Embed Size (px)
Citation preview
Safe At Any Speed: A Simulation-Based Test Harness for Autonomous Vehicles
FINAL RESEARCH REPORT
Rahul MangharamUniversity of Pennsylvania
Contract No. DTRT-13-GUTC-26

DISCLAIMER
The contents of this report reflect the views of the authors, who are responsible for the facts and the accuracy of the information presented herein. This document is disseminated under the sponsorship of the U.S. Department of Transportation’s University Transportation Centers Program, in the interest of information exchange. The U.S. Government assumes no liability for the contents or use thereof.
Safe At Any Speed: A Simulation-Based TestHarness for Autonomous Vehicles
Abstract—The testing of Autonomous Vehicles (AVs) requiresdriving the AV billions of miles under varied scenarios in orderto find bugs, accidents and otherwise inappropriate behavior.Because driving a real AV that many miles is too slow andcostly, this motivates the use of sophisticated ‘world simulators’,which present the AV’s perception pipeline with realistic inputscenes, and present the AV’s control stack with realistic trafficand physics to which to react. Thus the simulator is a crucial pieceof any CAD toolchain for AV testing. In this work, we build a testharness for driving an arbitrary AV’s code in a simulated world.We demonstrate this harness by using the game Grand TheftAuto V (GTA) as world simulator for AV testing. Namely, ourAV code, for both perception and control, interacts in real-timewith the game engine to drive our AV in the GTA world, and wesearch for weather conditions and AV operating conditions thatlead to dangerous situations. This goes beyond the current state-of-the-art where AVs are tested under ideal weather conditions,and lays the ground work for a more comprehensive testing effort.We also propose and demonstrate necessary analyzes to validatethe simulation results relative to the real world. The results ofsuch analyses allow the designers and verification engineers toweigh the results of simulation-based testing.
I. INTRODUCTION: TESTING AVS IN SIMULATED WORLDS
The development of Autonomous Vehicles (AVs) has seena remarkable acceleration in the last decade, as technologicaladvances like Deep Learning have allowed breakthroughs inprocessing visual information, and regulators have come toappreciate the potential of AVs to reduce accidents. Whilethe first wave of AV development focused on improving theperformance of individual components, like the ComputerVision (CV) pipeline or the behavioral controller, there is agrowing need for whole-AV testing. This is testing of theintegrated AV as a whole, where perception, control andenvironment conditions interact in unforeseen and complicatedways. This is an essential step towards building technical,regulatory, and public confidence in AVs as the solution tosome of our transportation problems.
Testing the real AV on real roads is a necessary part of thiseffort, but is woefully insufficient: a recent statistical studyby the RAND Corporation (a U.S.-based policy think tank)found that AVs would have to drive “hundreds of millions ofmiles and, under some scenarios, hundreds of billions of milesto create enough data to clearly demonstrate their safety”.According to the same report, “it would take existing fleets ofautonomous vehicles tens and even hundreds of years to logsufficient miles” to demonstrate their safety when compared tohuman-driven vehicles. This constitutes a definitive argumentfor building world simulators, that the AV can be driven in.A world simulator provides the AV with perceptual inputs(like video and range data), traffic conditions (like other carsand pedestrians), varied weather conditions, and moves the
AV in the simulated world in response to the AV’s computedactuation commands. Simulation is many orders of magnitudecheaper and faster than real-world testing.
This paper fills a gap in this regard: it demonstrates asimulation-based test harness for AVs, illustrates it use to auto-matically find dangerous situations, and clarifies the questionsthat must be answered when using simulation-based resultsfor debugging real AV code. A number of companies andstartups have released open-source AV code and platforms,such as Baidu’s Apollo [1] and Autoware [2], to cite a few.However, the open-source community still lacks a simulatorin which to test the whole AV in a wide range of drivingscenarios, and a corresponding automatic testing tool that cansearch for dangerous scenarios. To illustrate our test harness,we use the GTA V game engine as world simulator. Recentwork in the deep learning community uses synthetic scenesfrom GTA to train a neural network to perform a CV tasklike object detection [3] or image segmentation [4] or depthestimation [5]. By contrast, in this paper, we explore theuse of synthetic scenes to test a given pre-trained algorithm(like an object detector), as part of an overall AV testingeffort. Research that tries to find the most dangerous instancesof human driving by analyzing millions of human-drivenmiles [6] is complementary to what can be accomplished usingour test harness. That research highlights what miles mustbe driven by the AV to make sure it doesn’t repeat humanerrors; our harness allows the driving of any kinds of milesat little cost, and we search specifically autonomous miles fordangerous behavior.
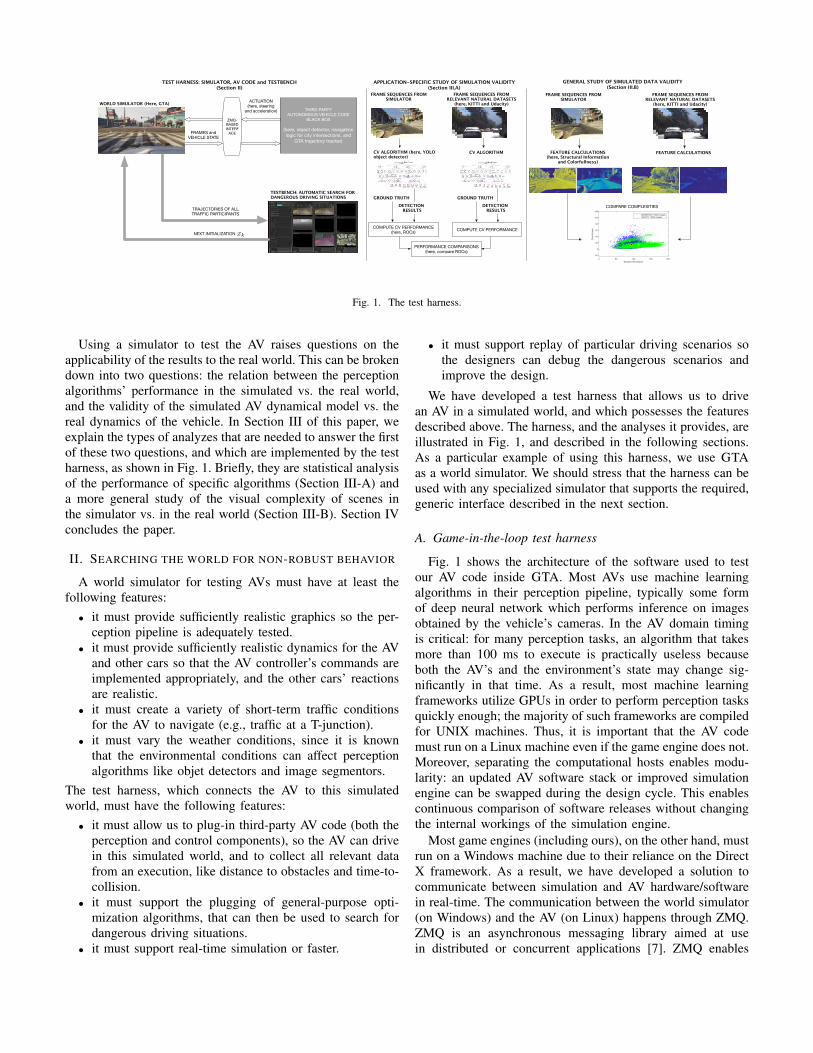
Fig. 1 gives an overview of the test harness and the questionswe answer in this paper, and which are detailed in thefollowing sections. Briefly, the test harness consists of a real-time communication architecture that allows connecting anarbitary AV code to a world simulator, like GTA. The simulatorfeeds the AV information about the state of the simulation. TheAV processes this information and computes the next controlinputs, which are sent back to the simulator to advance thesimulation by one clock tick. The harness also includes atestbench: the latter computes a measure of how dangerouswas the last simulation. E.g., the simplest measure of danger,which we implement, is the minimum distance between the AVand other traffic participants. Based on this value, the testbenchdecides on how to initialize the next simulation, including atwhat time of day it should take place. The ability to control thetime of day, and thus the lighting conditions, in a simulatoris a very powerful feature, since it allows us to stress theperception algorithms and the speed of reaction of the AV.Section II describes sample testing results that we obtain.
THIRD PARTY AUTONOMOUS VEHICLE CODE
BLACK BOX
(here, object detector, navigation logic for city intersections, and
GTA trajectory tracker)
ZMQ-BASED INTERF
ACE
ACTUATION(here, steering
and acceleration)
FRAMES and VEHICLE STATE
TESTBENCH: AUTOMATIC SEARCH FOR DANGEROUS DRIVING SITUATIONS
WORLD SIMULATOR (Here, GTA)
TRAJECTORIES OF ALL TRAFFIC PARTICIPANTS
NEXT INITIALIZATION xk
FRAME SEQUENCES FROM SIMULATOR
CV ALGORITHM (here, YOLO object detector)
GROUND TRUTH
COMPUTE CV PERFORMANCE(here, ROCs)
DETECTION RESULTS
CV ALGORITHM
GROUND TRUTH
COMPUTE CV PERFORMANCE
DETECTION RESULTS
PERFORMANCE COMPARISONS(here, compare ROCs)
FRAME SEQUENCES FROM RELEVANT NATURAL DATASETS
(here, KITTI and Udacity)
FRAME SEQUENCES FROM SIMULATOR
FEATURE CALCULATIONS (here, Structural Information
and Colorfullness)
FEATURE CALCULATIONS
FRAME SEQUENCES FROM RELEVANT NATURAL DATASETS
(here, KITTI and Udacity)
0 50 100 150 200
Spatial Information
-20
0
20
40
60
80
100
120
Col
orfu
lnes
s
DARMSTADT 19960 images
UDACITY 12000 images
COMPARE COMPLEXITIES
TEST HARNESS: SIMULATOR, AV CODE and TESTBENCH(Section II)
APPLICATION-SPECIFIC STUDY OF SIMULATION VALIDITY(Section III.A)
GENERAL STUDY OF SIMULATED DATA VALIDITY(Section III.B)
Fig. 1. The test harness.
Using a simulator to test the AV raises questions on theapplicability of the results to the real world. This can be brokendown into two questions: the relation between the perceptionalgorithms’ performance in the simulated vs. the real world,and the validity of the simulated AV dynamical model vs. thereal dynamics of the vehicle. In Section III of this paper, weexplain the types of analyzes that are needed to answer the firstof these two questions, and which are implemented by the testharness, as shown in Fig. 1. Briefly, they are statistical analysisof the performance of specific algorithms (Section III-A) anda more general study of the visual complexity of scenes inthe simulator vs. in the real world (Section III-B). Section IVconcludes the paper.
II. SEARCHING THE WORLD FOR NON-ROBUST BEHAVIOR
A world simulator for testing AVs must have at least thefollowing features:
• it must provide sufficiently realistic graphics so the per-ception pipeline is adequately tested.
• it must provide sufficiently realistic dynamics for the AVand other cars so that the AV controller’s commands areimplemented appropriately, and the other cars’ reactionsare realistic.
• it must create a variety of short-term traffic conditionsfor the AV to navigate (e.g., traffic at a T-junction).
• it must vary the weather conditions, since it is knownthat the environmental conditions can affect perceptionalgorithms like objet detectors and image segmentors.
The test harness, which connects the AV to this simulatedworld, must have the following features:
• it must allow us to plug-in third-party AV code (both theperception and control components), so the AV can drivein this simulated world, and to collect all relevant datafrom an execution, like distance to obstacles and time-to-collision.
• it must support the plugging of general-purpose opti-mization algorithms, that can then be used to search fordangerous driving situations.
• it must support real-time simulation or faster.
• it must support replay of particular driving scenarios sothe designers can debug the dangerous scenarios andimprove the design.
We have developed a test harness that allows us to drivean AV in a simulated world, and which possesses the featuresdescribed above. The harness, and the analyses it provides, areillustrated in Fig. 1, and described in the following sections.As a particular example of using this harness, we use GTAas a world simulator. We should stress that the harness can beused with any specialized simulator that supports the required,generic interface described in the next section.
A. Game-in-the-loop test harness
Fig. 1 shows the architecture of the software used to testour AV code inside GTA. Most AVs use machine learningalgorithms in their perception pipeline, typically some formof deep neural network which performs inference on imagesobtained by the vehicle’s cameras. In the AV domain timingis critical: for many perception tasks, an algorithm that takesmore than 100 ms to execute is practically useless becauseboth the AV’s and the environment’s state may change sig-nificantly in that time. As a result, most machine learningframeworks utilize GPUs in order to perform perception tasksquickly enough; the majority of such frameworks are compiledfor UNIX machines. Thus, it is important that the AV codemust run on a Linux machine even if the game engine does not.Moreover, separating the computational hosts enables modu-larity: an updated AV software stack or improved simulationengine can be swapped during the design cycle. This enablescontinuous comparison of software releases without changingthe internal workings of the simulation engine.
Most game engines (including ours), on the other hand, mustrun on a Windows machine due to their reliance on the DirectX framework. As a result, we have developed a solution tocommunicate between simulation and AV hardware/softwarein real-time. The communication between the world simulator(on Windows) and the AV (on Linux) happens through ZMQ.ZMQ is an asynchronous messaging library aimed at usein distributed or concurrent applications [7]. ZMQ enables
communication with little overhead and interoperability be-tween the different programming languages (Python and C++)utilized in our case study.
A typical simulation runs as follows: The test harness,which runs on the Linux machine, selects an initial stateof the AV (e.g., initial position, velocity, jitter, etc). It alsoselects initial environment conditions: number of cars, theirinitial positions and velocities, and time of day. The time ofday is a way to control the lighting conditions: from brightand clear skies in the morning, to dark and cloudy skieslater in the day. As explained in the Introduction, this isparticularly important for stressing the perception pipeline.This initalization is then sent to the Windows machine, wherea simulation starts. The testbench samples the simulation onceevery second: every second, the simulator sends back to thetestbench the current states of all traffic participants, includingthe AV, and the current ”video” frame. The testbench storesthe state for later computation of performance objectives, andpasses it, along with the frame, to the AV code. The perceptionpipeline processes the frame (e.g., to detect objects), and thecontroller then computes the next actuation (steering angle andacceleration). The control commands are passed back to thesimulator, and this loop continues until the end of simulation.
Our test harness allows this to run in real-time (so 10s ofsimulated time require about 10s of wallclock time). Giventhat we visualize the simulation as it runs, faster than real-time is not possible. Another simulator, that can run withoutthe graphics, could run faster than real-time. The bottleneckof the current setup is the GTA simulator, not the testbench.
The need to run the world simulator on a Windows machineis peculiar to GTA. However, the ZMQ-based communicationarchitecture we have developed has a wide range of applica-tions: namely, it is possible to spawn multiple instances ofthe simulator on multiple remote machines, and have themcontrolled from the same terminal that runs the AV code. Thisparallelization allows us to cover proportionally more drivingmiles in a given amount of time.
B. Search algorithmThe test harness can be used to test the AV code as
follows. First, pick a location in GTA’s San Andreas map.Next, define the AV state vector x ∈ R5, consisting of AV 2Dposition, 2D velocity and longitudinal jitter (second derivativeof longitudinal velocity). The AV state can be initialized, ina given simlation, to any value in a pre-determined set X ,e.g. X = [−1, 1]2 × [5, 15]2 × [−5, 5]. We also define a time-of-day variable tod, measured in minutes, and which can beinitialized to D = {0, 1, . . . , 60×24}. E.g. tod = 0 is midnightand tod = 60× 8 is 8 a.m. Finally, we define an environmentvector y ∈ R4N , consisting of the positions and velocities ofN other traffic participants. This can also be initialized to a setY . Collectively, we refer to z = (x, tod, y) as the world state,and it can be initialized to Z = X ×D × Y . If the testbenchinitializes the test harness with a given z ∈ Z, the harnesswill simulate the resulting driving situation as explained inSection II-A. The objective of the search is to find a value ofz in Z such that the resulting simulation exposes dangerousdriving situations, be they due to the AV’s errors of control
or perception, or because of unfortunate circumstances thatmight not have occurred to the AV designers. Indeed, evenaccidents that are not due to the AV’s fault are informative,as they might cause the designers to equip the AV with bettersensors or make it more conservative.
For illustration purposes in this paper, we define a ‘dan-gerous driving situation’ to be a state where the minimumdistance between the AV and other cars or pedestrians issmaller than a nominal value. Therefore, we can now runan optimization: the objective function is f : Z → [0,∞)where f(z) is the minimum distance between the AV and othercars or pedestrians, in the simulation initialized at z. Our goalis to minimize f over Z: find the most dangerous situation,where the AV gets closest to moving obstacles. Of course,if f(z∗) = 0, then z∗ actually witnesses an accident. Alldangerous situations are then returned to designers to examine:did the object detector miss the obstacle? Did it detect itbut too late? Did the obstacle come from behind a blindcorner, if so, do we need to annotate the AV map with blindintersections? Or was the controller tuned too aggressively andan accident followed?
The AV code and simulator are treated as black boxes bothdue to their complexity and in order to provide a method-ology which works to examine proprietary software withoutjeopardizing trade secrets or IP. Therefore we need to usea gradient-free optimizatoin heuristic. In the experiments weuse Simulated Annealing [8], a popular optimization algorithmthat offers asymptotic guarantees (namely, as the number ofsimulations goes to infinity, the probability of missing theglobal minimum goes to 0). Simulated Annealing and itsvariations have been successfully used in a very wide arrayof applications in the last 60 years. The next section presentssome illustrative results obtained by this test harness.
C. Optimization resultsWe selected a T-junction in Los Santos, the fictional city
that is the setting for GTA. The objective of the AV is tomake a safe right turn, and obey the Stop Sign. The simulationcontinues until either the objective is achieved, or a timeout(set to 20s) occurs.
The search automatically found an accident between the AVand another car in under 100 simulations. We can examine theexact conditions that led to the accident to understand whathappened. First, let’s describe the accident: the AV approachesthe T-junction, and starts the right turn. Another car approachesfrom the left. Neither car is able to stop on time, even thoughthey both eventually ‘saw’ each other. In this case, two factorscontributed to the accident: first, the scenario takes place attwilight. While the YOLO object detector correctly classifiedthe stop sign there is some delay. This delay was neverthelessenough to allow the AV to edge further into the intersectionbefore stopping. Secondly, the other car was traveling at aspeed similar to the AV’s. Any faster, and it would’ve passedthe AV before it started the right turn. Any slower, and theego-vehicle would’ve been able to stop on time. In addition,the other vehicle is initially occluded and subsequently missedin several frames just as the ego vehicle makes a decision toturn.
This is an example of a non-trivial accident, where justthe right conditions of timing and vechicle behavior must bepresent to cause the accident.
The automatic search enabled by our harness thus foundenvironment conditions (lighting) and traffic conditions (speedof one other car) that produced an accident. Another accident,captured from 3 different camera angles, can be found at thisanonymous Dropbox link: http://bit.ly/2fe2tZq
III. FAKE WORLD, REAL NEWS: ON THE VALIDITY OFUSING SYNTHETIC ENVIRONMENTS FOR TESTING AVS
The described test harness allows us to test orders ofmagnitude more scenarios than we could in the real world,and dangerous situations (so-called ‘counter-examples’) thatare exposed in simulation can help improve the design andflush out bugs. The natural question we need to answer is:do accidents discovered in simulation tell us something aboutreal-world accidents? Without actually running the AV in thereal world and correlating real-world results to the simulatedresults, it is impossible to obtain a direct empirical answerto this question. However, there are two ‘big’ questions thatone can answer instead, and which go a long way towardestablishing confidence in the simulated results. They are:
1) What is the relation between the perception algorithms’performance on synthetic driving scenes rendered by thegraphics engine and their performance on natural (‘real’)driving scenes?
2) What is the relation between the effect of AV controller’sactions in the simulator and their effect in the real world?
If we have confidence in our answers to these two questions,then we have more confidence that the whole-AV test enabledby our test harness is useful.
In this paper, we study the first question above. For thesecond question, it suffices to note that any dynamical modelused in the automotive industry will be thouroughly validatedby the automotive engineers, and the test harness we proposecan accommodate any world simulator as explained earlier.
We answer the first question on two levels: first, in Sec-tion III-A, we do a direct comparison between the performanceof a perception algorithm (e.g., object detection) on syntheticand natural scenes. This gives an application-specific evalu-ation of the suitability of synthetic scenes for our purposes.The same study can be done on any CV algorithm. Secondly,in Section III-B, we study the visual complexity of syntheticand natural scenes. Such a study is application-independent,and gives us a broader understanding of the differences andsimilarities between synthetic and natural scenes. While sucha broader understanding is, at first, harder to apply than anapplication-specific comparison, it has a benefit: by under-standing the ways in which synthetic scenes (as an ensemble)differ from natural scenes, we can better weigh the resultsof simulation-based testing and their relevance to real-worldtesting, accross a range of peception algorithms. E.g., visualcomplexity plays an important role in many computer visionalgorithms, like edge detection and motion from structure. Ifthe complexity of synthetic scenes is, say, poorer than that
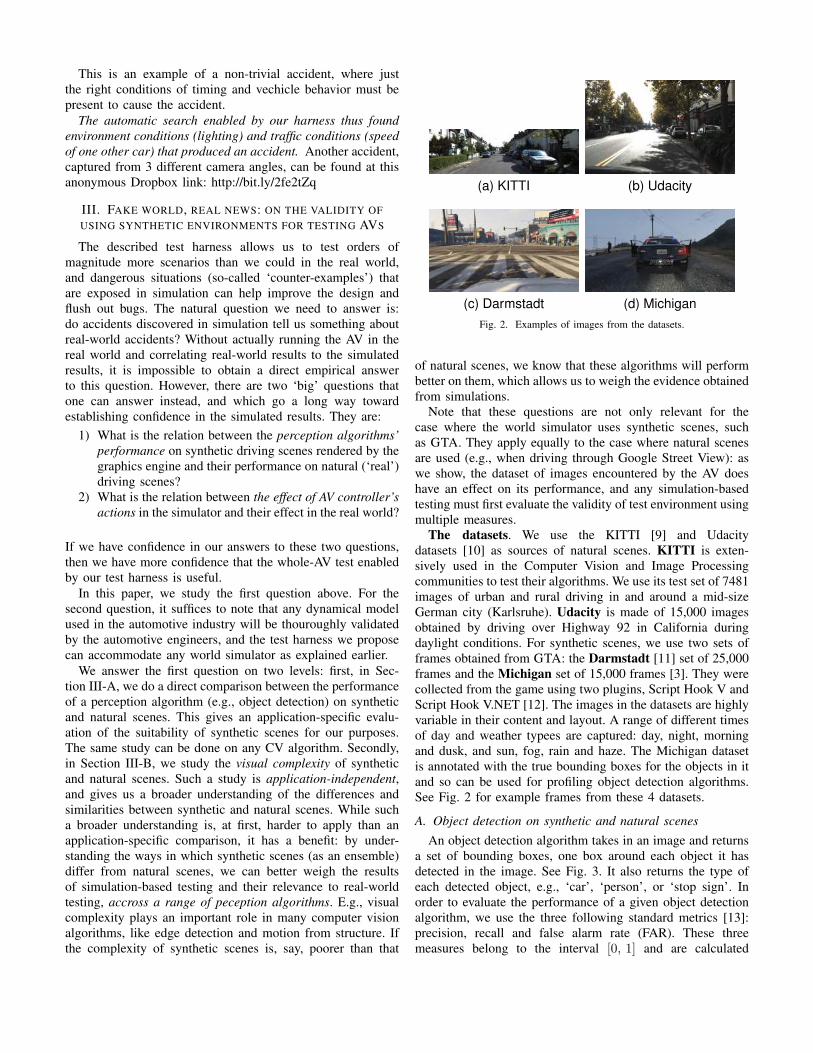
(a) KITTI (b) Udacity
(c) Darmstadt (d) MichiganFig. 2. Examples of images from the datasets.
of natural scenes, we know that these algorithms will performbetter on them, which allows us to weigh the evidence obtainedfrom simulations.
Note that these questions are not only relevant for thecase where the world simulator uses synthetic scenes, suchas GTA. They apply equally to the case where natural scenesare used (e.g., when driving through Google Street View): aswe show, the dataset of images encountered by the AV doeshave an effect on its performance, and any simulation-basedtesting must first evaluate the validity of test environment usingmultiple measures.
The datasets. We use the KITTI [9] and Udacitydatasets [10] as sources of natural scenes. KITTI is exten-sively used in the Computer Vision and Image Processingcommunities to test their algorithms. We use its test set of 7481images of urban and rural driving in and around a mid-sizeGerman city (Karlsruhe). Udacity is made of 15,000 imagesobtained by driving over Highway 92 in California duringdaylight conditions. For synthetic scenes, we use two sets offrames obtained from GTA: the Darmstadt [11] set of 25,000frames and the Michigan set of 15,000 frames [3]. They werecollected from the game using two plugins, Script Hook V andScript Hook V.NET [12]. The images in the datasets are highlyvariable in their content and layout. A range of different timesof day and weather typees are captured: day, night, morningand dusk, and sun, fog, rain and haze. The Michigan datasetis annotated with the true bounding boxes for the objects in itand so can be used for profiling object detection algorithms.See Fig. 2 for example frames from these 4 datasets.
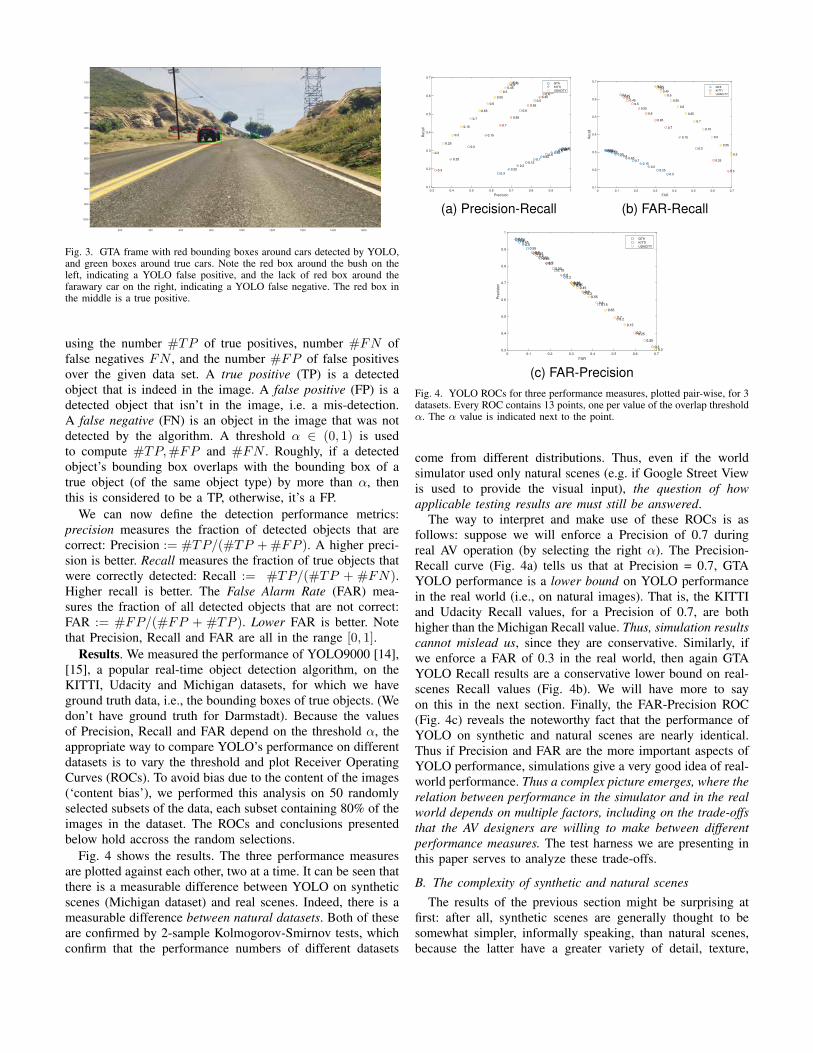
A. Object detection on synthetic and natural scenesAn object detection algorithm takes in an image and returns
a set of bounding boxes, one box around each object it hasdetected in the image. See Fig. 3. It also returns the type ofeach detected object, e.g., ‘car’, ‘person’, or ‘stop sign’. Inorder to evaluate the performance of a given object detectionalgorithm, we use the three following standard metrics [13]:precision, recall and false alarm rate (FAR). These threemeasures belong to the interval [0, 1] and are calculated
200 400 600 800 1000 1200 1400 1600 1800
100
200
300
400
500
600
700
800
900
1000
Fig. 3. GTA frame with red bounding boxes around cars detected by YOLO,and green boxes around true cars. Note the red box around the bush on theleft, indicating a YOLO false positive, and the lack of red box around thefarawary car on the right, indicating a YOLO false negative. The red box inthe middle is a true positive.
using the number #TP of true positives, number #FN offalse negatives FN , and the number #FP of false positivesover the given data set. A true positive (TP) is a detectedobject that is indeed in the image. A false positive (FP) is adetected object that isn’t in the image, i.e. a mis-detection.A false negative (FN) is an object in the image that was notdetected by the algorithm. A threshold α ∈ (0, 1) is usedto compute #TP,#FP and #FN . Roughly, if a detectedobject’s bounding box overlaps with the bounding box of atrue object (of the same object type) by more than α, thenthis is considered to be a TP, otherwise, it’s a FP.
We can now define the detection performance metrics:precision measures the fraction of detected objects that arecorrect: Precision := #TP/(#TP +#FP ). A higher preci-sion is better. Recall measures the fraction of true objects thatwere correctly detected: Recall := #TP/(#TP + #FN).Higher recall is better. The False Alarm Rate (FAR) mea-sures the fraction of all detected objects that are not correct:FAR := #FP/(#FP + #TP ). Lower FAR is better. Notethat Precision, Recall and FAR are all in the range [0, 1].
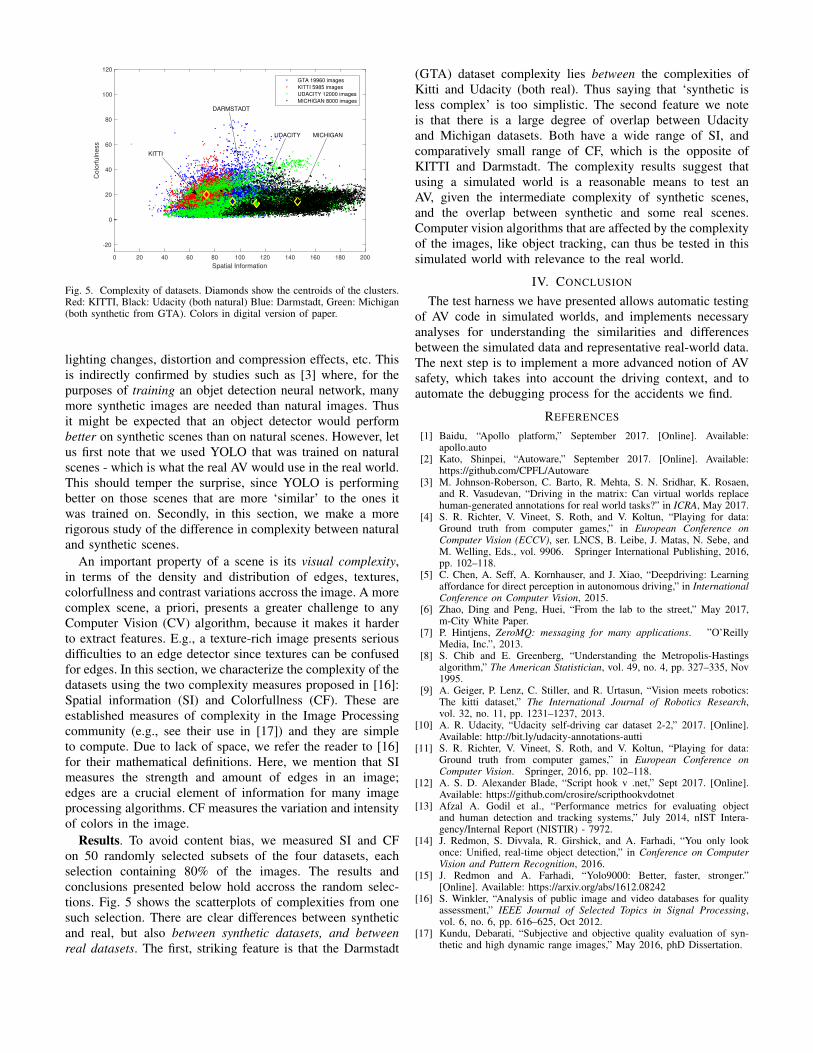
Results. We measured the performance of YOLO9000 [14],[15], a popular real-time object detection algorithm, on theKITTI, Udacity and Michigan datasets, for which we haveground truth data, i.e., the bounding boxes of true objects. (Wedon’t have ground truth for Darmstadt). Because the valuesof Precision, Recall and FAR depend on the threshold α, theappropriate way to compare YOLO’s performance on differentdatasets is to vary the threshold and plot Receiver OperatingCurves (ROCs). To avoid bias due to the content of the images(‘content bias’), we performed this analysis on 50 randomlyselected subsets of the data, each subset containing 80% of theimages in the dataset. The ROCs and conclusions presentedbelow hold accross the random selections.
Fig. 4 shows the results. The three performance measuresare plotted against each other, two at a time. It can be seen thatthere is a measurable difference between YOLO on syntheticscenes (Michigan dataset) and real scenes. Indeed, there is ameasurable difference between natural datasets. Both of theseare confirmed by 2-sample Kolmogorov-Smirnov tests, whichconfirm that the performance numbers of different datasets
0.3 0.4 0.5 0.6 0.7 0.8 0.9 1
Precision
0.1
0.2
0.3
0.4
0.5
0.6
0.7
Re
ca
ll
0.1
0.15
0.2
0.25
0.3
0.350.40.450.50.55
0.60.65
0.7
0.1
0.15
0.2
0.25
0.3
0.350.4
0.45
0.5
0.55
0.6
0.65
0.7
0.1
0.15
0.2
0.25
0.3
0.350.4
0.45
0.5
0.55
0.6
0.65
0.7
GTA
KITTI
UDACITY
(a) Precision-Recall
0 0.1 0.2 0.3 0.4 0.5 0.6 0.7
FAR
0.1
0.2
0.3
0.4
0.5
0.6
0.7
Recall
0.1
0.15
0.2
0.25
0.3
0.350.40.450.50.55
0.60.65
0.7
0.1
0.15
0.2
0.25
0.3
0.350.4
0.45
0.5
0.55
0.6
0.65
0.7
0.1
0.15
0.2
0.25
0.3
0.350.4
0.45
0.5
0.55
0.6
0.65
0.7
GTA
KITTI
UDACITY
(b) FAR-Recall
0 0.1 0.2 0.3 0.4 0.5 0.6 0.7
FAR
0.3
0.4
0.5
0.6
0.7
0.8
0.9
1
Pre
cis
ion
0.1
0.15
0.2
0.25
0.3
0.350.40.45
0.5
0.55
0.6
0.65
0.7
0.1
0.15
0.2
0.25
0.3
0.350.4
0.45
0.5
0.55
0.6
0.65
0.7
0.1
0.15
0.2
0.25
0.3
0.350.4
0.45
0.5
0.55
0.6
0.65
0.7
GTA
KITTI
UDACITY
(c) FAR-PrecisionFig. 4. YOLO ROCs for three performance measures, plotted pair-wise, for 3datasets. Every ROC contains 13 points, one per value of the overlap thresholdα. The α value is indicated next to the point.
come from different distributions. Thus, even if the worldsimulator used only natural scenes (e.g. if Google Street Viewis used to provide the visual input), the question of howapplicable testing results are must still be answered.
The way to interpret and make use of these ROCs is asfollows: suppose we will enforce a Precision of 0.7 duringreal AV operation (by selecting the right α). The Precision-Recall curve (Fig. 4a) tells us that at Precision = 0.7, GTAYOLO performance is a lower bound on YOLO performancein the real world (i.e., on natural images). That is, the KITTIand Udacity Recall values, for a Precision of 0.7, are bothhigher than the Michigan Recall value. Thus, simulation resultscannot mislead us, since they are conservative. Similarly, ifwe enforce a FAR of 0.3 in the real world, then again GTAYOLO Recall results are a conservative lower bound on real-scenes Recall values (Fig. 4b). We will have more to sayon this in the next section. Finally, the FAR-Precision ROC(Fig. 4c) reveals the noteworthy fact that the performance ofYOLO on synthetic and natural scenes are nearly identical.Thus if Precision and FAR are the more important aspects ofYOLO performance, simulations give a very good idea of real-world performance. Thus a complex picture emerges, where therelation between performance in the simulator and in the realworld depends on multiple factors, including on the trade-offsthat the AV designers are willing to make between differentperformance measures. The test harness we are presenting inthis paper serves to analyze these trade-offs.
B. The complexity of synthetic and natural scenesThe results of the previous section might be surprising at
first: after all, synthetic scenes are generally thought to besomewhat simpler, informally speaking, than natural scenes,because the latter have a greater variety of detail, texture,
0 20 40 60 80 100 120 140 160 180 200
Spatial Information
-20
0
20
40
60
80
100
120
Co
lorf
uln
ess
GTA 19960 images
KITTI 5985 images
UDACITY 12000 images
MICHIGAN 8000 images
KITTI
DARMSTADT
UDACITY MICHIGAN
Fig. 5. Complexity of datasets. Diamonds show the centroids of the clusters.Red: KITTI, Black: Udacity (both natural) Blue: Darmstadt, Green: Michigan(both synthetic from GTA). Colors in digital version of paper.
lighting changes, distortion and compression effects, etc. Thisis indirectly confirmed by studies such as [3] where, for thepurposes of training an objet detection neural network, manymore synthetic images are needed than natural images. Thusit might be expected that an object detector would performbetter on synthetic scenes than on natural scenes. However, letus first note that we used YOLO that was trained on naturalscenes - which is what the real AV would use in the real world.This should temper the surprise, since YOLO is performingbetter on those scenes that are more ‘similar’ to the ones itwas trained on. Secondly, in this section, we make a morerigorous study of the difference in complexity between naturaland synthetic scenes.
An important property of a scene is its visual complexity,in terms of the density and distribution of edges, textures,colorfullness and contrast variations accross the image. A morecomplex scene, a priori, presents a greater challenge to anyComputer Vision (CV) algorithm, because it makes it harderto extract features. E.g., a texture-rich image presents seriousdifficulties to an edge detector since textures can be confusedfor edges. In this section, we characterize the complexity of thedatasets using the two complexity measures proposed in [16]:Spatial information (SI) and Colorfullness (CF). These areestablished measures of complexity in the Image Processingcommunity (e.g., see their use in [17]) and they are simpleto compute. Due to lack of space, we refer the reader to [16]for their mathematical definitions. Here, we mention that SImeasures the strength and amount of edges in an image;edges are a crucial element of information for many imageprocessing algorithms. CF measures the variation and intensityof colors in the image.
Results. To avoid content bias, we measured SI and CFon 50 randomly selected subsets of the four datasets, eachselection containing 80% of the images. The results andconclusions presented below hold accross the random selec-tions. Fig. 5 shows the scatterplots of complexities from onesuch selection. There are clear differences between syntheticand real, but also between synthetic datasets, and betweenreal datasets. The first, striking feature is that the Darmstadt
(GTA) dataset complexity lies between the complexities ofKitti and Udacity (both real). Thus saying that ‘synthetic isless complex’ is too simplistic. The second feature we noteis that there is a large degree of overlap between Udacityand Michigan datasets. Both have a wide range of SI, andcomparatively small range of CF, which is the opposite ofKITTI and Darmstadt. The complexity results suggest thatusing a simulated world is a reasonable means to test anAV, given the intermediate complexity of synthetic scenes,and the overlap between synthetic and some real scenes.Computer vision algorithms that are affected by the complexityof the images, like object tracking, can thus be tested in thissimulated world with relevance to the real world.
IV. CONCLUSION
The test harness we have presented allows automatic testingof AV code in simulated worlds, and implements necessaryanalyses for understanding the similarities and differencesbetween the simulated data and representative real-world data.The next step is to implement a more advanced notion of AVsafety, which takes into account the driving context, and toautomate the debugging process for the accidents we find.
REFERENCES
[1] Baidu, “Apollo platform,” September 2017. [Online]. Available:apollo.auto
[2] Kato, Shinpei, “Autoware,” September 2017. [Online]. Available:https://github.com/CPFL/Autoware
[3] M. Johnson-Roberson, C. Barto, R. Mehta, S. N. Sridhar, K. Rosaen,and R. Vasudevan, “Driving in the matrix: Can virtual worlds replacehuman-generated annotations for real world tasks?” in ICRA, May 2017.
[4] S. R. Richter, V. Vineet, S. Roth, and V. Koltun, “Playing for data:Ground truth from computer games,” in European Conference onComputer Vision (ECCV), ser. LNCS, B. Leibe, J. Matas, N. Sebe, andM. Welling, Eds., vol. 9906. Springer International Publishing, 2016,pp. 102–118.
[5] C. Chen, A. Seff, A. Kornhauser, and J. Xiao, “Deepdriving: Learningaffordance for direct perception in autonomous driving,” in InternationalConference on Computer Vision, 2015.
[6] Zhao, Ding and Peng, Huei, “From the lab to the street,” May 2017,m-City White Paper.
[7] P. Hintjens, ZeroMQ: messaging for many applications. ”O’ReillyMedia, Inc.”, 2013.
[8] S. Chib and E. Greenberg, “Understanding the Metropolis-Hastingsalgorithm,” The American Statistician, vol. 49, no. 4, pp. 327–335, Nov1995.
[9] A. Geiger, P. Lenz, C. Stiller, and R. Urtasun, “Vision meets robotics:The kitti dataset,” The International Journal of Robotics Research,vol. 32, no. 11, pp. 1231–1237, 2013.
[10] A. R. Udacity, “Udacity self-driving car dataset 2-2,” 2017. [Online].Available: http://bit.ly/udacity-annotations-autti
[11] S. R. Richter, V. Vineet, S. Roth, and V. Koltun, “Playing for data:Ground truth from computer games,” in European Conference onComputer Vision. Springer, 2016, pp. 102–118.
[12] A. S. D. Alexander Blade, “Script hook v .net,” Sept 2017. [Online].Available: https://github.com/crosire/scripthookvdotnet
[13] Afzal A. Godil et al., “Performance metrics for evaluating objectand human detection and tracking systems,” July 2014, nIST Intera-gency/Internal Report (NISTIR) - 7972.
[14] J. Redmon, S. Divvala, R. Girshick, and A. Farhadi, “You only lookonce: Unified, real-time object detection,” in Conference on ComputerVision and Pattern Recognition, 2016.
[15] J. Redmon and A. Farhadi, “Yolo9000: Better, faster, stronger.”[Online]. Available: https://arxiv.org/abs/1612.08242
[16] S. Winkler, “Analysis of public image and video databases for qualityassessment,” IEEE Journal of Selected Topics in Signal Processing,vol. 6, no. 6, pp. 616–625, Oct 2012.
[17] Kundu, Debarati, “Subjective and objective quality evaluation of syn-thetic and high dynamic range images,” May 2016, phD Dissertation.