Embed Size (px)
Citation preview

SAFERELIABLE
AFFORDABLE
2011 ANNUAL REPORT
2244 Walnut Grove AvenueRosemead, California 91770www.sce.com
SCEAR2012
36027 Merrill Cvrs_Layout 1 2/29/12 4:12 PM Page 1

SOUTHERN CALIFORNIA EDISON COMPANY
An Edison International (NYSE:EIX) company,Southern California Edison is one of the nation’slargest electric utilities serving a population ofnearly 14 million via 4.9 million customer ac-counts in a 50,000-square-mile service area withinCentral, Coastal and Southern California.
SHAREHOLDER INFORMATION
This annual report is printed on recycled paper.
Annual MeetingThe annual meeting of shareholders will
be held on Thursday, April 26, 2012, at
9:00 a.m., Pacific Time, at the Hilton Los
Angeles San Gabriel Hotel, 225 West Valley
Boulevard, San Gabriel, California 91776.
Corporate Governance PracticesA description of SCE’s corporate gover-
nance practices is available on our
Web site at www.edisoninvestor.com.
The SCE Board Nominating/Corporate
Governance Committee periodically reviews
the Company’s corporate governance prac-
tices and makes recommendations to the
Company’s Board that the practices be up-
dated from time to time.
Stock and Trading InformationSCE's 4.08%, 4.24%, 4.32% and 4.78%
Series of $25 par value cumulative preferred
stock are listed on the NYSE Amex Equities
stock exchange. Previous day's closing
prices, when stock was traded, are listed in
the daily newspapers under NYSE Amex.
Shares of SCE's preference stock are not
listed on an exchange.
Transfer Agent and RegistrarWells Fargo Bank, N.A., which maintains
shareholder records, is the transfer agent
and registrar for SCE’s preferred and prefer-
ence stock. Shareholders may call Wells
Fargo Shareowner Services, (800) 347-
8625, between 7 a.m. and 7 p.m. (Central
Time), Monday through Friday, to speak
with a representative (or to use the interac-
tive voice response unit 24 hours a day,
seven days a week) regarding:
n stock transfer and name-change requirements;
n address changes, including dividend payment addresses;
n electronic deposit of dividends;
n taxpayer identification number submissions or changes;
n duplicate 1099 and W-9 forms;
n notices of, and replacement of, lost or destroyed stock certificates and
dividend checks; and
n requests for access to online account information.
Inquiries may also be directed to:Wells Fargo Bank, N.A.
Shareowner Services Department
161 North Concord Exchange Street
South St. Paul, MN 55075-1139
Fax(651) 450-4033
Wells Fargo Shareowner ServicesSM
www.wellsfargo.com/shareownerservices
Investor Rela tionswww.edisoninvestor.com
Email: [email protected]
Phone: (877) 379-9515
Online account information www.shareowneronline.com
36027 Merrill Cvrs_Layout 1 2/29/12 4:12 PM Page 2

UNITED STATESSECURITIES AND EXCHANGE COMMISSION
Washington, D.C. 20549________________________
FORM 10-K________________________
(Mark One)
ANNUAL REPORT PURSUANT TO SECTION 13 OR 15(d) OF THE SECURITIES EXCHANGE ACT OF 1934For the fiscal year ended December 31, 2011TRANSITION REPORT PURSUANT TO SECTION 13 OR 15(d) OF THE SECURITIES EXCHANGE ACT OF 1934For the transition period from to
Commission File Number 1-2313________________________
SOUTHERN CALIFORNIA EDISON COMPANY(Exact name of registrant as specified in its charter)
________________________
California(State or other jurisdiction of
incorporation or organization)
2244 Walnut Grove Avenue(P.O. Box 800)
Rosemead, California(Address of principal executive offices)
(626) 302-1212(Registrant's telephone number, including area code)
95-1240335(I.R.S. Employer
Identification No.)
91770(Zip Code)
Securities registered pursuant to Section 12(b) of the Act:
Title of each class
Cumulative Preferred Stock
4.08%Series 4.32%Series4.24%Series 4.78%Series
Name of each exchangeon which registered
NYSE Amex
Securities registered pursuant to Section 12(g) of the Act: None
Indicate by check mark if the registrant is a well-known seasoned issuer, as defined in Rule 405 of the Securities Act. Yes No
Indicate by check mark if the registrant is not required to file reports pursuant to Section 13 or Section 15(d) of the Exchange Act. Yes No
Indicate by check mark whether the registrant (1) has filed all reports required to be filed by Section 13 or 15(d) of the Securities Exchange Act of 1934 during the preceding 12 months (or for such shorter period that the registrant was required to file such reports), and (2) has been subject to such filing requirements for the past 90 days. Yes No
Indicate by check mark whether the registrant has submitted electronically and posted on its corporate website, if any, every Interactive Data File required to be submitted and posted pursuant to Rule 405 of Regulation S-T (§ 232.405 of this chapter) during the preceding 12 months (or for such shorter period that the registrant was required to submit and post such files). Yes No
Indicate by check mark if disclosure of delinquent filers pursuant to Item 405 of Regulation S-K is not contained herein, and will not be contained, to the best of registrant's knowledge, in definitive proxy or information statements incorporated by reference in Part III of this Form 10-K or any amendment to this Form 10-K.
Indicate by check mark whether the registrant is a large accelerated filer, an accelerated filer, a non-accelerated filer or a smaller reporting company. See the definitions of "accelerated filer," "large accelerated filer," and "smaller reporting company" in Rule 12b-12 of the Exchange Act. (Check One):
Large Accelerated Filer Accelerated Filer Non-accelerated Filer Smaller Reporting Company
Indicate by check mark whether the registrant is a shell company (as defined in Rule 12b-2 of the Exchange Act). Yes No
As of February 27, 2012, there were 434,888,104 shares of Common Stock outstanding, all of which are held by the registrant's parent holding company. The aggregate market value of registrant's voting and non-voting common equity held by non-affiliates was zero.
DOCUMENTS INCORPORATED BY REFERENCEPortions of the following documents listed below have been incorporated by reference into the parts of this report so indicated.(1) Designated portions of the Proxy Statement relating to registrant's 2012 Annual Meeting of Shareholders Part III

i
TABLE OF CONTENTS
GLOSSARY...................................................................................................................................................................FORWARD-LOOKING STATEMENTS....................................................................................................................
PART IITEM 1. BUSINESS......................................................................................................................................................
ITEM 1A. RISK FACTORS.........................................................................................................................................
ITEM 1B. UNRESOLVED STAFF COMMENTS.....................................................................................................ITEM 2. PROPERTIES................................................................................................................................................ITEM 3. LEGAL PROCEEDINGS .............................................................................................................................EXECUTIVE OFFICERS OF THE REGISTRANT.................................................................................................
PART II
ITEM 5. MARKET FOR REGISTRANT'S COMMON EQUITY, RELATED STOCKHOLDER MATTERS AND ISSUER PURCHASES OF EQUITY SECURITIES .......................................................................................ITEM 6. SELECTED FINANCIAL DATA.................................................................................................................
ITEM 7. MANAGEMENT'S DISCUSSION AND ANALYSIS OF FINANCIAL CONDITION AND RESULTS OF OPERATIONS .....................................................................................................................................MANAGEMENT OVERVIEW ...................................................................................................................................
RESULTS OF OPERATIONS .....................................................................................................................................
LIQUIDITY AND CAPITAL RESOURCES..............................................................................................................
Regulation ..............................................................................................................................................................Overview of Ratemaking Process.........................................................................................................................Purchased Power and Fuel Supply ......................................................................................................................Competition............................................................................................................................................................Properties ...............................................................................................................................................................Insurance ................................................................................................................................................................Seasonality..............................................................................................................................................................Environmental Matters .........................................................................................................................................
Regulatory Risks....................................................................................................................................................Operating Risks .....................................................................................................................................................Environmental Risks .............................................................................................................................................Financing Risks......................................................................................................................................................
Highlights of Operating Results ...........................................................................................................................2012 CPUC General Rate Case ............................................................................................................................FERC Formula Rates............................................................................................................................................Capital Program ....................................................................................................................................................Environmental Developments ..............................................................................................................................
Utility Earning Activities ......................................................................................................................................Utility Cost-Recovery Activities ...........................................................................................................................Supplemental Operating Revenue Information .................................................................................................Income Taxes..........................................................................................................................................................
Available Liquidity ................................................................................................................................................Capital Investment Plan........................................................................................................................................Regulatory Proceedings ........................................................................................................................................Dividend Restrictions ............................................................................................................................................Margin and Collateral Deposits ...........................................................................................................................Workers Compensation Self-Insurance Fund.....................................................................................................
iv1
334677888
111112131414141414
1616
17171717181818192021212223232325252526

ii
MARKET RISK EXPOSURES ...................................................................................................................................
CRITICAL ACCOUNTING ESTIMATES AND POLICIES...................................................................................
NEW ACCOUNTING GUIDANCE............................................................................................................................ITEM 7A. QUANTITATIVE AND QUALITATIVE DISCLOSURE ABOUT MARKET RISK .........................ITEM 8. FINANCIAL STATEMENTS AND SUPPLEMENTARY DATA .............................................................CONSOLIDATED FINANCIAL STATEMENTS .....................................................................................................REPORT OF INDEPENDENT REGISTERED PUBLIC ACCOUNTING FIRM ................................................
NOTES TO CONSOLIDATED FINANCIAL STATEMENTS ................................................................................
ITEM 9. CHANGES IN AND DISAGREEMENTS WITH ACCOUNTANTS ON ACCOUNTING AND FINANCIAL DISCLOSURE .......................................................................................................................................ITEM 9A. CONTROLS AND PROCEDURES..........................................................................................................ITEM 9B. OTHER INFORMATION .........................................................................................................................
Regulatory Balancing Accounts ...........................................................................................................................Historical Consolidated Cash Flows ....................................................................................................................Contractual Obligations and Contingencies .......................................................................................................
Interest Rate Risk ..................................................................................................................................................Commodity Price Risk ..........................................................................................................................................Credit Risk .............................................................................................................................................................
Rate Regulated Enterprises ..................................................................................................................................Nuclear Decommissioning – ARO ........................................................................................................................Pensions and Postretirement Benefits Other than Pensions..............................................................................Income Taxes..........................................................................................................................................................Accounting for Contingencies, Guarantees and Indemnities ............................................................................
Consolidated Statements of Income.....................................................................................................................Consolidated Statements of Comprehensive Income .........................................................................................Consolidated Balance Sheets ................................................................................................................................Consolidated Statements of Cash Flows..............................................................................................................Consolidated Statements of Changes in Equity ..................................................................................................
Note 1. Summary of Significant Accounting Policies .........................................................................................Note 2. Property, Plant and Equipment ..............................................................................................................Note 3. Variable Interest Entities .........................................................................................................................Note 4. Fair Value Measurements ........................................................................................................................Note 5. Debt and Credit Agreements ...................................................................................................................Note 6. Derivative Instruments and Hedging Activities.....................................................................................Note 7. Income Taxes.............................................................................................................................................Note 8. Compensation and Benefit Plans ............................................................................................................Note 9. Commitments and Contingencies ...........................................................................................................Note 10. Environmental Developments ...............................................................................................................Note 11. Accumulated Other Comprehensive Loss ............................................................................................Note 12. Supplemental Cash Flows Information ................................................................................................Note 13. Preferred and Preference Stock ............................................................................................................Note 14. Regulatory Assets and Liabilities ..........................................................................................................Note 15. Other Investments ..................................................................................................................................Note 16. Other Income and Expenses ..................................................................................................................Note 17. Quarterly Financial Data (Unaudited) .................................................................................................
2626282929303031313132343435353535363737384041424248495055555862778284858586888990
909091

iii
PART IIIITEM 10. DIRECTORS AND EXECUTIVE OFFICERS AND CORPORATE GOVERNANCE ......................ITEM 11. EXECUTIVE COMPENSATION..............................................................................................................
ITEM 12. SECURITY OWNERSHIP OF CERTAIN BENEFICIAL OWNERS AND MANAGEMENT AND RELATED STOCKHOLDER MATTERS.................................................................................................................
ITEM 13. CERTAIN RELATIONSHIPS AND RELATED TRANSACTIONS, AND DIRECTOR INDEPENDENCE.........................................................................................................................................................ITEM 14. PRINCIPAL ACCOUNTANT FEES AND SERVICES ...........................................................................
PART IVITEM 15. EXHIBITS AND FINANCIAL STATEMENT SCHEDULES ................................................................
SIGNATURESEXHIBIT INDEX
9191
91
9191
929496
iv
GLOSSARY
The following terms and abbreviations appearing in the text of this report have the meanings indicated below.
2010 Tax Relief Act...........AFUDC..............................APS....................................ARO(s) ..............................Bcf .....................................Big 4 ..................................CAA...................................CAIR..................................CAISO ...............................CAMR ...............................CARB ................................CDWR ...............................CEC ...................................CPUC.................................CRRs..................................DOE...................................ERRA.................................FASB .................................FERC .................................FGIC ..................................FIP(s) .................................Four Corners......................
GAAP ................................GHG ..................................Global Settlement ..............
GRC...................................IRS.....................................ISO.....................................kWh(s) ...............................MD&A...............................
Mohave ..............................
Moody's .............................MRTU................................MW....................................MWh..................................NAAQS .............................NERC ................................Ninth Circuit ......................NOx ....................................NRC...................................
Tax Relief, Unemployment Insurance Reauthorization and Job Creation Act of 2010allowance for funds used during constructionArizona Public Service Companyasset retirement obligation(s)billion cubic feetKern River, Midway-Sunset, Sycamore and Watson natural gas power projectsClean Air ActClean Air Interstate RuleCalifornia Independent System OperatorClean Air Mercury RuleCalifornia Air Resources BoardCalifornia Department of Water ResourcesCalifornia Energy CommissionCalifornia Public Utilities Commissioncongestion revenue rightsU. S. Department of Energyenergy resource recovery accountFinancial Accounting Standards BoardFederal Energy Regulatory CommissionFinancial Guarantee Insurance Companyfederal implementation plan(s)coal fueled electric generating facility located in Farmington, New Mexico in which SCEholds a 48% ownership interestgenerally accepted accounting principlesgreenhouse gasA settlement between Edison International and the IRS that resolves all of SCE's federalincome tax disputes and affirmative claims for tax years 1986 through 2002 and relatedmatters with state tax authorities.general rate caseInternal Revenue ServiceIndependent System Operatorkilowatt-hour(s)Management's Discussion and Analysis of Financial Condition and Results of Operations inthis reporttwo coal fueled electric generating facilities that no longer operate located in Clark County,Nevada in which SCE holds a 56% ownership interestMoody's Investors ServiceMarket Redesign Technical Upgrademegawattsmegawatt-hoursnational ambient air quality standardsNorth American Electric Reliability CorporationU.S. Court of Appeals for the Ninth Circuitnitrogen oxideNuclear Regulatory Commission
v
NSR ...................................Palo Verde..........................
PBOP(s).............................PBR....................................PG&E ................................PSD....................................QF(s)..................................ROE ...................................S&P....................................San Onofre.........................
SCAQMD..........................SCE....................................SDG&E..............................SEC....................................SIP(s) .................................SO2.....................................SRP ....................................US EPA..............................VIE(s) ................................
New Source Reviewlarge pressurized water nuclear electric generating facility located near Phoenix, Arizona inwhich SCE holds a 15.8% ownership interestpostretirement benefits other than pension(s)Performance-based ratemakingPacific Gas & Electric CompanyPrevention of Significant Deteriorationqualifying facility(ies)return on equityStandard & Poor's Ratings Serviceslarge pressurized water nuclear electric generating facility located in south San Clemente,California in which SCE holds a 78.21% ownership interestSouth Coast Air Quality Management DistrictSouthern California Edison CompanySan Diego Gas & ElectricU.S. Securities and Exchange Commissionstate implementation plan(s)sulfur dioxideSalt River Project Agricultural Improvement and Power DistrictU.S. Environmental Protection Agencyvariable interest entity(ies)
1
FORWARD-LOOKING STATEMENTS
This Annual Report on Form 10-K contains "forward-looking statements" within the meaning of the Private Securities Litigation Reform Act of 1995. Forward-looking statements reflect SCE's current expectations and projections about future events based on SCE's knowledge of present facts and circumstances and assumptions about future events and include any statement that does not directly relate to a historical or current fact. Other information distributed by SCE that is incorporated in this report, or that refers to or incorporates this report, may also contain forward-looking statements. In this report and elsewhere, the words "expects," "believes," "anticipates," "estimates," "projects," "intends," "plans," "probable," "may," "will," "could," "would," "should," and variations of such words and similar expressions, or discussions of strategy or of plans, are intended to identify forward-looking statements. Such statements necessarily involve risks and uncertainties that could cause actual results to differ materially from those anticipated. Some of the risks, uncertainties and other important factors that could cause results to differ from those currently expected, or that otherwise could impact SCE, include, but are not limited to:
• ability of SCE to recover its costs in a timely manner from its customers through regulated rates;
• decisions and other actions by the CPUC, the FERC and other regulatory authorities and delays in regulatory actions;
• possible customer bypass or departure due to technological advancements or cumulative rate impacts that make self-generation or use of alternative energy sources economically viable;
• risks associated with the operation of transmission and distribution assets and nuclear and other power generating facilities including: nuclear fuel storage issues, public safety issues, failure, availability, efficiency, output, cost of repairs and retrofits of equipment and availability and cost of spare parts;
• environmental laws and regulations, both at the state and federal levels, or changes in the application of those laws, that could require additional expenditures or otherwise affect the cost and manner of doing business;
• cost of capital and the ability to borrow funds and access to capital markets on reasonable terms;
• the cost and availability of electricity including the ability to procure sufficient resources to meet expected customer needs in the event of significant counterparty defaults under power-purchase agreements;
• changes in the fair value of investments and other assets;
• changes in interest rates and rates of inflation, including those rates which may be adjusted by public utility regulators;
• governmental, statutory, regulatory or administrative changes or initiatives affecting the electricity industry, including the market structure rules applicable to each market and price mitigation strategies adopted by Independent System Operators and Regional Transmission Organizations;
• availability and creditworthiness of counterparties and the resulting effects on liquidity in the power and fuel markets and/or the ability of counterparties to pay amounts owed in excess of collateral provided in support of their obligations;
• cost and availability of labor, equipment and materials;
• ability to obtain sufficient insurance, including insurance relating to SCE's nuclear facilities and wildfire-related liability, and to recover the costs of such insurance;
• ability to recover uninsured losses in connection with wildfire-related liability;
• effects of legal proceedings, changes in or interpretations of tax laws, rates or policies, and changes in accounting standards;
• potential for penalties or disallowances caused by non-compliance with applicable laws and regulations;
• cost and availability of coal, natural gas, fuel oil, and nuclear fuel, and related transportation to the extent not recovered through regulated rate cost escalation provisions or balancing accounts;
• cost and availability of emission credits or allowances for emission credits;
• transmission congestion in and to each market area and the resulting differences in prices between delivery points;
• ability to provide sufficient collateral in support of hedging activities and power and fuel purchased;

2
• weather conditions and natural disasters;
• risks inherent in the development of generation projects and transmission and distribution infrastructure replacement and expansion projects, including those related to project site identification, public opposition, environmental mitigation, construction, permitting, power curtailment costs (payments due under power contracts in the event there is insufficient transmission to enable the acceptance of power delivery), and governmental approvals; and
• risks that competing transmission systems will be built by merchant transmission providers in SCE's service area.
See "Risk Factors" in Part I, Item 1A of this report for additional information on risks and uncertainties that could cause results to differ from those currently expected or that otherwise could impact SCE or its subsidiaries.
Additional information about risks and uncertainties, including more detail about the factors described in this report, is contained throughout this report. Readers are urged to read this entire report, including the information incorporated by reference, and carefully consider the risks, uncertainties and other factors that affect SCE's business. Forward-looking statements speak only as of the date they are made and SCE is not obligated to publicly update or revise forward-looking statements. Readers should review future reports filed by SCE with the U.S. Securities and Exchange Commission.

3
PART I
ITEM 1. BUSINESS
SCE is an investor-owned public utility primarily engaged in the business of supplying electricity to an approximately 50,000 square-mile area of southern California. The SCE service territory contains a population of nearly 14 million people. In 2011, SCE's total operating revenue was derived as follows: 41.6% commercial customers, 40.2% residential customers, 5.7% industrial customers, 0.7% resale sales, 5.5% public authorities, and 6.3% agricultural and other customers. SCE had 18,069 full-time employees at December 31, 2011. SCE's operating revenue was approximately $10.6 billion in 2011.
Sources of energy to serve SCE's customers during 2011 were approximately: 36% purchased power; 21% CDWR; and 43% SCE-owned generation.
SCE separately files reports pursuant to Section 13(a) or 15(d) of the Securities Exchange Act. SCE also files a joint Proxy Statement with its parent, Edison International. Such reports and Proxy Statement are available at www.edisoninvestor.com or on the SEC's website at www.sec.gov. The information contained on, or connected to, the Edison investor website is not incorporated by reference into this report.
Regulation
CPUC
SCE's retail operations are subject to regulation by the CPUC. The CPUC has the authority to regulate, among other things, retail rates, energy purchases on behalf of retail customers, rate of return, rates of depreciation, issuance of securities, disposition of utility assets and facilities, oversight of nuclear decommissioning funding and costs, and aspects of the transmission system planning, site identification and construction.
FERC
SCE's wholesale operations (including sales of electricity into the wholesale markets) are subject to regulation by the FERC. The FERC has the authority to regulate wholesale rates as well as other matters, including unbundled transmission service pricing, accounting practices, and licensing of hydroelectric projects. The FERC also has jurisdiction over a portion of the retail rates and associated rate design.
NERC
The North American Electric Reliability Corporation ("NERC") establishes and enforces reliability standards and critical infrastructure protection standards to protect the bulk power system against potential disruptions from cyber and physical security breaches. The critical infrastructure protection standards focus on controlling access to critical physical and cyber security assets. Compliance with these standards is mandatory. The maximum penalty that may be levied for violating a NERC reliability or critical infrastructure protection standard is $1 million per violation, per day.
SCE has a formal cyber security program that is staffed and has a dedicated budget. The program covers SCE's information technology systems as well as the electric grid where SCE has control of it. Program staff is engaged with industry groups as well as public-private initiatives to reduce risk and to strengthen the security and reliability of SCE's systems and infrastructure. The program is also engaged in the protection of SCE's customer information.
Transmission and Substation Facilities Regulation
The construction, planning and project site identification of SCE's transmission lines and substation facilities require the approval of many governmental agencies and compliance with various laws. These agencies include utility regulatory commissions such as the CPUC and other state regulatory agencies depending on the project location; the CAISO, and other environmental, land management and resource agencies such as the Bureau of Land Management, the U.S. Forest Service, and the California Department of Fish and Game; and regional water quality control boards. In addition, to the extent that SCE transmission line projects pass through lands owned or controlled by Native American tribes, consent and approval from the affected tribes and the Bureau of Indian Affairs are also necessary for the project to proceed.
CEC
The construction, planning, and project site identification of SCE's power plants of 50 MW or greater within California are subject to the jurisdiction of the CEC. The CEC is also responsible for forecasting future energy needs. These forecasts are used by the CPUC in determining the adequacy of SCE's electricity procurement plans.

4
Nuclear Power Plant Regulation
SCE is subject to the jurisdiction of the NRC with respect to the safety of its San Onofre and Palo Verde Nuclear Generating Stations. The NRC regulates commercial nuclear power plants through licensing, oversight and inspection, performance assessment, and enforcement of its requirements.
In light of the events at the Fukushima Daiichi nuclear plant in Japan resulting from the March 2011 earthquake and tsunami, the NRC has been performing and plans to continue to perform additional operational and safety reviews of nuclear facilities in the United States. The NRC's Near Term Task Force ("NTTF") conducted a systematic review of NRC processes and regulations to determine whether additional improvements to the existing nuclear regulatory system are warranted in light of the events in Japan. The NTTF concluded that a sequence of events like the Fukushima accident is unlikely to occur in the U.S., and that continued operation of U.S. reactors does not pose an imminent risk to public health and safety. The NTTF Report proposed changes to regulations applicable to protection against natural phenomena, including earthquakes and flooding and emergency preparedness, and the NTTF made a number of recommendations as to actions that the NRC might implement. In October 2011, the NRC identified seven of the near-term actions recommended by the NRC staff as having the greatest potential for safety improvement. The NRC staff was directed to strive to implement these actions by 2016. Implementation of these actions will require further interactions between the NRC staff and the nuclear industry. These actions may impact future operations and capital requirements at U.S. nuclear facilities at the time of their implementation, including the operations and capital requirements of SCE's nuclear facilities.
Operating License Renewal
In April 2011, the NRC extended the operating license for Palo Verde Operating Units 1, 2 and 3 for an additional 20 years, to 2045, 2046 and 2047, respectively. San Onofre's current operating licenses for Units 2 and 3 will expire in 2022. The NRC's review of a license renewal application typically takes three to five years. Prior to filing a license renewal application at the NRC, SCE would make an application to the CPUC to demonstrate the cost effectiveness of continuing operations at San Onofre and to seek authority to recover the cost of seeking a license renewal at the NRC and pursuing approvals from other state and federal agencies, such as the Department of the Navy and the California Coastal Commission. SCE will consider a decision to file an application for cost recovery at the CPUC in 2012. If SCE were to choose not to pursue license renewal or if SCE' efforts to obtain license renewal were not successful, SCE will need to determine what generation and transmission alternatives would need to be made available to replace the capacity, energy, and grid reliability benefits that SCE's customers now receive from San Onofre by the time San Onofre ceases generating electricity. Should SCE decide to pursue a license extension for San Onofre, SCE will likely need to simultaneously consider generation and transmission alternatives given the long lead times for the NRC to approve a license extension and to site, permit and construct new generation and transmission facilities. The costs of these alternatives could be substantial.
Overview of Ratemaking Process
CPUC
Revenue authorized by the CPUC through triennial GRC proceedings is intended to provide SCE a reasonable opportunity to recover its costs and earn a return on its net investment in generation and distribution assets (also referred to as “rate base”). The CPUC sets an annual revenue requirement for the base year which is made up of the operation and maintenance costs, depreciation, taxes and a return consistent with the capital structure (discussed below). The return is established by multiplying an authorized rate of return, determined in separate cost of capital proceedings, by SCE's generation and distribution rate base. In the GRC proceedings, the CPUC also generally approves the level of capital spending on a forecast basis. Following the base year, the revenue requirements for the remaining two years are set by a methodology established in the GRC proceeding, which generally, among other items, includes annual allowances for escalation in operation and maintenance costs, additional changes in capital-related investments and the recovery for expected nuclear refueling outages.
SCE's authorized revenue requirements were $4.83 billion, $5.04 billion and $5.25 billion for the years ended December 31, 2009, 2010 and 2011, respectively. SCE filed its 2012 GRC application with the CPUC on November 23, 2010, to be effective on January 1, 2012. For further discussion of the 2012 GRC, see “Management Overview—2012 CPUC General Rate Case” in the MD&A.
CPUC rates decouple authorized revenue from the volume of electricity sales, so that SCE earns revenue equal to amounts authorized. Differences between amounts collected and authorized levels are either collected from or refunded to customers, and, therefore, such differences do not impact operating revenue. Accordingly, SCE is neither benefited nor burdened by the volumetric risk related to retail electricity sales.
The CPUC regulates SCE's capital structure and authorized rate of return. SCE's current authorized capital structure is 48%

5
common equity, 43% long-term debt and 9% preferred equity. SCE's current authorized cost of capital consists of: cost of long-term debt of 6.22%, cost of preferred equity of 6.01% and return on common equity of 11.5%. SCE is scheduled to file a new cost of capital application with the CPUC in April 2012 that will be effective beginning in 2013.
In addition, to the ratemaking process described above, the CPUC has also authorized ratemaking mechanisms outside of the GRC process for significant capital projects, as needed.
Balancing accounts (also referred to as cost-recovery mechanisms) are typically used to track and recover SCE's costs of fuel, purchased-power, and certain operation and maintenance expenses, including certain demand-side management program costs. SCE earns no return on these activities and although differences between forecasted and actual costs do not impact earnings, such differences do impact cash flows and can change rapidly.
SCE's balancing account for fuel and power procurement-related costs is established under the Energy Resource Recovery Account ("ERRA") Mechanism. SCE sets rates based on an annual forecast of the costs that it expects to incur during the following year. In addition, the CPUC has established a "trigger" mechanism for the ERRA balancing account that allows for a rate adjustment if the balancing account over-collection or under-collection exceeds 5% of SCE's prior year's revenue that is classified as generation for retail rates. For 2012, the trigger amount is approximately $237 million.
The majority of costs eligible for recovery through cost-recovery rates are approved upfront by the CPUC though a procurement plan with predefined standards, or through CPUC preapproval, and thus could negatively impact earnings and cash flows if SCE's costs were found to be unreasonable or out of compliance and disallowed.
FERC
Revenue authorized by the FERC is intended to provide SCE a reasonable opportunity to recover its costs and earn a return on its net investment in transmission assets. In August 2011, the FERC accepted SCE's request to implement a formula rate effective January 1, 2012 to determine SCE's FERC transmission revenue requirement, including its construction work in progress ("CWIP") revenue requirement that was previously recovered through a separate mechanism. For further discussion of SCE's FERC formula rates, see “Management Overview—FERC Formula Rates” in the MD&A.
Retail Rates
To develop retail rates, the authorized revenue requirements are allocated among all customer classes (residential, commercial, industrial and agricultural) on a functional basis (i.e., generation, distribution, transmission, etc.). Specific rate components are designed to recover the authorized revenue allocated to each customer class.
Currently, SCE has a five tier residential rate structure. Each tier represents a certain electricity usage level and within each increasing usage level, the electricity is priced at higher rates per kilowatt hour. The first tier is a baseline tier and has the lowest rate per kilowatt hour. "Baseline" refers to a specific amount of energy allocated for residential customers that is charged at a lower price than energy used in excess of that amount. Baseline quantities are determined by SCE for approval by the CPUC using average residential electricity consumption for nine geographical regions in southern and central California. Seasonal variations in usage are also accounted for in determining baseline allowances.
The intent of the baseline and the tiered structure is to provide a portion of reasonable energy needs (baseline usage) of residential customers at the lowest rate, and to encourage conservation of energy by increasing the rate charges as energy usage increases. Statutory restrictions on tier one and two rates have shifted the burden of residential rate increases to the higher tier/usage customers. As part of the second phase of SCE's 2012 GRC, SCE requested certain rate design modifications that are intended to provide a more equitable, cost-based rate design.
CDWR-Related Rates
As a result of the California energy crisis, in 2001 the CDWR entered into contracts to purchase power for sale at cost directly to SCE's retail customers and issued bonds to finance those power purchases. The CDWR's total statewide power charge and bond charge revenue requirements were allocated by the CPUC among the customers of the investor-owned utilities (SCE, PG&E and SDG&E). SCE billed and collected from its customers the costs of power purchased and sold by the CDWR. SCE will continue to bill and collect CDWR bond-related charges and direct access exit fees until 2022. The CDWR-related charges and a portion of direct access exit fees that are remitted directly to the CDWR are not recognized as operating revenue; but did affect customer rates. All CDWR power contracts that were allocated to SCE expired by the end of 2011. See "Results of Operations—Supplemental Operating Revenue Information" in the MD&A for further discussion of the impact of CDWR charges on customer rates.
6
Purchased Power and Fuel Supply
SCE obtains the power needed to serve its customers from its generating facilities and from sales by qualifying facilities, independent power producers, renewable power producers, the CAISO, and other utilities.
Natural Gas Supply
SCE requires natural gas to meet contractual obligations for power tolling agreements (power contracts in which SCE has agreed to provide or pay for the natural gas burned to generate electricity). SCE also requires natural gas to fuel its Mountainview and peaker plants, which are generation units that are designed to operate in response to changes in demand for power. The physical natural gas purchased by SCE is subject to competitive bidding.
Nuclear Fuel Supply
For San Onofre Units 2 and 3, contractual arrangements are in place covering 100% of the projected nuclear fuel requirements through the years indicated below:
Uranium concentratesConversionEnrichmentFabrication
2020202020202015
For Palo Verde, contractual arrangements are in place covering 100% of the projected nuclear fuel requirements through the years indicated below:
Uranium concentratesConversionEnrichmentFabrication
2017201820202016
Coal Supply
On January 1, 2010, SCE and the other Four Corners participants entered into a Four Corners Coal Supply Agreement with the BHP Navajo Coal Company, under which coal will be supplied to Four Corners Units 4 and 5 until July 6, 2016. The co-owners of Four Corners (excluding SCE) are currently negotiating a potential new Coal Supply Agreement with BHP Navajo Coal Company for the period after July 6, 2016. In November 2010, SCE entered into an agreement to sell its interest in Four Corners subject to certain conditions and regulatory approvals. See "Item 8. SCE Notes to Consolidated Financial Statements—Note 2. Property, Plant and Equipment," for more information on the sale of SCE's interest in Four Corners.
CAISO Wholesale Energy Market
In California and other states, wholesale energy markets exist through which competing electricity generators offer their electricity output to electricity retailers. Each state's wholesale electricity market is generally operated by its state ISO or a regional RTO. California's wholesale electricity market is operated by the CAISO. The CAISO schedules power in hourly increments with hourly prices through a real-time and day-ahead market that combines energy, ancillary services, unit commitment and congestion management. SCE participates in the day-ahead and real-time markets for the sale of its generation and purchases of its load requirements.
The CAISO uses a nodal locational pricing model, which sets wholesale electricity prices at system points ("nodes") that reflect local generation and delivery costs. Generally, SCE schedules its electricity generation to serve its load but when it has excess generation or the market price of power is more economic than its own generation, SCE may sell power from utility-owned generation assets and existing power procurement contracts into, or buy generation and/or ancillary services to meet its load requirements from, the day-ahead market. SCE will offer to buy its generation at nodes near the source of the generation, but will take delivery at nodes throughout SCE's service territory. Congestion may occur when available energy cannot be delivered due to transmission constraints, which results in transmission congestion charges and differences in prices at various nodes. The CAISO also offers congestion revenue rights or CRRs, a commodity that entitles the holder to receive (or pay) the value of transmission congestion between specific nodes, acting as an economic hedge against transmission congestion charges.

7
Competition
Because SCE is an electric utility company operating within a defined service territory pursuant to authority from the CPUC, SCE faces retail competition only to the extent that federal and California laws permit other entities to provide electricity and related services to customers within SCE's service territory. While California law provides only limited opportunities for customers to choose to purchase power directly from an energy service provider other than SCE, a California statute was adopted in 2009 that permits a limited, phased-in expansion of customer choice (direct access) for nonresidential customers. SCE also faces some competition from cities and municipal districts that create municipal utilities or community choice aggregators. Competition between SCE and other electricity providers is conducted mainly on the basis of price; customers seek the lowest cost power available. The effect of this competition on SCE generally is to reduce the number of customers purchasing power from SCE, but those departing customers typically continue to utilize and pay for SCE's transmission and distribution services.
Technological developments, such as on-site power generation (self generation), pose additional competitive challenges for traditional utilities. See "Item 1A. Risk Factors—Regulatory Risks."
In the area of transmission infrastructure, SCE may experience increased competition from merchant transmission providers. The FERC has made changes to its transmission planning requirements with the goal of opening transmission development to competition from independent developers. In July 2011, the FERC adopted new rules that remove incumbent public utility transmission owners' federally-based right of first refusal to construct certain new transmission facilities. The rules direct regional entities, such as ISOs, to create new processes that would allow other providers to develop new transmission projects. The new processes will not become effective until approved by the FERC, which is expected in late 2012. The majority of SCE's 2012 – 2014 transmission capital forecast relates to transmission projects that have been approved by the CAISO and barring a re-evaluation under the new rules, will not be subject to the new processes. SCE does not expect these projects to be re-evaluated. The impact of the new rules on future transmission projects will depend on the processes ultimately implemented by regional entities.
Properties
SCE supplies electricity to its customers through extensive transmission and distribution networks. Its transmission facilities, which are located primarily in California but also in Nevada and Arizona, deliver power from generating sources to the distribution network and consist of lines ranging from 33 kV to 500 kV and substations. SCE's distribution system, which takes power from substations to customers, includes over 59,000 circuit miles of overhead lines, 44,000 circuit miles of underground lines and over 700 distribution substations, all of which are located in California.
SCE owns the generating facilities listed in the following table.
Generating FacilitySan Onofre NuclearGenerating StationHydroelectric Plants (36)Pebbly Beach GeneratingStationMountainviewPeaker Plants (4)
Palo Verde NuclearGenerating StationFour Corners Units 4 and 5Solar PV Plants (23)Total
Location(in CA, unless
otherwise noted)South of SanClementeVariousCatalina Island
RedlandsVarious
Phoenix, AZ
Farmington, NMVarious
Fuel TypeNuclear
HydroelectricDiesel
Natural GasGas fueledCombustionTurbineNuclear
Coal-firedPhotovoltaic
OperatorSCE
SCESCE
SCESCE
APS
APSSCE
SCE'sOwnershipInterest (%)
78.21%
100%100%
100%100%
15.8%
48%100%
1
Net PhysicalCapacity(in MW)
2,150
1,1769
1,050196
3,739
1,54053
9,913
SCE's Capacity
pro rata share(in MW)
1,760
1,1769
1,050196
591
73953
5,574
1 In November 2010, SCE entered into an agreement to sell its interest in Four Corners to APS for approximately $294 million. The sale is contingent upon the satisfaction of several conditions and the obtaining of multiple regulatory approvals. Currently SCE estimates that the sale will close in the second half of 2012. See "Item 8. SCE Notes to Consolidated Financial Statements—Note 2. Property, Plant and Equipment" for more information.
8
San Onofre, Four Corners, certain of SCE's substations, and portions of its transmission, distribution and communication systems are located on lands owned by the United States or others under licenses, permits, easements or leases, or on public streets or highways pursuant to franchises. Certain of the documents evidencing such rights obligate SCE, under specified circumstances and at its expense, to relocate such transmission, distribution, and communication facilities located on lands owned or controlled by federal, state, or local governments.
Twenty-eight of SCE's 36 hydroelectric plants and related reservoirs are located in whole or in part on U.S.-owned lands pursuant to 30- to 50-year FERC licenses that expire at various times between 2012 and 2046. Such licenses impose numerous restrictions and obligations on SCE, including the right of the United States to acquire projects upon payment of specified compensation. When existing licenses expire, the FERC has the authority to issue new licenses to third parties that have filed competing license applications, but only if their license application is superior to SCE's and then only upon payment of specified compensation to SCE. New licenses issued to SCE are expected to contain more restrictions and obligations than the expired licenses because laws enacted since the existing licenses were issued require the FERC to give environmental objectives greater consideration in the licensing process.
Substantially all of SCE's properties are subject to the lien of a trust indenture securing first and refunding mortgage bonds. See "Item 8. SCE Notes to Consolidated Financial Statements—Note 5. Debt and Credit Agreements."
Insurance
SCE participates in the property and casualty insurance program of its parent, Edison International. This program includes excess liability insurance covering liabilities to third parties for bodily injury or property damage resulting from operations. For further information on wildfire insurance issues, see "Item 8. SCE Notes to Consolidated Financial Statements—Note 9. Commitments and Contingencies." SCE also has separate insurance programs for nuclear property and liability, workers compensations and solar rooftop construction liability.
Seasonality
Due to warm weather during the summer months and SCE's rate design, operating revenue during the third quarter of each year is generally higher than the other quarters.
Environmental Matters
Legislative and regulatory activities by federal, state, and local authorities in the United States relating to energy and the environment impose numerous restrictions on the operation of SCE's existing facilities and affect the timing, cost, location, design, construction and operation of new facilities, as well as the cost of mitigating the environmental impacts of past operations. The environmental regulations and other developments discussed below have the largest impact on fossil-fuel fired power plants, and therefore the discussion in this section focuses mainly on regulations applicable to the states of California and New Mexico, where such facilities are located.
SCE continues to monitor legislative and regulatory developments and to evaluate possible strategies for compliance with environmental regulations. Additional information about environmental matters affecting SCE, including projected environmental capital expenditures, is included in the MD&A under the heading "Liquidity and Capital Resources—Capital Investment Plan" and in "Item 8. SCE Notes to Consolidated Financial Statements—Note 9. Commitments and Contingencies—Environmental Remediation" and "—Note 10. Environmental Developments."
Air Quality
The CAA, which regulates air pollutants from mobile and stationary sources, has a significant impact on the operation of fossil fuel plants, especially coal-fired plants. The CAA requires the US EPA to establish concentration levels in the ambient air for six criteria pollutants to protect public health and welfare. These concentration levels are known as National Ambient Air Quality Standards ("NAAQS"). The six criteria pollutants are carbon monoxide, lead, nitrogen dioxide, ozone, particulate matter, and SO2.
Federal environmental regulations of these criteria pollutants require states to adopt state implementation plans, known as SIPs, for certain pollutants, which detail how the state will attain the standards that are mandated by the relevant law or regulation. The SIPs must be equal to or more stringent than the federal requirements and must be submitted to the US EPA for approval. Each state identifies the areas within its boundaries that meet the NAAQS (attainment areas) and those that do not (non-attainment areas), and must develop a SIP both to bring non-attainment areas into compliance with the NAAQS and to maintain good air quality in attainment areas. If the attainment status of areas changes, states may be required to develop new SIPs that address the changes. Much of southern California is in a non-attainment area for several criteria pollutants.
9
Ozone
National Ambient Air Quality Standards
In January 2010, the US EPA proposed a revision to the primary and secondary NAAQS for 8-hour ozone that it had finalized in 2008. The 8-hour ozone standard established in 2008 was 0.075 parts per million. In January 2010, the US EPA proposed establishing a primary 8-hour ozone NAAQS between 0.060 and 0.070 parts per million and a distinct secondary standard to protect sensitive vegetation and ecosystems. In September 2011, President Obama announced that the proposed revision was being withdrawn. The ozone NAAQS established in 2008 remains in place, but the implementation process must be completed before the 0.075 parts-per-million standard can be enforced. The US EPA has indicated that it intends to issue initial area designations of attainment, nonattainment, and unclassifiable areas across the nation in 2012. States will then be required to develop and submit state implementation plans outlining how compliance with the 2008 NAAQS will be achieved. New primary and secondary ozone standards are expected in 2014.
Regional Haze
The regional haze rules under the CAA are designed to prevent impairment of visibility in certain federally designated areas. The goal of the rules is to restore visibility in mandatory federal Class I areas, such as national parks and wilderness areas, to natural background conditions by 2064. Sources such as power plants that are reasonably anticipated to contribute to visibility impairment in Class I areas may be required to install best available retrofit technology ("BART") or implement other control strategies to meet regional haze control requirements.
In relation to Four Corners, the US EPA issued its proposed FIP in October 2010. The proposed FIP would require the installation of SCR pollution control equipment within designated time periods. In November 2010, SCE and APS entered into an agreement for the sale of SCE's interest in Four Corners Units 4 and 5 to APS, subject to regulatory approvals and other conditions. Due to the investment constraints of SB 1368, the California law on GHG emission performance standards discussed below in "—Greenhouse Gas Regulation—Regional Initiatives and State Legislation," SCE does not expect to be a Four Corners participant after the 2016 expiration of the current participant agreements and does not expect to participate in any investment in Four Corners SCRs. See "Item 8. SCE Notes to Consolidated Financial Statements—Note 2. Property, Plant and Equipment," for more information on the sale of SCE's interest in Four Corners.
New Source Review Requirements
The NSR regulations impose certain requirements on facilities, such as electric generating stations, if modifications are made to air emissions sources at the facility. Since 1999, the US EPA has pursued a coordinated compliance and enforcement strategy to address NSR compliance issues at the nation's coal-fired power plants.
In April 2009, APS, as operating agent of Four Corners, received a US EPA request pursuant to Section 114 of the CAA for information about Four Corners, including information about Four Corners' capital projects from 1990 to the present. SCE understands that in other cases the US EPA has utilized responses to similar Section 114 letters to examine whether power plants have triggered NSR requirements under the CAA. In October 2011, four environmental organizations filed a lawsuit against the Four Corners owners alleging NSR violations. See "Item 8. SCE Notes to Consolidated Financial Statements—Note 2. Property, Plant and Equipment," for information on the sale of SCE's interest in Four Corners.
Water Quality
Clean Water Act
Regulations under the federal Clean Water Act govern critical parameters at generating facilities, such as the temperature of effluent discharges and the location, design, and construction of cooling water intake structures at generating facilities. In March 2011, the US EPA proposed standards under the federal Clean Water Act that would affect cooling water intake structures at generating facilities. The standards are intended to protect aquatic organisms by reducing capture in screens attached to cooling water intake structures (impingement) and in the water volume brought into the facilities (entrainment). The regulations are expected to be finalized by July 2012. SCE is evaluating the proposed standards and believes, from a preliminary review, that compliance with the proposed standards regarding impingement will be achievable without incurring material additional capital expenditures or operating costs. The required measures to comply with the proposed standards regarding entrainment are subject to the discretion of the permitting authority, and SCE is unable at this time to assess potential costs of compliance, which could be significant for San Onofre.
California—Prohibition on the Use of Ocean-Based Once-Through Cooling
California has a US EPA-approved program to issue individual or group permits for the regulation of Clean Water Act
10
discharges. California also regulates certain discharges not regulated by the US EPA. Effective October 1, 2010, the California State Water Resources Control Board issued a final policy, which establishes closed-cycle wet cooling as required technology for retrofitting existing once-through cooled plants like SCE's San Onofre and many of the existing fossil-fueled power plants along the California coast. The final policy required an independent engineering study to be completed prior to the fourth quarter of 2013 regarding the feasibility of compliance by California's two coastal nuclear power plants. The policy may result in significant capital expenditures at San Onofre and may affect its operations.
Coal Combustion Wastes
US EPA regulations currently classify coal ash and other coal combustion residuals as solid wastes that are exempt from hazardous waste requirements. This classification enables beneficial uses of coal combustion residuals, such as for cement production and fill materials. In June 2010, the US EPA published proposed regulations relating to coal combustion residuals that could result in their reclassification. For further discussion see "Item 8. SCE Notes to Consolidated Financial Statements—Note 10. Environmental Developments."
Greenhouse Gas Regulation
There have been a number of federal and state legislative and regulatory initiatives to reduce GHG emissions. Any climate change regulation or other legal obligation that would require substantial reductions in GHG emissions or that would impose additional costs or charges for the emission of GHGs could significantly increase the cost of generating electricity from fossil fuels, and especially from coal-fired plants, as well as the cost of purchased power, which could adversely affect SCE.
Federal Legislative/Regulatory Developments
In June 2010, the US EPA issued the Prevention of Significant Deterioration ("PSD") and Title V Greenhouse Gas Tailoring Rule, known as the "GHG tailoring rule." This regulation generally subjects newly constructed sources of GHG emissions and newly modified existing major sources to the PSD air permitting program beginning in January 2011 (and later, to the Title V permitting program under the CAA); however the GHG tailoring rule significantly increases the emissions thresholds that apply before facilities are subjected to these programs. The emissions thresholds for CO2 equivalents in the final rule vary from 75,000 tons per year to 100,000 tons per year depending on the date and whether the sources are new or modified.
Regulation of GHG emissions pursuant to the PSD program could affect efforts to modify SCE's facilities in the future, and could subject new capital projects to additional permitting or emissions control requirements that could delay such projects.
In December 2010, the US EPA announced that it had entered into a settlement with various states and environmental groups to resolve a long-standing dispute over regulation of GHGs from electrical generating units pursuant to the New Source Performance Standards in the CAA and would propose performance standards for emissions from new and modified power plants and emissions guidelines for existing power plants. The specific requirements will not be known until the regulations are finalized. Since January 2010, the US EPA's Final Mandatory GHG Reporting Rule has required all sources within specified categories, including electric generation facilities, to monitor emissions, and to submit annual reports to the US EPA by March 31 of each year. SCE's 2011 GHG emissions were approximately 5.8 million metric tons.
Regional Initiatives and State Legislation
Regional initiatives and state legislation may also require reductions of GHG emissions and it is not yet clear whether or to what extent any federal legislation would preempt them. If state and/or regional initiatives remain in effect after federal legislation is enacted, utilities and generators could be required to satisfy them in addition to the federal standards.
SCE's operations in California are subject to two laws governing GHG emissions. The first law, the California Global Warming Solutions Act of 2006 (also referred to as AB 32), establishes a comprehensive program to reduce GHG emissions. AB 32 requires the California Air Resources Board ("CARB") to develop regulations, effective in 2012, that would reduce California's GHG emissions to 1990 levels in yearly increments by 2020. In December 2011, the CARB regulation was officially published establishing a California cap-and-trade program. The first compliance period under the regulations is for 2013 GHG emissions. CARB regulations implementing a cap-and-trade program and the cap-and-trade program itself, continue to be the subject of litigation. In December 2011, a federal district court enjoined the Low Carbon Fuel Standard, another AB 32 program regulating the carbon content of transportation fuels, on constitutional commerce clause grounds. Additional litigation challenging the cap-and-trade program on similar grounds is expected, though no suit has been filed to date.
The second law, SB 1368, required the CPUC and the CEC to adopt GHG emission performance standards restricting the ability of California investor-owned and publicly owned utilities, respectively, to enter into long-term arrangements for the purchase of electricity. The standards that have been adopted prohibit these entities, including SCE, from entering into long-
11
term financial commitments with generators that emit more than 1,100 pounds of CO2 per MWh, the performance of a combined-cycle gas turbine generator. SB 1368 may prohibit SCE from making emission control expenditures at Four Corners. See "Item 8. SCE Notes to Consolidated Financial Statements—Note 2. Property, Plant and Equipment" for information on the sale of SCE's interest in Four Corners.
California law has also required SCE to increase its electricity generated from renewable resources by at least 1% of its annual retail electricity sales per year so that 20% of its annual electricity sales are provided from such resources (the "RPS Program") by no later than December 31, 2010 or such later date as flexible compliance requirements permit. In accordance with the procurement rules and regulations, SCE demonstrated full compliance with the RPS Program in its March 2011 and August 2011 filings.
In April 2011, California enacted a law requiring California retail sellers of electricity to procure 33% of their customers' electricity requirements from renewable resources, as defined in the statute. The impact of the new 33% law will depend on how the CPUC and CEC implement the law, which remains uncertain. On December 1, 2011, the CPUC approved a decision setting procurement quantity requirements for CPUC-regulated retail sellers that incrementally increase to 33% over several periods between January 2011 and December 31, 2020. The quantity would remain at 33% of retail sales for each year thereafter. Currently SCE estimates its delivery of eligible renewable resources to customers to be 21% of its total energy portfolio for 2011.
Litigation Developments
Litigation alleging that GHG is a public and private nuisance may affect SCE, whether or not it is named as a defendant. The law is unsettled on whether or not this litigation presents questions capable of judicial resolution or political questions that should be resolved by the legislative or executive branches. For further discussion see "Item 8. SCE Notes to Consolidated Financial Statements—Note 10. Environmental Developments."
ITEM 1A. RISK FACTORS
Regulatory Risks
SCE's financial results depend upon its ability to recover its costs in a timely manner from its customers through regulated rates.
SCE's ongoing financial results depend on its ability to recover from its customers in a timely manner its costs, including the costs of electricity purchased for its customers, through the rates it charges its customers as approved by the CPUC and FERC. SCE's financial results also depend on its ability to earn a reasonable return on capital, including long-term debt and equity. SCE's capital investment plan, increasing procurement of renewable power, increasing environmental regulations, moderating demand, and the cumulative impact of other public policy requirements, collectively place continuing upward pressure on customer rates. Increases in self generation also reduce the pool of customers from whom fixed costs are recovered, while costs potentially increase due to system modifications that may be necessary to cope with the systemic effects of self-generation. Customers that self-generate their own power do not currently pay most transmission and distribution charges and are only subject to certain non-bypassable charges. The net result is to increase utility rates further for those customers who do not self-generate, which encourages more self generation and further rate increases. If SCE is unable to obtain a sufficient rate increase or to recover material amounts of its costs in rates in a timely manner or recover an adequate return on capital, its financial condition and results of operations could be materially adversely affected. For further information on SCE's rate requests, see "Management Overview—2012 General Rate Case" and "—FERC Formula Rates" in the MD&A.
SCE's energy procurement activities are subject to regulatory and market risks that could adversely affect its financial condition and liquidity.
SCE obtains energy, capacity, environmental credits and ancillary services needed to serve its customers from its own generating plants, as well as through contracts with energy producers and sellers. California law and CPUC decisions allow SCE to recover through the rates it is allowed to charge its customers reasonable procurement costs incurred in compliance with an approved procurement plan. Nonetheless, SCE's cash flows remain subject to volatility primarily resulting from changes to commodity prices. In addition, SCE is subject to the risks of unfavorable or untimely CPUC decisions about the compliance with SCE's procurement plan and the reasonableness of certain procurement-related costs.
SCE may not be able to hedge its risk for commodities on economic terms or fully recover the costs of hedges through the rates it is allowed to charge its customers, which could adversely affect SCE's liquidity and results of operations, see "Liquidity and Capital Resources—Market Risk Exposures" in the MD&A.

12
SCE is subject to extensive regulation and the risk of adverse regulatory decisions and changes in applicable regulations or legislation.
SCE operates in a highly regulated environment. SCE's business is subject to extensive federal, state and local energy, environmental and other laws and regulations. The CPUC regulates SCE's retail operations, and the FERC regulates SCE's wholesale operations. The NRC regulates SCE's nuclear power plants. The construction, planning, and project site identification of SCE's power plants and transmission lines in California are also subject to the jurisdiction of the California Energy Commission (for plants 50 MW or greater) and the CPUC.
SCE must periodically apply for licenses and permits from these various regulatory authorities and abide by their respective orders. Should SCE be unsuccessful in obtaining necessary licenses or permits or should these regulatory authorities initiate any investigations or enforcement actions or impose penalties or disallowances on SCE, SCE's business could be adversely affected. The process of obtaining licenses and permits from regulatory authorities may be delayed or defeated by concerted community opposition and such delay or defeat would have an adverse effect on SCE's business.
This extensive governmental regulation creates significant risks and uncertainties for SCE's business. Existing regulations may be revised or reinterpreted and new laws and regulations may be adopted or become applicable to SCE, or its facilities or operations in a manner that may have a detrimental effect on SCE's business or result in significant additional costs. In addition, regulation adopted via the public initiative process may apply to SCE, or its facilities or operations in a manner that may have a detrimental effect on SCE's business or result in significant additional costs.
The generation, transmission and distribution of electricity are dangerous and involve inherent risks of injury to employees and the general public.
Electricity is dangerous for employees and the general public should they come in contact with power lines or electrical equipment. Injuries caused by such contact can subject SCE to liability that, despite the existence of insurance coverage, can be significant.. In the wake of recent natural disasters such as windstorms, which can cause wildfires, pole failures and associated property damage and outages, the CPUC has increased its focus on public safety issues with an emphasis on heightened compliance with construction and operating standards and the potential for penalties being imposed on utilities. Such penalties and liabilities could be significant but are very difficult to predict. The range of possible penalties and liabilities includes amounts that could adversely affect SCE's liquidity and results of operations.
Operating Risks
SCE's financial condition and results of operations could be materially adversely affected if it is unable to successfully manage the risks inherent in operating and improving its facilities.
SCE's infrastructure is aging and could pose a risk to system reliability. In order to mitigate this risk, SCE is engaged in one of the largest infrastructure investment programs in its history, which involves multiple large-scale projects in multiple locations. This substantial increase in activity from SCE's historical levels elevates the operational risks and the need for superior execution in its activities. SCE's financial condition and results of operations could be materially affected if it is unable to successfully manage these risks as well as the risks inherent in operating and improving its facilities, the operation of which can be hazardous. SCE's inherent operating risks include such matters as the risks of human performance, workforce capabilities, public opposition to infrastructure projects, delays, environmental mitigation costs, difficulty in estimating costs, system limitations and degradation, and interruptions in necessary supplies. For example, SCE has recently experienced significant additional costs and disruptions in the progress of its Tehachapi Renewable Transmission Project. See "Liquidity and Capital Resources—Capital Investment Plan" in the MD&A.
SCE's systems and network infrastructure may be vulnerable to cyber attacks, intrusions or other catastrophic events that could result in their failure or reduced functionality.
Regulators, such as the NERC, and U.S. Government Departments, including the Departments of Defense, Homeland Security and Energy, have noted that the U.S. national electric grid and other energy infrastructures have potential vulnerabilities to cyber attacks and disruptions and that such cyber threats are becoming increasingly sophisticated and dynamic. SCE's operations require the continuous operation of critical information technology systems and network infrastructure. Although SCE actively monitors developments in this area and is involved in various industry groups and government initiatives, no security measures can completely shield such systems and infrastructure from vulnerabilities to cyber attacks, intrusions or other catastrophic events that could result in their failure or reduced functionality. If SCE's information technology systems security measures were to be breached or a critical system failure were to occur without timely recovery, SCE could be unable to fulfill critical business functions and/or sensitive confidential personal and other

13
data could be compromised, which could adversely affect SCE's financial condition and results of operations. See "Item 1. Business—Regulation—NERC" for further discussion.
There are inherent risks associated with operating nuclear power generating facilities.
Continued NRC scrutiny of San Onofre may result in additional corrective actions that will increase operations and maintenance costs or require additional capital expenditures.
San Onofre is subject to extensive oversight and scrutiny of the NRC. This scrutiny may result in SCE being required to take additional corrective actions and incur increased operations and maintenance expenses or new capital expenditures. If SCE is unable to take effective corrective actions required by the NRC, the NRC has the authority to impose fines or shut down a unit, or both, depending upon the NRC's assessment of the severity of the situation, until compliance is achieved. See "Item 1. Business—Regulation—Nuclear Power Plant Regulation" for further discussion.
Existing insurance and ratemaking arrangements may not protect SCE fully against losses from a nuclear incident.
Federal law limits public liability claims from a nuclear incident to the amount of available financial protection which is currently approximately $12.6 billion. SCE and other owners of the San Onofre and Palo Verde Nuclear Generating Stations have purchased the maximum private primary insurance available of $375 million per site. If nuclear incident liability claims were to exceed $375 million, the remaining amount would be made up from contributions of approximately $12.2 billion made by all of the nuclear facility owners in the U.S., up to an aggregate total of $12.6 billion. There is no assurance that the CPUC would allow SCE to recover the required contribution made in the case of one or more nuclear incident claims that exceeded $375 million. If this public liability limit of $12.6 billion is insufficient, federal law contemplates that additional funds may be appropriated by Congress. There can be no assurance of SCE's ability to recover uninsured costs in the event the additional federal appropriations are insufficient. See "Item 8. SCE Notes to Consolidated Financial Statements—Note 9. Commitments and Contingencies—Nuclear Insurance."
Spent fuel storage capacity could be insufficient to permit long-term operation of SCE's nuclear plants.
The U.S. Department of Energy has defaulted on its obligation to begin accepting spent nuclear fuel from commercial nuclear industry participants by January 31, 1998. If SCE or the operator of Palo Verde were unable to arrange and maintain sufficient capacity for interim spent-fuel storage now or in the future, it could hinder the operation of the plants and impair the value of SCE's ownership interests until storage could be obtained, each of which may have a material adverse effect on SCE.
SCE's insurance coverage for wildfires arising from its ordinary operations may not be sufficient and Edison International may not be able to obtain sufficient insurance on SCE's behalf for such occurrences.
Edison International has been experiencing increased costs and difficulties in obtaining insurance coverage for wildfires that could arise from SCE's ordinary operations. In addition, the insurance Edison International has obtained on SCE's behalf for wildfire liabilities may not be sufficient. Uninsured losses and increases in the cost of insurance may not be recoverable in customer rates. A loss which is not fully insured or cannot be recovered in customer rates could materially and adversely affect Edison International's and SCE's financial condition and results of operations. Furthermore, insurance for wildfire liabilities may not continue to be available at all or at rates or on terms similar to those presently available to Edison International. See "Item 8. SCE Notes to Consolidated Financial Statements—Note 10. Environmental Developments."
Environmental Risks
SCE is subject to extensive environmental regulations that may involve significant and increasing costs and adversely affect SCE.
SCE is subject to extensive and frequently changing environmental regulations and permitting requirements that involve significant and increasing costs and substantial uncertainty. SCE devotes significant resources to environmental monitoring, pollution control equipment, mitigation projects, and emission allowances to comply with existing and anticipated environmental regulatory requirements. However, the current trend is toward more stringent standards, stricter regulation, and more expansive application of environmental regulations. The adoption of laws and regulations to implement greenhouse gas controls could adversely affect operations, particularly of SCE's coal-fired plants. SCE may also be exposed to risks arising from past, current or future contamination at its former or existing facilities or with respect to offsite waste disposal sites that have been used in its operations. Other environmental laws, particularly with respect to air emissions, disposal of ash, wastewater discharge and cooling water systems, are also generally becoming more stringent. The continued operation of SCE facilities may require substantial capital expenditures for environmental controls or cessation of operations. Current and future state laws and regulations in California also could increase the required amount of energy that must be procured from

14
renewable resources. See "Item 1. Business—Environmental Matters" and "Item 8. SCE Notes to Consolidated Financial Statements—Note 10. Environmental Developments" for further discussion of environmental regulations under which SCE operates.
Financing Risks
As a capital intensive company, SCE relies on access to the capital markets. If SCE were unable to access the capital markets or the cost of financing were to substantially increase, its liquidity and operations would be adversely affected.
SCE regularly accesses the capital markets to finance its activities and is expected to do so by its regulators as part of its obligation to serve as a regulated utility. SCE's needs for capital for its ongoing infrastructure investment program are substantial. SCE's ability to arrange financing, as well as its ability to refinance debt and make scheduled payments of principal and interest, are dependent on numerous factors, including SCE's levels of indebtedness, maintenance of acceptable credit ratings, its financial performance, liquidity and cash flow, and other market conditions. SCE's failure to obtain additional capital from time to time would have a material adverse effect on SCE's liquidity and operations. See "Liquidity and Capital Resources—Capital Investment Plan" and "—Historical Consolidated Cash Flows" in the MD&A.
ITEM 1B. UNRESOLVED STAFF COMMENTS
None.
ITEM 2. PROPERTIES
The principal properties of SCE are described above under the heading "Item 1. Business—Properties."
ITEM 3. LEGAL PROCEEDINGS
None.
Pursuant to Form 10-K's General Instruction G(3), the following information in included as an additional item in Part I:
EXECUTIVE OFFICERS OF THE REGISTRANT
Executive OfficerRonald L. LitzingerStephen E. PickettLynda L. ZieglerPeter T. DietrichLinda G. SullivanRussell C. SwartzChris C. Dominski
Age atDecember 31, 2011
52615947486045
Company PositionPresidentExecutive Vice President, External RelationsExecutive Vice President, Power Delivery ServicesSenior Vice President and Chief Nuclear OfficerSenior Vice President and Chief Financial OfficerSenior Vice President and General CounselVice President and Controller
As set forth in Article IV of SCE's Bylaws, the elected officers of SCE are chosen annually by, and serve at the pleasure of, SCE's Board of Directors and hold their respective offices until their resignation, removal, other disqualification from service, or until their respective successors are elected. All of the above officers have been actively engaged in the business of SCE, its parent company Edison International, and/or one of SCE's subsidiaries or other affiliates for more than five years, except

15
for Mr. Dietrich, and have served in their present positions for the periods stated below. Additionally, those officers who have had other or additional principal positions in the past five years had the following business experience during that period:
Executive OfficerRonald L. Litzinger
Stephen E. Pickett
Lynda L. Ziegler
Peter T. Dietrich
Stuart R. Hemphill
Linda G. Sullivan
Russell C. Swartz
Chris C. Dominski
Company PositionPresident, SCEChairman of the Board, President and Chief Executive Officer, EMG1
Senior Vice President, Transmission and Distribution, SCEExecutive Vice President, External Relations, SCEExecutive Vice President, External Relations and GeneralCounsel, SCESenior Vice President and General Counsel, SCEExecutive Vice President, Power Delivery Services, SCESenior Vice President, Customer Service, SCESenior Vice President and Chief Nuclear Officer, SCESenior Vice President, SCESite Vice President, Entergy Nuclear Operations, Inc., James A. Fitzpatrick Nuclear Plant2
Senior Vice President, Power SupplySenior Vice President, Power Procurement, SCEVice President, Renewable and Alternative Power, SCEDirector of Renewable and Alternative Power, SCESenior Vice President and Chief Financial Officer, SCESenior Vice President, Chief Financial Officer and ActingController, SCEVice President and Controller, Edison InternationalVice President and Controller, SCESenior Vice President and General Counsel, SCEVice President and Associate General Counsel, SCEAssociate General Counsel, SCEAssistant General Counsel, SCEVice President, and Controller, SCEAssistant Controller, Edison InternationalAssistant Controller, SCEManager, Financial Planning and Analysis, SCE
Effective DatesJanuary 2011 to present
April 2008 to December 2010May 2005 to March 2008February 2011 to present
January 2011 to February 2011January 2002 to December 2010January 2011 to presentMarch 2006 to December 2010December 2010 to presentNovember 2010 to present
April 2006 to November 2010January 2011 to presentJuly 2009 to December 2010March 2008 to June 2009April 2006 to March 2008March 2010 to present
July 2009 to March 2010June 2005 to August 2009June 2005 to June 2009February 2011 to presentFebruary 2010 to February 2011March 2007 to February 2010February 2002 to February 2007March 2010 to presentMarch 2007 to April 2010March 2007 to March 2010July 2006 to March 2007
1 EMG is the holding company of Edison Mission Energy, an independent power producer. EMG is a wholly-owned subsidiary of Edison International and is an affiliate of SCE.
2 Entergy Nuclear Operations, Inc. is a subsidiary of Entergy Corporation, an integrated energy company and is not a parent, affiliate or subsidiary of SCE.
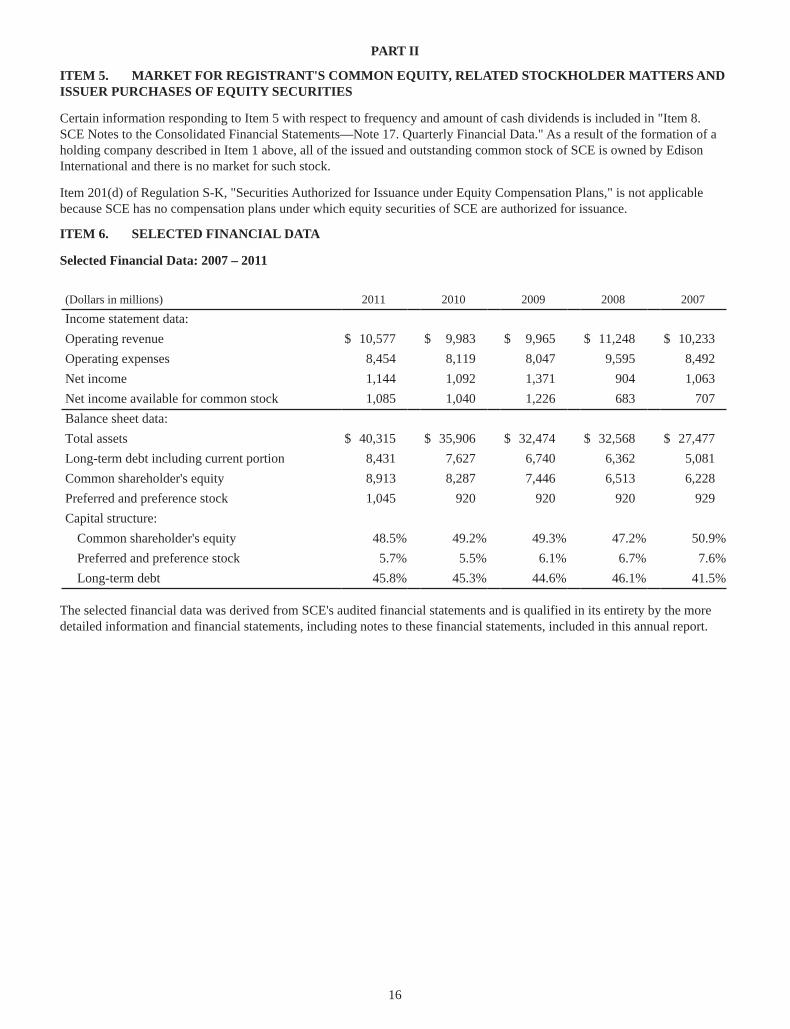
16
PART II
ITEM 5. MARKET FOR REGISTRANT'S COMMON EQUITY, RELATED STOCKHOLDER MATTERS AND ISSUER PURCHASES OF EQUITY SECURITIES
Certain information responding to Item 5 with respect to frequency and amount of cash dividends is included in "Item 8. SCE Notes to the Consolidated Financial Statements—Note 17. Quarterly Financial Data." As a result of the formation of a holding company described in Item 1 above, all of the issued and outstanding common stock of SCE is owned by Edison International and there is no market for such stock.
Item 201(d) of Regulation S-K, "Securities Authorized for Issuance under Equity Compensation Plans," is not applicable because SCE has no compensation plans under which equity securities of SCE are authorized for issuance.
ITEM 6. SELECTED FINANCIAL DATA
Selected Financial Data: 2007 – 2011
(Dollars in millions)
Income statement data:Operating revenueOperating expensesNet incomeNet income available for common stockBalance sheet data:Total assetsLong-term debt including current portionCommon shareholder's equityPreferred and preference stockCapital structure:
Common shareholder's equityPreferred and preference stockLong-term debt
2011
$ 10,577
8,4541,1441,085
$ 40,3158,4318,9131,045
48.5%5.7%
45.8%
2010
$ 9,983
8,1191,0921,040
$ 35,906
7,6278,287
920
49.2%5.5%
45.3%
2009
$ 9,965
8,0471,3711,226
$ 32,474
6,7407,446
920
49.3%6.1%
44.6%
2008
$ 11,248
9,595904683
$ 32,568
6,3626,513
920
47.2%6.7%
46.1%
2007
$ 10,233
8,4921,063
707 $ 27,477
5,0816,228
929
50.9%7.6%
41.5%
The selected financial data was derived from SCE's audited financial statements and is qualified in its entirety by the more detailed information and financial statements, including notes to these financial statements, included in this annual report.

17
ITEM 7. MANAGEMENT'S DISCUSSION AND ANALYSIS OF FINANCIAL CONDITION AND RESULTS OF OPERATIONS
MANAGEMENT OVERVIEW
SCE's core mission is to deliver safe, reliable and affordable electric service to its customers. Accomplishing this mission requires balancing competing priorities, including public policies regarding air and water quality, energy efficiency and renewable energy and the need to replace aging infrastructure. The accumulation of several major policy mandates is expected to add significantly to the cost of electric service, which could cause a growing number of customers to seek to self-generate their power. Choices by customers to self-generate results in fewer kilowatt hour sales to absorb the increasing costs of the electrical system, further increasing rates for SCE's other customers. Working with policy makers to balance competing priorities, a key focus of SCE is to manage the costs that drive increases in electricity rates while delivering safe and reliable electric service to its customers.
Highlights of Operating Results
(in millions)
Net income available for common stockLess: Non-core itemsGlobal SettlementTax impact of health care legislationRegulatory itemsTotal non-core itemsCore Earnings
2011
$ 1,085
————
$ 1,085
2010
$ 1,040
95(39)—56
$ 984
Change
$ 45
(95)39—
(56)$ 101
2009
$ 1,226
306—46
352$ 874
SCE's earnings are prepared in accordance with generally accepted accounting principles used in the United States. Management uses core earnings for financial planning and for analysis of performance. Core earnings are also used when communicating with analysts and investors regarding SCE's earnings results to facilitate comparisons of the performance from period to period. Core earnings are a non-GAAP financial measure and may not be comparable to those of other companies. Core earnings are defined as earnings attributable to SCE less income or loss from significant discrete items that management does not consider representative of ongoing earnings, such as: settlement of certain tax, regulatory or legal matters or proceedings.
SCE's 2011 core earnings increased primarily due to rate base growth.
Non-core items included:
• An earnings benefit of $95 million recorded in 2010 relating to the California impact of the federal Global Settlement resulting from acceptance by the California Franchise Tax Board of tax positions finalized with the IRS in 2009 and receipt of the final interest determination from the Franchise Tax Board. For further discussion of the Global Settlement, see "Item 8. SCE Notes to Consolidated Financial Statements—Note 7. Income Taxes."
• An after-tax earnings charge of $39 million recorded in 2010 to reverse previously recognized federal tax benefits eliminated by federal health care legislation enacted in 2010. The health care law eliminated the federal tax deduction for retiree health care costs to the extent those costs are eligible for federal Medicare Part D subsidies.
See "Results of Operations" for discussion of SCE results of operations, including a comparison of 2010 results to 2009.
2012 CPUC General Rate Case
SCE filed its 2012 GRC application in November 2010. In October 2011, SCE submitted updated testimony to reflect changes in escalation rates, known changes due to governmental actions and changes in the timing of recovery for nuclear refueling outages at San Onofre, which taken together changed its requested 2012 base rate revenue requirement to $6.3 billion. SCE's updated request, after considering the effects of sales growth and including the impacts of reducing SCE's solar program as approved by the CPUC, would result in incremental customer base rate increases of $809 million, $117 million and $513 million in 2012, 2013 and 2014, respectively.
The Division of Ratepayer Advocates ("DRA") recommended that SCE's requested 2012 base rate revenue requirement be decreased by approximately $850 million, comprised of approximately $630 million in operation and maintenance expense

18
reductions and approximately $220 million in capital-related revenue requirement reductions. The Utility Reform Network ("TURN") and other intervenors recommended an additional $610 million revenue requirement reduction, beyond the DRA adjustments, primarily capital-related in nature, as well as disallowances of recorded capital investments for specific projects. Intervenors have also recommended changes to SCE's proposed post-test year ratemaking methodology to be used for 2013 and 2014 as well as limiting the recovery amount of SCE's pension costs. A final decision on the GRC is expected in the first half of 2012. The CPUC has authorized the establishment of a GRC memorandum account, which will make the 2012 revenue requirement ultimately adopted by the CPUC effective as of January 1, 2012. Recognition of the revenue for the period January 1, 2012 through the date of a final decision, as well as any delays in certain expenditures, may impact the timing of earnings in 2012.
FERC Formula Rates
The FERC has accepted, subject to refund and settlement procedures, SCE's request to implement formula rates as a means to determine SCE's FERC transmission revenue requirement effective January 1, 2012. The formula rates include revenue requirements related to construction work in progress ("CWIP") that was previously recovered through a separate mechanism. SCE estimates its total 2012 FERC weighted average ROE will be 11.1%, including the previously authorized 50 basis point incentive for CAISO participation and individual authorized project incentives. The actual weighted average ROE and rate base is dependent upon the amount and timing of capital expenditures among FERC incentive and non-incentive projects. SCE's request proposed the adoption of a specific formula to calculate a forecasted annual revenue requirement that is used to establish rates and is trued-up annually to allow SCE to recover its actual revenue requirement, including its actual cost of service, actual rate base and the authorized return on investment. SCE's request also allows SCE to make single-issue rate filings requesting changes to certain elements of the formula, including the base ROE, depreciation rates and the retail rate structure. SCE and the other parties to the proceeding are currently in settlement negotiations.
Capital Program
During 2011, SCE continued execution of its capital investment program. Total capital expenditures (including accruals) were $3.9 billion in 2011 compared to $3.8 billion in 2010. The level of future spending is significantly dependent on a final outcome of SCE's 2012 GRC decision and the timing, scope and approvals of major transmission projects. SCE's capital program for 2012 – 2014 is focused primarily in the following areas:
• Maintaining reliability and expanding the capability of SCE's transmission and distribution system.
• Upgrading and constructing new transmission lines and substations for system reliability and increased access to renewable energy, including the Tehachapi, Devers-Colorado River, Eldorado-Ivanpah, and Red Bluff projects.
• Completing installation of digital meters in households and small businesses, referred to as EdisonSmartConnectTM. Through 2011, SCE installed 3.8 million meters and plans to install the remaining 1.2 million meters during 2012.
• Generation capital projects for nuclear and hydro-electric plants.
SCE forecasts capital expenditures in the range of $11.8 billion to $13.2 billion for 2012 – 2014. Actual capital spending will be affected by: changes in regulatory, environmental and engineering design requirements; permitting and project delays; cost and availability of labor, equipment and materials; and other factors as discussed further under "Liquidity and Capital Resources—Capital Investment Plan." SCE has experienced significant cost pressures on its Tehachapi and Devers-Colorado River Transmission Projects, primarily related to environmental monitoring and mitigation costs, scope changes and schedule delays. Currently, SCE is completing the final engineering design for these projects and expects to file revised cost estimates with the CPUC later this year. Subject to further permitting and schedule delays, SCE has revised its direct capital expenditure estimates for the Tehachapi Project to $2.5 billion from $2.1 billion and revised its estimates for the Devers-Colorado River Project to $860 million from $649 million. The Tehachapi Project may be further impacted by issues related to aviation marking and lighting and community opposition to portions of the line, as further discussed in "Liquidity and Capital Resources—Capital Investment Plan." Capital program cost increases have been partially offset by expenditures for other transmission reliability projects, which were deferred due to delays from once-through cooling requirements for coastal generating plants. SCE plans to utilize cash generated from its operations, tax benefits and issuance of additional debt and preferred equity to fund its capital needs.
Environmental Developments
For a discussion of environmental developments, see "Item 8. SCE Notes to Consolidated Financial Statements—Note 10. Environmental Developments."

19
RESULTS OF OPERATIONS
SCE's results of operations are derived mainly through two sources:
• Utility earning activities – representing revenue authorized by the CPUC and FERC which is intended to provide SCE a reasonable opportunity to recover its costs and earn a return on its net investment in generation, transmission and distribution assets. The annual revenue requirements are comprised of forecasted operation and maintenance costs, depreciation, taxes and a return consistent with the capital structure. Also, included in utility earnings activities are revenues or penalties related to incentive mechanisms, other operating revenue, and regulatory charges or disallowances, if any.
• Utility cost-recovery activities – representing CPUC- and FERC-authorized balancing accounts which allow for recovery of specific project or program costs incurred or provide for mechanisms to track and recover or refund differences in forecasted and actual amounts, subject to reasonableness review or compliance with upfront standards.
The following table is a summary of SCE's results of operations for the periods indicated. The presentation below separately identifies utility earning activities and utility cost-recovery activities.
(in millions)
Operating revenueFuel and purchased powerOperations and maintenanceDepreciationdecommissioning andamortizationProperty taxes and otherGain on sale of assetsTotal operating expensesOperating incomeNet interest expense and otherIncome before income taxesIncome tax expenseNet incomeNet income attributable tononcontrolling interestDividends on preferred andpreference stockNet income available forcommon stockCore Earnings3
Non-Core Earnings:Global tax settlement
Tax impact of health carelegislationRegulatory items
Total SCE GAAP Earnings
2011
UtilityEarning
Activities
$ 5,902—
2,208
1,294277—
3,7792,123(378)
1,745601
1,144
—
59
$ 1,085
UtilityCost-
RecoveryActivities
$ 4,6753,3561,179
1328
—4,675
—————
—
—
$ —
TotalConsolidated
$ 10,5773,3563,387
1,426285—
8,4542,123(378)
1,745601
1,144
—
59
$ 1,085$ 1,085
—
——
$ 1,085
2010
UtilityEarning
Activities
$ 5,606—
2,271
1,213260—
3,7441,862(330)
1,532440
1,092
—
52
$ 1,040
UtilityCost-
RecoveryActivities
$ 4,3773,2931,020
603
(1)4,375
2(2)———
—
—
$ —
TotalConsolidated
$ 9,9833,2933,291
1,273263
(1)8,1191,864(332)
1,532440
1,092
—
52
$ 1,040$ 984
95
(39)—
$ 1,040
2009
UtilityEarning
Activities
$ 5,303—
2,111
1,124244—
3,4791,824(298)
1,526249
1,277
—
51
$ 1,226
UtilityCost-
RecoveryActivities1,2
$ 4,6623,4721,043
54—(1)
4,56894—94—94
94
—
$ —
TotalConsolidated
$ 9,9653,4723,154
1,178244
(1)8,0471,918(298)
1,620249
1,371
94
51
$ 1,226$ 874
306
—46
$ 1,226
1 Effective January 1, 2010, SCE deconsolidated the Big 4 projects and therefore these projects are reflected in 2009 activities only (see "Item 8. SCE Notes to Consolidated Financial Statements—Note 3. Variable Interest Entities" for further discussion).
2 Effective July 1, 2009, SCE transferred Mountainview Power Company, LLC to SCE. As a result of the transfer and for comparability purposes, Mountainview's 2009 activity was reclassified from cost-recovery activities to utility earning activities consistent with the revised recovery mechanism.
3 See use of Non-GAAP financial measures in "Management Overview—Highlights of Operating Results."
20
Utility Earning Activities
2011 vs. 2010
Utility earning activities were primarily affected by the following:
• Higher operating revenue of $296 million primarily due to the following:
• $135 million increase primarily due to a $215 million (4.35%) increase in 2011 authorized revenue approved in the 2009 CPUC GRC decision. The 2011 increase was partially offset by reductions of $80 million mainly resulting from revenue recognized in 2010 associated with the recovery of San Onofre Unit 3 scheduled outage costs with no comparable amount in 2011.
• $95 million increase in FERC-related revenue primarily resulting from the inclusion of capital expenditures related to the Tehachapi Transmission Project in rate base.
• $25 million increase in capital-related revenue requirements related to the San Onofre steam generator replacement project and a $20 million increase for the EdisonSmartConnectTM project.
• $20 million increase related to recovery of legal costs incurred between 2004 and 2009 in support of SCE's efforts to obtain generator refunds related to claims arising out of the energy crisis in California in 2000 – 2001.
• Lower operation and maintenance expense of $63 million primarily due to costs incurred in 2010 related to the San Onofre Unit 3 scheduled outage.
• Higher depreciation, decommissioning and amortization expense of $81 million primarily related to increased transmission and distribution investments.
• Higher net interest expense and other of $48 million primarily due to higher outstanding balances on long-term debt. For details of other income and expenses, see "Item 8. SCE Notes to Consolidated Financial Statements—Note 16. Other Income and Expenses."
• Higher income taxes primarily due to an increase in income as well as benefits recorded in 2010 related to the Global Settlement. See "—Income Taxes" below for more information.
2010 vs. 2009
Utility earning activities were primarily affected by the following:
• Higher operating revenue of $303 million primarily due to the following:
• $190 million increase primarily due to a 4.25% increase in 2010 authorized revenue approved in the 2009 CPUC GRC decision.
• $55 million increase in FERC-related revenue, primarily due to the implementation of SCE's 2010 and 2009 FERC rate cases effective March 1, 2010 and March 1, 2009, respectively.
• $25 million increase in capital-related revenue requirements related to the San Onofre steam generator replacement project and a $20 million increase for the EdisonSmartConnect™ project.
• Higher operation and maintenance expense of $160 million primarily due to the following:
• $75 million of higher expenses to support company growth programs, including new information technology system requirements and facility maintenance.
• $45 million of higher transmission and distribution expenses to support system reliability and infrastructure replacement, right of way costs; preventive maintenance work, technical training and line clearing.
• $15 million of higher generation expenses primarily from a $25 million increase from the San Onofre Unit 2 and 3 scheduled outages, including $10 million of additional work identified during the Unit 2 scheduled outage, and a $10 million increase primarily due to overhaul and outage costs at Four Corners. These increases were partially offset by a $20 million decrease resulting from 2009 scheduled outages at the Mountainview power plant.
• $15 million of higher expense related to general liability and property insurance due to higher premiums for wildfire coverage.

21
• Higher depreciation expense of $89 million primarily related to increased capital expenditures, including capitalized software costs.
• Higher net interest expense and other of $32 million primarily due to:
• Lower other income of $19 million primarily related to a decrease in AFUDC – equity earnings due to the transfer of the Mountainview power plant to utility rate base in the third quarter of 2009 partially offset by an increase in AFUDC – equity resulting from a higher capitalization rate and level of construction in progress associated with SCE's capital expenditure plan.
• Higher interest expense of $7 million primarily due to higher outstanding balances on long-term debt.
See "—Income Taxes" below for discussion of higher income taxes during 2010 compared to the same period in 2009.
Utility Cost-Recovery Activities
2011 vs. 2010
Utility cost-recovery activities were primarily affected by the following:
• Higher purchased power expense of $59 million primarily driven by the cost to replace CDWR contracts that expired in 2011, which were not previously recorded as an SCE cost but impacted customer bills (see "—Supplemental Operating Revenue Information" below), and higher costs associated with renewable contracts. The increase was partially offset by increased purchased power in 2010 during the outages at San Onofre and Four Corners.
• Higher operation and maintenance expense of $159 million including $75 million of increased energy efficiency program costs and $40 million related to the EdisonSmartConnectTM project.
• Higher depreciation, decommissioning and amortization expense of $72 million including $35 million related to the EdisonSmartConnectTM project and $25 million related to the San Onofre steam generator replacement project.
2010 vs. 2009
Utility cost-recovery activities exclude the impact of the consolidation of the Big 4 projects in 2009 for comparability purposes. The following amounts were excluded for 2009: $370 million for purchased power expense to reflect the elimination of sales between the VIEs and SCE; $368 million for fuel expense; and $94 million for operation and maintenance expense. Utility cost-recovery activities were primarily affected by:
• Lower purchased power expense of $191 million primarily related to lower realized losses on economic hedging activities ($156 million in 2010 compared to $344 million in 2009) reflecting the impact of higher natural gas prices in 2010 and changes in SCE's hedge portfolio mix.
• Higher operation and maintenance expense of $71 million primarily due to an increase in spending for various public purpose programs.
Supplemental Operating Revenue Information
SCE's retail billed and unbilled revenue (excluding wholesale sales and balancing account over/undercollections) was $10.0 billion for both 2011 and 2010 and $9.5 billion for 2009. The 2011 revenue reflects:
• a rate decrease of $408 million resulting from a rate adjustment beginning on June 1, 2011, primarily reflecting the refund of over collected fuel and power procurement-related costs, offset by
• a sales volume increase of $393 million primarily due to SCE providing power that was previously provided by CDWR contracts which expired in 2011.
The 2010 revenue reflects:
• a rate increase of $777 million mainly due to the implementation of the CPUC 2009 GRC decision and approved FERC transmission rate changes, partially offset by
• a sales volume decrease of $255 million primarily due to milder weather experienced during 2010 compared to the same period in 2009 and continuing recessionary effects.
As a result of the CPUC-authorized decoupling mechanism, SCE earnings are not affected by changes in retail electricity

22
sales (see "Item 1. Business—Overview of Ratemaking Process").
SCE remits to CDWR and does not recognize as revenue the amounts that SCE bills and collects from its customers for electric power purchased and sold by the CDWR to SCE's customers, as well as CDWR bond-related costs and a portion of direct access exit fees. The amounts collected and remitted to CDWR were $1.1 billion, $1.2 billion and $1.8 billion for years ended December 31, 2011, 2010 and 2009, respectively. All CDWR power contracts allocated to SCE by the CPUC had expired by the end of 2011. SCE's revenue and related purchased power expense is expected to increase in 2012 as these CDWR contracts are replaced by new power purchase agreements entered into by SCE.
Effective January 1, 2010, the CDWR-related rates were decreased to reflect lower power procurement expenses and a refund of operating reserves that CDWR releases as its contracts terminate. Approximately $440 million is expected to be refunded to SCE customers through lower CDWR rates in 2012.
Income Taxes
The table below provides an analysis of the principal factors impacting SCE's effective tax rate.
(in millions)
Income from continuing operations before income taxesNet income attributable to noncontrolling interests in the Big 4 projectsAdjusted income from continuing operations before income taxesProvision for income tax at federal statutory rate of 35%Increase (decrease) in income tax from:
Items presented with related state income tax, netGlobal settlement related1
Change in tax accounting method for asset removal costs2
State tax – net of federal benefitHealth care legislation3
Property-relatedOther
Total income tax expense from continuing operationsEffective tax rate
Years ended December 31,
2011
$ 1,745—
$ 1,745$ 611
——80—
(76)(14)
$ 60134.4%
2010
$ 1,532—
$ 1,532$ 536
(95)(40)5939
(47)(12)
$ 44028.7%
2009
$ 1,620(94)
$ 1,526$ 534
(306)—67—
(64)18
$ 24916.3%
1 Edison International and the IRS finalized the terms of a Global Settlement on May 5, 2009. The Global Settlement resolved all of SCE's federal income tax disputes and affirmative claims through tax year 2002. During 2009, SCE recorded after-tax earnings of approximately $306 million. During 2010, SCE recognized a $95 million earnings benefit from the acceptance by the California Franchise Tax Board of the tax positions finalized in 2009 and receipt of the final interest determination from the Franchise Tax Board.
2 During 2010, the IRS approved SCE's request to change its tax accounting method for asset removal costs primarily related to its infrastructure replacement program. As a result, SCE recognized a $40 million earnings benefit (of which $28 million relates to asset removal costs incurred prior to 2010) from deducting asset removal costs earlier in the construction cycle. These deductions were recorded on a flow-through basis as required by the CPUC.
3 During 2010, SCE recorded a $39 million non-cash charge to reverse previously recognized federal tax benefits eliminated by the federal health care legislation enacted in March 2010. The health care law eliminated the federal tax deduction for retiree health care costs to the extent those costs are eligible for federal Medicare Part D subsidies.
The increase in income taxes for property-related items was primarily due to a cumulative deferred income tax adjustment of $30 million in 2011 related to nuclear fuel.
For a discussion of the status of Edison International's income tax audits, see "SCE Notes to Consolidated Financial Statements—Note 7. Income Taxes."

23
LIQUIDITY AND CAPITAL RESOURCES
SCE's ability to operate its business, fund capital expenditures, and implement its business strategy are dependent upon its cash flow and access to the capital markets. SCE's overall cash flows fluctuate based on, among other things, its ability to recover its costs in a timely manner from its customers through regulated rates, changes in commodity prices and volumes, collateral requirements, interest and dividend payments to investors, and the outcome of tax and regulatory matters.
SCE expects to fund its 2012 obligations, capital expenditures and dividends through operating cash flows, tax benefits (including bonus depreciation) and capital market financings of debt and preferred equity, as needed. SCE also has availability under its credit facilities to meet operating and capital requirements.
In January and February 2012, SCE issued 250,000 shares and 100,000 shares, respectively, of 6.25% Series E preference stock (cumulative, $1,000 liquidation value). The Series E preference stock may not be redeemed prior to February 1, 2022. The proceeds from the sale of these shares were used to repay commercial paper borrowings issued to fund SCE's capital program.
Available Liquidity
SCE has two credit facilities: a $2.4 billion five-year credit facility that matures in February 2013 and a $500 million three-year credit facility that matures in March 2013.
(in millions)
CommitmentOutstanding borrowings supported by credit facilitiesOutstanding letters of creditAmount available
Credit Facilities
$ 2,894(419)(81)
$ 2,394
Debt Covenant
SCE has a debt covenant in its credit facilities that limits its debt to total capitalization ratio to less than or equal to 0.65 to 1. At December 31, 2011, SCE's debt to total capitalization ratio was 0.48 to 1.
Capital Investment Plan
SCE's forecasted capital expenditures for 2012 – 2014 include a capital forecast in the range of $11.8 billion to $13.2 billion based on the average variability experienced in 2011, 2010 and 2009 of 11% between annual forecast capital expenditures and actual spending. This capital forecast includes certain projects under CPUC jurisdiction that are subject to the outcome of the 2012 CPUC GRC. The completion of projects, the timing of expenditures, and the associated cost recovery may be affected by permitting requirements and delays, construction schedules, availability of labor, equipment and materials, financing, legal and regulatory approvals and developments, weather and other unforeseen conditions.
SCE's 2011 capital expenditures and the 2012 – 2014 capital expenditures forecast are set forth in the table below:
(in millions)TransmissionDistributionGenerationEdisonSmartConnect™Total Estimated Capital Expenditures1
Total Estimated Capital Expenditures for 2012 – 2014 (using11% variability discussed above)
2011Actual
$ 9291,847
729372
$ 3,877
2012$ 1,547
2,304743373
$ 4,967
$ 4,421
2013$ 1,452
2,355642—
$ 4,449
$ 3,960
2014$ 850
2,416520—
$ 3,786
$ 3,369
Total$ 3,849
7,0751,905
373$ 13,202
$ 11,750
1 Included in SCE's capital expenditures plan are projected environmental capital expenditures of $499 million, $534 million and $576 million in 2012, 2013 and 2014, respectively. The projected environmental capital expenditures are to comply with laws, regulations, and other nondiscretionary requirements.

24
Transmission Projects
SCE has experienced cost increases on its Tehachapi and Devers-Colorado River Transmission Projects, primarily related to environmental monitoring and mitigation costs, scope changes and schedule delays. A summary of SCE's major transmission and substation projects during the next three years is presented below:
Project Name
Tehachapi 1-11Devers-Colorado River
Eldorado-IvanpahRed Bluff
DescriptionTransmission lines andsubstationTransmission lineSubstation and upgradedtransmission lineSubstation
Project LifecyclePhase
In constructionIn constructionEngineering/ConstructionIn construction
In ServiceDate
2009 – 20152013
20132013
Direct Expenditures1
(in millions)
$ 2,500860
444234
% of SpendComplete
62%18%
6%6%
2012 – 2014Forecast
(in millions)
$ 904709
417220
1 Direct expenditures include direct labor, land and contract costs incurred for the respective projects and exclude overhead costs that are included in the capital expenditures forecasted for 2012 – 2014.
Currently, SCE is completing the final engineering design for the Tehachapi Transmission and the Devers-Colorado River Projects and has increased its 2012 – 2014 forecasted expenditures for these projects as a result of cost pressures discussed above. The Tehachapi Project costs and schedule may be further impacted by the CPUC's response to SCE's petition to modify the 2009 decision approving the project for the purpose of obtaining authorization to install aviation marking and lighting in accordance with FAA standards. In October 2011, the CPUC staff notified SCE that the constructed portions of the project should be marked and lighted as required, but instructed SCE to defer completion of remaining project components that may require aviation marking or lighting pending CPUC review of the petition to modify. Community opposition to portions of the project continues and requests for reconsideration of the CPUC's 2009 decision are pending. In January 2012, in response to a CPUC request, SCE provided information on potential new options for a portion of the project, including traversing a state park, changing the nature of some of the towers, and undergrounding lines. Adoption of any of these alternatives could create additional costs and delay the completion of the project. SCE is required to file revised cost estimates with the CPUC. As with all transmission investments, cost recovery will be subject to future rate proceedings.
Distribution Projects
Distribution expenditures include projects and programs to meet customer load growth requirements, reliability and infrastructure replacement needs, information and other technology and related facility requirements.
Generation Projects
Generation expenditures include:
• Nuclear-related capital expenditures necessary to maintain safe and reliable plant operation, meet NRC and other regulatory requirements, and optimize plant performance and cost-effectiveness.
• Hydro-related capital expenditures associated with infrastructure and equipment replacement and renewal of FERC operating licenses. Infrastructure expenditures include dam improvements, flowline and substation refurbishments, and powerline replacements. Equipment replacement expenditures include transformers, automation, switchgear, hydro turbine repowers, generator rewinds, and small generator replacements.
• SCE's Solar Photovoltaic Program to develop up to 125 MW of utility owned Solar Photovoltaic generating facilities generally ranging in size from 1 to 2 MW each, on commercial and industrial rooftops and other space in SCE's service territory. The CPUC has authorized recovery of reasonable costs and allowed for a return on investment.
EdisonSmartConnect™
SCE's EdisonSmartConnect™ project involves installing state-of-the-art "smart" meters in approximately 5 million households and small businesses through its service area. In March 2008, SCE was authorized by the CPUC to recover $1.63 billion in customer rates for the deployment phase of EdisonSmartConnect™. In 2009, SCE began full deployment of meters to all residential and small business customers under 200 kW. SCE anticipates completion of the deployment in 2012. In 2011, the CPUC began exploring the feasibility of allowing customers to voluntarily opt out of smart meter installation.

25
SCE has provided information to the CPUC on the costs and technical issues involved. Should the CPUC order SCE to implement an opt out option, SCE would file an application seeking to recover the associated costs in rates.
Regulatory Proceedings
Energy Efficiency Shareholder Risk/Reward Incentive Mechanism
The CPUC previously adopted and extended through 2009 an Energy Efficiency Risk/Reward Incentive Mechanism ("Energy Efficiency Mechanism") allowing SCE to earn incentives based on SCE's performance toward meeting CPUC energy efficiency goals. In December 2011, the CPUC issued a decision approving an $18 million final payment for 2009 performance under the Energy Efficiency Mechanism. The CPUC is reviewing and may further modify or eliminate the Energy Efficiency Mechanism for performance periods subsequent to 2009.
San Onofre Outage and Repair Issues
Four replacement steam generators were installed at San Onofre Units 2 and 3 in 2010 and 2011. Inspections of the Unit 2 steam generators during a planned maintenance and refueling outage in February 2012 found some isolated areas of wear in some of the 19,454 heat transfer tubes. In light of this condition, SCE, in consultation with the steam generators' manufacturer, determined that a number of the tubes should be removed from service as a preventive measure. The steam generators are designed to include sufficient tubes to accommodate a need to remove some from service for a variety of reasons, including wear, and the tubes that SCE is in the process of preventively removing from service in Unit 2 are well within the extra margin. Additionally, on January 31, 2012, a water leak was detected in one of the tubes of a new steam generator in Unit 3, and the Unit was safely taken offline. Extensive testing of the Unit 3 steam generators is ongoing to fully understand the cause of the leak. In a memorandum dated February 16, 2012, the NRC determined that inasmuch as the leak was in a newly installed steam generator, it will conduct an event follow-up baseline inspection to review San Onofre's response to the leak and verify the appropriateness of its remedial actions. Each Unit will be restarted when repairs on that Unit are completed, and SCE is satisfied that it is safe to do so.
The steam generators were supplied by Mitsubishi Heavy Industries (“MHI”) and are warranted for an initial period of 20 years from acceptance. Subject to certain exceptions, the purchase agreement sets forth specified damages for certain repairs, generally limits MHI's aggregate contractual liability to the approximately $137 million purchase price of the generators and excludes consequential damages from recovery, such as the cost of replacement power. In 2005, the CPUC authorized expenditures of approximately $525 million ($665 million when adjusted for inflation) for SCE's 78.21% share of San Onofre to purchase and install new generators and remove their predecessors. Those expenditures remain subject to CPUC review upon submission of SCE's final costs for the overall project. SCE expects to file an application with the CPUC setting forth final project costs in the third or fourth quarter of 2012. Replacement power costs are recovered through the ERRA balancing account, subject to reasonableness review.
Dividend Restrictions
The CPUC regulates SCE's capital structure which limits the dividends it may pay Edison International. In SCE's most recent cost of capital proceeding, the CPUC set an authorized capital structure for SCE which included a common equity component of 48%. SCE may make distributions to Edison International as long as the common equity component of SCE's capital structure remains at or above the 48% authorized level on a 13-month weighted average basis. At December 31, 2011, SCE's 13-month weighted-average common equity component of total capitalization was 50.4% resulting in the capacity to pay $436 million in additional dividends.
During 2011, SCE made $461 million in dividend payments to its parent, Edison International. Future dividend amounts and timing of distributions are dependent upon several factors including the level of capital expenditures, operating cash flows and earnings.
Margin and Collateral Deposits
Certain derivative instruments, power procurement contracts and other contractual arrangements contain collateral requirements. Future collateral requirements may differ from the requirements at December 31, 2011, due to the addition of incremental power and energy procurement contracts with collateral requirements, if any, and the impact of changes in wholesale power and natural gas prices on SCE's contractual obligations.
Some of the power procurement contracts contain provisions that require SCE to maintain an investment grade credit rating from the major credit rating agencies. If SCE's credit rating were to fall below investment grade, SCE may be required to pay the liability or post additional collateral.

26
The table below provides the amount of collateral posted by SCE to its counterparties as well as the potential collateral that would be required as of December 31, 2011.
(in millions)
Collateral posted as of December 31, 20111
Incremental collateral requirements for power procurement contracts resulting from apotential downgrade of SCE's credit rating to below investment grade
Posted and potential collateral requirements2
$ 149
89$ 238
1 Collateral provided to counterparties and other brokers consisted of $51 million of cash which was offset against net derivative liabilities on the consolidated balance sheets, $17 million of cash reflected in "Other current assets" on the consolidated balance sheets and $81 million in letters of credit.
2 There would be no increase to SCE's total posted and potential collateral requirements based on SCE's forward positions as of December 31, 2011 due to adverse market price movements over the remaining lives of the existing power procurement contracts using a 95% confidence level.
Workers Compensation Self-Insurance Fund
SCE is self-insured for workers compensation claims. SCE assesses workers compensation claims that have been asserted and those that have been incurred but not reported to determine the probable amount of losses that should be recorded. The Department of Industrial Relations for the State of California requires companies that are self-insured for workers compensation to post collateral (in the form of cash and/or letters of credits) based on the estimated workers' compensation liability if a company's bond rating were to fall below "B." As of December 31, 2011, if SCE's bond rating were to fall below a "B" rating, SCE would be required to post $208 million for its workers compensation self-insurance plan.
Regulatory Balancing Accounts
SCE's cash flows are affected by regulatory balancing account over- or under-collections. Over- and under-collections represent differences between cash collected in current rates for specified forecasted costs and the costs actually incurred. With some exceptions, SCE seeks to adjust rates on an annual basis or at other designated times to recover or refund the balances recorded in its balancing account. Under- or over-collections in these balancing accounts impact cash flows and can change rapidly. Over- and under-collections accrue interest based on a three-month commercial paper rate published by the Federal Reserve.
As of December 31, 2011, balancing account net over-collections were $1.2 billion primarily related to public purpose-related program costs as well as fuel and power procurement-related costs. Over-collections for public purpose-related programs are expected to decrease as costs are incurred to fund programs established by the CPUC. The fuel and power procurement-related over-collections of $392 million are expected to be refunded through a rate adjustment in 2012.
Historical Consolidated Cash Flows
The table below sets forth condensed historical cash flow information for SCE.
(in millions)
Net cash provided by operating activitiesNet cash provided (used) by financing activitiesNet cash used by investing activitiesNet decrease in cash and cash equivalents
2011
$ 3,261799
(4,260)$ (200)
2010
$ 3,386503
(4,094)$ (205)
2009
$ 4,069(1,999)(3,219)
$ (1,149)
Net Cash Provided by Operating Activities
Net cash provided by operating activities decreased $125 million in 2011 compared to 2010. The decrease in cash flows provided by operating activities was primarily due to the following:
• $310 million decrease from refunding to customers overcollections of revenue which resulted from actual electricity sales exceeding forecasted electricity sales. SCE began refunding this balance through a rate adjustment effective June 1, 2011;
• $250 million decrease resulting from higher balancing account overcollections for fuel and power procurement-related

27
costs in 2010 when compared to 2011 (overcollections of approximately $300 million in 2010 compared to approximately $50 million in 2011). The 2010 overcollection was primarily due to lower realized gas and power prices compared to the amounts forecasted for setting customer rates. SCE began refunding the overcollection through a rate adjustment beginning on June 1, 2011. The balancing account was over-collected by $392 million at December 31, 2011, $345 million at December 31, 2010, $46 million at December 31, 2009 and under-collected by $406 million at December 31, 2008; and
• $365 million increase resulting from higher income before depreciation and income taxes primarily driven by higher customer revenue.
Net cash provided by operating activities decreased $683 million in 2010, compared to 2009. The cash flows provided by operating activities were primarily due to the following:
• $531 million decrease in cash reflecting lower net tax receipts in 2010 compared to 2009 primarily related to the impacts of the Global Settlement. In 2009, SCE received tax-allocation payments of $875 million from the Global Settlement, compared to tax-allocation payments received of $26 million in 2010. This decrease was partially offset by higher estimated tax payments in 2009 compared to 2010.
• $155 million net cash inflow from balancing accounts composed of:
• $310 million net cash inflow from the funding of public purpose and solar initiative programs and lower pension and PBOP contributions in 2010 compared to 2009; and
• $155 million net cash outflow due to the decrease in balancing account cash flows for fuel and power procurement-related costs (collections of approximately $300 million in 2010, compared to collections of approximately $450 million in 2009).
• Timing of cash receipts and disbursements related to working capital items, including a net cash outflow of $95 million related to the timing of fuel and power procurement-related activities primarily related to ISO charges and a $60 million decrease in margin and collateral deposits – net of collateral received.
Net Cash Provided (Used) by Financing Activities
Cash provided (used) by financing activities mainly consisted of net repayments of short-term debt and long-term debt issuances (payments).
Net cash provided by financing activities for 2011 was $799 million consisting of the following significant events:
• Issued $500 million of 3.875% first and refunding mortgage bonds due in 2021. The proceeds from these bonds were used to repay commercial paper borrowings and to fund SCE's capital program.
• Issued a net $419 million of commercial paper supported by SCE's line of credit to fund interim working capital requirements.
• Issued $250 million of 3.9% first and refunding mortgage bonds due in 2041. The proceeds from these bonds were used to fund SCE's capital program.
• Issued $150 million of floating rate first and refunding mortgage bonds due in 2014. The proceeds from these bonds were used to finance fuel inventories.
• Issued $125 million of 6.5% Series D preference stock. The proceeds from the issuance were used to fund SCE's capital program.
• Paid $461 million of dividends to Edison International.
• Purchased $86 million of SCE variable rate tax-exempt bonds.
Net cash provided by financing activities for 2010 was $503 million consisting of the following significant events:
• Issued $1 billion of first refunding mortgage bonds due in 2040 to fund SCE's capital program.
• Reissued $144 million of tax-exempt pollution control bonds due in 2035 to fund SCE's capital program.
• Repaid $250 million of senior unsecured notes.
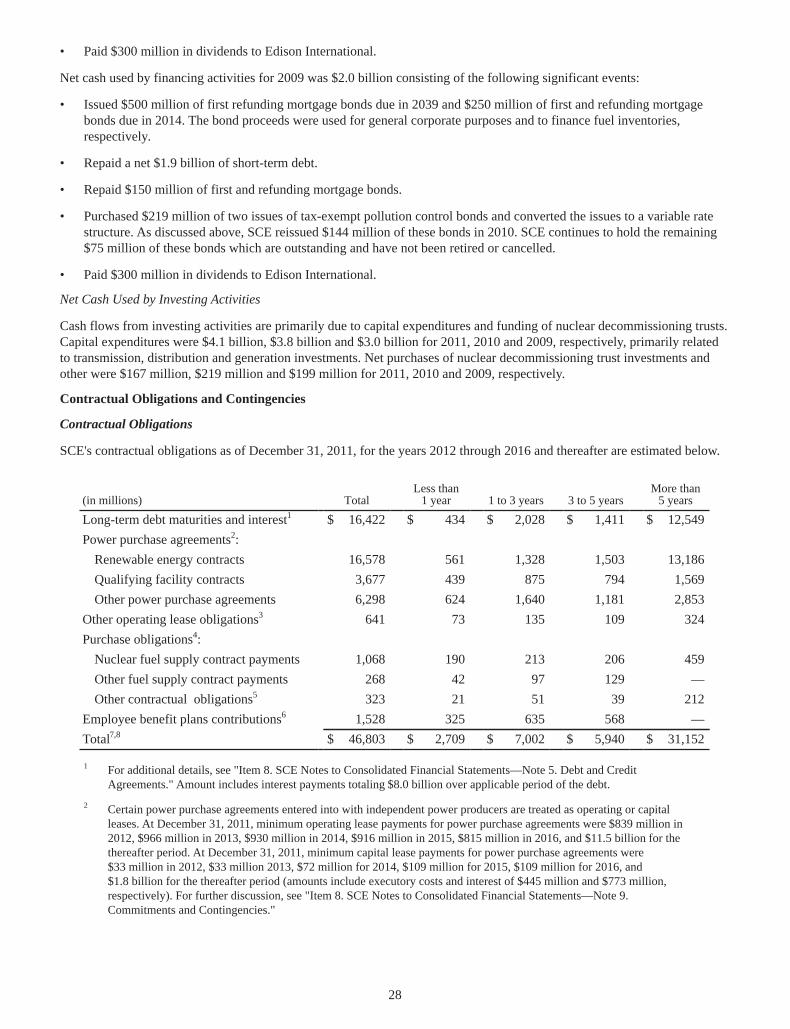
28
• Paid $300 million in dividends to Edison International.
Net cash used by financing activities for 2009 was $2.0 billion consisting of the following significant events:
• Issued $500 million of first refunding mortgage bonds due in 2039 and $250 million of first and refunding mortgage bonds due in 2014. The bond proceeds were used for general corporate purposes and to finance fuel inventories, respectively.
• Repaid a net $1.9 billion of short-term debt.
• Repaid $150 million of first and refunding mortgage bonds.
• Purchased $219 million of two issues of tax-exempt pollution control bonds and converted the issues to a variable rate structure. As discussed above, SCE reissued $144 million of these bonds in 2010. SCE continues to hold the remaining $75 million of these bonds which are outstanding and have not been retired or cancelled.
• Paid $300 million in dividends to Edison International.
Net Cash Used by Investing Activities
Cash flows from investing activities are primarily due to capital expenditures and funding of nuclear decommissioning trusts. Capital expenditures were $4.1 billion, $3.8 billion and $3.0 billion for 2011, 2010 and 2009, respectively, primarily related to transmission, distribution and generation investments. Net purchases of nuclear decommissioning trust investments and other were $167 million, $219 million and $199 million for 2011, 2010 and 2009, respectively.
Contractual Obligations and Contingencies
Contractual Obligations
SCE's contractual obligations as of December 31, 2011, for the years 2012 through 2016 and thereafter are estimated below.
(in millions)
Long-term debt maturities and interest1
Power purchase agreements2:Renewable energy contractsQualifying facility contractsOther power purchase agreements
Other operating lease obligations3
Purchase obligations4:Nuclear fuel supply contract paymentsOther fuel supply contract paymentsOther contractual obligations5
Employee benefit plans contributions6
Total7,8
Total
$ 16,422
16,5783,6776,298
641
1,068268323
1,528$ 46,803
Less than1 year
$ 434
56143962473
1904221
325$ 2,709
1 to 3 years
$ 2,028
1,328875
1,640135
2139751
635$ 7,002
3 to 5 years
$ 1,411
1,503794
1,181109
20612939
568$ 5,940
More than5 years
$ 12,549
13,1861,5692,853
324
459—
212—
$ 31,152
1 For additional details, see "Item 8. SCE Notes to Consolidated Financial Statements—Note 5. Debt and Credit Agreements." Amount includes interest payments totaling $8.0 billion over applicable period of the debt.
2 Certain power purchase agreements entered into with independent power producers are treated as operating or capital leases. At December 31, 2011, minimum operating lease payments for power purchase agreements were $839 million in 2012, $966 million in 2013, $930 million in 2014, $916 million in 2015, $815 million in 2016, and $11.5 billion for the thereafter period. At December 31, 2011, minimum capital lease payments for power purchase agreements were $33 million in 2012, $33 million 2013, $72 million for 2014, $109 million for 2015, $109 million for 2016, and $1.8 billion for the thereafter period (amounts include executory costs and interest of $445 million and $773 million, respectively). For further discussion, see "Item 8. SCE Notes to Consolidated Financial Statements—Note 9. Commitments and Contingencies."

29
3 At December 31, 2011, minimum other operating lease payments were primarily related to vehicles, office space and other equipment. For further discussion, see "Item 8. SCE Notes to Consolidated Financial Statements—Note 9. Commitments and Contingencies."
4 For additional details, see "Item 8. SCE Notes to Consolidated Financial Statements—Note 9. Commitments and Contingencies."
5 At December 31, 2011, other commitments were primarily related to maintaining reliability and expanding SCE's transmission and distribution system.
6 Amount includes estimated contributions to the pension and PBOP plans. The estimated contributions for SCE are not available beyond 2016. These amounts represent estimates that are based on assumptions that are subject to change. In addition, funding of future contributions could be impacted by the final 2012 GRC decision. See "Item 8. SCE Notes to Consolidated Financial Statements—Note 8. Compensation and Benefit Plans" for further information.
7 At December 31, 2011, SCE had a total net liability recorded for uncertain tax positions of $258 million, which is excluded from the table. SCE cannot make reliable estimates of the cash flows by period due to uncertainty surrounding the timing of resolving these open tax issues with the IRS.
8 The contractual obligations table does not include derivative obligations and asset retirement obligations, which are discussed in "Item 8. SCE Notes to Consolidated Financial Statements—Note 6. Derivative Instruments and Hedging Activities," and "Item 8. SCE Notes to Consolidated Financial Statements—Note 2. Property, Plant and Equipment," respectively.
Contingencies
SCE has contingencies related to the CPSD Investigations, Four Corners New Source Review litigation, nuclear insurance, wildfire insurance and spent nuclear fuel, which are discussed in "Item 8. SCE Notes to Consolidated Financial Statements—Note 9. Commitments and Contingencies."
Environmental Remediation
SCE records its environmental remediation liabilities when site assessments and/or remedial actions are probable and a range of reasonably likely cleanup costs can be estimated. SCE reviews its sites and measures the liability quarterly, by assessing a range of reasonably likely costs for each identified site using currently available information, including existing technology, presently enacted laws and regulations, experience gained at similar sites, and the probable level of involvement and financial condition of other potentially responsible parties. These estimates include costs for site investigations, remediation, operations and maintenance, monitoring and site closure. Unless there is a probable amount, SCE records the lower end of this reasonably likely range of costs (classified as "Other long-term liabilities") at undiscounted amounts as timing of cash flows is uncertain.
As of December 31, 2011, SCE had identified 24 material sites for remediation and recorded an estimated minimum liability of $49 million. SCE expects to recover 90% of its remediation costs at certain sites. See "Item 8. SCE Notes to Consolidated Financial Statements—Note 9. Commitments and Contingencies" for further discussion.
MARKET RISK EXPOSURES
SCE's primary market risks include fluctuations in interest rates, commodity prices and volumes, and counterparty credit. Fluctuations in interest rates can affect earnings and cash flows. Fluctuations in commodity prices and volumes and counterparty credit losses may temporarily affect cash flows, but are not expected to affect earnings due to expected recovery through regulatory mechanisms. Derivative instruments are used, as appropriate, to manage market risks for customers and SCE. For a further discussion of SCE's market risk exposures, including commodity price risk, credit risk and interest rate risk, see "Item 8. SCE Notes to Consolidated Financial Statements—Note 6. Derivative Instruments and Hedging Activities" and "—Note 4. Fair Value Measurements."
Interest Rate Risk
SCE is exposed to changes in interest rates primarily as a result of its financing and short-term investing activities used for liquidity purposes, to fund business operations and to fund capital investments. The nature and amount of SCE's long-term and short-term debt can be expected to vary as a result of future business requirements, market conditions and other factors. Changes in interest rates may impact SCE's authorized rate of return for the period beyond 2012, see "Item 1. Business—Overview of Ratemaking Process—CPUC" for further discussion.
At December 31, 2011, the fair market value of SCE's long-term debt (including current portion of long-term debt) was $10.1 billion, compared to a carrying value of $8.4 billion. A 10% increase in market interest rates would have resulted in a

30
$399 million decrease in the fair market value of SCE's long-term debt. A 10% decrease in market interest rates would have resulted in a $430 million increase in the fair market value of SCE's long-term debt.
Commodity Price Risk
SCE and its customers are exposed to the risk of a change in the market price of natural gas and electric power. SCE's hedging program reduces exposure to variability in market prices related to SCE's purchases and sales of electric power and natural gas. SCE expects recovery of its related hedging costs through the ERRA balancing account or CPUC-approved procurement plans, and as a result, exposure to commodity price is not expected to impact earnings, but may impact the timing of cash flows. SCE's hedging program reduces customer exposure to variability in market prices. As part of this program, SCE enters into energy options, swaps, forward arrangements, tolling arrangements, and congestion revenue rights ("CRRs"). The transactions are pre-approved by the CPUC or executed in compliance with CPUC-approved procurement plans. For further discussion on derivative instruments entered into to mitigate commodity price exposures, see "Item 8. SCE Notes to Consolidated Financial Statements—Note 6. Derivative Instruments and Hedging Activities."
Fair Value of Derivative Instruments
With some exceptions, SCE records derivative instruments on its consolidated balance sheets at fair value. Changes in the fair value of derivative instruments are expected to be recovered from or refunded to customers through regulatory mechanisms and, therefore, SCE's fair value changes have no impact on earnings. SCE does not use hedge accounting for these transactions due to this regulatory accounting treatment. For further discussion on fair value measurements and the fair value hierarchy, see "Item 8. SCE Notes to Consolidated Financial Statements—Note 4. Fair Value Measurements."
The fair value of outstanding derivative instruments used at SCE to mitigate its exposure to commodity price risk was a net liability of $936 million and $207 million at December 31, 2011 and 2010, respectively. The increase in the net liability was related to changes in unrealized losses on economic hedging activities primarily due to declining power and natural gas prices. The following table summarizes the increase or decrease to the fair values of outstanding derivative instruments as of December 31, 2011, if the electricity prices or gas prices were changed while leaving all other assumptions constant:
(in millions)
Increase in electricity prices by 10%Decrease in electricity prices by 10%Increase in gas prices by 10%Decrease in gas prices by 10%
December 31,2011
$ 266(581)(340)
(7)
Credit Risk
For information related to credit risks and how SCE manages credit risk, see "Item 8. SCE Notes to Consolidated Financial Statements—Note 6. Derivative Instruments and Hedging Activities."
Credit risk exposure from counterparties for power and gas trading activities is measured as the sum of net accounts receivable (accounts receivable less accounts payable) and the current fair value of net derivative assets (derivative assets less derivative liabilities) reflected on the consolidated balance sheets. SCE enters into master agreements which typically provide for a right of setoff. Accordingly, SCE's credit risk exposure from counterparties is based on a net exposure under these arrangements. SCE manages the credit risk on the portfolio for both rated and non-rated counterparties based on credit ratings using published ratings of counterparties and other publicly disclosed information, such as financial statements, regulatory filings, and press releases, to guide it in the process of setting credit levels, risk limits and contractual arrangements, including master netting agreements.

31
As of December 31, 2011, the amount of balance sheet exposure as described above broken down by the credit ratings of SCE's counterparties, was as follows:
(in millions)
S&P Credit Rating1
A or higherNot rated3
Total
December 31, 2011
Exposure2
$ 122
11$ 133
Collateral
$ —
(3)$ (3)
Net Exposure
$ 122
8$ 130
1 SCE assigns a credit rating based on the lower of a counterparty's S&P or Moody's rating. For ease of reference, the above table uses the S&P classifications to summarize risk, but reflects the lower of the two credit ratings.
2 Exposure excludes amounts related to contracts classified as normal purchases and sales and non-derivative contractual commitments that are not recorded on the consolidated balance sheets, except for any related net accounts receivable.
3 The exposure in this category relates to long-term power purchase agreements. SCE's exposure is mitigated by regulatory treatment.
CRITICAL ACCOUNTING ESTIMATES AND POLICIES
The accounting policies described below are considered critical to obtaining an understanding of SCE's consolidated financial statements because their application requires the use of significant estimates and judgments by management in preparing the consolidated financial statements. Management estimates and judgments are inherently uncertain and may differ significantly from actual results achieved. Management considers an accounting estimate to be critical if the estimate requires significant assumptions and changes in the estimate or the use of alternative estimates that could have a material impact on SCE's results of operations or financial position. For more information on SCE's accounting policies, see "Item 8. SCE Notes to Consolidated Financial Statements—Note 1. Summary of Significant Accounting Policies."
Rate Regulated Enterprises
Nature of Estimate Required. SCE follows the accounting principles for rate-regulated enterprises which are required for entities whose rates are set by regulators at levels intended to recover the estimated costs of providing service, plus a return on net investment, or rate base. Regulators may also impose certain penalties or grant certain incentives. Due to timing and other differences in the collection of revenue, these principles allow a cost that would otherwise be charged as an expense by a unregulated entity to be capitalized as a regulatory asset if it is probable that such cost is recoverable through future rates; conversely the principles allow creation of a regulatory liability for amounts collected in rates to recover costs expected to be incurred in the future or amounts collected in excess of costs incurred.
Key Assumptions and Approach Used. SCE's management assesses at the end of each reporting period whether regulatory assets are probable of future recovery by considering factors such as the current regulatory environment, the issuance of rate orders on recovery of the specific or a similar incurred cost to SCE or other rate-regulated entities in California, and other factors that would indicate that the regulator will treat an incurred cost as allowable for ratemaking purposes. Using these factors, management has determined that existing regulatory assets and liabilities are probable of future recovery or settlement. This determination reflects the current regulatory climate in California and is subject to change in the future.
Effect if Different Assumption Used. Significant management judgment is required to evaluate the anticipated recovery of regulatory assets, the recognition of incentives and revenue subject to refund, as well as the anticipated cost of regulatory liabilities or penalties. If future recovery of costs ceases to be probable, all or part of the regulatory assets and liabilities would have to be written off against current period earnings. At December 31, 2011, the consolidated balance sheets included regulatory assets of $6.3 billion and regulatory liabilities of $5.3 billion. If different judgments were reached on recovery of costs and timing of income recognition, SCE's earnings may vary from the amounts reported.
Nuclear Decommissioning – ARO
Nature of Estimate Required. Regulations by the NRC require SCE to decommission its nuclear power plants which is expected to begin after the plants' operating licenses expire. In accordance with authoritative guidance, SCE is required to record an obligation to decommission its nuclear facilities. Nuclear decommissioning costs are recovered in utility rates

32
through contributions that are reviewed every three years by the CPUC. Due to regulatory accounting treatment, nuclear decommissioning activities are not expected to affect SCE earnings.
Key Assumptions and Approach Used. The liability to decommission SCE's nuclear power facilities is based on site-specific studies performed in 2008 and 2007 for San Onofre and Palo Verde, respectively, which estimate that SCE will spend approximately $8.6 billion through 2053 to decommission its active nuclear facilities. Decommissioning cost estimates are updated in each Nuclear Decommissioning Triennial Proceeding. The current estimate is based on the following assumptions from the 2008 and 2007 site-specific studies:
• Decommissioning Costs. The estimated costs for labor, dismantling and disposal costs, energy and miscellaneous costs.
• Escalation Rates. Annual escalation rates are used to convert the decommissioning cost estimates in base year dollars to decommissioning cost estimates in future-year dollars. Escalation rates are primarily used for labor, material, equipment, and low level radioactive waste burial costs. SCE's current estimate is based on SCE's decommissioning cost methodology used for ratemaking purposes, escalated at rates ranging from 1.8% to 6.9% (depending on the cost element) annually.
• Timing. Cost estimates are based on an assumption that decommissioning will commence promptly after the NRC operating licenses expire. The operating licenses currently expire in 2022 for San Onofre Units 2 and 3. When the site-specific study was completed, the licenses for the Palo Verde units were set to expire in 2025, 2026 and 2027. Effective April 2011, the licenses were extended to 2045, 2046 and 2047 for the Palo Verde units.
• Spent Fuel Dry Storage Costs. Cost estimates are based on an assumption that the DOE will begin to take spent fuel in 2015, and will remove the last spent fuel from the San Onofre and Palo Verde sites by 2051 and 2053, respectively. Costs for spent fuel monitoring are included until 2051 and 2053, respectively.
• Changes in decommissioning technology, regulation, and economics. The current cost studies assume the use of current technologies under current regulations and at current cost levels.
Effect if Different Assumptions Used. The ARO for decommissioning SCE's active nuclear facilities was $2.5 billion and $2.4 billion at December 31, 2011 and 2010, respectively. Changes in the estimated costs or timing of decommissioning, or in the assumptions and judgments by management underlying these estimates, could cause material revisions to the estimated total cost to decommission these facilities which could have a material effect on the recorded liability and related regulatory asset. The following table illustrates the increase to the ARO and regulatory asset if the escalation rate was adjusted while leaving all other assumptions constant:
(in millions)
Uniform increase in escalation rate of 25 basis points
Increase toARO and regulatory
asset atDecember 31, 2011
$ 146
Pensions and Postretirement Benefits Other than Pensions
Nature of Estimate Required. Authoritative accounting guidance requires companies to recognize the overfunded or underfunded status of defined benefit pension and other postretirement plans as assets and liabilities in the balance sheet; the assets and/or liabilities are normally offset through other comprehensive income (loss). In accordance with authoritative guidance for rate-regulated enterprises, regulatory assets and liabilities are recorded instead of charges and credits to other comprehensive income (loss) for its postretirement benefit plans that are recoverable in utility rates. SCE has a fiscal year-end measurement date for all of its postretirement plans.
Key Assumptions of Approach Used. Pension and other postretirement obligations and the related effects on results of operations are calculated using actuarial models. Two critical assumptions, discount rate and expected return on assets, are important elements of plan expense and liability measurement. Additionally, health care cost trend rates are critical assumptions for postretirement health care plans. These critical assumptions are evaluated at least annually. Other assumptions, which require management judgment, such as retirement, mortality and turnover, are evaluated periodically and updated to reflect actual experience.
As of December 31, 2011, SCE's pension plans had a $4.1 billion benefit obligation and total expense for these plans was $113 million for 2011. As of December 31, 2011, SCE's PBOP plans had a $2.4 billion benefit obligation and total expense for these plans was $34 million for 2011. Annual contributions made to most of SCE's pension plans are currently recovered

33
through CPUC-approved regulatory mechanisms and are expected to be, at a minimum, equal to the related annual expense.
The following are critical assumptions used to determine expense for pension and other postretirement benefit for 2011:
(in millions)
Discount rate1
Expected long-term return on plan assets2
Assumed health care cost trend rates3
PensionPlans
5.25%7.5%
—
PostretirementBenefits Otherthan Pensions
5.50%7.0%9.75%
1 The discount rate enables SCE to state expected future cash flows at a present value on the measurement date. SCE selects its discount rate by performing a yield curve analysis. This analysis determines the equivalent discount rate on projected cash flows, matching the timing and amount of expected benefit payments. Two corporate yield curves were considered, Citigroup and AON-Hewitt.
2 To determine the expected long-term rate of return on pension plan assets, current and expected asset allocations are considered, as well as historical and expected returns on plan assets. A portion of PBOP trusts asset returns are subject to taxation, so the 7.5% rate of return on plan assets above is determined on an after-tax basis. Actual time-weighted, annualized returns on the pension plan assets were 2.2%, 2.0% and 5.9% for the one-year, five-year and ten-year periods ended December 31, 2011, respectively. Actual time-weighted, annualized returns on the PBOP plan assets were 1.2%, 0.8%, and 4.2% over these same periods. Accounting principles provide that differences between expected and actual returns are recognized over the average future service of employees.
3 The health care cost trend rate gradually declines to 5.5% for 2019 and beyond.
Pension expense is recorded for SCE based on the amount funded to the trusts, as calculated using an actuarial method required for ratemaking purposes, in which the impact of market volatility on plan assets is recognized in earnings on a more gradual basis. Any difference between pension expense calculated in accordance with ratemaking methods and pension expense calculated in accordance with authoritative accounting guidance for pension is accumulated as a regulatory asset or liability, and will, over time, be recovered from or returned to customers. As of December 31, 2011, this cumulative difference amounted to a regulatory asset of $105 million, meaning that the accounting method has recognized more in expense than the ratemaking method since implementation of authoritative guidance for employers' accounting for pensions in 1987.
As of December 31, 2011, SCE had unrecognized pension costs of $1.03 billion and unrecognized PBOP costs of $714 million which primarily consisted of the cumulative impact of the reduced discount rates on the respective benefit obligations and the cumulative difference between the expected and actual rate of return on plan assets. Of these deferred costs, $989 million of pension costs and $714 million of PBOP costs are recorded as regulatory assets, an offset to the underfunded liabilities of these plans, and will be amortized to expense over the average expected future service of employees.
SCE's pension and PBOP plans are subject to limits established for federal tax deductibility. SCE funds its pension and PBOP plans in accordance with amounts allowed by the CPUC. Executive pension plans and PBOP plans have no plan assets.
Effect if Different Assumptions Used. Changes in the estimated costs or timing of pension and other postretirement benefit obligations, or the assumptions and judgments used by management underlying these estimates, could have a material effect on the recorded expenses and liabilities. Earnings could be impacted if the CPUC eliminates or modifies the current approved regulatory recovery mechanism.
The following table summarizes the increase or (decrease) to the projected benefit obligation for pension and the accumulated benefit obligation for PBOP if the discount rate were changed while leaving all other assumptions constant:
(in millions)
Change to projected benefit obligation for pensionChange to accumulated benefit obligation for PBOP
Increase in discountrate by 1%
$ (360)(319)
Decrease indiscount rate by 1%
$ 388370

34
A one percentage point increase in the expected rate of return on pension plan assets would decrease current year expense by $30 million and a one percentage point increase in the expected rate of return on PBOP plan assets would decrease current year expense by $16 million.
The following table summarizes the increase or (decrease) to the accumulated benefit obligation and annual aggregate service and interest costs for PBOP if the health care cost trend rate was changed while leaving all other assumptions constant:
(in millions)
Change to accumulated benefit obligation for PBOPChange to annual aggregate service and interest costs
Increase in healthcare cost trend rate
by 1%
$ 27314
Decrease in healthcare cost trend rate
by 1%
$ (227)(12)
Income Taxes
Nature of Estimates Required. As part of the process of preparing its consolidated financial statements, SCE is required to estimate its income taxes for each jurisdiction in which it operates. This process involves estimating actual current period tax expense together with assessing temporary differences resulting from differing treatment of items, such as depreciation, for tax and accounting purposes. These differences result in deferred tax assets and liabilities, which are included within SCE's consolidated balance sheets.
SCE takes certain tax positions it believes are applied in accordance with the applicable tax laws. However, these tax positions are subject to interpretation by the IRS, state tax authorities and the courts. SCE determines its uncertain tax positions in accordance with the authoritative guidance.
Key Assumptions and Approach Used. Accounting for tax obligations requires management judgment. Management uses judgment in determining whether the evidence indicates it is more likely than not, based solely on the technical merits, that a tax position will be sustained, and to determine the amount of tax benefits to be recognized. Judgment is also used in determining the likelihood a tax position will be settled and possible settlement outcomes. In assessing its uncertain tax positions SCE considers, among others, the following factors: the facts and circumstances of the position, regulations, rulings, and case law, opinions or views of legal counsel and other advisers, and the experience gained from similar tax positions. Management evaluates uncertain tax positions at the end of each reporting period and makes adjustments when warranted based on changes in fact or law.
Effect if Different Assumptions Used. Actual income taxes may differ from the estimated amounts which could have a significant impact on the liabilities, revenue and expenses recorded in the financial statements. SCE continues to be under audit or subject to audit for multiple years in various jurisdictions. Significant judgment is required to determine the tax treatment of particular tax positions that involve interpretations of complex tax laws. A tax liability has been recorded with respect to tax positions in which the outcome is uncertain and the effect is estimable. Such liabilities are based on judgment and a final determination could take many years from the time the liability is recorded. Furthermore, settlement of tax positions included in open tax years may be resolved by compromises of tax positions based on current factors and business considerations that may result in material adjustments to income taxes previously estimated. See "Item 8. SCE Notes to Consolidated Financial Statements—Note 7. Income Taxes" for a further discussion on income taxes.
Accounting for Contingencies, Guarantees and Indemnities
Nature of Estimates Required. SCE records loss contingencies when it determines that the outcome of future events is probable of occurring and when the amount of the loss can be reasonably estimated. When a guarantee or indemnification subject to authoritative guidance is entered into, SCE records a liability for the estimated fair value of the underlying guarantee or indemnification. Gain contingencies are recognized in the financial statements when they are realized.
Key Assumptions and Approach Used. The determination of a reserve for a loss contingency is based on management judgment and estimates with respect to the likely outcome of the matter, including the analysis of different scenarios. Liabilities are recorded or adjusted when events or circumstances cause these judgments or estimates to change. In assessing whether a loss is a reasonable possibility, SCE may consider the following factors, among others: the nature of the litigation, claim or assessment, available information, opinions or views of legal counsel and other advisors, and the experience gained from similar cases. SCE provides disclosures for material contingencies when there is a reasonable possibility that a loss or an additional loss may be incurred. Some guarantees and indemnifications could have a significant financial impact under certain circumstances, and management also considers the probability of such circumstances occurring when estimating the fair value.

35
Effect if Different Assumptions Used. Actual amounts realized upon settlement of contingencies may be different than amounts recorded and disclosed and could have a significant impact on the liabilities, revenue and expenses recorded on the consolidated financial statements. In addition, for guarantees and indemnities actual results may differ from the amounts recorded and disclosed and could have a significant impact on SCE's consolidated financial statements. For a discussion of contingencies, guarantees and indemnities, see "Item 8. SCE Notes to Consolidated Financial Statements—Note 9. Commitments and Contingencies."
NEW ACCOUNTING GUIDANCE
New accounting guidance is discussed in "Item 8. SCE Notes to Consolidated Financial Statements—Note 1. Summary of Significant Accounting Policies—New Accounting Guidance."
ITEM 7A. QUANTITATIVE AND QUALITATIVE DISCLOSURE ABOUT MARKET RISK
Information responding to Item 7A is included in the MD&A under the heading "Market Risk Exposures."
ITEM 8. FINANCIAL STATEMENTS AND SUPPLEMENTARY DATA
CONSOLIDATED FINANCIAL STATEMENTS
36
REPORT OF INDEPENDENT REGISTERED PUBLIC ACCOUNTING FIRM
To the Board of Directors and Shareholder of Southern California Edison Company
In our opinion, the consolidated balance sheets and the related consolidated statements of income, comprehensive income, cash flows and changes in equity present fairly, in all material respects, the financial position of Southern California Edison Company (the "Company") and its subsidiaries at December 31, 2011 and 2010, and the results of their operations and their cash flows for each of the three years in the period ended December 31, 2011 in conformity with accounting principles generally accepted in the United States of America. In addition, in our opinion, the financial statement schedule listed in the index appearing under Item 15(a)(2) presents fairly, in all material respects, the information set forth therein when read in conjunction with the related consolidated financial statements. These financial statements and financial statement schedule are the responsibility of the Company's management. Our responsibility is to express an opinion on these financial statements and financial statement schedules based on our audits. We conducted our audits of these statements in accordance with the standards of the Public Company Accounting Oversight Board (United States). Those standards require that we plan and perform the audit to obtain reasonable assurance about whether the financial statements are free of material misstatement. An audit includes examining, on a test basis, evidence supporting the amounts and disclosures in the financial statements, assessing the accounting principles used and significant estimates made by management, and evaluating the overall financial statement presentation. We believe that our audits provide a reasonable basis for our opinion.
As discussed in Note 3 to the consolidated financial statements, the Company changed the manner in which it accounts for variable interest entities as of January 1, 2010.
/s/ PricewaterhouseCoopers LLP
Los Angeles, California
February 29, 2012

The accompanying notes are an integral part of these consolidated financial statements.
37
Consolidated Statements of Income Southern California Edison Company
(in millions)Operating revenueFuelPurchased powerOperation and maintenanceDepreciation, decommissioning and amortizationProperty and other taxesGain on sale of assetsTotal operating expensesOperating incomeInterest incomeOther incomeInterest expenseOther expensesIncome before income taxesIncome tax expenseNet incomeLess: Net income attributable to noncontrolling interests
Dividends on preferred and preference stockNet income available for common stock
Years ended December 31,2011
$ 10,577367
2,9893,3871,426
285—
8,4542,123
5135
(463)(55)
1,745601
1,144—59
$ 1,085
2010
$ 9,983363
2,9303,2911,273
263(1)
8,1191,864
7141
(429)(51)
1,532440
1,092—52
$ 1,040
2009
$ 9,965721
2,7513,1541,178
244(1)
8,0471,918
11160
(420)(49)
1,620249
1,3719451
$ 1,226
Consolidated Statements of Comprehensive Income
(in millions)Net incomeOther comprehensive income (loss), net of tax:
Pension and postretirement benefits other than pensions:Net loss arising during period, net of income tax benefit of $2, $6 and $5
for 2011, 2010 and 2009 respectivelyAmortization of net loss included in net income, net of income tax expense
of $2, $2 and $1 for 2011, 2010 and 2009 respectivelyComprehensive incomeLess: Comprehensive income attributable to noncontrolling interestsComprehensive income attributable to SCE
Years ended December 31,2011
$ 1,144
(3)
41,145
—$ 1,145
2010
$ 1,092
(9)
31,086
—$ 1,086
2009
$ 1,371
(7)
21,366
94$ 1,272
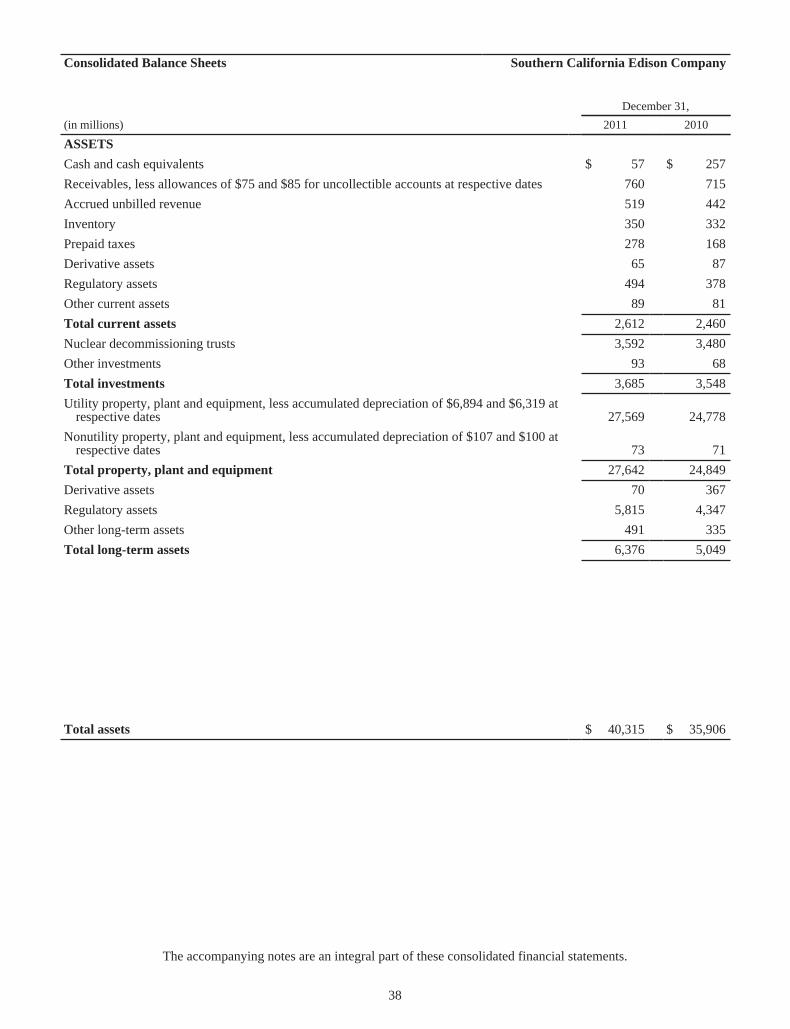
The accompanying notes are an integral part of these consolidated financial statements.
38
Consolidated Balance Sheets Southern California Edison Company
(in millions)ASSETSCash and cash equivalentsReceivables, less allowances of $75 and $85 for uncollectible accounts at respective datesAccrued unbilled revenueInventoryPrepaid taxesDerivative assetsRegulatory assetsOther current assetsTotal current assetsNuclear decommissioning trustsOther investmentsTotal investmentsUtility property, plant and equipment, less accumulated depreciation of $6,894 and $6,319 at
respective datesNonutility property, plant and equipment, less accumulated depreciation of $107 and $100 at
respective datesTotal property, plant and equipmentDerivative assetsRegulatory assetsOther long-term assetsTotal long-term assets
Total assets
December 31,2011
$ 57
76051935027865
49489
2,6123,592
933,685
27,569
7327,642
705,815
4916,376
$ 40,315
2010
$ 257
71544233216887
37881
2,4603,480
683,548
24,778
7124,849
3674,347
3355,049
$ 35,906

The accompanying notes are an integral part of these consolidated financial statements.
39
Consolidated Balance Sheets Southern California Edison Company
(in millions, except share amounts)LIABILITIES AND EQUITYShort-term debtAccounts payableAccrued taxesAccrued interestCustomer depositsDerivative liabilitiesRegulatory liabilitiesOther current liabilitiesTotal current liabilitiesLong-term debtDeferred income taxesDeferred investment tax creditsCustomer advancesDerivative liabilitiesPensions and benefitsAsset retirement obligationsRegulatory liabilitiesOther deferred credits and other long-term liabilitiesTotal deferred credits and other liabilitiesTotal liabilitiesCommitments and contingencies (Note 9)Common stock, no par value (560,000,000 shares authorized; 434,888,104 shares issued and
outstanding at each date)Additional paid-in capitalAccumulated other comprehensive lossRetained earningsTotal common shareholder's equityPreferred and preference stockTotal equityTotal liabilities and equity
December 31,2011
$ 419
1,31949
167199266670759
3,8488,4315,781
84138805
2,4612,6104,6701,529
18,07830,357
2,168596(24)
6,1738,9131,0459,958
$ 40,315
2010
$ —
1,27145
169217212738663
3,3157,6274,829
118112449
1,8382,5074,5241,380
15,75726,699
2,168572(25)
5,5728,287
9209,207
$ 35,906

The accompanying notes are an integral part of these consolidated financial statements.
40
Consolidated Statements of Cash Flows Southern California Edison Company
(in millions)Cash flows from operating activities:Net incomeAdjustments to reconcile to net cash provided by operating activities:
Depreciation, decommissioning and amortizationRegulatory impacts of net nuclear decommissioning trust earningsOther amortizationStock-based compensationDeferred income taxes and investment tax credits
Changes in operating assets and liabilities:ReceivablesInventoryMargin and collateral deposits – net of collateral receivedPrepaid taxesOther current assetsAccounts payableAccrued taxesOther current liabilitiesDerivative assets and liabilities – netRegulatory assets and liabilities – netOther assetsOther liabilities
Net cash provided by operating activitiesCash flows from financing activities:Long-term debt issuedLong-term debt issuance costsLong-term debt repaidBonds purchasedPreferred stock issued – netShort-term debt financing – netSettlements of stock-based compensation – netDistributions to noncontrolling interestsDividends paidNet cash provided (used) by financing activitiesCash flows from investing activities:Capital expendituresProceeds from sale of nuclear decommissioning trust investmentsPurchases of nuclear decommissioning trust investments and otherCustomer advances for construction and other investmentsEffect of deconsolidation of variable interest entitiesNet cash used by investing activitiesNet decrease in cash and cash equivalentsCash and cash equivalents, beginning of yearCash and cash equivalents, end of year
Years ended December 31,2011
$ 1,144
1,42614613216
852
(44)(18)
7(110)(87)114
(33)730
(1,428)(180)693
3,261
896(9)
(14)(86)123419(10)—
(520)799
(4,122)2,773
(2,940)29—
(4,260)(200)257
$ 57
2010 $ 1,092
1,27318910617
973
(25)(11)
2(135)(101)(166)
36118(43)278(10)
(207)3,386
1,135
(16)(259)
———(5)—
(352)503
(3,780)1,432
(1,651)(3)
(92)(4,094)
(205)462
$ 257
2009 $ 1,371
1,17815810913
574
(9)2863
178(29)43
(331)26
(413)1,457
48(395)
4,069
750(11)
(154)(219)
—(1,893)
4(125)(351)
(1,999)
(2,999)2,217
(2,416)(21)—
(3,219)(1,149)1,611
$ 462

The accompanying notes are an integral part of these consolidated financial statements.
41
Consolidated Statements of Changes in Equity Southern California Edison Company
(in millions)Balance at December 31, 2008Net incomeOther comprehensive lossDividends declared on common
stockDividends declared on preferred
and preference stockDistributions to noncontrolling
interestsStock-based compensation – netNoncash stock-based
compensation and otherBalance at December 31, 2009Net incomeOther comprehensive lossDeconsolidation of variable
interest entitiesDividends declared on
common stockDividends declared on preferred
and preference stockStock-based compensation – netNoncash stock-based
compensation and otherBalance at December 31, 2010Net incomeOther comprehensive incomeDividends declared on
common stockDividends declared on preferred
and preference stockStock-based compensation and
otherNoncash stock-based
compensation and otherIssuance of preference stockBalance at December 31, 2011
Equity Attributable to SCE
CommonStock
$ 2,168——
—
—
——
—$ 2,168
——
—
—
——
—$ 2,168
——
—
—
—
——
$ 2,168
AdditionalPaid-inCapital
$ 532——
—
—
—7
12$ 551
——
—
—
—4
17$ 572
——
—
—
11
15(2)
$ 596
AccumulatedOther
ComprehensiveIncome (Loss)
$ (14)—(5)
—
—
——
—$ (19)
—(6)
—
—
——
—$ (25)
—1
—
—
—
——
$ (24)
RetainedEarnings
$ 3,8271,277
—
(300)
(51)
—(3)
(4)$ 4,746
1,092—
—
(200)
(52)(9)
(5)$ 5,572
1,144—
(461)
(59)
(21)
(2)—
$ 6,173
Preferredand
PreferenceStock
$ 920——
—
—
——
—$ 920
——
—
—
——
—$ 920
——
—
—
—
—125
$ 1,045
NoncontrollingInterests
$ 38094—
—
—
(125)—
—$ 349
——
(349)
—
——
—$ —
——
—
—
—
——
$ —
TotalEquity
$ 7,8131,371
(5)
(300)
(51)
(125)4
8$ 8,715
1,092(6)
(349)
(200)
(52)(5)
12$ 9,207
1,1441
(461)
(59)
(10)
13123
$ 9,958

42
NOTES TO CONSOLIDATED FINANCIAL STATEMENTS
Note 1. Summary of Significant Accounting Policies
SCE is an investor-owned public utility primarily engaged in the business of supplying electricity to an approximately 50,000 square-mile area of southern California. SCE is a wholly-owned subsidiary of Edison International.
Basis of Presentation
The consolidated financial statements include SCE and its subsidiaries. Effective January 1, 2010, SCE deconsolidated four cogeneration projects in accordance with authoritative guidance for Variable Interest Entities ("VIEs"). Intercompany transactions have been eliminated.
SCE's accounting policies conform to accounting principles generally accepted in the United States of America, including the accounting principles for rate-regulated enterprises, which reflect the ratemaking policies of the California Public Utility Commission ("CPUC") and the Federal Energy Regulatory Commission ("FERC"). SCE applies authoritative guidance for rate-regulated enterprises to the portion of its operations in which regulators set rates at levels intended to recover the estimated costs of providing service, plus a return on capital. Regulators may also impose certain penalties or grant certain incentives. Due to timing and other differences in the collection of operating revenue, these principles require an incurred cost that would otherwise be charged to expense by a nonregulated entity to be capitalized as a regulatory asset if it is probable that the cost is recoverable through future rates; and conversely the principles require recording of a regulatory liability for amounts collected in rates to recover costs expected to be incurred in the future or amounts collected in excess of costs incurred. SCE assesses, at the end of each reporting period, whether regulatory assets are probable of future recovery. See Note 14 for composition of regulatory assets and liabilities.
The preparation of financial statements in conformity with United States generally accepted accounting principles requires management to make estimates and assumptions that affect the reported amounts of assets and liabilities and disclosure of contingent assets and liabilities at the date of the financial statements and the reported amounts of revenue and expenses during the reported period. Actual results could differ from those estimates.
Cash Equivalents
Cash equivalents included investments in money market funds totaling $21 million and $243 million at December 31, 2011 and 2010, respectively. Generally, the carrying value of cash equivalents equals the fair value, as these investments have maturities of three months or less.
SCE temporarily invests the ending daily cash balance in its primary disbursement accounts until required for check clearing. SCE reclassified $220 million and $196 million of checks issued, but not yet paid by the financial institution, from cash to accounts payable at December 31, 2011 and 2010, respectively.
Allowance for Uncollectible Accounts
SCE records an allowance for uncollectible accounts, based upon a variety of factors, including historical amounts written-off, current economic conditions and assessment of customer collectability.
Inventory
Inventory is stated at the lower of cost or market, cost being determined by the average cost method for fuel and materials and supplies. Inventory consisted of the following:
(in millions)FuelMaterials and supplies, spare partsTotal inventory
December 31,2011
$ 24326
$ 350
2010$ 21
311$ 332

43
Renewable Energy Credits
Renewable energy certificates or credits ("RECs") represent property rights established by governmental agencies for the environmental, social, and other nonpower qualities of renewable electricity generation. A REC, and its associated attributes and benefits, can be sold separately from the underlying physical electricity associated with a renewable-based generation source in certain markets.
Retail sellers of electricity obtain RECs through renewable power purchase agreements, internal generation or separate purchases in the market to comply with renewable portfolio standards established in certain such governmental agencies. RECs are the mechanism used to verify renewable portfolio standards compliance and are recognized at the lower of weighted-average cost or market when amounts purchased are in excess of the amounts needed to comply with RPS requirements. The cost of RECs is recoverable as part of the cost of purchased power by SCE.
Property, Plant and Equipment
Utility Property, Plant and Equipment
Utility plant additions, including replacements and betterments, are capitalized. Such costs include direct material and labor and indirect costs such as construction overhead, administrative and general costs, pension and benefits, and property taxes. The CPUC authorizes a rate for each of the indirect costs which are allocated to each project based on either labor or total costs. In addition, allowance for funds used during construction ("AFUDC") is capitalized for certain projects.
Estimated useful lives (authorized by the CPUC) and weighted-average useful lives of SCE's property, plant and equipment, are as follows:
Generation plantDistribution plantTransmission plantGeneral and Other plant
Estimated Useful Lives25 years to 70 years30 years to 60 years35 years to 65 years5 years to 60 years
Weighted-AverageUseful Lives
40 years40 years46 years22 years
Depreciation of utility property, plant and equipment is computed on a straight-line, remaining-life basis. Depreciation expense stated as a percent of average original cost of depreciable utility plant was, on a composite basis, 4.3%, 4.1% and 4.2% for 2011, 2010 and 2009, respectively. Replaced or retired property costs are charged to the accumulated provision for depreciation. Cash payments for removal costs less salvage reduce the liability for asset retirement obligations ("AROs").
Nuclear fuel is recorded as utility plant (nuclear fuel in the fabrication and installation phase is recorded as construction in progress) in accordance with CPUC ratemaking procedures. Nuclear fuel is amortized using the units of production method.
AFUDC represents the estimated cost of debt and equity funds that finance utility-plant construction and is capitalized during certain plant construction. AFUDC is recovered in rates through depreciation expense over the useful life of the related asset. AFUDC equity represents a method to compensate SCE for the estimated cost of equity used to finance utility plant additions and is recorded as part of construction in progress. AFUDC equity was $96 million, $100 million and $116 million in 2011, 2010 and 2009, respectively. AFUDC debt was $42 million, $41 million and $32 million in 2011, 2010 and 2009, respectively.
The FERC issued an order granting return on equity ("ROE") incentive adders, recovery of the return on rate base including incentive adders during the construction phase (referred to as CWIP) and recovery of abandoned plant costs, if needed, for several of SCE's transmission projects. In addition, the FERC granted an ROE incentive to SCE for California Independent System Operator ("CAISO") participation. The order permits SCE to include 100% of prudently-incurred capital expenditures in rate base during construction of the projects and earn a return on equity, rather than capitalizing AFUDC.
Major Maintenance
Certain plant facilities and equipment require periodic major maintenance. These costs are expensed as incurred.
Asset Retirement Obligations
The fair value of a liability for an ARO is recorded in the period in which it is incurred, including a liability for the fair value of a conditional ARO, if the fair value can be reasonably estimated even though uncertainty exists about the timing and/or

44
method of settlement. When an ARO liability is initially recorded, the entity capitalizes the cost by increasing the carrying amount of the related long-lived asset. Over time, the liability is increased for accretion expense each period and the capitalized cost is depreciated over the useful life of the related asset. Settlement of an ARO liability for an amount other than its recorded amount results in an increase or decrease in expense. AROs related to decommissioning of SCE's nuclear power facilities are based on site-specific studies. Those site-specific studies are updated as part of each Nuclear Decommissioning Cost Triennial Proceeding ("NDCTP"). The initial establishment of a nuclear-related ARO is at fair value. Subsequent layers of an ARO are established for updated site-specific decommissioning cost estimates as approved by the CPUC on the NDCTP. For further discussion, see "Nuclear Decommissioning" below and Notes 4 and 15. A reconciliation of the changes in the ARO liability is as follows:
(in millions)Beginning balanceAccretion expenseRevisions1
Liabilities settledTransfers in or out2
Ending balance
2011$ 2,507
6242(1)—
$ 2,610
2010$ 3,198
195(867)
(1)(18)
$ 2,507
1 Revisions in 2010 represent the most recent site-specific studies approved by the CPUC.2 Transfers in or out consist of the deconsolidation of the Big 4 projects (Kern River, Midway-Sunset,
Sycamore and Watson) effective January 1, 2010. For further discussion, see Note 3.
In 2003, SCE recorded the fair value of its liability for AROs related to the decommissioning of its nuclear power facilities. At that time, SCE adjusted its nuclear decommissioning obligation, capitalized the initial costs of the ARO into a nuclear-related ARO regulatory asset and also recorded an ARO regulatory liability as a result of timing differences between the recognition of costs and the recovery of costs through the ratemaking process. Once a Commission decision is rendered, a revised ARO layer reflecting the updated cost estimate is established and accreted over the lives of San Onofre and Palo Verde. The ARO liability related to San Onofre and Palo Verde was $2.5 billion at both December 31, 2011 and 2010.
Impairment of Long-Lived Assets
SCE evaluates the impairment of its long-lived assets based on a review of estimated future cash flows expected to be generated whenever events or changes in circumstances indicate that the carrying amount of such investments or assets may not be recoverable. If the carrying amount of a long-lived asset exceeds expected future cash flows, undiscounted and without interest charges, an impairment loss is recognized in the amount of the excess of fair value over the carrying amount. Fair value is determined via market, cost and income based valuation techniques, as appropriate. SCE's impaired assets are recorded as a regulatory asset if it is deemed probable that such amounts will be recovered from customers.
Leases
SCE enters into power purchase agreements that may contain leases, as discussed under "Power Purchase Agreements" below. SCE has entered into a number of agreements to lease property and equipment in the normal course of business. Minimum lease payments under operating leases for property, plant and equipment are levelized (total minimum lease payments divided by the number of years of the lease) and recorded as rent expense over the terms of the leases. Lease payments in excess of the minimum are recorded as rent expense in the year incurred.
Capital leases are reported as long-term obligations on the consolidated balance sheets under "Other deferred credits and other long-term liabilities." As a rate regulated enterprise, SCE's capital lease amortization expense and interest expense are reflected in "Purchased power" on the consolidated statements of income.
Nuclear Decommissioning
SCE plans to decommission its nuclear generating facilities by a prompt removal method authorized by the NRC. Decommissioning is expected to begin after expiration of the plants' operating licenses. The plants' operating licenses are currently set to expire in 2022 for San Onofre Units 2 and 3, unless license renewal proves feasible, and 2045, 2046 and 2047 for Palo Verde units 1, 2 and 3, respectively. Decommissioning costs, which are recovered through nonbypassable customer rates over the term of each nuclear facility's operating license, are recorded as a component of depreciation expense, with a corresponding credit to the ARO regulatory liability. Amortization of the ARO asset (included within the unamortized nuclear

45
investment) and accretion of the ARO liability are deferred as increases to the ARO regulatory liability account, resulting in no impact on earnings.
SCE has collected in rates amounts for the future costs of removal of its nuclear assets, and has placed those amounts in independent trusts. The cost of removal amounts, in excess of fair value collected for assets not legally required to be removed, are classified as regulatory liabilities.
Due to regulatory recovery of SCE's nuclear decommissioning expense, nuclear decommissioning activities do not affect SCE's earnings. SCE's nuclear decommissioning trust investments primarily consist of debt and equity investments that are classified as available-for-sale. Due to regulatory mechanisms, earnings and realized gains and losses (including other-than-temporary impairments) have no impact on operating revenue. Unrealized gains and losses on decommissioning trust funds increase or decrease the trust assets and the related regulatory asset or liability and have no impact on operating revenue or decommissioning expense. SCE reviews each security for other-than-temporary impairment on the last day of each month. If the fair value on the last day of two consecutive months is less than the cost for that security, SCE recognizes a loss for the other-than-temporary impairment. If the fair value is greater or less than the cost for that security at the time of sale, SCE recognizes a related realized gain or loss, respectively.
Deferred Financing Costs
Debt premium, discount and issuance expenses incurred in connection with obtaining financing are deferred and amortized on a straight-line basis as interest expense over the term of the related debt. Under CPUC ratemaking procedures, debt reacquisition expenses are amortized over the remaining life of the reacquired debt or, if refinanced, the life of the new debt. SCE had unamortized losses on reacquired debt of $249 million and $268 million at December 31, 2011 and 2010, respectively, reflected in "Regulatory assets" in the long-term section of the consolidated balance sheets. SCE had unamortized debt issuance costs of $60 million at both December 31, 2011 and 2010, reflected in "Other long-term assets" on the consolidated balance sheets. Amortization of deferred financing costs charged to interest expense was $33 million, $30 million and $27 million in 2011, 2010 and 2009, respectively.
Revenue Recognition
Operating revenue is recognized when electricity is delivered and includes amounts for services rendered but unbilled at the end of each reporting period. Rates charged to customers are based on CPUC and FERC-authorized revenue requirements. CPUC rates are implemented upon final approval, and beginning in 2012 FERC rates are based on a forecasted revenue requirement, subject to refund and settlement procedures and will be trued-up annually based on actual amounts.
CPUC rates decouple authorized revenue from the volume of electricity sales, so that SCE earns revenue equal to amounts authorized. Differences between amounts collected and authorized levels are either collected from or refunded to customers, and therefore, such differences do not impact operating revenue.
SCE remits to the California Department of Water Resources ("CDWR"), and does not recognize as revenue the amounts that SCE bills and collects from its customers for electric power purchased and sold by the CDWR to SCE's customers, as well as CDWR-bond-related costs and a portion of direct access exit fees. Power purchased by the CDWR for these long-term contracts are not considered a cost to SCE because SCE is acting as a limited agent to CDWR for these transactions. The amounts collected and remitted to CDWR were $1.1 billion, $1.2 billion, and $1.8 billion for the years ended December 31, 2011, 2010 and 2009, respectively. All power contracts that CDWR allocated to SCE had expired by the end of 2011. The bond-related charges and direct access exit fees continue until 2022.
Power Purchase Agreements
SCE, generally as the purchaser, enters into power purchase agreements in the normal course of business. Accounting for power purchase agreements is complex and varies based on the terms and conditions of each agreement. A power purchase agreement may be considered a variable interest in a variable interest entity. Under this classification, the power purchase agreement is evaluated to determine if SCE is the primary beneficiary in the variable interest entity, in which case, such entity would be consolidated. None of SCE's contracts resulted in consolidation of a variable interest entity at December 31, 2011. See Note 3 for further discussion of power purchase agreements that are considered variable interests.
A power purchase agreement may also contain a lease for accounting purposes. This generally occurs when a power purchase agreement (signed or modified after June 30, 2003) designates a specific power plant in which the buyer purchases substantially all of the output and does not otherwise meet a fixed price per unit of output exception. SCE has a number of power purchase agreements that contain leases. SCE's recognition of lease expense conforms to the ratemaking treatment for
46
SCE's recovery of the cost of electricity and is recorded in purchased power. See Note 9 for further discussion of SCE's power purchase agreements, including agreements that are classified as capital leases for accounting purposes.
A power purchase agreement that does not contain a lease may be classified as a derivative. subject to a normal purchase and sale exception, in which case, the power purchase agreement is classified as an executory contract and accounted for on an accrual basis. Most of SCE's QF contracts are not required to be recorded on the consolidated balance sheets because they either do not meet the definition of a derivative or meet the normal purchase and sale exception. However, SCE purchases power from certain QFs in which the contract pricing is based on a natural gas index, but the power is not generated with natural gas. These contracts are not eligible for the normal purchase and sale exception and are recorded as a derivative on the consolidated balance sheets at fair value. See Note 6 for further information on derivatives and hedging activities.
Power purchase agreements that do not meet the above classifications are accounted for on an accrual basis.
Derivative Instruments and Hedging Activities
SCE records derivative instruments on its consolidated balance sheets as either assets or liabilities measured at fair value unless otherwise exempted from derivative treatment as normal purchases or sales. The normal purchases and sales exception requires, among other things, physical delivery in quantities expected to be used or sold over a reasonable period in the normal course of business. Changes in the fair value of derivative instruments are expected to be recovered from or refunded to customers through regulatory mechanisms and, therefore, SCE's fair value changes have no impact on purchased-power expenses or earnings. SCE does not use hedge accounting for derivative transactions due to regulatory accounting treatment.
Where SCE's derivative instruments are subject to a master netting agreement and certain criteria are met, SCE presents its derivative assets and liabilities on a net basis on its consolidated balance sheets. In addition, derivative positions are offset against margin and cash collateral deposits. The results of derivative activities are recorded as part of cash flows from operating activities on the consolidated statements of cash flows. See Note 6 for further information on derivative and hedging activities.
Sales and Use Taxes
SCE bills certain sales and use taxes levied by state or local governments to its customers. Included in these sales and use taxes are franchise fees, which SCE pays to various municipalities (based on contracts with these municipalities) in order to operate within the limits of the municipality. SCE bills these franchise fees to its customers based on a CPUC-authorized rate. These franchise fees, which are required to be paid regardless of SCE's ability to collect from the customer, are accounted for on a gross basis and reflected in operating revenue and other operation and maintenance expense. SCE's franchise fees billed to customers and recorded as operating revenue were $101 million, $102 million and $102 million for the years ended December 31, 2011, 2010 and 2009, respectively. When SCE acts as an agent and when the tax is not required to be remitted as not having been collected from the customer, the taxes are accounted for on a net basis. Amounts billed to and collected from customers for these taxes are remitted to the taxing authorities and are not recognized as operating revenue.
Stock-Based Compensation
Stock options, performance shares, deferred stock units and restricted stock units have been granted under Edison International's long-term incentive compensation programs. Generally, Edison International does not issue new common stock for settlement of equity awards. Rather, a third party is used to purchase shares from the market and delivery for settlement of option exercises, performance shares and restricted stock units. Performance shares earned are settled half in cash and half in common stock; however, Edison International has discretion under certain of the awards to pay the half subject to cash settlement in Edison International's common stock. Deferred stock units granted to management are settled in cash, and represent a liability. Restricted stock units are settled in common stock; however, Edison International will substitute cash awards to the extent necessary to pay tax withholding or any government levies.
SCE recognizes stock-based compensation expense on a straight-line basis over the requisite service period. SCE recognizes stock-based compensation expense for awards granted to retirement-eligible participants on a prorated basis over the initial year or over the period between the date of grant and the date the participant first becomes eligible for retirement.
Dividend Restrictions
The CPUC regulates SCE's capital structure which limits the dividends it may pay Edison International. In SCE's most recent cost of capital proceeding, the CPUC set an authorized capital structure for SCE which included a common equity component of 48%. SCE may make distributions to Edison International as long as the common equity component of SCE's capital structure remains at or above the 48% authorized level on a 13-month weighted average basis. At December 31, 2011, SCE's
47
13-month weighted-average common equity component of total capitalization was 50.4% resulting in the capacity to pay $436 million in additional dividends.
Income Taxes
SCE and its subsidiaries are included in Edison International's consolidated federal income tax and combined state franchise tax returns. Pursuant to an income tax-allocation agreement approved by the CPUC, SCE's tax liability is computed as if it filed its federal and state income tax returns on a separate return basis. SCE estimates its income taxes for each jurisdiction in which it operates. This involves estimating current period tax expense along with assessing temporary differences resulting from differing treatment of items (such as depreciation) for tax and accounting purposes. These differences result in deferred tax assets and liabilities, which are included within SCE's consolidated balance sheets. Income tax expense includes the current tax liability from operations and the change in deferred income taxes during the year. Investment tax credits are deferred and amortized to income tax expense over the lives of the properties.
Interest income, interest expense and penalties associated with income taxes are reflected in "Income tax expense" on the consolidated statements of income.
Management evaluates its uncertain tax positions at each reporting date. Liabilities for uncertain tax positions are reflected in "Accrued taxes" and "Other deferred credits and long-term liabilities" on the consolidated balance sheets.
Related Party Transactions
Specified administrative services such as payroll and employee benefit programs, performed by SCE employees, are shared among all subsidiaries of Edison International, and the cost of these corporate support services are allocated to all subsidiaries. Costs are allocated based on one of the following formulas: relative amount of equity in investment, number of employees, or multi-factor method (operating revenue, operating expenses, total assets and number of employees). In addition, services of SCE employees are sometimes directly requested by Edison International or one of its subsidiaries. Labor and additional expenses of these directly requested services are specifically identified and billed . SCE participates in the insurance program of Edison International, including property, general liability, workers' compensation and various other specialty policies. SCE's insurance premiums are generally based on SCE's share of risk related to each policy.
New Accounting Guidance
Accounting Guidance Adopted in 2011
Fair Value Measurements and Disclosures
The Financial Accounting Standards Board ("FASB") issued an accounting standards update modifying the disclosure requirements related to fair value measurements. Under these requirements, purchases and settlements for Level 3 fair value measurements are presented on a gross basis, rather than net. SCE adopted this guidance effective January 1, 2011.
Accounting Guidance Not Adopted in 2011
Fair Value Measurement
In May 2011, the FASB issued an accounting standards update modifying the fair value measurement and disclosure guidance. This guidance prohibits grouping of financial instruments for purposes of fair value measurement and requires the value be based on the individual security. This amendment also results in new disclosures primarily related to Level 3 measurements including quantitative disclosure about unobservable inputs and assumptions, a description of the valuation processes and a narrative description of the sensitivity of the fair value to changes in unobservable inputs. SCE will adopt this guidance in the first quarter of 2012. The adoption of this accounting standards update is not expected to have a material impact on SCE's consolidated financial position.
Presentation of Comprehensive Income
In June 2011 and December 2011, the FASB issued an accounting standards update on the presentation of comprehensive income. An entity can elect to present items of net income and other comprehensive income in one continuous statement, referred to as the statement of comprehensive income, or in two separate but consecutive statements. SCE will adopt this guidance in the first quarter of 2012. SCE currently presents the statement of comprehensive income immediately following the statement of income and will continue to do so. The adoption of this accounting standards update will not change the items that constitute net income and other comprehensive income.

48
Offsetting Assets and Liabilities
In December 2011, the FASB issued an accounting standards update modifying the disclosure requirements about the nature of an entity's rights of offsetting assets and liabilities in the statement of financial position under master netting agreements and related arrangements associated with financial and derivative instruments. The guidance requires increased disclosure of the gross and net recognized assets and liabilities, collateral positions and narrative descriptions of setoff rights. SCE will adopt this guidance effective January 1, 2013. SCE does not expect the adoption of this standard to have a material impact on SCE's consolidated statements of income, financial position or cash flows.
Note 2. Property, Plant and Equipment
Utility Property, Plant and Equipment
Utility property, plant and equipment included on the consolidated balance sheets is composed of the following:
(in millions)TransmissionDistributionGenerationGeneral plant and otherAccumulated depreciation
Construction work in progressNuclear fuel, at amortized costTotal utility property, plant and equipment
December 31,2011
$ 6,10915,9384,0633,951
(6,894)23,1673,922
480$ 27,569
2010$ 5,811
14,8783,3713,377
(6,319)21,1183,291
369$ 24,778
Capitalized Software Costs
SCE capitalizes costs incurred during the application development stage of internal use software projects to property, plant, and equipment. SCE amortizes capitalized software costs ratably over the expected lives of the software, ranging from 5 to 15 years and commencing upon operational use. At December 31, 2011 and 2010, capitalized software costs were $1.4 billion and $1.1 billion and accumulated amortization was $491 million and $393 million, respectively. Amortization expense for capitalized software was $156 million, $129 million and $88 million in 2011, 2010 and 2009, respectively. At December 31, 2011, amortization expense is estimated to be approximately $174 million annually for 2012 through 2016.
Jointly Owned Utility Projects
SCE owns interests in several generating stations and transmission systems for which each participant provides its own financing. SCE's proportionate share of these projects is reflected in the consolidated balance sheets and included in the above table. SCE's proportionate share of expenses for each project is reflected in the consolidated statements of income. All of the investments in the Mohave generating station and a portion of the investments in San Onofre and Palo Verde generating stations are included in regulatory assets on the consolidated balance sheets—see Note 14.

49
The following is SCE's investment in each project as of December 31, 2011:
(in millions)
Transmission systems:EldoradoPacific Intertie
Generating stations:Four Corners Units 4 and 5 (coal)Mohave (coal)Palo Verde (nuclear)San Onofre (nuclear)
Total
Plant inService
$ 71
189
589327
1,8035,198
$ 8,177
ConstructionWork inProgress
$ 42
172454
370$ 471
AccumulatedDepreciation
$ 13
68
519287
1,4654,111
$ 6,463
Nuclear Fuel (atamortized cost)
$ ——
——
138342
$ 480
Net BookValue
$ 62123
8764
5301,799
$ 2,665
OwnershipInterest
60%50%
48%56%16%78%
In addition to the projects above, SCE has ownership interests in jointly owned power poles with other companies.
On November 8, 2010, SCE entered into an agreement to sell its ownership interest in Units 4 and 5 of the Four Corners coal-fired electric generating facility to the operator of the facility, Arizona Public Service Company. The sale price is $294 million, subject to certain adjustments. The closing of the sale is contingent upon the receipt of regulatory approvals and other specified closing conditions and is estimated to occur in the second half of 2012. Any gain on sale will be for the benefit of SCE's customers and, therefore, will not affect SCE's earnings.
Note 3. Variable Interest Entities
Effective January 1, 2010, SCE adopted the FASB's new guidance regarding VIEs. A VIE is defined as a legal entity whose equity owners do not have sufficient equity at risk, or, as a group, the holders of the equity investment at risk lack any of the following three characteristics: decision-making rights, the obligation to absorb losses, or the right to receive the expected residual returns of the entity. The primary beneficiary is identified as the variable interest holder that has both the power to direct the activities of the VIE that most significantly impact the entity's economic performance and the obligation to absorb losses or the right to receive benefits from the entity that could potentially be significant to the VIE. The primary beneficiary is required to consolidate the VIE. Commercial and operating activities are generally the factors that most significantly impact the economic performance of VIEs in which SCE has a variable interest. Commercial and operating activities include construction, operation and maintenance, fuel procurement, dispatch and compliance with regulatory and contractual requirements.
Variable Interest in VIEs that are not Consolidated
Power Purchase Contracts
SCE has 16 power purchase agreements ("PPAs") that have variable interests in VIEs, including 6 tolling agreements through which SCE provides the natural gas to fuel the plants and 10 contracts with qualifying facilities ("QFs") (including the Big 4 projects) that contain variable pricing provisions based on the price of natural gas. SCE has concluded that it is not the primary beneficiary of these VIEs since it does not control the commercial and operating activities of these entities. In general, because payments for capacity are the primary source of income, the most significant economic activity for SCE's VIEs is the operation and maintenance of the power plants. See further discussion of the Big 4 projects below.
As of the balance sheet date, the carrying amount of assets and liabilities in SCE's consolidated balance sheet that relate to its involvement with VIEs result from amounts due under the PPAs or the fair value of those derivative contracts. Under these contracts, SCE recovers the costs incurred through demonstration of compliance with its CPUC-approved long-term power procurement plans. SCE has no residual interest in the entities and has not provided or guaranteed any debt or equity support, liquidity arrangements, performance guarantees or other commitments associated with these contracts other than the purchase commitments described in Note 9. As a result, there is no significant potential exposure to loss as a result of SCE's involvement with these VIEs. The aggregate capacity dedicated to SCE for these VIE projects was 3,820 MW at December 31, 2011 and the amounts that SCE paid to these projects were $477 million and $534 million for the years ended December 31, 2011 and 2010, respectively. These amounts are recoverable in customer rates.

50
Big 4 Projects Consolidated Prior to 2010
SCE has variable interests in the Big 4 Projects through power contracts between SCE and the Big 4 Projects containing variable contract pricing provisions based on the price of natural gas. Prior to 2010, SCE had determined that it was the primary beneficiary of these four VIEs and, therefore, consolidated these projects. SCE prospectively deconsolidated the Big 4 Projects at January 1, 2010 since it does not control the commercial and operating activities of these projects. The deconsolidation did not result in a gain or loss.
SCE's consolidated statements of income impacted by VIE activities prior to 2010 are presented below:
(in millions)
Operating revenueFuelPurchased powerOperation and maintenanceDepreciation, decommissioning and amortizationProperty and other taxesGain on sale of assetsTotal operating expensesOperating incomeInterest incomeOther incomeInterest expense – net of amounts capitalizedOther expensesIncome before income taxesIncome tax expenseNet incomeLess: Net income attributable to noncontrolling interestsDividends on preferred and preference stockNet income available for common stock
ElectricUtility
Year ended December 31, 2009
$ 9,746353
3,1213,0601,145
244(1)
7,9221,824
11160
(420)(49)
1,526(249)
1,277—
(51)$ 1,226
VIEs
$ 589368—9433——
49594————94—94
(94)—
$ —
Eliminations
$ (370)—
(370)————
(370)——————————
$ —
SCE
$ 9,965721
2,7513,1541,178
244(1)
8,0471,918
11160
(420)(49)
1,620(249)
1,371(94)(51)
$ 1,226
Note 4. Fair Value Measurements
Recurring Fair Value Measurements
Fair value is defined as the price that would be received to sell an asset or paid to transfer a liability in an orderly transaction between market participants at the measurement date referred to as an exit price. Fair value of an asset or liability should consider assumptions that market participants would use in pricing the asset or liability, including assumptions about nonperformance risk.
SCE categorizes financial assets and liabilities into a fair value hierarchy based on valuation inputs used to determine fair value. The hierarchy gives the highest priority to unadjusted quoted market prices in active markets for identical assets and liabilities (Level 1 measurements) and the lowest priority to unobservable inputs (Level 3 measurements).

51
The following table sets forth assets and liabilities that were accounted for at fair value by level within the fair value hierarchy:
(in millions)
Assets at Fair ValueMoney market funds1
Derivative contracts2:ElectricityNatural gasCRRsTolling
Subtotal of derivative contractsLong-term disability planNuclear decommissioning trusts:
Stocks3
Municipal bondsU.S. government and agency securitiesCorporate bonds4
Short-term investments, primarily cash equivalents5
Subtotal of nuclear decommissioningtrusts
Total assets6
Liabilities at Fair ValueDerivative contracts:
ElectricityNatural gasTolling
Subtotal of derivative contractsTotal liabilitiesNet assets (liabilities)
December 31, 2011
Level 1
$ 21
—————8
1,899—
433—
—
2,3322,361
—————
$ 2,361
Level 2
$ —
—5
——5
—
—756147317
15
1,2351,240
5234—
239239
$ 1,001
Level 3
$ —
1—
12210
133—
————
—
—133
6523
799887887
$ (754)
Netting andCollateral
$ —
—(3)——(3)—
————
—
—(3)
(2)(53)—
(55)(55)
$ 52
Total
$ 21
12
12210
1358
1,899756580317
15
3,5673,731
68204799
1,0711,071
$ 2,660

52
(in millions)Assets at Fair Value
Money market funds1
Derivative contracts2:ElectricityNatural gasCRRsTolling
Subtotal of derivative contractsLong-term disability planNuclear decommissioning trusts:
Stocks3
Municipal bondsCorporate bonds4
U.S. government and agency securitiesShort-term investments, primarily cash
equivalents5
Subtotal of nuclear decommissioningtrusts
Total assets6
Liabilities at Fair ValueDerivative contracts:
ElectricityNatural gasTolling
Subtotal of derivative contractsTotal liabilitiesNet assets
December 31, 2010Level 1
$ 243
—————9
2,029
——
215
1
2,2452,497
—————
$ 2,497
Level 2
$ —
—69——69—
—
79034673
31
1,2401,309
1285—
286286
$ 1,023
Level 3
$ —
11911
137118385—
————
—
—385
2411
344379379
$ 6
Collateral
$ —
——————
————
—
——
—(4)—(4)(4)
$ 4
Total
$ 243
11980
137118454
9
2,029790346288
32
3,4854,191
25292344661661
$ 3,530
1 Money market funds are included in cash and cash equivalents on SCE's consolidated balance sheets.2 Represents the netting of assets and liabilities under master netting agreements and cash collateral across the levels of the fair value
hierarchy. Netting among positions classified within the same level is included in that level.3 Approximately 70% and 67% of the equity investments were located in the United States at December 31, 2011 and 2010,
respectively.4 At December 31, 2011 and 2010, corporate bonds were diversified and included collateralized mortgage obligations and other asset
backed securities of $22 million and $27 million, respectively. 5 Excludes net receivables of $25 million and net liabilities of $5 million at December 31, 2011 and 2010, respectively, of interest and
dividend receivables and receivables related to pending securities sales and payables related to pending securities purchases.6 Excludes $31 million at both December 31, 2011 and 2010, of cash surrender value of life insurance investments for deferred
compensation.

53
The following table sets forth a summary of changes in the fair value of Level 3 assets and liabilities:
(in millions)Fair value of derivative contracts, net liabilities at beginning of periodTotal realized/unrealized gains (losses), net:
Included in regulatory assets1
PurchasesSettlementsTransfers into Level 3Transfers out of Level 3Fair value of derivative contracts, net assets (liabilities) at end of periodChange during the period in unrealized gains (losses) related to assets and liabilities
held at the end of period
December 31,2011
$ 6
(806)47(1)——
$ (754)
$ (789)
2010$ (111)
58385
—16
$ 6
$ 130
1 Due to regulatory mechanisms, SCE's realized and unrealized gains and losses are recorded as regulatory assets and liabilities.
SCE determines the fair value for transfers in and transfers out of each level at the end of each reporting period. There were no significant transfers between levels during 2011 and 2010.
Valuation Techniques Used to Determine Fair Value
Level 1
Includes financial assets and liabilities where fair value is determined using unadjusted quoted prices in active markets that are available at the measurement date for identical assets and liabilities. Financial assets and liabilities classified as Level 1 include exchange-traded equity securities, exchange traded derivatives, U.S. treasury securities and money market funds.
Level 2
Pricing inputs include quoted prices for similar assets and liabilities in active markets and inputs that are observable for the asset or liability, either directly or indirectly, for substantially the full term of the derivative instrument. Financial assets and liabilities utilizing Level 2 inputs include fixed-income securities and over-the-counter derivatives.
Derivative contracts that are over-the-counter traded are valued using pricing models to determine the net present value of estimated future cash flows and are generally classified as Level 2. Inputs to the pricing models include forward published or posted clearing prices from exchanges (New York Mercantile Exchange and Intercontinental Exchange) for similar instruments and discount rates. A primary source that best represents traded activity for each market is used to develop observable forward market prices in determining the fair value of these positions. Broker quotes or prices from exchanges are used to validate and corroborate the primary source. These price quotations reflect mid-market prices (average of bid and ask) and are obtained from sources believed to provide the most liquid market for the commodity. Broker quotes are incorporated when corroborated with other information which may include a combination of prices from exchanges, other brokers and comparison to executed trades.
Level 3
Includes financial assets and liabilities where fair value is determined using techniques that require significant unobservable inputs. Over-the-counter options, bilateral contracts, capacity contracts, QF contracts, derivative contracts that trade infrequently (such as congestion revenue rights ("CRRs") in the California market and over-the-counter derivatives at illiquid locations), long-term power agreements, and derivative contracts with counterparties that have significant nonperformance risks are generally valued using pricing models that incorporate unobservable inputs and are classified as Level 3. Assumptions are made in order to value derivative contracts in which observable inputs are not available. In circumstances where SCE cannot verify fair value with observable market transactions, it is possible that a different valuation model could produce a materially different estimate of fair value. As markets continue to develop and more pricing information becomes available, SCE continues to assess valuation methodologies used to determine fair value.
For derivative contracts that trade infrequently (CRRs), changes in fair value are based on models forecasting the value of those contracts. The models' inputs are reviewed and the fair value is adjusted when it is concluded that a change in inputs would result in a new valuation that better reflects the fair value of those derivative contracts. For illiquid long-term power agreements, fair value is based upon the discounting of future electricity and natural gas prices derived from a proprietary

54
model using the risk free discount rate for a similar duration contract, adjusted for credit risk and market liquidity. Changes in fair value are based on changes to forward market prices, including forecasted prices for illiquid forward periods. The fair value of the majority of SCE's derivatives that are classified as Level 3 is determined using uncorroborated non-binding broker quotes and models which may require SCE to extrapolate short-term observable inputs in order to calculate fair value. Broker quotes are obtained from several brokers and compared against each other for reasonableness.
Nonperformance Risk
The fair value of the derivative assets and liabilities are adjusted for nonperformance risk. To assess nonperformance risks, SCE considers the probability of and the estimated loss incurred if a party to the transaction were to default. SCE also considers collateral, netting agreements, guarantees and other forms of credit support when assessing nonperformance. The nonperformance risk adjustment represented an insignificant amount at both December 31, 2011 and 2010.
Nuclear Decommissioning Trusts
SCE's nuclear decommissioning trust investments include equity securities, U.S. treasury securities and other fixed-income securities. Equity and treasury securities are classified as Level 1 as fair value is determined by observable market prices in active or highly liquid and transparent markets. The remaining fixed-income securities are classified as Level 2. The fair value of these financial instruments is based on evaluated prices that reflect significant observable market information such as reported trades, actual trade information of similar securities, benchmark yields, broker/dealer quotes, issuer spreads, bids, offers and relevant credit information.
SCE's investment policies and CPUC requirements place limitations on the types and investment grade ratings of the securities that may be held by the nuclear decommissioning trust funds. These policies restrict the trust funds from holding alternative investments and limit the trust funds' exposures to investments in highly illiquid markets. Except for Level 3 investments, valuation is based on observable market inputs and assumptions used by market participants. With respect to equity and fixed income securities, the trustee obtains prices from third-party pricing services which SCE is able to independently corroborate as described below. A primary price source is identified by the trustee based on asset type, class or issue for each security. The trustee monitors prices supplied by pricing services and may use a supplemental price source or change the primary price source of a given security if the trustee or SCE's investment managers challenge an assigned price and determine that another price source is considered to be preferable. The trustee “scrubs” prices against defined parameters at established times throughout the day. Variances that do not meet the parameters are researched and resolved. Unpriced and stale priced securities, as well as any unusual variations in market price or overall market value are investigated. Price variance reports are reviewed on the basis of predetermined tolerances. Variances identified outside of tolerance are then researched and resolved. Parameters and predetermined tolerance thresholds are established by asset class based on past experience and an understanding of valuation process techniques. Questionable prices are reported to the vendor who provided the price and pricing specialists then follow-up with the vendors. If the prices are validated, the primary price source is used. If not, a secondary source price which has passed the applicable tolerance check is used. The trustee monitors and grades the performance of pricing vendors. SCE reviewed the process/procedures of both the pricing services and the trustee to gain an understanding of the inputs/assumptions and valuation techniques used to price each asset type/class and to reach a conclusion that their pricing controls are satisfactory. This consisted of SCE's review of their written detailed process/procedures and service organization control (SOC 1-formerly SAS 70) reports, as well as follow-up conversations based on our written questions. This assists SCE in determining if the valuations represent exit price fair value and that investments are appropriately classified in the fair value hierarchy. Additionally, SCE corroborates the fair values of securities by comparison to other market-based price sources obtained by SCE's investment managers. Differences outside established thresholds are followed-up with the trustee and resolved. The results of this process have demonstrated that vendor and trustee pricing controls are satisfactory. For each reporting period, SCE reviews the trustee determined fair value hierarchy and overrides the trustee level classification when appropriate. Due to its regulatory treatment, SCE's fair value transactions are recovered in rates.
Fair Value of Long-Term Debt Recorded at Carrying Value
The carrying value and fair value of long-term debt are:
(in millions)
Long-term debt, including current portion
December 31,2011
CarryingAmount
$ 8,431
FairValue
$ 10,129
2010CarryingAmount
$ 7,627
FairValue
$ 8,285

55
Fair values of long-term debt are based on evaluated prices that reflect significant observable market information such as reported trades, actual trade information of similar securities, benchmark yields, broker/dealer quotes of new issue prices and relevant credit information. The fair value of long-term debt is classified as Level 2.
The carrying value of trade receivables, payables and short-term debt approximates fair value.
Note 5. Debt and Credit Agreements
Long-Term Debt
The following table summarizes long-term debt (rates and terms are as of December 31, 2011):
(in millions)
First and refunding mortgage bonds:2014 – 2041 (3.875% to 6.05% and floating)
Pollution-control bonds:2028 – 2035 (2.875% to 5.0% and variable)
Bonds repurchasedDebentures and notes:
2029 – 2053 (5.06% to 6.65%)Unamortized debt discount – netTotal
December 31,2011
$ 7,375
939(161)
307(29)
$ 8,431
2010
$ 6,475
1,196(324)
307(27)
$ 7,627
Long-term debt maturities for the next five years are: 2012 – zero; 2013 – zero; 2014 – $1.2 billion; 2015 – $300 million; and 2016 – $400 million.
Liens and Security Interests
Almost all SCE properties are subject to a trust indenture lien. SCE has pledged first and refunding mortgage bonds as collateral for borrowed funds obtained from certain pollution-control bonds issued by government agencies. SCE has a debt covenant that requires a debt to total capitalization ratio be met. At December 31, 2011, SCE was in compliance with this debt covenant.
Credit Agreements and Short-Term Debt
SCE has two revolving credit facilities with various banks; a $2.4 billion five-year credit facility that matures in February 2013, and a $500 million three-year credit facility that matures in March 2013. Commercial paper issued under these credit facilities are generally used to finance fuel inventories, balancing accounts undercollections and general, temporary cash requirements including power purchase payments. At December 31, 2011, the outstanding commercial paper was $419 million at a weighted-average interest rate of 0.44%. At December 31, 2011, letters of credit issued under SCE's credit facilities aggregated $81 million and were scheduled to expire in twelve months or less.
The following table summarizes the status of SCE's credit facilities at December 31, 2011:
(in millions)
CommitmentOutstanding borrowings supported by credit facilitiesOutstanding letters of creditAmount available
CreditFacilities
$ 2,894(419)(81)
$ 2,394
Note 6. Derivative Instruments and Hedging Activities
SCE uses derivative financial instruments to manage exposure to commodity price risk. SCE manages these risks in part by entering into forward commodity transactions, including options, swaps and futures. SCE is exposed to credit loss in the event of nonperformance by counterparties. To mitigate credit risk from counterparties, master netting agreements are used
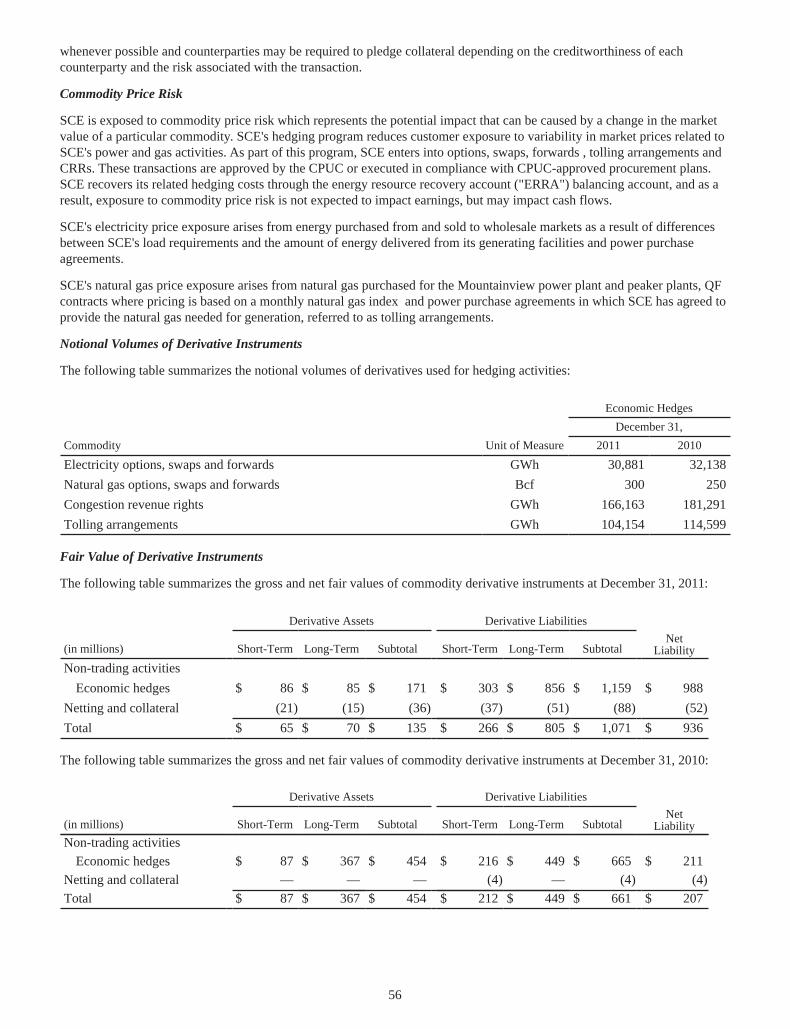
56
whenever possible and counterparties may be required to pledge collateral depending on the creditworthiness of each counterparty and the risk associated with the transaction.
Commodity Price Risk
SCE is exposed to commodity price risk which represents the potential impact that can be caused by a change in the market value of a particular commodity. SCE's hedging program reduces customer exposure to variability in market prices related to SCE's power and gas activities. As part of this program, SCE enters into options, swaps, forwards , tolling arrangements and CRRs. These transactions are approved by the CPUC or executed in compliance with CPUC-approved procurement plans. SCE recovers its related hedging costs through the energy resource recovery account ("ERRA") balancing account, and as a result, exposure to commodity price risk is not expected to impact earnings, but may impact cash flows.
SCE's electricity price exposure arises from energy purchased from and sold to wholesale markets as a result of differences between SCE's load requirements and the amount of energy delivered from its generating facilities and power purchase agreements.
SCE's natural gas price exposure arises from natural gas purchased for the Mountainview power plant and peaker plants, QF contracts where pricing is based on a monthly natural gas index and power purchase agreements in which SCE has agreed to provide the natural gas needed for generation, referred to as tolling arrangements.
Notional Volumes of Derivative Instruments
The following table summarizes the notional volumes of derivatives used for hedging activities:
CommodityElectricity options, swaps and forwardsNatural gas options, swaps and forwardsCongestion revenue rightsTolling arrangements
Unit of Measure
GWhBcf
GWhGWh
Economic HedgesDecember 31,
201130,881
300166,163104,154
2010
32,138250
181,291114,599
Fair Value of Derivative Instruments
The following table summarizes the gross and net fair values of commodity derivative instruments at December 31, 2011:
(in millions)
Non-trading activitiesEconomic hedges
Netting and collateralTotal
Derivative Assets
Short-Term
$ 86
(21)$ 65
Long-Term
$ 85
(15)$ 70
Subtotal
$ 171
(36)$ 135
Derivative Liabilities
Short-Term
$ 303
(37)$ 266
Long-Term
$ 856
(51)$ 805
Subtotal
$ 1,159
(88)$ 1,071
Net
Liability $ 988
(52)$ 936
The following table summarizes the gross and net fair values of commodity derivative instruments at December 31, 2010:
(in millions)Non-trading activities
Economic hedgesNetting and collateralTotal
Derivative Assets
Short-Term $ 87
—$ 87
Long-Term $ 367
—$ 367
Subtotal $ 454
—$ 454
Derivative Liabilities
Short-Term $ 216
(4)$ 212
Long-Term $ 449
—$ 449
Subtotal $ 665
(4)$ 661
Net
Liability $ 211
(4)$ 207

57
Income Statement Impact of Derivative Instruments
SCE recognizes realized gains and losses on derivative instruments as purchased power expense and expects that such gains or losses will be part of the purchase power costs recovered from customers. As a result, realized gains and losses are not reflected in earnings, but may temporarily affect cash flows. Due to expected future recovery from customers, unrealized gains and losses are recorded as regulatory assets and liabilities and therefore are also not reflected in earnings. The results of derivative activities and related regulatory offsets are recorded in cash flows from operating activities in the consolidated statements of cash flows.
The following table summarizes the components of economic hedging activity:
(in millions)
Realized gains/(losses)Unrealized gains/(losses)
Years ended December 31,
2011
$ (165)(768)
2010
$ (156)36
2009
$ (344)470
Contingent Features/Credit Related Exposure
Certain derivative instruments and power procurement contracts under SCE's power and natural gas hedging activities contain collateral requirements. SCE has historically provided collateral in the form of cash and/or letters of credit for the benefit of counterparties. These requirements can vary depending upon the level of unsecured credit extended by counterparties, changes in market prices relative to contractual commitments and other factors.
Certain of these power contracts contain a provision that requires SCE to maintain an investment grade credit rating from each of the major credit rating agencies, referred to as a credit-risk-related contingent feature. If SCE's credit rating were to fall below investment grade, SCE may be required to pay the derivative liability or post additional collateral. The aggregate fair value of all derivative liabilities with these credit-risk-related contingent features was $216 million and $67 million as of December 31, 2011 and 2010, respectively, for which SCE has posted no collateral and $4 million of collateral to its counterparties, for the respective periods. If the credit-risk-related contingent features underlying these agreements were triggered on December 31, 2011, SCE would be required to post $36 million of collateral.
Counterparty Default Risk Exposure
As part of SCE's procurement activities, SCE contracts with a number of utilities, energy companies, financial institutions, and other companies, collectively referred to as counterparties. If a counterparty were to default on its contractual obligations, SCE could be exposed to potentially volatile spot markets for buying replacement power or selling excess power. In addition, SCE would be exposed to the risk of non-payment of accounts receivable, primarily related to sales of excess energy and realized gains on derivative instruments. Substantially all of the contracts that SCE has executed with counterparties are either entered into under SCE's procurement plan which has been pre-approved by the CPUC, or the contracts are approved by the CPUC before becoming effective. As a result of regulatory recovery mechanisms, losses from non-performance are not expected to affect earnings, but may temporarily affect cash flows.
To manage credit risk, SCE looks at the risk of a potential default by counterparties. Credit risk is measured by the loss that would be incurred if counterparties failed to perform pursuant to the terms of their contractual obligations. To mitigate credit risk from counterparties, master netting agreements are used whenever possible and counterparties may be required to pledge collateral when deemed necessary.

58
Margin and Collateral Deposits
Margin and collateral deposits include cash deposited with counterparties and brokers as credit support under energy contracts. The amount of margin and collateral deposits generally varies based on changes in the fair value of the related positions. SCE nets counterparty receivables and payables where balances exist under master netting agreements. SCE
presents the portion of its margin and collateral deposits netted with its derivative positions on its consolidated balance sheets. The following table summarizes margin and collateral deposits provided to counterparties:
(in millions)
Collateral provided to counterparties:Offset against derivative liabilitiesReflected in other current assets
December 31,2011
$ 51
17
2010
$ 4
5
Note 7. Income Taxes
Current and Deferred Taxes
The components of income tax expense by location of taxing jurisdiction are:
(in millions)Current:FederalState
Deferred:FederalState
Total
Years ended December 31,2011
$ (275)
91(184)
75728
785$ 601
2010 $ (145)
(71)(216)
663
(7)656
$ 440
2009 $ (82)
17391
200(42)158
$ 249

59
The components of net accumulated deferred income tax liability are:
(in millions)
Deferred tax assets:Property and software relatedRegulatory balancing accountsUnrealized gains and lossesLoss and credit carryforwardsPensions and PBOPsOtherTotalDeferred tax liabilities:Property-relatedCapitalized software costsRegulatory balancing accountsUnrealized gains and lossesOtherTotalAccumulated deferred income tax liability – netClassification of accumulated deferred income taxes – net:Included in deferred credits and other liabilitiesIncluded in current liabilitiesIncluded in other current assets
December 31,2011
$ 728
8937415
173480
$ 1,859 $ 6,492
324301374238
$ 7,729$ 5,870 $ 5,781$ 89$ —
2010
$ 655
230389—
176490
$ 1,940 $ 5,520
293293389264
$ 6,759$ 4,819 $ 4,829$ —$ 10
As of December 31, 2011, SCE had $10 million of federal tax credit carryforwards, $2 million of which expire in 2030 and 2031 and the remainder has no expiration date. Additionally, SCE had $5 million of federal net operating loss carryforwards which expire in 2015.

60
Effective Tax Rate
The table below provides a reconciliation of income tax expense computed at the federal statutory income tax rate to the income tax provision from continuing operations.
(in millions)
Income from continuing operations before income taxesNet income attributable to noncontrolling interests in the Big 4 projectsAdjusted income from continuing operations before income taxesProvision for income tax at federal statutory rate of 35%Increase (decrease) in income tax from:
Items presented with related state income tax, netGlobal settlement related1
Change in tax accounting method for asset removal costs2
State tax – net of federal benefitHealth care legislation3
Property-relatedOther
Total income tax expense from continuing operationsEffective tax rate
Years ended December 31,2011
$ 1,745—
$ 1,745611
——80—
(76)(14)
$ 60134.4%
2010
$ 1,532—
$ 1,532536
(95)(40)5939
(47)(12)
$ 44028.7%
2009
$ 1,620(94)
$ 1,526534
(306)—67—
(64)18
$ 24916.3%
1 Edison International and the IRS finalized the terms of a Global Settlement on May 5, 2009. The Global Settlement resolved all of SCE's federal income tax disputes and affirmative claims through tax year 2002. During 2009, SCE recorded after-tax earnings of approximately $306 million. During 2010, SCE recognized a $95 million earnings benefit from the acceptance by the California Franchise Tax Board of the IRS tax positions finalized in 2009 and receipt of the final interest determination from the Franchise Tax Board.
2 During 2010, the IRS approved SCE's request to change its tax accounting method for asset removal costs primarily related to its infrastructure replacement program. As a result, SCE recognized a $40 million earnings benefit (of which $28 million relates to asset removal costs incurred prior to 2010) from deducting asset removal costs earlier in the construction cycle. These deductions were recorded on a flow-through basis as required by the CPUC.
3 During 2010, SCE recorded a $39 million non-cash charge to reverse previously recognized federal tax benefits eliminated by the federal health care legislation enacted in March 2010. The health care law eliminated the federal tax deduction for retiree health care costs to the extent those costs are eligible for federal Medicare Part D subsidies.
The CPUC requires flow-through ratemaking treatment for the current tax benefit arising from certain property-related and other temporary differences which reverse over time. The accounting treatment for these temporary differences results in recording regulatory assets and liabilities for amounts that would otherwise be recorded to deferred income tax expense.
Accounting for Uncertainty in Income Taxes
Authoritative guidance related to accounting for uncertainty in income taxes requires an enterprise to recognize, in its financial statements, the best estimate of the impact of a tax position by determining if the weight of the available evidence indicates it is more likely than not, based solely on the technical merits, that the position will be sustained upon examination. The guidance requires the disclosure of all unrecognized tax benefits, which includes both the reserves recorded for tax positions on filed tax returns and the unrecognized portion of affirmative claims.

61
Unrecognized Tax Benefits
The following table provides a reconciliation of unrecognized tax benefits:
(in millions)
Balance at January 1Tax positions taken during the current year
IncreasesTax positions taken during a prior year
IncreasesDecreases
Decreases for settlements during the periodBalance at December 31
2011
$ 329
34
82(72)—
$ 373
2010
$ 482
47
140(272)(68)
$ 329
2009
$ 2,066
14
200(212)
(1,586)$ 482
Unrecognized tax benefits were reduced by $68 million during 2010 related to the California Franchise Tax Board's acceptance of the federal Global Settlement as discussed above and $1.6 billion during 2009 primarily due to completion of the federal Global Settlement as discussed above.
As of December 31, 2011 and 2010, respectively, if recognized, $282 million and $225 million of the unrecognized tax benefits would impact the effective tax rate.
Edison International's federal income tax returns and its California combined franchise tax returns are currently open for years subsequent to 2002. In addition, specific California refund claims made by Edison International for years 1991 through 2002 are currently under review by the Franchise Tax Board. The IRS examination phase of tax years 2003 through 2006 was completed in the fourth quarter of 2010. This included a proposed adjustment to disallow a component of SCE's repair allowance deduction, which if sustained, would result in a federal tax payment of approximately $93 million, including interest through December 31, 2011. Edison International disagrees with the proposed adjustment and filed a protest with the IRS in the first quarter of 2011.
Accrued Interest and Penalties
The total amount of accrued interest and penalties related to SCE's income tax liabilities was $75 million and $61 million as of December 31, 2011 and 2010, respectively.
The net after-tax interest and penalties recognized in income tax expense was $8 million in 2011, compared to a benefit of $80 million and $279 million in 2010 and 2009, respectively.
Repair Deductions
In 2009, Edison International made a voluntary election to change its tax accounting method for certain repair costs incurred on SCE's transmission, distribution and generation assets. The change in tax accounting method resulted in a $192 million cash benefit realized in the fourth quarter of 2009. In August of 2011 the IRS issued guidance on repair deductions and changes in accounting method related to transmission and distribution assets. Based on this guidance, SCE will include a second change in tax accounting method in its 2011 tax return. SCE does not expect any cash impact in 2011 due to its current net operating loss position. Regulatory treatment for the incremental deductions taken after the voluntary election to change SCE's tax accounting method for certain repair costs will be addressed in SCE's 2012 GRC. Due to the pending regulatory decision, SCE has not recognized an earnings benefit or regulatory asset related to this method change and incremental deductions taken in 2009, 2010 and 2011.

62
Note 8. Compensation and Benefit Plans
Employee Savings Plan
SCE has a 401(k) defined contribution savings plan designed to supplement employees' retirement income. The plan received employer contributions of $83 million in 2011, $76 million in 2010 and $70 million in 2009.
Pension Plans and Postretirement Benefits Other Than Pensions
Pension Plans
Noncontributory defined benefit pension plans (some with cash balance features) cover most employees meeting minimum service requirements. SCE recognizes pension expense for its nonexecutive plan as calculated by the actuarial method used for ratemaking. The expected contributions (all by the employer) are approximately $263 million for the year ending December 31, 2012. Annual contributions made to most of SCE's pension plans are currently recovered through CPUC-approved regulatory mechanisms. Annual contributions to these plans are expected to be, at a minimum, equal to the related annual expense.
The funded position of SCE's pension is very sensitive to changes in market conditions. Changes in overall interest rate levels significantly affect the company's liabilities, while assets held in the various trusts established to fund SCE's long-term pension are affected by movements in the equity and bond markets. The market value of the investments (reflecting investment returns, contributions and benefit payments) within the plan trusts declined 35% during 2008. This reduction in value of plan assets combined with increased liabilities has resulted in a change in the pension plan funding status from a surplus to a material deficit, which will result in increased future expense and cash contributions. The SCE pension remains underfunded as liabilities have increased significantly as a result of steady declines in interest rates. Due to SCE's regulatory recovery treatment, the unfunded status is offset by a regulatory asset. In the 2009 GRC, SCE requested recovery of and continued balancing account treatment for amounts contributed to these trusts. SCE requested the continuation of this approach in the 2012 GRC.

63
Information on plan assets and benefit obligations is shown below:
(in millions)
Change in projected benefit obligationProjected benefit obligation at beginning of yearService costInterest costAmendmentsActuarial lossBenefits paidProjected benefit obligation at end of yearChange in plan assetsFair value of plan assets at beginning of yearActual return on plan assetsEmployer contributionsBenefits paidFair value of plan assets at end of yearFunded status at end of yearAmounts recognized in the consolidated balance sheets consist of:Current liabilitiesLong-term liabilities
Amounts recognized in accumulated other comprehensive loss consist of:Net lossAmounts recognized as a regulatory asset:Prior service costNet loss
Total not yet recognized as expenseAccumulated benefit obligation at end of yearPension plans with an accumulated benefit obligation in excess of plan assets:
Projected benefit obligationAccumulated benefit obligationFair value of plan assets
Weighted-average assumptions used to determine obligations at end of year:Discount rateRate of compensation increase
Years endedDecember 31,
2011
$ 3,732
145192—
311(268)
$ 4,112 $ 3,066
58115
(268)$ 2,971$ (1,141) $ (6)
(1,135)$ (1,141) $ 41 $ 34
955$ 989$ 1,030$ 3,817 $ 4,112
3,8172,971
4.5%4.5%
2010
$ 3,389
132193
5185
(172)$ 3,732 $ 2,726
41498
(172)$ 3,066$ (666) $ (6)
(660)$ (666) $ 42 $ 40
500$ 540$ 582$ 3,436 $ 3,732
3,4363,066
5.25%5.0%

64
Expense components and other amounts recognized in other comprehensive income:
Expense components are:
(in millions)
Service costInterest costExpected return on plan assetsAmortization of prior service costAmortization of net lossExpense under accounting standardsRegulatory adjustment – deferredTotal expense recognized
Years ended December 31,
2011
$ 145192
(225)7
22$ 141
(28)$ 113
2010
$ 132193
(201)8
17$ 149
(52)$ 97
2009
$ 107191
(162)1154
$ 201(94)
$ 107
Other changes in plan assets and benefit obligations recognized in other comprehensive income:
(in millions)
Net lossAmortization of net lossTotal recognized in other comprehensive lossTotal recognized in expense and other comprehensive income
Years ended December 31,
2011
$ 8(7)
$ 1$ 114
2010
$ 15(4)
$ 11$ 108
2009
$ 11(4)
$ 7$ 114
In accordance with authoritative guidance on rate-regulated enterprises, SCE records regulatory assets and liabilities instead of charges and credits to other comprehensive income (loss) for the portion of its postretirement benefit plans that are recoverable in utility rates. The estimated net loss and prior service cost that will be amortized to expense in 2012 are $57 million and $3 million, respectively; $7 million of the net loss is expected to be reclassified from accumulated other comprehensive loss.
The following are weighted-average assumptions used to determine expense:
Discount rateRate of compensation increaseExpected return on plan assets
Years ended December 31,
2011
5.25%5.0%7.5%
2010
6.0%5.0%7.5%
2009
6.25%5.0%7.5%
The following benefit payments, which reflect expected future service, are expected to be paid:
(in millions)
201220132014201520162017 – 2021
Years endedDecember 31,$ 285
291296307313
1,590
65
Postretirement Benefits Other Than Pensions
Most non-union employees retiring at or after age 55 with at least 10 years of service may be eligible for postretirement medical, dental, vision and life insurance and other benefits. Eligibility for a company contribution toward the cost of these benefits in retirement depends on a number of factors, including the employee's hire date. The expected contributions (all by the employer) to the PBOP trust are $62 million for the year ending December 31, 2012. Annual contributions made to SCE plans are currently recovered through CPUC-approved regulatory mechanisms and are expected to be, at a minimum, equal to the total annual expense for these plans.
The funded position of SCE's PBOP is very sensitive to changes in market conditions. Changes in overall interest rate levels significantly affect the company's liabilities, while assets held in the various trusts established to fund SCE's other postretirement benefits are affected by movements in the equity and bond markets. The market value of the investments (reflecting investment returns, contributions and benefit payments) within the plan trust declined 33% during 2008. This reduction in the value of plan assets resulted in an increase in the plan's underfunded status and will also result in increased future expense and increased future contributions. SCE's PBOP is underfunded as liabilities have increased significantly as a result of steady declines in interest rates. Due to SCE's regulatory recovery treatment, the unfunded status is offset by a regulatory asset. In the 2009 GRC, SCE requested recovery of and continued balancing account treatment for amounts contributed to this trust. SCE requested the continuation of this approach in the 2012 GRC.

66
Information on plan assets and benefit obligations is shown below:
(in millions)
Change in benefit obligationBenefit obligation at beginning of year
Service costInterest costAmendmentsActuarial lossPlan participants' contributionsMedicare Part D subsidy receivedBenefits paid
Benefit obligation at end of yearChange in plan assetsFair value of plan assets at beginning of year
Actual return on assetsEmployer contributionsPlan participants' contributionsMedicare Part D subsidy receivedBenefits paid
Fair value of plan assets at end of yearFunded status at end of yearAmounts recognized in the consolidated balance sheets consist of:Current liabilitiesLong-term liabilities
Amounts recognized as a regulatory asset (liability):Prior service creditNet loss
Total not yet recognized as expenseWeighted-average assumptions used to determine obligations at end of year:
Discount rateAssumed health care cost trend rates:Rate assumed for following yearUltimate rateYear ultimate rate reached
Years endedDecember 31,
2011
$ 2,295
40114—46185
(103)$ 2,415 $ 1,606
1034185
(103)$ 1,570$ (845) $ (16)
(829)$ (845) $ (125)
839$ 714
4.75%
9.5%5.25%2019
2010
$ 2,011
3412112
203175
(108)$ 2,295 $ 1,459
17558175
(108)$ 1,606$ (689) $ (17)
(672)$ (689) $ (161)
718$ 557
5.5%
9.75%5.5%2019
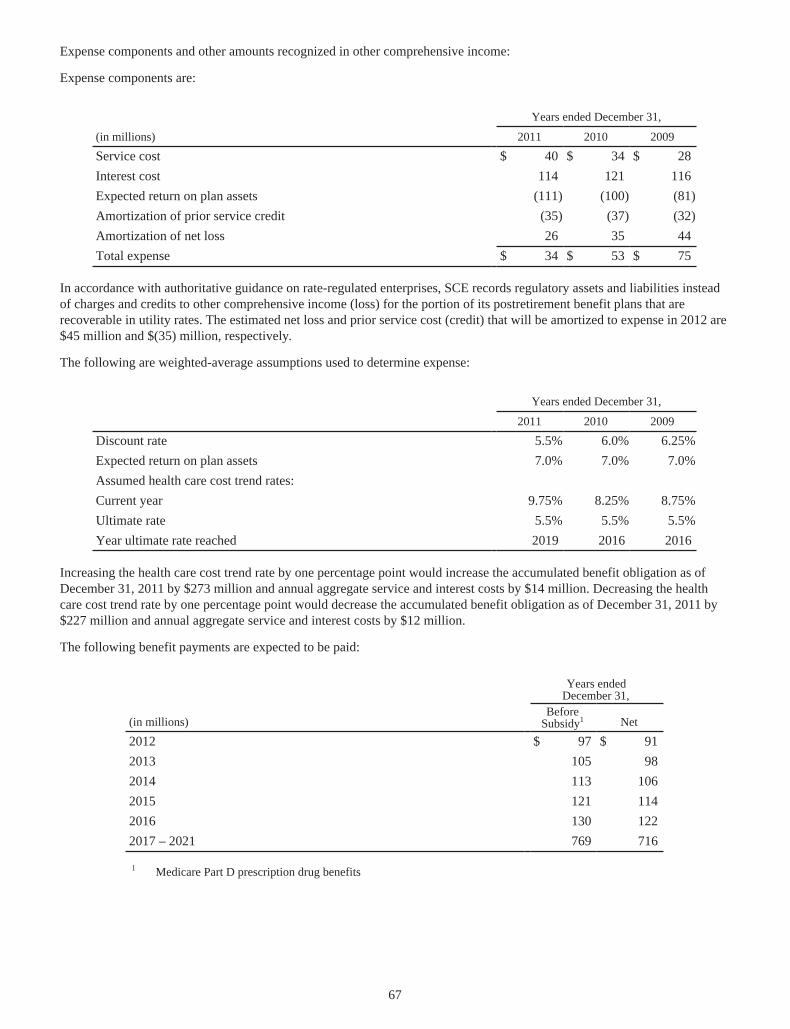
67
Expense components and other amounts recognized in other comprehensive income:
Expense components are:
(in millions)
Service costInterest costExpected return on plan assetsAmortization of prior service creditAmortization of net lossTotal expense
Years ended December 31,
2011
$ 40114
(111)(35)26
$ 34
2010
$ 34121
(100)(37)35
$ 53
2009
$ 28116(81)(32)44
$ 75
In accordance with authoritative guidance on rate-regulated enterprises, SCE records regulatory assets and liabilities instead of charges and credits to other comprehensive income (loss) for the portion of its postretirement benefit plans that are recoverable in utility rates. The estimated net loss and prior service cost (credit) that will be amortized to expense in 2012 are $45 million and $(35) million, respectively.
The following are weighted-average assumptions used to determine expense:
Discount rateExpected return on plan assetsAssumed health care cost trend rates:Current yearUltimate rateYear ultimate rate reached
Years ended December 31,
2011
5.5%7.0%
9.75%5.5%2019
2010
6.0%7.0%
8.25%5.5%2016
2009
6.25%7.0%
8.75%5.5%2016
Increasing the health care cost trend rate by one percentage point would increase the accumulated benefit obligation as of December 31, 2011 by $273 million and annual aggregate service and interest costs by $14 million. Decreasing the health care cost trend rate by one percentage point would decrease the accumulated benefit obligation as of December 31, 2011 by $227 million and annual aggregate service and interest costs by $12 million.
The following benefit payments are expected to be paid:
(in millions)
201220132014201520162017 – 2021
Years endedDecember 31,
BeforeSubsidy1
$ 97105113121130769
Net
$ 9198
106114122716
1 Medicare Part D prescription drug benefits

68
Plan Assets
Description of Pension and Postretirement Benefits Other than Pensions Investment Strategies
The investment of plan assets is overseen by a fiduciary investment committee. Plan assets are invested using a combination of asset classes, and may have active and passive investment strategies within asset classes. Target allocations for pension plan assets are 30% for U.S. equities, 16% for non-U.S. equities, 35% for fixed income, 15% for opportunistic and/or alternative investments and 4% for other investments. Target allocations for PBOP plan assets are 41% for U.S. equities, 17% for non-U.S. equities, 34% for fixed income, 7% for opportunistic and/or alternative investments, and 1% for other investments. Edison International employs multiple investment management firms. Investment managers within each asset class cover a range of investment styles and approaches. Risk is managed through diversification among multiple asset classes, managers, styles and securities. Plan, asset class and individual manager performance is measured against targets. Edison International also monitors the stability of its investment managers' organizations.
Allowable investment types include:
• United States Equities: Common and preferred stocks of large, medium, and small companies which are predominantly United States-based.
• Non-United States Equities: Equity securities issued by companies domiciled outside the United States and in depository receipts which represent ownership of securities of non-United States companies.
• Fixed Income: Fixed income securities issued or guaranteed by the United States government, non-United States governments, government agencies and instrumentalities including municipal bonds, mortgage backed securities and corporate debt obligations. A portion of the fixed income positions may be held in debt securities that are below investment grade.
Opportunistic, Alternative and Other Investments:
• Opportunistic: Investments in short to intermediate term market opportunities. Investments may have fixed income and/or equity characteristics and may be either liquid or illiquid.
• Alternative: Limited partnerships that invest in non-publicly traded entities.
• Other: Investments diversified among multiple asset classes such as global equity, fixed income currency and commodities markets. Investments are made in liquid instruments within and across markets. The investment returns are expected to approximate the plans' expected investment returns.
Asset class portfolio weights are permitted to range within plus or minus 3%. Where approved by the fiduciary investment committee, futures contracts are used for portfolio rebalancing and to reallocate portfolio cash positions. Where authorized, a few of the plans' investment managers employ limited use of derivatives, including futures contracts, options, options on futures and interest rate swaps in place of direct investment in securities to gain efficient exposure to markets. Derivatives are not used to leverage the plans or any portfolios.
Determination of the Expected Long-Term Rate of Return on Assets
The overall expected long-term rate of return on assets assumption is based on the long-term target asset allocation for plan assets and capital markets return forecasts for asset classes employed. A portion of the PBOP trust asset returns are subject to taxation, so the expected long-term rate of return for these assets is determined on an after-tax basis.
Capital Markets Return Forecasts
Our capital markets return forecast methodologies primarily use a combination of historical market data, current market conditions, proprietary forecasting expertise, complex models to develop asset class return forecasts and a building block approach. The forecasts are developed using variables such as real risk-free interest, inflation, and asset class specific risk premiums. For equities, the risk premium is based on an assumed average equity risk premium of 6% over cash. The forecasted return on private equity and opportunistic investments are estimated at a 3% premium above public equity, reflecting a premium for higher volatility and liquidity. For fixed income, the risk premium is based off of a comprehensive modeling of credit spreads.

69
Fair Value of Plan Assets
The PBOP Plan and the Southern California Edison Company Retirement Plan Trust (Master Trust) assets include investments in equity securities, U.S. treasury securities, other fixed-income securities, common/collective funds, mutual funds, other investment entities, foreign exchange and interest rate contracts, and partnership/joint ventures. Equity securities, U.S. treasury securities, mutual and money market funds are classified as Level 1 as fair value is determined by observable, unadjusted quoted market prices in active or highly liquid and transparent markets. Common/collective funds are valued at the net asset value ("NAV") of shares held. Although common/collective funds are determined by observable prices, they are classified as Level 2 because they trade in markets that are less active and transparent. The fair value of the underlying investments in equity mutual funds and equity common/collective funds are based upon stock-exchange prices. The fair value of the underlying investments in fixed-income common/collective funds, fixed-income mutual funds and other fixed income securities including municipal bonds are based on evaluated prices that reflect significant observable market information such as reported trades, actual trade information of similar securities, benchmark yields, broker/dealer quotes, issuer spreads, bids, offers and relevant credit information. Foreign exchange and interest rate contracts are classified as Level 2 because the values are based on observable prices but are not traded on an exchange. Futures contracts trade on an exchange and therefore are classified as Level 1. One of the partnerships is classified as Level 2 since this investment can be readily redeemed at NAV and the underlying investments are liquid, publicly traded fixed-income securities which have observable prices. The remaining partnerships/joint ventures are classified as Level 3 because fair value is determined primarily based upon management estimates of future cash flows. Other investment entities are valued similarly to common collective funds and are therefore classified as Level 2. The Level 1 registered investment companies are either mutual or money market funds. The remaining funds in this category are readily redeemable at NAV and classified as Level 2 and are discussed further at footnote 7 to the pension plan master trust investments table below.
SCE reviews the process/procedures of both the pricing services and the trustee to gain an understanding of the inputs/assumptions and valuation techniques used to price each asset type/class. The trustee and SCE's validation procedures for pension and PBOP equity and fixed income securities are the same as the nuclear decommissioning trusts. For further discussion see Note 4. The values of Level 1 mutual and money market funds are publicly quoted. The trustees obtain the values of common/collective and other investment funds from the fund managers. The values of partnerships are based on partnership valuation statements updated for cash flows. SCE's investment managers corroborate the trustee fair values.
Pension Plan
The following table sets forth the Master Trust investments that were accounted for at fair value as of December 31, 2011 by asset class and level within the fair value hierarchy:
(in millions)
Corporate stocks1
Partnerships/joint ventures2
Common/collective funds3
Corporate bonds4
U.S. government and agency securities5
Other investment entities6
Registered investment companies7
Interest-bearing cashOtherTotalReceivables and payables, netNet plan assets available for benefitsSCE's share of net plan assets
Level 1
$ 642———
104—795
(1)$ 829
Level 2
$ —14058249735124729—69
$ 1,915
Level 3
$ —448———————
$ 448
Total
$ 642588582497455247108
568
$ 3,192(39)
$ 3,153$ 2,971

70
The following table sets forth the Master Trust investments that were accounted for at fair value as of December 31, 2010 by asset class and level within the fair value hierarchy:
(in millions)
Corporate stocks1
Partnerships/joint ventures2
Common/collective funds3
Corporate bonds4
U.S. government and agency securities5
Other investment entities6
Registered investment companies7
Interest-bearing cashOtherTotalReceivables and payables, netNet plan assets available for benefitsSCE's share of net plan assets
Level 1
$ 786———84—8452
$ 961
Level 2
$ —15560055531623692—30
$ 1,984
Level 3
$ —345———————
$ 345
Total
$ 786500600555400236176
532
$ 3,290(55)
$ 3,235$ 3,066
1 Corporate stocks are diversified. For 2011 and 2010, respectively, performance is primarily benchmarked against the Russell Indexes (60% and 63%) and Morgan Stanley Capital International (MSCI) index (40% and 37%).
2 Partnerships/joint venture Level 2 investments consist primarily of a partnership which invests in publicly traded fixed income securities, primarily from the banking and finance industry and U.S. government agencies. At December 31, 2011 and 2010, respectively, approximately 55% and 60% of the Level 3 partnerships are invested in (1) asset backed securities, including distressed mortgages and (2) commercial and residential loans and debt and equity of banks. The remaining Level 3 partnerships are invested in small private equity and venture capital funds. Investment strategies for these funds include branded consumer products, early stage technology, California geographic focus, and diversified US and non-US fund-of-funds.
3 At December 31, 2011 and 2010, respectively, the common/collective assets were invested in equity index funds that seek to track performance of the Standard and Poor's (S&P 500) Index (29% and 29%), Russell 200 and Russell 1000 indexes (27% and 28%) and the MSCI Europe, Australasia and Far East (EAFE) Index (10% and 11%). A non-index U.S. equity fund representing 23% of this category for both 2011 and 2010 is actively managed. Another fund representing 8% of this category for both 2011 and 2010 is a global asset allocation fund.
4 Corporate bonds are diversified. At December 31, 2011 and 2010, respectively, this category includes $53 million and $65 million for collateralized mortgage obligations and other asset backed securities of which $10 million and $17 million are below investment grade.
5 Level 1 U.S. government and agency securities are U.S. treasury bonds and notes. Level 2 primarily relates to the Federal National Mortgage Association and the Federal Home Loan Mortgage Corporation.
6 Other investment entities were primarily invested in (1) emerging market equity securities, (2) a hedge fund that invests through liquid instruments in a global diversified portfolio of equity, fixed income, interest rate, foreign currency and commodities markets, and (3) domestic mortgage backed securities.
7 Level 1 of registered investment companies consisted of a global equity mutual fund which seeks to outperform the MSCI World Total Return Index. Level 2 primarily consisted of short-term, emerging market, high yield bond funds and government inflation-indexed bonds.
At both December 31, 2011 and 2010, approximately 69% of the publicly traded equity investments, including equities in the common/collective funds, were located in the United States.

71
The following table sets forth a summary of changes in the fair value of Level 3 investments for 2011 and 2010:
(in millions)
Fair value, net at beginning of periodActual return on plan assets:
Relating to assets still held at end of periodRelating to assets sold during the period
PurchasesDispositionsTransfers in and /or out of Level 3Fair value, net at end of period
2011
$ 345
622
130(55)—
$ 448
2010
$ 240
4224
108(69)—
$ 345
Postretirement Benefits Other than Pensions
The following table sets forth the PBOP Plan's financial assets that were accounted for at fair value as of December 31, 2011 by asset class and level within the fair value hierarchy:
(in millions)
Common/collective funds1
Corporate stocks2
Corporate notes and bonds3
Partnerships4
U.S. government and agency securities5
Registered investment companies6
Interest bearing cashOther7
TotalReceivables and payables, netCombined net plan assets available for benefits
Level 1
$ —319——
10080124
$ 515
Level 2
$ 642—
1771642——71
$ 948
Level 3
$ ———
130————
$ 130
Total
$ 642319177146142801275
$ 1,593(23)
$ 1,570

72
The following table sets forth the PBOP Plan's financial assets that were accounted for at fair value as of December 31, 2010 by asset class and level within the fair value hierarchy:
(in millions)
Common/collective funds1
Corporate stocks2
Corporate notes and bonds3
Partnerships4
U.S. government and agency securities5
Registered investment companies6
Interest bearing cashOther7
TotalReceivables and payables, netCombined net plan assets available for benefits
Level 1
$ —344——50
144124
$ 554
Level 2
$ 657—
18416381
—76
$ 972
Level 3
$ ———92————
$ 92
Total
$ 65734418410888
1451280
$ 1,618(12)
$ 1,606
1 At December 31, 2011 and 2010, respectively, 63% and 61% of the common/collective assets are invested in a large cap index fund which seeks to track performance of the Russell 1000 index. 21% and 23% of the assets in this category are in index funds which seek to track performance in the MSCI Europe, Australasia and Far East (EAFE) Index. 6% and 7% of this category are invested in a privately managed bond fund and 6% and 6% in a fund which invests in equity securities the fund manager believes are undervalued.
2 Corporate stock performance is primarily benchmarked against the Russell Indexes (53% and 54%) and the MSCI All Country World (ACWI) index (47% and 46%) for 2011 and 2010, respectively.
3 Corporate notes and bonds are diversified and include approximately $14 million and $15 million for commercial collateralized mortgage obligations and other asset backed securities at December 31, 2011 and 2010, respectively.
4 At December 31, 2011 and 2010, respectively, 81% and 84% of the Level 3 partnerships category is invested in (1) asset backed securities including distressed mortgages, (2) distressed companies and (3) commercial and residential loans and debt and equity of banks.
5 Level 1 U.S. government and agency securities are U.S. treasury bonds and notes. Level 2 primarily relates to the Federal Home Loan Mortgage Corporation and the Federal National Mortgage Association.
6 Level 1 registered investment companies consist of an investment grade corporate bond mutual fund and a money market fund.7 Other includes $60 million and $64 million of municipal securities at December 31, 2011 and 2010, respectively.
At December 31, 2011 and 2010, approximately 69% and 67%, respectively, of the publicly traded equity investments, including equities in the common/collective funds, were located in the United States.
The following table sets forth a summary of changes in the fair value of PBOP Level 3 investments for 2011 and 2010:
(in millions)
Fair value, net at beginning of periodActual return on plan assets
Relating to assets still held at end of periodRelating to assets sold during the period
PurchasesDispositionsTransfers in and /or out of Level 3Fair value, net at end of period
2011
$ 92
(3)6
48(13)—
$ 130
2010
$ 49
14—46
(17)—
$ 92

73
Stock-Based Compensation
Edison International maintains a shareholder approved incentive plan (the 2007 Performance Incentive Plan) that includes stock-based compensation. The maximum number of shares of Edison International's common stock authorized to be issued or transferred pursuant to awards under the 2007 Performance Incentive Plan, as amended in 2009 and 2011, is 49.5 million shares, plus the number of any shares subject to awards issued under Edison International's prior plans and outstanding as of April 26, 2007, which expire, cancel or terminate without being exercised or shares being issued ("carry-over shares"). As of December 31, 2011, Edison International had approximately 30 million shares remaining for future issuance under its stock-based compensation plans.
Stock Options
Under various plans, Edison International has granted stock options at exercise prices equal to the average of the high and low price and, beginning in 2007, at the closing price at the grant date. Edison International may grant stock options and other awards related to or with a value derived from its common stock to directors and certain employees. Options generally expire 10 years after the grant date and vest over a period of four years of continuous service, with expense recognized evenly over the requisite service period, except for awards granted to retirement-eligible participants, as discussed in "Stock-Based Compensation" in Note 1.
Stock options granted in 2003 through 2006 accrue dividend equivalents for the first five years of the option term. Stock options granted in 2007 and later have no dividend equivalent rights except for options granted to Edison International's Board of Directors in 2007. Unless transferred to nonqualified deferral plan accounts, dividend equivalents accumulate without interest. Dividend equivalents are paid in cash after the vesting date. Edison International has discretion to pay certain dividend equivalents in shares of Edison International common stock. Additionally, Edison International will substitute cash awards to the extent necessary to pay tax withholding or any government levies.
The fair value for each option granted was determined as of the grant date using the Black-Scholes option-pricing model. The Black-Scholes option-pricing model requires various assumptions noted in the following table:
Expected terms (in years)Risk-free interest rateExpected dividend yieldWeighted-average expected dividend yieldExpected volatilityWeighted-average volatility
Years ended December 31,
2011
7.01.4% – 3.1%3.1% – 3.5%
3.4%18.2% – 19.0%
18.9%
2010
7.32.0% – 3.2%3.3% – 4.0%
3.8%18.8% – 19.8%
19.8%
2009
7.42.8% – 3.5%3.6% – 5.0%
4.9%20% – 21%
20.6%
The expected term represents the period of time for which the options are expected to be outstanding and is primarily based on historical exercise and post-vesting cancellation experience and stock price history. The risk-free interest rate for periods within the contractual life of the option is based on a zero coupon U.S. Treasury issued STRIPS (separate trading of registered interest and principal of securities) whose maturity equals the option's expected term on the measurement date. Expected volatility is based on the historical volatility of Edison International's common stock for the length of the option's expected term for 2011. The volatility period used was 84 months, 87 months and 84 months at December 31, 2011, 2010 and 2009, respectively.

74
The following is a summary of the status of Edison International stock options granted to SCE employees:
Outstanding at December 31, 2010GrantedExpiredForfeitedExercisedAffiliate transfers – netOutstanding at December 31, 2011Vested and expected to vest at December 31, 2011Exercisable at December 31, 2011
StockOptions
10,064,7361,909,443
(95,170)(296,680)
(1,166,076)110,287
10,526,54010,272,9695,781,567
Weighted-Average
ExercisePrice
$ 32.8638.0949.6533.5924.0331.9834.6034.6235.20
RemainingContractual
Term(Years)
6.015.964.36
AggregateIntrinsic
Value (in millions)
$ 86$ 50
At December 31, 2011, there was $10 million of total unrecognized compensation cost related to stock options, net of expected forfeitures. That cost is expected to be recognized over a weighted-average period of approximately two years.
Performance Shares
A target number of contingent performance shares were awarded to executives in March 2009, March 2010 and March 2011, and vest at the end of December 2011, 2012 and 2013, respectively. Performance shares awarded contain dividend equivalent reinvestment rights. An additional number of target contingent performance shares will be credited based on dividends on Edison International common stock for which the ex-dividend date falls within the performance period. The vesting of Edison International's performance shares is dependent upon a market condition and three years of continuous service subject to a prorated adjustment for employees who are terminated under certain circumstances or retire, but payment cannot be accelerated. The market condition is based on Edison International's total shareholder return relative to the total shareholder return of a specified group of peer companies at the end of a three-calendar-year period. The number of performance shares earned is determined based on Edison International's ranking among these companies. Performance shares earned are settled half in cash and half in common stock; however, Edison International has discretion under certain of the awards to pay the half subject to cash settlement in common stock. Edison International also has discretion to pay certain dividend equivalents in Edison International common stock. Additionally, cash awards are substituted to the extent necessary to pay tax withholding or any government levies. The portion of performance shares that can be settled in cash is classified as a share-based liability award. The fair value of these shares is remeasured at each reporting period and the related compensation expense is adjusted. The portion of performance shares payable in common stock is classified as a share-based equity award. Compensation expense related to these shares is based on the grant-date fair value. Performance shares expense is recognized ratably over the requisite service period based on the fair values determined, except for awards granted to retirement-eligible participants.

75
The fair value of performance shares is determined using a Monte Carlo simulation valuation model. The Monte Carlo simulation valuation model requires various assumptions noted in the following table.
Equity awardsGrant date risk-free interest rateGrant date expected volatility
Liability awards1
Expected volatilityRisk-free interest rate:
2011 awards2010 awards2009 awards
Years ended December 31,
2011
1.2%20.4%
15.9%
0.3%0.2%—%
2010
1.3%21.6%
20.6%
—%0.6%0.3%
2009
1.3%21.4%
21.9%
—%—%1.1%
1 The portion of performance shares classified as share-based liability awards are revalued at each reporting period.
The risk-free interest rate is based on the daily spot rate on the grant or valuation date on U.S. Treasury zero coupon issue or STRIPS with terms nearest to the remaining term of the performance shares and is used as a proxy for the expected return for the specified group of peer companies. Expected volatility is based on the historical volatility of Edison International's (and the specified group of peer companies') common stock for the most recent 36 months. Historical volatility for each company in the specified group is obtained from a financial data services provider.
The following is a summary of the status of Edison International nonvested performance shares granted to SCE employees:
Nonvested at December 31, 2010GrantedForfeited1
Affiliate transfers – netNonvested at December 31, 2011
Equity Awards
Shares
219,90486,207
(54,848)3,496
254,759
Weighted-Average GrantDate Fair Value
$ 32.1529.4049.8726.9027.91
Liability Awards
Shares
219,90486,207
(54,848)3,496
254,759
Weighted-Average Fair
Value
$ 37.68
29.74
1 Includes performance shares that expired with zero value as performance targets were not met.
The current portion of nonvested performance shares classified as liability awards is reflected in "Other current liabilities" and the long-term portion is reflected in "Pensions and benefits" on the consolidated balance sheets.
At December 31, 2011, there was $2 million (based on the December 31, 2011 fair value of performance shares classified as equity awards) of total unrecognized compensation cost related to performance shares. That cost is expected to be recognized over a weighted-average period of approximately two years.
Restricted Stock Units
Restricted stock units were awarded to executives in March 2009, March 2010 and March 2011 and vest and become payable in January 2012, 2013 and 2014, respectively. Each restricted stock unit awarded is a contractual right to receive one share of Edison International common stock, if vesting requirements are satisfied. Restricted stock units awarded contain dividend equivalent reinvestment rights. An additional number of restricted stock units will be credited based on dividends on Edison International common stock for which the ex-dividend date falls within the performance period. The vesting of Edison International's restricted stock units is dependent upon continuous service through the end of the three-calendar-year-plus-two-days vesting period. Vesting is subject to a pro-rated adjustment for employees who are terminated under certain circumstances or retire. Cash awards are substituted to the extent necessary to pay tax withholding or any government levies.
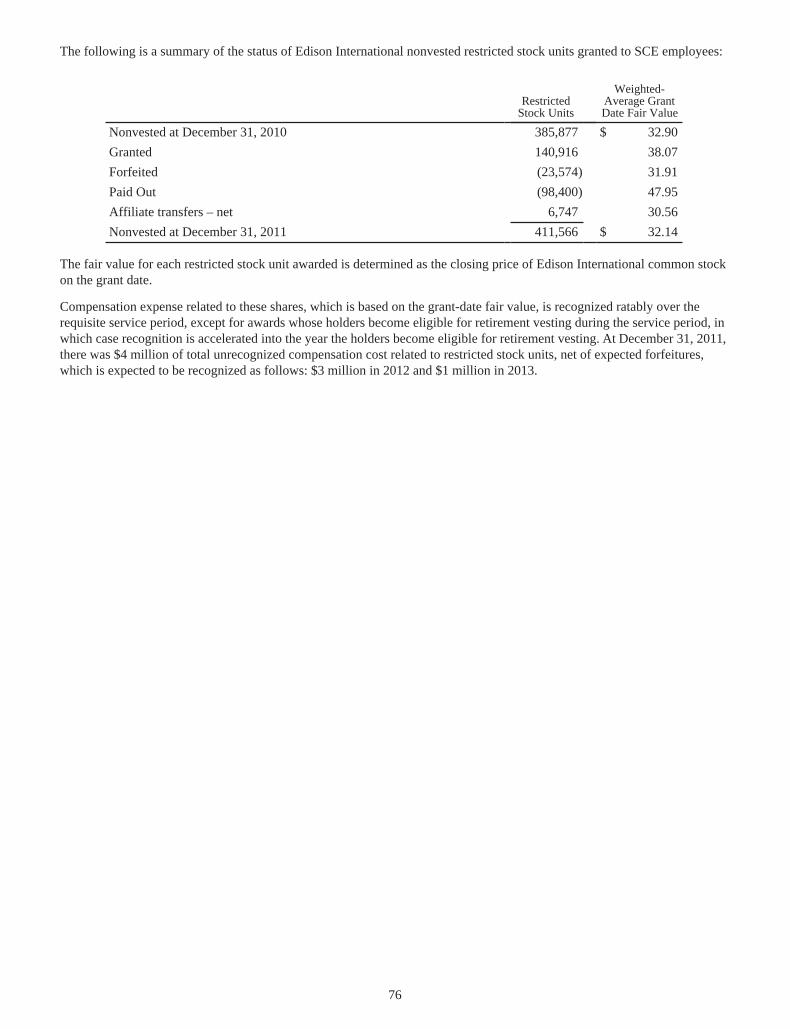
76
The following is a summary of the status of Edison International nonvested restricted stock units granted to SCE employees:
Nonvested at December 31, 2010GrantedForfeitedPaid OutAffiliate transfers – netNonvested at December 31, 2011
RestrictedStock Units
385,877140,916(23,574)(98,400)
6,747411,566
Weighted-Average GrantDate Fair Value
$ 32.9038.0731.9147.9530.56
$ 32.14
The fair value for each restricted stock unit awarded is determined as the closing price of Edison International common stock on the grant date.
Compensation expense related to these shares, which is based on the grant-date fair value, is recognized ratably over the requisite service period, except for awards whose holders become eligible for retirement vesting during the service period, in which case recognition is accelerated into the year the holders become eligible for retirement vesting. At December 31, 2011, there was $4 million of total unrecognized compensation cost related to restricted stock units, net of expected forfeitures, which is expected to be recognized as follows: $3 million in 2012 and $1 million in 2013.

77
Supplemental Data on Stock Based Compensation
(in millions, except per award amounts)
Stock Based Compensation Expense1
Stock optionsPerformance sharesRestricted stock unitsOther
Total stock based compensation expenseIncome tax benefits related to stock compensation expenseExcess tax benefits2
Stock optionsWeighted average grant date fair value per option grantedFair value of options vestedCash used to purchase shares to settle optionsCash from participants to exercise stock optionsValue of options exercisedTax benefits from options exercised
Performance Shares3 Classified as Equity AwardsWeighted average grant date fair value per share grantedFair value of shares vested
Restricted Stock unitsValues of shares settledTax benefits realized from settlement of awardsWeighted average grant date fair value per unit granted
Years ended December 31,
2011
$ 9
344
$ 20$ 8
11 $ 5.61
104628187
$ 29.40
2 $ 5
238.07
2010
$ 10
656
$ 27$ 11
4 $ 4.87
11271894
$ 32.19
3 $ —
—33.38
2009
$ 8
336
$ 20$ 8
7 $ 3.06
89631
$ 21.56
1 $ —
—25.32
1 Reflected in "Operations and maintenance" on the consolidated statements of income.2 Reflected in "Settlements of stock based compensation – net" in the financing section of the consolidated statements of
cash flows.3 There were no settlements of awards for performance shares in 2011, 2010 and 2009 as performance targets were not
met.
Note 9. Commitments and Contingencies
Third-Party Power Purchase Agreements
SCE enters into various agreements to purchase power and electric capacity, including:
• Renewable Energy Contracts – California law requires retail sellers of electricity to comply with an RPS by delivering renewable energy, primarily through power purchase contracts. Renewable energy contract payments generally consist of payments based on a fixed price per megawatt hour. As of December 31, 2011, SCE had 68 renewable energy contracts that were approved by the CPUC and met critical contract provisions which expire at various dates between 2012 and 2035.
• Qualifying Facility Power Purchase Agreements – Under the Public Utility Regulatory Policies Act of 1978 ("PURPA"), electric utilities are required, with exceptions, to purchase energy and capacity from independent power producers that are qualifying co-generation facilities and qualifying small power production facilities ("QFs"). As of December 31, 2011, SCE had 171 QF contracts which expire at various dates between 2012 and 2025.

78
• Other Power Purchase Agreements – In accordance with the SCE's CPUC-approved long-term procurement plans, SCE has entered into capacity agreements with third parties, including 15 tolling arrangements, 40 power call options and 143 resource adequacy contracts. SCE's obligations under a portion of these agreements are limited to payments for the availability of such resources.
At December 31, 2011, the undiscounted future minimum expected payments for power purchase agreements that have been approved by the CPUC and have completed major milestones for construction were as follows:
(in millions)
20122013201420152016ThereafterTotal future commitments
RenewableEnergy
Contracts
$ 561616712751752
13,186$ 16,578
QF PowerPurchase
Agreements
$ 439438437426368
1,569$ 3,677
Other Purchase
Agreements
$ 624828812705476
2,853$ 6,298
Some of the power purchase agreements that SCE entered into with independent power producers are treated as operating and capital leases. The following table shows the future minimum expected payments due under the contracts that are treated as operating and capital leases (these amounts are also included in the table above). The future expected payments for capital leases are discounted to their present value in the table below using SCE's incremental borrowing rate at the inception of the leases. The amount of this discount is shown in the table below as the amount representing interest.
(in millions)
20122013201420152016ThereafterTotal future commitmentsAmount representing executory costsAmount representing interestNet commitments
OperatingLeases
$ 839966930916815
11,468$ 15,934
CapitalLeases
$ 333372
109109
1,751$ 2,107
(445)(773)
$ 889
Operating lease expense for these power purchase agreements was $1.4 billion in 2011, $1.3 billion in 2010 and $1.2 billion in 2009. The timing of SCE's recognition of the lease expense conforms to ratemaking treatment for SCE's recovery of the cost of electricity and is included in purchased power.
At December 31, 2011 and 2010, net capital leases reflected in "Utility plant" on the consolidated balance sheets were $222 million and $227 million, including accumulated amortization of $27 million and $22 million, respectively. SCE had $6 million and $5 million included in "Other current liabilities" and $216 million and $222 million included in "Other deferred credits and other liabilities," representing the present value of the minimum lease payments due under these contracts recorded on the consolidated balance sheets at December 31, 2011 and 2010, respectively. SCE has a power purchase contract, with net commitments totaling $667 million, that meet the requirements for capital lease treatment, but is not reflected on the consolidated balance sheets since the lease term begins in 2014.

79
Other Lease Commitments
The following summarizes the estimated minimum future commitments for noncancelable other operating leases (excluding power purchase agreements discussed above):
(in millions)
20122013201420152016ThereafterTotal future commitments
OperatingLeases –
Other$ 73
70655851
324$ 641
Operating lease expense for other leases (primarily related to vehicles, office space and other equipment) were $66 million in 2011, $62 million in 2010 and $47 million in 2009.
Nuclear Decommissioning Commitment
SCE has collected in rates amounts for the future costs of removal of its nuclear assets, and has placed those amounts in independent trusts. The recorded liability to decommission SCE's nuclear power facilities is $2.5 billion as of December 31, 2011, based on site-specific studies performed in 2008 for San Onofre and 2007 for Palo Verde. Changes in the estimated costs, timing of decommissioning or the assumptions underlying these estimates could cause material revisions to the estimated total cost to decommission. SCE estimates that it will spend approximately $8.6 billion through 2053 to decommission its active nuclear facilities. This estimate is based on SCE's decommissioning cost methodology used for ratemaking purposes, escalated at rates ranging from 1.8% to 6.9% (depending on the cost element) annually. These costs are expected to be funded from independent decommissioning trusts, which received contributions of $23 million in both 2011 and 2010 and $46 million in 2009. SCE estimates annual after-tax earnings on the decommissioning funds of 4.2% to 5.7%. If the assumed return on trust assets is not earned, it is probable that additional funds needed for decommissioning will be recoverable through rates in the future. If the assumed return on trust assets is greater than estimated, funding amounts may be reduced through future decommissioning proceedings.
All of SCE's San Onofre Unit 1 decommissioning costs will be paid from its nuclear decommissioning trust funds and are subject to CPUC review. The estimated remaining cost to decommission San Onofre Unit 1 is recorded as an ARO liability of $65 million at December 31, 2011. Total expenditures for the decommissioning of San Onofre Unit 1 were $597 million from the beginning of the project in 1998 through December 31, 2011.
Decommissioning expense under the ratemaking method was $23 million, $30 million and $46 million in 2011, 2010 and 2009, respectively. The ARO for decommissioning SCE's active nuclear facilities was $2.5 billion and $2.4 billion at December 31, 2011 and 2010, respectively. See Note 4 and Note 15 for discussion on the nuclear decommissioning trusts.
Other Commitments
Certain other commitments for the years 2012 through 2016 are estimated below:
(in millions)
Nuclear fuel supply contractsOther fuel supply contractsOther contractual obligations
2012
$ 1904221
2013
$ 1353927
2014
$ 785824
2015
$ 788325
2016
$ 1284614
SCE has fuel supply contracts which require payment only if the fuel is made available for purchase. SCE has a coal fuel contract that requires payment of certain fixed charges whether or not coal is delivered.
80
Indemnities
Indemnity Provided as Part of the Acquisition of Mountainview
In connection with the acquisition of the Mountainview power plant, SCE agreed to indemnify the seller with respect to specific environmental claims related to SCE's previously owned San Bernardino Generating Station, divested by SCE in 1998 and reacquired as part of the Mountainview acquisition. SCE retained certain responsibilities with respect to environmental claims as part of the original divestiture of the station. The aggregate liability for either party to the purchase agreement for damages and other amounts is a maximum of $60 million. This indemnification for environmental liabilities expires on or before March 12, 2033. SCE has not recorded a liability related to this indemnity.
Mountainview Filter Cake Indemnity
SCE has indemnified the City of Redlands, California in connection with Mountainview's California Energy Commission permit for cleanup or associated actions related to groundwater contaminated by perchlorate due to the disposal of filter cake at the City's solid waste landfill. The obligations under this agreement are not limited to a specific time period or subject to a maximum liability. SCE has not recorded a liability related to this indemnity.
Other Indemnities
SCE provides other indemnifications through contracts entered into in the normal course of business. These are primarily indemnifications against adverse litigation outcomes in connection with underwriting agreements, and indemnities for specified environmental liabilities and income taxes with respect to assets sold. SCE's obligations under these agreements may or may not be limited in terms of time and/or amount, and in some instances SCE may have recourse against third parties. SCE has not recorded a liability related to these indemnities. The overall maximum amount of the obligations under these indemnifications cannot be reasonably estimated.
Contingencies
In addition to the matters disclosed in these Notes, SCE is involved in other legal, tax and regulatory proceedings before various courts and governmental agencies regarding matters arising in the ordinary course of business. SCE believes the outcome of these other proceedings will not materially affect its results of operations or liquidity.
CPSD Investigations
San Gabriel Valley Windstorm Investigation
In November 2011, a windstorm resulted in significant damage to SCE’s electric system and service outages for SCE customers primarily in the San Gabriel Valley. The CPUC directed its Consumer Protection and Safety Division (“CPSD”) to conduct an investigation focused on the cause of the outages, SCE’s service restoration effort, and SCE’s customer communications during the outages. The CPSD issued its preliminary report on February 1, 2012. The report asserts that SCE and others with whom SCE shares utility poles violated certain CPUC safety rules applicable to overhead line construction, maintenance and operation, which may have caused the failures of affected poles and supporting cables. The report also concludes that SCE’s restoration time was not adequate and makes other assertions. Additionally, the report contends that SCE violated CPUC rules by failing to preserve evidence relevant to the investigation when it did not retain damaged poles that were replaced following the windstorm. If the CPUC issues an Order Instituting Investigation ("OII") regarding this matter and SCE is found to have violated any CPUC rules, it could face penalties. In addition, the cost of any large scale review of poles or other equipment for safety compliance could be significant. SCE is unable to estimate a possible loss or range of loss associated with any penalties that may be imposed by the CPUC on SCE.
Malibu Fire Order Instituting Investigation
Following a 2007 wildfire in Malibu, California, the CPUC issued an OII to determine if any statutes, CPUC general orders, rules or regulations were violated by SCE or telecomm providers (“OII Respondents”) that shared the use of three failed power poles in the wildfire area. The CPSD has alleged, among other things, that the poles were overloaded, that the OII Respondents violated the CPUC's rules governing the design, construction and inspection of poles and misled the CPUC during its investigation of the fire, and that SCE failed to preserve evidence relevant to the investigation. In October 2011, the CPSD proposed that the OII Respondents be assessed penalties of approximately $99 million, with SCE being allocated approximately $50 million of the total. SCE has denied the allegations and believes the proposed penalties are excessive.
81
Four Corners New Source Review Litigation
In October 2011, four private environmental organizations filed a CAA citizen lawsuit against the co-owners of Four Corners. The complaint alleges that certain work performed at the Four Corners generating units 4 and 5, over the approximate periods of 1985-1986 and 2007-present, constituted plant “major modifications” for which the plant should have, but did not, obtain permits and install best available control technology ("BACT") in violation of the PSD requirements and of the New Source Performance Standards of the CAA. The complaint also alleges subsequent and continuing violation of BACT air emissions limits. The lawsuit seeks injunctive and declaratory relief, civil penalties, including a mitigation project and litigation costs. In November 2010, SCE entered into an agreement to sell its ownership interest in generating units 4 and 5 to APS. The sale is subject to regulatory approvals and is expected to close in late 2012. Under the agreement SCE would remain responsible for its pro rata share of certain environmental liabilities, including penalties arising from environmental violations prior to the sale, but SCE would not be liable for any costs of installing BACT or other costs related to continuing or extending Four Corners operations. SCE is unable to estimate a possible loss or range of loss associated with this matter.
Concurrently, the US EPA has proposed a regional haze federal implementation plan based on an APS proposal that would require shut down of units 1, 2 and 3 by 2016 and the installation of selective catalytic reduction technology on units 4 and 5 by 2018. APS' proposal contemplated that these actions would both satisfy the federal regional haze requirements and resolve any New Source Review claims the US EPA might have. A final federal implementation plan is expected in 2012.
Environmental Remediation
SCE records its environmental remediation liabilities when site assessments and/or remedial actions are probable and a range of reasonably likely cleanup costs can be estimated. SCE reviews its sites and measures the liability quarterly, by assessing a range of reasonably likely costs for each identified site using currently available information, including existing technology, presently enacted laws and regulations, experience gained at similar sites, and the probable level of involvement and financial condition of other potentially responsible parties. These estimates include costs for site investigations, remediation, operations and maintenance, monitoring and site closure. Unless there is a single probable amount, SCE records the lower end of this reasonably likely range of costs (reflected in "Other long-term liabilities") at undiscounted amounts as timing of cash flows is uncertain.
At December 31, 2011, SCE's recorded estimated minimum liability to remediate its 24 identified material sites (sites in which the upper end of the range of the costs is at least $1 million) and 33 identified immaterial sites was $49 million (which includes $14 million related to San Onofre) and $3 million, respectively. Of the $52 million total environmental remediation liability, $49 million has been recorded as a regulatory asset. SCE expects to recover $31 million through an incentive mechanism that allows SCE to recover 90% of its environmental remediation costs at certain sites (SCE may request to include additional sites) and $18 million through a mechanism that allows SCE to recover 100% of the costs incurred at certain sites through customer rates. SCE's identified sites include several sites for which there is a lack of currently available information, including the nature and magnitude of contamination, and the extent, if any, that SCE may be held responsible for contributing to any costs incurred for remediating these sites. Thus, no reasonable estimate of cleanup costs can be made for these sites.
The ultimate costs to clean up SCE's identified sites may vary from its recorded liability due to numerous uncertainties inherent in the estimation process, such as: the extent and nature of contamination; the scarcity of reliable data for identified sites; the varying costs of alternative cleanup methods; developments resulting from investigatory studies; the possibility of identifying additional sites; and the time periods over which site remediation is expected to occur. SCE believes that, due to these uncertainties, it is reasonably possible that cleanup costs at the identified material sites and immaterial sites could exceed its recorded liability by up to $197 million and $6 million, respectively. The upper limit of this range of costs was estimated using assumptions least favorable to SCE among a range of reasonably possible outcomes.
SCE expects to clean up its identified sites over a period of up to 30 years. Remediation costs in each of the next five years are expected to range from $7 million to $17 million. Costs incurred for the years ended December 31, 2011, 2010 and 2009 were $16 million, $17 million and $11 million, respectively.
Based upon the CPUC's regulatory treatment of environmental remediation costs, SCE believes that costs ultimately recorded will not materially affect its results of operations, financial position or cash flows. There can be no assurance, however, that future developments, including additional information about existing sites or the identification of new sites, will not require material revisions to estimates.

82
Nuclear Insurance
Federal law limits public liability claims from a nuclear incident to the amount of available financial protection, which is currently approximately $12.6 billion. SCE and other owners of San Onofre and Palo Verde have purchased the maximum private primary insurance available ($375 million). The balance is covered by a loss sharing program among nuclear reactor licensees. If a nuclear incident at any licensed reactor in the United States results in claims and/or costs which exceed the primary insurance at that plant site, all nuclear reactor licensees could be required to contribute their share of the liability in the form of a deferred premium.
Based on its ownership interests, SCE could be required to pay a maximum of approximately $235 million per nuclear incident. However, it would have to pay no more than approximately $35 million per incident in any one year. If the public liability limit above is insufficient, federal law contemplates that additional funds may be appropriated by Congress. This could include an additional assessment on all licensed reactor operators as a measure for raising further federal revenue.
Property damage insurance covers losses up to $500 million, including decontamination costs, at San Onofre and Palo Verde. Decontamination liability and excess property damage coverage exceeding the primary $500 million also has been purchased in amounts greater than the federal requirement of a minimum of approximately $1.1 billion. Property damage insurance also covers damages caused by acts of terrorism up to specified limits. Additional insurance covers part of replacement power expenses during an accident-related nuclear unit outage. A mutual insurance company owned by entities with nuclear facilities issues these policies. If losses at any nuclear facility covered by the arrangement were to exceed the accumulated funds for these insurance programs, SCE could be assessed retrospective premium adjustments of up to approximately $48 million per year. Insurance premiums are charged to operating expense.
Wildfire Insurance
Severe wildfires in California have given rise to large damage claims against California utilities for fire-related losses alleged to be the result of the failure of electric and other utility equipment. Invoking a California Court of Appeal decision, plaintiffs pursuing these claims have relied on the doctrine of inverse condemnation, which can impose strict liability (including liability for a claimant's attorneys' fees) for property damage. On September 1, 2011, SCE's parent, Edison International, renewed its insurance coverage, which included coverage for SCE's wildfire liabilities up to a $575 million limit (with a self-insured retention of $10 million per wildfire occurrence). Various coverage limitations within the policies that make up the insurance coverage could result in additional self-insured costs in the event of multiple wildfire occurrences during the policy period (September 1, 2011 to August 31, 2012). SCE may experience coverage reductions and/or increased insurance costs in future years. No assurance can be given that future losses will not exceed the limits of SCE's insurance coverage.
Spent Nuclear Fuel
Under federal law, the Department of Energy ("DOE") is responsible for the selection and construction of a facility for the permanent disposal of spent nuclear fuel and high-level radioactive waste. The DOE did not meet its contractual obligation to begin acceptance of spent nuclear fuel by January 31, 1998. Extended delays by the DOE have led to the construction of costly alternatives and associated siting and environmental issues. Currently, both San Onofre and Palo Verde have interim storage for spent nuclear fuel on site sufficient for the current license period.
In June 2010, the United States Court of Federal Claims issued a decision granting SCE and the San Onofre co-owners damages of approximately $142 million to recover costs incurred through December 31, 2005 for the DOE's failure to meet its obligation to begin accepting spent nuclear fuel from San Onofre. SCE received payment from the federal government in the amount of the damage award in November 2011. SCE has returned to the San Onofre co-owners their respective share of the damage award paid. SCE, as operating agent, filed a lawsuit against the DOE in the Court of Federal Claims in December 2011 seeking damages for the period from January 1, 2006 to December 31, 2010 for the DOE's failure to meet its obligation to begin accepting spent nuclear fuel. Additional legal action would be necessary to recover damages incurred after December 31, 2010. Any damages recovered by SCE are subject to CPUC review as to what amounts would be returned to SCE customers or used to offset past or future fuel decommissioning or storage costs for the benefit of customers.
Note 10. Environmental Developments
Water Quality
Once-Through Cooling Issues
In March 2011, the US EPA proposed standards under the federal Clean Water Act that would affect cooling water intake structures at generating facilities. The standards are intended to protect aquatic organisms by reducing capture in screens attached to cooling water intake structures (impingement) and in the water volume brought into the facilities (entrainment).
83
The regulations are expected to be finalized by July 2012. The required measures to comply with the proposed standards regarding entrainment are subject to the discretion of the permitting authority, and SCE is unable at this time to assess potential costs of compliance, which could be significant for San Onofre.
In addition to the proposed draft US EPA standards, the existing California once-through cooling policy may result in significant capital expenditures at San Onofre and may affect its operations. If other coastal power plants in California that rely on once-through cooling are forced to shut down or limit operations, the California policy may also significantly impact SCE's ability to procure generating capacity from those plants, which could have an adverse effect on system reliability and the cost of electricity.
Coal Combustion Wastes
US EPA regulations currently classify coal ash and other coal combustion residuals as solid wastes that are exempt from hazardous waste requirements. In June 2010, the US EPA published proposed regulations relating to coal combustion residuals that could result in their reclassification. Two different proposed approaches are under consideration.
The first approach, under which the US EPA would list these residuals as special wastes subject to regulation as hazardous wastes, could require SCE to incur additional capital and operating costs. The second approach, under which the US EPA would regulate these residuals as nonhazardous wastes, would establish minimum technical standards for units that are used for the disposal of coal combustion residuals, but would allow procedural and enforcement mechanisms (such as permit requirements) to be exclusively a matter of state law. Many of the proposed technical standards are similar under both proposed options (for example, surface impoundments may need to be retrofitted, depending on which standard is finally adopted), but the second approach is not expected to require the retrofitting of landfills used for the disposal of coal combustion residuals.
Greenhouse Gas Regulation
There have been a number of federal and state legislative and regulatory initiatives to reduce greenhouse gas ("GHG") emissions. Any climate change regulation or other legal obligation that would require substantial reductions in GHG emissions or that would impose additional costs or charges for GHG emissions could significantly increase the cost of generating electricity from fossil fuels as well as the cost of purchased power, which could adversely affect SCE's business. In the case of utilities, like SCE, these costs are generally borne by customers.
Significant developments include the following:
• In June 2010, the US EPA issued the Prevention of Significant Deterioration ("PSD") and Title V Greenhouse Gas Tailoring Rule, known as the "GHG tailoring rule." This regulation generally subjects newly constructed sources of GHG emissions and newly modified existing major sources to the Prevention of Significant Deterioration air permitting program (and later, to the Title V permitting program under the CAA), beginning in January 2011. A challenge to the GHG tailoring rule (along with other GHG regulations and determinations issued by the US EPA) is pending before the U.S. Court of Appeals for the D.C. Circuit.
• Under a pending court settlement, the US EPA was to propose performance standards for GHG emissions from new and modified power plants. The specific requirements will not be known until the regulations are finalized.
• In December 2011, the California Air Resources Board ("CARB") regulation was officially published establishing a California cap-and-trade program. The first compliance period under the regulations is for 2013 GHG emissions. CARB regulations implementing a California cap-and-trade program and the cap-and-trade program itself continue to be the subject of litigation.
• In April 2011, California enacted a law requiring California retail sellers of electricity to procure 33% of their customers' electricity requirements from renewable resources, as defined in the statute. Specifically, the new law establishes multi-year compliance periods and requires the CPUC and the CEC to establish the quantity of renewable resources to be procured according to the limitations set forth in the statute. On December 1, 2011, the CPUC approved a decision setting procurement quantity requirements for CPUC-regulated retail sellers that incrementally increase to 33% over several periods between January 2011 and December 31, 2020. The quantity would remain at 33% of retail sales for each year thereafter. The full impact of the new 33% law will depend on how the CPUC and CEC implement the law, which remains uncertain.

84
Greenhouse Gas Litigation Developments
In June 2011, the U.S. Supreme Court dismissed public nuisance claims against five power companies, ruling that the CAA and the US EPA actions it authorizes displace federal common law nuisance claims that might arise from the emission of GHGs. The court also affirmed the Second Circuit's determination that at least some of the plaintiffs had standing to bring the case. The court did not address whether the CAA also preempts state law claims arising from the same circumstances.
An appeal before the Ninth Circuit of a federal district order dismissing a case against SCE's parent company, Edison International, and other defendants, had been deferred pending the U.S. Supreme Court's ruling described above. In the case, which was brought by the Alaskan Native Village of Kivalina, the plaintiffs seek damages of up to $400 million for the cost of relocating the village, which they claim is no longer protected from storms because the Arctic sea ice has melted as the result of climate change. The stay of the appeal has been lifted and argument before the Ninth Circuit was held in November 2011.
In May 2011, private citizens filed a purported class action complaint in the United States District Court for the Southern District of Mississippi, naming a large number of defendants, including SCE and other Edison International subsidiaries. Plaintiffs allege that the defendants' activities resulted in emissions of substantial quantities of GHGs that have contributed to climate change and sea level rise, which in turn are alleged to have increased the destructive force of Hurricane Katrina. The lawsuit alleges causes of action for negligence, public and private nuisance, and trespass, and seeks unspecified compensatory and punitive damages. The claims in this lawsuit are nearly identical to a subset of the claims that were raised against many of the same defendants in a previous lawsuit that was filed in, and dismissed by, the same federal district court where the current case has been filed.
Note 11. Accumulated Other Comprehensive Loss
SCE's accumulated other comprehensive loss consists of:
(in millions)
Balance at December 31, 2009Change for 2010Balance at December 31, 2010Change for 2011Balance at December 31, 2011
Pensionand PBOP –
Net Loss
$ (18)(7)
(25)1
$ (24)
Pension andPBOP –
PriorService Cost
$ (1)1
——
$ —
AccumulatedOther
ComprehensiveLoss
$ (19)(6)
(25)1
$ (24)

85
Note 12. Supplemental Cash Flows Information
SCE's supplemental cash flows information is:
(in millions)
Cash payments(receipts) for interest and taxes:Interest – net of amounts capitalizedTax payments (refunds) – net
Noncash investing and financing activities:Accrued capital expendituresDetails of debt exchange:
Pollution-control bonds redeemedPollution-control bonds issued
Details of capital lease obligations:Capital lease purchasedCapital lease obligation issued
Deconsolidation of variable interest entities:Assets other than cashLiabilities and noncontrolling interests
Dividends declared but not paid:Common stockPreferred and preference stock
Years ended December 31,2011
$ 408
(86)
$ 685
$ (86)86
$ ——
$ ——
$ —11
2010
$ 369
(127)
$ 648
$ (378)378
$ ——
$ 306(398)
$ —13
2009
$ 352
(658)
$ 466
$ ——
$ (223)223
$ ——
$ 10013
Note 13. Preferred and Preference Stock
SCE's authorized shares are: $100 cumulative preferred – 12 million shares, $25 cumulative preferred – 24 million shares and preference with no par value – 50 million shares. SCE's outstanding shares are not subject to mandatory redemption. There are no dividends in arrears for the preferred or preference shares. Shares of SCE's preferred stock have liquidation and dividend preferences over shares of SCE's common stock and preference stock. All cumulative preferred shares are redeemable. When preferred shares are redeemed, the premiums paid, if any, are charged to common equity. No preferred shares were issued or redeemed in the years ended December 31, 2011, 2010 and 2009. There is no sinking fund requirement for redemptions or repurchases of preferred shares.
Shares of SCE's preference stock rank junior to all of the preferred stock and senior to all common stock. Shares of SCE's preference stock are not convertible into shares of any other class or series of SCE's capital stock or any other security. The preference shares issued prior to 2012 have a $100 liquidation value. There is no sinking fund requirement for redemptions or repurchases of preference shares.

86
Preferred stock and preference stock is:
(in millions, except shares and per-share amounts)Cumulative preferred stock$25 par value:4.08% Series4.24% Series4.32% Series4.78% SeriesPreference stockNo par value:4.90% Series A (variable and noncumulative)6.125% Series B (noncumulative)6.00% Series C (noncumulative)6.50% Series D (cumulative)Total
SharesOutstanding
650,0001,200,0001,653,4291,296,769
4,000,0002,000,0002,000,0001,250,000
RedemptionPrice
$ 25.50
25.8028.7525.80
100.00100.00100.00100.00
December 31,2011
$ 16
304133
400200200125
$ 1,045
2010 $ 16
304133
400200200—
$ 920
Shares of Series A and B preference stock were issued in 2005 and shares of Series C preference stock were issued in 2006. SCE may, at its option, redeem the Series A, B, or C preference shares in whole or in part. Shares of Series D preference stock, issued in 2011, may not be redeemed prior to March 1, 2016. After March 1, 2016, SCE may, at its option, redeem the shares in whole or in part for a price of $100 per share plus accrued and unpaid dividends, if any. The proceeds from the sale of these shares were used to fund SCE's capital program. Preference shares are not subject to mandatory redemption and no preference shares were redeemed in the last three years.
At December 31, 2011 accrued dividends related to SCE's preferred and preference stock were $11 million.
In January and February 2012, SCE issued 250,000 and 100,000 shares, respectively, of 6.25% Series E preference stock (cumulative, $1,000 liquidation value). The Series E preference shares may not be redeemed prior to February 1, 2022. After February 1, 2022, SCE may at its option, redeem the shares, in whole or in part for a price of $1,000 per share plus accrued and unpaid dividends, if any. The shares are not subject to mandatory redemption. The proceeds from the sale of these shares were used to repay commercial paper borrowings and to fund SCE's capital program.
Note 14. Regulatory Assets and Liabilities
Included in SCE's regulatory assets and liabilities are regulatory balancing accounts. CPUC authorized balancing account mechanisms require SCE to refund or recover any differences between forecasted and actual costs. The CPUC has authorized balancing accounts for specified costs or programs such as fuel, purchased-power, demand-side management programs, nuclear decommissioning and public purpose programs. Certain of these balancing accounts include a return on rate base of 8.75%. The CPUC also authorizes the use of a balancing account to recover from or refund to customers differences in revenue resulting from actual and forecasted electricity sales.
Balancing account over and under collections represent differences between cash collected in current rates for specified forecasted costs and these costs that are actually incurred. Under-collections are recorded as regulatory balancing account assets. Over-collections are recorded as regulatory balancing account liabilities. With some exceptions, SCE seeks to adjust rates on an annual basis or at other designated times to recover or refund the balances recorded in its balancing accounts. Regulatory balancing accounts that SCE does not expect to collect or refund in the next 12 months are reflected in the long-term section of the consolidated balance sheets. Under collections and over collections accrue interest based on a three-month commercial paper rate published by the Federal Reserve.
Amounts included in regulatory assets and liabilities are generally recorded with corresponding offsets to the applicable income statement accounts.

87
Regulatory Assets
Regulatory assets included on the consolidated balance sheets are:
(in millions)
Current:Regulatory balancing accountsEnergy derivativesOther
Total CurrentLong-term:
Deferred income taxes – netPensions and other postretirement benefitsUnamortized investments – netUnamortized loss on reacquired debtEnergy derivativesNuclear-related investment – netRegulatory balancing accountsOther
Total Long-termTotal Regulatory Assets
December 31,
2011
$ 223
2647
494
2,0201,703
48424983615669
2985,815
$ 6,309
2010
$ 213
1623
378
1,8551,097
46026817715456
2804,347
$ 4,725
SCE's regulatory assets related to energy derivatives are primarily an offset to unrealized losses on derivatives. The regulatory asset changes based on fluctuations in the fair market value of the contracts, which expire in 1 to 12 years.
SCE's regulatory assets related to deferred income taxes represent tax benefits passed through to customers. The CPUC requires SCE to pass through certain deferred income tax benefits to customers by reducing electricity rates, thereby deferring recovery of such amounts to future periods. Based on current regulatory ratemaking and income tax laws, SCE expects to recover its regulatory assets related to deferred income taxes over the life of the assets that give rise to the accumulated deferred income taxes, ranging from 1 to 45 years.
SCE's regulatory assets related to pensions and other post-retirement plans represents the unfunded net loss and prior service costs of the plans (see "Pension Plans and Postretirement Benefits Other than Pensions" discussion in Note 8). This amount is being recovered through rates charged to customers as the plans are funded.
SCE's unamortized investments include nuclear assets related to San Onofre which are expected to be recovered by 2022, nuclear assets related to Palo Verde which are expected to be recovered by 2027 and SCE's unamortized coal plant investment which is being recovered through June 2016. Unamortized investments also include legacy meters retired as part of the EdisonSmartConnectTM program which are expected to be recovered by 2025. Although SCE's unamortized investments are classified as regulatory assets on the consolidated balance sheets, they continue to be a component of rate base and earned an 8.75% return in both 2011 and 2010.
SCE's net regulatory asset related to its unamortized loss on reacquired debt will be recovered over the remaining original amortization period of the reacquired debt over periods ranging from 1 to 27 years.
SCE's nuclear-related investment include assets and accumulated depreciation related to the AROs for San Onofre and Palo Verde, which are expected to be recovered by 2022 and 2027, respectively. These assets are included in rate base and earned a return of 8.75% in 2011 and 2010.

88
Regulatory Liabilities
Regulatory liabilities included on the consolidated balance sheets are:
(in millions)
Current:Regulatory balancing accountsOther
Total CurrentLong-term:
Costs of removalAsset Retirement ObligationsRegulatory balancing accountsOther
Total Long-termTotal Regulatory Liabilities
December 31,
2011
$ 661
9670
2,6971,105
8644
4,670$ 5,340
2010
$ 733
5738
2,6231,099
802—
4,524$ 5,262
SCE's regulatory liabilities related to costs of removal represent operating revenue collected for asset removal costs that SCE expects to incur in the future. These balances will be returned to customers in a future ratemaking proceeding, be charged against expense to the extent that future expenses exceed amounts recoverable through the ratemaking process, or be applied as otherwise directed by the CPUC.
SCE's regulatory liabilities related to the AROs represent timing differences between the AROs and the assets of the nuclear decommissioning trust. The balance varies due to changes in the AROs as well as nuclear decommissioning trust investment activities.
Note 15. Other Investments
Nuclear Decommissioning Trusts
Future decommissioning costs of removal of nuclear assets are expected to be funded from independent decommissioning trusts, which currently receive contributions of approximately $23 million per year included in SCE customer rates. Contributions to the decommissioning trusts are reviewed every three years by the CPUC. If additional funds are needed for decommissioning, it is probable that the additional funds will be recoverable through customer rates. Funds collected, together with accumulated earnings, will be utilized solely for decommissioning. The CPUC has set certain restrictions related to the investments of these trusts.
The following table sets forth amortized cost and fair value of the trust investments:
(in millions)
StocksMunicipal bondsU.S. government and agency securitiesCorporate bondsShort-term investments and receivables/payablesTotal
LongestMaturity
Dates
—205120412054
One-year
Amortized Cost
December 31,2011
$ 86562551625938
$ 2,303
December 31,2010
$ 89570627028826
$ 2,185
Fair Value
December 31,2011
$ 1,89975658031740
$ 3,592
December 31,2010
$ 2,02979028834627
$ 3,480
Trust fund earnings (based on specific identification) increase the trust fund balance and the ARO regulatory liability. Proceeds from sales of securities (which are reinvested) were $2.8 billion, $1.4 billion and $2.2 billion for the years ended December 31, 2011, 2010 and 2009, respectively. Unrealized holding gains, net of losses, were $1.3 billion at both December 31, 2011 and 2010.

89
The following table sets forth a summary of changes in the fair value of the trust for the years ended December 31:
(in millions)
Balance at beginning of periodGross realized gainsGross realized lossesUnrealized gains (losses) – netOther-than-temporary impairmentsInterest, dividends, contributions and otherBalance at end of period
2011
$ 3,480108(17)(7)
(47)75
$ 3,592
2010
$ 3,140125
(4)148(27)98
$ 3,480
2009
$ 2,524242
(147)526
(111)106
$ 3,140
Due to regulatory mechanisms, earnings and realized gains and losses (including other-than-temporary impairments) have no impact on operating revenue or earnings.
Note 16. Other Income and Expenses
Other income and expenses are as follows:
(in millions)
Other income:Equity AFUDCIncrease in cash surrender value of life insurance policiesEnergy settlementOtherTotal other incomeOther expenses:Civic, political and related activities and donationsMarketing servicesOtherTotal other expenses
Years ended December 31,2011
$ 96
262
11$ 135
$ 307
18$ 55
2010
$ 100
255
11$ 141
$ 287
16$ 51
2009
$ 116
239
12$ 160
$ 281110
$ 49
During 2009, the CPUC and FERC authorized the transfer of the Mountainview power plant to utility rate base which resulted in a non-cash accounting benefit of approximately $46 million. This non-cash accounting benefit primarily resulted from the establishment of regulatory assets to recognize $50 million in differences in the accounting treatment for non-regulated and rate-regulated entities mainly related to equity AFUDC. There was no economic impact to customers from this change as compared to the FERC-approved power-purchase agreement.

90
Note 17. Quarterly Financial Data (Unaudited)
(in millions)
Operating revenueOperating incomeNet incomeNet income available for common stockCommon dividends declared
Total2011
$ 10,5772,1231,1441,085
461
Fourth
$ 2,514474262247116
Third
$ 3,386764421406115
Second
$ 2,446443226211115
First
$ 2,232443236222115
(in millions)
Operating revenueOperating incomeNet incomeNet income available for common stockCommon dividends declared
Total2010
$ 9,9831,8641,0921,040
200
Fourth
$ 2,479383194181100
Third
$ 3,098696407394100
Second
$ 2,247404314301—
First
$ 2,159380177164—
Due to the seasonal nature of SCE's business, a significant amount of revenue and earnings are recorded in the third quarter of each year. As a result of rounding, the total of the four quarters does not always equal the amount for the year.
ITEM 9. CHANGES IN AND DISAGREEMENTS WITH ACCOUNTANTS ON ACCOUNTING AND FINANCIAL DISCLOSURE
None.
ITEM 9A. CONTROLS AND PROCEDURES
Disclosure Controls and Procedures
SCE's management, under the supervision and with the participation of the company's President and Chief Financial Officer, has evaluated the effectiveness of SCE's disclosure controls and procedures (as that term is defined in Rules 13a-15(e) or 15d-15(e) under the Exchange Act) as of the end of the period covered by this report. Based on that evaluation, the President and Chief Financial Officer concluded that, as of the end of the period, SCE's disclosure and procedures were effective.
Management's Report on Internal Control Over Financial Reporting
SCE's management is responsible for establishing and maintaining adequate internal control over financial reporting (as that term is defined in Rule 13a-15(f) under the Exchange Act) for SCE. Under the supervision and with the participation of its President and Chief Financial Officer, SCE's management conducted an evaluation of the effectiveness of SCE's internal control over financial reporting based on the framework set forth in Internal Control–Integrated Framework issued by the Committee of Sponsoring Organizations of the Treadway Commission (COSO). Based on its evaluation under the COSO framework, SCE's management concluded that SCE's internal control over financial reporting was effective as of December 31, 2011.
Change in Internal Control Over Financial Reporting
There were no changes in SCE's internal control over financial reporting during the quarter to which this report relates that have materially affected, or are reasonably likely to materially affect, SCE's internal control over financial reporting.
Jointly Owned Utility Plant
SCE's scope of evaluation of internal control over financial reporting includes its Jointly Owned Utility Projects.

91
ITEM 9B. OTHER INFORMATION
None.
PART III
ITEM 10. DIRECTORS AND EXECUTIVE OFFICERS AND CORPORATE GOVERNANCE
Information concerning executive officers of SCE is set forth in Part I in accordance with General Instruction G(3), pursuant to Instruction 3 to Item 401(b) of Regulation S-K. Other information responding to Item 10 will appear in SCE's definitive Proxy Statement to be filed with the SEC in connection with SCE's Annual Shareholders' Meeting to be held on April 26, 2012, under the headings "Item 1: Election of Directors" and "Board Committees," and is incorporated herein by this reference.
The Edison International Employee Ethics and Compliance Code is applicable to all officers and employees of Edison International and its subsidiaries, including SCE. The Code is available on Edison International's Internet website at www.edisoninvestor.com at "Corporate Governance." Any amendments or waivers of Code provisions for SCE's principal executive officer, principal financial officer, principal accounting officer or controller, or persons performing similar functions, will be posted on Edison International's Internet website at www.edisoninvestor.com.
ITEM 11. EXECUTIVE COMPENSATION
Information responding to Item 11 will appear in the Proxy Statement under the headings "Compensation Discussion and Analysis," "Compensation Committee Interlocks and Insider Participation," "Summary Compensation Table," "Grants of Plan-Based Awards," "Outstanding Equity Awards at Fiscal Year-End," "Option Exercises and Stock Vested," "Pension Benefits," "Non-Qualified Deferred Compensation," "Potential Payments Upon Termination or Change in Control," and "Director Compensation," and is incorporated herein by this reference, and under the heading “Compensation Committee Report,” which is incorporated by reference in accordance with Instruction G(3) pursuant to Instruction 2 to Item 407(e)(5) of Regulation S-K.
ITEM 12. SECURITY OWNERSHIP OF CERTAIN BENEFICIAL OWNERS AND MANAGEMENT AND RELATED STOCKHOLDER MATTERS
Information responding to Item 12 will appear in the Proxy Statement under the headings "Stock Ownership of Directors and Executive Officers" and "Stock Ownership of Certain Shareholders," and is incorporated herein by this reference.
Item 201(d) of Regulation S-K, "Securities Authorized For Issuance Under Equity Compensation Plans," is not applicable because SCE has no compensation plans under which equity securities of SCE are authorized for issuance.
ITEM 13. CERTAIN RELATIONSHIPS AND RELATED TRANSACTIONS, AND DIRECTOR INDEPENDENCE
Information responding to Item 13 will appear in the Proxy Statement under the headings "Certain Relationships and Related Transactions," and "Corporate Governance–Q: Is SCE subject to the same corporate governance stock exchange rules as EIX?,–Q: How does the Board determine which Directors are considered independent?–Q: Which Directors has the Board determined are independent?" and "Where can I find the Company's corporate governance documents?" and is incorporated herein by this reference.
ITEM 14. PRINCIPAL ACCOUNTANT FEES AND SERVICES
Information responding to Item 14 will appear in the Proxy Statement under the heading "Independent Registered Public Accounting Firm Fees," and is incorporated herein by this reference.

92
PART IV
ITEM 15. EXHIBITS ANDFINANCIAL STATEMENT SCHEDULES
(a)(1) Financial Statements
See Consolidated Financial Statements listed in the Table of Contents of this report.
(a)(2) Report of Independent Registered Public Accounting Firm and Schedules Supplementing Financial Statements
Schedule II – Valuation and Qualifying Accounts
Page
Schedules I and III through V, inclusive, are omitted as not required or not applicable.
(a)(3) Exhibits
See Exhibit Index beginning on page 96 of this report.
SCE will furnish a copy of any exhibit listed in the accompanying Exhibit Index upon written request and upon payment to SCE of its reasonable expenses of furnishing such exhibit, which shall be limited to photocopying charges and, if mailed to the requesting party, the cost of first-class postage.
93
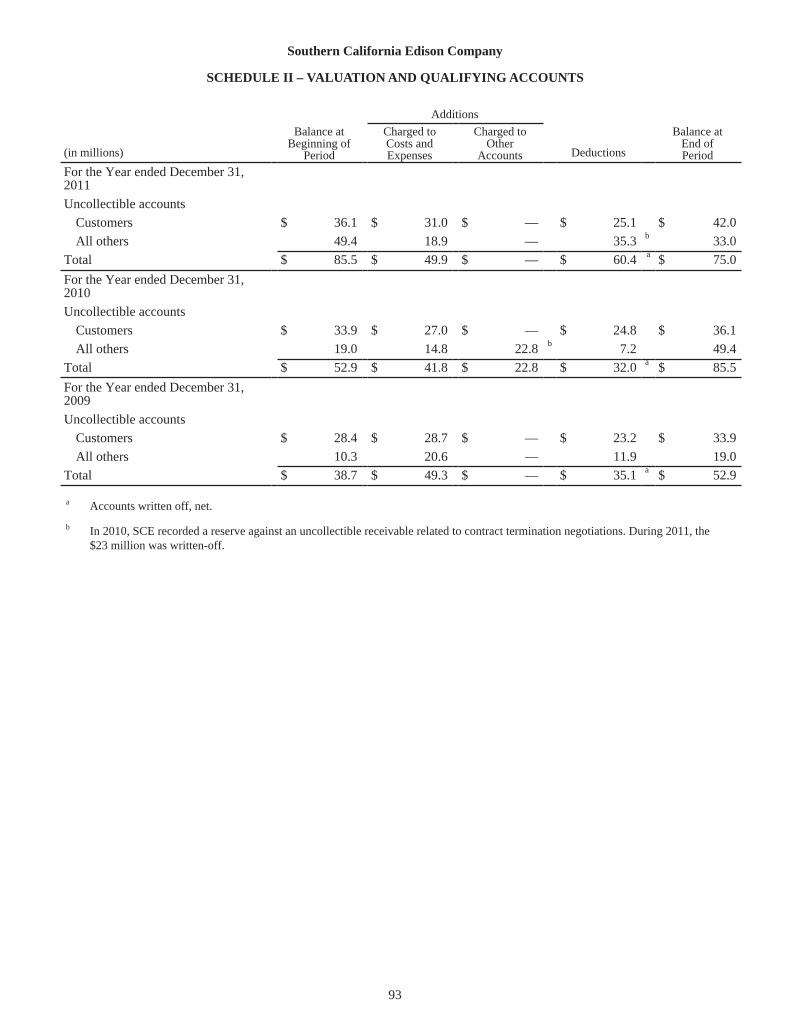
93
Southern California Edison Company
SCHEDULE II – VALUATION AND QUALIFYING ACCOUNTS
(in millions)
For the Year ended December 31,2011Uncollectible accounts
CustomersAll others
TotalFor the Year ended December 31,2010Uncollectible accounts
CustomersAll others
TotalFor the Year ended December 31,2009Uncollectible accounts
CustomersAll others
Total
Balance at
Beginning ofPeriod
$ 36.1
49.4$ 85.5
$ 33.9
19.0$ 52.9
$ 28.4
10.3$ 38.7
AdditionsCharged toCosts andExpenses
$ 31.0
18.9$ 49.9
$ 27.0
14.8$ 41.8
$ 28.7
20.6$ 49.3
Charged toOther
Accounts
$ —
—$ —
$ —
22.8$ 22.8
$ —
—$ —
b
Deductions
$ 25.1
35.3$ 60.4
$ 24.8
7.2$ 32.0
$ 23.2
11.9$ 35.1
b
a
a
a
Balance at
End ofPeriod
$ 42.0
33.0$ 75.0
$ 36.1
49.4$ 85.5
$ 33.9
19.0$ 52.9
a Accounts written off, net.b In 2010, SCE recorded a reserve against an uncollectible receivable related to contract termination negotiations. During 2011, the
$23 million was written-off.

94
SIGNATURES
Pursuant to the requirements of Section 13 or 15(d) of the Securities Exchange Act of 1934, the registrant has duly caused this report to be signed on its behalf by the undersigned, thereunto duly authorized.
SOUTHERN CALIFORNIA EDISON COMPANY
By: /s/ Chris C. Dominski
Chris C. DominskiVice President and Controller
(Duly Authorized Officer and PrincipalAccounting Officer)
Date: February 29, 2012

95
Pursuant to the requirements of the Securities Exchange Act of 1934, this report has been signed below by the following persons on behalf of the registrant and in the capacities and on the date indicated.
Signature
Principal Executive Officer:
Ronald L. Litzinger*
Principal Financial Officer:Linda G. Sullivan*
Principal Accounting Officer:Chris C. Dominski
Board of Directors:Jagjeet S. Bindra*
Vanessa C.L. Chang*
France A. Córdova*
Theodore F. Craver, Jr.*
Charles B. Curtis*
Bradford M. Freeman*
Ronald L. Litzinger*
Luis G. Nogales*
Ronald L. Olson*
James M. Rosser*
Richard T. Schlosberg, III*
Thomas C. Sutton*
Peter J. Taylor*
Brett White*
Title
President
Senior Vice President and Chief Financial Officer
Vice President and Controller
Director
Director
Director
Director
Director
Director
Director
Director
Director
Director
Director
Director
Director
Director
*By: /s/ Chris C. DominskiChris C. Dominski
Vice President and Controller(Attorney-in-fact)
Date: February 29, 2012

96
EXHIBIT INDEX
ExhibitNumber3.1
3.2
4.1
4.2
4.3
10.1**
10.2**
10.3**
10.4**
10.4.1**
10.4.2**
10.5**
10.6**
10.7**
10.7.1**
10.8**
10.9**
10.10**
10.11**
10.12**
DescriptionCertificate of Restated Articles of Incorporation of Southern California Edison Company, effective March 2,2006 (File No. 1-2313, filed as Exhibit 3.1 to Southern California Edison Company's Form 10-K for the yearended December 31 2005)*
Amended Bylaws of Southern California Edison Company, as Adopted by the Board of Directors effectiveOctober 27, 2011 (File No. 1-2313, filed as Exhibit 3.1 to Southern California Edison Company's Form 10-Qfor the quarter ended September 30, 2011)*
Edison International Senior Indenture, dated September 10, 2010 (File No. 1-9936, filed as Exhibit 4.1 toEdison International's Form 10-Q for the quarter ended September 30, 2010)*
Southern California Edison Company First Mortgage Bond Trust Indenture, dated as of October 1, 1923,Restated with all Amendments (File No. 1-2313, filed as Exhibit 4.2 to Southern California Company's Form10-K for the year ended December 31, 2010)*
Southern California Edison Company Indenture, dated as of January 15, 1993 (File No. 1-2313, Form 8-Kdated January 28, 1993)*
Amendment to 1985 Deferred Compensation Plan Agreement for Directors with James M. Rosser, datedDecember 31, 2003 (File No. 1-2313, filed as Exhibit 10.36 to Southern California Edison Company's Form 10-K for the year ended December 31, 2003)*
Director Deferred Compensation Plan as amended December 31, 2008 (File No. 1-9936, filed as ExhibitNo. 10.4 to Edison International's Form 10-K for the year ended December 31, 2008)*
2008 Director Deferred Compensation Plan, effective December 31, 2008 (File No. 1-9936, filed as ExhibitNo. 10.5 to Edison International's Form 10-K for the year ended December 31, 2008)*
Director Grantor Trust Agreement, dated August 1995 (File No. 1-9936, filed as Exhibit 10.10 to EdisonInternational's Form 10-K for the year ended December 31, 1995)*
Director Grantor Trust Agreement Amendment 2002-1, effective May 14, 2002 (File No. 1-9936, filed asExhibit 10.4 to Edison International's Form 10-Q for the quarter ended June 30, 2002)*
Executive and Director Grantor Trust Agreements Amendment 2008-1 (File No. 1-9936, filed as ExhibitNo. 10.6.2 to Edison International's Form 10-K for the year ended December 31, 2008)*
Executive Deferred Compensation Plan, as amended and restated December 31, 2008 (File No. 1-9936, filed asExhibit No. 10.5 to Edison International's Form 10-K for the year ended December 31, 2011)*
2008 Executive Deferred Compensation Plan, as amended and restated effective October 26, 2011 (FileNo. 1-9936, filed as Exhibit No. 10.6 to Edison International's Form 10-K for the year ended December 31,2011)*
Executive Grantor Trust Agreement, dated August 1995 (File No. 1-9936, filed as Exhibit 10.12 to EdisonInternational's Form 10-K for the year ended December 31, 1995)*
Executive Grantor Trust Agreement Amendment 2002-1, effective May 14, 2002 (File No. 1-9936, filed asExhibit 10.3 to Edison International's Form 10-Q for the quarter ended June 30, 2002)*
Executive Supplemental Benefit Program, as amended December 31, 2008 (File No. 1-9936, filed as ExhibitNo. 10.10 to Edison International's Form 10-K for the year ended December 31, 2008)*
Executive Retirement Plan as restated effective December 31, 2008 (File No. 1-9936, filed as Exhibit No. 10.9to Edison International's Form 10-K for the year ended December 31, 2011)*
2008 Executive Retirement Plan, as amended and restated effective October 26, 2011(File No. 1-9936, filed asExhibit No. 10.10 to Edison International's Form 10-K for the year ended December 31, 2011)*
Edison International Executive Incentive Compensation Plan, as amended in February 2009 (File No. 1-9936,filed as Exhibit 10.1 to Edison International's Form 10-Q for the quarter ended June 30, 2009)*
2008 Executive Disability Plan as amended and restated effective October 26, 2011 (File No. 1-9936, filed asExhibit No. 10.12 to Edison International's Form 10-K for the year ended December 31, 2011)*

97
ExhibitNumber Description10.13**
10.14**
10.15**
10.15.1**
10.15.2**
10.16**
10.17**
10.17.1**
10.17.2**
10.17.3**
10.17.4**
10.18**
10.18.1**
10.18.2**
10.18.3**
10.18.4**
10.18.5**
10.19**
10.19.1**
10.19.2**
2008 Executive Survivor Benefit Plan as amended and restated effective October 26, 2011 (File No. 1-9936,filed as Exhibit No. 10.13 to Edison International's Form 10-K for the year ended December 31, 2011)*
Retirement Plan for Directors, as amended and restated effective December 31, 2008 (File No. 1-9936, filed asExhibit No. 10.17 to Edison International's Form 10-K for the year ended December 31, 2008)*
Equity Compensation Plan as restated effective January 1, 1998 (File No. 1-9936, filed as Exhibit 10.1 toEdison International's Form 10-Q for the quarter ended June 30, 1998)*
Equity Compensation Plan Amendment No. 1, effective May 18, 2000 (File No. 1-9936, filed as Exhibit 10.4 toEdison International's Form 10-Q for the quarter ended June 30, 2000)*
Amendment of Equity Compensation Plans, adopted October 25, 2006 (File No. 1-9936, filed as Exhibit 10.52to Edison International's Form 10-K for the year ended December 31, 2006)*
2000 Equity Plan, effective May 18, 2000 (File No. 1-9936, filed as Exhibit 10.1 to Edison International'sForm 10-Q for the quarter ended June 30, 2000)*
Edison International 2007 Performance Incentive Plan, as amended and restated as of February 24, 2011 (FileNo. 1-9936, filed as Exhibit 10.1 to the Edison International's Form 8-K filed on April 29, 2011)*
Edison International 2008 Long-Term Incentives Terms and Conditions (File No. 1-9936, filed as Exhibit 10.2to Edison International's Form 10-Q for the quarter ended March 31, 2008)*
Edison International 2009 Long-Term Incentives Terms and Conditions (File No. 1-9936, filed as Exhibit 10.2to Edison International's Form 10-Q for the quarter ended March 31, 2009)*
Edison International 2010 Long-Term Incentives Terms and Conditions (File No. 1-9936 filed as Exhibit 10.2to Edison International Form 10-Q for the quarter ended March 31, 2010)*
Edison International 2011 Long-Term Incentives Terms and Conditions (File No. 1-9936 filed as Exhibit 10.2 toEdison International Form 10-Q for the quarter ended March 31, 2011)*
Terms and conditions for 2002 long-term compensation awards under the Equity Compensation Plan and 2000Equity Plan (File No. 1-9936, filed as Exhibit 10.1 to Edison International's Form 10-Q for the quarter endedMarch 31, 2002)*
Terms and conditions for 2003 long-term compensation awards under the Equity Compensation Plan and 2000Equity Plan (File No. 1-9936, filed as Exhibit 10.1 to Edison International's Form 10-Q for the quarter endedMarch 31, 2003)*
Terms and conditions for 2004 long-term compensation awards under the Equity Compensation Plan and 2000Equity Plan (File No. 1-9936, filed as Exhibit 10.1 to Edison International's Form 10-Q for the quarter endedMarch 31, 2004)*
Terms and conditions for 2005 long-term compensation award under the Equity Compensation Plan and 2000Equity Plan (File No. 1-9936, filed as Exhibit 99.2 to Edison International's Form 8-K dated December 16,2004 and filed on December 22, 2004)*
Terms and conditions for 2006 long-term compensation awards under the Equity Compensation Plan and 2000Equity Plan (File No. 1-9936, filed as Exhibit 10.29 to Edison International's Form 10-K for the year endedDecember 31, 2005)*
Terms and conditions for 2007 long-term compensation awards under the Equity Compensation Plan and the2007 Performance Incentive Plan (File No. 1-9936, filed as Exhibit 10.1 to Edison International's Form 10-Qfor the quarter ended March 31, 2007)*
Director Nonqualified Stock Option Terms and Conditions under the Equity Compensation Plan (FileNo. 1-9936, filed as Exhibit 10.1 to Edison International's Form 10-Q for the quarter ended June 30, 2002)*
Director 2004 Nonqualified Stock Option Terms and Conditions under the Equity Compensation Plan (FileNo. 1-9936, filed as Exhibit 10.1 to Edison International's Form 10-Q for the quarter ended June 30, 2004)*
Director Nonqualified Stock Option Terms and Conditions under the 2007 Performance Incentive Plan(File 1-9936, filed as Exhibit 10.2 to Edison International's Form 10-Q for the quarter ended March 31, 2007)*

98
ExhibitNumber Description10.20**
10.20.1**
10.20.2**
10.20.3**
10.21**
10.22**
10.23**
10.24**
10.25**
10.26
10.26.1
10.26.2
10.26.3
10.26.4
10.27**
10.28**
10.29**
10.30**
Edison International and Edison Capital Affiliate Option Exchange Offer Circular, dated July 3, 2000 (FileNo. 1-9936, filed as Exhibit 10.1 to Edison International's Form 10-Q for the quarter ended September 30,2000)*
Edison International and Edison Capital Affiliate Option Exchange Offer Summary of Deferred CompensationAlternatives, dated July 3, 2000 (File No. 1-9936, filed as Exhibit 10.2 to Edison International's Form 10-Q forthe quarter ended September 30, 2000)*
Edison International and Edison Mission Energy Affiliate Option Exchange Offer Circular, dated July 3, 2000(File No. 1-13434, filed as Exhibit 10.93 to Edison Mission Energy's Form 10-K for the year endedDecember 31, 2001)*
Edison International and Edison Mission Energy Affiliate Option Exchange Offer Summary of DeferredCompensation Alternatives, dated July 3, 2000 (File No. 1-13434, filed as Exhibit 10.94 to Edison MissionEnergy's Form 10-K for the year ended December 31, 2001)*
Estate and Financial Planning Program as amended December 31, 2008 (File No. 1-9936, filed as ExhibitNo. 10.24 to Edison International's Form 10-K for the year ended December 31, 2008)*
2008 Executive Severance Plan, as amended and restated effective October 26, 2011 (File No. 1-9936, filed asExhibit No. 10.22 to Edison International's Form 10-K for the year ended December 31, 2011)*
Edison International and Southern California Edison Company Director Compensation Schedule, as adoptedJune 23, 2011 (File No. 1-9936, filed as Exhibit 10.1 to Edison International's Form 10-Q for the quarter endedJune 30, 2011)*
Edison International Director Matching Gifts Program, as adopted June 24, 2010 (File No. 1-9936, filed asExhibit 10.1 to Edison International's Form 10-Q for the quarter ended June 30, 2010)*
Edison International Director Nonqualified Stock Options 2005 Terms and Conditions (File No. 1-9936, filed asExhibit 99.3 to Edison International's Form 8-K dated May 19, 2005, and filed on May 25, 2005)*Amended and Restated Agreement for the Allocation of Income Tax Liabilities and Benefits among EdisonInternational, Southern California Edison Company and The Mission Group dated September 10, 1996 (FileNo. 1-9936, filed as Exhibit 10.3 to Edison International's Form 10-Q for the quarter ended September 30,2002)*
Amended and Restated Tax Allocation Agreement among The Mission Group and its first-tier subsidiaries datedSeptember 10, 1996 (File No. 1-9936, filed as Exhibit 10.3.1 to Edison International's Form 10-Q for thequarter ended September 30, 2002)*
Amended and Restated Tax Allocation Agreement between Edison Capital and Edison Funding Company(formerly Mission First Financial and Mission Funding Company) dated May 1, 1995 (File No. 1-9936, filed asExhibit 10.3.2 to Edison International's Form 10-Q for the quarter ended September 30, 2002)*
Tax Allocation Agreement between Mission Energy Holding Company and Edison Mission Energy datedJuly 2, 2001 (File No. 1-9936, filed as Exhibit 10.3.3 to Edison International's Form 10-Q for the quarter endedSeptember 30, 2002)*
Administrative Agreement re Tax Allocation Payments among Edison International, Southern California EdisonCompany, The Mission Group, Edison Capital, Mission Energy Holding Company, Edison Mission Energy,Edison O&M Services, Edison Enterprises, and Mission Land Company dated July 2, 2001 (File No. 1-9936,filed as Exhibit 10.3.4 to Edison International's Form 10-Q for the quarter ended September 30, 2002)*
Form of Indemnity Agreement between Edison International and its Directors and any officer, employee orother agent designated by the Board of Directors (File No. 1-9936, filed as Exhibit 10.5 to EdisonInternational's Form 10-Q for the period ended June 30, 2005, and filed on August 9, 2005)*
Edison International 2011 Executive Annual Incentive Program (File No. 1-9936, filed as Exhibit 10.1 toEdison International's Form 10-Q for the quarter ended March 31, 2011)*Edison International Executive Perquisites (File No. 1-9936, filed as Exhibit No. 10.36 to Edison International'sForm 10-K for the year ended December 31, 2008)*Section 409A and Other Conforming Amendments to Terms and Conditions (File No. 1-9936, filed as ExhibitNo. 10.37 to Edison International's Form 10-K for the year ended December 31, 2008)*
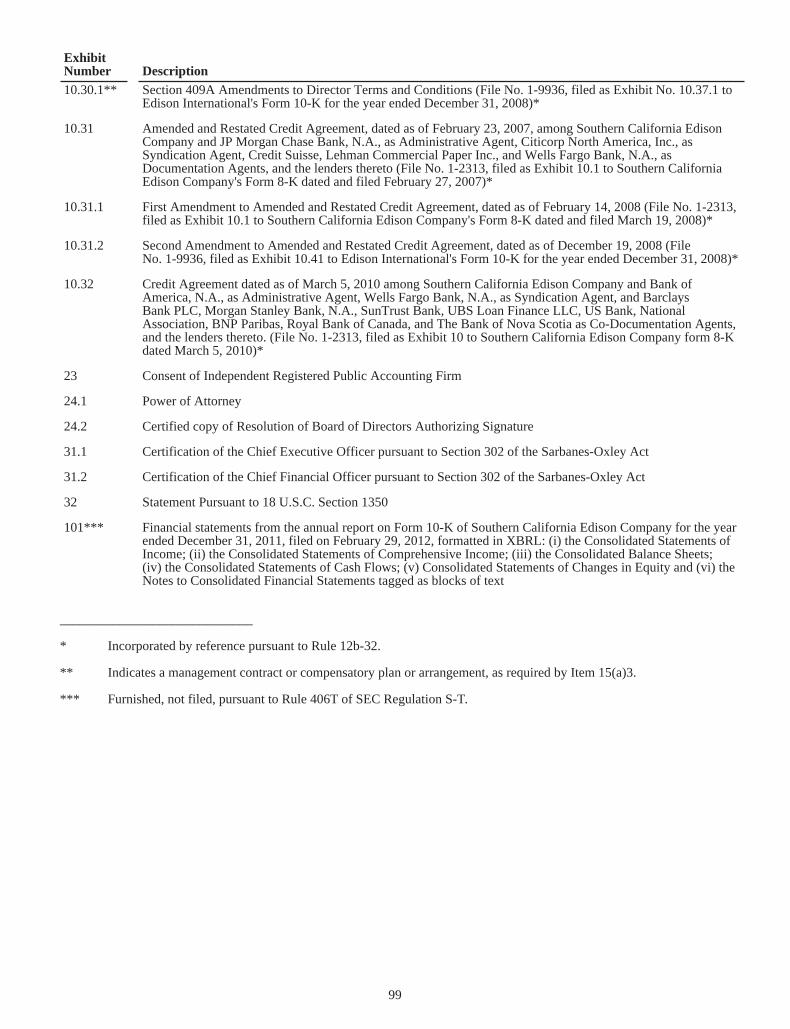
99
ExhibitNumber Description10.30.1**
10.31
10.31.1
10.31.2
10.32
23
24.1
24.2
31.1
31.2
32
101***
Section 409A Amendments to Director Terms and Conditions (File No. 1-9936, filed as Exhibit No. 10.37.1 toEdison International's Form 10-K for the year ended December 31, 2008)*
Amended and Restated Credit Agreement, dated as of February 23, 2007, among Southern California EdisonCompany and JP Morgan Chase Bank, N.A., as Administrative Agent, Citicorp North America, Inc., asSyndication Agent, Credit Suisse, Lehman Commercial Paper Inc., and Wells Fargo Bank, N.A., asDocumentation Agents, and the lenders thereto (File No. 1-2313, filed as Exhibit 10.1 to Southern CaliforniaEdison Company's Form 8-K dated and filed February 27, 2007)*
First Amendment to Amended and Restated Credit Agreement, dated as of February 14, 2008 (File No. 1-2313,filed as Exhibit 10.1 to Southern California Edison Company's Form 8-K dated and filed March 19, 2008)*
Second Amendment to Amended and Restated Credit Agreement, dated as of December 19, 2008 (FileNo. 1-9936, filed as Exhibit 10.41 to Edison International's Form 10-K for the year ended December 31, 2008)*
Credit Agreement dated as of March 5, 2010 among Southern California Edison Company and Bank ofAmerica, N.A., as Administrative Agent, Wells Fargo Bank, N.A., as Syndication Agent, and BarclaysBank PLC, Morgan Stanley Bank, N.A., SunTrust Bank, UBS Loan Finance LLC, US Bank, NationalAssociation, BNP Paribas, Royal Bank of Canada, and The Bank of Nova Scotia as Co-Documentation Agents,and the lenders thereto. (File No. 1-2313, filed as Exhibit 10 to Southern California Edison Company form 8-Kdated March 5, 2010)*
Consent of Independent Registered Public Accounting Firm
Power of Attorney
Certified copy of Resolution of Board of Directors Authorizing Signature
Certification of the Chief Executive Officer pursuant to Section 302 of the Sarbanes-Oxley Act
Certification of the Chief Financial Officer pursuant to Section 302 of the Sarbanes-Oxley Act
Statement Pursuant to 18 U.S.C. Section 1350
Financial statements from the annual report on Form 10-K of Southern California Edison Company for the yearended December 31, 2011, filed on February 29, 2012, formatted in XBRL: (i) the Consolidated Statements ofIncome; (ii) the Consolidated Statements of Comprehensive Income; (iii) the Consolidated Balance Sheets;(iv) the Consolidated Statements of Cash Flows; (v) Consolidated Statements of Changes in Equity and (vi) theNotes to Consolidated Financial Statements tagged as blocks of text
_____________________________
* Incorporated by reference pursuant to Rule 12b-32.
** Indicates a management contract or compensatory plan or arrangement, as required by Item 15(a)3.
*** Furnished, not filed, pursuant to Rule 406T of SEC Regulation S-T.

(This page has been left blank intentionally.)
BOARD OF DIRECTORS
Ronald L. LitzingerPresident Southern California EdisonA director since 2010
Jagjeet S. Bindra1,3
Retired President Chevron Global Manufacturing (an integrated energy company)Dallas, Texas A director since 2010
Vanessa C.L. Chang1,3
PrincipalEL & EL Investments(private real estate investmentcompany)Los Angeles, CaliforniaA director since 2007
France A. Córdova1,4
PresidentPurdue UniversityWest Lafayette, IndianaA director since 2004
Theodore F. Craver, Jr.Chairman of the Board,President andChief Executive OfficerEdison InternationalA director since 2007
Charles B. Curtis3,4
President EmeritusNuclear Threat Initiative(private foundation dealing withnational security issues)Washington, DCA director since 2006
Bradford M. Freeman 2,3
Founding PartnerFreeman Spogli & Co.(private investment company)Los Angeles, CaliforniaA director since 2002
Luis G. Nogales1,2
Managing PartnerNogales Investors, LLC(private equity investment company)Los Angeles, CaliforniaA director since 1993
Ronald L. Olson 3
Senior PartnerMunger, Tolles & Olson (law firm)Los Angeles, CaliforniaA director since 1995
James M. Rosser 2,4
PresidentCalifornia State University, Los AngelesLos Angeles, CaliforniaA director since 1988
Richard T. Schlosberg, III 2,4
Retired President andChief Executive OfficerThe David and Lucile Packard Foundation(private family foundation)San Antonio, TexasA director since 2002
Thomas C. Sutton1,3
Retired Chairman of the Board and Chief Executive OfficerPacific Life Insurance CompanyNewport Beach, CaliforniaA director since 1995
Peter J. Taylor1
Executive Vice President andChief Financial OfficerUniversity of CaliforniaOakland, CaliforniaA director since 2011
Brett White 2,4
President andChief Executive OfficerCB Richard Ellis(commercial real estate services company)Los Angeles, CaliforniaA director since 2007
1 Audit Committee2 Compensation and ExecutivePersonnel Committee
3 Finance Committee4 Nominating/Corporate GovernanceCommittee

MANAGEMENT TEAM
Douglas R. BauderVice President, Generation andStation Manager,San Onofre Nuclear Generating Station
Robert C. BoadaVice President and Treasurer
Lisa D. CagnolattiVice President,Business Customer Division
Caroline ChoiVice President,Regulatory & Environmental Policy
Kevin R. CiniVice President,Rate Challenge Project
Ann P. CohnVice President andAssociate General Counsel
Chris C. DominskiVice President andController
Steven D. EisenbergVice PresidentEnergy Supply and Management
Veronica GutierrezVice President,Local Public Affairs
Harry B. HutchisonVice President,Customer Service Operations
Todd L. InlanderVice President,Client Services Planning and Controls
Akbar JazayeriVice President,Regulatory Operations
Walter J. JohnstonVice President,Power Delivery
Megan K. JordanVice President,Corporate Communications
Seth J. KinerVice President,Customer Programs and Services
R. W. (Russ) Krieger, Jr.Vice President,Power Production
Barbara E. MathewsVice President,Associate General Counsel,Chief Governance Officer andCorporate Secretary Patricia H. MillerVice President,Human Resources
Stacy R. MinesVice President and Chief Ethics and Compliance Officer
Paul L. MultariVice President,Major Projects
Thomas J. PalmisanoVice President,Nuclear Engineering
Kevin M. PayneVice President,Engineering and Technical Services
Michael L. PinterVice President,Technology Delivery and Maintenance
Walter RhodesVice President,Supply Management
Megan Scott-KakuresVice President and General Auditor
Marc L. UlrichVice President,Renewable and Alternative Power
Ronald L. LitzingerPresident
Stephen E. PickettExecutive Vice President,External Relations
Lynda L. ZieglerExecutive Vice President,Power Delivery Services
Peter T. Dietrich Senior Vice President,Generation and Chief Nuclear Officer
Erwin G. FurukawaSenior Vice President,Customer Service
Stuart R. HemphillSenior Vice President,Power Supply
Cecil R. HouseSenior Vice President,Safety & Operations Support andChief Procurement Officer
David L. MeadSenior Vice President,Transmission & Distribution
Leslie E. StarckSenior Vice President,Regulatory Affairs
Linda G. SullivanSenior Vice President andChief Financial Officer
Russell C. SwartzSenior Vice President andGeneral Counsel
Gaddi H. VasquezSenior Vice President,Public Affairs
Mahvash YazdiSenior Vice President,Information Technology andBusiness Integration andChief Information Officer
SOUTHERN CALIFORNIA EDISON COMPANY
An Edison International (NYSE:EIX) company,Southern California Edison is one of the nation’slargest electric utilities serving a population ofnearly 14 million via 4.9 million customer ac-counts in a 50,000-square-mile service area withinCentral, Coastal and Southern California.
SHAREHOLDER INFORMATION
This annual report is printed on recycled paper.
Annual MeetingThe annual meeting of shareholders will
be held on Thursday, April 26, 2012, at
9:00 a.m., Pacific Time, at the Hilton Los
Angeles San Gabriel Hotel, 225 West Valley
Boulevard, San Gabriel, California 91776.
Corporate Governance PracticesA description of SCE’s corporate gover-
nance practices is available on our
Web site at www.edisoninvestor.com.
The SCE Board Nominating/Corporate
Governance Committee periodically reviews
the Company’s corporate governance prac-
tices and makes recommendations to the
Company’s Board that the practices be up-
dated from time to time.
Stock and Trading InformationSCE's 4.08%, 4.24%, 4.32% and 4.78%
Series of $25 par value cumulative preferred
stock are listed on the NYSE Amex Equities
stock exchange. Previous day's closing
prices, when stock was traded, are listed in
the daily newspapers under NYSE Amex.
Shares of SCE's preference stock are not
listed on an exchange.
Transfer Agent and RegistrarWells Fargo Bank, N.A., which maintains
shareholder records, is the transfer agent
and registrar for SCE’s preferred and prefer-
ence stock. Shareholders may call Wells
Fargo Shareowner Services, (800) 347-
8625, between 7 a.m. and 7 p.m. (Central
Time), Monday through Friday, to speak
with a representative (or to use the interac-
tive voice response unit 24 hours a day,
seven days a week) regarding:
n stock transfer and name-change requirements;
n address changes, including dividend payment addresses;
n electronic deposit of dividends;
n taxpayer identification number submissions or changes;
n duplicate 1099 and W-9 forms;
n notices of, and replacement of, lost or destroyed stock certificates and
dividend checks; and
n requests for access to online account information.
Inquiries may also be directed to:Wells Fargo Bank, N.A.
Shareowner Services Department
161 North Concord Exchange Street
South St. Paul, MN 55075-1139
Fax(651) 450-4033
Wells Fargo Shareowner ServicesSM
www.wellsfargo.com/shareownerservices
Investor Rela tionswww.edisoninvestor.com
Email: [email protected]
Phone: (877) 379-9515
Online account information www.shareowneronline.com
36027 Merrill Cvrs_Layout 1 2/29/12 4:12 PM Page 2

SAFERELIABLE
AFFORDABLE
2011 ANNUAL REPORT
2244 Walnut Grove AvenueRosemead, California 91770www.sce.com
SCEAR2012
36027 Merrill Cvrs_Layout 1 2/29/12 4:12 PM Page 1