Embed Size (px)
Citation preview

Safeguarding SCADA Systems with Anomaly Detection
John Bigham1, David Gamez1 and Ning Lu1
1 Department of Electronic Engineering, Queen Mary, University of London, London, E1 4NS, UK
{john.bigham, david.gamez, ning.lu}@elec.qmul.ac.uk
Abstract. This paper will show how the accuracy and security of SCADA systems can be improved by using anomaly detection to identify bad values caused by attacks and faults. The performance of invariant induction and n-gram anomaly-detectors will be compared and this paper will also outline plans for taking this work further by integrating the output from several anomaly-detecting techniques using Bayesian networks. Although the methods outlined in this paper are illustrated using the data from an electricity network, this re-search springs from a more general attempt to improve the security and depend-ability of SCADA systems using anomaly detection.
1. Introduction
Over the last fifteen years a considerable amount of research has been done on the protection of IP networks against malicious viruses and attacks. We now have intru-sion detection systems, firewalls, virus detectors and even a certain amount of anom-aly-detecting software making its way into commercial production [2]. SCADA sys-tems play a vital control and information-gathering role in many industries, but until recently very little effort has been expended on their security. The main reason for this is that they have generally been run using obscure protocols and they have had lit-tle connection to the outside world. Today this is changing: there is now an increasing interconnectivity of everything, SCADA systems are moving over to standard proto-cols, and the deregulation of many industries (especially the electricity industry) makes their control systems more vulnerable to manipulation by malicious insiders.
Two approaches can be taken to securing SCADA systems. One is to identify prob-lems at the perimeter of the system using virus and intrusion detection software to identify known attacks and viruses. This provides a good defence against external at-tackers, but it does nothing to prevent insiders from abusing the system and it is also unable to detect unknown attacks and viruses. A second approach is to model the normal data flows and control operations within the SCADA system to detect anoma-lies caused by attempts to change or damage the system. This has the advantage that it can detect unknown attacks and the actions of malicious insiders, but unless it is han-dled carefully it can generate a lot of false alarms.
In the work on anomaly detection that has been carried out so far, the main empha-sis has been on monitoring the behaviour of the system (sequences of function calls, connections between machines, and so on) rather than the data passed around the sys-tem. Since there is almost no open source SCADA software and many of the data-
gathering applications run on proprietary hardware, an analysis of functional behav-iour is not the best place to start with anomaly detection. The detection of anomalies within the data is a much more promising area of investigation.
SCADA systems are used to control processes ranging from electricity networks to chemical plants. Although in the longer term a solution is needed that can be applied to many different areas, it was decided to start with the data from electricity networks, since this is more systematically related than that from other sources. The techniques described in this paper are being developed as part of the Safeguard IST project [17], and they will eventually be incorporated into agents that are used detect and repair anomalies within large complex critical infrastructures.
2. An Overview of the Electricity Management Network
A typical electricity network is managed from a control centre containing a number of computers running server, database, firewall, monitoring and control software. This is connected via a wide area network to a number of data acquisition systems (DAS), which in turn are connected to remote terminal units (RTU), which send data readings from local sites in response to requests from software running in the control centre. The electricity network is managed by sending control signals from the control centre to the RTUs, which control breakers, transformers, switches and so on. The data ac-quisition and control parts of this management network are its SCADA (Serial Con-trol And Data Acquisition) system.
Remote Terminal Unit
DAS
RTU
Data Acquisition System Wide Area Network
DAS
Operator GUI EMS system PC-based
applications, including load management & state estimation
Control centre
RTU RTU
RTU
DAS
RTU RTU
RTU
DAS
RTU RTU
Corporate network
Independent System Operator
Manufacturer support
Fig. 1. An electricity management network
The data that is gathered by electricity SCADA systems is incomplete and subject to substantial corruption and loss. To cope with these problems, a program called a state estimator is used, which takes the data, assigns weights to it according to its

credibility, and uses the known electrical properties of the network to calculate a best-fit hypothesis about its current state. A limitation of state estimation is that it cannot cope with massive data loss and it usually assumes that its picture of the topology of the network (i.e. which breakers are open or closed) is correct. This is a risky assump-tion since there are often configuration errors and there is always the chance that an attacker could be mediating between the control centre and the electricity network. State estimation techniques are also less applicable when the equations relating the data values are less well defined – in water systems and chemical plants for example.
When the state estimator cannot reach a result because of corruption or insufficient data a second technique is brought into play. This is the suggestion of pseudo-measurements, which are rough guesses (generally based on statistics) as to what the corrupt or missing readings should be. Using these pseudo-measurements the state es-timator can come up with an improved guess about the true state of the network.
3. Vulnerabilities of SCADA Systems
Although there has been a lot of hype about the prospect of cyber-terrorists taking control of SCADA systems,1 there remains a very real threat to them from insiders and outsiders. Power and energy companies are frequent targets of attacks and ap-proximately 60% of them experienced at least one severe security alert in the last six months [9]. There have also been a couple of incidents in the last few years where SCADA systems have been severely compromised:2
• In November 2001 an attacker used the Internet, a wireless radio and stolen control software to release up approximately one million liters of raw sewage into the river and coastal waters of Maroochydore in Queensland, Australia.
• In 1994 an attacker broke into the computers of an Arizona water facility: the Salt River Project in the Phoenix area. In addition to outside attacks there is also a threat from insiders,3 whose greater
technical knowledge enables them to do greater damage to the system. Operator errors are also a frequent source of disruption.
Once an attacker is inside an electricity SCADA system, there are a number of ma-licious actions that they can perform:
• Changing data values. By manipulating data readings an attacker can deceive the operators about the power and voltages on the network. If an operator acts on the false information, they can put the electricity network into a dangerous state.
• Changing control signals. An attacker could block control signals and issue false confirmations. Operators would be lead to think that breakers are closed when they are open or that a transformer is malfunctioning when it is not.
1 See [11] for a critical assessment of this hype. 2 These examples are taken from [13] and [11]. More information about electricity vulnerabili-
ties can be found in [12]. 3 The most recent dti survey [4] reports that 48% of large businesses blame their worst security
incident on insider activity.
• Opening breakers. The attacker could take direct control of the network and send control signals to shut parts of it down. The operators’ attempts to restart the net-work could be blocked with a denial of service over the SCADA system.
• Fraud. In the future, the metering of electricity will be done remotely, probably over IP. Attackers could fraudulently manipulate these readings.
• Overload. In the future, electricity companies are likely to have much more control over demand, for example switching on water heaters in homes when there is low demand. An attacker could overload the electricity system by switching on all the electricity devices across the country at a period of high demand.
The most dangerous scenario is a combination of these disruptions, which could cause a similar loss of control to that experienced when the Legion of Doom took over Southern Bell’s telephone network in 1989.4
4. Detecting Anomalous Events in SCADA Systems
This paper will compare two approaches to modelling SCADA data from an electric-ity network: one that treats the data as text and learns the normal patterns within this text (n-gram), the other which treats the data as numbers and looks for invariants, such as mathematical relationships between the numbers (invariant induction).
4.1 N-gram
This technique was initially developed by Marc Damashek, who used it to classify texts independently of errors and the language they were written in. N-gram scanning works by moving a sliding window of width n along a text and recording the number of occurrences of each sequence of characters in the window. For example, if the sys-tem has to process “The cat sat on the mat” using a sliding window of width two, “Th”, “he”, “e ” and so on will be read into the database until the entire document (or string in this case) has been read in. The result is a representation of the document as a vector containing the relative frequencies of its distinct constituent n-grams, which can then be used to measure the similarity between documents.
To apply this technique to the data from an electricity network a number of modifi-cations need to be made. To begin with, this approach is normally error tolerant and here it was necessary to detect errors rather than tolerate them. In electricity meas-urements, if a decimal point is dropped or a sign reversed, a radically different read-ing can result. The n-gram technique is error tolerant because it is essentially a statis-tical technique that measures the distribution of n-grams in the data. To make it more error sensitive it was decided to start with a non-statistical n-gram model of the data, which simply records whether a particular n-gram occurs in the training data or not. This is very similar to Forrest’s stide technique [7], which was used to model the normal sequences of system calls within a Linux system. To reduce the size of the normal model it was decided to work with just the first four characters of each meas-
6 See Bruce Stirling, The Hacker Crackdown [18] for more on this.

urement. These included the sign of the reading, the position of the decimal point and the most significant digits. Each movement of the sliding window was then advanced four characters along the data so that each successive n-gram covered a new reading. To increase the generalisation offered by the system, a degree of approximation be-tween the n-grams held in the database and the test n-grams was also introduced.
The advantage of the n-gram technique is that it will work with data in any format and it should even work with some forms of encrypted data. A further benefit is that it does not depend upon mathematical relationships between the data readings and so it is a natural complement to invariant induction. The limitation of this approach is that it has difficulty detecting errors that occur close together because a single error cre-ates a zero response for the entire time that the sliding window is over it.
4.2 Invariant Induction
This approach builds up a normal model of the data by looking for relationships be-tween the different data readings. These are expressed as invariants, i.e. facts which should always hold in the current context. In the data from electricity networks this approach is particularly effective since most of the data is interrelated in a systematic manner. For example, in the networks that we have experimented on, the relationship between the power flow readings at either end of a line are, to a high degree of accu-racy, of the form P1 = kP2 + C, where k and C are constants. Initially a certain num-ber of invariants are hypothesised for the readings from the network. Some relation-ships are based on physical relationships, but others will simply be empirical relationships that are found in the training data. As more data comes in, some of these relationships will be discarded because they no longer hold and eventually one is left with a set of relationships which hold for all of the training data. A simplified exam-ple of this technique now follows.
Suppose that this approach is being applied to the three bus network in Fig. 2.
Fig. 2. Three bus electricity network
Table 1. Real power readings for three bus network
Time P1 P2 P3 P4 P5 P6
T1 200 -190 60 -59.4 -70 67.9 T2 220 -209 50 -49.5 -100 97 T3 240 -228 80 -79.2 -150 145.5
P5P4
P6P3
P1 P2
Bus 3Bus 2Bus 1

Table 1 shows three sets of real power readings for this network. If the only rela-tionships that are hypothesised are linear equations through the origin, then at time T1 it is possible to hypothesise the following six equations:
P1 = - 1.05 P2 (1)
P3 = - 1.01 P4 (2)
P5 = - 1.03 P6 (3)
P1 = 3.33 P3 (4)
P1 = - 3.37 P4 (5)
P1 = 2.86 P5 (6)
At times T2 and T3, equations (4), (5) and (6) (and the rest of the potential linear equations) no longer hold and the model of the normal relationships between the data readings reduces down to (1), (2) and (3). If these equations do not hold in a future test data set, this could indicate data corruption or loss, or the manipulation of data by a malicious attacker. In practice, an approximate model will be fitted to the training data and its residual computed (e.g. least squares).
An advantage of this technique is that the beliefs that are encapsulated in the in-variants can be used to form beliefs about the components of the invariants. For ex-ample, if the power readings at each end of a link between two buses do not satisfy the linear relationship, then one of the power readings must be at fault. Information about the range of typical readings and the last known breaker state can then be used to discover whether there is an error in the power sensor reading or in the breaker sen-sor reading. This allows you to connect topology information and power readings lo-cally and adjust the weights on the input to the state estimator.
A limitation of this approach is that you can only identify incorrect readings by looking at the relationships of the two candidates with other correct readings. If a sign reverses on P1, equation (1) will no longer hold, but it will not be known whether this is because P2 should be negative or P1 positive unless there are further equations linking P1 and P2 with other readings. These further equations may not always be available if there is a substantial amount of corruption.
5. Previous Work
5.1 N-grams
Marc Damashek was one of the first to develop the n-gram technique [3]. His system has been successfully used it to classify documents independently of errors and lan-guage. In the application of this technique presented here, the aim has been rather dif-ferent, since although the format of the data is ultimately unimportant, the errors are critical and so Damashek’s statistical approach could not be adopted unaltered.
The simplified non-statistical version of Damashek’s technique used in these ex-periments is also similar to Stephanie Forrest’s sequence time-delay embedding

(stide) methodology, described in [7] and elsewhere, which was used to track the be-haviour of applications by identifying abnormal sequences of their system calls. The focus in Forrest’s work is on the behaviour of the system, not on the data passed around it, and there was little need in the context of her work to track down the exact position of errors and suggest corrections.
5.2 Invariant Induction
Since Langley’s BACON system [10], there has been a substantial amount of work on equation induction within the AI and engineering communities and a number of sys-tems have been developed [5], [15]. However the main aim of this work was to dis-cover equations that could be used by engineers and there has not been any applica-tion of the learnt equations to the problem of SCADA security and anomaly detection.
Research into the more general problem of invariant induction has been carried out by Michael Ernst, whose Daikon system [6] dynamically identifies invariant proper-ties of the variables within a program by instrumenting its source code and running it over a test bed that is intended to give a comprehensive coverage of the program’s behaviour. As the program runs the variables are analysed for invariant properties, such as x > 10, x + y = 35, etc. Although Ernst’s techniques are similar to the ones de-scribed in this paper, the area of application is different. Ernst’s approach is orientated towards debugging applications and not towards building up a normal model of SCADA data and using this to detect intrusions. Furthermore, Ernst’s pruning tech-nique does not allow invariants that are usually true, e.g. 99% of the time.
5.3 Support for the State Estimator in Electricity Networks
A lot of research has been carried out on the development of state estimation and the extension of it to include topology errors. This includes the work by Clements on the identification of topology errors [1] [14] and recent research by Wollenberg on massive data loss and pseudo-measurements [8]. However, none of the work so far has applied anomaly-detecting techniques to these problems and very little work has been done on intrusion detection in SCADA systems.
6. Experiments
Using a load flow program,5 real and reactive power flow measurements for a six bus network were calculated for total system loads varying over the annual cycle given with the specification of the IEEE 24 bus test network [16]. This provided 8736 files containing snapshots of the network for every hour of every day for a year. To test the false positive rate of the anomaly detectors, one in ten of these files was set
5 For these experiments we adapted the load flow program supplied with Wood & Wollen-
berg’s Power Generation, Operation and Control [20].

aside and then the n-gram and invariant induction techniques were used to learn nor-mal models of the network.
Test data was generated by introducing between 1 and 44 random errors into a se-lection of the normal data files. These errors included changing the sign of a reading, moving the decimal point to the right or left and swapping one of the digits with a random number. The ability of the two anomaly-detecting techniques to identify the errors was then evaluated.
7. Results
The first set of experiments measured the true and false positive rates per file for the two techniques, which were used to identify whether a complete snapshot of the net-work was normal or abnormal. Different sliding window lengths were used for the n-gram technique and different threshold settings for the invariant induction. The results are shown in figures 3, 4, 5 and 6.
Fig. 3. The average true positive rates for the n-gram technique plotted against the number of power readings in the sliding window6 us-ing three different approximation levels
Fig. 4. The average false positive rates for the n-gram technique plotted against the number of power readings in the sliding window using three different approximation levels.
The next set of experiments measured the ability of the two techniques to correctly
identify errors within each corrupted file. For the n-gram technique, the sliding win-dows that covered six and eight data readings gave the best results when identifying errors on a file by file basis and so these window lengths were used to identify errors within each file. For the invariant induction, a threshold setting of 1.96s, where s is the standard deviation of the residual error, was chosen. Since we were focusing on the induction of linear equations in these experiments, this technique could only indi-cate whether there was an error in a line (represented by two readings) and it could not identify individual points in a file that were corrupt. It was also found that the re-lationship between the reactive power readings was non-linear and so errors could not 6 Four characters from each power reading were read into the n-gram model and so a sliding
window that includes eight power readings will have a length of thirty two characters.
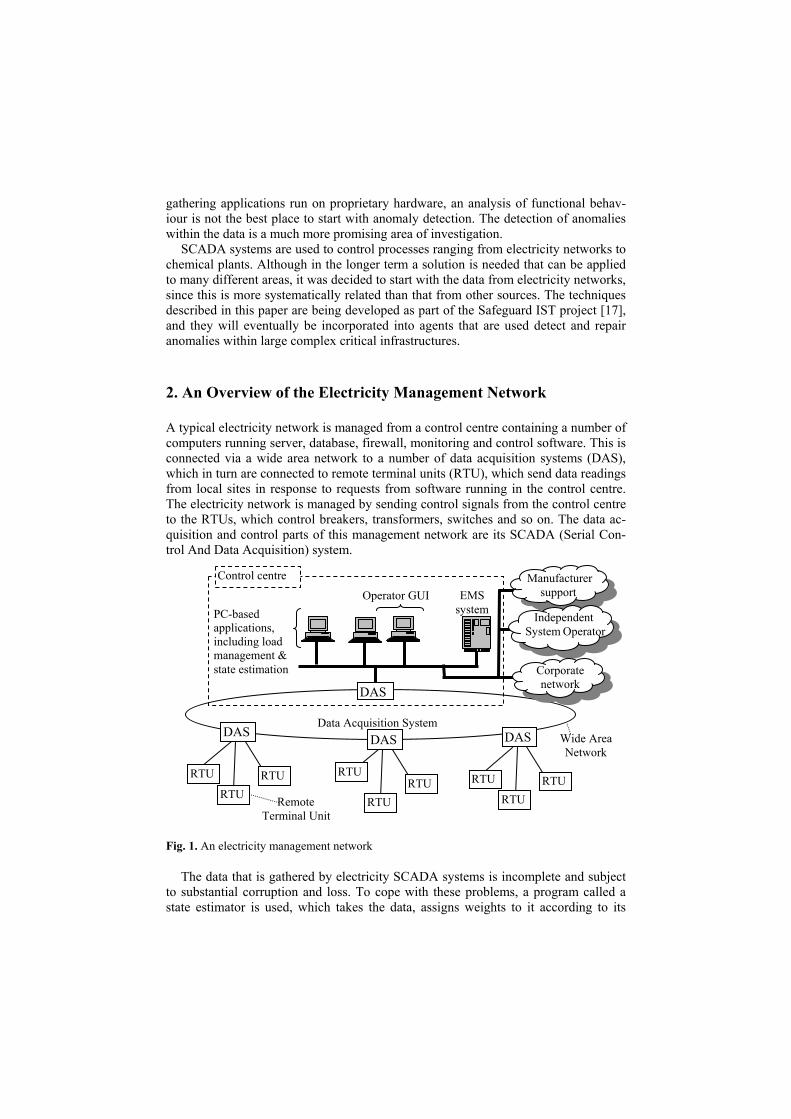
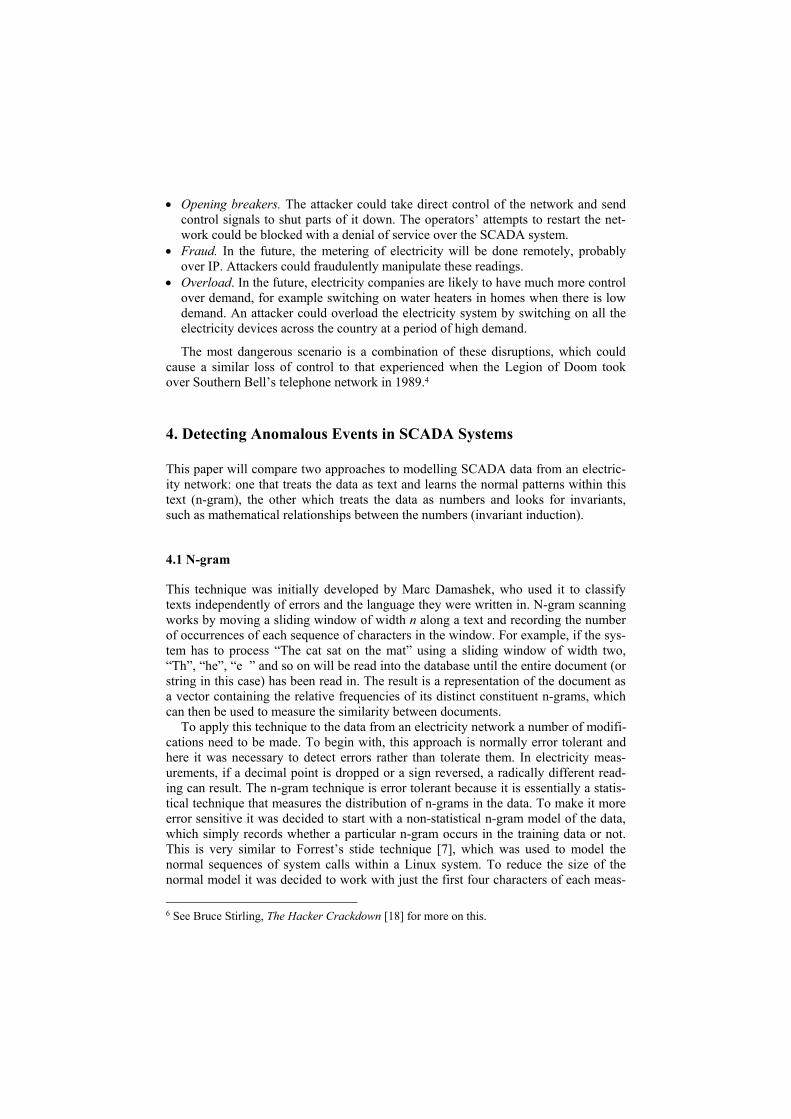
be identified in these values. This meant that a maximum of eleven line errors could be detected by invariant induction; whereas the n-gram technique could theoretically detect up to forty four corruptions in the file. Results are shown in Fig. 7 and Fig. 8.
Fig. 5. True positive rate for invariant induc-tion plotted against the multiple of the stan-dard error used to trigger an anomaly
Fig. 6. False positive rate for invariant induc-tion plotted against the multiple of the stan-dard error used to trigger an anomaly
Fig. 7. Plot of the number of errors in the dataagainst the average number of errors accu-rately detected by the n-gram technique
Fig. 8. Plot of the number of errors per line against the average number of line errors ac-curately detected by invariant induction
8. Discussion
Both techniques performed well in the first experiment. A sliding window that in-cluded six data readings7 and an approximation level of two could identify ninety 7 Here again we encounter the magic number six, which has been the optimal window length in
many anomaly-detecting experiments. Tan and Maxion [19] claim that the frequent occur-rence of this number is an artifact of Forrest’s data, but this cannot be the explanation here. The coincidence is also not as close as it appears. Although six data readings proved optimal, with four characters in each reading, the actual window length was 24 characters.
eight percent of the corrupt files with a one percent false positive rate. With a stan-dard deviation of two, the invariant induction technique identified ninety one percent of the corrupt files with a four percent false positive rate.
In the second experiment, the n-gram technique proved to be good at accurately identifying small numbers of errors within each file, but as the errors increased the false positive rates started to make the results meaningless.8 In practice it will proba-bly be sufficient to identify one or two errors in each file or to identify the file as completely corrupt and for this the n-gram technique is sufficient. Invariant induction performed much better on this task and with just one invariant type, this approach proved successful at identifying line corruptions within the files. In these experiments, invariant induction could only identify pairs of readings containing an error, however the performance of this technique will improve as it is extended to include other in-variants not described here (such as the sum of the real and reactive powers being zero and topology dependent range checks).
These results suggest that the best way to detect anomalies within electricity data is to combine more than one anomaly-detecting technique. Whilst n-grams perform bet-ter on the identification of corrupt files and at pinpointing small numbers of errors within files, invariant induction has a better overall performance on the identification of errors within files. The combined results from both methods could be used to adjust the weighting on data going into the state estimator.
9. Future Work
The first stage of our future work will be to improve the anomaly detectors by extend-ing the invariant induction to include more sophisticated equations and testing the ability of the n-gram technique to handle encrypted data. Preliminary experiments have suggested that although some forms of encryption reduce the ability of the n-gram technique to provide approximate matches, they do not entirely prevent it from recording normal sequences and identifying deviations.
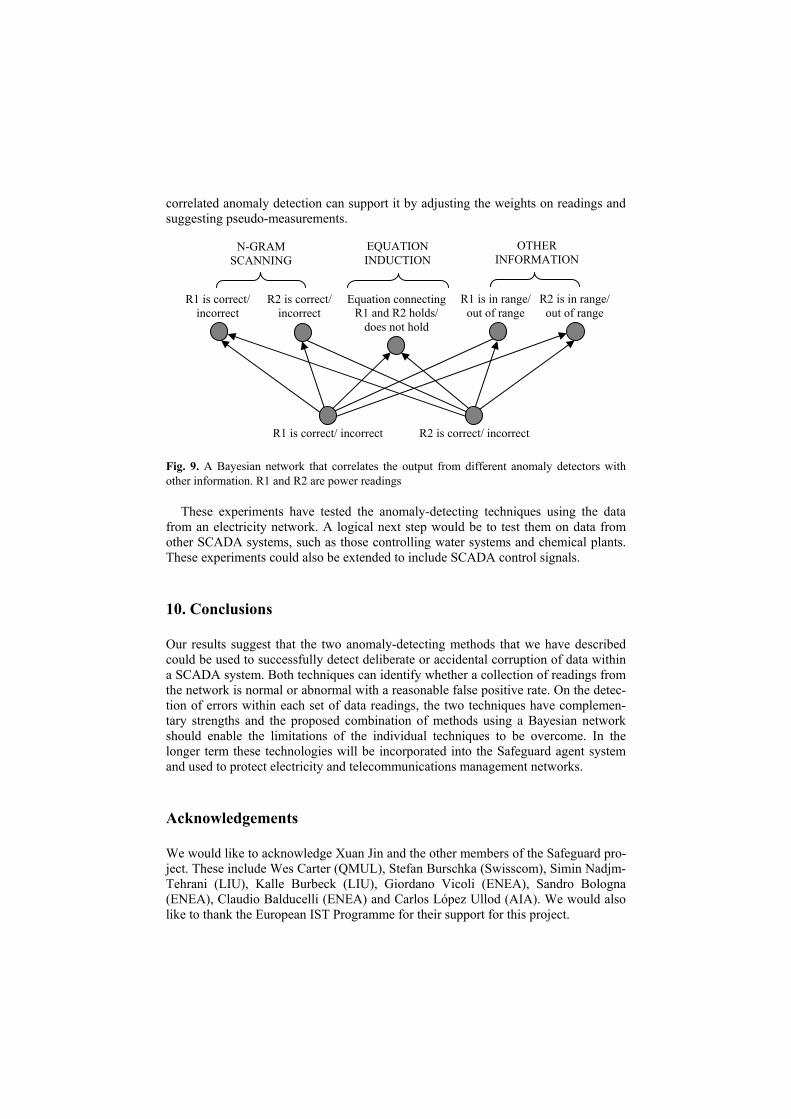
The results so far have indicated that anomaly detection can be improved by com-bining several different anomaly detectors. An effective way of doing this would be to use a Bayesian network to correlate their outputs with other data sources. This should reduce the false positive rate and would enable more accurate pinpointing of errors. In Fig. 9, information from the n-gram and invariant anomaly detectors is brought to-gether with a range checker using the Bayesian network, which works out which read-ing has been corrupted and could suggest a pseudo measurement for that reading. These correlation techniques can also be extended to integrate information from many different independent sources and create higher level concepts and beliefs about them.
The work on improving and correlating the anomaly detectors will be used to study the interactions between the anomaly detectors and the state estimator. As explained in section 2, the state estimator offers an effective way of evaluating the state of the network and the purpose here has not been to duplicate its work, but to improve it. Experiments need to be carried out to evaluate the performance of the state estimator on corrupted data, determine its limitations and then investigate the extent to which 8 Results were plotted up to a false positive rate of 20%.
correlated anomaly detection can support it by adjusting the weights on readings and suggesting pseudo-measurements.
OTHER INFORMATION
EQUATION INDUCTION
N-GRAM SCANNING
R1 is correct/ incorrect
Equation connecting R1 and R2 holds/
does not hold
R1 is in range/out of range
R1 is correct/ incorrect
R2 is in range/ out of range
R2 is correct/ incorrect
R2 is correct/ incorrect
Fig. 9. A Bayesian network that correlates the output from different anomaly detectors with other information. R1 and R2 are power readings
These experiments have tested the anomaly-detecting techniques using the data from an electricity network. A logical next step would be to test them on data from other SCADA systems, such as those controlling water systems and chemical plants. These experiments could also be extended to include SCADA control signals.
10. Conclusions
Our results suggest that the two anomaly-detecting methods that we have described could be used to successfully detect deliberate or accidental corruption of data within a SCADA system. Both techniques can identify whether a collection of readings from the network is normal or abnormal with a reasonable false positive rate. On the detec-tion of errors within each set of data readings, the two techniques have complemen-tary strengths and the proposed combination of methods using a Bayesian network should enable the limitations of the individual techniques to be overcome. In the longer term these technologies will be incorporated into the Safeguard agent system and used to protect electricity and telecommunications management networks.
Acknowledgements
We would like to acknowledge Xuan Jin and the other members of the Safeguard pro-ject. These include Wes Carter (QMUL), Stefan Burschka (Swisscom), Simin Nadjm-Tehrani (LIU), Kalle Burbeck (LIU), Giordano Vicoli (ENEA), Sandro Bologna (ENEA), Claudio Balducelli (ENEA) and Carlos López Ullod (AIA). We would also like to thank the European IST Programme for their support for this project.
References
1. Clements, K. A. and Davis P. W., ‘Detection and Identification of Topology Errors in Elec-tric Power Systems, IEEE Transactions on Power Systems, Vol. 3, No. 4, November 1988.
2. CylantSecure, www.cylant.com. 3. Damashek, Marc. ‘Gauging Similarity with n-Grams: Language-Independent Categorization
of Text’, Science, Vol. 267, 10 February 1995, pp. 843 – 848. 4. dti (Department of Trade and Industry, UK). ‘Information Security Breaches Survey 2002’,
available at: https://www.security-survey.gov.uk/ isbs2002_detailedreport.pdf. 5. Džeroski, Sašo and Todorovski, Ljupčo, ‘Discovering Dynamics: From Inductive Logic Pro-
gramming to Machine Discovery’, Journal of Intelligent Systems, 4, 89-108, 1994. 6. Ernst, Michael. Dynamically Discovering Likely Program Invariants, PhD Thesis, University
of Washington 2000. 7. Forrest, S., Hofmeyr, S., Somayaji, A. and Longstaff, T., ‘A sense of self for unix processes’.
Proceedings of the 1996 IEEE Symposium on Computer Security and Privacy. IEEE Press, 1996.
8. González-Pérez, Carlos and Wollenberg, Bruce F., ‘Analysis of Massive Measurement Loss in Large-Scale Power System State Estimation’, IEEE Transactions on Power Systems, Vol. 16, No. 4, November 2001.
9. Higgins, Mark (ed.), Symantec Internet Security Threat Report, Volume 3, February 2003. 10. Langley, P., Simon, H. and Bradshaw, G. ‘Heuristics for empirical discovery’, in Bolc, L.
(editor) Computational Models of Learning, Berlin: Springer, 1987. 11. Lemos, Robert, Borland, John, Bowman, Lisa and Junnarkar, Sandeep, ‘E-terrorism’,
News.com Special Report, August 27, 2002 12. National Security Telecommunications Advisory Committee Information Assurance Task
Force, ‘Electric Power Risk Assessment’, March 1997: http://www.ncs.gov/n5_hp/Re-ports/EPRA/electric.html.
13. Oman, Paul, Schweitzer, E. and Roberts, Jeff ‘Safeguarding IEDs, Substations, and SCADA Systems Against Electronic Intrusions’, available at: http://tesla.selinc.com/techpprs.htm.
14. Pereira, Jorge Correia, Saraiva, João Tomé, Miranda, Vladimiro, Costa, Antonio Simões, Lourenço and Clements, K. A., ‘Comparison of Approaches to Identify Topology Errors in the Scope of State Estimation Studies’, Proceedings of the 2001 IEEE Porto Power Tech Conference, 10th – 13th September, Porto, Portugal.
15. Rao, R.B.; Lu, S.C.-Y., ‘KEDS: a knowledge-based equation discovery system for engi-neering problems’, Proceedings of the Eighth Conference on Artificial Intelligence for Ap-plications, 2-6 Mar 1992, pp. 211 -217.
16. Reliability Test System Task Force of the Application of Probability Methods Subcommit-tee, ‘IEEE Reliability Test System’, IEEE Transactions on Power Apparatus and Systems, Vol. PAS-98, No. 6 Nov./ Dec. 1979.
17. Safeguard website: www.ist-safeguard.org. 18. Sterling, Bruce, The Hacker Crackdown, available at: http://www.mit.edu/hacker/
hacker.html 19. Tan, Kymie M. C. and Maxion, Roy A. "Why 6? Defining the Operational Limits of stide,
an Anomaly-Based Intrusion Detector." IEEE Symposium on Security and Privacy, pages 188-201, Berkeley, California, 12-15 May 2002.
20. Wood, Allen J. and Wollenberg, Bruce F., Power Generation, Operation and Control (Sec-ond Edition), New York: John Wiley & Sons, Inc., 1996.