Embed Size (px)
Citation preview
SAFEGUARDS FOR THE URANIUM EXTRACTION (UREX) +1A
PROCESS
A Thesis
by
JESSICA SHAWN FEENER
Submitted to the Office of Graduate Studies of Texas A&M University
in partial fulfillment of the requirements for the degree of
MASTER OF SCIENCE
May 2010
Major Subject: Nuclear Engineering

SAFEGUARDS FOR THE URANIUM EXTRACTION (UREX) +1A
PROCESS
A Thesis
by
JESSICA SHAWN FEENER
Submitted to the Office of Graduate Studies of Texas A&M University
in partial fulfillment of the requirements for the degree of
MASTER OF SCIENCE
Approved by:
Chair of Committee, William S. Charlton Committee Members, Sean M. McDeavitt Jasen J. Castillo Head of Department, Raymond Juzaitis
May 2010
Major Subject: Nuclear Engineering
iii
ABSTRACT
Safeguards for the Uranium Extraction (UREX) +1a Process.
(May 2010)
Jessica Shawn Feener, B.S., Georgia Institute of Technology
Chair of Advisory Committee: Dr. William S. Charlton
As nuclear energy grows in the United States and around the world, the expansion
of the nuclear fuel cycle is inevitable. All currently deployed commercial reprocessing
plants are based on the Plutonium – Uranium Extraction (PUREX) process. However,
this process is not implemented in the U.S. for a variety of reasons, one being that it is
considered by some as a proliferation risk. The 2001 Nuclear Energy Policy report
recommended that the U.S. “develop reprocessing and treatment technologies that are
cleaner, more efficient, less waste-intensive, and more proliferation-resistant”. The
Uranium Extraction (UREX+) reprocessing technique has been developed to reach these
goals. However, in order for UREX+ to be considered for commercial implementation, a
safeguards approach is needed to show that a commercially sized UREX+ facility can be
safeguarded to current international standards.
A detailed safeguards approach for a UREX+1a reprocessing facility has been
developed. The approach includes the use of nuclear material accountancy (MA),
containment and surveillance (C/S) and solution monitoring (SM). Facility information
was developed for a hypothesized UREX+1a plant with a throughput of 1000 Metric
Tons Heavy Metal (MTHM) per year. Safeguard goals and safeguard measures to be
implemented were established. Diversion and acquisition pathways were considered;
however, the analysis focuses mainly on diversion paths. The detection systems used in
the design have the ability to provide near real-time measurement of special fissionable
material in feed, process and product streams. Advanced front-end techniques for the
quantification of fissile material in spent nuclear fuel were also considered. The
economic and operator costs of these systems were not considered. The analysis shows
that the implementation of these techniques result in significant improvements in the
ability of the safeguards system to achieve the objective of timely detection of the

iv
diversion of a significant quantity of nuclear material from the UREX+1a reprocessing
facility and to provide deterrence against such diversion by early detection.

v
ACKNOWLEDGEMENTS
I would like to thank my advisor, Dr. William Charlton, for all his time and help
in doing this research. Thanks are also due to my committee members, Dr. Sean
McDeavitt and Dr. Jasen Castillo.
I would also like to thank my family and friends; I don’t know if I could have
come this far without all of you. A special thanks to my mom and dad, Terri and Gary
Feener, who have always encouraged, supported, and inspired me.
I would also like to recognize the sponsors of this research, the DOE Office of
Nuclear Energy Science and Technology via grant number DE-FG07-07ID14890.

vi
NOMENCLATURE AFCI Advanced Fuel Cycle Initiative
β Nondetection Probability
BT Buffer Tank
CCD-PED Chlorined Cobalt Dicarbollide and Poly-ethylene Glycol
COEX Co-Extraction
C/S Containment and Surveillance
Cs Cesium
FT Fill Tank
GNEP Global Nuclear Energy Partnership
IAEA International Atomic Energy Agency
KMP Key Measurement Point
Ln Lanthanides
MA Nuclear Material Accountancy
MBA Material Balance Area
MBP Material Balance Period
MTHM Metric Tons Heavy Metal
MUF Material Unaccounted For
NDA Nondestructive Assay
Np Neptunium
P Probability of Detection
Pu Plutonium
PUREX Plutonium – Uranium Reduction Extraction
RT Receiving Tank
S Threshold
SFNDA Spent Fuel Nondestructive Assay
SM Solution Monitoring
SNM Special Nuclear Material
SQ Significant Quantity

vii
Sr Strontium
TALSPEAK Trivalent Actinide Lanthanide Separation by Phosphorus
Extractants and Aqueous Komplexes
Tc Technetium
TRU Transuranic
TRUEX Transuranic Extraction
U Uranium
UREX Uranium Extraction

viii
TABLE OF CONTENTS Page
ABSTRACT ....................................................................................................................... iii
ACKNOWLEDGEMENTS ................................................................................................ v
NOMENCLATURE .......................................................................................................... vi
TABLE OF CONTENTS ................................................................................................. viii
LIST OF FIGURES ........................................................................................................... ix
LIST OF TABLES ............................................................................................................. xi
CHAPTER
I INTRODUCTION ...................................................................................................... 1
I.A. Motivation.........................................................................................................1 I.B. Introduction to UREX+ ....................................................................................1 I.C. Nuclear Safeguards and General Safeguards for Reprocessing Plants .............5
I.C.1. Nuclear Material Accountancy................................................................6 I.C.2. Containment and Surveillance ................................................................9 I.C.3. Solution Monitoring ................................................................................9 I.C.4. Application of Safeguards to PUREX and Previous Work ....................9
I.D. Overview of the Safeguards Approach Development ....................................11
II MATERIAL ACCOUNTANCY............................................................................. 13
II.A. Overview of the Nuclear Material Measurement Systems ............................13 II.B. Description of the Facility .............................................................................15 II.C. Material Accountancy System .......................................................................20
III OTHER SAFEGUARD MEASURES ................................................................... 25
III.A. Incorporation of Other Safeguard Measures into Nondetection Probability ..................................................................................................25
III.B. Containment and Surveillance .....................................................................25 III.B.1. Summary of the Material Accountancy and Containment and
Surveillance Results ..........................................................................31 III.C. Solution Monitoring .....................................................................................34
IV PROPOSED UREX SAFEGUARDS APPROACH ............................................. 39
V SUMMARY AND CONCLUSIONS ..................................................................... 41
REFERENCES ................................................................................................................. 43
VITA ................................................................................................................................. 46
ix
LIST OF FIGURES
Page
Figure 1 UREX+1a process schematic. ..............................................................................4 Figure 2 Alarm Threshold ...................................................................................................8 Figure 3 Simplified process flow schematic of the PUREX process. ...............................11 Figure 4 Process used in designing the safeguard approach. ............................................12 Figure 5 MBA schematic where all the Pu separation steps are in one MBA. .................17 Figure 6 MBA schematic where each Pu separation step is in a separate MBA. .............18 Figure 7 RT, BT, and FT schematic. ................................................................................19 Figure 8 RT, BT, and FT time versus tank fill level. ........................................................19 Figure 9 βMA and βC/S versus MUF for MBA 1 using a SFNDA uncertainty of 1%. ........26 Figure 10 βMA and βC/S versus MUF for MBA 2 using a 7 day MPB, SFNDA
uncertainty of 1.31% at KMP 2 and the IDMS at KMP3. ...............................27 Figure 11 βMA and βC/S versus MUF for MBA 3 using the HKED at KMPs 3 and
4........................................................................................................................28 Figure 12 βMA and βC/S versus MUF for MBA 3 using the TMFD at KMPs 3, 3A,
3B, 3C, and 3D.................................................................................................29 Figure 13 βMA and βC/S versus MUF for MBA 4 using a TMFD at KMP 4 and a
ANCC at KMP 5. .............................................................................................30 Figure 14 βMA and βC/S versus MUF for MBA 5 using a ANCC at KMPs 5 and 6............30 Figure 15 Normal concentration and volume graphs for RT filling and emptying. .........34 Figure 16 Diversion of solution without replacing the diverted solution,
concentration and volume graph for RT filling and emptying. .......................35 Figure 17 Diversion of solution while replacing the diverted solution with
another solution (with the same density) concentration and volume graph for RT filling and emptying. ..................................................................35

x
Page Figure 18 βMA, βSM, and βC/S versus MUF to keep βtotal at 5% for MBAs 3A, 3B,
3C, and 3D. ......................................................................................................37 Figure 19 βSM for MBAs 3A, 3B, 3C, and 3D for a MUF from 1 to 8 kg Pu. ..................38

xi
LIST OF TABLES
Page Table 1 Comparison of UREX+ Processes. ........................................................................3
Table 2 IAEA’s SNM SQs and Timeliness Goals ..............................................................6
Table 3 Uncertainties for the Detectors Used in Safeguards Approach ...........................15
Table 4 Pu Concentration at Each Separation Step ..........................................................16
Table 5 U Concentration at Each Separation Step ............................................................16
Table 6 SFNDA Uncertainties and βMA for Various MBPs for MBA 2 for a MUF of 1 SQ Pu ...........................................................................................................22
Table 7 MBPs and βMA for MBA 3 for a MUF of 1 SQ Pu ..............................................22
Table 8 MBPs and βMA for MBA 4 for a MUF of 1 SQ Pu. ..............................................23
Table 9 MBPs and βMA for MBA 6 for a MUF of 1 SQ U. ...............................................24
Table 10 SFNDA Uncertainties and βC/S for Various MBPs for MBA 2 for a MUF of 1 SQ Pu to Keep βtotal at 5% .................................................................27
Table 11 βC/S for MBA 3 for a MUF of 1 SQ Pu to Keep βtotal at 5% ..............................28
Table 12 βC/S for MBA 4 for a MUF of 1 SQ Pu to Keep βtotal at 5% ..............................29
Table 13 βC/S for MBA 6 for a MUF of 1 SQ Pu to Keep βtotal at 5% ..............................31
Table 14 MBA 1 and 2 MA and C/S results. ....................................................................32
Table 15 MBA 3, 3A, 3B, 3C, 3D, 4, 5, 6, 7, and 8 MA and C/S Results. ......................33
Table 16 Liters of Solution per MBP for MBAs 3A, 3B, 3C, and 3D. ............................36
Table 17 Detectors at each KMP for the Proposed Safeguard Approach .........................40
Table 18 MBPs and βs for a MUF of 1 SQ for each MBA for the Proposed Safeguards Approach ..........................................................................................40
1
CHAPTER I
INTRODUCTION
I.A. Motivation
As nuclear energy grows in the United States and around the world, the expansion
of the nuclear fuel cycle is inevitable. The current commercial reprocessing technique,
PUREX, is not implemented in the U.S. for a variety of reasons, one of which being that
it is considered a proliferation risk. The 2001 Nuclear Energy Policy report recommended
that the U.S. “develop reprocessing and treatment technologies that are cleaner, more
efficient, less waste-intensive, and more proliferation-resistant”. As such, the UREX+
reprocessing technique has been developed to reach these goals. UREX+ is very efficient
(greater than 99.99% uranium [U] and plutonium [Pu] separation efficiency),
significantly reduces the volume of high level waste, and has the potential to have
proliferation resistant characteristics as there is never separated Pu. In order for UREX+
to be considered for commercial implementation, a safeguards approach is needed to
show that UREX+ can be safeguarded to current standards.
I.B. Introduction to UREX+
UREX+ was born from the Global Nuclear Energy Partnership (GNEP), a
partnership of countries aiming to improve the proliferation resistance of the nuclear fuel
cycle while guaranteeing access to fuel supplies that was initiated in 2006 by the Bush
administration. Domestically, GNEP was based on the Advanced Fuel Cycle Initiative
(AFCI), and while GNEP has essentially terminated with the new Obama administration,
the AFCI program continues with research and development “on proliferation-resistant
fuel cycles and waste reduction strategies.”1
An early priority in GNEP was to develop new reprocessing technologies.
Reprocessing of used nuclear fuel takes fuel from nuclear reactors and reprocesses it to
_
___________ This thesis follows the style of Nuclear Technology.

2
recover unused U, Pu, and other transuranics (TRUs) to use as additional fuel in reactors.
Recovering these elements gains approximately 25% more energy from the original U
(gains increase as the fuel is reprocessed again), reduces the volume of high-level waste,
and the level of radioactivity is much smaller than used fuel. PUREX, which has been
employed for over half a century, is well understood and proven to be commercially
viable; but it is a proliferation concern because it separates Pu. PUREX also sends minor
actinides to waste, increasing the radiotoxicity and volume. In addition, major heat
generating radionulides go into high-level waste streams which do not benefit heat
management in geological repositories. Additional information on PUREX can be found
in Ref. 2. New reprocessing technologies are designed to combine Pu with U and/or
TRUs, rendering it more difficult to use the Pu in the manufacturing of weapons and
reduces the high level waste volume, radiotoxicity, and heat generation.3,4
There are several reprocessing techniques that fit the GNEP concept including
Co-Extraction (COEX), NUEX, and UREX+. COEX separates U and Pu together (and
possibly neptunium [Np]) as well as a pure U stream, leaving the other minor actinides
and fission product together. NUEX separates U and then all TRUs, including Pu,
together, with fission products separately. UREX+ separates U, technetium (Tc), cesium
(Cs), and strontium (Sr), then has a suite of combinations of Pu and other TRUs. TABLE
1 compares different UREX+ processes. The further down the table the more pure the Pu
products get.1,4
UREX+ has U and Pu recovery efficiencies greater than 99.99% and has the
ability to greatly reduce the volume, radiotoxicity, and heat generation of waste to be
placed in long term geological storage by separating the Cs, Sr, and fission products from
the TRUs. Since UREX+ never has separated Pu it has the characteristic of being
intrinsically proliferation resistant. The down side of UREX+ is that it requires advanced
chemistry to perform the separations, the separated TRUs will require remote fuel
fabrication, and since the Pu is never separated it is harder to measure.
The UREX+1a process was chosen to safeguard for three reasons. First, GNEP
was focused on UREX+1a. Secondly, since the Pu is kept with the curium (Cm) it makes
for a more difficult measurement. Since Cm emits an order of magnitude more neutrons
than Pu, one cannot simply measure the neutrons to determine the amount of Pu. Lastly,

3
TABLE 1.
Comparison of UREX+ processes5
Process Prod. #1
Prod. #2
Prod. #3
Prod. #4 Prod. #5 Prod. #6
Prod. #7
UREX+1 U Tc Cs/Sr TRU+Ln FP UREX+1a U Tc Cs/Sr TRU All FP UREX+1b U Tc Cs/Sr U+TRU All FP UREX+2 U Tc Cs/Sr Pu+Np Am+Cm+Ln FP UREX+2a U Tc Cs/Sr U+Pu+Np Am+Cm+Ln FP UREX+3 U Tc Cs/Sr Pu+Np Am+Cm All FP UREX+3a U Tc Cs/Sr U+Pu+Np Am+Cm All FP UREX+4 U Tc Cs/Sr Pu+Np Am Cm All FP
U: uranium (removed in order to reduce the mass and volume of high-level waste) Tc: technetium (long-lived fission product, prime contributor to long-term dose at Yucca Mtn.) Cs/Sr: cesium and strontium (primary short-term heat generators; repository impact TRU: transuranic elements (Pu: Plutonium, Np: neptunium, Am: americium, Cm: curium) Ln: lanthanide (rare earth) fission products FP: fission products other than cesium, strontium, technetium, iodine, and the lanthanides All FP: fission products plus lanthanides
it is felt that if UREX+1a can be safeguarded, the other UREX+ processes can be
safeguarded as well. This is because the UREX+1a Pu product is more impure than most
of the other UREX+ processes, therefore, if we can successfully measure and safeguard
the Pu in a UREX+1a process, it can be done for the other processes as well. Since
UREX+1a has a low material attractiveness, if the safeguard system can safeguard
UREX+1a to current standards, it will be more proliferation resistant than PUREX.
A schematic of a UREX+1a process is shown in Fig. 1. Spent fuel is received by
the facility and stored in the spent fuel pool. The fuel is then sheared where it is chopped
up into small pieces. It then goes to the voloxidation and spent fuel dissolver step.
Voloxidation involves heating the fuel pieces in air or oxygen (normally an oxygen rich
environment) to separate the fuel from the cladding, decrease particle size of the fuel,
which increases efficiency of the kinetics of downstream treatment operations, and can
remove problematic constitutes from the fuel prior to downstream treatment (i.e.
tritium).6 In the dissolver step, the pieces of fuel are immersed in a nitric acid bath to
fully separate the fuel from the cladding and hulls. The hulls and cladding go to the hulls
and metal waste storage area.

4
Fig. 1. UREX+1a process schematic.5

5
The fuel then enters the first Pu separation step, UREX, where the U and Tc are
separated. In UREX, the U and Tc is the product and the raffinate is everything else. The
next step is Chlorined Cobalt Dicarbollide and Poly-ethylene Glycol (CCD-PEG) which
removes the Cs and Sr. In CCD-PEG, the product is Cs and Sr and the raffinate is the
TRUs plus fission products. The third step is Transuranic Extraction (TRUEX) where the
fission products (minus lanthanides) are separated. In TRUEX, the product is the TRUs
plus lanthanides and the raffinate is the fission products. Finally, the lanthanides are
separated using Trivalent Actinide Lanthanide Separation by Phosphorus Extractants and
Aqueous Komplexes (TALSPEAK). In TALSPEAK, the product is the lanthanides and
the raffinate is the TRUs. The TRU product, including Pu, is solidified and packaged then
moved to the storage area until it is shipped from the facility.7,8
After the UREX separation step the U and Tc undergo ion exchange to separate
them. The U then goes through the evaporator and is converted into U-oxide before going
to storage until it is shipped from the facility.
All of the waste products (including, Tc, Cs, Sr, fission products and lanthanides)
are solidified and packaged before being shipped from the facility.
I.C. Nuclear Safeguards and General Safeguards for Reprocessing Plants
After the detonation of the first nuclear weapon and the observation of its obvious
destructive force, nuclear nonproliferation began. Weapons with such power must be
controlled and the ability to produce them must be carefully monitored. The International
Atomic Energy Agency (IAEA) was formed by the United Nations in 1957 and was
tasked to safeguard nuclear materials in facilities that were placed under its monitoring
by member states.9 Under the IAEA’s comprehensive safeguards agreement, safeguards
are applied to verify a State’s compliance with its undertaking to accept safeguards on all
nuclear material in all its peaceful nuclear activities and to verify that such material is not
diverted to nuclear weapons or other nuclear explosive devices. In this regard, the
technical objective is specified: “the timely detection of diversion of significant quantities
of nuclear material from peaceful nuclear activities to the manufacture of nuclear
weapons or of other nuclear explosive devices or for purposes unknown, and deterrence
of such diversion by the risk of early detection”. The second technical objective, to fully

6
address the verification of a State’s compliance, is the detection of undeclared nuclear
materials and activities in a State.10
With regard to the first technical objective, the IAEA has defined a set of
Significant Quantities (SQ) based on the type of material. These values are derived from
the approximate amount of nuclear material for which the possibility of manufacturing a
nuclear explosive devise cannot be excluded. The ‘timely detection’ refers to a set of
timeliness goals that are broken down into categories based on the time it would take a
state to form a nuclear device from the particular material. TABLE 2 gives the IAEA’s
Special Nuclear Material (SNM) SQs and timeliness detection goals.10
TABLE 2.
IAEA’s SNM SQs and Timeliness Goals10,11
Material Category Material Type Significant Quantity Timeliness Goal (months)
Direct Use Material Pu (separated)a 8 kg Pu 1 HEU (235U
enrichment ≥ 20%) 25 kg 235U 1 (unirradiated)
3 (irradiated) Pu in Spent Fuel 8 kg Pu 3
233U 8 kg 233U 1 Indirect Use
Material LEU (235U
enrichment < 20%) 75 kg 235U 12
Th 20 tons 12 a For Pu containing less than 80% Pu.
I.C.1. Nuclear Material Accountancy
The safeguards framework begins with nuclear material accountancy (MA). MA
includes, but is not limited to, dividing operations involving nuclear material into
material balance areas (MBAs) and maintaining records on all quantities of nuclear
material entering, leaving, and contained in the MBA. The nuclear material is measured
at key measurement points (KMPs), a location where nuclear material appears in such a
form that it may be measured to determine material flow or inventory. Most MBAs have
KMPs where nuclear material enters and exits and an inventory KMP. The physical
inventory of nuclear material is accounted for over a material balance period (MBP), the
time between two consecutive physical inventory takings. The MBP length is determined

7
by the material unaccounted for (MUF). The MUF is calculated for a MBA over a MBP
using the material balance equation:
PEYXPBMUF −−+= )( (1)
where PB is the beginning physical inventory, X is the sum of increases to inventory, Y is
the sum of decreases from inventory, and PE is the ending physical inventory. If no
diversion of material has occurred, one would expect the MUF to be zero. For item
MBAs [MBAs where the elements nuclear material can be counted (e.g., fuel assemblies
or cans of U-oxide powder)], MUF should be zero and a non-zero MUF is an indication
of a safeguards problem. For bulk handling MBAs [MBAs where the material mass must
be measured (e.g., solutions, etc.)], a non-zero MUF is expected because of measurement
uncertainty and the nature of processing. In bulk handling MBAs, each term in the MUF
equation will have measurement uncertainties associated with it and are combined with
the material quantities to determine the total MUF uncertainty, σMUF. During any one
MBP10, we seek to perform accountancy such that
SQMUF 13 ≤×σ . (2) The expression in Eq. (2) is a rule-of-thumb derived from hypothesis testing for a system
with an expected MUF equal to zero but with a σMUF not equal to zero.
The probability of detection (P) is the probability that if a diversion of a given
amount of material has occurred, the safeguard activities will lead to detection. The
detection probability is denoted as 1-β, where β is the nondetection probability. The false
alarm probability, α, is the probability that statistical analysis of accountancy verification
data would indicate that an amount of nuclear material is missing when, in fact, no
diversion has occurred.
When analyzing a safeguards system, the system is typically tested against two
hypotheses. The first hypothesis is that no diversion of material has occurred, which is
called the null hypothesis or Ho. The second hypothesis is that a diversion does occur,
which will be called the diversion hypothesis or H1. The mathematical probability that a
count (x) will occur above a threshold (S) if the null hypothesis is true is given by:
α = prob (x > S │ Ho) (3)
where Ho є (μ = 0, σ = σMUF), μ is the mean, and σ is the standard deviation.

8
The mathematical probability that a count (x) will occur below S if the diversion
hypothesis is true:
β = prob (x ≤ S │ H1) (4)
where H1 є (μ = 1 SQ, σ = σMUF). α and β are preselected input parameters for designing
sampling plans and performing statistical tests. α is usually set to 0.05 to minimize the
number of false alarms. The values of 1-β are considered high probability levels if greater
than 90% and low probability levels if less than 20%.10
Fig. 2 shows graphically how σMUF and α are used to determine the alarm
threshold, S, and β. The measurement uncertainties are assumed to have a normal
distribution around the true value of the measurement. The threshold is selected where
any value above that threshold (to the right) will alarm the system and any value below it
(to the left) will not. α is the area above the threshold under the No Diversion curve. β is
the area below the threshold and under the Diversion curve. In this work, α is set and a
threshold is found. β is then calculated from the threshold.10
Fig. 2. Alarm threshold
Since the MA system cannot always reach the β goal, additional measures can be
implemented to reach the goal and independently verify the correctness of the
accountancy information. Additional measures include, but are not limited to
Containment and Surveillance (C/S) and Solution Monitoring (SM).

9
I.C.2. Containment and Surveillance
The IAEA defines containment as, “structural features of a facility, containers or
equipment which are used to establish the physical integrity of an area or items (including
safeguards equipment or data) and to maintain the continuity of knowledge of the area or
items by preventing undetected access to, or movement of, nuclear or other material, or
interference with the items.” Examples of containment are storage containers, doors, and
walls. The continuing integrity of the containment itself is usually assured by surveillance
measures or seals.10
Surveillance is the collection of information through observation aimed at
detecting movements of nuclear material or other items. Surveillance may also be used
for observing various operations by obtaining relevant operational data. Examples of
surveillance are cameras and detectors.10
The application of C/S is to complement nuclear material accountancy. The use of
C/S measures is aimed at verifying information on movement of material, equipment and
samples, or preservation of the integrity of safeguards relevant data.10
I.C.3. Solution Monitoring
SM is an element of a broader monitoring system known as process monitoring.
Process monitoring “implies the collection and evaluation of a broad range of data from
the process operations in a nuclear facility to make timely judgments regarding the
location and movement of special nuclear material.”12 SM helps guarantee continuity of
information on process solutions as they move through the plant.
In SM, bulk volumes, masses, temperatures, pH, and concentrations are tracked
though a facility. This includes the flow rates between tanks, the filling and emptying of
the tanks, or both. SM can help ensure that the shifting of a diversion from one MBA
inventory period to the next one does not occur. SM also has the ability to detect a
diversion in real-time and not over a MBP.12,13,14,15
I.C.4. Application of Safeguards to PUREX and Previous Work
The foundation for developing safeguard approaches for aqueous reprocessing
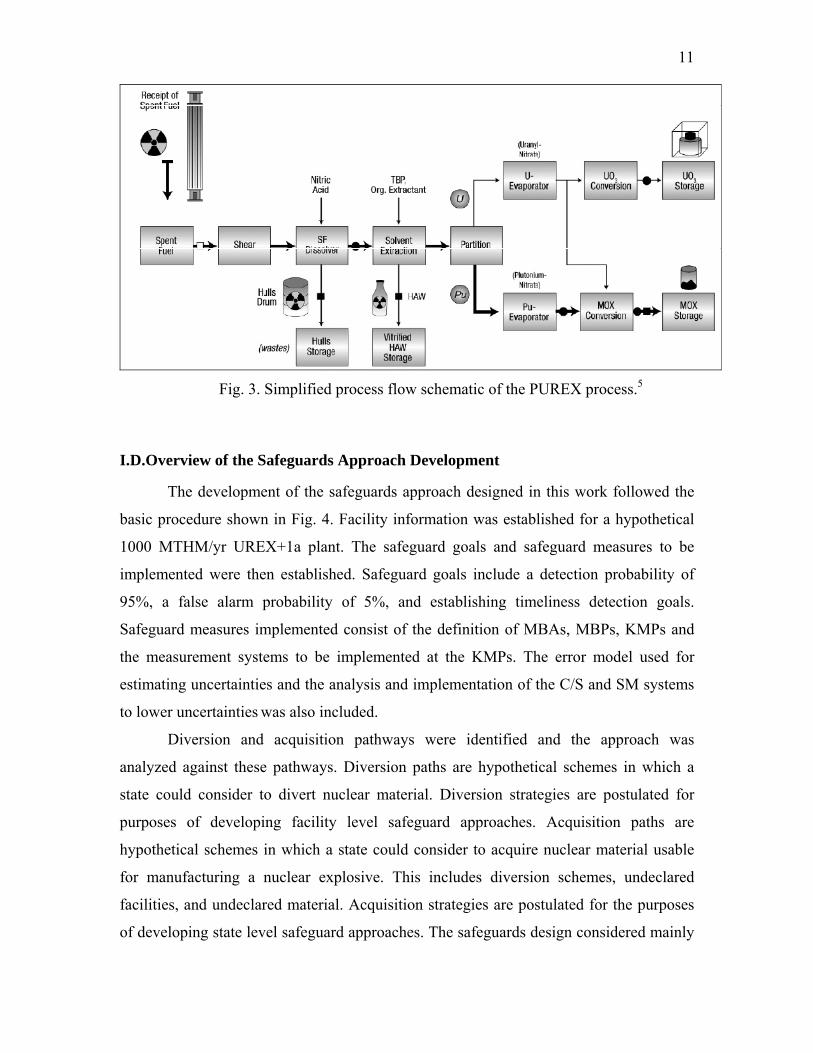
begins with the well-established PUREX process. A simplified process flow schematic of
the PUREX process is shown in Fig. 3. Since PUREX is the current, commercial

10
reprocessing technique, large scale aqueous reprocessing safeguards are based on and
compared to the current PUREX safeguard systems and the results these safeguard
systems achieve. The Rokkasho Reprocessing Plant in Japan is the newest commercial
PUREX reprocessing plant in the world. It is designed to process 800 MTHM/year and
its safeguard system is characterized by a MBP of 7-8 days, a false alarm fate of 5% and
a nondetection probability of 5%. The PUREX process is a significant point of reference
because there are modern large scale facilities under international safeguards. However, it
should be noted that there are significant differences in the chemical processes between
PUREX and UREX+.
There are ongoing, extensive efforts being pursued on front-end nondestructive
assay (NDA) measurement techniques. In current reprocessing facilities, the front-end
measurement uncertainties are too large to be beneficial to the MA system. Therefore,
C/S is the main safeguards mechanism before a lower uncertainty destructive assay (DA)
measurement can be taken after the spent fuel is dissolved. A NDA measurement with a
low uncertainty at the front-end will greatly improve the MA before the spent fuel is
dissolved. More information on some of these efforts can be found in Refs. 16, 17, and
18.
Previous works on UREX+ safeguards include developing approaches and
identifying technical challenges that need to be addressed.5 There has also been an
“advanced instrument scenario” developed, using a Safeguards Performance Model, for
materials accountability for a UREX+1a reprocessing plant, that can be found in Ref. 19.
Extensive work on SM and applying SM to safeguards has also been done. Information
on this work can be found in Refs. 12, 13, 14, and 15. Additional information on
advanced safeguard methods and safeguard system analysis can be found in Refs. 20 and
21.
11
Fig. 3. Simplified process flow schematic of the PUREX process.5
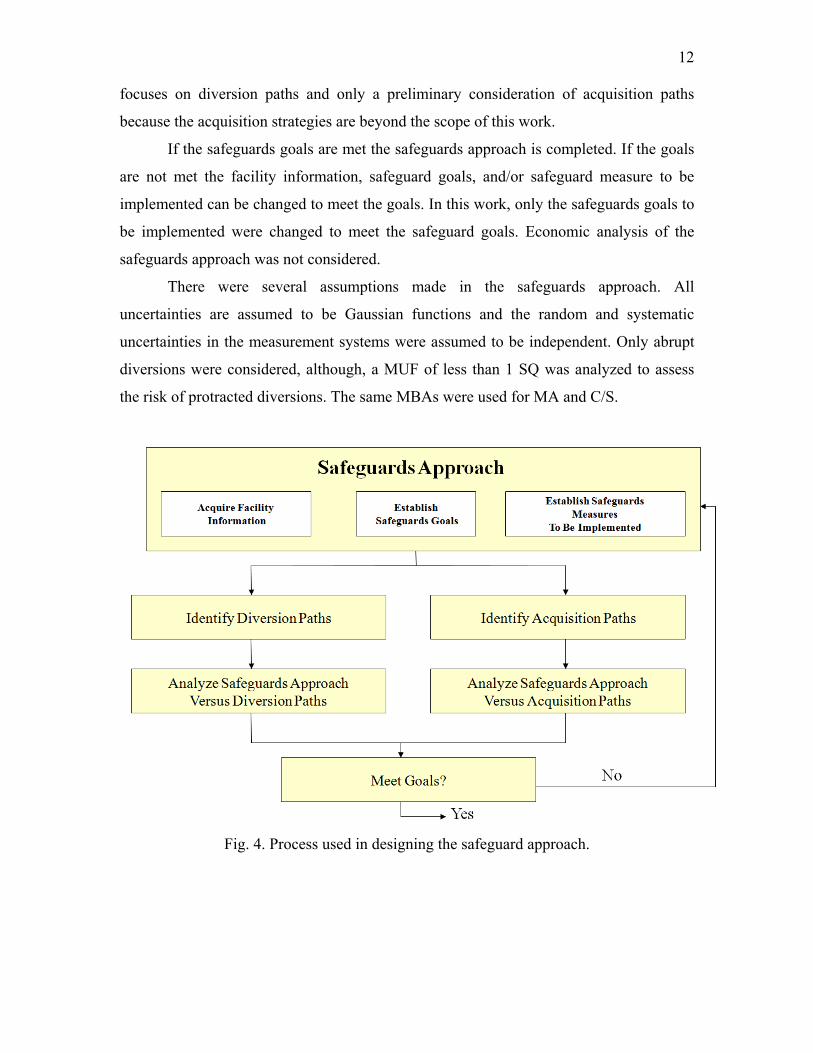
I.D.Overview of the Safeguards Approach Development
The development of the safeguards approach designed in this work followed the
basic procedure shown in Fig. 4. Facility information was established for a hypothetical
1000 MTHM/yr UREX+1a plant. The safeguard goals and safeguard measures to be
implemented were then established. Safeguard goals include a detection probability of
95%, a false alarm probability of 5%, and establishing timeliness detection goals.
Safeguard measures implemented consist of the definition of MBAs, MBPs, KMPs and
the measurement systems to be implemented at the KMPs. The error model used for
estimating uncertainties and the analysis and implementation of the C/S and SM systems
to lower uncertainties was also included.
Diversion and acquisition pathways were identified and the approach was
analyzed against these pathways. Diversion paths are hypothetical schemes in which a
state could consider to divert nuclear material. Diversion strategies are postulated for
purposes of developing facility level safeguard approaches. Acquisition paths are
hypothetical schemes in which a state could consider to acquire nuclear material usable
for manufacturing a nuclear explosive. This includes diversion schemes, undeclared
facilities, and undeclared material. Acquisition strategies are postulated for the purposes
of developing state level safeguard approaches. The safeguards design considered mainly
12
focuses on diversion paths and only a preliminary consideration of acquisition paths
because the acquisition strategies are beyond the scope of this work.
If the safeguards goals are met the safeguards approach is completed. If the goals
are not met the facility information, safeguard goals, and/or safeguard measure to be
implemented can be changed to meet the goals. In this work, only the safeguards goals to
be implemented were changed to meet the safeguard goals. Economic analysis of the
safeguards approach was not considered.
There were several assumptions made in the safeguards approach. All
uncertainties are assumed to be Gaussian functions and the random and systematic
uncertainties in the measurement systems were assumed to be independent. Only abrupt
diversions were considered, although, a MUF of less than 1 SQ was analyzed to assess
the risk of protracted diversions. The same MBAs were used for MA and C/S.
Fig. 4. Process used in designing the safeguard approach.

13
CHAPTER II
MATERIAL ACCOUNTANCY
II.A. Overview of the Nuclear Material Measurement Systems
The safeguards approach presents several nuclear material measurement systems.
The measurement systems and how they are used in the safeguards approach are
explained here.
One measurement system is a Spent Fuel Non Destructive Assay (SFNDA)
measurement. The SFNDA was used as an unspecified NDA measurement to quantify
the Pu content in spent fuel assemblies. There is extensive work being done on these
NDA techniques and information on them can be found in Refs. 16, 17, and 18.
Another measurement technique is the Tension Metastable Fluid Detector
(TMFD) for online alpha spectroscopy to quantify Pu and U concentration in solution.
For alpha spectroscopy, the TMFD works by spinning the working fluid; therefore
putting it under tension. This takes advantage of the weakened intermolecular bonds of
liquids in sub-vacuum states. The alpha particles incident on the sufficiently tensioned
working fluid can nucleate critical size vapor bubbles which grow from nanoscales and
are then possible to see, hear and record. If the working fluid is spun slower or faster,
more or less incident particle energy, respectively, is needed to nucleate a bubble.
Therefore, the tension of the working fluid is proportional to the alpha particle energy
threshold in the detector.22
The K-edge densitometer (KED) was used to quantify the concentration of U. In
KED a continuous-energy beam of photons from a tungsten-anode x-ray tube is
transmitted through a liquid sample. Photon transmission through the sample is measured
at two photon energies which closely bracket the k-absorption edge energy of the element
of interest (U). The concentration of the measured element is a simple function of the
photon transmission below and above the absorption edge, and the path length of x-rays
through the sample.23,24
The Hybrid K-edge/x-ray Fluorescence Densitometer (HKED) was used to
quantify the U and Pu concentration. In HKED, KED is augmented by a simultaneous x-
ray fluoresce (XRF) measurement of the specimen. The concentration of the most-

14
abundant actinide is determined by KED, and the XRF detector measures fluoresced x-
rays emitted from sample face. Concentrations of other actinides are derived from
attenuation-corrected ratios of XRF peak areas.23, 24
Isotope Dilution Mass Spectroscopy (IDMS) is another measurement technique
that was used to quantify the concentration of Pu and U. IDMS involves the addition of a
measured quantity of a highly enriched isotope, known as the ‘spike’, to an aliquot of the
sample. After chemical and isotopic equilibrium, the quantities of the isotopes in the
sample are measured relative to the added isotope by mass spectroscopy. From the
change in the isotopic ratios of the sample caused by the spike, the elemental content of
the sample may be calculated.25
The Active Neutron Coincidence Counter (ANCC) was used to quantify Pu
concentration in oxide form. The ANCC uses a neutron source to bombard the sample
with neutrons and records coincidence neutrons from fission in the sample. The fission
rate is proportional to the amount of fissile material in the sample.
High Purity Germanium (HPGe) detectors were used to calculate the U
concentration. HPGe’s are semiconductors that use the formation of ions in the detector
material by the interaction of gamma rays with atomic electrons and the atomic nucleus.
This creates a pulse that can be recorded that is linearly proportional to the energy of the
incident gamma ray.25
All concentration measurements must be paired with a volume or mass
measurement to calculate the total amount of the given element or isotope. To measure
volume in tanks a Dip Tube (DIPT) is used. To measure the mass of a given object a
Gravimetry (GRAV) measurement is used, which simply means weighing the item.
To measure the leftover Pu and U on the clad and hulls the Plutonium Scrap
Multiplicity Counter (PSMC) is used. The PSMC is a high efficiency neutron
coincidence counter designed for measuring the multiplicity of the neutron emission from
both spontaneous fission and induced-fission reaction in Pu and U.26
A table of the detector uncertainties is given in TABLE 3. All uncertainties are
from the “International Target Values 2000 for Measuring Uncertainties in Safeguarding
Nuclear Material”27 except the TMFD, which is still under development so a best guess
uncertainty was used. The concentration measurement uncertainties are given with and
without the volume/mass uncertainty. In the safeguards approach, the total uncertainty of

15
the concentration plus volume/mass is used but only referred to as the concentration
measurement.
TABLE 3.
Uncertainties for the Detectors Used in Safeguards Approach
Detector Total Uncertainty (%)(a) Concentration + Volume/Mass
Total Uncertainty(%)(a)
SFNDA 10(b) TMFD 0.8485 TMFD + DIPT 0.9220 HKED 0.6708 HKED + DIPT 0.7616 IDMS 0.2828 IDMS + DIPT 0.4583 KED 0.0625 KED + DIPT 0.3659
ANCC 0.2828 ANCC + GRAV 0.2915 HPGe 0.7071 HPGe + GRAV 0.7106 DIPT 0.3606
GRAV 0.0707 (a) The total uncertainty is the random and systematic uncertainties summed in quadrature. (b) This is an estimated uncertainty that is not unreasonable for current SFNDA detectors to achieve.
II.B. Description of the Facility
Facility information was developed for a hypothesized UREX+1a plant with a
throughput of 1000 MTHM per year. The plant is assumed to run continuously 365 days
per year. The incoming spent fuel was assumed to have a Pu content of 1% and a U
content of 96%. This makes the flow through the plant approximately 27.4 kg Pu/day and
2630.1 kg U/day. Because of the high separation efficiencies, the Pu and U waste is
ignored (the same amount of Pu and U that enter the facility exit the facility as product).
Pu and U concentrations at each separation step, provided by Argonne National
Laboratory,8 are given in TABLE 4 and TABLE 5 respectively. The U content after
UREX is negligible.

16
TABLE 4.
Pu Concentration at Each Separation Step
Feed (g/L) Raffinate (g/L) Product (g/L) Spent Solvent (g/L) UREX 3.978 2.652 - -
CCD-PEG 2.652 2.116 - - TRUEX 2.116 2.81•10-15 2.106 3.49•10-10
TALSPEAK 2.106 1.269 5.24•10-16 3.97•10-25
TABLE 5.
U Concentration at Each Separation Step
Feed (g/L) Raffinate (g/L) Product (g/L) Spent Solvent (g/L) UREX 219.890 2.54•10-22 70.932 3.22•10-17
The plant’s MBAs were established in two different ways. Fig. 5 shows one
proposed MBA break down where all the Pu separation steps are in one MBA. Fig. 6
shows the other proposed MBAs with each Pu separation step in its own MBA. The
further break down of the MBAs in Fig. 6 was done for several reasons. Because the MA
and C/S MBAs are the same, the smaller MBAs are more applicable to the C/S system.
Since it is likely that each separation step will be done in different halls within the plant,
it is expected that each hall would have different C/S systems. A typical C/S system
would not be continuous in several rooms or halls within a plant. The smaller MBAs also
use the TMFD, a real-time measurement, between each MBA. It is assumed that the
TMFD uncertainty will decrease after each separation step since there is less radioactive
material after each separation step, resulting in longer MBPs. The smaller MBAs also
have the potential to determine if a diversion has occurred faster than a larger MBA
could. The disadvantage of having smaller MBAs is more KMPs and having to analyze
more measurements. The MBAs and KMPs used in the safeguards approach are labeled
in each schematic.

17
Fig. 5. MBA schematic where all the Pu separation steps are in one MBA.

18
Fig. 6. MBA schematic where each Pu separation step is in a separate MBA.

19
Between each Pu separation step, there is a Receiving Tank (RT), Buffer Tank
(BT) and Fill Tank (FT) as shown in Fig. 7. The RT continuously receives solution then
ships it to the BT in one batch. The BT receives and ships solution on one batch. The FT
receives solution in one batch and ships continuously. A graphical representation of the
tank level versus time for all three tanks is shown in Fig. 8.
Fig. 7. RT, BT, and FT schematic.
Fig. 8. RT, BT, and FT time versus tank fill level.

20
II.C. Material Accountancy System
Each of the MBAs in Fig. 5 and Fig. 6 were analyzed with the appropriate
measurement techniques discussed in Sec. II.A. The MBPs and material accountancy
nondetection probabilities (βMA) were calculated as described in Sec. I.C.1. First, an
uncertainty is calculated for zero MUF (μ = 0 / null hypothesis [Ho]) by multiplying the
amount of material (U or Pu) passing through the MBA per day by the detector
uncertainty. This gives the uncertainty in grams per day (σt). The MPB is then calculated
in days by iterating on
SQMPBt 13 ≤××σ . (5)
The total uncertainty in all the measurements over one MBP with no diversion is
tMUF MBP σσ ×= (6)
which is also the standard deviation in Fig. 2. The threshold (S) was then calculated using
the NORMINV function in excel which returns the inverse of the normal cumulative
distribution for a specified probability (1-α = 95%), mean (μ = 0), and standard deviation
(σMUF).
The uncertainty in the measurement was then calculated over the MBP for a MUF
of 1 SQ, σMUF, by multiplying the grams of material that pass though the MBA per MBP
by the detector uncertainty (diversion hypothesis [H1]). This is also the standard deviation
in Fig. 2. βMA was then calculated my using the NORMDIST function in excel that
returns the normal distribution for the specified threshold (S), mean (μ = 1 SQ), and
standard deviation (σMUF).
Item accounting is used for MBA 1 therefore, the MUF should be zero and a non-
zero MUF would indicate a diversion. As an additional measure, the bulk measurement
of the Pu in the spent fuel assemblies was also analyzed. This is advantageous to detect
partial diversions (fuel pins within the fuel assembly) of material. Using the SFNDA at
KMPs 1 and 2 with the assumed SFNDA uncertainty of 10% the MBP is 0 days for a
MUF of 1 SQ. This means that 3 • σMUF >1SQ for a MBP of zero days for the proposed
detector and detector scheme. With the SFNDA uncertainty of 10%, the bulk
measurement is not beneficial to the MA system. If the SFNDA uncertainty can be
lowered to 1%, a MBP of 6 days can be achieved with a βMA of 0.0328. If the MBP is
21
forced to be 30 days with the SFNDA uncertainty at 1%, the βMA is 0.8318. KMP A
would also use a SFNDA. This analysis is applicable to any reprocessing plant (i.e.
PUREX, COEX, etc.) that has a spent fuel pool MBA and processes the same amount of
Pu per year.
The analysis of U diversion is not considered in MBAs 1 or 2 because the
diversion of any fuel material from these MBAs would be detected by the Pu diversion
requirements. For example, an adversary would need to take 9.8 times more fuel pins
(from MBA 1) or solution (from MBA 2) to reach 1 SQ of U than 1 SQ of Pu.
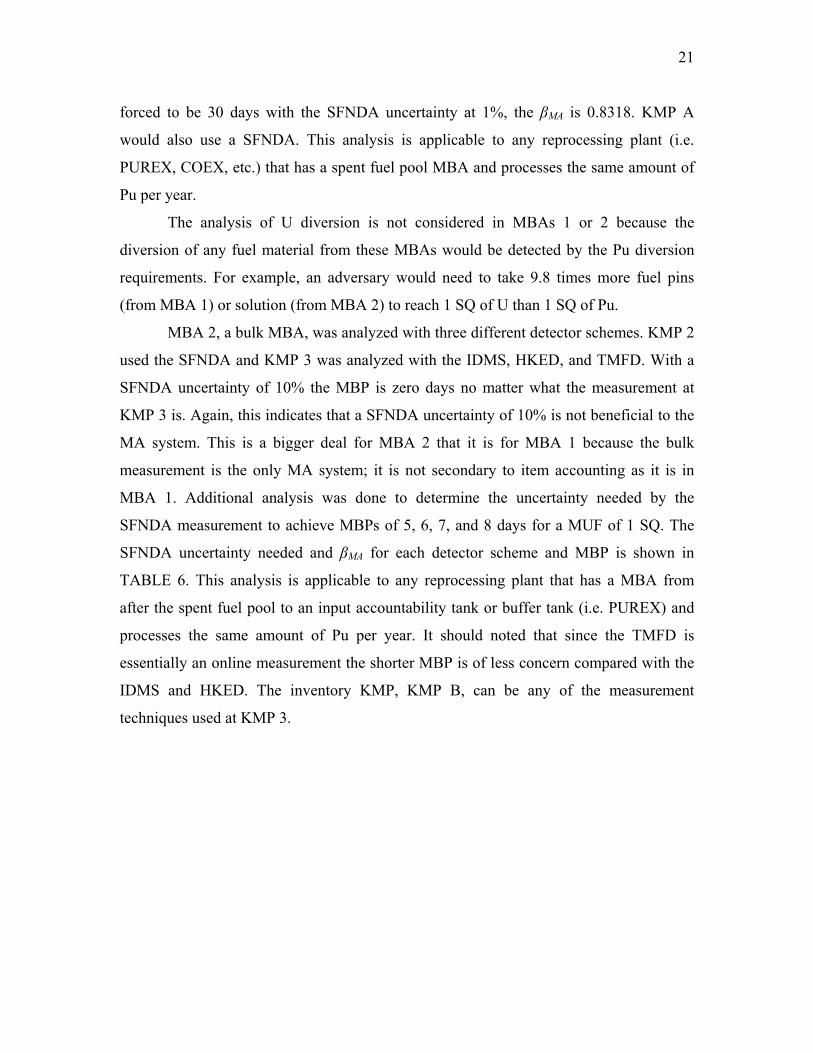
MBA 2, a bulk MBA, was analyzed with three different detector schemes. KMP 2
used the SFNDA and KMP 3 was analyzed with the IDMS, HKED, and TMFD. With a
SFNDA uncertainty of 10% the MBP is zero days no matter what the measurement at
KMP 3 is. Again, this indicates that a SFNDA uncertainty of 10% is not beneficial to the
MA system. This is a bigger deal for MBA 2 that it is for MBA 1 because the bulk
measurement is the only MA system; it is not secondary to item accounting as it is in
MBA 1. Additional analysis was done to determine the uncertainty needed by the
SFNDA measurement to achieve MBPs of 5, 6, 7, and 8 days for a MUF of 1 SQ. The
SFNDA uncertainty needed and βMA for each detector scheme and MBP is shown in
TABLE 6. This analysis is applicable to any reprocessing plant that has a MBA from
after the spent fuel pool to an input accountability tank or buffer tank (i.e. PUREX) and
processes the same amount of Pu per year. It should noted that since the TMFD is
essentially an online measurement the shorter MBP is of less concern compared with the
IDMS and HKED. The inventory KMP, KMP B, can be any of the measurement
techniques used at KMP 3.
22
TABLE 6.
SFNDA Uncertainties and βMA for Various MBPs for MBA 2 for a MUF of 1 SQ Pu
MBP (days) SFNDA uncertainty (%)
Detector at KMP 3
βMA
5 1.89 IDMS 0.1975 5 1.79 HKED 0.1968 5 1.71 TMFD 0.0839 6 1.55 IDMS 0.1521 6 1.43 HKED 0.1521 6 1.33 TMFD 0.0832 7 1.31 IDMS 0.1160 7 1.16 HKED 0.1143 7 1.04 TMFD 0.0835 8 1.12 IDMS 0.0840 8 0.94 HKED 0.0819 8 0.79 TMFD 0.0822
MBA 3 was analyzed with five different detector schemes. The detectors used at
both KMPs, MBPs, and βMA for a MUF of 1 SQ Pu for each detector scheme is shown in
TABLE 7. The measurements that take place at both KMPs are taken at the BTs before
UREX and after TALSPEAK (see Fig. 7). A DIPT is used to measure the volume and the
detectors listed in TABLE 7 are used to measure the concentration of Pu. This measures
the total Pu in each BT to ensure that no diversion has occurred. There are no inventory
KMPs in MBA 3 because it assumed that in the event of a plant shutdown all the material
in MBA 3 would processed so there would be no inventory in the MBA.
TABLE 7.
MBPs and βMA for MBA 3 for a MUF of 1 SQ Pu
Detector at KMP 3
Detector at KMP 4
MBP (days) βMA
IDMS IDMS 15 0.0015 IDMS HKED 10 0.0078 IDMS TMFD 9 0.0225 HKED HKED 9 0.0363 TMFD TMFD 7 0.0562

23
MBAs 3A, 3B, 3C, and 3D were each analyzed using the TMFD at KMPs 3, 3A,
3B, 3C, and 4. As explained above, it is assumed that the TMFD uncertainty will
decrease at each step, but the decrease in uncertainty has not yet been tested. Therefore,
the original total uncertainty of 0.9220% (uncertainty for the TMFD plus DIPT) was
used, making this a conservative analysis. The measurements that take place at all KMPs
are taken at the BTs between each separation step (see Fig. 7). The DIPT is used to
measure the volume and the TMFD was used to measure the concentration of Pu. This
measures the total Pu in each BT to ensure that no diversion has occurred. The MBP is 7
days and βMA is 0.0562 for MBAs 3A, 3B, 3C, and 3D. There is no inventory
measurement in MBAs 3A, 3B, 3C, and 3D because the amount of material in the actual
separation process is small and it assumed that in the event of a plant shutdown all the
material in these MBAs would processed so there would be no inventory.
MBA 4 was analyzed with three different detector schemes. The detectors used at
the KMPs, MBPs and βMA for a MUF of 1 SQ Pu for each detector scheme is shown in
TABLE 8. KMP C uses an ANCC.
TABLE 8.
MBPs and βMA for MBA 4 for a MUF of 1 SQ Pu
Detector at KMP 4
Detector at KMP 5
MBP (days) βMA
IDMS ANCC 17 0.0046 HKED ANCC 11 0.0377 TMFD ANCC 10 0.0840
MBA 5 used the ANCC at KMPs 5 and 6. This gives a MBP of 23 days and a βMA
of 0.0745 for a MUF of 1 SQ Pu. KMP D uses an ANCC.
MBA 6 is the first MBA where the diversion of U is analyzed. It was evaluated
using 4 different detector schemes. The detectors considered at KMP 3 were used at
KMP 7 by perturbing the uncertainty across the UREX separation step due to the loss of
U. The UREX separation was assumed to have a 99.99% separation efficiency making
the additional uncertainty 0.01%. KED was also considered at KMP 7. A HPGe

24
measurement is used at KMP 8. The results for a MUF of 1 SQ U (75 kg 235U = 7500 kg
U assuming 1% 235U) are shown in TABLE 9. KMP E could use any of the detectors
considered at KMP 7.
TABLE 9.
MBPs and βMA for MBA 6 for a MUF of 1 SQ U
Detector at KMP 7
Detector at KMP 8
MBP (days) βMA
IDMSa HPGe 112 0.0936 HKEDa HPGe 91 0.1438 TMFDa HPGe 81 0.1697
KED HPGe 118 0.0800 a Detectors considered at KMP 3 with uncertainties perturbed across UREX separation step.
MBA 7 used a HPGe measurement at KMPs 8 and 9. This gives a MBP of 94
days and a βMA of 0.1340 for a MUF of 1 SQ U. KMP F uses a HPGe.
MBA 8 uses a PSMC at KMPs 10 and 11. KMP 10 is to confirm that no Pu was
diverted out of MBA 2 and no U was diverted out of MBA 6. No inventory KMP is
needed at MBA 8 and no MBP or βMA is given because the amount of material is small
and it is essentially a waste MBA.

25
CHAPTER III
OTHER SAFEGUARD MEASURES
III.A. Incorporation of Other Safeguard Measures into Nondetection Probability
The nondetection probability (β) goal for the safeguards approach is 5% for any
MBA. Since the MA system alone cannot always reach this goal, additional safeguard
measures are used. If the additional safeguard measures are independent of the MA
system, the total nondetection probability (βtotal) can be calculated as
niiMAtotal +∗∗∗= ββββ ... . (7)
To reach the goal of βtotal = 5%, C/S and SM safeguard measures were considered, in
addition to the MA system, in the safeguards approach.
Additional safeguard measures are also needed for defense in depth. This includes
multiple independent and redundant layers of defense so that no single layer, no matter
how robust, is exclusively relied upon. That way, if an adversary can defeat one of the
safeguard systems, there are other systems in place that will detect a diversion of
material. The more safeguard systems in place, the higher probability the adversary will
fail.
III.B. Containment and Surveillance
Only the requirements of the C/S were evaluated because specific facility
information is needed for designing C/S systems. The C/S was analyzed so the total
nondetection probability for each MBA was 5%. Since the nondetection probability
achieved by the MA system, βMA, is a function of detector uncertainly, which is known,
the nondetection probability for the C/S system, βC/S, was calculated using:
%5/ ==∗ totalSCMA βββ .
Therefore
MASC β
β 05.0/ = (8)
Thus, any diversion the MA system may be detected by the C/S system. The results given
in this section are for the same detector schemes considered in Sec. II.C.

26
As described in Sec. II.C., the bulk measurement systems for MBAs 1 and 2 are
not beneficial to the MA system if the SFNDA uncertainty is 10%. This means that the
C/S system would need to be able to detect any diversion of material and requires βC/S to
equal 0.05 to meet the safeguard goals.
For MBA 1, if the SFNDA uncertainty can lowered to 1%, then the MA system is
advantageous to the safeguards system and relaxes the requirements of the C/S system. A
graph of βMA and βC/S versus MUF from 1 to 8 kg Pu to keep the βtotal at 5% is shown in
Fig. 9. Note that in the figure, βC/S is not given for a MUF of 8 kg; this is because the MA
system alone, reaches the nondetection probability goal (βMA < 0.05).
Fig. 9. βMA and βC/S versus MUF for MBA 1 using a SFNDA uncertainty of 1%.
In Sec. II.C. MBA 2 was analyzed for the uncertainty needed by the SFNDA
measurement needed to achieve MBPs 5, 6, 7 and 8 days for various detector schemes.
βC/S is given in TABLE 10 for the same requirements and detector schemes. An example
of βMA and βC/S verses MUF from 1 to 8 kg Pu for MBA 2 is shown in Fig. 10. This
example shows the result from having an IDMS at KMP 3 with a MBP of 7 days, making
the SFNDA uncertainty at KMP 2 be 1.31%.
0
0.1
0.2
0.3
0.4
0.5
0.6
0.7
0.8
0.9
1
0 2 4 6 8
Nondetection Probability
MUF (kg)
MAC/S

27
TABLE 10.
SFNDA Uncertainties and βC/S for Various MBPs for MBA 2 for a MUF of 1 SQ Pu to
Keep βtotal at 5%
MBP (days) SFNDA uncertainty (%)
Detector at KMP 3
βC/S
5 1.89 IDMS 0.2531 5 1.79 HKED 0.2540 5 1.71 TMFD 0.5956 6 1.55 IDMS 0.3288 6 1.43 HKED 0.3287 6 1.33 TMFD 0.6010 7 1.31 IDMS 0.4312 7 1.16 HKED 0.4376 7 1.04 TMFD 0.5985 8 1.12 IDMS 0.5950 8 0.94 HKED 0.6102 8 0.79 TMFD 0.6083
Fig. 10. βMA and βC/S versus MUF for MBA 2 using a 7 day MPB, SFNDA uncertainty of
1.31% at KMP 2 and the IDMS at KMP3.
MBA 3 was analyzed with five different detector schemes. The detectors used at
both KMPs, MBPs, and βC/S for a MUF of 1 SQ Pu for each detector scheme is shown in
0
0.1
0.2
0.3
0.4
0.5
0.6
0.7
0.8
0.9
1
0 2 4 6 8
Nondetection Probability
MUF (kg)
MAC/S

28
TABLE 11. βC/S is not given in the first 4 schemes; this is because the MA system alone,
reaches the nondetection probability goal for a MUF of 1 SQ Pu (βMA < 0.05). A graph of
βMA and βC/S versus MUF from 1 to 8 kg Pu using the HKED at KMPs 3 and 4 is shown
in Fig. 11. βC/S is not shown for a MUF of 8 kg; this is because βMA, alone, has reached
the βtotal goal of 0.05.
TABLE 11.
βC/S for MBA 3 for a MUF of 1 SQ Pu to Keep βtotal at 5%
Detector at KMP 3
Detector at KMP 4
MBP (days) βC/S
IDMS IDMS 15 - IDMS HKED 10 - IDMS TMFD 9 - HKED HKED 9 - TMFD TMFD 7 0.8892
Fig. 11. βMA and βC/S versus MUF for MBA 3 using the HKED at KMPs 3 and 4.
MBAs 3A, 3B, 3C, and 3D were each analyzed using the TMFD at KMPs 3, 3A,
3B, 3C, and 4. For the MBP of 7 days the βC/S is 0.8892 for a MUF of 1 SQ Pu. The
graph of βMA and βC/S versus MUF from 1 to 8 kg Pu for MBAs 3A, 3B, 3C, and 3D using
a TMFD at KMPs 3, 3A, 3B, 3C, and 3D is shown in Fig. 12.
0
0.1
0.2
0.3
0.4
0.5
0.6
0.7
0.8
0.9
1
0 2 4 6 8
Nondetection Probability
MUF (kg)
MAC/S

29
Fig. 12. βMA and βC/S versus MUF for MBA 3 using the TMFD at KMPs 3, 3A, 3B, 3C,
and 3D.
MBA 4 was analyzed with three different detector schemes. The detectors used at
the KMPs, MBPs and βC/S for a MUF of 1 SQ Pu for each detector scheme is shown in
TABLE 12. βC/S is not given in the first 2 schemes; this is because the MA system alone,
reaches the nondetection probability goal for a MUF of 1 SQ Pu (βMA < 0.05). A graph of
βMA and βC/S versus MUF from 1 to 8 kg Pu for MBA 4 using a TMDF at KMP 4 and the
ANCC at KMP 5 is shown in Fig 13.
TABLE 12.
βC/S for MBA 4 for a MUF of 1 SQ Pu to Keep βtotal at 5%
Detector at KMP 4
Detector at KMP 5
MBP (days) βC/S
IDMS ANCC 17 - HKED ANCC 11 - TMFD ANCC 10 0.5951
0
0.1
0.2
0.3
0.4
0.5
0.6
0.7
0.8
0.9
1
0 2 4 6 8
Nondetection Probability
MUF (kg)
MAC/S

30
Fig 13. βMA and βC/S versus MUF for MBA 4 using a TMFD at KMP 4 and a ANCC at
KMP 5.
MBA 5 used the ANCC at KMPs 5 and 6. For the MBP of 23 days, the βC/S is
0.6716 for a MUF of 1 SQ Pu. A graph of βMA and βC/S versus MUF from 1 to 8 kg of Pu
for MBA 5 is shown in Fig. 14.
Fig. 14. βMA and βC/S versus MUF for MBA 5 using a ANCC at KMPs 5 and 6.
0
0.1
0.2
0.3
0.4
0.5
0.6
0.7
0.8
0.9
1
0 2 4 6 8
Nondetection Probability
MUF (kg)
MAC/S
0
0.1
0.2
0.3
0.4
0.5
0.6
0.7
0.8
0.9
1
0 2 4 6 8
Nondetection Probability
MUF (kg)
MAC/S

31
MBA 6 was evaluated using 4 different detector schemes. The detectors
considered at both KMPs, MBPs, and βC/S’s are shown in TABLE 13 for a MUF of 1 SQ
U.
TABLE 13.
βC/S for MBA 6 for a MUF of 1 SQ U to Keep βtotal at 5%
Detector at KMP 7
Detector at KMP 8
MBP (days) βC/S
IDMSa HPGe 112 0.5342 HKEDa HPGe 91 0.3476 TMFDa HPGe 81 0.2947
KED HPGe 118 0.6252 a Detectors considered at KMP 3 with uncertainties perturbed across UREX separation step.
MBA 7 used the HPGe at KMPs 8 and 9. For the MBP of 94 days, the βC/S is
0.3731 for a MUF of 1 SQ U.
There is no graph showing βMA and. βC/S versus MUF for the U MBAs because
there is no time constraint. The MBPs are long enough that they could easily be
decreased to detect MUF less than 1 SQ.
These results show that the less total uncertainty in the detector system for each
MBA, the MA nondetection probability decreases. In turn, the C/S nondetection
probability can increase, (to keep the total nondetection probability at 5%) decreasing the
requirement on the C/S system.
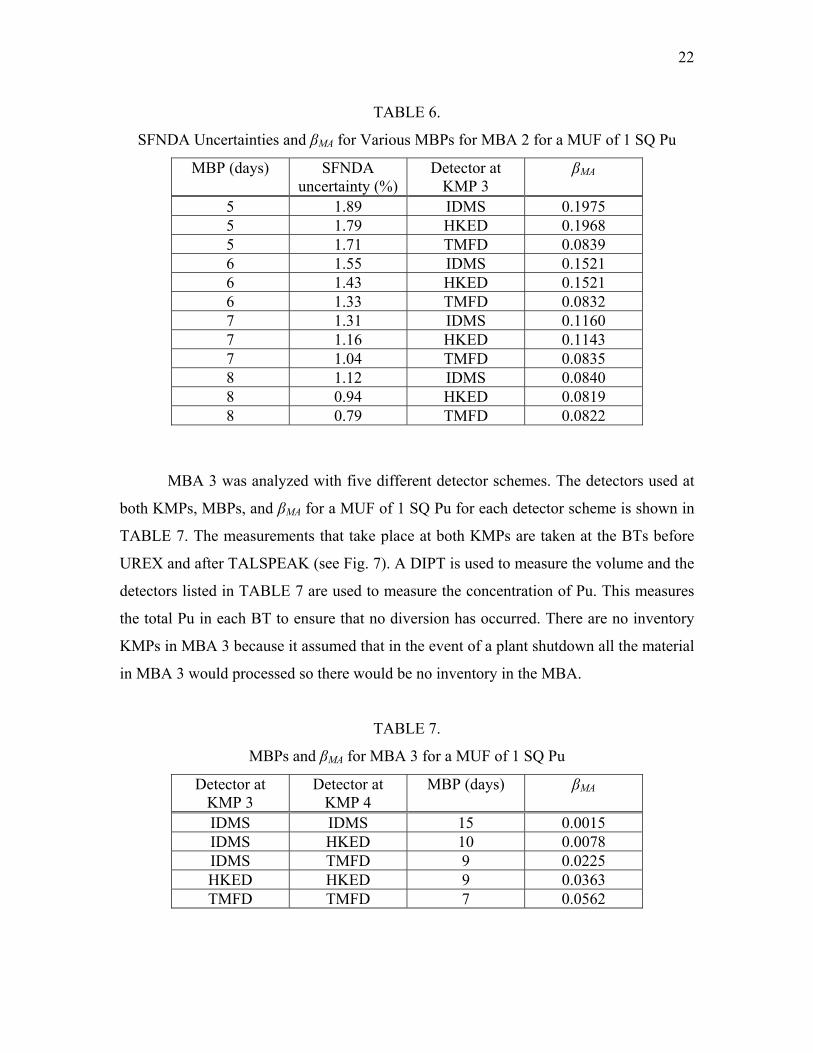
III.B.1. Summary of the Material Accountancy and Containment and Surveillance
Results
TABLE 14 shows the MA and C/S results for all the detector schemes and
SFNDA uncertainties considered at MBAs 1 and 2. TABLE 15 shows the MA and C/S
results for all the detector schemes considered at MBAs 3, 3A, 3B, 3C, 3D, 4, 5 ,6 ,7 and
8.
32
TABLE 14.
MBA 1 and 2 MA and C/S Results
MBA 1 Detector at
KMPs 1 & 2 SFNDA
uncertainty (%) MBP (days) βMA βC/S
SFNDA 10 0 0 0.05 SFNDA 1 6 0.0328 - SFNDA 1 30 0.8318 0.0601
MBA 2 KMP 2 SFNDA uncertainty (%)
Detector at KMP 3
MBP (days) βMA βC/S
1.89 IDMS 5 0.1975 0.2531 1.79 HKED 5 0.1968 0.2540 1.71 TMFD 5 0.0839 0.5956 1.55 IDMS 6 0.1521 0.3288 1.43 HKED 6 0.1521 0.3287 1.33 TMFD 6 0.0832 0.6010 1.31 IDMS 7 0.1160 0.4312 1.16 HKED 7 0.1143 0.4376 1.04 TMFD 7 0.0835 0.5985 1.12 IDMS 8 0.0840 0.5950 0.94 HKED 8 0.0819 0.6102 0.79 TMFD 8 0.0822 0.6083

33
TABLE 15.
MBA 3, 3A, 3B, 3C, 3D, 4, 5, 6, 7, and 8 MA and C/S Results
MBA 3 Detector at
KMP 3 Detector at
KMP 4 MBP (days) βMA βC/S
IDMS IDMS 15 0.0015 - IDMS HKED 10 0.0078 - IDMS TMFD 9 0.0225 - HKED HKED 9 0.0363 - TMFD TMFD 7 0.0562 0.8892
MBA 3A, 3B, 3C, 3D Detectors at KMPs 3, 3A, 3B, 3C,
4 MBP (days) βMA βC/S
TMFD 7 0.0562 0.8892 MBA 4
Detector at KMP 4
Detector at KMP 5
MBP (days) βMA βC/S
IDMS ANCC 17 0.0046 - HKED ANCC 11 0.0377 - TMFD ANCC 10 0.0840 0.5951
MBA 5 Detector at
KMP 5 Detector at
KMP 6 MBP (days) βMA βC/S
ANCC ANCC 23 0.0745 0.6716 MBA 6
Detector at KMP 7
Detector at KMP 8
MBP (days) βMA βC/S
IDMSa HPGe 112 0.0936 0.5342 HKEDa HPGe 91 0.1438 0.3476 TMFDa HPGe 81 0.1697 0.2947
KED HPGe 118 0.0800 0.6252 MBA 7
Detector at KMP 8
Detector at KMP 9
MBP (days) βMA βC/S
HPGe HPGe 94 0.1340 0.3713 MBA 8
Detector at KMP 10
Detector at KMP 11
MBP (days) βMA βC/S
PSMC PSMC - - -

III.C
rid o
indep
wher
FT b
conce
of th
analy
TMF
norm
shoul
shoul
adver
meas
take s
densi
C. Solution M
The incor
f the need o
pendent of th
/∗ CMA ββ
e βSM is the
before and
entration and
he MA syste
yzing the tota
D, as it is a
mal condition
ld be consta
ld steadily
rsary were t
urement sho
solution from
ity), the conc
Fig. 15. Nor
Monitoring
rporation of
of the C/S s
he MA and C
/ =∗ SMS ββ
SM nondete
after each
d volume of
em, as the
al Pu in each
a real-time m
ns, as the RT
ant, oscillatin
increase an
to take solut
ould detect t
m the line an
centration m
rmal concen
a SM system
system on M
C/S systems,
%5=totalβ
ection probab
Pu separa
f each RT an
MA system
h BT. The co
measurement
Ts and FTs
ng around i
d decrease.
tion from th
this diversio
nd replace th
measurement
ntration and v
m can reduc
MBAs conta
, the total no
bility. As sh
ation step. T
nd FT as it f
m confirms
oncentration
t and the DI
fill and em
ts nominal v
This is sh
he line and n
on, as shown
he solution w
should detec
volume grap
ce the require
aining soluti
ondetection p
hown in Fig.
The SM sy
fills and emp
that no div
n measureme
IPT for volu
mpty, the con
value, and t
hown if Fig
not replace
n in Fig.16.
with another
ct this divers
phs for RT fi
ements or co
ion. If the S
probability is
(9
7, there is a
ystem will
pties. This is
version has
ent will be d
ume measure
ncentration
the volume
. 15 for th
the solution
If the adver
r solution (w
sion as show
illing and em
3
ompletely ge
SM system i
s
9)
a RT, BT, an
monitor th
s independen
occurred m
done using th
ement. Unde
measuremen
measuremen
e RT. If th
n, the volum
rsary were t
with the sam
wn in Fig. 17
mptying.
34
et
is
nd
he
nt
my
he
er
nt
nt
he
me
to
me
7.

Fig.
Fig.
(wi
wher
detec
MBA
MBP
comp
divid
the s
negli
calcu
liters
.16. Diversio
17. Diversio
ith the same
βSM was fo
1SM −=β
e SMP is th
ction, and SCP
As 3A, 3B, 3
P for these M
puting βMA ex
ding the mas
same for all
gible). The l
ulated by div
of solution
on of solutio
volum
on of solutio
density) con
ound by
(1SM PP −=−
he SM prob
SMC is the SM
3C, and 3D a
MBAs. SMVP
xplained in
s of Pu per y
l the consid
liters (L) of
viding the k
entering and
on without re
me graph for
n while repl
ncentration a
)SMC
SMV PP ∗
bability of d
M concentrati
and was ana
and SMCP we
Sec. II.C. F
year by the
dered MBAs
solution ent
kgs of Pu pe
d exiting eac
eplacing the
r RT filling a
lacing the div
and volume
detection, VP
ion probabili
lyzed for a p
re calculated
First, the mas
MBPs per y
s (since los
tering and ex
er MBP by t
ch MBA per
diverted solu
and emptying
verted soluti
graph for RT
SMVP is the SM
ity of detecti
period of 7 d
d using the
ss of Pu per
year to get 1
sses in the p
xiting each M
the Pu conc
MBP is sho
ution, conce
g.
ion with ano
T filling and
(1
M volume p
ion. The SM
days since th
same basic
r MBP was
91.8 kg Pu/M
process wer
MBA per MB
centration. A
wn in TABL
3
entration and
other solution
d emptying.
10)
probability o
M was used o
hat is the MA
principles a
calculated b
MBP. This i
re essentiall
BP were the
A table of th
LE 16.
35
d
n
of
on
A
as
by
is
ly
en
he

36
TABLE 16.
Liters of Solution per MBP for MBAs 3A, 3B, 3C, and 3D
MBA 3A (L/MBP)
MBA 3B (L/MBP)
MBA 3C (L/MBP)
MBA 3D (L/MBP)
Entering 4.82•104 7.23•104 9.06•104 9.11•104 Exiting 7.23•104 9.06•104 9.11•104 1.51•105
To calculate SMVP the L/MBP entering and exiting the MBA was multiplied by the
volume uncertainty and combined to get the total MUF uncertainty, σMUF, in L over one
MBP. The threshold (S) is then calculated using the NORMINV function in excel which
returns the inverse of the normal cumulative distribution for a specified probability (1-α
= 95%), mean (μ = 0), and standard deviation (σMUF). The SM volume nondetection
probability ( )SMVβ was then calculated by using the NORMDIST function in excel that
returns the normal distribution for a specified threshold (S), mean (μ = # of L for 1 SQ),
and standard deviation (σMUF). SMVP is then found by 1- .SM
Vβ To calculate SM
CP the kgs Pu/MBP entering and exiting the MBA was multiplied
by the TMFD uncertainty and combined to get the total MUF uncertainty, σMUF, in kgs in
one MBP. The threshold (S) is then calculated using the NORMINV function in excel
which returns the inverse of the normal cumulative distribution for a specified probability
(1-α = 95%), mean (μ = 0), and standard deviation (σMUF). The SM concentration
nondetection probability ( )SMCβ was then calculated by using the NORMDIST function in
excel that returns the normal distribution for the specified threshold (S), mean (μ =1 SQ
in kgs), and standard deviation (σMUF). SMCP is then found by 1- .SM
Cβ
Since the nondetection probability achieved by the MA and SM systems is a
function of detector uncertainly, which is known, the nondetection probability for the C/S
system is found from
SMMASC ββ
β∗
=05.0
/ . (11)

37
For a MUF of 1 SQ Pu, βSM is 0.0082 over the 7 day MBP for all the MBAs
considered. A graph of βMA, βSM, and βC/S versus MUF to keep βtotal at 5% for MBAs 3A,
3B, 3C, and 3D is shown in Fig. 18. βC/S is not given for a MUF of 6 kg and greater
because the MA and SM systems achieve a βtotal of 5%.
Fig. 18. βMA, βSM, and βC/S versus MUF to keep βtotal at 5% for MBAs 3A, 3B, 3C, and 3D.
βSM, is slightly different for each of the MBAs because the concentration of Pu
decreases after each separation step and the volume of solution approximately doubles
from MBA 3A to 3D. This makes for a competing effect on βSM. More solution is needed
to obtain a given amount of Pu which decreases βSM and σMUF increases after each
separation step because the amount of solution increases as the solution is diluted which
increases βSM. The differences between each MBAs are small and are shown in Fig. 19.
βSM is dependent on facility information and if the solution volume increase were less,
βSM would change accordingly.
0
0.1
0.2
0.3
0.4
0.5
0.6
0.7
0.8
0.9
1
0 2 4 6 8
Nondetection Probability
MUF (kg)
SMMAC/S

38
Fig. 19. βSM for MBAs 3A, 3B, 3C, and 3D for a MUF from 1 to 8 kg Pu.
0.0000
0.1000
0.2000
0.3000
0.4000
0.5000
0.6000
0.7000
0.8000
0.9000
1.0000
0 2 4 6 8
βSM
MUF (kg)
UREXCCD-PEGTRUEXTALSPEAK
39
CHAPTER IV
PROPOSED UREX SAFEGUARDS APPROACH
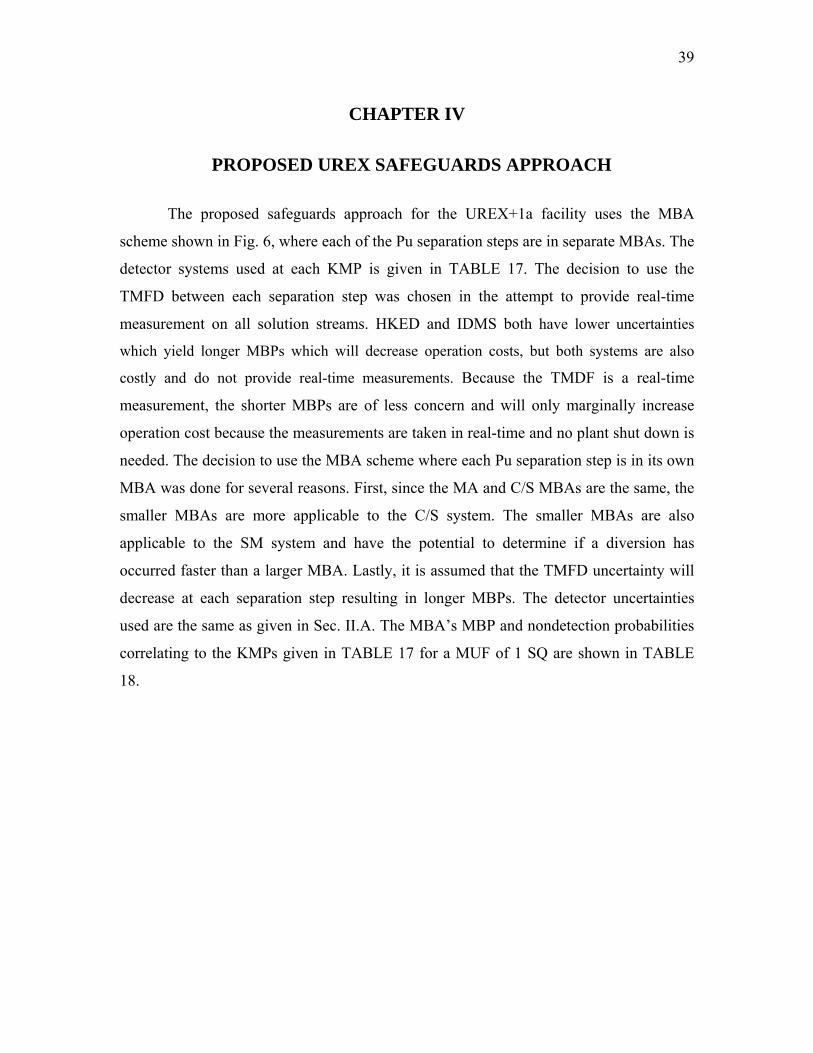
The proposed safeguards approach for the UREX+1a facility uses the MBA
scheme shown in Fig. 6, where each of the Pu separation steps are in separate MBAs. The
detector systems used at each KMP is given in TABLE 17. The decision to use the
TMFD between each separation step was chosen in the attempt to provide real-time
measurement on all solution streams. HKED and IDMS both have lower uncertainties
which yield longer MBPs which will decrease operation costs, but both systems are also
costly and do not provide real-time measurements. Because the TMDF is a real-time
measurement, the shorter MBPs are of less concern and will only marginally increase
operation cost because the measurements are taken in real-time and no plant shut down is
needed. The decision to use the MBA scheme where each Pu separation step is in its own
MBA was done for several reasons. First, since the MA and C/S MBAs are the same, the
smaller MBAs are more applicable to the C/S system. The smaller MBAs are also
applicable to the SM system and have the potential to determine if a diversion has
occurred faster than a larger MBA. Lastly, it is assumed that the TMFD uncertainty will
decrease at each separation step resulting in longer MBPs. The detector uncertainties
used are the same as given in Sec. II.A. The MBA’s MBP and nondetection probabilities
correlating to the KMPs given in TABLE 17 for a MUF of 1 SQ are shown in TABLE
18.
40
TABLE 17.
Detectors at each KMP for the Proposed Safeguard Approach
KMP Detector 1 Item + SFNDA 2 Item + SFNDA
3A, 3B, 3C, 3D TMFD 4 TMFD 5 ANCC 6 ANCC 7 TMFD 8 GRAV 9 GRAV 10 PSMC 11 PSMC
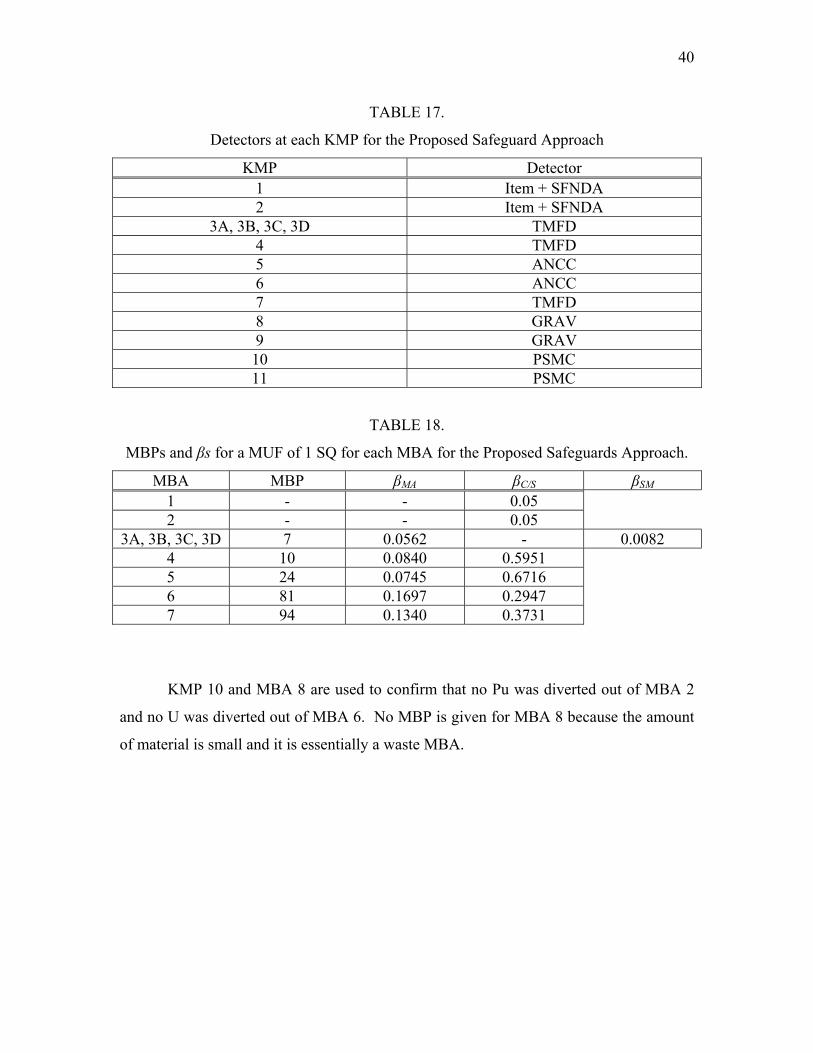
TABLE 18.
MBPs and βs for a MUF of 1 SQ for each MBA for the Proposed Safeguards Approach.
MBA MBP βMA βC/S βSM 1 - - 0.05 2 - - 0.05
3A, 3B, 3C, 3D 7 0.0562 - 0.0082 4 10 0.0840 0.5951 5 24 0.0745 0.6716 6 81 0.1697 0.2947 7 94 0.1340 0.3731
KMP 10 and MBA 8 are used to confirm that no Pu was diverted out of MBA 2
and no U was diverted out of MBA 6. No MBP is given for MBA 8 because the amount
of material is small and it is essentially a waste MBA.

41
CHAPTER V
SUMMARY AND CONCLUSIONS
Facility information was acquired for a hypothetical 1000 MTHM/yr UREX+1a
facility and the goals of the safeguards system were established based on the SQ and
timeliness goals set by the IAEA. The MA system was designed and analyzed and then
the requirements of the C/S system were determined to achieve the safeguard goals; a
total nondetection probability at 5% and a false alarm probability of 5%. A SM system
was then designed and analyzed to observe how it could relax the requirements of the C/S
system. It was shown that the additional safeguard measures resulted in relaxed C/S
system requirements to keep a certain βtotal or a decrease in βtotal.
The given safeguard approach shows that a UREX+1a facility can be safeguarded
to the same standards as current reprocessing facilities. The goals of the system were
reached and the MBPs are close to similar sized, current PUREX reprocessing facilities.
Since UREX+1a has a lower material attractiveness and can be safeguarded as well as
PUREX, UREX+1a is more proliferation resistant reprocessing technology.
Front end measurement techniques were considered and uncertainties must
decrease in order to be advantageous to the MA system. A range of uncertainties were
given that, if met, would result in reasonable MBPs. The results showed that SFNDA
uncertainties close to 1% are needed to provide value to the MA system. These results are
applicable to any reprocessing plant that has a spent fuel pool MBA and/or a MBA from
after the spent fuel pool to an input accountability tank or buffer tank (i.e. PUREX,
COEX) and processes the same amount of Pu per year. Currently the C/S system would
need to detect any diversion.
The shortest MBP achieved by the MA system is 7 days. Since these MBAs use
the TMFD, a real-time measurement, the shorter MBP is of less concern. If the TMFD,
along with any of the detectors used in the safeguards approach, uncertainties could be
decreased or new detectors developed with lower uncertainties, the MBPs on all MPAs
could be lengthened, decreasing operation costs. It should be noted that the TMFD is still

42
being developed and may not achieve the uncertainty used in the safeguards approach. If
the TMFD uncertainty is larger than used here or not used in the safeguards approach at
all, the safeguard goals can still be met with the other detector schemes considered. The
other detector schemes will not have real-time measurements but the UREX+1a facility
can be safeguarded to the same standards as current reprocessing facilities.
Future work includes the analysis of acquisition pathways and protracted
diversion scenarios. Testing of the TMFD is ongoing and better detector uncertainties
could be used to refine the safeguards system. There are also extensive efforts on front
end measurement techniques. If these detector uncertainties could be decreased bulk
SNM measurement techniques could be used in addition to item accounting and C/S.

43
REFERENCES
1) World Nuclear Association, “Global Nuclear Energy Partnership,”
http://www.world-nuclear.org/info/inf117_gnep.html, (2009).
2) M. BENEDICT, T. H. PIGFORD, and H. W. LEVI, Nuclear Chemical
Engineering, McGraw-Hill, Inc. New York, New York (1981).
3) J. J. LAIDLER, “GNEP Spent Fuel Reprocessing; Waste Streams and Disposition
Options,” Argonne National Laboratory, Argonne, Illinois (2007).
4) World Nuclear Association, “Processing of Used Nuclear Fuel,”
http://www.world-nuclear.org/info/inf69.html, (2009).
5) P.C. DURST, I. THERISO, R. BEAN, A. DOUGAN, B. D. BOYER, R.
WALLACE, M. EHINGER, D. KOVACIC, and K. TOLK, “Advanced
Safeguards Approaches for New Reprocessing Facilities,” PNNL-16674, Pacific
Northwest National Laboratory, Richland, Washington (2007).
6) K. HOWDEN, J. J. PARK, “Development of Voloxidation Process for Treatment
of LWR Spent Fuel,” Argonne National Laboratory and Korea Atomic Energy
Research Institute, (2007).
7) International Atomic Energy Agency, “Development of Advanced Reprocessing
Technologies,” International Atomic Energy Agency, Vienna (1998)
8) Personal communication and spreadsheet from Candido Pereira from Argonne
National Laboratory (2008).
9) International Atomic Energy Agency, “The Evolution of IAEA Safeguards,”
IAEA/NVS/3, International Atomic Energy Agency, Vienna (1998).
10) International Atomic Energy Agency, “IAEA Safeguards Glossary,”
IAEA/NVS/2, International Atomic Energy Agency, Vienna (2001)
11) J. E. STEWART, “Measurement and Accounting of the Minor Actinides
Produced in Nuclear Power Reactors,” LA-13054-MS, Los Alamos National
Laboratory, Los Alamos, New Mexico (1996).
44
12) J. HOWELL, M. EHINGER, T. BURR, “Process Monitoring for Safeguards,”
LA-UR-07-7305, Los Alamos National Laboratory, Los Alamos, New Mexico
(1998).
13) T. BURR, C. A. COULTER, and L. E. WANGEN, “Solution Monitoring:
Quantitative Benefits to Safeguards,” LA-UR-97-3467, Los Alamos National
Laboratory, Los Alamos, New Mexico.
14) T. BURR, C. A. COULTER, J. HOWELL and L. E. WANGEN, “Solution
Monitoring: Quantitative and Qualitative Benefits to Safeguards,” Nuclear
Science and Technology, 40(4), 256-263 (2003).
15) T. BURR, and L. WANGEN, “Enhanced Safeguards Via Solution Monitoring,”
LA-13186-MS, ISPO-390, Los Alamos National Laboratory, Los Alamos, New
Mexico (1996).
16) S. J. TOBIN, S. F. DEMUTH, M. L. FENSIN, J. S. HENDRICKS, H. O.
MENLOVE, M. T. SWINHOE, “Determination of Plutonium Content in Spent
Fuel with NDA- Why an Integrated Approach?” Institute of Nuclear Material
Management 48th Annual Meeting, Nashville, TN, July 14-17 2008.
17) C. WILLMAN, A. HAKANSSON, O. OSIFO, A. BACKLIN, S. J. SAVRD,
“Nondestructive Assay of Spent Nuclear Fuel with Gamma-ray Spectroscopy,”
Annals of Nuclear Energy, 33, 427-438 (2006).
18) A. M. LAFLEUR, W. S. CHARLTON, H. O. MENLOVE, M. T. SWINHOE,
“Development of Self-Interrogation Neutron Resonance Densitometry (SINRD)
to Measure the 235U and 239Pu Content in a PWR 17x17 Spent Fuel Assembly,”
Proceedings of 31st Annual ESARDA Meeting, Vilnius, Lithuania, May 26-28,
2009.
19) B. B. CIPITI and N. L. RICKER, “Advancing the State of the Art in Materials
Accountancy through Safeguards Performance Modeling,” SAND2008-5100,
Sandia National Laboratory, Albuquerque, New Mexico (2008).
20) R. AVENHAUS, Safeguard Systems Analysis, Plenum Press, New York, (1986).
21) A. S. GOLDMAN, R. R. PICARD, J. P. SHIPLEY, “Statistical Methods for
Nuclear Material Safeguards: An Overview,” Technometrics, 24(4), 267-275
(1982).
45
22) J.R. LAPINSKAS, S.M. ZIELINSKI, J.A. WEBSTER, R.P. TALEYARKHAN,
S.M. MCDEAVITT and Y. XU, “Tension Metastable Fluid Detection Systems for
Special Nuclear Material Detection and Monitoring,” 17th International
Conference on Nuclear Engineering (ICONE17), Brussels, Belgium, July 12-16,
2009.
23) D. REILLY, N. ENSSLIN, and H. SMITH, “Passive Nondestructive Assay of
Nuclear Materials,” Los Alamos National Laboratory, Los Alamos, New Mexico,
LA-UR-90-732 (1991).
24) ESARDA Bulletin, No. 37, NDA Technical Sheets, 41-60. December 2007.
25) D. ROGERS, “Handbook of Nuclear Safeguards Measurement Methods,” US
Nuclear Regulatory. Commission, Washington, DC, (1983).
26) J. E. STEWART and M. S. KRICK, “Performance of the Plutonium Scrap
Multiplicity Counter for Verification of Excess Scrap Plutonium Oxide from
Nuclear Weapons Production,” LA-UR-97-2070, Los Alamos National
Laboratory, Los Alamos, New Mexico (1997).
27) H. AINGER, R. BINNER, E. KUHN, U. BLOHM-HIEBER, K. MAYER, S.
GUARDINI, C. PIETRI, B. RAPPINGER, B. MITTERRAND, J. REED, O.
MAFRA-GUIDICINI, S. DERON, “International Target Values 2000 for
Measurement Uncertainties in Safeguarding Nuclear Materials”, International
Atomic Energy Agency, Vienna (2000).

46
VITA
Name: Jessica Shawn Feener
Address: Texas A&M University Department of Nuclear Engineering Nuclear Security Science and Policy Institute 3133 TAMU College Station, TX 77843-3133 Email Address: [email protected] [email protected] Education: B.S., Nuclear and Radiological Engineering, Georgia Institute of
Technology, 2007 M.S., Nuclear Engineering, Texas A&M University, 2010