Embed Size (px)
Citation preview

Achievements in Public Health, 1900–1999
Safer and Healthier Foods
Safer and Healthier Foods — ContinuedDuring the early 20th century, contaminated food, milk, and water caused many
foodborne infections, including typhoid fever, tuberculosis, botulism, and scarlet fe-
ver. In 1906, Upton Sinclair described in his novel The Jungle the unwholesome work-
ing environment in the Chicago meat-packing industry and the unsanitary conditions
under which food was produced. Public awareness dramatically increased and led to
the passage of the Pure Food and Drug Act (1 ). Once the sources and characteristics
of foodborne diseases were identified—long before vaccines or antibiotics—they
could be controlled by handwashing, sanitation, refrigeration, pasteurization, and pes-
ticide application. Healthier animal care, feeding, and processing also improved food
supply safety. In 1900, the incidence of typhoid fever was approximately 100 per
100,000 population; by 1920, it had decreased to 33.8, and by 1950, to 1.7 (Figure 1).
During the 1940s, studies of autopsied muscle samples showed that 16% of persons
U.S. DEPARTMENT OF HEALTH & HUMAN SERVICES
905 Safer and Healthier Foods
914 Folic Acid Campaign andEvaluation — SouthwesternVirginia, 1997–1999
918 Self-Reported Asthma in Adultsand Proxy-Reported Asthma inChildren — Washington,1997–1998
October 15, 1999 / Vol. 48 / No. 40
1920 1930 1940 1950 1960
0
10
20
30
40
50
Year
Incid
en
ce
*Per 100,000 population.
FIGURE 1. Incidence* of typhoid fever, by year — United States, 1920–1960

in the United States had trichinellosis; 300–400 cases were diagnosed every year, and
10–20 deaths occurred (2 ). Since then, the rate of infection has declined markedly;
from 1991 through 1996, three deaths and an average of 38 cases per year were re-
ported (3 ).
Nutritional sciences also were in their infancy at the start of the century. Unknown
was the concept that minerals and vitamins were necessary to prevent diseases
caused by dietary deficiencies. Recurring nutritional deficiency diseases, including
rickets, scurvy, beri-beri, and pellagra were thought to be infectious diseases. By 1900,
biochemists and physiologists had identified protein, fat, and carbohydrates as the
basic nutrients in food. By 1916, new data had led to the discovery that food contained
vitamins, and the lack of “vital amines” could cause disease. These scientific discov-
eries and the resulting public health policies, such as food fortification programs, led
to substantial reductions in nutritional deficiency diseases during the first half of the
century. The focus of nutrition programs shifted in the second half of the century from
disease prevention to control of chronic conditions, such as cardiovascular disease
and obesity.
Food Safety
Perishable foods contain nutrients that pathogenic microorganisms require to re-
produce. Bacteria such as Salmonella sp., Clostridium sp., and Staphylococcus sp.
can multiply quickly to sufficient numbers to cause illness. Prompt refrigeration slows
bacterial growth and keeps food fresh and edible.
At the turn of the 20th century, consumers kept food fresh by placing it on a block
of ice or, in cold weather, burying it in the yard or storing it on a window sill outside.
During the 1920s, refrigerators with freezer compartments became available for
household use. Another process that reduced the incidence of disease was invented
by Louis Pasteur—pasteurization. Although the process was applied first in wine pres-
ervation, when milk producers adopted the process, pasteurization eliminated a sub-
stantial vector of foodborne disease (see box, page 907). In 1924, the Public Health
Service created a document to assist Alabama in developing a statewide milk sanita-
tion program. This document evolved into the Grade A Pasteurized Milk Ordinance, a
voluntary agreement that established uniform sanitation standards for the interstate
shipment of Grade A milk and now serves as the basis of milk safety laws in the
50 states and Puerto Rico (4 ).
Along with improved crop varieties, insecticides and herbicides have increased
crop yields, decreased food costs, and enhanced the appearance of food. Without
proper controls, however, the residues of some pesticides that remain on foods can
create potential health risks (5 ). Before 1910, no legislation existed to ensure the
safety of food and feed crops that were sprayed and dusted with pesticides. In 1910,
the first pesticide legislation was designed to protect consumers from impure or im-
properly labeled products. During the 1950s and 1960s, pesticide regulation evolved
to require maximum allowable residue levels of pesticides on foods and to deny reg-
istrations for unsafe or ineffective products. During the 1970s, acting under these
strengthened laws, the newly formed Environmental Protection Agency (EPA) re-
moved DDT and several other highly persistent pesticides from the marketplace. In
1996, the Food Quality Protection Act set a stricter safety standard and required the
review of older allowable residue levels to determine whether they were safe. In 1999,
906 MMWR October 15, 1999
Safer and Healthier Foods — Continued

Milton J. Rosenau, M.D.
Few public health issues are more public than food
safety, which can involve health officials, farmers,
manufacturers, and consumers. Milton J. Rosenau
played a crucial role in the long, contentious campaign
to make milk supplies pure and safe in the United States.
As researcher, health official, and educator, Rosenau put
medical science to work in the service of preventive
medicine and public health.
Rosenau was born in Philadelphia on January 1,
1869, and received his medical degree from the Univer-
sity of Pennsylvania in 1889. In 1890, he joined the
United States Marine Hospital Service (MHS). He served as quarantine officer in
San Francisco from 1895–1898 and in Cuba in 1898. During 1899–1909, he directed
the MHS Hygienic Laboratory, transforming a one-person operation into a bustling
institution with divisions in bacteriology, chemistry, pathology, pharmacology, zo-
ology, and biology. Rosenau conducted his most important medical research dur-
ing his 10 years at the Hygienic Laboratory, publishing many articles and books,
including The Milk Question (1912) and Preventive Medicine and Hygiene (1913),
which quickly became the most influential textbook on the subject.
From early in his career, campaigns to reduce milkborne diseases occupied
Rosenau’s attention. As he stated in his textbook, “Next to water purification, pas-
teurization is the most important single preventive measure in the field of sanita-
tion.” A Public Health Service study in 1909 reported that 500 outbreaks of
milkborne diseases had occurred during 1880–1907. By 1900, increasing numbers
of children drank pasteurized milk, but raw milk remained the norm partly because
the high-temperature process then in use imparted a “cooked milk” taste. In 1906,
Rosenau established that low temperature, slow pasteurization (140 F [60 C] for 20
minutes) killed pathogens without spoiling the taste, thus eliminating a key obsta-
cle to public acceptance of pasteurized milk. However, securing a safe milk supply
nationwide took another generation. By 1936, pasteurized, certified milk was the
standard in most large cities, although over half of all milk in the United States was
still consumed raw.
In 1913, Rosenau became a Harvard University Medical School professor and a
co-founder of the Harvard and Massachusetts Institute of Technology School for
Health Officers. When Harvard established a school of public health in 1922,
Rosenau directed its epidemiology program until 1935. In 1936, he moved to the
University of North Carolina, Chapel Hill, to help establish its public health school
(1940), where he served as dean until his death in 1946.
Rosenau was a dedicated teacher and advocate for improved training in preven-
tive medicine, but he is better remembered for his textbook than his pioneering
epidemiologic work. This is as he expected: “We find monuments erected to heroes
who have won wars, but we find none commemorating anyone’s preventing a war.
The same is true with epidemics.”
Vol. 48 / No. 40 MMWR 907
Safer and Healthier Foods — Continued

federal and state laws required that pesticides meet specific safety standards; the EPA
reviews and registers each product before it can be used and sets levels and restric-
tions on each product intended for food or feed crops.
Newly recognized foodborne pathogens have emerged in the United States since
the late 1970s; contributing factors include changes in agricultural practices and food
processing operations, and the globalization of the food supply (Table 1). Seemingly
healthy food animals can be reservoirs of human pathogens. During the 1980s, for
example, an epidemic of egg-associated Salmonella serotype Enteritidis infection
spread to an estimated 45% of the nation’s egg-laying flocks, which resulted in a large
increase in egg-associated foodborne illness within the United States (6,7 ). Es-
cherichia coli O157:H7, which can cause severe infections and death in humans, pro-
duces no signs of illness in its nonhuman hosts (8 ). In 1993, a severe outbreak of E.
coli O157:H7 infections attributed to consumption of undercooked ground beef (9 )
resulted in 501 cases of illness, 151 hospitalizations, and three deaths, and led to a
restructuring of the meat inspection process. The most common foodborne infectious
agent may be the calicivirus (a Norwalk-like virus), which can pass from the unwashed
hands of an infected foodhandler to the meal of a consumer. Animal husbandry and
meat production improvements that have contributed to reducing pathogens in the
food supply include pathogen eradication campaigns, the Hazard Analysis and Critical
Control Point (HACCP) programs (10 ), better animal feeding regulations (11 ), the use
of uncontaminated water in food processing (12 ), more effective food preservatives
(13 ), improved antimicrobial products for sanitizing food processing equipment and
facilities, and adequate surveillance of foodhandling and preparation methods (14 ).
HACCP programs also are mandatory for the seafood industry (15 ).
Improved surveillance, applied research, and outbreak investigations have eluci-
dated the mechanisms of contamination that are leading to new control measures for
foodborne pathogens. In meat-processing plants (16 ), the incidence of Salmonella
and Campylobacter infections has decreased. However, in 1998, apparently unrelated
TABLE 1. Newly recognized pathogens identified as predominantly foodborne
Campylobacter coli
Campylobacter jejuni
Campylobacter fetus ssp. fetus
Cryptosporidium parvum
Cyclospora cayetanensis
Escherichia coli O157:H7 and related E. coli (e.g., O111:NM and O104:H21)
Listeria monocytogenes
Norwalk-like viruses
Nitschia pungens (cause of amnesic shellfish poisoning)
Salmonella serotype Enteritidis
Salmonella serotype Typhimurium DT 104
Vibrio cholerae Non-O1
Vibrio vulnificus
Vibrio parahaemolyticus
Yersinia enterocolitica
908 MMWR October 15, 1999
Safer and Healthier Foods — Continued

cases of Listeria infections were linked when an epidemiologic investigation indicated
that isolates from all cases shared the same genetic DNA fingerprint; approximately
100 cases and 22 deaths were traced to eating hot dogs and deli meats produced in a
single manufacturing plant (17 ). In 1998, a multistate outbreak of shigellosis was
traced to imported parsley (18 ). During 1997–1998 in the United States, outbreaks of
cyclosporiasis were associated with mesclun mix lettuce, basil/basil-containing prod-
ucts, and Guatemalan raspberries (19 ). These instances highlight the need for meas-
ures that prevent food contamination closer to its point of production, particularly if
the food is eaten raw or is difficult to wash (20 ).
Any 21st century improvement will be accelerated by new diagnostic techniques
and the rapid exchange of information through use of electronic networks and the
Internet. PulseNet, for example, is a network of laboratories in state health depart-
ments, CDC, and food regulatory agencies. In this network, the genetic DNA finger-
prints of specific pathogens can be identified and shared electronically among
laboratories, enhancing the ability to detect, investigate, and control geographically
distant yet related outbreaks. Another example of technology is DPDx, a computer
network that identifies parasitic pathogens. By combining PulseNet and DPDx with
field epidemiologic investigations, the public health system can rapidly identify and
control outbreaks. CDC, the Food and Drug Administration, the U.S. Department of
Agriculture (USDA), other federal agencies, and private organizations are enhancing
food safety by collaborating in education, training, research, technology, and transfer
of information and by considering food safety as a whole—from farm to table.
Nutrition
The discovery of essential nutrients and their roles in disease prevention has been
instrumental in almost eliminating nutritional deficiency diseases such as goiter, rick-
ets, and pellagra in the United States. During 1922–1927, with the implementation of a
statewide prevention program, the goiter rate in Michigan fell from 38.6% to 9.0 %
(21) . In 1921, rickets was considered the most common nutritional disease of children,
affecting approximately 75% of infants in New York City (22 ). In the 1940s, the fortifi-
cation of milk with vitamin D was a critical step in rickets control.
Because of food restrictions and shortages during the first world war, scientific dis-
coveries in nutrition were translated quickly into public health policy; in 1917, USDA
issued the first dietary recommendations based on five food groups; in 1924, iodine
was added to salt to prevent goiter. The 1921–1929 Maternal and Infancy Act enabled
state health departments to employ nutritionists, and during the 1930s, the federal
government developed food relief and food commodity distribution programs, includ-
ing school feeding and nutrition education programs, and national food consumption
surveys.
Pellagra is a good example of the translation of scientific understanding to public
health action to prevent nutritional deficiency. Pellagra, a classic dietary deficiency
disease caused by insufficient niacin, was noted in the South after the Civil War. Then
considered infectious, it was known as the disease of the four Ds: diarrhea, dermatitis,
dementia, and death. The first outbreak was reported in 1907. In 1909, more than
1000 cases were estimated based on reports from 13 states. One year later, approxi-
mately 3000 cases were suspected nationwide based on estimates from 30 states and
the District of Columbia. By the end of 1911, pellagra had been reported in all but nine
Vol. 48 / No. 40 MMWR 909
Safer and Healthier Foods — Continued

states, and prevalence estimates had increased nearly ninefold (23 ). During 1906–
1940, approximately 3 million cases and approximately 100,000 deaths were attrib-
uted to pellagra (24 ). From 1914 until his death in 1929, Joseph Goldberger, a Public
Health Service physician, conducted groundbreaking studies that demonstrated that
pellagra was not infectious but was associated with poverty and poor diet. Despite
compelling evidence, his hypothesis remained controversial and unconfirmed until
1937. The near elimination of pellagra by the end of the 1940s (Figure 2) has been
attributed to improved diet and health associated with economic recovery during the
1940s and to the enrichment of flour with niacin. Today, most physicians in the United
States have never seen pellagra although outbreaks continue to occur, particularly
among refugees and during emergencies in developing countries (25 ).
The growth of publicly funded nutrition programs was accelerated during the early
1940s because of reports that 25% of draftees showed evidence of past or present
malnutrition; a frequent cause of rejection from military service was tooth decay or
loss. In 1941, President Franklin D. Roosevelt convened the National Nutrition Confer-
ence for Defense, which led to the first recommended dietary allowances of nutrients,
and resulted in issuance of War Order Number One, a program to enrich wheat flour
with vitamins and iron. In 1998, the most recent food fortification program was initi-
ated; folic acid, a water-soluble vitamin, was added to cereal and grain products to
prevent neural tube defects.
While the first half of the century was devoted to preventing and controlling nutri-
tional deficiency disease, the focus of the second half has been on preventing chronic
5000
4500
4000
3500
3000
2500
2000
1500
1000
500
01920 1925 1930 1935 1940 1945 1950 1955 1960
Year
De
ath
s
Female
Male
Used by permission. © American Journal of Clinical Nutrition, American Society for ClinicalNutrition.
FIGURE 2. Number of reported pellagra deaths, by sex of decedent and year — UnitedStates, 1920–1960
910 MMWR October 15, 1999
Safer and Healthier Foods — Continued

disease with initiation of the Framingham Heart Study in 1949. This landmark study
identified the contribution of diet and sedentary lifestyles to the development of car-
diovascular disease, and the effect of elevated serum cholesterol on the risk for coro-
nary heart disease. With increased awareness, public health nutrition programs have
sought strategies to improve diets. By the 1970s, food and nutrition labeling and other
consumer information programs stimulated the development of products low in fat,
saturated fat, and cholesterol. Since then, persons in the United States have signifi-
cantly decreased their dietary intakes of total fat from approximately 40% of total calo-
rie intake in 1977–1978 to 33% in 1994–1996, approaching the recommended 30%
(26) ; saturated fat intake and serum cholesterol levels also have decreased (27 ). Pre-
vention efforts, including changes in diet (28 ) and lifestyle and early detection and
improved treatment, have contributed to impressive declines in mortality from heart
disease and stroke (29 ).
Populations with diets rich in fruits and vegetables have a substantially lower risk
for many types of cancer. In 1991, the National Cancer Institute and the Produce for
Better Health Foundation launched a program to encourage eating at least five serv-
ings of fruits and vegetables daily. Although public awareness of the “5 A Day” mes-
sage has increased, only approximately 36% of persons in the United States aged
≥2 years achieved the daily goal of five or more servings of fruits and vegetables (28 ).
A diet rich in fruits and vegetables that provide vitamins, antioxidants (including ca-
rotenoids), other phytochemicals, and fiber is associated with additional health bene-
fits, including decreased risk for cardiovascular disease.
The most urgent challenge to nutritional health during the 21st century will be obe-
sity. In the United States, with an abundant, inexpensive food supply and a largely
sedentary population, overnutrition has become an important contributor to morbid-
ity and mortality in adults. As early as 1902, USDA’s W.O. Atwater linked dietary intake
to health, noting that “the evils of overeating may not be felt at once, but sooner or
later they are sure to appear—perhaps in an excessive amount of fatty tissue, perhaps
in general debility, perhaps in actual disease” (30 ). In U.S. adults, overweight (body
mass index [BMI] of ≥25 kg/m2) and obesity (BMI ≥30 kg/m2) have increased markedly,
especially since the 1970s. In the third National Health and Nutrition Examination Sur-
vey (NHANES III, 1988–1994), the crude prevalence of overweight for adults aged
≥20 years was 54.9%. From 1976–1980 (NHANES II) to 1988–1994 (NHANES III), the
prevalence of obesity increased from 14.5% to 22.5% (31 ).
Overweight and obesity increase risk for and complications of hypertension, hyper-
lipidemia, diabetes, coronary heart disease, osteoarthritis, and other chronic disor-
ders; total costs attributable to obesity are an estimated $100 billion annually (32 ).
Obesity also is a growing problem in developing countries where it is associated with
substantial morbidity and where malnutrition, particularly deficiencies of iron, iodine,
and vitamin A, affects approximately 2 billion people. Increasing physical activity in
the U.S. population is an important step (33 ), but effective prevention and control of
overweight and obesity will require concerted public health action.
As the U.S. population ages, attention to both nutrition and food safety will become
increasingly important. Challenges will include maintaining and improving nutritional
status, because nutrient needs change with aging, and assuring food quality and
safety, which is important to an older, more vulnerable population. Continuing chal-
lenges for public health action include reducing iron deficiency, especially in infants,
Vol. 48 / No. 40 MMWR 911
Safer and Healthier Foods — Continued

young children, and women of childbearing age; improving initiation and duration of
breastfeeding; improving folate status for women of childbearing age; and applying
emerging knowledge about nutrition on dietary patterns and behavior that promote
health and reduce risk for chronic disease. Behavioral research indicates that success-
ful nutrition promotion activities focus on specific behaviors, have a strong consumer
orientation, segment and target consumers, use multiple reinforcing channels, and
continually refine the messages (34 ). These techniques form a paradigm to achieve
public health goals and to communicate and motivate consumers to change their be-
havior.Reported by: Environmental Protection Agency. United States Department of Agriculture. Centerfor Food Safety and Applied Nutrition, Food and Drug Administration. Div of Nutrition ResearchCoordination, National Institutes of Health. National Center for Health Statistics; National Centerfor Environmental Health; National Center for Infectious Diseases; National Center for ChronicDisease Prevention and Health Promotion, CDC.
References1. Young JH. Pure food: securing the Federal Food and Drugs Act of 1906. Princeton, New Jersey:
Princeton University Press, 1989.2. Schantz PM. Trichinosis in the United States—1947–1981. Food Technol 1983;March:83–86.
3. Moorhead A. Trichinellosis in the United States, 1991–1996: declining but not gone. Am JTrop Med Hyg 1999;60:66–9.
4. Public Health Service. 1924 United States Proposed Standard Milk Ordinance. Public HealthReports, Washington, DC: Public Health Service, November 7, 1924.
5. Fan AM, Jackson RJ. Pesticides and food safety. Regulatory Toxicology & Pharmacology.1989;9:158–74.
6. St. Louis ME, Morse DL, Potter ME, et al. The emergence of grade A eggs as a major sourceof Salmonella enteritidis infections: new implications for the control of salmonellosis. JAMA1988;259:2103–7.
7. Ebel ED, Hogue AT, Schlosser WD. Prevalence of Salmonella enterica serovar enteritidis inunpasteurized liquid eggs and aged laying hens at slaughter: implications on epidemiologyand control of the disease. In: Saeed AM, Gast RK, Potter ME, Wall PG, eds. Salmonella entericaserovar enteritidis in humans and animals; epidemiology, pathogenesis and control. Ames,Iowa: Iowa State University Press, 1999:341–52.
8. Griffin PM. Epidemiology of shiga toxin-producing Escherichia coli infections in humans inthe United States. In: Kaper JB, O’Brien AD, eds. Escherichia coli O157:H7 and other Shiga-toxin producing E. coli strains. Washington, DC: American Society for Microbiology,1998:15–22.
9. Bell BP, Goldoft M, Griffin PM, et al. A multistate outbreak of Escherichia coli O157:H7-associated bloody diarrhea and hemolytic uremic syndrome from hamburgers: the Wash-ington experience. JAMA 1994;272:1349–53.
10. Amendment to the Federal Meat Inspection Act and the Poultry Products Inspection Act toEnsure the Safety of Imported Meat and Poultry Products. Ensuring the Safety of ImportedMeat and Poultry Act of 1999. H. R. 2581, July 21, 1999.
11. CDC. Trichinella spiralis infection—United States, 1990. MMWR 1991;40:35.
12. CDC. Outbreaks of cyclosporiasis—United States and Canada, 1997. MMWR 1997;46:521.
13. Binkerd EF, Kolari OE. The history and use of nitrate and nitrite in the curing of meat. Food& Cosmetics Toxicology 1975;13:655–61.
14. CDC. Multistate surveillance for food handling, preparation, and consumption. MMWR1998;47(no. SS-4):33–57.
15. Shapiro RL, Altekruse S, Hutwagner L, et al. The role of Gulf Coast oysters harvested in warmermonths in Vibrio vulnificus infections in the United States, 1988–1996. J Infect Dis1998;178:752–9.
16. CDC. Incidence of foodborne illnesses: preliminary data from the Foodborne Disease ActiveSurveillance Network (FoodNet)—United States, 1998. MMWR 1999;48:189–94.
17. CDC. Update: Multistate outbreak of listeriosis—United States, 1998–1999. MMWR1999;47:1117–8.
912 MMWR October 15, 1999
Safer and Healthier Foods — Continued

18. CDC. Outbreaks of Shigella sonnei infection associated with eating fresh parsley—UnitedStates and Canada, July–August, 1998. MMWR 1999;48:285–9.
19. Herwaldt BL, Ackers ML, and the Cyclospora Working Group. An outbreak in 1996 of cyclospori-asis associated with imported raspberries. N Engl J Med 1997;336:1548–56.
20. Osterholm MT, Potter ME. Irradiation pasteurization of solid foods; taking food safety to thenext level. Emerging Infectious Diseases 1997;3:575–7.
21. Langer PL. History of goitre. In: Endemic goitre. Geneva, Switzerland: World Health Organi-zation, 1960:9–25 (WHO Monograph Series No. 44).
22. Hess AF. Newer aspects of some nutritional disorders. JAMA 1921;76:693–700.
23. Lanska DJ. Stages in the recognition of epidemic pellagra in the United States: 1865–1960.Neurol 1996;47:829–34.
24. Bollet AJ. Politics and pellagra: the epidemic of pellagra in the US in the early twentiethcentury. Yale J Biol Med 1992;65:211–21.
25. CDC. Outbreak of pellagra among Mozambican refugees—Malawi, 1990. MMWR 1991;40:209–13.
26. Tippett KS, Cleveland LE. How current diets stack up: comparison with dietary guidelines.
In: Frazao E, ed. America’s eating habits: changes and consequences. Washington, DC: USDepartment of Agriculture, Economic Research Service, Food and Rural Economics Divi-sion,1999:51–70 (Agricultural Information Bulletin no. 750).
27. Ernst ND, Sempos ST, Briefel RR, Clark MB. Consistency between US dietary fat intake andserum total cholesterol concentrations: the National Health and Nutrition Examination sur-veys. Am J Clin Nutr 1997;66:965S–972S.
28. Crane NT, Hubbard VS, Lewis CJ. American diets and year 2000 goals. In: US Departmentof Agriculture. America’s eating habits: changes and consequences. Washington, DC: US De-partment of Agriculture, Economic Research Service, Food and Rural Economics Division,1999:111–32 (Agricultural Information Bulletin no. 750).
29. CDC. Decline in deaths from heart disease and stroke—United States, 1900–1999. MMWR1999;48:649–56.
30. Atwater WO. Foods: nutritive value and cost. Washington, DC: US Department of Agriculture,1894 (Farmers’ Bulletin no. 23).
31. Flegal KM, Carroll MD, Kuczmarski RJ, Johnson CL. Overweight and obesity in the UnitedStates: prevalence and trends, 1960–1994. Int J Obesity 1998;22:39–47.
32. Wolf AM, Colditz GA. Current estimates of the economic cost of obesity in the United States:whither? Obesity Res 1998;6:97–106.
33. CDC. Physical activity and health: a report of the Surgeon General. Atlanta, Georgia: US De-partment of Health and Human Services, CDC, 1996.
34. Contento I, Balch GI, Bronner YL, et al. The effectiveness of nutrition education and impli-cations for nutrition education policy, programs and research: a review of research. J NutrEdu 1995;27:279–83.
Safer and Healthier Foods — Continued
Vol. 48 / No. 40 MMWR 913
Safer and Healthier Foods — Continued

Folic Acid Campaign and Evaluation —Southwestern Virginia, 1997–1999
Folic Acid Campaign — ContinuedA needs assessment conducted in rural southwestern Virginia in 1996 indicated
higher rates of birth defects in that region than in the entire state (1 ). In response to
these findings, in January 1997 the regional perinatal council conducted a community
folic acid information campaign designed to raise awareness about the 1992 Public
Health Service recommendation that all women who are capable of becoming preg-
nant consume 400 µg (0.4 mg) of the B vitamin folic acid every day to decrease their
risk for having a pregnancy affected with spina bifida or other neural tube defects
(NTDs) (2 ). This report describes the information campaign and the findings from pre-
campaign and postcampaign surveys, which showed a significant increase in re-
ported awareness and knowledge of the benefits of folic acid and reported knowledge
about the sources of folic acid.
During 1997, a year-long community information campaign targeted an estimated
22,500 women of childbearing age in a four-county area of southwestern Virginia. The
campaign included television and radio public service announcements (PSAs), a news
conference, newspaper advertisements, and billboards. The television and radio PSAs
used actors from the local theater and local broadcasting students. Printed materials
included brochures, posters, information cards, food labels, flyers, banners, and dis-
play boards. Focus groups and readability tests were conducted to help develop print
materials. A local grocery store chain helped promote the use of folate-dense foods,
folic acid vitamin supplements, fortified cereals, and multivitamin supplements by
having volunteers specially label specific foods and hand out educational materials.
Volunteers also distributed green ribbons in the communities to promote folic acid
awareness. Local school board members and teachers developed a folic acid teaching
packet for use in health education and biology classes for students in grades 5–12 and
college-level nursing programs.
The campaign activities and results were evaluated using precampaign and post-
campaign random sample telephone surveys to assess folic acid awareness and
knowledge. The precampaign survey, conducted during January 1997, included
412 women aged 18–45 years chosen by a systematic random sample of listed tele-
phone numbers. The postcampaign telephone surveys were conducted during Janu-
ary 1998 (n=419) and February 1999 (n=278), using identical survey methods and an
additional question about the source of folic acid information.
Based on responses to the question “Have you heard about the benefits of folic
acid?”, reported awareness increased significantly, from 31% in 1997 (precampaign)
to 54% in 1998 (postcampaign), and to 75% in 1999 (sustainability survey) (p<0.05,
chi-square test) (Table 1). Among women who reported hearing about the benefits of
folic acid, the proportion who correctly answered that one benefit of folic acid was to
help prevent certain birth defects increased from 77% in 1997 to 81% in 1998 and to
88% in 1999. Among women who reported in the postcampaign survey that they had
heard about folic acid, knowledge about ways to increase consumption increased
from 55% in 1997 to 73% in 1999, but correct knowledge about the best time to take
folic acid (before or during pregnancy) did not increase. Women who had heard of
folic acid cited television and health-care providers as the two leading sources of in-
formation.
914 MMWR October 15, 1999

Reported by: K Broome, MPH, Region I Perinatal Coordinating Council of Abingdon, Virginia.Div of Birth Defects, Child Development, and Disability and Health, National Center for Envi-ronmental Health, CDC.
Editorial Note: National surveys indicate that awareness of folic acid among
reproductive-aged women increased from 52% in 1995 to 68% in 1998, although in-
creases in use of folic acid-containing vitamins were modest, from 28% to 32% (3 ).
Increasing the number of women who consume 400 µg of folic acid per day depends
on the success of national and local health communication campaigns. The campaign
described in this report demonstrated that with limited resources, community volun-
teers and campaign staff were able to use qualitative formative research methods to
develop health communication materials, enlist the assistance of private- and public-
sector community partners, and survey women about folic acid knowledge and
awareness in this community.
The findings of the surveys in southwestern Virginia are subject to at least four
limitations. First, the changes in awareness and knowledge might have resulted from
other national media efforts rather than the local campaign. Second, because the sur-
vey did not collect information about characteristics such as age, parity, or pregnancy
intention, different awareness and knowledge levels among these subsets of
reproductive-aged women cannot be assessed. For example, awareness and knowl-
edge could have increased more among women who were planning a pregnancy than
among women not planning a pregnancy. Third, the women in the counties surveyed
may not be representative of reproductive-aged women in this age group in this re-
gion of Virginia or in the United States. Finally, an increase in knowledge is an inter-
mediate outcome and may not be related directly to an increase in intake of folic acid
or a decrease in the occurrence of NTDs. For example, women knowledgeable about
the benefits of folic acid may have other barriers to changing their behavior to in-
crease consumption. To overcome these barriers, women need both knowledge and
resources to make and sustain behavior change, particularly for an active modification
such as daily vitamin consumption (4 ).
Another method to facilitate increased folic acid intake without relying solely on
active behavior change is through food fortification. Since January 1998, “enriched”
cereal grain products must be fortified with folic acid at a level of 140 µg per 100 g of
cereal grain product (5 ). Fortification will increase folic acid consumption among
reproductive-aged women, but many women will still consume <400 µg of synthetic
folic acid daily (6 ). In 1998, the Institute of Medicine recommended that women capa-
ble of becoming pregnant take 400 µg of synthetic folic acid daily from fortified foods
and/or supplements in addition to consuming food folate from a varied diet (7 ).
Women are advised to consume foods fortified with folic acid (e.g., breakfast cereals,
enriched breads, and pastas) in addition to a balanced diet including folate-dense
foods, such as leafy green vegetables, orange juice, and beans. Use of supplements
containing folic acid, even though it requires a behavior change, remains a convenient
way to assure consumption of 400 µg daily.
Despite the limitations of survey methods used in the study in southwestern Vir-
ginia, the relatively low cost and ease of implementation made such a survey feasible
in this community evaluation. Other more objective evaluation methodologies for fo-
lic acid interventions include measurements of blood folate levels and monitoring the
rates of NTD-affected pregnancies. Preintervention and postintervention blood folate
Vol. 48 / No. 40 MMWR 915
Folic Acid Campaign — Continued

Fo
lic A
cid
Cam
pa
ign
— C
on
tinu
ed
916
MM
WR
Octo
ber 1
5, 1
999
TABLE 1. Assessment of knowledge related to folic acid among childbearing-aged women before and after an educationcampaign and to assess sustainability of knowledge — southwestern Virginia, 1997, 1998, and 1999
Question
1997 (precampaign) 1998 (postcampaign) 1999 (sustainability)
No.respondents
Responses No.respondents
Responses No.respondents
Responses
No. (%) (95% CI*) No. (%) (95% CI) No. (%) (95% CI)
1. Have you heard aboutthe benefits of folic acid?Answer: Yes 412 128 (31) (27%–36%) 419 226 (54) (49%–59%) 278 207 (75) (69%–80%)†
2. What is one benefit offolic acid?§
Answer: It helps prevent certain birth defects 128 98 (77) (68%–84%) 226 184 (81) (76%–86%) 207 183 (88) (83%–92%)†
3. When is the best time totake more folic acid?¶
Answer: Before you become pregnant 98 85 (87) (78%–93%) 184 150 (82) (75%–87%) 183 162 (89) (83%–93%)
4. What are ways to take inmore folic acid?¶,**Answer: Eat more foods such as broccoli, legumes, cereal and orange juice 98 83 (85) (76%–91%) 184 157 (85) (79%–91%) 183 167 (91) (86%–95%)†
Answer: Take a daily multivitamin with folic acid 98 63 (64) (54%–74%) 184 135 (73) (66%–80%) 183 145 (79) (73%–85%)†
Answer: Use both folate-rich foods and multivitamins 98 54 (55) (45%–65%) 184 115 (63) (55%–70%) 183 134 (73) (66%–80%)†
5. Where did you hearabout folic acid?**,††
Television — 184 108 (59) (51%–66%) 206 89 (43) (36%–50%)§§
Health-care provider — 184 52 (28) (22%–35%) 206 56 (27) (21%–34%) Other¶¶ — 184 36 (20) (14%–26%) 206 20 (10) ( 6%–15%)§§
Posters or brochures — 184 29 (16) (11%–22%) 206 10 ( 5) ( 2%– 9%)§§
Health department — 184 21 (11) ( 7%–17%) 206 9 ( 4) ( 2%– 8%)§§
School — 184 15 ( 8) ( 5%–13%) 206 7 ( 3) ( 1%– 7%)§§
Friend or relative — 184 13 ( 7) ( 4%–12%) 206 10 ( 5) ( 2%– 9%) Radio — 184 6 ( 3) ( 1%– 7%) 206 2 ( 1) ( 0%– 4%) Billboard — 184 5 ( 3) ( 1%– 6%) 206 3 ( 2) ( 1%– 4%)
*Confidence interval.†Significant change from 1997 to 1999 (p<0.05).§Asked only of those who answered yes to question 1.¶Asked only of those who chose the correct answer to question 2.
**The sum of the percentages does not equal 100% because of multiple responses in the survey.††Not asked in 1997 survey.§§Significant change from 1998 to 1999 (p<0.05).¶¶Specified as, but not limited to, newspapers and magazines.

levels can be used to assess the effectiveness of interventions at the community level
but require substantial resources to obtain and measure the blood samples. On the
national level, blood folate measurements collected in the National Health and Nutri-
tion Examination Survey can be used to evaluate the impact of interventions. Accurate
NTD monitoring requires the inclusion of affected pregnancies that were prenatally
detected to assess the impact of consuming folic acid independent from that of the
increasing use of prenatal diagnosis. The large population size necessary to detect a
change in NTD rates limits the use of NTD rate monitoring to evaluate local cam-
paigns, although NTD data from several states or communities can be combined to
assess the impact of interventions in larger populations.
NTDs occur very early in pregnancy. Because more than 50% of pregnancies in the
United States are mistimed or unplanned (8 ), it is especially important to increase
women’s knowledge about the importance of consuming folic acid before pregnancy.
In 1999, CDC, the National March of Dimes Birth Defects Foundation, and the National
Council on Folic Acid began a national education campaign with materials targeted to
women who are thinking about pregnancy (“Before You Know It”) and to women who
are able to get pregnant even though they are not planning on it in the near future
(“Ready, Not”). The campaign includes a series of PSAs and other outreach activities
to women of reproductive age and to health-care providers.
More experience is needed in implementing and evaluating folic acid campaigns to
determine which interventions are most effective. States and communities are en-
couraged to share their experiences and lessons learned with other states and com-
munities that are planning interventions. The folic acid education campaign in Virginia
is one of several examples included in a resource guide for folic acid campaigns (9 ).
The resource guide and other educational materials on folic acid are available by con-
tacting CDC by e-mail, [email protected], or by telephone, (888) 232-6789.
References1. Virginia Department of Health, Center for Health Statistics. Virginia vital statistics—1991 annual
report. Richmond, Virginia: Virginia Department of Health, 1992.
2. CDC. Recommendations for the use of folic acid to reduce the number of cases of spina bifida
and other neural tube defects. MMWR 1992;41(no. RR-14).
3. CDC. Use of folic acid-containing supplements among women of childbearing age—United
States, 1997. MMWR 1998;47:131–4.
4. Glanz K, Lewis FM, Rimer BK. Health behavior and health education. 2nd ed. San Francisco,
California: Jossey-Bass, Inc, 1997:157.
5. Food and Drug Administration. Food standards: amendment of standards of identity for en-
riched grain products to require addition of folic acid. Federal Register 1996;61:8781–97.
6. Lewis CJ, Crane NT, Wilson DB, Yetley EA. Estimated folate intakes: data updated to reflect
food fortification, increased bioavailability, and dietary supplement use. Am J Clin Nutrition
1999;70:198–207.
7. Institute of Medicine, National Academy of Sciences. Dietary reference intakes for thiamin,
riboflavin, niacin, vitamin B6, folate, vitamin B12, pantothenic acid, biotin, and holine. Wash-
ington, DC: National Academy Press, 1998:8-1.
8. Grimes DA. Unplanned pregnancies in the United States. Obstet Gynecol 1986;67:438–42.
9. CDC. Preventing neural tube birth defects: a prevention model and resource guide. Atlanta,
Georgia: US Department of Health and Human Services, CDC, National Center for Environ-
mental Health, Division of Birth Defects and Pediatric Genetics, 1998.
Folic Acid Campaign — Continued
Vol. 48 / No. 40 MMWR 917
Folic Acid Campaign — Continued

Self-Reported Asthma in Adults and Proxy-Reported Asthma in Children —Washington, 1997–1998
Asthma — ContinuedIncreased awareness of asthma as a public health problem reflects recent increases
in asthma prevalence, asthma-related visits to hospital emergency departments, and
asthma-related mortality (1 ). To assess the prevalence of asthma in Washington, the
Washington State Department of Health added survey items on asthma to its 1997 and
1998 Behavioral Risk Factor Surveillance System (BRFSS) survey. This report summa-
rizes the results of those surveys, which indicate that persons with asthma reported
significantly lower health status than other respondents and that a substantial propor-
tion of households with children reported having a child with asthma.
BRFSS is a state-based, random-digit–dialed survey of the noninstitutionalized
population aged ≥18 years; the survey collects information about modifiable risk fac-
tors for chronic diseases and other leading causes of death. CDC and state and territo-
rial departments of health use the system to measure achievement toward both
national and state health objectives.
BRFSS respondents were asked “Has a doctor or other health care professional
ever told you that you have asthma?” and “How old were you the first time this hap-
pened?” These questions were followed by “Has a doctor ever said that one of the
children currently living in your household has asthma?” and, if yes, “How old is this
child (are these children)?”
The number of respondents was 3604 both in 1997 and 1998. To improve the preci-
sion of estimates, data from the two survey years were combined. Except for the esti-
mated number of children with asthma in the population, prevalence estimates and
95% confidence intervals (CIs) were calculated using weighted data to adjust for sam-
ple design. The number of children with asthma was stratified by age and its 95% CI
was calculated on pooled unweighted data.
Among adults, 10.8% reported having had asthma at some point in their life (i.e.,
ever asthma), and the median age at onset was 19 years (range: 1–81 years). Persons
with asthma reported significantly lower health status than other respondents: 18.8%
(95% CI=15.8%–21.8%) reported fair or poor health, compared with 9.9% (95%
CI=9.1%–10.7%) of those not reporting asthma. The number of adults with asthma in
Washington was an estimated 450,000 (95% CI=413,000–479,000).
At least one child aged ≤17 years was reported to reside in 39.4% of households. Of
those households with children, 15.9% (95% CI=14.2%–17.6%) had a child with
asthma. Overall, 10.1% of children ever had asthma: 7.8% of those aged <5 years, 9.5%
of those aged 5–12 years, and 12.8% of those aged 13–17 years. The number of chil-
dren with asthma was an estimated 151,000 (95% CI=139,000–165,000).
For children with asthma, results varied by socioeconomic status, family history,
and whether the respondent was a current smoker. Compared with households with
an annual income >$20,000, poorer households had higher asthma prevalence, with a
rate ratio of 1.9 among children aged <5 years. When the respondent self-reported
asthma, the prevalence of asthma in household children was 34% (p<0.001), com-
pared with 14% when the respondent did not report asthma. In those households in
which the respondent reported being a current smoker, 20.0% contained a child with
asthma compared with 14.9% (p=0.04) of other households.Reported by: SC Macdonald, PhD, LS Bensley, PhD, J VanEenwyk, PhD, Acting State Epidemi-ologist, Office of Epidemiology; K Wynkoop Simmons, PhD, Washington State Dept of Health.
918 MMWR October 15, 1999
Air Pollution and Respiratory Health Br, Div of Environmental Hazards and Health Effects,National Center for Environmental Health, CDC.
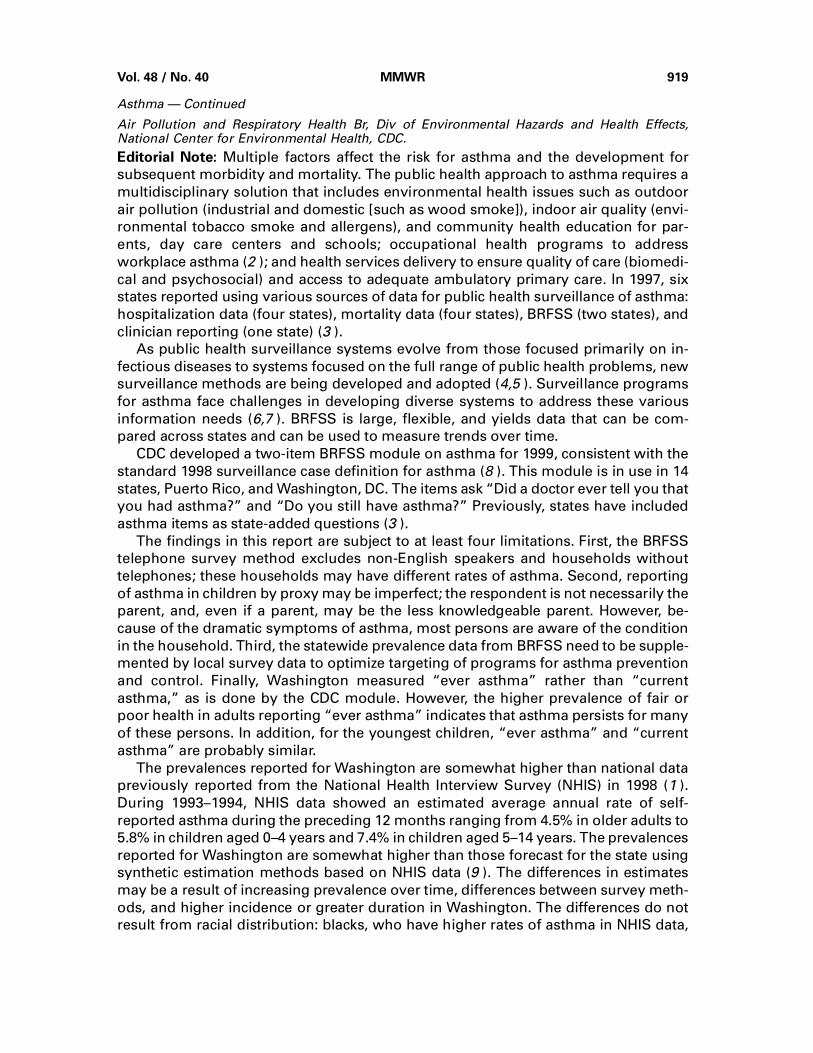
Editorial Note: Multiple factors affect the risk for asthma and the development for
subsequent morbidity and mortality. The public health approach to asthma requires a
multidisciplinary solution that includes environmental health issues such as outdoor
air pollution (industrial and domestic [such as wood smoke]), indoor air quality (envi-
ronmental tobacco smoke and allergens), and community health education for par-
ents, day care centers and schools; occupational health programs to address
workplace asthma (2 ); and health services delivery to ensure quality of care (biomedi-
cal and psychosocial) and access to adequate ambulatory primary care. In 1997, six
states reported using various sources of data for public health surveillance of asthma:
hospitalization data (four states), mortality data (four states), BRFSS (two states), and
clinician reporting (one state) (3 ).
As public health surveillance systems evolve from those focused primarily on in-
fectious diseases to systems focused on the full range of public health problems, new
surveillance methods are being developed and adopted (4,5 ). Surveillance programs
for asthma face challenges in developing diverse systems to address these various
information needs (6,7 ). BRFSS is large, flexible, and yields data that can be com-
pared across states and can be used to measure trends over time.
CDC developed a two-item BRFSS module on asthma for 1999, consistent with the
standard 1998 surveillance case definition for asthma (8 ). This module is in use in 14
states, Puerto Rico, and Washington, DC. The items ask “Did a doctor ever tell you that
you had asthma?” and “Do you still have asthma?” Previously, states have included
asthma items as state-added questions (3 ).
The findings in this report are subject to at least four limitations. First, the BRFSS
telephone survey method excludes non-English speakers and households without
telephones; these households may have different rates of asthma. Second, reporting
of asthma in children by proxy may be imperfect; the respondent is not necessarily the
parent, and, even if a parent, may be the less knowledgeable parent. However, be-
cause of the dramatic symptoms of asthma, most persons are aware of the condition
in the household. Third, the statewide prevalence data from BRFSS need to be supple-
mented by local survey data to optimize targeting of programs for asthma prevention
and control. Finally, Washington measured “ever asthma” rather than “current
asthma,” as is done by the CDC module. However, the higher prevalence of fair or
poor health in adults reporting “ever asthma” indicates that asthma persists for many
of these persons. In addition, for the youngest children, “ever asthma” and “current
asthma” are probably similar.
The prevalences reported for Washington are somewhat higher than national data
previously reported from the National Health Interview Survey (NHIS) in 1998 (1 ).
During 1993–1994, NHIS data showed an estimated average annual rate of self-
reported asthma during the preceding 12 months ranging from 4.5% in older adults to
5.8% in children aged 0–4 years and 7.4% in children aged 5–14 years. The prevalences
reported for Washington are somewhat higher than those forecast for the state using
synthetic estimation methods based on NHIS data (9 ). The differences in estimates
may be a result of increasing prevalence over time, differences between survey meth-
ods, and higher incidence or greater duration in Washington. The differences do not
result from racial distribution: blacks, who have higher rates of asthma in NHIS data,
Vol. 48 / No. 40 MMWR 919
Asthma — Continued

are underrepresented in Washington, accounting for 3.1% of the population in 1990,
compared with 12% nationally.
Washington has adopted the CDC module for its 1999 BRFSS and has modified its
child asthma items to ask about “current asthma.” The module is available on the
World-Wide Web at http://www.doh.wa.gov/EHSPHL/Epidemiology/NICE.* Use of
these types of surveys to ascertain the prevalence of asthma is an important compo-
nent in the public health approach to asthma. To facilitate pooling and comparing data
across states and regions, states should consider using uniform or comparable ques-
tions.
References1. CDC. Surveillance for asthma—United States, 1960–1995. MMWR 1998;47(no. SS-1).
2. CDC. Surveillance of work-related asthma in selected U.S. states using surveillance guidelines
for state health departments—California, Massachusetts, Michigan, and New Jersey, 1993–95.
MMWR 1999;48(no. SS-3):1–20.
3. CDC. Monitoring environmental disease—United States, 1997. MMWR 1998;47:522–5.
4. Berkelman RL, Stroup DF, Buehler JW. Public health surveillance. In: Detels R, Holland WW,
McEwan J, Omenn GS, eds. Oxford textbook of public health. 3rd ed. New York, New York:
Oxford University Press, 1997:735–50.
5. Meriwether RA. Blueprint for a national public health surveillance system for the 21st century.
J Public Health Management Practice 1996;2:16–23.
6. Thacker SB, Stroup DF, Parrish RG, Anderson HA. Surveillance in environmental public health:
issues, systems, and sources. Am J Public Health 1996;86:633–8.
7. Macdonald SC, Pertowski CA, Jackson RJ. Environmental public health surveillance. J Public
Health Management Practice 1996;2:45–9.
8. Council of State and Territorial Epidemiologists. Asthma surveillance case definition: position
statement adopted at 1998 CSTE annual meeting, Des Moines, Iowa.
9. CDC. Forecasted state-specific estimates of self-reported asthma prevalence—United States,
1998. MMWR 1998;47:1022–5.
Asthma — Continued
*References to sites of non-CDC organizations on the Internet are provided as a service toMMWR readers and do not constitute or imply endorsement of these organizations or theirprograms by CDC or the U.S. Department of Health and Human Services. CDC is not respon-sible for the content of pages found at these sites.
920 MMWR October 15, 1999
Asthma — Continued

FIGURE I. Selected notifiable disease reports, comparison of provisional 4-week totalsending October 9, 1999, with historical data — United States
Anthrax - HIV infection, pediatric*§ 109Brucellosis* 38 Plague 5Cholera 5 Poliomyelitis, paralytic -Congenital rubella syndrome 4 Psittacosis* 16Cyclosporiasis* 47 Rabies, human -Diphtheria 4 Rocky Mountain spotted fever (RMSF) 422Encephalitis: California* 35 Streptococcal disease, invasive Group A 1,642
eastern equine* 5 Streptococcal toxic-shock syndrome* 30St. Louis* 2 Syphilis, congenital¶ 146western equine* - Tetanus 30
Ehrlichiosis human granulocytic (HGE)* 117 Toxic-shock syndrome 91human monocytic (HME)* 33 Trichinosis 8
Hansen Disease* 71 Typhoid fever 246Hantavirus pulmonary syndrome*† 16 Yellow fever -Hemolytic uremic syndrome, post-diarrheal* 73
Cum. 1999Cum. 1999
TABLE I. Summary — provisional cases of selected notifiable diseases,United States, cumulative, week ending October 9, 1999 (40th Week)
-: no reported cases *Not notifiable in all states. † Updated weekly from reports to the Division of Viral and Rickettsial Diseases, National Center for Infectious Diseases (NCID). § Updated monthly from reports to the Division of HIV/AIDS Prevention–Surveillance and Epidemiology, National Center for
HIV, STD, and TB Prevention (NCHSTP), last update September 26, 1999. ¶ Updated from reports to the Division of STD Prevention, NCHSTP.
DISEASE DECREASE INCREASECASES CURRENT
4 WEEKS
Ratio (Log Scale)*
AAAAAAAAAAAA
AAAAAA
Beyond Historical Limits
4210.50.25
1,018
381
130
59
11
102
19
322
3
Hepatitis A
Hepatitis B
Hepatitis, C/Non-A, Non-B
Legionellosis
Measles, Total
Mumps
Pertussis
Rubella
Meningococcal Infections
*Ratio of current 4-week total to mean of 15 4-week totals (from previous, comparable, andsubsequent 4-week periods for the past 5 years). The point where the hatched area begins isbased on the mean and two standard deviations of these 4-week totals.
Vol. 48 / No. 40 MMWR 921

TABLE II. Provisional cases of selected notifiable diseases, United States,weeks ending October 9, 1999, and October 10, 1998 (40th Week)
UNITED STATES 34,088 35,254 437,542 450,964 1,698 3,055 2,476 2,312 1,562 1,830
NEW ENGLAND 1,698 1,354 15,377 15,780 112 131 257 278 229 235Maine 54 24 738 757 21 28 31 33 - -N.H. 36 25 737 764 15 14 26 40 27 42Vt. 13 17 363 324 32 21 26 18 14 16Mass. 1,116 684 7,069 6,460 42 61 149 128 115 133R.I. 77 98 1,774 1,756 2 7 25 11 6 1Conn. 402 506 4,696 5,719 - - U 48 67 43
MID. ATLANTIC 8,684 9,591 49,741 46,970 262 467 209 253 60 81Upstate N.Y. 952 1,103 N N 121 279 160 184 - -N.Y. City 4,588 5,419 21,963 20,322 109 167 7 11 15 12N.J. 1,619 1,753 7,929 9,026 22 21 42 58 32 48Pa. 1,525 1,316 19,849 17,622 10 N N N 13 21
E.N. CENTRAL 2,280 2,565 62,199 76,279 389 609 518 370 384 308Ohio 345 549 18,054 20,373 45 59 169 99 151 59Ind. 258 412 7,898 8,470 33 50 74 81 45 42Ill. 1,108 986 20,939 20,741 17 70 178 99 81 71Mich. 456 466 15,308 16,069 41 33 97 91 65 61Wis. 113 152 U 10,626 253 397 N N 42 75
W.N. CENTRAL 770 661 25,421 26,704 178 240 502 384 277 351Minn. 138 135 5,396 5,405 67 79 200 167 142 191Iowa 69 58 3,104 3,411 51 60 100 80 57 50Mo. 370 310 8,595 9,640 23 20 39 38 53 54N. Dak. 6 4 325 776 16 27 16 10 1 15S. Dak. 14 13 1,174 1,184 6 19 38 22 13 31Nebr. 60 60 2,601 2,074 14 30 88 39 - -Kans. 113 81 4,226 4,214 1 5 21 28 11 10
S. ATLANTIC 9,423 9,157 92,123 86,787 301 249 260 187 139 148Del. 129 112 1,968 1,974 - 3 6 - 3 2Md. 1,113 1,300 7,844 5,736 13 17 23 34 2 14D.C. 412 690 N N 8 7 - 1 U UVa. 608 687 10,637 10,847 21 19 62 N 48 48W. Va. 53 68 1,204 1,856 3 1 9 8 6 8N.C. 629 637 17,403 16,876 15 N 55 45 46 44S.C. 797 598 9,494 13,505 - - 19 10 14 8Ga. 1,382 979 21,374 17,983 115 83 27 61 - -Fla. 4,300 4,086 22,199 18,010 126 119 59 28 20 24
E.S. CENTRAL 1,536 1,440 35,498 31,267 24 20 100 100 53 55Ky. 214 221 5,796 4,859 6 8 31 31 - -Tenn. 588 519 10,810 10,403 6 7 43 44 33 35Ala. 405 395 10,007 7,723 10 N 21 20 16 18Miss. 329 305 8,885 8,282 2 5 5 5 4 2
W.S. CENTRAL 3,524 4,187 65,019 68,721 65 862 74 80 81 87Ark. 132 159 4,690 3,021 1 6 11 9 8 10La. 663 705 10,879 11,243 22 14 9 4 11 6Okla. 101 238 5,853 7,687 9 N 20 13 12 6Tex. 2,628 3,085 43,597 46,770 33 842 34 54 50 65
MOUNTAIN 1,343 1,230 24,106 25,056 82 116 233 299 94 211Mont. 8 23 1,133 1,009 10 10 17 15 - 5Idaho 19 19 1,309 1,533 7 17 35 35 8 23Wyo. 10 1 600 530 1 2 14 52 5 55Colo. 235 230 4,784 6,193 11 16 87 64 40 50N. Mex. 74 178 2,943 2,668 37 44 9 17 5 16Ariz. 697 501 9,238 8,896 9 18 25 41 16 26Utah 116 101 1,641 1,653 N N 32 61 18 21Nev. 184 177 2,458 2,574 7 9 14 14 2 15
PACIFIC 4,830 5,069 68,058 73,400 285 361 323 361 245 354Wash. 285 331 9,097 8,599 N N 131 78 104 104Oreg. 151 138 4,794 4,230 86 62 64 94 61 90Calif. 4,319 4,452 50,531 57,150 199 296 119 185 71 147Alaska 13 17 1,463 1,461 - - 1 4 - -Hawaii 62 131 2,173 1,960 - 3 8 - 9 13
Guam 5 - 226 307 - - N N U UP.R. 1,013 1,244 U U - N 5 5 U UV.I. 25 24 U U U U U U U UAmer. Samoa - - U U U U U U U UC.N.M.I. - - U U U U U U U U
N: Not notifiable U: Unavailable -: no reported cases C.N.M.I.: Commonwealth of Northern Mariana Islands
*Individual cases may be reported through both the National Electronic Telecommunications System for Surveillance (NETSS) and thePublic Health Laboratory Information System (PHLIS).
†Updated monthly from reports to the Division of HIV/AIDS Prevention–Surveillance and Epidemiology, National Center for HIV, STD,and TB Prevention, last update September 26, 1999.
Reporting Area
AIDS Chlamydia Cryptosporidiosis
Escherichia
coli O157:H7*
NETSS PHLIS
Cum.
1999†
Cum.
1998
Cum.
1999
Cum.
1998
Cum.
1999
Cum.
1998
Cum.
1999
Cum.
1998
Cum.
1999
Cum.
1998
922 MMWR October 15, 1999

TABLE II. (Cont’d.) Provisional cases of selected notifiable diseases, United States,weeks ending October 9, 1999, and October 10, 1998 (40th Week)
UNITED STATES 240,425 268,683 2,562 2,574 656 1,006 8,494 12,901
NEW ENGLAND 4,650 4,667 58 53 55 64 2,946 4,062Maine 42 52 2 - 4 1 34 68N.H. 87 71 - - 6 4 11 35Vt. 37 32 5 4 12 5 18 11Mass. 1,954 1,687 48 46 16 30 927 643R.I. 457 290 3 3 7 15 350 424Conn. 2,073 2,535 - - 10 9 1,606 2,881
MID. ATLANTIC 29,061 29,055 107 172 128 252 4,144 7,002Upstate N.Y. 5,080 5,438 72 86 48 77 3,011 3,317N.Y. City 9,463 9,161 - - 9 32 29 195N.J. 4,988 6,077 - U 13 15 390 1,514Pa. 9,530 8,379 35 86 58 128 714 1,976
E.N. CENTRAL 41,608 52,670 1,290 555 182 332 99 667Ohio 10,823 13,187 3 7 59 102 64 35Ind. 4,339 4,981 1 5 31 58 19 31Ill. 15,724 17,258 36 37 10 45 10 13Mich. 10,722 12,419 659 377 53 68 1 12Wis. U 4,825 591 129 29 59 5 576
W.N. CENTRAL 10,467 13,151 149 34 38 56 173 186Minn. 2,072 2,054 7 9 6 6 115 141Iowa 830 1,149 - 8 11 9 18 23Mo. 4,448 6,879 131 12 14 14 17 11N. Dak. 31 63 - - 1 - 1 -S. Dak. 132 183 - - 2 3 - -Nebr. 1,128 856 5 3 4 17 10 3Kans. 1,826 1,967 6 2 - 7 12 8
S. ATLANTIC 68,883 72,323 175 87 104 113 875 743Del. 1,229 1,141 1 - 10 11 25 57Md. 6,299 6,949 36 10 23 28 630 539D.C. 2,969 3,400 1 - 3 6 3 4Va. 7,074 7,228 10 11 26 16 95 55W. Va. 363 682 17 6 N N 15 10N.C. 15,361 14,756 33 19 13 11 63 48S.C. 5,545 8,579 22 5 7 10 5 4Ga. 14,359 15,374 1 9 1 8 - 5Fla. 15,684 14,214 54 27 21 23 39 21
E.S. CENTRAL 28,557 30,170 214 241 35 54 69 91Ky. 2,631 2,804 15 18 18 26 8 21Tenn. 8,749 9,098 81 144 14 16 30 41Ala. 9,044 9,989 2 4 3 5 18 16Miss. 8,133 8,279 116 75 - 7 13 13
W.S. CENTRAL 36,592 42,171 178 423 6 27 28 19Ark. 2,452 3,122 11 15 - 1 4 6La. 8,653 9,554 102 68 2 2 - 4Okla. 2,877 4,191 14 12 3 12 4 2Tex. 22,610 25,304 51 328 1 12 20 7
MOUNTAIN 7,016 6,959 118 315 40 59 16 12Mont. 34 32 5 7 - 2 - -Idaho 65 138 6 86 2 2 5 3Wyo. 23 26 37 76 - 1 3 1Colo. 1,786 1,604 19 23 11 14 - -N. Mex. 597 648 7 77 1 2 1 4Ariz. 3,330 3,197 30 8 5 14 - -Utah 163 182 6 19 15 18 5 -Nev. 1,018 1,132 8 19 6 6 2 4
PACIFIC 13,591 17,517 273 694 68 49 144 119Wash. 1,570 1,507 13 19 11 9 7 7Oreg. 692 618 17 16 N N 11 17Calif. 10,782 14,746 243 605 56 38 126 94Alaska 238 247 - - 1 1 - 1Hawaii 309 399 - 54 - 1 N N
Guam 32 50 - 1 - 2 - 1P.R. 215 294 - - - - N NV.I. U U U U U U U UAmer. Samoa U U U U U U U UC.N.M.I. U U U U U U U U
N: Not notifiable U: Unavailable -: no reported cases
Reporting Area
Gonorrhea
Hepatitis
C/NA,NB Legionellosis
Lyme
Disease
Cum.
1999
Cum.
1998
Cum.
1999
Cum.
1998
Cum.
1999
Cum.
1998
Cum.
1999
Cum.
1998
Vol. 48 / No. 40 MMWR 923

TABLE II. (Cont’d.) Provisional cases of selected notifiable diseases, United States,weeks ending October 9, 1999, and October 10, 1998 (40th Week)
UNITED STATES 979 1,146 4,586 5,920 27,463 32,004 21,513 27,144
NEW ENGLAND 49 47 694 1,187 1,326 1,936 1,382 1,845Maine 3 3 132 197 114 141 83 52N.H. 2 5 44 70 112 152 118 193Vt. 4 1 83 53 77 103 71 81Mass. 15 16 164 414 937 1,076 718 1,096R.I. 4 4 74 77 86 107 52 34Conn. 21 18 197 376 U 357 340 389
MID. ATLANTIC 220 347 858 1,274 3,121 5,223 2,905 4,860Upstate N.Y. 56 75 642 893 1,028 1,274 860 1,144N.Y. City 99 198 U U 1,059 1,575 803 1,286N.J. 44 48 143 168 508 1,112 535 1,109Pa. 21 26 73 213 526 1,262 707 1,321
E.N. CENTRAL 92 123 131 110 4,086 5,067 2,698 3,845Ohio 18 14 31 51 998 1,206 830 939Ind. 18 10 12 9 404 551 322 439Ill. 20 50 9 N 1,312 1,570 399 1,205Mich. 31 40 76 31 776 923 747 836Wis. 5 9 3 19 596 817 400 426
W.N. CENTRAL 61 75 579 593 1,785 1,823 1,704 1,892Minn. 33 42 88 96 525 429 563 517Iowa 12 7 135 129 220 310 158 247Mo. 12 14 12 34 536 503 731 695N. Dak. - 2 125 119 41 48 4 65S. Dak. - - 129 134 75 93 58 101Nebr. - 1 3 7 169 152 - 32Kans. 4 9 87 74 219 288 190 235
S. ATLANTIC 278 233 1,677 1,950 6,537 6,295 4,153 4,815Del. 1 3 34 38 107 66 120 103Md. 78 66 322 381 699 732 725 711D.C. 16 15 - - 62 62 U UVa. 55 48 437 467 1,044 870 789 720W. Va. 2 2 90 63 126 120 126 123N.C. 24 23 345 484 949 902 1,051 1,098S.C. 15 5 119 117 530 457 349 428Ga. 21 32 178 247 1,034 1,236 651 1,191Fla. 66 39 152 153 1,986 1,850 342 441
E.S. CENTRAL 21 25 218 234 1,464 1,757 814 1,280Ky. 7 5 32 27 319 294 - 124Tenn. 7 13 78 122 324 458 429 564Ala. 6 5 108 83 471 538 308 475Miss. 1 2 - 2 350 467 77 117
W.S. CENTRAL 15 31 85 26 2,480 3,412 2,557 2,474Ark. 2 1 14 26 492 440 120 298La. 10 12 - - 334 444 438 607Okla. 2 3 71 N 344 368 212 165Tex. 1 15 - - 1,310 2,160 1,787 1,404
MOUNTAIN 39 54 165 213 2,385 2,021 1,563 1,716Mont. 4 1 52 46 49 67 1 40Idaho 3 7 - N 82 93 56 76Wyo. 1 - 40 55 50 57 22 50Colo. 14 16 1 32 594 454 537 433N. Mex. 2 12 8 5 281 249 208 217Ariz. 9 8 52 43 758 633 627 594Utah 3 1 7 26 419 281 59 122Nev. 3 9 5 6 152 187 53 184
PACIFIC 204 211 179 333 4,279 4,470 3,737 4,417Wash. 22 17 - - 515 394 617 531Oreg. 18 14 1 7 360 243 419 267Calif. 156 174 171 303 3,082 3,576 2,457 3,360Alaska 1 2 7 23 44 50 8 30Hawaii 7 4 - - 278 207 236 229
Guam - 2 - - 20 29 U UP.R. - - 47 40 255 578 U UV.I. U U U U U U U UAmer. Samoa U U U U U U U UC.N.M.I. U U U U U U U U
N: Not notifiable U: Unavailable -: no reported cases
*Individual cases may be reported through both the National Electronic Telecommunications System for Surveillance (NETSS) and thePublic Health Laboratory Information System (PHLIS).
Reporting Area
Malaria Rabies, Animal
Salmonellosis*
NETSS PHLIS
Cum.
1999
Cum.
1998
Cum.
1999
Cum.
1998
Cum.
1999
Cum.
1998
Cum.
1999
Cum.
1998
924 MMWR October 15, 1999

TABLE II. (Cont’d.) Provisional cases of selected notifiable diseases, United States,weeks ending October 9, 1999, and October 10, 1998 (40th Week)
UNITED STATES 11,467 15,979 5,469 9,046 4,848 5,503 10,886 12,629
NEW ENGLAND 538 357 386 314 44 62 309 338Maine 4 12 - - - 1 13 11N.H. 15 15 14 18 - 2 10 -Vt. 6 6 4 - 3 4 1 4Mass. 492 237 315 226 26 35 187 192R.I. 21 29 9 13 2 1 32 41Conn. U 58 44 57 13 19 66 90
MID. ATLANTIC 693 1,970 370 1,484 196 242 1,983 2,223Upstate N.Y. 231 457 45 157 24 33 245 282N.Y. City 220 600 82 542 67 55 1,069 1,094N.J. 170 593 121 555 44 77 396 476Pa. 72 320 122 230 61 77 273 371
E.N. CENTRAL 2,090 2,248 1,068 1,177 876 791 1,019 1,280Ohio 353 414 111 102 69 113 194 189Ind. 233 140 70 34 343 152 69 128Ill. 813 1,224 592 986 312 332 459 601Mich. 333 219 227 4 152 141 221 284Wis. 358 251 68 51 U 53 76 78
W.N. CENTRAL 915 834 568 494 95 106 345 349Minn. 200 257 194 288 9 6 122 114Iowa 43 58 23 40 9 1 37 28Mo. 560 102 312 79 60 81 134 133N. Dak. 2 7 - 3 - - 6 8S. Dak. 11 30 5 21 - 1 12 16Nebr. 62 334 - 19 7 4 15 11Kans. 37 46 34 44 10 13 19 39
S. ATLANTIC 1,910 3,325 373 1,025 1,562 2,008 2,275 2,227Del. 12 27 7 23 6 19 12 31Md. 128 167 44 59 290 540 206 242D.C. 45 23 U U 54 69 34 86Va. 105 162 43 74 121 120 203 222W. Va. 8 11 4 7 2 2 33 31N.C. 165 237 72 114 395 589 333 339S.C. 106 144 51 64 212 240 206 227Ga. 179 874 37 210 248 213 450 402Fla. 1,162 1,680 115 474 234 216 798 647
E.S. CENTRAL 896 745 444 550 895 956 700 894Ky. 211 100 - 45 81 81 148 131Tenn. 508 218 387 306 498 448 257 281Ala. 94 382 47 192 177 222 239 303Miss. 83 45 10 7 139 205 56 179
W.S. CENTRAL 1,659 3,077 1,644 980 762 829 1,231 1,837Ark. 71 162 23 53 57 90 135 105La. 118 239 83 217 200 334 U 150Okla. 419 327 128 86 145 70 100 139Tex. 1,051 2,349 1,410 624 360 335 996 1,443
MOUNTAIN 824 972 456 597 178 202 318 415Mont. 7 8 - 3 1 - 10 15Idaho 21 18 7 13 1 2 14 7Wyo. 3 3 1 1 - 1 3 4Colo. 148 162 80 120 2 10 U 50N. Mex. 101 233 59 132 9 22 48 49Ariz. 418 473 294 290 157 151 175 157Utah 51 37 9 28 2 3 31 45Nev. 75 38 6 10 6 13 37 88
PACIFIC 1,942 2,451 160 2,425 240 307 2,706 3,066Wash. 90 161 69 142 57 27 156 198Oreg. 70 115 67 110 8 4 82 109Calif. 1,754 2,137 - 2,137 171 272 2,293 2,578Alaska 2 4 - 2 1 1 43 40Hawaii 26 34 24 34 3 3 132 141
Guam 7 29 U U 1 1 - 72P.R. 62 46 U U 121 146 41 122V.I. U U U U U U U UAmer. Samoa U U U U U U U UC.N.M.I. U U U U U U U U
N: Not notifiable U: Unavailable -: no reported cases
*Individual cases may be reported through both the National Electronic Telecommunications System for Surveillance (NETSS) and thePublic Health Laboratory Information System (PHLIS).
†Cumulative reports of provisional tuberculosis cases for 1999 are unavailable (“U”) for some areas using the Tuberculosis InformationSystem (TIMS).
Reporting Area
Shigellosis* Syphilis
(Primary & Secondary) TuberculosisNETSS PHLIS
Cum.
1999
Cum.
1998
Cum.
1999
Cum.
1998
Cum.
1999
Cum.
1998
Cum.
1999†
Cum.
1998†
Vol. 48 / No. 40 MMWR 925

TABLE III. Provisional cases of selected notifiable diseases preventable by vaccination,United States, weeks ending October 9, 1999,
and October 10, 1998 (40th Week)
UNITED STATES 913 847 11,878 17,427 4,948 7,533 - 50 - 22 72 75
NEW ENGLAND 73 57 214 232 73 158 - 6 - 4 10 3Maine 5 2 8 16 1 2 - - - - - -N.H. 16 9 15 10 13 14 - - - 1 1 -Vt. 5 6 16 14 2 7 - - - - - 1Mass. 27 34 62 102 30 57 - 5 - 2 7 2R.I. 4 5 14 14 27 52 - - - - - -Conn. 16 1 99 76 - 26 - 1 - 1 2 -
MID. ATLANTIC 139 138 727 1,353 511 977 - - - 2 2 14Upstate N.Y. 68 47 212 278 152 188 - - - 2 2 2N.Y. City 31 37 209 472 157 341 - - - - - -N.J. 39 47 57 277 40 170 - - - - - 8Pa. 1 7 249 326 162 278 - - - - - 4
E.N. CENTRAL 140 145 2,221 2,779 507 1,136 - 1 - 1 2 15Ohio 50 44 538 256 77 63 - - - - - 1Ind. 20 36 95 124 36 87 - 1 - - 1 3Ill. 59 50 490 627 1 196 - - - - - -Mich. 11 8 1,072 1,605 388 369 - - - 1 1 10Wis. - 7 26 167 5 421 - - - - - 1
W.N. CENTRAL 79 75 619 1,159 242 318 - - - - - -Minn. 38 58 61 101 41 35 - - - - - -Iowa 9 2 117 378 33 48 - - - - - -Mo. 23 8 341 544 126 190 - - - - - -N. Dak. 1 - 2 3 - 4 - - - - - -S. Dak. 1 - 8 21 1 2 U - U - - -Nebr. 3 1 50 25 14 17 - - - - - -Kans. 4 6 40 87 27 22 U - U - - -
S. ATLANTIC 206 154 1,608 1,504 979 801 - 9 - 6 15 8Del. - - 2 3 1 3 - - - - - 1Md. 54 50 293 325 138 115 - - - - - 1D.C. 4 - 54 48 21 10 - - - - - -Va. 15 15 133 172 74 84 - 9 - 3 12 2W. Va. 6 5 31 6 22 8 - - - - - -N.C. 28 23 127 95 194 173 - - - 1 1 -S.C. 5 3 40 32 63 31 - - - - - -Ga. 55 33 383 466 136 127 - - - - - 2Fla. 39 25 545 357 330 250 - - - 2 2 2
E.S. CENTRAL 52 45 324 320 340 396 - 2 - - 2 2Ky. 6 7 55 26 33 38 - 2 - - 2 -Tenn. 28 26 142 186 170 220 - - - - - 1Ala. 15 10 45 57 68 62 - - - - - 1Miss. 3 2 82 51 69 76 - - - - - -
W.S. CENTRAL 43 44 2,255 3,075 684 1,676 - 5 - 4 9 -Ark. 2 - 44 72 36 88 - - - - - -La. 7 20 73 70 77 111 U - U - - -Okla. 30 22 379 466 103 71 - - - - - -Tex. 4 2 1,759 2,467 468 1,406 - 5 - 4 9 -
MOUNTAIN 92 94 1,052 2,648 471 670 - 3 - - 3 -Mont. 2 - 17 85 17 5 - - - - - -Idaho 1 - 35 208 25 32 - - - - - -Wyo. 1 1 7 33 12 7 - - - - - -Colo. 11 20 184 249 76 85 - - - - - -N. Mex. 18 5 41 119 148 263 - - - - - -Ariz. 49 46 615 1,607 126 149 - 1 - - 1 -Utah 7 3 39 160 27 60 - 2 - - 2 -Nev. 3 19 114 187 40 69 - - - - - -
PACIFIC 89 95 2,858 4,357 1,141 1,401 - 24 - 5 29 33Wash. 4 7 263 853 55 86 - - - - - 1Oreg. 35 37 209 337 74 148 - 9 - - 9 -Calif. 38 41 2,366 3,101 987 1,143 - 15 - 4 19 7Alaska 5 3 8 16 13 11 - - - - - 25Hawaii 7 7 12 50 12 13 - - - 1 1 -
Guam - - 2 1 2 2 U 1 U - 1 -P.R. 1 2 112 51 102 195 U - U - - -V.I. U U U U U U U U U U U UAmer. Samoa U U U U U U U U U U U UC.N.M.I. U U U U U U U U U U U U
N: Not notifiable U: Unavailable -: no reported cases
*For imported measles, cases include only those resulting from importation from other countries.†Of 170 cases among children aged <5 years, serotype was reported for 87 and of those, 23 were type b.
Reporting Area
H. influenzae,
invasive
Hepatitis (Viral), by type Measles (Rubeola)
A B Indigenous Imported* Total
Cum.
1999†
Cum.
1998
Cum.
1999
Cum.
1998
Cum.
1999
Cum.
1998 1999
Cum.
1999 1999
Cum.
1999
Cum.
1999
Cum.
1998
926 MMWR October 15, 1999

UNITED STATES 1,861 2,083 9 257 540 60 4,122 4,923 2 224 338
NEW ENGLAND 91 90 - 4 6 1 486 793 - 7 38Maine 5 5 - - - - - 5 - - -N.H. 12 11 - 1 - - 74 80 - - -Vt. 4 5 - 1 - 1 53 66 - - -Mass. 52 41 - 2 4 - 321 595 - 7 8R.I. 4 3 - - - - 24 9 - - 1Conn. 14 25 - - 2 - 14 38 - - 29
MID. ATLANTIC 167 218 - 28 176 3 684 493 - 22 146Upstate N.Y. 51 56 - 9 5 3 598 259 - 18 114N.Y. City 44 26 - 3 155 - 10 31 - - 18N.J. 39 51 - - 6 - 12 15 - 1 13Pa. 33 85 - 16 10 - 64 188 - 3 1
E.N. CENTRAL 321 320 2 32 67 11 315 624 - 2 -Ohio 117 115 2 13 25 10 166 220 - - -Ind. 53 56 - 4 6 - 54 113 - 1 -Ill. 87 84 - 8 9 - 49 78 - 1 -Mich. 40 38 - 7 25 1 42 56 - - -Wis. 24 27 - - 2 - 4 157 - - -
W.N. CENTRAL 206 182 - 11 28 17 289 407 - 123 32Minn. 45 29 - 1 12 15 154 215 - 5 -Iowa 37 33 - 5 10 2 41 60 - 29 -Mo. 80 67 - 2 3 - 47 30 - 2 2N. Dak. 3 5 - - 2 - 4 3 - - -S. Dak. 11 7 U - - U 5 8 U - -Nebr. 12 13 - - - - 3 15 - 87 -Kans. 18 28 U 3 1 U 35 76 U - 30
S. ATLANTIC 327 344 - 42 42 9 335 264 - 36 18Del. 7 2 - - - - 4 5 - - -Md. 46 25 - 3 - 1 95 51 - 1 1D.C. 1 1 - 2 - - - 1 - - -Va. 42 31 - 9 7 - 19 26 - - 1W. Va. 5 13 - - - - 2 1 - - -N.C. 36 48 - 8 10 - 83 89 - 35 13S.C. 41 49 - 4 6 - 15 25 - - -Ga. 52 79 - 4 1 1 34 21 - - -Fla. 97 96 - 12 18 7 83 45 - - 3
E.S. CENTRAL 118 161 - 11 13 1 69 102 - 1 2Ky. 25 28 - - - - 20 43 - - -Tenn. 43 58 - - 1 - 28 32 - - 2Ala. 29 41 - 8 7 1 18 23 - 1 -Miss. 21 34 - 3 5 - 3 4 - - -
W.S. CENTRAL 147 248 - 30 53 1 140 310 1 12 87Ark. 31 27 - - 11 - 17 60 1 5 -La. 34 50 U 3 6 U 3 7 U - -Okla. 26 34 - 1 - - 12 31 - - -Tex. 56 137 - 26 36 1 108 212 - 7 87
MOUNTAIN 120 115 4 23 35 17 508 865 1 17 5Mont. 2 4 - - - - 2 9 - - -Idaho 10 9 - 1 4 - 129 206 - - -Wyo. 4 5 - - 1 - 2 8 - - -Colo. 30 22 1 5 6 9 146 200 1 2 -N. Mex. 13 21 N N N 2 104 82 - - 1Ariz. 41 37 3 7 6 6 65 179 - 13 1Utah 13 10 - 5 5 - 55 142 - 1 2Nev. 7 7 - 5 13 - 5 39 - 1 1
PACIFIC 364 405 3 76 120 - 1,296 1,065 - 4 10Wash. 59 58 - 2 8 - 581 262 - - 5Oreg. 61 68 N N N - 41 73 - - -Calif. 234 271 1 60 87 - 642 701 - 4 3Alaska 5 3 1 2 2 - 4 14 - - -Hawaii 5 5 1 12 23 - 28 15 - - 2
Guam 1 2 U 1 3 U 1 1 U - -P.R. 5 9 U - 3 U 16 4 U - 12V.I. U U U U U U U U U U UAmer. Samoa U U U U U U U U U U UC.N.M.I. U U U U U U U U U U U
N: Not notifiable U: Unavailable -: no reported cases
TABLE III. (Cont’d.) Provisional cases of selected notifiable diseases preventableby vaccination, United States, weeks ending October 9, 1999,
and October 10, 1998 (40th Week)
Reporting Area
Meningococcal
Disease Mumps Pertussis Rubella
Cum.
1999
Cum.
1998 1999
Cum.
1999
Cum.
1998 1999
Cum.
1999
Cum.
1998 1999
Cum.
1999
Cum.
1998
Vol. 48 / No. 40 MMWR 927

NEW ENGLAND 454 334 76 36 7 1 26Boston, Mass. 147 100 27 16 4 - 8Bridgeport, Conn. 36 30 4 1 1 - 1Cambridge, Mass. 14 11 2 1 - - 1Fall River, Mass. 27 20 5 2 - - 4Hartford, Conn. U U U U U U ULowell, Mass. 24 17 5 1 1 - -Lynn, Mass. 14 11 2 1 - - 1New Bedford, Mass. 13 8 2 2 - 1 -New Haven, Conn. 27 23 3 1 - - 1Providence, R.I. 35 28 4 3 - - 3Somerville, Mass. 2 - 1 1 - - -Springfield, Mass. 44 33 6 4 1 - -Waterbury, Conn. 18 17 1 - - - 1Worcester, Mass. 53 36 14 3 - - 6
MID. ATLANTIC 2,220 1,587 416 149 37 31 84Albany, N.Y. 48 38 7 2 - 1 2Allentown, Pa. U U U U U U UBuffalo, N.Y. 91 70 13 5 1 2 5Camden, N.J. 20 11 5 1 - 3 -Elizabeth, N.J. 13 13 - - - - 1Erie, Pa. 38 31 5 1 1 - 2Jersey City, N.J. 20 14 4 - 1 1 -New York City, N.Y. 1,182 840 223 82 18 19 26Newark, N.J. U U U U U U UPaterson, N.J. U U U U U U UPhiladelphia, Pa. 435 279 99 43 10 4 23Pittsburgh, Pa.§ 46 35 6 2 2 1 4Reading, Pa. 30 25 2 2 1 - 1Rochester, N.Y. 141 116 19 5 1 - 7Schenectady, N.Y. 28 19 7 1 1 - 3Scranton, Pa. 23 16 5 2 - - 3Syracuse, N.Y. 74 59 13 2 - - 5Trenton, N.J. 16 10 5 1 - - 2Utica, N.Y. 15 11 3 - 1 - -Yonkers, N.Y. U U U U U U U
E.N. CENTRAL 1,754 1,188 322 141 63 37 132Akron, Ohio 51 35 7 7 2 - 2Canton, Ohio 38 30 3 5 - - 6Chicago, Ill. 448 247 112 55 19 12 29Cincinnati, Ohio 79 54 14 3 3 5 10Cleveland, Ohio 121 81 21 14 4 1 3Columbus, Ohio 194 126 37 20 7 4 16Dayton, Ohio 103 75 19 5 1 3 8Detroit, Mich. U U U U U U UEvansville, Ind. 22 20 2 - - - 1Fort Wayne, Ind. 55 37 11 3 2 2 3Gary, Ind. 16 11 3 - 1 1 1Grand Rapids, Mich. 41 29 8 2 - 2 4Indianapolis, Ind. 157 116 23 9 8 1 21Lansing, Mich. 42 26 11 1 4 - 3Milwaukee, Wis. 105 79 15 5 5 1 11Peoria, Ill. 43 39 1 2 - 1 3Rockford, Ill. 60 44 8 6 1 1 3South Bend, Ind. 35 21 9 2 1 2 1Toledo, Ohio 89 72 15 - 2 - 2Youngstown, Ohio 55 46 3 2 3 1 5
W.N. CENTRAL 712 511 128 35 14 24 35Des Moines, Iowa 136 93 28 9 1 5 8Duluth, Minn. 37 24 8 2 1 2 2Kansas City, Kans. U U U U U U UKansas City, Mo. 99 75 15 2 3 4 6Lincoln, Nebr. 31 24 4 2 - 1 2Minneapolis, Minn. 162 123 26 9 3 1 6Omaha, Nebr. 70 44 18 3 1 4 5St. Louis, Mo. 77 50 14 3 4 6 1St. Paul, Minn. 100 78 15 5 1 1 5Wichita, Kans. U U U U U U U
S. ATLANTIC 1,104 699 221 117 32 35 66Atlanta, Ga. U U U U U U UBaltimore, Md. 175 85 38 35 8 9 14Charlotte, N.C. 120 88 17 9 1 5 10Jacksonville, Fla. 171 105 40 9 5 12 10Miami, Fla. 74 61 3 7 3 - 12Norfolk, Va. 53 32 14 4 1 2 3Richmond, Va. 64 37 18 6 2 1 3Savannah, Ga. 59 40 10 5 3 1 5St. Petersburg, Fla. 59 49 4 2 2 2 3Tampa, Fla. 177 114 38 18 4 3 2Washington, D.C. 128 68 35 22 3 - 4Wilmington, Del. 24 20 4 - - - -
E.S. CENTRAL 859 571 165 72 31 19 71Birmingham, Ala. 152 101 27 10 8 5 9Chattanooga, Tenn. 68 45 15 7 1 - 2Knoxville, Tenn. 98 63 23 8 2 2 8Lexington, Ky. 72 52 10 7 2 1 5Memphis, Tenn. 252 159 53 18 13 9 27Mobile, Ala. 54 37 7 8 2 - 2Montgomery, Ala. 53 36 10 5 2 - 9Nashville, Tenn. 110 78 20 9 1 2 9
W.S. CENTRAL 1,377 859 310 113 42 53 88Austin, Tex. 76 44 19 10 2 1 2Baton Rouge, La. 44 27 12 3 1 1 3Corpus Christi, Tex. 37 24 8 1 2 2 2Dallas, Tex. 175 100 36 23 4 12 6El Paso, Tex. 82 53 22 4 2 1 4Ft. Worth, Tex. 124 79 23 9 3 10 9Houston, Tex. 391 235 95 32 16 13 28Little Rock, Ark. 67 45 16 3 2 1 5New Orleans, La. 41 21 8 7 2 3 6San Antonio, Tex. 201 138 42 10 7 4 12Shreveport, La. 47 30 7 6 1 3 5Tulsa, Okla. 92 63 22 5 - 2 6
MOUNTAIN 1,004 670 205 84 28 17 86Albuquerque, N.M. 122 89 14 14 3 2 11Boise, Idaho 43 29 9 3 1 1 2Colo. Springs, Colo. 55 36 8 8 2 1 4Denver, Colo. 134 90 30 10 2 2 10Las Vegas, Nev. 177 108 48 14 6 1 8Ogden, Utah 42 30 8 3 1 - 5Phoenix, Ariz. 163 94 38 15 10 6 16Pueblo, Colo. 27 18 7 2 - - 1Salt Lake City, Utah 112 74 23 10 2 3 19Tucson, Ariz. 129 102 20 5 1 1 10
PACIFIC 1,513 1,091 262 97 42 21 128Berkeley, Calif. 19 14 4 1 - - -Fresno, Calif. 88 62 13 8 5 - 5Glendale, Calif. 21 18 2 1 - - -Honolulu, Hawaii 57 46 6 3 1 1 7Long Beach, Calif. 67 43 12 5 5 2 6Los Angeles, Calif. 367 267 68 18 9 5 24Pasadena, Calif. 22 13 4 2 1 2 2Portland, Oreg. 141 104 26 7 1 3 15Sacramento, Calif. 180 130 31 10 5 4 24San Diego, Calif. 130 89 23 11 4 3 7San Francisco, Calif. U U U U U U USan Jose, Calif. 126 86 25 9 6 - 19Santa Cruz, Calif. 25 20 5 - - - 1Seattle, Wash. 148 110 20 13 4 1 8Spokane, Wash. 60 46 11 3 - - 6Tacoma, Wash. 62 43 12 6 1 - 4
TOTAL 10,997¶
7,510 2,105 844 296 238 716
Reporting Area>65 45-64 25-44 1-24 <1
P&I†
TotalAllAges
All Causes, By Age (Years)
Reporting AreaP&I
†
TotalAllAges
All Causes, By Age (Years)
>65 45-64 25-44 1-24 <1
U: Unavailable -: no reported cases*Mortality data in this table are voluntarily reported from 122 cities in the United States, most of which have populations of 100,000 ormore. A death is reported by the place of its occurrence and by the week that the death certificate was filed. Fetal deaths are notincluded.
†Pneumonia and influenza.§Because of changes in reporting methods in this Pennsylvania city, these numbers are partial counts for the current week. Completecounts will be available in 4 to 6 weeks.
¶Total includes unknown ages.
TABLE IV. Deaths in 122 U.S. cities,* week endingOctober 9, 1999 (40th Week)
928 MMWR October 15, 1999

Vol. 48 / No. 40 MMWR 929

930 MMWR October 15, 1999

Contributors to the Production of the MMWR (Weekly)Weekly Notifiable Disease Morbidity Data and 122 Cities Mortality Data
Samuel L. Groseclose, D.V.M., M.P.H.
State Support Team Robert Fagan Jose Aponte Paul Gangarosa, M.P.H. Gerald Jones David Nitschke Carol A. Worsham
CDC Operations Team Carol M. Knowles Deborah A. Adams Willie J. Anderson Fredrick Browder Patsy A. Hall Kathryn Snavely
Vol. 48 / No. 40 MMWR 931

The Morbidity and Mortality Weekly Report (MMWR) Series is prepared by the Centers for Disease Controland Prevention (CDC) and is available free of charge in electronic format and on a paid subscription basisfor paper copy. To receive an electronic copy on Friday of each week, send an e-mail message [email protected]. The body content should read SUBscribe mmwr-toc. Electronic copy also isavailable from CDC’s World-Wide Web server at http://www.cdc.gov/ or from CDC’s file transfer protocolserver at ftp.cdc.gov. To subscribe for paper copy, contact Superintendent of Documents, U.S. GovernmentPrinting Office, Washington, DC 20402; telephone (202) 512-1800.
Data in the weekly MMWR are provisional, based on weekly reports to CDC by state health departments.The reporting week concludes at close of business on Friday; compiled data on a national basis are officiallyreleased to the public on the following Friday. Address inquiries about the MMWR Series, including materialto be considered for publication, to: Editor, MMWR Series, Mailstop C-08, CDC, 1600 Clifton Rd., N.E., Atlanta,GA 30333; telephone (888) 232-3228.
All material in the MMWR Series is in the public domain and may be used and reprinted withoutpermission; citation as to source, however, is appreciated.
Director, Centers for Disease Controland Prevention Jeffrey P. Koplan, M.D., M.P.H.
Acting Deputy Director for Scienceand Public Health, Centers forDisease Control and Prevention Stephen M. Ostroff, M.D.
Acting Director,Epidemiology Program Office Barbara R. Holloway, M.P.H.
Editor, MMWR Series John W. Ward, M.D.
Managing Editor,MMWR (weekly) Karen L. Foster, M.A.
Writers-Editors,MMWR (weekly) Jill Crane David C. Johnson Teresa F. Rutledge Caran R. Wilbanks
Desktop Publishing Morie M. Higgins Peter M. Jenkins
✩U.S. Government Printing Office: 2000-533-206/08029 Region IV
932 MMWR October 15, 1999