Embed Size (px)
Citation preview

search | recruit | sustain
health safety and environment remuneration survey 2015 / 2016
safesearch.com.aumelbourne | sydney | perth | brisbane | adelaide | auckland | wellington | christchurch
in association with
in association with
health, safety and environment rem
uneration survery 2015/2016
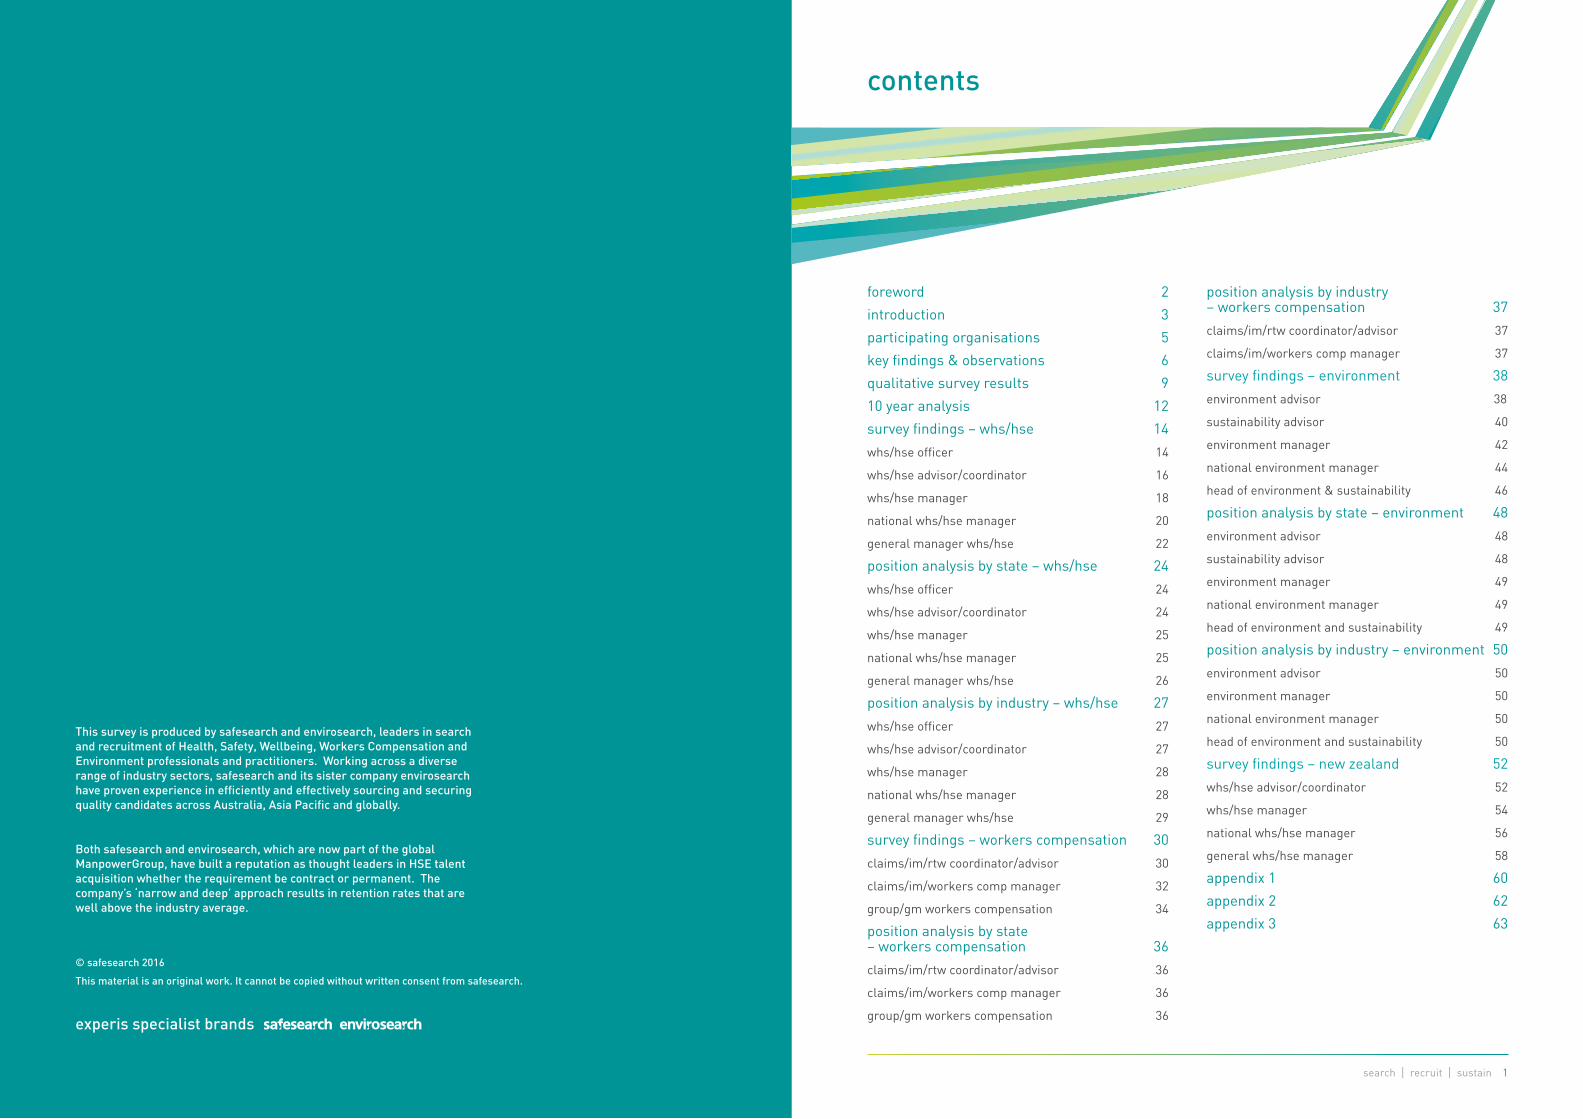
foreword 2
introduction 3
participating organisations 5
key findings & observations 6
qualitative survey results 9
10 year analysis 12
survey findings – whs/hse 14
whs/hse officer 14
whs/hse advisor/coordinator 16
whs/hse manager 18
national whs/hse manager 20
general manager whs/hse 22
position analysis by state – whs/hse 24
whs/hse officer 24
whs/hse advisor/coordinator 24
whs/hse manager 25
national whs/hse manager 25
general manager whs/hse 26
position analysis by industry – whs/hse 27
whs/hse officer 27
whs/hse advisor/coordinator 27
whs/hse manager 28
national whs/hse manager 28
general manager whs/hse 29
survey findings – workers compensation 30
claims/im/rtw coordinator/advisor 30
claims/im/workers comp manager 32
group/gm workers compensation 34
position analysis by state – workers compensation 36
claims/im/rtw coordinator/advisor 36
claims/im/workers comp manager 36
group/gm workers compensation 36
position analysis by industry – workers compensation 37
claims/im/rtw coordinator/advisor 37
claims/im/workers comp manager 37
survey findings – environment 38
environment advisor 38
sustainability advisor 40
environment manager 42
national environment manager 44
head of environment & sustainability 46
position analysis by state – environment 48
environment advisor 48
sustainability advisor 48
environment manager 49
national environment manager 49
head of environment and sustainability 49
position analysis by industry – environment 50
environment advisor 50
environment manager 50
national environment manager 50
head of environment and sustainability 50
survey findings – new zealand 52
whs/hse advisor/coordinator 52
whs/hse manager 54
national whs/hse manager 56
general whs/hse manager 58
appendix 1 60
appendix 2 62
appendix 3 63
contents
search | recruit | sustain 1
This survey is produced by safesearch and envirosearch, leaders in search and recruitment of Health, Safety, Wellbeing, Workers Compensation and Environment professionals and practitioners. Working across a diverse range of industry sectors, safesearch and its sister company envirosearch have proven experience in efficiently and effectively sourcing and securing quality candidates across Australia, Asia Pacific and globally.
Both safesearch and envirosearch, which are now part of the global ManpowerGroup, have built a reputation as thought leaders in HSE talent acquisition whether the requirement be contract or permanent. The company’s ‘narrow and deep’ approach results in retention rates that are well above the industry average.
© safesearch 2016
This material is an original work. It cannot be copied without written consent from safesearch.
experis specialist brands
2 2015/2016 remuneration survey search | recruit | sustain 3
The health and safety sector in 2015-16 continues to be influenced by downturns in investment across the energy and resources sector and general softness across the jobs front in a number of other industries traditionally employing OHS/WHS expertise.
What do we as a sector know about how this and other industry issues are impacting on the people who are working in the profession? Who is most effected and how? How is the education and experience profile of the profession changing? What are the trends in regards to the choices employers are making in the way they are setting up their HSEQ teams/workforces, and in what sectors?
We don’t know enough. Solid knowledge is built on the analysis of high quality data, and we need more of that data to better understand the subtleties of change in the way Health and Safety is managed and administrated throughout different industries and across Australia. This makes the work of safesearch and this remuneration survey important. It remains an annual piece of data collection which shows emerging trends over time, and gives us insights into the evolution of the health and safety profession.
One program just introduced which will have a structural effect on the sector in the years to come – and the data in this survey – is Certification of the profession. For some years, the Safety institute of Australia has worked to build three key building blocks to ensure the ongoing improvement of advice to employers and the capability of the OHS/WHS profession: (a) The creation of the OHS Body
of Knowledge, providing a rich source of knowledge which outlines the conceptual frameworks for the roles of OHS practitioner and professional; (b) accreditation of higher education, building greater consistency in education and articulating it against the Body of Knowledge; and (c) Certification, which combines both education and critical on-the-job experience, to recognise the capability of individuals. In July 2015, the Safety Institute of Australia introduced its full Certification for the OHS profession, with the introduction of three important levels of certification: Practitioner, Professional and Chartered Professional, and there are now 1400 members of the profession certified into these roles. Employers can have increased confidence that by employing a certified person, they are more likely to get a person capable of delivering high quality OHS/WHS advice at the level they are certified.
We again commend the safesearch remuneration survey to readers as a great initiative – a regular source of annual data that over time, building on the data of previous years, tells one part of the complex story which is the state of the health and safety profession through our workplaces in Australia.
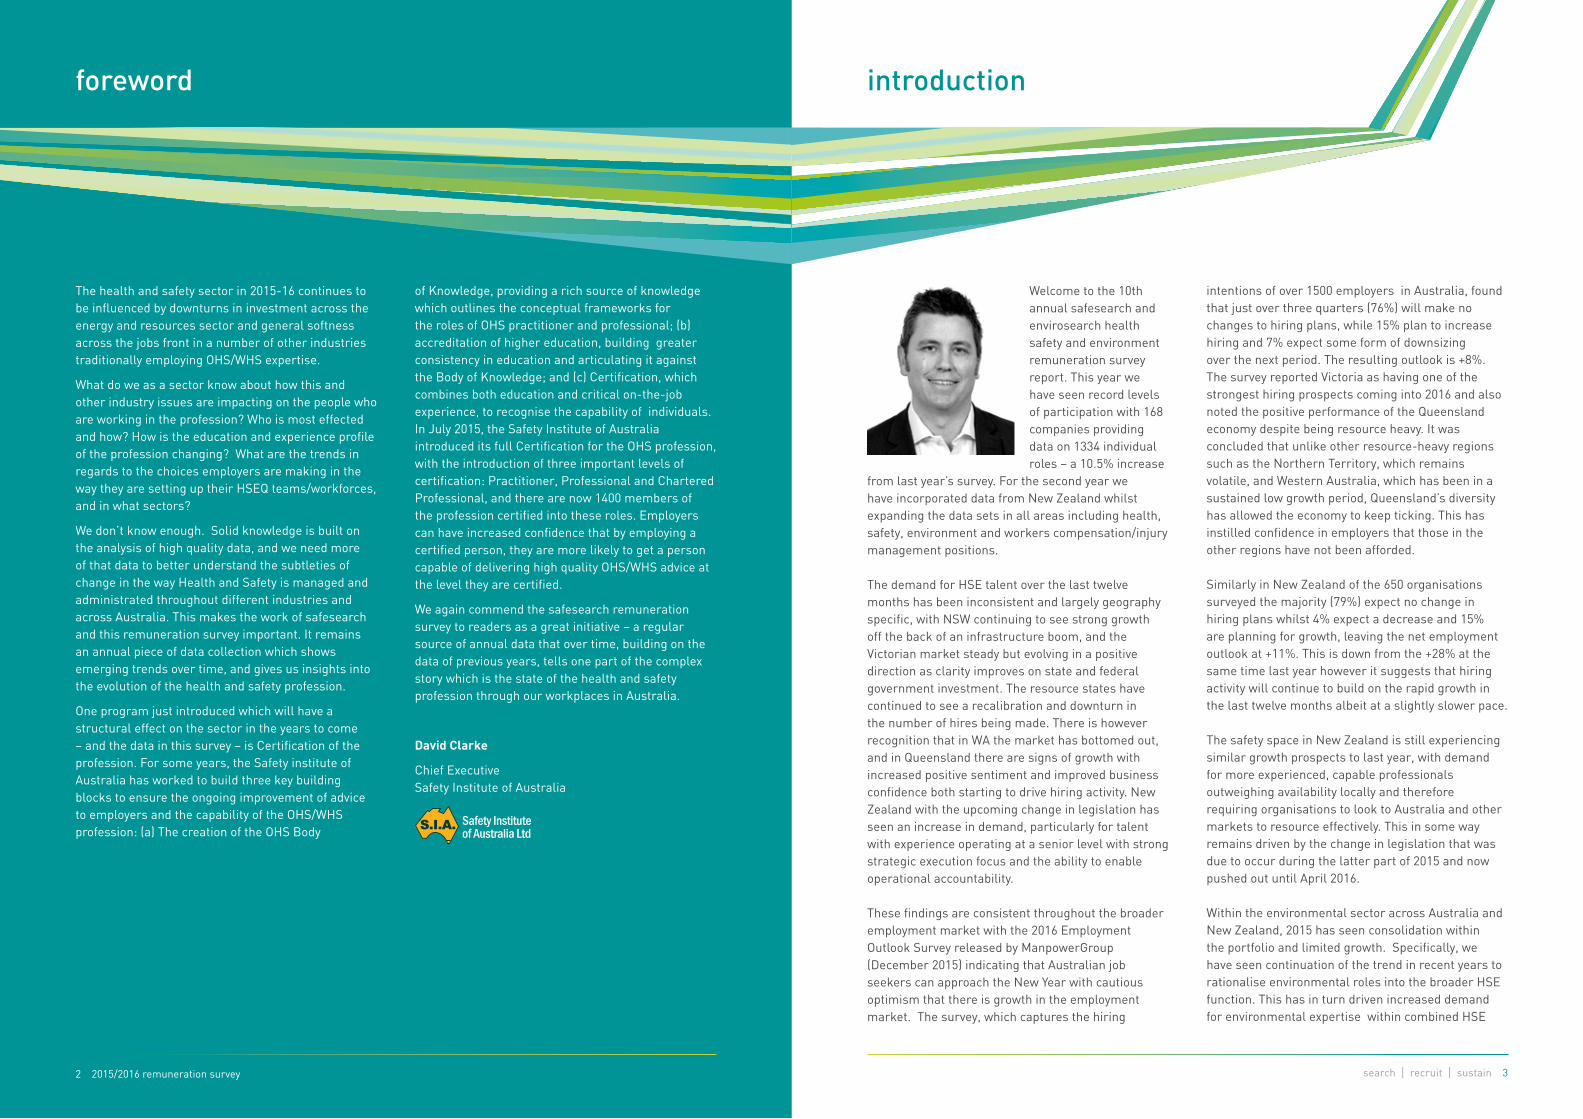
David Clarke
Chief ExecutiveSafety Institute of Australia
foreword introduction
Welcome to the 10th annual safesearch and envirosearch health safety and environment remuneration survey report. This year we have seen record levels of participation with 168 companies providing data on 1334 individual roles – a 10.5% increase
from last year’s survey. For the second year we have incorporated data from New Zealand whilst expanding the data sets in all areas including health, safety, environment and workers compensation/injury management positions.
The demand for HSE talent over the last twelve months has been inconsistent and largely geography specific, with NSW continuing to see strong growth off the back of an infrastructure boom, and the Victorian market steady but evolving in a positive direction as clarity improves on state and federal government investment. The resource states have continued to see a recalibration and downturn in the number of hires being made. There is however recognition that in WA the market has bottomed out, and in Queensland there are signs of growth with increased positive sentiment and improved business confidence both starting to drive hiring activity. New Zealand with the upcoming change in legislation has seen an increase in demand, particularly for talent with experience operating at a senior level with strong strategic execution focus and the ability to enable operational accountability.
These findings are consistent throughout the broader employment market with the 2016 Employment Outlook Survey released by ManpowerGroup (December 2015) indicating that Australian job seekers can approach the New Year with cautious optimism that there is growth in the employment market. The survey, which captures the hiring
intentions of over 1500 employers in Australia, found that just over three quarters (76%) will make no changes to hiring plans, while 15% plan to increase hiring and 7% expect some form of downsizing over the next period. The resulting outlook is +8%. The survey reported Victoria as having one of the strongest hiring prospects coming into 2016 and also noted the positive performance of the Queensland economy despite being resource heavy. It was concluded that unlike other resource-heavy regions such as the Northern Territory, which remains volatile, and Western Australia, which has been in a sustained low growth period, Queensland’s diversity has allowed the economy to keep ticking. This has instilled confidence in employers that those in the other regions have not been afforded.
Similarly in New Zealand of the 650 organisations surveyed the majority (79%) expect no change in hiring plans whilst 4% expect a decrease and 15% are planning for growth, leaving the net employment outlook at +11%. This is down from the +28% at the same time last year however it suggests that hiring activity will continue to build on the rapid growth in the last twelve months albeit at a slightly slower pace.
The safety space in New Zealand is still experiencing similar growth prospects to last year, with demand for more experienced, capable professionals outweighing availability locally and therefore requiring organisations to look to Australia and other markets to resource effectively. This in some way remains driven by the change in legislation that was due to occur during the latter part of 2015 and now pushed out until April 2016.
Within the environmental sector across Australia and New Zealand, 2015 has seen consolidation within the portfolio and limited growth. Specifically, we have seen continuation of the trend in recent years to rationalise environmental roles into the broader HSE function. This has in turn driven increased demand for environmental expertise within combined HSE

4 2015/2016 remuneration survey
appendix ??? appendix ???
search | recruit | sustain 5
introduction – continued
roles. Recent policy changes and activity within operational oil and gas and construction sectors has seen demand start to increase in more recent times with positive hiring intent seen as we move into 2016. We anticipate that the recent changes signalled by the Commonwealth government, combined with the global climate agreement reached in Paris in late 2015, will drive further growth in both the environmental and sustainability sectors.
safesearch has continued to play an active thought leadership role over the past year with another successful “safesearch Great Debate” having been held in Sydney. The debate centred on the Board’s role in safety within business, and saw contributions from a number of leading board directors across Australia. This event was once again supported by PwC and was attended by a large audience of CEOs, senior executives and safety leaders from across the country, demonstrating the importance and commitment to safety at all levels, which was both refreshing and exciting to see. Through this event and others we have seen a continued drive across the profession towards the need to evolve, to align more closely with the business and to do things differently in order to maintain relevance and maximise impact.
We are committed to further contribution in this space in the hope that we can continue to contribute to a better informed and engaged workforce that is better enabled to reduce fatalities, injuries and illness, that manages assets and operations in a sustainable fashion, embraces the changing nature of work, and places an increased focus on people risk and the potential impacts that will arise if such risks are not properly managed.
Thank you again for your support, contribution and interest in our survey. For feedback or to register your interest for next year’s survey, email us at [email protected].
Aaron NeilsonGeneral Manager
participating organisations
safesearch and envirosearch would like to thank each of the participants above as well as 116 other participating organisations that preferred not to be named.
ABB Australia
AGC
Alcoa
Asciano
Australia Post
Australian Home Care Services
Australian Red Cross Blood Service
Bega Cheese
Boskalis Australia
Broadcast Australia
Compass Group
Condor Energy Services
Crown
Delta SBD
DuluxGroup
Evolution Mining
Fonterra
George Weston Foods
Healthscope
Industrial Galvanizers
ISS Facility Services
Jemena
John Holland
Laing O’Rourke Australia
Lend Lease
Lion
L’Oreal Australia
Lyons Construction
Matrix Composites & Engineering
Medibank Private
Melbourne Health
News Corp Australia
Orica
Pilbara Meta Maya Regional Aboriginal Corporation
PMP
Programmed
RMIT
Roads and Maritime Services
Safety Action
Samsung C&T
Sims Metal Management
Sirtex Medical
SMEC Australia
Swire Cold Storage
Telstra
Thiess
Transfield Services
Victoria Racing Club
Visy Industries
Watpac Civil and Mining
Westpac Banking Corporation
Woolworths

6 2015/2016 remuneration survey search | recruit | sustain 7
claims / im / workers compensation manager• Average TAR increase of 9.4%• 47% qualified to relevant Diploma-level (AQF 5) • 41% are responsible for two or more jurisdictions• VIC has the highest average TAR at $132,121
group / gm workers compensation• Average TAR decrease of 1.5%• All respondents qualified to at least relevant undergraduate-level (AQF 7)• 57% have 6+ years of experience• 67% have one or more direct reports
environment advisor• Average TAR increase of 16.5%• 94% are qualified to relevant undergraduate-level (AQF 7)• 69% have multi-site responsibility
sustainability advisor• Average TAR increase of 5.2% from 2013/14 survey• 29% have a relevant Masters (AQF 9) degree• No direct reports reported for this role
environment manager• Average TAR increase of 8.6%• 67% have no direct reports, compared to 51% last year• 48% have 11+ years of experience national environment manager• Average TAR increase of 22.1% (TFR increase of 14.6%)• 79% lead a team• 71% have 11+ years of experience
head of environment & sustainability• Average TAR increase of 9% year-on-year• 70% of Target STI paid out• 29% have no direct reports
“Over the past ten years the HSE profession has continued to evolve as a business partner that delivers real value. Growth in remuneration levels during this period reflects this, with HSE General Managers’ actual take home packages increasing by 52.2%, while National HSE Managers have increased by 71.2%.”Aaron NeilsonGeneral Manager
key findings & observations
The key findings from the 2015/2016 report include the following:
• There is an overall increase in remuneration of 5.34% across all safety roles this year compared to last
• Average TAR up, with double digit growth for mid-level roles in QLD (WHS/HSE Advisor/Coordinator and Manager) and National Manager level in NSW
• In QLD the recovery continues with 11.3% and 20.7% growth at the WHS/HSE Advisor/Coordinator and Manager levels respectively
• NSW sees significant 17.2% growth at the National WHS/HSE Manager level with increases at all other levels reflecting the strength in this market over the last two years built around the infrastructure boom
• Increases at Management and National Management levels can in some way be attributed to the ‘more with less’ approach many organisations continue to employ – smaller team sizes combined with increased accountability at this level has driven growth in management salaries
• The environment sector returns to growth with an average 12.28% increase across all positions in this year’s survey
whs / hse officer• Average TAR increase of 9.1%• 80% have formal safety qualifications• 55% with single site responsibility• VIC average TAR has increased by 8.8% however it remains lowest in Australia; NSW has increased by 4.1% while QLD has decreased by 6.5%
whs / hse advisor / coordinator• Average TAR increase of 2.4%• 67% have multi-site responsibility; 15% have 10+ sites• 85% have Diploma-level safety qualification (AQF 5) or higher; only 2% with no formal safety qualification• NT remains highest paid in the state, with VIC the lowest despite a small increase (1.2%)
whs / hse manager• Average TAR increase of 4.1%• 81% qualified to the Diploma-level (AQF 5) or higher• 50% have direct reports; only 6% have more than 5 direct reports• Average TAR increases in every state other than WA and SA. TAR in VIC has increased 6%.
national whs / hse manager• Average TAR increase of 9.5%• 57% have responsibility for 21+ sites• 86% have direct reports, with 27% having 6+ direct reports• QLD average TAR returns to 2012/2013 levels; NSW average TAR has increased by 17.2% to become highest paying state• VIC has decreased by 6.7% after five years of increases
gm whs / hse• Average TAR increase of 1.6%• Average TFR up 0.4%, while average Actual STI is up from 11.4% of TFR to 12.7% of TFR• 32% have Masters -level (AQF 9) qualifications • QLD average TAR increase of 13%; VIC average TAR decrease of 5.2%
claims / im / rtw coordinator / advisor• Average TAR increased by 7.7%• 12% qualified to relevant undergraduate-level (AQF 7) • 53% have responsibility for one jurisdiction• Average TAR highest in WA for the third year in a row

8 2015/2016 remuneration survey search | recruit | sustain 9
key findings & observations – continued qualitative survey results
The ‘infrastructure boom’ in NSW drives strong growth at every level
Safety salaries in New South Wales have increased at all position levels . Officer level roles have increased by 4.1% average TAR, advisor/coordinator roles have increased by 7.5% average TAR, manager level roles increased by 1.9% average TAR, and national manager level roles have increased by 17.2% average TAR year-on-year. While GM-level roles have seen their TAR increase year-on-year by 0.7% as a result of a decrease in average bonus payout, average total fixed remuneration (TFR) at the GM level is also up this year, by 0.8%.
Solid growth continues in entry level roles
Officer-level roles have seen another year of robust growth in almost every market, with only Queensland seeing a decrease of 6.5%. Victoria has increased by 8.8%, New South Wales has increased by 4.1%, and Western Australia has increased by 2%. This continues to demonstrate the recognition from organisations that in order to attract suitable career-minded safety professionals (both graduate/early-career and mature age entrants or those changing career), they need to remain competitive with other functional areas. It also reflects an increase in those already within organisations identifying safety as a career pathway, or being identified as potential ‘champions’ and encouraged to transition.
Queensland continues to claw back lost ground
As the Queensland market recalibrates following the resource boom so too have salaries at the whs/hse advisor/coordinator level with a 12.2% increase and whs/hse managers increasing by 20.7% compared to last year. This is the second consecutive year that we have seen increases at the Advisor/Coordinator level, while at the manager level it is a welcome sign of recovery following two years of double digit declines at this level.
Legislative changes see New Zealand Market continue to evolve
Recruitment activity in New Zealand for safety professionals has strengthened on the back of recent legislative changes. However as our survey findings show, remuneration for safety professionals continues to lag behind Australia, particularly at the senior level. This imbalance is likely to cause challenges as New Zealand-based organisations increasingly look to Australia in their search for senior safety talent.
Mid-level workers compensation salaries increase
Workers compensation roles at the Advisor/Coordinator and Manager level have both seen solid year-on-year increases, of 7.7% and 9.4% respectively. This supports the experience seen by our workers compensation recruitment team that organisations are increasingly seeing the value in properly resourcing their workers compensation teams in order to better manage the costs associated with claims management. This strong growth in remuneration has not been seen at the senior-most level however, with Group / GM Workers Compensation roles having decreased slightly (-1.5%) year-on-year.
Environmental sector shows signs of stability
In the resource-centric states of Queensland and Western Australia, Environmental Managers have seen their average TAR increase year-on-year after having seen significant drops in last year’s survey as the mining boom wound down. Environmental Advisors’ TAR has increased by 16.5% year-on-year, with all of the growth being seen in the resource states of Western Australia and Queensland, while Victoria has decreased slightly (-0.8%) and NSW has increased marginally by 1.1%. This supports the view that outside of the resource sector dedicated environmental roles at the advisor level are being folded into the broader HSE function. However, within the mining and oil and gas sectors specialist environmental roles at this level have continued to be required.
This year our qualitative questions delved deeper into the critical issues identified by safety industry leaders in last year’s survey results: health and wellbeing strategy, and the increasing suggestion that the safety function itself must evolve in order to maintain relevance and add value. A wide range of organisations contributed to this section, with both common threads and industry-specific issues emerging.
Safety must be done differently
With 90% of respondents in agreement, the message is clear that safety ‘needs to be done differently’. All acknowledged the need to be more innovative, and to adopt a continuous improvement approach towards safety leadership and implementation. Typical comments included:
“There is a need for the HSE team to move to more of a value creation role, rather than value protection (e.g. compliance), particularly the more senior roles.”
Survey respondents noted that while there are many new philosophies on doing safety differently, the common elements are a less systems-focused approach and a stronger emphasis on behaviours, engagement and ownership. Over half of this year’s survey respondents referred to safety needing to be seen as simple/easier, effective/smarter, and more aligned to business objectives in order to better appeal to the broader organisation. Commentary included:
“We need to be less technical and more business focussed. HSE professionals need to deliver ROI, engage, execute and coach.”
“We need to remove onerous, sluggish safety processes that do little to increase workplace safety in favour of more streamlined, practical approaches that people see as supporting them, not slowing them down. Remove red tape. Increase accountability.”
“There are of course some awesome operators, [and] as any industry needs to adjust to the technical revolution and other generational changes, so does our approach to safety. [The] profession has to transform, but the trick will be to decipher through the seemingly endless opinions and find approaches that are genuine and worth investment.”
Health and Wellbeing comes into its own
As Health and Wellbeing programs begin to gain traction and credibility, survey respondents are coming face-to-face with the complexity of the core issues: mental health, depression, stress management, and the aging workforce. 80% of respondents claimed their health and wellbeing strategy is viewed as of high or significant importance within their organisations, however only a third of the respondents had a dedicated health and wellbeing resource in place. As one respondent puts it:
“It is a focus, but is challenged by the cost cutting in the business. We need to find smart (and cheap!) ways to do things. Leveraging return on investment where possible.”
The majority of respondents are using employee survey results and/or results from EAP programs to measure the effectiveness of their health and wellbeing strategies. Despite this, only 50% were confident their programs were delivering a measurable return on investment.
An aging/maturing workforce remains a significant issue for most organisations. As individuals are increasingly encouraged (or need) to stay in the workforce for longer, complexities are arising with how this is managed. Some respondents reported organisational concerns on the impact this shift can have on productivity and injury/claim costs. Others are already moving ahead to spend on capital investment to upgrade equipment and plant to accommodate the changing ergonomic requirements of an aging work force.

10 2015/2016 remuneration survey search | recruit | sustain 11
qualitative survey results – continued
Mental Health management clarity needed
Despite recent media attention and increased awareness of mental health in society more broadly, respondents made it clear that their organisations need more clarity on who is responsible, and where the line is drawn in regards to internal and external ownership of identification and treatment. As one survey respondent explains:
“Currently mental health is in the national conscience and is promoted accordingly. This in turn creates an environment in which individuals look to their work as both cause of health issues and a source of information to manage the problem. It is important for businesses to both delineate ‘work and home’, and accept that people will focus on their workplace as a source of stress.”
“There is a convergence between outside-of-work issues and work issues and this blurring of the lines makes managing this more difficult.”
From our survey responses it is clear health and safety and HR professionals must continue to educate front-line leaders on how to identify and manage mental health issues proactively, rather than waiting for them to appear in the workplace.
“The challenge is [this]: exactly what is the risk and how best to manage it in the workplace, if indeed the workplace is an appropriate place to manage it?”
The reality of endemic methamphetamine use hits the workplace
For many organisations, the use of drugs to counter the effects of fatigue, psychological illness and stress are an area of ongoing concern. In particular, the widening usage of methamphetamines (‘ice’) has been identified, with one respondent noting the “national health agencies have been caught off guard by the speed this group of substances is infiltrating our community.”
Technology drives the appetite for greater access to information
Forward-thinking organisations are looking towards technology for increased access to information for their workforce and management. With increasing use of handheld electronic devices, organisations are looking to develop and implement increasingly efficient and effective information solutions. Training, asset tracking, compliance reporting, and individual employee tracking information is being delivered electronically via software and apps. This is seen as a more simple and effective way for organisations to deliver their messages and manage risk. As the demand grows for simple and effective Safety Management Systems, so too does the demand for effective delivery methods. One respondent notes their goal to “[use] innovative technologies to support safety programs. Everyone has smart devices, [and] safety programs need to leverage these devices to deliver more engaging and consistent safety messaging.”
However, for some it can be challenging to implement such solutions in a cost-effective manner:
“[In] trying to do more with less, cost effective technology will be important to meet the regulatory burden of compliance. Unfortunately many of the technology solutions are too expensive to be implemented at the bottom of a cycle which is also the best time to do it. Software needs to be rotating seat not per user license, then it could be more cost effective.”
Remote and offsite working more complex than it appears
As the desire grows for flexibility and agility in work environments, such as home, office or elsewhere, complexities are emerging with regards to practicality. Some comments include:
“Mobility means more people are not working in traditional ways so understanding how to manage risks associated with people that are ‘out of sight’ creates a whole expanding paradigm of risk mitigation.”
“Transient / casual workforces present challenges around training and development and injury management.”
Retention is more of a focus than the ability to attract talent
Seventy percent of organisations saw attracting safety professionals this year to be the same or easier as it has been in previous years. What has proved to be more challenging for some organisations was the attraction of the right talent, particularly with getting the right technical fit when technical capabilities are often overstated. The “more for less” approach has continued, with managers looking to retain and develop their current team.
Influencing skills as important as qualifications
While the majority of respondents confirmed the importance of formal qualifications, greater emphasis was put on credibility and influencing – with these soft skills seen as having more of a positive impact on safety culture and performance than formal training alone. Explanations included:
“Qualifications are essential but needs to be balanced against experience, ability to influence and track record of achievements.”
“I would prefer people who can engage and execute a plan as well as coach.”
“Good balance between capabilities technical, strategic and soft skills is required.”

12 2015/2016 remuneration survey
10 year analysis
search | recruit | sustain 13
TAR by Position by Year
whs/hse officer -total actual remuneration
LOWER QUARTILE MEDIAN AVERAGE UPPER QUARTILE
$40000
$50000
$60000
$70000
$80000
$90000
$100000
$110000
$120000
15/1614/1513/1412/1311/1210/1109/1008/0907/0806/07
whs/hse advisor / coordinator - total actual remuneration
LOWER QUARTILE MEDIAN AVERAGE UPPER QUARTILE
$60000
$70000
$80000
$90000
$100000
$110000
$120000
$130000
$140000
$150000
$160000
15/1614/1513/1412/1311/1210/1109/1008/0907/0806/07
whs/hse manager -total actual remuneration
LOWER QUARTILE MEDIAN AVERAGE UPPER QUARTILE
$80000
$100000
$120000
$140000
$160000
$180000
$200000
$220000
$240000
15/1614/1513/1412/1311/1210/1109/1008/0907/0806/07
national whs/hse manager -total actual remuneration
LOWER QUARTILE MEDIAN AVERAGE UPPER QUARTILE
$100000
$120000
$140000
$160000
$180000
$200000
$220000
$240000
$260000
$280000
15/1614/1513/1412/1311/1210/1109/1008/0907/0806/07
general manager whs/hse - total actual remuneration
LOWER QUARTILE MEDIAN AVERAGE UPPER QUARTILE
$160000
$210000
$260000
$310000
$360000
$410000
15/1614/1513/1412/1311/1210/1109/1008/0907/0806/07
environment advisor - total actual remuneration
LOWER QUARTILE MEDIAN AVERAGE UPPER QUARTILE
$60000
$70000
$80000
$90000
$100000
$110000
$120000
$130000
15/1614/1513/1412/1311/1210/1109/1008/0907/08
environment manager- total actual remuneration
LOWER QUARTILE MEDIAN AVERAGE UPPER QUARTILE
$80000
$100000
$120000
$140000
$160000
$180000
$200000
15/1614/1513/1412/1311/1210/1109/1008/0907/08
national environment manager- total actual remuneration
LOWER QUARTILE MEDIAN AVERAGE UPPER QUARTILE
$100000
$120000
$140000
$160000
$180000
$200000
$220000
$240000
$260000
$280000
15/1614/1513/1412/1311/1210/1109/1008/0907/08
head / general manager of environment & sustainability - total actual remuneration
LOWER QUARTILE MEDIAN AVERAGE UPPER QUARTILE
$150000
$200000
$250000
$300000
$350000
$400000
15/1614/1513/1412/1311/1210/1109/1008/0907/08
14 2015/2016 remuneration survey
survey findings - whs/hse
search | recruit | sustain 15
whs/hse officerfigure 3
number of sites responsible for
^
51
21- 50
11-20
6-10
2-5
Single
55% 20%
3%6%
figure 4
number of direct reports
100%
^
1,001
501-1,000
101-500
26-100
6-25
1-5
None
0%
0%
0%
0%
0%
3%
97%
table 1.1
percentage of remuneration packages with vehicles
Vehicles No. Percent
A. Base + Benefits 2 40.00%
B. Total Fixed Remuneration 3 60.00%
Total 5
Overall % 8.47%
Average Value * $16,400
* Using Vehicle Formula, including 50% discount for Work Requirement
table 1.2
number with incentives as part of their package
Incentives No. Percent
Percentage with a STI 41 69.49%
Basis of STI
- As a % of Base Salary 16 39.02%
- As a % of Fixed Rem 25 60.98%
Percentage with a LTI 2 3.39%
table 1.3
breakdown of packages by basis of remuneration
Basis of Remuneration No. Percent
A. Base + Benefits 10 16.95%
B. Total Fixed Remuneration 49 83.05%
Total 59
Job Match 100%+ Partial
Percentage* 73.68% 33.3326.32%
Range Earliest Average Latest
Last review date** 01/01/2014 8/07/2015 01/10/2015
* Job Match denotes whether each position matches position descriptions located in Appendix 3
** Last review date denotes range of most recent remuneration review
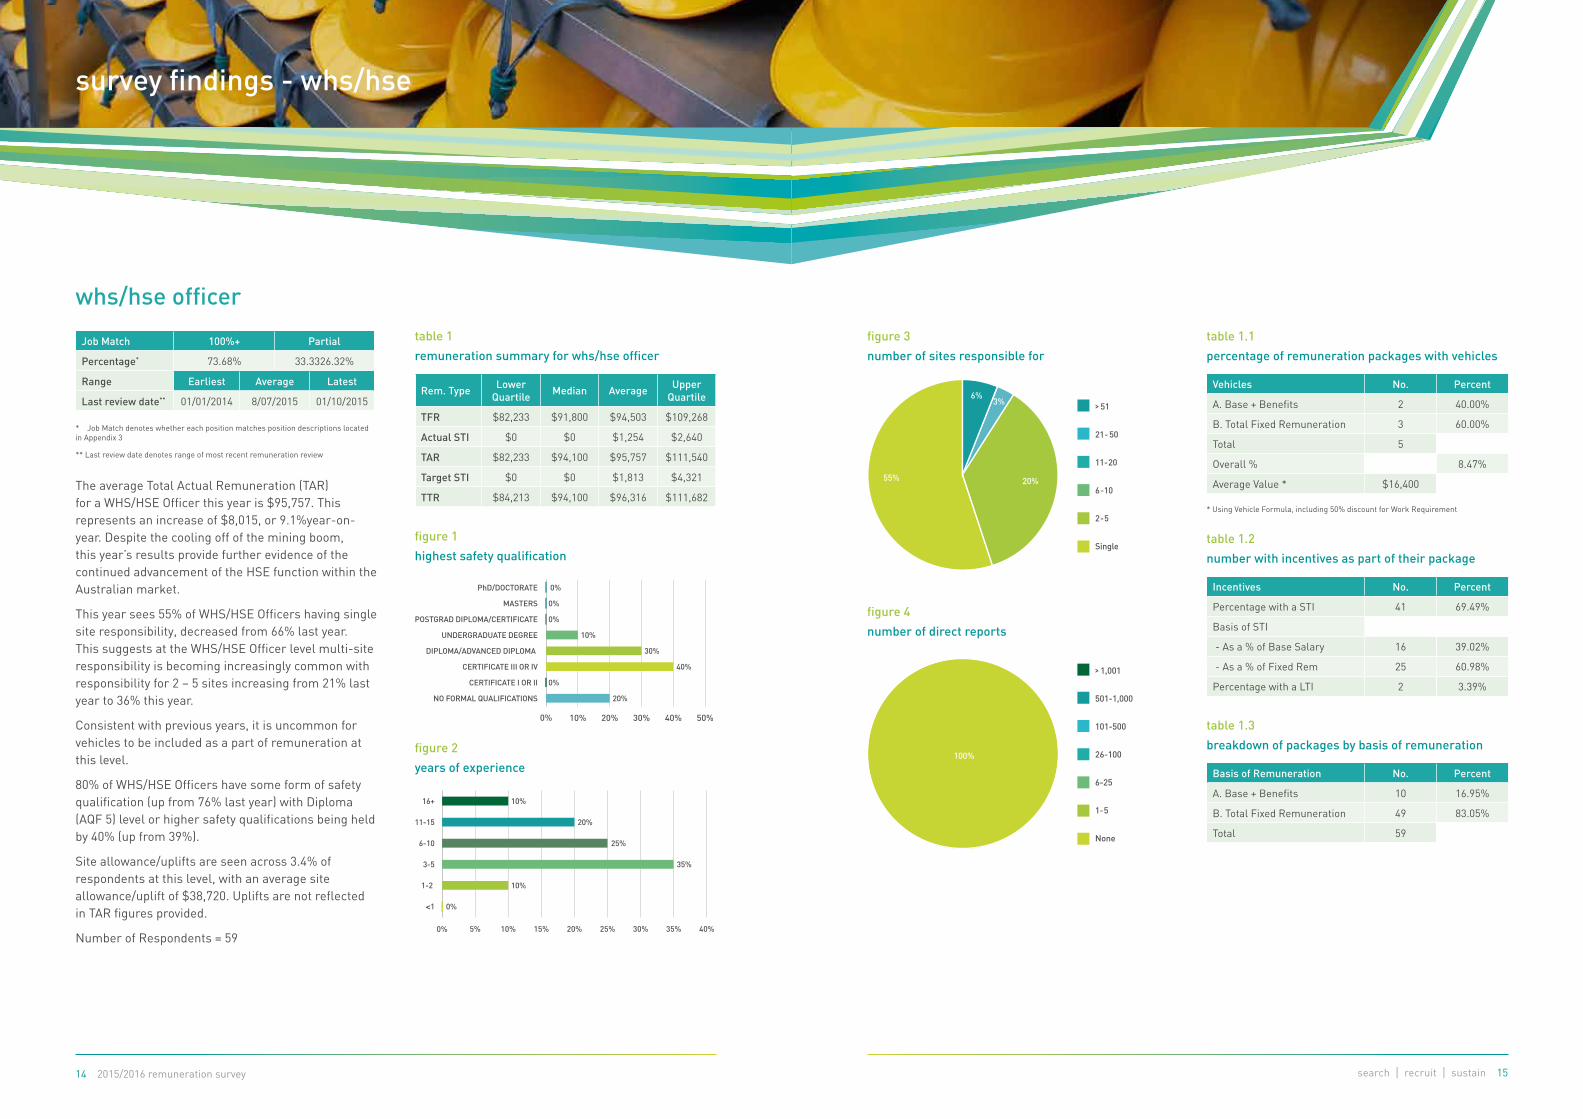
The average Total Actual Remuneration (TAR) for a WHS/HSE Officer this year is $95,757. This represents an increase of $8,015, or 9.1%year-on-year. Despite the cooling off of the mining boom, this year’s results provide further evidence of the continued advancement of the HSE function within the Australian market.
This year sees 55% of WHS/HSE Officers having single site responsibility, decreased from 66% last year. This suggests at the WHS/HSE Officer level multi-site responsibility is becoming increasingly common with responsibility for 2 – 5 sites increasing from 21% last year to 36% this year.
Consistent with previous years, it is uncommon for vehicles to be included as a part of remuneration at this level.
80% of WHS/HSE Officers have some form of safety qualification (up from 76% last year) with Diploma (AQF 5) level or higher safety qualifications being held by 40% (up from 39%).
Site allowance/uplifts are seen across 3.4% of respondents at this level, with an average site allowance/uplift of $38,720. Uplifts are not reflected in TAR figures provided.
Number of Respondents = 59
table 1
remuneration summary for whs/hse officer
Rem. Type Lower Quartile Median Average Upper
Quartile
TFR $82,233 $91,800 $94,503 $109,268
Actual STI $0 $0 $1,254 $2,640
TAR $82,233 $94,100 $95,757 $111,540
Target STI $0 $0 $1,813 $4,321
TTR $84,213 $94,100 $96,316 $111,682
figure 1
highest safety qualification
0% 10% 20% 30% 40% 50%
PhD/DOCTORATE
MASTERS
POSTGRAD DIPLOMA/CERTIFICATE
UNDERGRADUATE DEGREE
DIPLOMA/ADVANCED DIPLOMA
CERTIFICATE III OR IV
CERTIFICATE I OR II
NO FORMAL QUALIFICATIONS
0%
0%
0%
10%
30%
40%
0%
20%
figure 2
years of experience
0% 5% 10% 15% 20% 25% 30% 35% 40%
16+
11-15
6-10
3-5
1-2
<1
10%
20%
25%
35%
10%
0%

16 2015/2016 remuneration survey
survey findings – whs/hse
search | recruit | sustain 17
whs/hse advisor/coordinatorfigure 3
number of sites responsible for
^
51
21- 50
11-20
6-10
2-5
Single
33%
34%
13%
18%
1%1%
figure 4
number of direct reports
^
1,001
501-1,000
101-500
26-100
6-25
1-5
None
0%
0%
0%
0%
0%
3%
97%
6%
94%
table 1.1
percentage of remuneration packages with vehicles
Vehicles No. Percent
A. Base + Benefits 27 100.00%
B. Total Fixed Remuneration 0 0.00%
Total 27
Overall % 6.19%
Average Value * $24,363
* Using Vehicle Formula, including 50% discount for Work Requirement
table 1.2
number with incentives as part of their package
Incentives No. Percent
Percentage with a STI 291 66.74%
Basis of STI
- As a % of Base Salary 138 47.42%
- As a % of Fixed Rem 153 52.58%
Percentage with a LTI 5 1.15%
table 1.3
breakdown of packages by basis of remuneration
Basis of Remuneration No. Percent
A. Base + Benefits 148 33.94%
B. Total Fixed Remuneration 288 66.06%
Total 436
Job Match 100%+ Partial
Percentage* 67.57% 32.43%
Range Earliest Average Latest
Last review date** 01/01/2013 5/06/2015 01/10/2015
* Job Match denotes whether each position matches position descriptions located in Appendix 3
** Last review date denotes range of most recent remuneration review
The average WHS/HSE Advisor/Coordinator earns a TAR of $123,955 which is an increase of 2.4% from last year’s survey results. This follows on from a 4% increase last year, but is still slightly below the $126,562 TAR seen in our 2012/13 survey.
The majority of individuals at this level (67%) have multi-site responsibility and 15% have responsibility for ten or more sites. All but 15% of respondents at this level have a Diploma-level (AQF 5) safety qualification or higher, and only 2% have no formal safety qualifications.
The majority of WHS/HSE Advisor/Coordinators (94%) have no direct reports. 6.2% have vehicles included as a part of their remuneration package.
Site allowance/uplifts are seen across 13.1% of respondents at this level, with an average site allowance/uplift of $35,828. Uplifts are not reflected in TAR figures provided.
Number of respondents = 436
table 1
remuneration summary for whs/hse advisor/coordinator
Rem. Type Lower Quartile Median Average Upper
Quartile
TFR $100,701 $116,617 $119,008 $133,374
Actual STI $0 $3,400 $5,017 $6,809
TAR $107,247 $122,955 $123,955 $138,503
Target STI $0 $5,000 $5,835 $10,402
TTR $106,464 $123,014 $124,816 $140,238
figure 1
highest safety qualification
0% 10% 20% 30% 40% 50% 60%
PhD/DOCTORATE
MASTERS
POSTGRAD DIPLOMA/CERTIFICATE
UNDERGRADUATE DEGREE
DIPLOMA/ADVANCED DIPLOMA
CERTIFICATE III OR IV
CERTIFICATE I OR II
NO FORMAL QUALIFICATIONS
0%
4%
10%
22%
48%
13%
0%
2%
figure 2
years of experience
0% 10% 20% 30% 40% 50%
16+
11-15
6-10
3-5
1-2
<1
2%
7%
45%
46%
0%
0%

18 2015/2016 remuneration survey search | recruit | sustain 19
whs/hse managerfigure 3
number of sites responsible for
^
51
21- 50
11-20
6-10
2-5
Single
24%
8%
21%
19%
19%
8%
figure 4
number of direct reports
^
1,001
501-1,000
101-500
26-100
6-25
1-5
None
0%
0%
0%
0%
0%
3%
97%
6%
50% 44%
table 1.1
percentage of remuneration packages with vehicles
Vehicles No. Percent
A. Base + Benefits 36 69.23%
B. Total Fixed Remuneration 16 30.77%
Total 52
Overall % 19.70%
Average Value * $19,985
* Using Vehicle Formula, including 50% discount for Work Requirement
table 1.2
number with incentives as part of their package
Incentives No. Percent
Percentage with a STI 194 73.48%
Basis of STI
- As a % of Base Salary 97 50.00%
- As a % of Fixed Rem 97 50.00%
Percentage with a LTI 23 8.71%
table 1.3
breakdown of packages by basis of remuneration
Basis of Remuneration No. Percent
A. Base + Benefits 92 34.85%
B. Total Fixed Remuneration 172 65.15%
Total 264
survey findings – whs/hse
Job Match 100%+ Partial
Percentage* 68.50% 31.50%
Range Earliest Average Latest
Last review date** 68.50% 31.50% 01/10/2014
* Job Match denotes whether each position matches position descriptions located in Appendix 3
** Last review date denotes range of most recent remuneration review
WHS/HSE Managers earned an average TAR of $165,541 this year. This represents an increase of 4.1% after two years of decreases, while still falling far short of the $182,673 TAR that reported in our 2012/13 survey during the height of the resource sector boom.
Average Actual STI this year is $7,282 (4.6% of TFR), up 20.5% from last year’s Average Actual STI of $6,041 (3.9% of TFR). The majority of WHS/HSE Managers this year were paid at least some STI, unlike the previous two years.
Remaining consistent with last year, 82% of respondents have a minimum Diploma/Advanced Diploma level (AQF 5) safety qualification, at least half of respondents hold undergraduate-level (AQF 7) or greater safety qualifications and 10% have Masters-level (AQF9) safety qualifications or higher.
While 50% of WHS/HSE Managers have direct reports, the percentage of those with teams of six or more has decreased from 15% last year to 6% this year, further reflecting the ‘doing more with less’ trend safesearch has identified within the safety function in recent years.
Site allowance/uplifts are seen across 6.4% of respondents at this level, with an average site allowance/uplift of $44,931. Uplifts are not reflected in TAR figures provided.
Number of respondents = 264
table 1
remuneration summary for whs/hse manager
Rem. Type Lower Quartile Median Average Upper
Quartile
TFR $141,073 $151,000 $158,313 $176,700
Actual STI $0 $1,660 $7,282 $15,000
TAR $143,000 $166,307 $165,541 $183,642
Target STI $0 $0 $11,257 $21,400
TTR $146,621 $169,735 $169,570 $184,627
figure 1
highest safety qualification
0% 10% 20% 30% 40%
PhD/DOCTORATE
MASTERS
POSTGRAD DIPLOMA/CERTIFICATE
UNDERGRADUATE DEGREE
DIPLOMA/ADVANCED DIPLOMA
CERTIFICATE III OR IV
CERTIFICATE I OR II
NO FORMAL QUALIFICATIONS
1%
9%
27%
13%
33%
16%
0%
3%
figure 2
years of experience
0% 5% 10% 15% 20% 25% 30% 35% 40% 45%
16+
11-15
6-10
3-5
1-2
<1
23%
32%
38%
7%
0%
0%

20 2015/2016 remuneration survey search | recruit | sustain 21
national whs/hse managerfigure 3
number of sites responsible for
^
51
21- 50
11-20
6-10
2-5
Single
18%
28%
29%
8%
19%
figure 4
number of direct reports
^
1,001
501-1,000
101-500
26-100
6-25
1-5
None
0%
0%
0%
0%
0%
3%
97%
27%
14%
59%
table 1.1
percentage of remuneration packages with vehicles
Vehicles No. Percent
A. Base & Salary 10 62.50%
B. Total Fixed Remuneration 6 37.50%
Total 16
Overall % 15.24%
Average Value * $24,427
* Using Vehicle Formula, including 50% discount for Work Requirement
table 1.2
number with incentives as part of their package
Incentives No. Percent
Percentage with a STI 79 75.24%
Basis of STI
- As a % of Base Salary 40 50.63%
- As a % of Fixed Rem 39 49.37%
Percentage with a LTI 16 15.24%
table 1.3
breakdown of packages by basis of remuneration
Basis of Remuneration No. Percent
A. Base & Salary 34 32.38%
B. Total Fixed Remuneration 71 67.62%
Total 105
survey findings – whs/hse
Job Match 100%+ Partial
Percentage* 68.37% 31.63%
Range Earliest Average Latest
Last review date** 01/01/2012 10/03/2015 01/10/2015
* Job Match denotes whether each position matches position descriptions located in Appendix 3
** Last review date denotes range of most recent remuneration review
National WHS/HSE Managers earned an average TAR of $222,774 this year, an increase of 9.5% from last year’s average TAR of $203,379. Median Actual STI at this level is $4,500, meaning that most National WHS/HSE Managers received a bonus during the most recent survey period. The average Actual STI this year is $14,031 (6.7% of TFR) against a Target STI of $29,484 (14.1% of TFR).
The majority (57%) of individuals at this level have responsibility for 21 or more sites. 76% of individuals at this level have 11+ years of experience.
86% of WHS/HSE Managers have at least one direct report with 27% having six or more direct reports. 74% of National WHS/HSE Managers have undergraduate degree (AQF 7) safety qualifications or higher, with 29% holding Masters-level (AQF 9) safety qualifications, up from 20% reported in both our 2014/15 and 2013/14 surveys and 14% reported in 2012/13.
Number of Respondents = 105
table 1
remuneration summary for national whs/hse manager
Rem. Type Lower Quartile Median Average Upper
Quartile
TFR $180,600 $200,250 $208,859 $244,575
Actual STI $0 $4,500 $14,031 $20,320
TAR $185,225 $217,175 $222,774 $253,063
Target STI $5,500 $21,000 $29,484 $39,737
TTR $195,000 $231,400 $238,098 $271,015
figure 1
highest safety qualification
0% 10% 20% 30% 40%
PhD/DOCTORATE
MASTERS
POSTGRAD DIPLOMA/CERTIFICATE
UNDERGRADUATE DEGREE
DIPLOMA/ADVANCED DIPLOMA
CERTIFICATE III OR IV
CERTIFICATE I OR II
NO FORMAL QUALIFICATIONS
0%
29%
36%
9%
12%
7%
0%
8%
figure 2
years of experience
0% 5% 10% 15% 20% 25% 30% 35% 40% 45%
16+
11-15
6-10
3-5
1-2
<1
42%
34%
21%
3%
0%
0%

22 2015/2016 remuneration survey
survey findings – whs/hse
search | recruit | sustain 23
general manager whs/hsefigure 3
number of sites responsible for
^
51
21- 50
11-20
6-10
2-5
Single
17%50%
14%
5%
12%
1%
figure 4
number of direct reports
^
1,001
501-1,000
101-500
26-100
6-25
1-5
None
0%
0%
0%
0%
0%
3%
97%
43%
8%
49%
table 1.1
percentage of remuneration packages with vehicles
Vehicles No. Percent
A. Base & Salary 3 50.00%
B. Total Fixed Remuneration 3 50.00%
Total 6
Overall % 11.76%
Average Value * $23,667
* Using Vehicle Formula, including 50% discount for Work Requirement
table 1.2
number with incentives as part of their package
Incentives No. Percent
Percentage with a STI 48 94.12%
Basis of STI
- As a % of Base Salary 20 41.67%
- As a % of Fixed Rem 28 58.33%
Percentage with a LTI 22 43.14%
table 1.3
breakdown of packages by basis of remuneration
Basis of Remuneration No. Percent
A. Base & Salary 12 23.53%
B. Total Fixed Remuneration 39 76.47%
Total 51
Job Match 100%+ Partial
Percentage* 72.92% 27.08%
Range Earliest Average Latest
Last review date** 01/01/2014 20/05/2015 01/10/2015
* Job Match denotes whether each position matches position descriptions located in Appendix 3
** Last review date denotes range of most recent remuneration review
General Managers earned an average TAR of $344,387 this year, an increase of 1.6% from $338,910 last year.
Average total fixed remuneration (TFR) at the GM level has essentially remained flat (+0.4%) year-on-year, while average Actual STI has increased by $4,354 to $38,916. This year’s Actual STI represents 12.7% of this year’s average TFR, in comparison to 11.4% last year.
88% of respondents have eleven or more years of experience, up from 82% last year, with the majority (55%) having over 15 years of experience. At this level 81% hold an undergraduate safety qualification (AQF 7) or greater, an increase from 72% last year. 32% hold a Masters (AQF 9) safety qualification.
Note: This category includes Divisional General Managers for divisions of significant size.
Number of Respondents = 51
table 1
remuneration summary for general manager whs/hse
Rem. Type Lower Quartile Median Average Upper
Quartile
TFR $252,500 $295,000 $305,472 $332,078
Actual STI $0 $35,518 $38,916 $60,000
TAR $282,700 $312,232 $344,387 $373,800
Target STI $49,216 $75,000 $77,565 $96,000
TTR $299,185 $357,000 $383,036 $422,419
figure 1
highest safety qualification
0% 10% 20% 30% 40%
PhD/DOCTORATE
MASTERS
POSTGRAD DIPLOMA/CERTIFICATE
UNDERGRADUATE DEGREE
DIPLOMA/ADVANCED DIPLOMA
CERTIFICATE III OR IV
CERTIFICATE I OR II
NO FORMAL QUALIFICATIONS
0%
32%
30%
19%
14%
0%
0%
5%
figure 2
years of experience
0% 10% 20% 30% 40% 50% 60%
16+
11-15
6-10
3-5
1-2
<1
55%
33%
10%
3%
0%
0%
24 2015/2016 remuneration survey
position analysis by state – whs/hse
search | recruit | sustain 25
Where the sample number was not sufficient for analysis, individual states have been excluded to prevent identification of company remuneration information and to protect the integrity of the data. A minimum of four respondents is required per state for analysis.
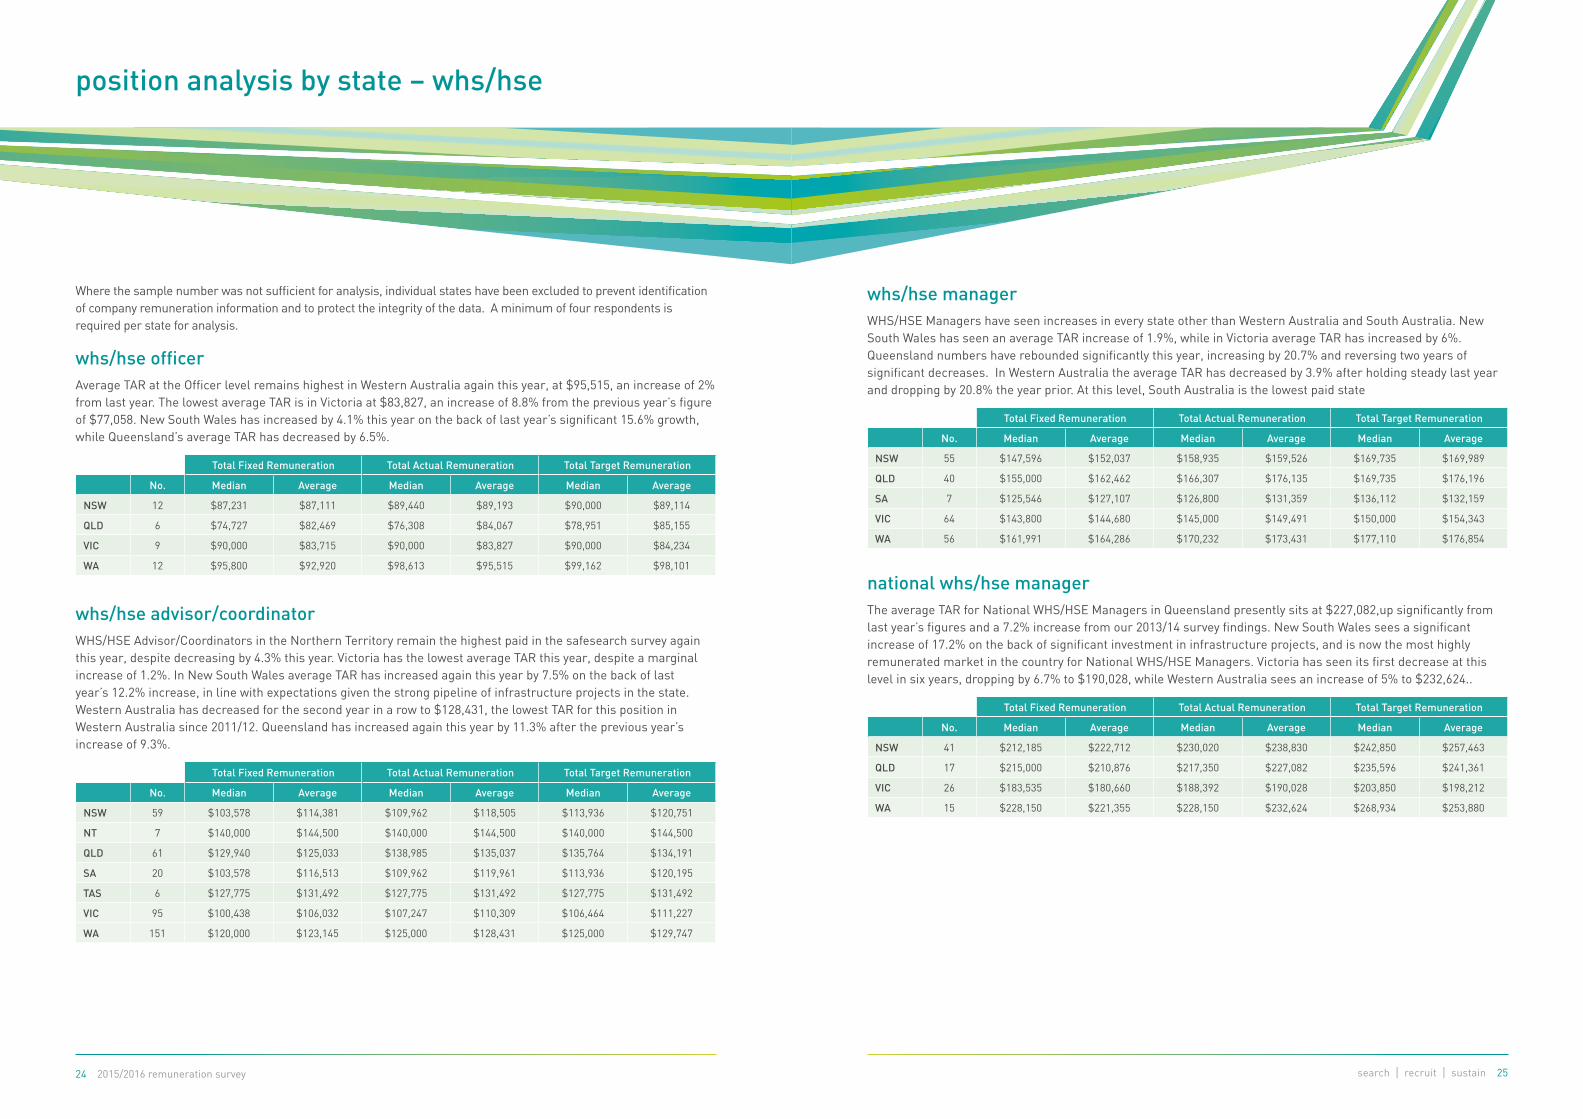
whs/hse officerAverage TAR at the Officer level remains highest in Western Australia again this year, at $95,515, an increase of 2% from last year. The lowest average TAR is in Victoria at $83,827, an increase of 8.8% from the previous year’s figure of $77,058. New South Wales has increased by 4.1% this year on the back of last year’s significant 15.6% growth, while Queensland’s average TAR has decreased by 6.5%.
Total Fixed Remuneration Total Actual Remuneration Total Target Remuneration
No. Median Average Median Average Median Average
NSW 12 $87,231 $87,111 $89,440 $89,193 $90,000 $89,114
QLD 6 $74,727 $82,469 $76,308 $84,067 $78,951 $85,155
VIC 9 $90,000 $83,715 $90,000 $83,827 $90,000 $84,234
WA 12 $95,800 $92,920 $98,613 $95,515 $99,162 $98,101
whs/hse advisor/coordinator WHS/HSE Advisor/Coordinators in the Northern Territory remain the highest paid in the safesearch survey again this year, despite decreasing by 4.3% this year. Victoria has the lowest average TAR this year, despite a marginal increase of 1.2%. In New South Wales average TAR has increased again this year by 7.5% on the back of last year’s 12.2% increase, in line with expectations given the strong pipeline of infrastructure projects in the state. Western Australia has decreased for the second year in a row to $128,431, the lowest TAR for this position in Western Australia since 2011/12. Queensland has increased again this year by 11.3% after the previous year’s increase of 9.3%.
Total Fixed Remuneration Total Actual Remuneration Total Target Remuneration
No. Median Average Median Average Median Average
NSW 59 $103,578 $114,381 $109,962 $118,505 $113,936 $120,751
NT 7 $140,000 $144,500 $140,000 $144,500 $140,000 $144,500
QLD 61 $129,940 $125,033 $138,985 $135,037 $135,764 $134,191
SA 20 $103,578 $116,513 $109,962 $119,961 $113,936 $120,195
TAS 6 $127,775 $131,492 $127,775 $131,492 $127,775 $131,492
VIC 95 $100,438 $106,032 $107,247 $110,309 $106,464 $111,227
WA 151 $120,000 $123,145 $125,000 $128,431 $125,000 $129,747
whs/hse managerWHS/HSE Managers have seen increases in every state other than Western Australia and South Australia. New South Wales has seen an average TAR increase of 1.9%, while in Victoria average TAR has increased by 6%. Queensland numbers have rebounded significantly this year, increasing by 20.7% and reversing two years of significant decreases. In Western Australia the average TAR has decreased by 3.9% after holding steady last year and dropping by 20.8% the year prior. At this level, South Australia is the lowest paid state
Total Fixed Remuneration Total Actual Remuneration Total Target Remuneration
No. Median Average Median Average Median Average
NSW 55 $147,596 $152,037 $158,935 $159,526 $169,735 $169,989
QLD 40 $155,000 $162,462 $166,307 $176,135 $169,735 $176,196
SA 7 $125,546 $127,107 $126,800 $131,359 $136,112 $132,159
VIC 64 $143,800 $144,680 $145,000 $149,491 $150,000 $154,343
WA 56 $161,991 $164,286 $170,232 $173,431 $177,110 $176,854
national whs/hse managerThe average TAR for National WHS/HSE Managers in Queensland presently sits at $227,082,up significantly from last year’s figures and a 7.2% increase from our 2013/14 survey findings. New South Wales sees a significant increase of 17.2% on the back of significant investment in infrastructure projects, and is now the most highly remunerated market in the country for National WHS/HSE Managers. Victoria has seen its first decrease at this level in six years, dropping by 6.7% to $190,028, while Western Australia sees an increase of 5% to $232,624..
Total Fixed Remuneration Total Actual Remuneration Total Target Remuneration
No. Median Average Median Average Median Average
NSW 41 $212,185 $222,712 $230,020 $238,830 $242,850 $257,463
QLD 17 $215,000 $210,876 $217,350 $227,082 $235,596 $241,361
VIC 26 $183,535 $180,660 $188,392 $190,028 $203,850 $198,212
WA 15 $228,150 $221,355 $228,150 $232,624 $268,934 $253,880

26 2015/2016 remuneration survey
position analysis by industry – whs/hse
search | recruit | sustain 27
general manager whs/hseIn New South Wales this year’s average TAR has remained essentially flat (+0.7%) despite an average increase of fixed remuneration from $309,158 to $318,081. Victoria also sees a decrease this year, with average TAR dropping by 5.2% and average fixed remuneration decreasing by 9.6%.
In Western Australia, the average GM TAR has increased after two years of decreases, rebounding by 12.8% to $369,500 after last year’s drop of 8.7%. GMs in Queensland have also seen an increase in average TAR, gaining 13% in comparison to last year.
Total Fixed Remuneration Total Actual Remuneration Total Target Remuneration
No. Median Average Median Average Median Average
NSW 20 $296,355 $318,081 $321,375 $352,073 $369,055 $406,871
QLD 6 $292,000 $305,028 $352,755 $366,391 $352,630 $368,727
VIC 16 $255,000 $267,690 $272,000 $307,282 $302,100 $333,214
WA 4 $327,500 $347,500 $352,500 $369,500 $404,375 $420,788
whs/hse officer This year the Engineering and Construction sector overtakes the Resources and Energy sector, with an average TAR of $106,401 compared to the Resources and Energy sector at $94,918. Manufacturing has rebounded by 21.7% to $95,420 while Transportation has decreased by 13.7% to $71,920.
Total Fixed Remuneration Total Actual Remuneration Total Target Remuneration
No. Median Average Median Average Median Average
Resources and Energy 11 $91,658 $91,868 $97,726 $94,918 $100,824 $98,287
Engineering and Construction 28 $103,967 $105,571 $104,717 $106,401 $103,967 $105,571
Manufacturing 5 $90,000 $95,420 $90,000 $95,420 $90,000 $95,420
Transport 5 $69,280 $69,280 $71,920 $71,920 $74,476 $74,476
Other 5 $62,880 $69,738 $62,880 $69,738 $62,880 $70,088
whs/hse advisor/coordinatorAt the advisor/coordinator level, those in the Resources and Energy sector have seen a significant decrease of 15.8% this year, from an average TAR of $160,700 last year to $135,240 this year. Engineering and Construction have decreased by 3.2% to $133,628, while Manufacturing is up slightly from $100,484 to $102,985, a gain of 2.5%. Transport, Professional Services/Finance/Retail and Industrial Services sectors have all decreased year-on-year.
Total Fixed Remuneration Total Actual Remuneration Total Target Remuneration
No. Median Average Median Average Median Average
Government 4 $89,999 $95,349 $89,999 $95,349 $89,999 $95,349
Resources and Energy 153 $125,000 $126,186 $126,087 $135,240 $127,775 $136,543
Engineering and Construction 93 $131,610 $131,960 $135,000 $133,628 $131,610 $132,275
Manufacturing 20 $104,995 $101,825 $104,995 $102,985 $104,995 $104,601
Transport 35 $103,578 $103,981 $109,962 $109,818 $113,936 $113,765
Professional Services / Finance / Retail
9 $103,050 $101,357 $103,050 $102,690 $108,203 $109,266
Industrial Services 48 $125,000 $121,818 $125,000 $121,916 $125,000 $124,063
Research and Education 4 $117,885 $113,714 $117,885 $113,714 $117,885 $113,714
Telecommunications 58 $100,438 $102,083 $100,438 $102,083 $106,464 $108,086
Other 12 $87,470 $90,856 $88,790 $90,856 $88,570 $91,223
position analysis by state – whs/hse – continued

28 2015/2016 remuneration survey search | recruit | sustain 29
whs/hse managerManager-level WHS/HSE professionals in the Resources and Energy sector have seen a 17.5% decrease in average TAR this year, returning the function to slightly below 2013/14 levels. Within the Manufacturing sector, average TAR has decreased again this year, down 3.2% on the back of last year’s 1.9% decrease. Average TAR within the Industrial Services sector has decreased significantly again this year, falling 7.4% after last year’s drop of 22%. The Transport sector has increased by 7.5% year-on-year while the Engineering and Construction sector has decreased by 3.9%.
Total Fixed Remuneration Total Actual Remuneration Total Target Remuneration
No. Median Average Median Average Median Average
Resources and Energy 53 $166,294 $175,408 $184,778 $193,149 $183,540 $195,640
Engineering and Construction 89 $170,872 $171,482 $174,500 $174,981 $171,000 $173,220
Manufacturing 39 $150,000 $143,210 $152,500 $144,426 $155,000 $156,486
Transport 36 $147,596 $147,414 $166,307 $161,967 $169,735 $168,712
Professional Services / Finance / Retail
12 $130,000 $125,855 $130,000 $129,408 $130,500 $137,847
Industrial Services 19 $129,365 $135,859 $132,228 $137,779 $139,480 $150,708
Research and Education 4 $128,123 $124,980 $128,123 $124,980 $128,123 $124,980
Other 8 $140,000 $142,118 $140,000 $142,118 $142,470 $146,824
national whs/hse managerNational WHS/HSE Managers in Engineering and Construction have seen their TAR return to growth this year, increasing by 4.6% after falling by 17.5% last year. Within the Manufacturing sector, average TAR has increased by 4% year-on-year, from $192,065 to $199,659. The highest average TAR for positions at this level is within the Resources and Energy sector which has decreased by 7% year-on-year, while the lowest sectors include Industrial Services and Manufacturing.
Total Fixed Remuneration Total Actual Remuneration Total Target Remuneration
No. Median Average Median Average Median Average
Resources and Energy 17 $228,150 $238,256 $258,750 $266,838 $270,000 $284,414
Engineering and Construction 25 $222,961 $221,700 $242,897 $234,886 $246,117 $248,214
Manufacturing 19 $195,000 $189,537 $196,000 $199,659 $211,200 $215,848
Transport 14 $198,200 $229,753 $230,020 $240,837 $237,840 $250,016
Professional Services / Finance / Retail
5 $217,285 $208,020 $222,185 $214,357 $244,122 $271,826
Industrial Services 17 $171,000 $169,795 $171,000 $183,027 $171,000 $194,217
Other 4 $163,562 $168,471 $163,562 $168,471 $163,562 $179,377
position analysis by industry – whs/hse – continued
general manager whs/hseAt the GM level, those within the Resources and Energy sector have the highest TAR with a solid increase of 8.1% from last year, while those in Engineering and Construction have seen their TAR decrease again this year, falling by 5.5% having decreased by 3% in last year’s survey. Within the Manufacturing sector the average TAR has decreased by 7.3% to $350,635..
Total Fixed Remuneration Total Actual Remuneration Total Target Remuneration
No. Median Average Median Average Median Average
Resources and Energy 12 $297,355 $311,285 $339,014 $363,455 $371,693 $388,258
Engineering and Construction 9 $321,086 $324,395 $350,000 $357,317 $401,358 $399,269
Manufacturing 9 $305,000 $292,709 $312,232 $324,966 $351,455 $352,955
Transport 4 $252,500 $271,250 $283,500 $317,775 $291,000 $327,500
Industrial Services 6 $271,700 $294,900 $303,750 $326,150 $348,540 $378,163
Telecommunications 4 $247,157 $249,728 $247,157 $249,728 $296,588 $299,674

30 2015/2016 remuneration survey
survey findings – workers compensation
search | recruit | sustain 31
claims/im/rtw coordinator/advisorfigure 3
number of sites responsible for
^
51
21- 50
11-20
6-10
2-5
Single
20%
37%
17%6%
15%
3%5%
figure 4
number of direct reports
^
1,001
501-1,000
101-500
26-100
6-25
1-5
None
0%
0%
0%
0%
0%
3%
97%98%
2%
table 1.1
percentage of remuneration packages with vehicles
Vehicles No. Percent
A. Base + Benefits 0 0.00%
B. Total Fixed Remuneration 14 100.00%
Total 14
Overall % 13.33%
Average Value * No Data
* Using Vehicle Formula, including 50% discount for Work Requirement
table 1.2
number with incentives as part of their package
Incentives No. Percent
Percentage with a STI 58 55.24%
Basis of STI
- As a % of Base Salary 47 81.03%
- As a % of Fixed Rem 11 18.97%
Percentage with a LTI 2 1.90%
table 1.3
breakdown of packages by basis of remuneration
Basis of Remuneration No. Percent
A. Base + Benefits 43 40.95%
B. Total Fixed Remuneration 62 59.05%
Total 105
Job Match 100%+ Partial
Percentage* 75.73% 24.27%
Range Earliest Average Latest
Last review date** 1/01/2013 19/05/2015 1/10/2015
* Job Match denotes whether each position matches position descriptions located in Appendix 3
** Last review date denotes range of most recent remuneration review
This year’s TAR of $92,710 represents an increase of 7.7% from last year’s figure of $86,089. While a clear majority of 81% have over five years of experience, only 12% hold a relevant undergraduate (AQF 7) or postgraduate qualification (AQF 8), and 41% hold no formal safety or workers compensation-related qualifications at all. 41% of respondents are self-insured. The majority (53%) have responsibility for a single jurisdiction, and vehicles do not commonly form part of their package at this level (13% of respondents).
Number of Respondents = 105
table 1
remuneration summary for claims/im/rtw coordinator/advisor
Rem. Type Lower Quartile Median Average Upper
Quartile
TFR $80,000 $89,000 $90,172 $99,000
Actual STI $0 $578 $2,539 $6,000
TAR $86,400 $89,154 $92,710 $101,300
Target STI $0 $3,824 $4,090 $6,400
TTR $86,400 $92,015 $94,262 $104,308
table 2scheme sector
Workers Compensation Number Percentage
Self Insured 32 41%
Comcare 21 27%
Conventional State Scheme 25 32%
TOTAL 78 100%
table 3
State Jurisdictions Number Percentage
Single 39 53%
2 - 5 27 36%
6 - 10 8 11%
11 - 20 0 0%
21 - 50 0 0%
> 50 0 0%
TOTAL 74 100%
figure 1
highest relevant qualification
0% 10% 20% 30% 40% 50%
PhD/DOCTORATE
MASTERS
POSTGRAD DIPLOMA/CERTIFICATE
UNDERGRADUATE DEGREE
DIPLOMA/ADVANCED DIPLOMA
CERTIFICATE III OR IV
CERTIFICATE I OR II
NO FORMAL QUALIFICATIONS
0%
0%
2%
10%
26%
21%
0%
41%
figure 2
years of experience
0% 10% 20% 30% 40% 50% 60% 70%
16+
11-15
6-10
3-5
1-2
<1
3%
11%
66%
16%
3%
0%

32 2015/2016 remuneration survey search | recruit | sustain 33
claims/im/workers comp managerfigure 3
number of sites responsible for
^
51
21- 50
11-20
6-10
2-5
Single
16%
68%
5%
11%
figure 4
number of direct reports
^
1,001
501-1,000
101-500
26-100
6-25
1-5
None
0%
0%
0%
0%
0%
3%
97%81%
10%10%
table 1.1
percentage of remuneration packages with vehicles
Vehicles No. Percent
A. Base + Benefits 0 0.00%
B. Total Fixed Remuneration 0 0.00%
Total 0
Overall % 0.00%
Average Value * 0
* Using Vehicle Formula, including 50% discount for Work Requirement
table 1.2
number with incentives as part of their package
Incentives No. Percent
Percentage with a STI 14 66.67%
Basis of STI
- As a % of Base Salary 12 85.71%
- As a % of Fixed Rem 2 14.29%
Percentage with a LTI 1 4.76%
table 1.3
breakdown of packages by basis of remuneration
Basis of Remuneration No. Percent
A. Base + Benefits 9 42.86%
B. Total Fixed Remuneration 12 57.14%
Total 21
survey findings – workers compensation
Job Match 100%+ Partial
Percentage* 85.71% 14.29%
Range Earliest Average Latest
Last review date** 01/02/2015 24/06/2015 01/09/2015
* Job Match denotes whether each position matches position descriptions located in Appendix 3
** Last review date denotes range of most recent remuneration review
Managers at this level see an average TAR of $136,979, an increase of 9.4% on the back of last year’s 6.5% increase. 47% hold relevant qualifications to at least the Diploma (AQF 5) level, with just 6% holding postgraduate (AQF 8) level qualifications. 47% of respondents have no relevant qualifications.The majority (56%) have over ten years of experience, and 68% are responsible for over fifty sites, with 41% responsible for multiple jurisdictions. Most (81%) are leading a small team of 1-5 employees.
Number of Respondents = 21
table 1
remuneration summary for claims/im/workers comp manager
Rem. Type Lower Quartile Median Average Upper
Quartile
TFR $115,721 $117,885 $128,648 $130,000
Actual STI $0 $9,700 $8,332 $13,000
TAR $117,885 $125,421 $136,979 $150,800
Target STI $0 $11,572 $9,696 $20,800
TTR $117,885 $127,293 $138,344 $150,800
table 2
scheme sector
Workers Compensation Number Percentage
Self Insured 9 53%
Comcare 5 29%
Conventional State Scheme 3 18%
TOTAL 17 100%
table 3
State Jurisdictions Number Percentage
Single 10 59%
2 - 5 5 29%
6 - 10 2 12%
11 - 20 0 0%
21 - 50 0 0%
> 50 0 0%
TOTAL 17 100%
figure 1
highest relevant qualification
0% 10% 20% 30% 40% 50%
PhD/DOCTORATE
MASTERS
POSTGRAD DIPLOMA/CERTIFICATE
UNDERGRADUATE DEGREE
DIPLOMA/ADVANCED DIPLOMA
CERTIFICATE III OR IV
CERTIFICATE I OR II
NO FORMAL QUALIFICATIONS
0%
0%
6%
0%
41%
6%
0%
47%
figure 2
years of experience
0% 10% 20% 30% 40% 50% 60%
16+
11-15
6-10
3-5
1-2
<1
6%
50%
39%
6%
0%
0%

34 2015/2016 remuneration survey search | recruit | sustain 35
group/gm workers compensationfigure 3
number of sites responsible for
^
51
21- 50
11-20
6-10
2-5
Single
25%
63%
13%
figure 4
number of direct reports
^
1,001
501-1,000
101-500
26-100
6-25
1-5
None
0%
0%
0%
0%
0%
3%
97%
56%
33%
11%
table 1.1
percentage of remuneration packages with vehicles
Vehicles No. Percent
A. Base + Benefits 1 50.00%
B. Total Fixed Remuneration 1 50.00%
Total 2
Overall % 22.22%
Average Value * $16,800
* Using Vehicle Formula, including 50% discount for Work Requirement
table 1.2
number with incentives as part of their package
Incentives No. Percent
Percentage with a STI 7 77.78%
Basis of STI
- As a % of Base Salary 4 57.14%
- As a % of Fixed Rem 3 42.86%
Percentage with a LTI 1 11.11%
table 1.3
breakdown of packages by basis of remuneration
Basis of Remuneration No. Percent
A. Base + Benefits 4 44.44%
B. Total Fixed Remuneration 5 55.56%
Total 9
survey findings – workers compensation
Job Match 100%+ Partial
Percentage* 75% 25%
Range Earliest Average Latest
Last review date** 01/01/2013 01/04/2014 01/10/2014
* Job Match denotes whether each position matches position descriptions located in Appendix 3
** Last review date denotes range of most recent remuneration review
The average TAR for this category is $180,626, a decrease of 1.5% from $183,346 reported last year. Every respondent has at least a relevant undergraduate degree, with 29% holding a relevant Masters degree. The majority (57%) have over five years of experience, while67% have one or more direct reports. 11% lead a team of six or more. 43% have less than 5 years relevant experience, while 88% have responsibility for 21 or more sites.
Number of Respondents = 9
table 1
remuneration summary for group/gm workers compensation
Rem. Type Lower Quartile Median Average Upper
Quartile
TFR $137,011 $164,000 $162,584 $185,100
Actual STI $0 $21,484 $18,042 $25,500
TAR $137,011 $185,484 $180,626 $209,700
Target STI $14,444 $27,402 $26,286 $30,420
TTR $158,884 $188,600 $188,870 $215,050
table 2
scheme sector
Workers Compensation Number Percentage
Self Insured 4 50%
Comcare 2 25%
Conventional State Scheme 2 25%
TOTAL 8 100%
table 3
State Jurisdictions Number Percentage
Single 1 14%
2 - 5 3 43%
6 - 10 3 43%
11 - 20 0 0%
21 - 50 0 0%
> 50 0 0%
TOTAL 7 100%
figure 1
highest relevant qualification
0% 10% 20% 30% 40% 50%
PhD/DOCTORATE
MASTERS
POSTGRAD DIPLOMA/CERTIFICATE
UNDERGRADUATE DEGREE
DIPLOMA/ADVANCED DIPLOMA
CERTIFICATE III OR IV
CERTIFICATE I OR II
NO FORMAL QUALIFICATIONS
0%
29%
29%
43%
0%
0%
0%
0%
figure 2
years of experience
0%10% 20% 30% 40% 50% 60%
16+
11-15
6-10
3-5
1-2
<1
14%
14%
29%
14%
29%
0%

36 2015/2016 remuneration survey
position analysis by state – workers compensation position analysis by industry– workers compensation
search | recruit | sustain 37
Where the sample number was not sufficient for analysis, individual states have been excluded to prevent identification of company remuneration information and to protect the integrity of the data. A minimum of four respondents is required per state for analysis.
claims/im/rtw coordinator/advisorIndividuals at this level receive the highest TAR in Western Australia for the third year in a row.
Total Fixed Remuneration Total Actual Remuneration Total Target Remuneration
No. Median Average Median Average Median Average
NSW 38 $85,995 $87,646 $86,745 $90,304 $92,015 $92,051
QLD 4 $79,643 $88,943 $82,196 $90,364 $81,555 $90,855
SA 4 $80,000 $80,862 $86,400 $84,062 $86,400 $84,062
VIC 34 $88,500 $87,996 $88,577 $88,934 $89,154 $89,611
WA 25 $95,022 $94,862 $102,960 $99,292 $104,524 $102,044
claims/im/workers comp manager In this category the highest average TAR is in Victoria. New South Wales sees a slight decrease of 2.7% year-on-year while Victoria sees an increase of 9% year-on-year.
Total Fixed Remuneration Total Actual Remuneration Total Target Remuneration
No. Median Average Median Average Median Average
NSW 5 $117,000 $121,888 $125,421 $130,328 $127,293 $130,677
VIC 9 $117,885 $126,210 $125,421 $132,121 $127,293 $134,315
group/gm workers compensationAverage TAR for this position in New South Wales is up 2.7% year-on-year.
Total Fixed Remuneration Total Actual Remuneration Total Target Remuneration
No. Median Average Median Average Median Average
NSW 6 $156,720 $159,592 $173,242 $173,449 $181,917 $182,481
claims/im/rtw coordinator/advisor At the Coordinator/Advisor level, the highest average TAR is within the Resources and Energy sector. The lowest average TAR is in the Government ($82,624) and Other ($80,992) sectors.
Total Fixed Remuneration Total Actual Remuneration Total Target Remuneration
No. Median Average Median Average Median Average
Government 21 $89,154 $82,624 $89,154 $82,624 $89,154 $82,624
Resources and Energy 22 $104,638 $105,541 $111,118 $111,069 $113,352 $115,773
Engineering and Construction 5 $95,300 $94,589 $101,300 $99,574 $95,300 $94,589
Manufacturing 4 $100,000 $97,500 $100,000 $97,500 $100,000 $97,500
Transport 8 $85,995 $85,995 $86,745 $86,745 $92,015 $92,015
Professional Services / Finance / Retail
8 $89,000 $86,412 $93,450 $89,466 $97,900 $92,931
Industrial Services 22 $80,000 $87,692 $86,400 $91,764 $86,400 $92,422
Other 13 $80,140 $80,992 $80,140 $80,992 $80,140 $80,992
claims/im/workers comp managerThe average TAR for positions at this level in the Government sector have increased 7.4% year-on-year and positions in Industrial Services have seen an increase of 8.9% from last year.
Total Fixed Remuneration Total Actual Remuneration Total Target Remuneration
No. Median Average Median Average Median Average
Government 6 $115,721 $122,231 $125,421 $130,314 $127,293 $131,874
Industrial Services 8 $130,000 $125,125 $150,800 $138,125 $150,800 $138,125

38 2015/2016 remuneration survey search | recruit | sustain 39
survey findings – environment
environment advisorfigure 3
number of sites responsible for
^
51
21- 50
11-20
6-10
2-5
Single
7%1%
31%
58%
1%
figure 4
number of direct reports
^
1,001
501-1,000
101-500
26-100
6-25
1-5
None
0%
0%
0%
0%
0%
3%
97%96%
4%
table 1.1
percentage of remuneration packages with vehicles
Vehicles No. Percent
A. Base + Benefits 1 2.56%
B. Total Fixed Remuneration 38 97.44%
Total 39
Overall % 29.10%
Average Value * $30,000
* Using Vehicle Formula, including 50% discount for Work Requirement
table 1.2
number with incentives as part of their package
Incentives No. Percent
Percentage with a STI 125 93.28%
Basis of STI
- As a % of Base Salary 56 44.80%
- As a % of Fixed Rem 69 55.20%
Percentage with a LTI 0 0.00%
table 1.3
breakdown of packages by basis of remuneration
Basis of Remuneration No. Percent
A. Base + Benefits 46 34.33%
B. Total Fixed Remuneration 88 65.67%
Total 134
Job Match 100%+ Partial
Percentage* 82.14% 17.86%
Range Earliest Average Latest
Last review date** 1/09/2012 12/06/2014 1/10/2015
* Job Match denotes whether each position matches position descriptions located in Appendix 3
** Last review date denotes range of most recent remuneration review
Environment Advisors earned an average of TAR of $115,837 this year, which represents a 16.5% increase year-on-year. The average target STI at the Advisor-level within the environmental sector has increased for the second year in a row, from $4,895 to $9,512and STI eligibility increased again this year from 85% to 93%.
Almost all (94%) respondents hold at least an undergraduate degree-level (AQF 7) environmental qualification. The majority of Environmental Advisors have 3-5 years of experience, and for the first time in our survey the majority (58%) of Environmental Advisors are responsible for 2-5 sites. This combination of increased remuneration and increased multi-site responsibility reflects consolidation of the Environmental Advisor role and a move away from enviro-specific resources for single sites.
Site allowance/uplifts are seen across 19.4% of respondents at this level, with an average uplift of $45,548. Site allowances/uplifts are not reflected in TAR figures provided.
Number of Respondents = 134
table 1
remuneration summary for environment advisor
Rem. Type Lower Quartile Median Average Upper
Quartile
TFR $100,000 $111,072 $108,674 $117,718
Actual STI $0 $8,000 $7,163 $11,158
TAR $100,888 $118,371 $115,837 $126,467
Target STI $4,869 $10,740 $9,512 $11,772
TTR $105,000 $121,692 $118,185 $128,382
figure 1
highest environment qualification
0% 10%20%30%40%50%60%70%80%90%
PhD/DOCTORATE
MASTERS
POSTGRAD DIPLOMA/CERTIFICATE
UNDERGRADUATE DEGREE
DIPLOMA/ADVANCED DIPLOMA
CERTIFICATE III OR IV
CERTIFICATE I OR II
NO FORMAL QUALIFICATIONS
0%
2%
8%
86%
2%
2%
0%
2%
figure 2
years of experience
0% 10% 20% 30% 40% 50% 60% 70%
16+
11-15
6-10
3-5
1-2
<1
5%
11%
23%
58%
3%
0%

40 2015/2016 remuneration survey search | recruit | sustain 41
survey findings – environment
sustainability advisorfigure 3
number of sites responsible for
^
51
21- 50
11-20
6-10
2-5
Single
20%
30%
30%
10%
10%
figure 4
number of direct reports
^
1,001
501-1,000
101-500
26-100
6-25
1-5
None
0%
0%
0%
0%
0%
3%
97%100%
table 1.1
percentage of remuneration packages with vehicles
Vehicles No. Percent
A. Base + Benefits 0 0.00%
B. Total Fixed Remuneration 0 0.00%
Total 0
Overall % 0.00%
Average Value * 0
* Using Vehicle Formula, including 50% discount for Work Requirement
table 1.2
number with incentives as part of their package
Incentives No. Percent
Percentage with a STI 8 72.73%
Basis of STI
- As a % of Base Salary 3 37.50%
- As a % of Fixed Rem 5 62.50%
Percentage with a LTI 1 9.09%
table 1.3
breakdown of packages by basis of remuneration
Basis of Remuneration No. Percent
A. Base + Benefits 3 27.27%
B. Total Fixed Remuneration 8 72.73%
Total 11
Job Match 100%+ Partial
Percentage* 66.67% 33.33%
Range Earliest Average Latest
Last review date** 1/09/2012 20/09/2014 1/10/2015
* Job Match denotes whether each position matches position descriptions located in Appendix 3
** Last review date denotes range of most recent remuneration review
Sustainability Advisors received an average TAR of $135,077, a 5.2% increase from our 2013/14 survey findings, and nearly equal to the $136,565 seen in 2012/13. All but 14% of individuals in these roles have at least an undergraduate environment qualification (AQF 7), with 29% holding a relevant Masters degree (AQF 9).
Number of Respondents = 11
table 1
remuneration summary for sustainability advisor
Rem. Type Lower Quartile Median Average Upper
Quartile
TFR $103,725 $134,400 $129,142 $163,429
Actual STI $0 $4,000 $5,935 $11,298
TAR $105,725 $147,495 $135,077 $171,118
Target STI $3,750 $13,440 $11,354 $15,814
TTR $111,600 $147,840 $140,496 $171,272
figure 1
highest environment qualification
0% 10% 20% 30% 40% 50% 60%
PhD/DOCTORATE
MASTERS
POSTGRAD DIPLOMA/CERTIFICATE
UNDERGRADUATE DEGREE
DIPLOMA/ADVANCED DIPLOMA
CERTIFICATE III OR IV
CERTIFICATE I OR II
NO FORMAL QUALIFICATIONS
0%
29%
0%
57%
0%
0%
14%
0%
figure 2
years of experience
0% 10% 20% 30% 40% 50%
16+
11-15
6-10
3-5
1-2
<1
0%
14%
43%
0%
43%
0%

42 2015/2016 remuneration survey
survey findings – environment
search | recruit | sustain 43
environment managerfigure 3
number of sites responsible for
^
51
21- 50
11-20
6-10
2-5
Single
4%
28%
18%
48%
2%
figure 4
number of direct reports
^
1,001
501-1,000
101-500
26-100
6-25
1-5
None
0%
0%
0%
0%
0%
3%
97%
25%
67%
8%
table 1.1
percentage of remuneration packages with vehicles
Vehicles No. Percent
A. Base + Benefits 0 0.00%
B. Total Fixed Remuneration 8 100.00%
Total 8
Overall % 14.04%
Average Value * No Data
* Using Vehicle Formula, including 50% discount for Work Requirement
table 1.2
number with incentives as part of their package
Incentives No. Percent
Percentage with a STI 55 96.49%
Basis of STI
- As a % of Base Salary 33 60.00%
- As a % of Fixed Rem 22 40.00%
Percentage with a LTI 0 0.00%
table 1.3
breakdown of packages by basis of remuneration
Basis of Remuneration No. Percent
A. Base + Benefits 28 49.12%
B. Total Fixed Remuneration 29 50.88%
Total 57
Job Match 100%+ Partial
Percentage* 91.84% 8.16%
Range Earliest Average Latest
Last review date** 1/09/2012 15/08/2014 1/10/2015
* Job Match denotes whether each position matches position descriptions located in Appendix 3
** Last review date denotes range of most recent remuneration review
Environment Managers have seen an 8.6% increase in average TAR, reversing last year’s 6.3% decrease. Almost all of this increase can be attributed to an increase in average Actual STI, which has nearly tripled from $4,205 last year (36% of Target STI) to $11,532 (71.3% of Target STI) this year.
All Environment Managers surveyed are, at a minimum, undergraduate degree qualified, with 14% holding PhD-level (AQF 10) environment qualifications.
Site allowances/uplifts are seen across 12.3% of respondents at this level, with an average uplift between them of $46,142. Uplifts are not reflected in TAR figures provided.
Number of Respondents = 57
table 1
remuneration summary for environment manager
Rem. Type Lower Quartile Median Average Upper
Quartile
TFR $150,000 $160,000 $160,155 $165,450
Actual STI $0 $13,115 $11,532 $15,646
TAR $162,157 $172,180 $171,687 $178,080
Target STI $15,000 $16,204 $16,176 $17,360
TTR $165,380 $173,308 $176,331 $183,063
figure 1
highest environment qualification
0% 20% 40% 60% 80% 100%
PhD/DOCTORATE
MASTERS
POSTGRAD DIPLOMA/CERTIFICATE
UNDERGRADUATE DEGREE
DIPLOMA/ADVANCED DIPLOMA
CERTIFICATE III OR IV
CERTIFICATE I OR II
NO FORMAL QUALIFICATIONS
14%
0%
5%
81%
0%
0%
0%
0%
figure 2
years of experience
0% 10% 20% 30% 40% 50% 60%
16+
11-15
6-10
3-5
1-2
<1
24%
24%
48%
5%
0%
0%

44 2015/2016 remuneration survey
survey findings – environment
search | recruit | sustain 45
national environment managerfigure 3
number of sites responsible for
^
51
21- 50
11-20
6-10
2-5
Single
36%
14%7%
43%
figure 4
number of direct reports
^
1,001
501-1,000
101-500
26-100
6-25
1-5
None
0%
0%
0%
0%
0%
3%
97%57%
21% 21%
table 1.1
percentage of remuneration packages with vehicles
Vehicles No. Percent
A. Base + Benefits 8 100.00%
B. Total Fixed Remuneration 0 0.00%
Total 8
Overall % 57.14%
Average Value * $21,763
* Using Vehicle Formula, including 50% discount for Work Requirement
table 1.2
number with incentives as part of their package
Incentives No. Percent
Percentage with a STI 10 71.43%
Basis of STI
- As a % of Base Salary 9 90.00%
- As a % of Fixed Rem 1 10.00%
Percentage with a LTI 2 14.29%
table 1.3
breakdown of packages by basis of remuneration
Basis of Remuneration No. Percent
A. Base + Benefits 10 71.43%
B. Total Fixed Remuneration 4 28.57%
Total 14
Job Match 100%+ Partial
Percentage* 85.71% 14.29%
Range Earliest Average Latest
Last review date** 1/10/2014 12/03/2015 1/09/2015
* Job Match denotes whether each position matches position descriptions located in Appendix 3
** Last review date denotes range of most recent remuneration review
Average TAR for National Environment Managers has increased by 22.1% from $185,103 to $225,937 year-on-year. As with the other environmental roles, some portion of this growth comes from higher STIs being paid out this year. Average TFR year-on-year has increased by 14.6%, whereas average Actual STI has increased nearly 250%, from $6,071 to $20,793 – more than 100% of Actual STI due to some ‘stretch’ targets being hit.
The majority of respondents (71%) at this level have 11+ years of experience, and 79% have one or more direct reports.
Number of Respondents = 14
table 1
remuneration summary for national environment manager
Rem. Type Lower Quartile Median Average Upper
Quartile
TFR $168,873 $213,650 $205,145 $235,087
Actual STI $2,500 $22,914 $20,793 $31,278
TAR $176,250 $238,392 $225,937 $269,075
Target STI $5,324 $22,391 $18,147 $24,241
TTR $186,875 $235,175 $223,292 $258,596
figure 1
highest environment qualification
0% 10% 20% 30% 40% 50% 60%
PhD/DOCTORATE
MASTERS
POSTGRAD DIPLOMA/CERTIFICATE
UNDERGRADUATE DEGREE
DIPLOMA/ADVANCED DIPLOMA
CERTIFICATE III OR IV
CERTIFICATE I OR II
NO FORMAL QUALIFICATIONS
0%
0%
14%
57%
0%
0%
14%
14%
figure 2
years of experience
0% 10% 20% 30% 40% 50% 60%
16+
11-15
6-10
3-5
1-2
<1
14%
57%
14%
14%
0%
0%

46 2015/2016 remuneration survey search | recruit | sustain 47
survey findings – environment
head of environment & sustainabilityfigure 3
number of sites responsible for
^
51
21- 50
11-20
6-10
2-5
Single
8%
8%67%
17%
figure 4
number of direct reports
^
1,001
501-1,000
101-500
26-100
6-25
1-5
None
0%
0%
0%
0%
0%
3%
97%
14%
57%
29%
table 1.1
percentage of remuneration packages with vehicles
Vehicles No. Percent
A. Base + Benefits 1 50.00%
B. Total Fixed Remuneration 1 50.00%
Total 2
Overall % 14.29%
Average Value * $22,300
* Using Vehicle Formula, including 50% discount for Work Requirement
table 1.2
number with incentives as part of their package
Incentives No. Percent
Percentage with a STI 14 100.00%
Basis of STI
- As a % of Base Salary 6 42.86%
- As a % of Fixed Rem 8 57.14%
Percentage with a LTI 3 21.43%
table 1.3
breakdown of packages by basis of remuneration
Basis of Remuneration No. Percent
A. Base + Benefits 4 28.57%
B. Total Fixed Remuneration 10 71.43%
Total 14
Job Match 100%+ Partial
Percentage* 69.23% 30.77%
Range Earliest Average Latest
Last review date** 1/09/2012 1/04/2015 1/10/2015
* Job Match denotes whether each position matches position descriptions located in Appendix 3
** Last review date denotes range of most recent remuneration review
The average TAR for Heads of Environment and Sustainability has increased by 9% this year, from $268,177 to $292,267. STIs have again been largely paid out, with average Actual STI this year landing at 70% of average Target STI for this group. The increase this year is largely the result of an increase in TFR across the positions, from an average TFR of $229,329 last year (a three year low) to a TFR of 261,363 this year, slightly below the $261,667 figure reported three years ago in our 2012/13 survey.
This year 29% of respondents in this category have no direct reports, up from 11% reported in the two previous years.
Number of Respondents = 14
table 1
remuneration summary for head of environment & sustainability
Rem. Type Lower Quartile Median Average Upper
Quartile
TFR $206,750 $258,721 $261,363 $304,750
Actual STI $11,000 $30,700 $30,904 $36,168
TAR $223,000 $289,580 $292,267 $343,750
Target STI $25,667 $34,170 $44,091 $63,500
TTR $234,925 $286,058 $305,454 $381,000
figure 1
highest environment qualification
0% 10% 20% 30% 40% 50%
PhD/DOCTORATE
MASTERS
POSTGRAD DIPLOMA/CERTIFICATE
UNDERGRADUATE DEGREE
DIPLOMA/ADVANCED DIPLOMA
CERTIFICATE III OR IV
CERTIFICATE I OR II
NO FORMAL QUALIFICATIONS
0%
20%
20%
40%
0%
0%
0%
20%
figure 2
years of experience
0% 10% 20% 30% 40% 50% 60% 70%
16+
11-15
6-10
3-5
1-2
<1
60%
20%
10%
10%
0%
0%

48 2015/2016 remuneration survey search | recruit | sustain 49
position analysis by industry – environment
Where the sample number was not sufficient for analysis, individual states have been excluded to prevent identification of company remuneration information and to protect the integrity of the data. A minimum of four respondents is required per state for analysis.
environment advisorAverage TAR for Environment Advisors in Victoria has decreased by 0.8% on the back of last year’s 7.1% drop, while in NSW average TAR has again increased very slightly by 1.1% following on from last year’s marginal increase of 0.5%. Queensland has seen a significant increase this year (up 41.1%), moving to become the second highest state from last place last year. Western Australia has also seen a significant year-on-year increase of 18.6%.
Total Fixed Remuneration Total Actual Remuneration Total Target Remuneration
No. Median Average Median Average Median Average
NSW 15 $105,850 $107,940 $115,350 $111,743 $121,728 $118,043
QLD 36 $105,653 $106,682 $117,782 $118,642 $118,331 $118,518
SA 4 $105,000 $107,000 $105,000 $107,000 $110,250 $112,350
VIC 18 $100,000 $101,644 $100,000 $102,260 $104,750 $106,902
WA 58 $112,445 $111,408 $122,778 $119,360 $123,226 $121,222
sustainability advisorSustainability advisors in Victoria see an average TAR of $137,800, up 11.9% from our 2013/14 survey findings. As is the case with previous years’ surveys, a very small proportion (1.3%) of Sustainability Advisors’ TAR comes from STI.
Total Fixed Remuneration Total Actual Remuneration Total Target Remuneration
No. Median Average Median Average Median Average
VIC 5 $150,000 $136,000 $150,000 $137,800 $157,500 $145,750
environment manager At the Environment Manager level, those in New South Wales have seen a decrease in average TAR of 2.6%. In Victoria, average TAR has increased by 4.8% to $155,627. Queensland has seen a rebound from last year’s significant drop, with average TAR increasing year-on-year by 9.7%, although it still remains below the peak of $183,473 seen two years ago. Similarly, after last year’s decrease of 19.3% in Western Australia, there has been a modest increase in average TAR of 4.7%.
Total Fixed Remuneration Total Actual Remuneration Total Target Remuneration
No. Median Average Median Average Median Average
NSW 9 $158,000 $158,673 $167,109 $164,492 $176,308 $173,528
QLD 12 $148,354 $159,534 $173,120 $178,446 $169,108 $181,165
VIC 5 $163,955 $154,307 $163,955 $155,627 $168,300 $164,458
WA 29 $162,636 $163,185 $175,170 $175,991 $178,899 $178,952
national environment managerNational Environment Managers in Western Australia see an average TAR of $259,600, 14.9% above the national average of $225,937.
Total Fixed Remuneration Total Actual Remuneration Total Target Remuneration
No. Median Average Median Average Median Average
WA 8 $228,152 $228,080 $258,128 $259,660 $250,967 $252,138
head of environment and sustainability Comparing this year’s results with those from safesearch’s 2011/2012 survey (the last year for which directly comparable data is available in sufficient quantity), average TAR for Heads of Environment and Sustainability in Victoria have decreased by 10.1%. In New South Wales, those in the same function have seen a 6.7% increase.
Total Fixed Remuneration Total Actual Remuneration Total Target Remuneration
No. Median Average Median Average Median Average
NSW 6 $264,968 $247,439 $289,580 $283,043 $291,462 $294,694
VIC 4 $240,805 $252,903 $249,305 $268,903 $264,886 $288,943
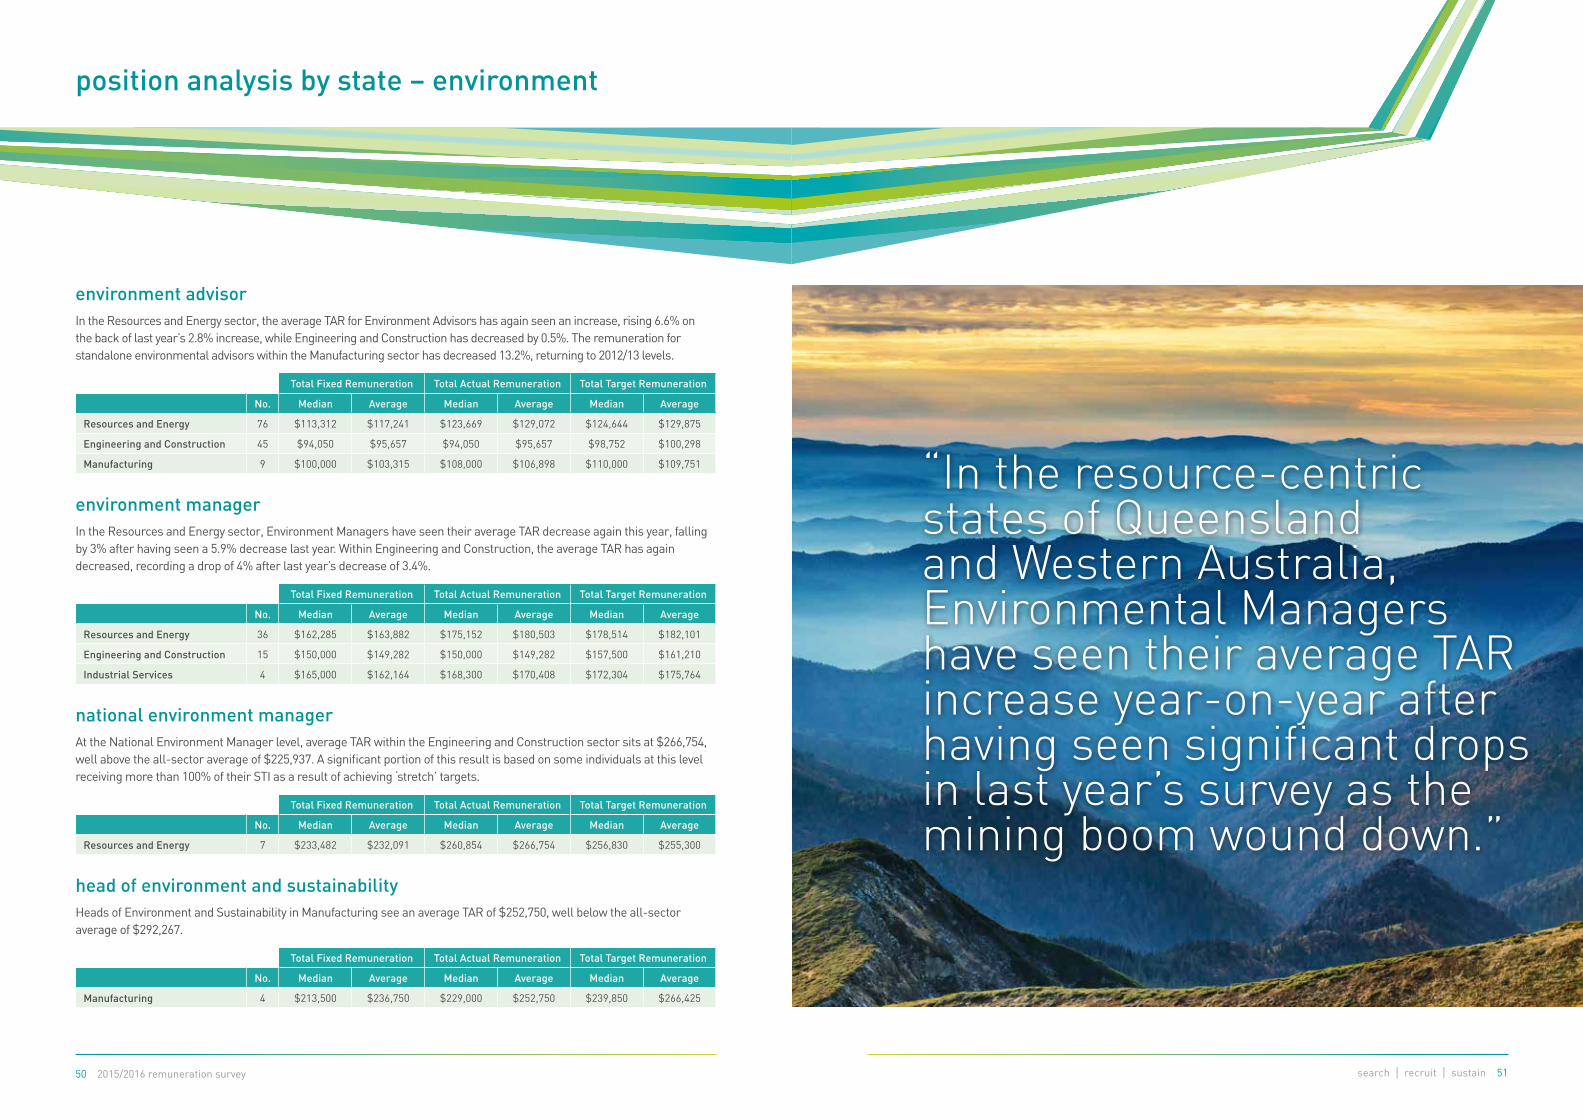
50 2015/2016 remuneration survey search | recruit | sustain 51
position analysis by state – environment
environment advisor In the Resources and Energy sector, the average TAR for Environment Advisors has again seen an increase, rising 6.6% on the back of last year’s 2.8% increase, while Engineering and Construction has decreased by 0.5%. The remuneration for standalone environmental advisors within the Manufacturing sector has decreased 13.2%, returning to 2012/13 levels.
Total Fixed Remuneration Total Actual Remuneration Total Target Remuneration
No. Median Average Median Average Median Average
Resources and Energy 76 $113,312 $117,241 $123,669 $129,072 $124,644 $129,875
Engineering and Construction 45 $94,050 $95,657 $94,050 $95,657 $98,752 $100,298
Manufacturing 9 $100,000 $103,315 $108,000 $106,898 $110,000 $109,751
environment managerIn the Resources and Energy sector, Environment Managers have seen their average TAR decrease again this year, falling by 3% after having seen a 5.9% decrease last year. Within Engineering and Construction, the average TAR has again decreased, recording a drop of 4% after last year’s decrease of 3.4%.
Total Fixed Remuneration Total Actual Remuneration Total Target Remuneration
No. Median Average Median Average Median Average
Resources and Energy 36 $162,285 $163,882 $175,152 $180,503 $178,514 $182,101
Engineering and Construction 15 $150,000 $149,282 $150,000 $149,282 $157,500 $161,210
Industrial Services 4 $165,000 $162,164 $168,300 $170,408 $172,304 $175,764
national environment managerAt the National Environment Manager level, average TAR within the Engineering and Construction sector sits at $266,754, well above the all-sector average of $225,937. A significant portion of this result is based on some individuals at this level receiving more than 100% of their STI as a result of achieving ‘stretch’ targets.
Total Fixed Remuneration Total Actual Remuneration Total Target Remuneration
No. Median Average Median Average Median Average
Resources and Energy 7 $233,482 $232,091 $260,854 $266,754 $256,830 $255,300
head of environment and sustainabilityHeads of Environment and Sustainability in Manufacturing see an average TAR of $252,750, well below the all-sector average of $292,267.
Total Fixed Remuneration Total Actual Remuneration Total Target Remuneration
No. Median Average Median Average Median Average
Manufacturing 4 $213,500 $236,750 $229,000 $252,750 $239,850 $266,425
“In the resource-centric states of Queensland and Western Australia, Environmental Managers have seen their average TAR increase year-on-year after having seen significant drops in last year’s survey as the mining boom wound down.”

52 2015/2016 remuneration survey
survey findings – new zealand
search | recruit | sustain 53
whs/hse advisor/coordinatorfigure 3
number of sites responsible for
^
51
21- 50
11-20
6-10
2-5
Single
5%5%
37%
53%
figure 4
number of direct reports
^
51
21- 50
11-20
6-10
2-5
Single
5%
95%
table 1.1
percentage of remuneration packages with vehicles
Vehicles No. Percent
A. Base & Salary 4 100.00%
B. Total Fixed Remuneration 0 0.00%
Total 4
Overall % 20.00%
Average Value * $18,350
* Using Vehicle Formula, including 50% discount for Work Requirement
table 1.2
number with incentives as part of their package
Incentives No. Percent
Percentage with a STI 8 40.00%
Basis of STI
- As a % of Base Salary 1 12.50%
- As a % of Fixed Rem 7 87.50%
Percentage with a LTI 0 0.00%
table 1.3
breakdown of packages by basis of remuneration
Basis of Remuneration No. Percent
A. Base & Benefits 7 35.00%
B. Total Fixed Remuneration 13 65.00%
Total 20
Job Match 100%+ Partial
Percentage* 68.42% 31.58%
Range Earliest Average Latest
Last review date** 01/01/2012 24/05/2015 01/10/2015
* Job Match denotes whether each position matches position descriptions located in Appendix 3
** Last review date denotes range of most recent remuneration review
The average TAR for WHS/HSE Advisor/Coordinators in New Zealand this year is $95,310, a 1.7% increase from last year’s figure of $93,719. While average TFR has decreased very slightly year-on-year (-0.6%), this has been offset by a significant increase in Actual STIs paid out, from $679 last year to $2,113 this year.
The majority (58%) have between 3-5 years of experience, while 51% hold a Diploma (NZQA 5) level or higher safety qualification, an increase from 34% last year.
Number of Respondents = 20
table 1
remuneration summary for whs/hse advisor/coordinator
Rem. Type Lower Quartile Median Average Upper
Quartile
TFR $83,000 $85,000 $92,518 $94,100
Actual STI $0 $0 $2,792 $5,810
TAR $85,000 $88,810 $95,310 $94,100
Target STI $0 $0 $3,209 $5,810
TTR $85,000 $88,810 $95,728 $94,100
All figures for New Zealand roles are in NZD
figure 1
highest safety qualification
0% 10% 20% 30% 40% 50% 60%
PhD/DOCTORATE
MASTERS
POSTGRAD DIPLOMA/CERTIFICATE
UNDERGRADUATE DEGREE
DIPLOMA/ADVANCED DIPLOMA
CERTIFICATE III OR IV
CERTIFICATE I OR II
NO FORMAL QUALIFICATIONS
0%
0%
13%
0%
38%
50%
0%
0%
figure 2
years of experience
0% 10% 20% 30% 40% 50% 60% 70%
16+
11-15
6-10
3-5
1-2
<1
0%
5%
21%
58%
16%
0%

54 2015/2016 remuneration survey search | recruit | sustain 55
survey findings – new zealand
whs/hse managerfigure 3
number of sites responsible for
^
51
21- 50
11-20
6-10
2-5
Single
8%
17%
58%
17%
figure 4
number of direct reports
^
51
21- 50
11-20
6-10
2-5
Single
83%
17%
table 1.1
percentage of remuneration packages with vehicles
Vehicles No. Percent
A. Base & Salary 3 100.00%
B. Total Fixed Remuneration 0 0.00%
Total 3
Overall % 25.00%
Average Value * $17,667
* Using Vehicle Formula, including 50% discount for Work Requirement
table 1.2
number with incentives as part of their package
Incentives No. Percent
Percentage with a STI 5 41.67%
Basis of STI
- As a % of Base Salary 5 100.00%
- As a % of Fixed Rem 0 0.00%
Percentage with a LTI 0 0.00%
table 1.3
breakdown of packages by basis of remuneration
Basis of Remuneration No. Percent
A. Base & Benefits 10 83.33%
B. Total Fixed Remuneration 2 16.67%
Total 12
Job Match 100%+ Partial
Percentage* 63.64% 36.36%
Range Earliest Average Latest
Last review date** 01/01/2015 12/07/2015 01/10/2015
* Job Match denotes whether each position matches position descriptions located in Appendix 3
** Last review date denotes range of most recent remuneration review
The average TAR for WHS/HSE Managers in New Zealand is $131,432. This includes an average STI of $4,067. This represents a decrease of 6.5. % from last year’s average TAR of $140,587.
The majority (83%) are qualified to the Diploma (NZQF 5) level or greater, with 33% holding undergraduate degree-level (NZQF 8) safety qualifications. All respondents have multi-site responsibility, but only 17% have direct reports.
Number of Respondents = 12
table 1
remuneration summary for whs/hse manager
Rem. Type Lower Quartile Median Average Upper
Quartile
TFR $118,875 $120,000 $127,365 $127,969
Actual STI $0 $0 $4,067 $1,601
TAR $120,000 $125,000 $131,432 $137,596
Target STI $0 $0 $6,654 $14,081
TTR $120,000 $128,728 $134,019 $146,386
All figures for New Zealand roles are in NZD
figure 1
highest safety qualification
0% 10% 20% 30% 40% 50% 60%
PhD/DOCTORATE
MASTERS
POSTGRAD DIPLOMA/CERTIFICATE
UNDERGRADUATE DEGREE
DIPLOMA/ADVANCED DIPLOMA
CERTIFICATE III OR IV
CERTIFICATE I OR II
NO FORMAL QUALIFICATIONS
0%
0%
0%
33%
50%
0%
17%
0%
figure 2
years of experience
0% 10% 20% 30% 40% 50% 60%
16+
11-15
6-10
3-5
1-2
<1
8%
50%
25%
17%
0%
0%

56 2015/2016 remuneration survey search | recruit | sustain 57
national whs/hse managerfigure 3
number of sites responsible for
^
51
21- 50
11-20
6-10
2-5
Single
16%
37%
32%
5%
5%5%
figure 4
number of direct reports
^
51
21- 50
11-20
6-10
2-5
Single74%
16%11%
table 1.1
percentage of remuneration packages with vehicles
Vehicles No. Percent
A. Base & Salary 4 66.67%
B. Total Fixed Remuneration 2 33.33%
Total 6
Overall % 30.00%
Average Value * $16,224
* Using Vehicle Formula, including 50% discount for Work Requirement
table 1.2
number with incentives as part of their package
Incentives No. Percent
Percentage with a STI 14 70.00%
Basis of STI
- As a % of Base Salary 13 92.86%
- As a % of Fixed Rem 1 7.14%
Percentage with a LTI 3 15.00%
table 1.3
breakdown of packages by basis of remuneration
Basis of Remuneration No. Percent
A. Base & Benefits 9 45.00%
B. Total Fixed Remuneration 11 55.00%
Total 20
Job Match 100%+ Partial
Percentage* 61.54%38.46% 38.46%
Range Earliest Average Latest
Last review date** 01/02/2015 27/07/2015 01/10/2015
* Job Match denotes whether each position matches position descriptions located in Appendix 3
** Last review date denotes range of most recent remuneration review
National WHS/HSE Managers in New Zealand have an average TAR of $176,467. This includes an Actual STI of $12,081. At this level 90% are qualified to Diploma-level (NZQF 5) or higher.
Number of Respondents = 20
table 1
remuneration summary for national whs/hse manager
Rem. Type Lower Quartile Median Average Upper
Quartile
TFR $144,750 $157,900 $164,990 $198,000
Actual STI $0 $9,000 $12,081 $20,320
TAR $153,680 $159,500 $176,467 $210,329
Target STI $0 $17,660 $19,424 $36,150
TTR $153,680 $172,250 $184,414 $216,900
All figures for New Zealand roles are in NZD
figure 1
highest safety qualification
0% 10% 20% 30% 40% 50%
PhD/DOCTORATE
MASTERS
POSTGRAD DIPLOMA/CERTIFICATE
UNDERGRADUATE DEGREE
DIPLOMA/ADVANCED DIPLOMA
CERTIFICATE III OR IV
CERTIFICATE I OR II
NO FORMAL QUALIFICATIONS
0%
10%
25%
40%
15%
5%
0%
5%
figure 2
years of experience
0% 10% 20% 30% 40% 50% 60% 70%
16+
11-15
6-10
3-5
1-2
<1
0%
37%
58%
5%
0%
0%
survey findings – new zealand

58 2015/2016 remuneration survey search | recruit | sustain 59
general manager whs/hsefigure 3
number of sites responsible for
^
51
21- 50
11-20
6-10
2-5
Single
70%
20%
10%
figure 4
number of direct reports
^
51
21- 50
11-20
6-10
2-5
Single63%
13%
25%
table 1.1
percentage of remuneration packages with vehicles
Vehicles No. Percent
A. Base & Salary 2 100.00%
B. Total Fixed Remuneration 0 0.00%
Total 2
Overall % 18.18%
Average Value * $22,500
* Using Vehicle Formula, including 50% discount for Work Requirement
table 1.2
number with incentives as part of their package
Incentives No. Percent
Percentage with a STI 5 45.45%
Basis of STI
- As a % of Base Salary 4 80.00%
- As a % of Fixed Rem 1 20.00%
Percentage with a LTI 4 36.36%
table 1.3
breakdown of packages by basis of remuneration
Basis of Remuneration No. Percent
A. Base & Benefits 7 63.64%
B. Total Fixed Remuneration 4 36.36%
Total 11
Job Match 100%+ Partial
Percentage* 81.82% 18.18%
Range Earliest Average Latest
Last review date** 01/11/2014 1/06/2015 01/10/2015
* Job Match denotes whether each position matches position descriptions located in Appendix 3
** Last review date denotes range of most recent remuneration review
In New Zealand the GM WHS/HSE role has an average TAR of $285,907. This includes an Actual STI of $20,440. 87% of individuals in this function have one or more direct reports.
Number of Respondents = 11
table 1
remuneration summary for national whs/hse manager
Rem. Type Lower Quartile Median Average Upper
Quartile
TFR $236,699 $259,780 $265,467 $288,480
Actual STI $0 $0 $20,440 $32,500
TAR $241,699 $294,780 $285,907 $309,480
Target STI $0 $41,544 $48,374 $69,750
TTR $241,699 $312,000 $313,841 $341,250
All figures for New Zealand roles are in NZD
figure 1
highest safety qualification
0% 10% 20% 30% 40%
PhD/DOCTORATE
MASTERS
POSTGRAD DIPLOMA/CERTIFICATE
UNDERGRADUATE DEGREE
DIPLOMA/ADVANCED DIPLOMA
CERTIFICATE III OR IV
CERTIFICATE I OR II
NO FORMAL QUALIFICATIONS
11%
11%
33%
22%
11%
0%
0%
11%
figure 2
years of experience
0% 10% 20% 30% 40% 50% 60%
16+
11-15
6-10
3-5
1-2
<1
20%
50%
30%
0%
0%
0%
survey findings – new zealand

60 2015/2016 remuneration survey search | recruit | sustain 61
appendix 1
methodology168 companies submitted data for this survey, including many of Australia’s largest employers of WHS/HSE and Environmental professionals. There are a total of 1,334 individuals covered in this year’s survey. The list of participating organisations can be found at the front of this report. Some organisations preferred not to be named.
All Health Safety and Environment positions had sufficient position matches to obtain meaningful market comparisons (i.e. medians and/or quartiles). The survey has provided valid results with sample sizes ranging from 9 to 436 with a mean sample size of approximately 78 per role. Where the sample size is insufficient in the geographical and industry breakdowns we have omitted analysis to ensure confidentiality. The data in this report should be read in the context of other market remuneration data available for a comprehensive summary of market remuneration trends.
The survey was conducted and data collected from September to November 2015.
The survey utilised a job matching approach, where standard role descriptions covering Health Safety, Workers Compensation and Environment positions were provided to participating organisations to match their equivalent roles. Each role description contained a purpose, key accountabilities, person specification and key role dimensions (approximate budgets, staff reporting etc).
“We are committed to further contribution in this space. Our hope is that we can continue to contribute to a better informed and engaged workforce – one that is better enabled to reduce harm and manage assets and operations in a sustainable fashion, while placing an increased focus on people risk and the potential impacts that will arise if such risks are not properly managed.”Aaron NeilsonGeneral Manager, safesearch

62 2015/2016 remuneration survey search | recruit | sustain 63
appendix 3
position profiles
WHS/HSE Officer
Key Purpose To support a safe work environment by effectively using a range of WHS tools and processes to implement WHS programs and drive compliance.
Typical Key Dimensions No. employees on site(s) responsible for: 50 - 300 No. sites: 1 No. staff Reporting: Nil No. Dotted line Reports: NilNB: The above ranges of dimensions are based on large organisations. If your company falls outside these ranges, please indicate this on the data sheet.
Reports to WHS/HSE Manager in larger organisations. In SME may report to manager/CEO with advice provided by contracted consultant.
Alternative Titles Safety Officer
Key Accountabilities Planning- Assist with implementing the SME/division’s WHS plans and strategies.Operational activities - Encourage the prompt reporting of hazards and incidents. - Support management and staff awareness of WHS responsibilities and accountabilities. - Contribute to WHS consultation processes.- Support and encourage workplace parties in fostering a positive WHS culture. - Undertake hazard identification, inspections, Job Safety Analyses. - Contribute to recommendation for prevention of workplace fatality, injury disease an ill health. - Support and contribute to implementation of activities prevent workplace fatality, injury disease an ill
health.- Support and participate in incident and emergency response processes.- Monitor compliance with workplace policies and procedures including by contractors. - Assist in addressing actions identified in SMS and other audits. Engagement - Engage with and support HSRs, WHS committees and supervisors. - Liaise with relevant authorities regarding WHS Issues.Training - Conduct safety inductions. - Conduct local topic specific training including tool box talks.Administration/Reporting - Maintain WHS records including hazard and risk registers and other manifests.- Manage WHS information system.- Compile work injury/illness statistics.Staff management - Nil
Qualifications WHS Diploma (VET). Certified WHS Practitioner.
Typical experience 1-3 years.
appendix 2
definitions and assumptionsThere are three types of remuneration analysed in this survey:
Remuneration Type Definition
Total Fixed Remuneration (TFR) The non-variable component of a role’s remuneration. Includes base salary, superannuation, vehicles and other benefits, including any FBT payable.
Total Actual Remuneration (TAR) The actual remuneration received in the previous 12 months. Included TFR plus any short term incentive (STI) payments actually received in the past year.
Total Target Remuneration (TTR) The total remuneration which will be received if the incumbent meets their KPIs at target performance levels. This is the sum of the TFR and the STI assuming targets are met at 100% levels.
The data is reported using the following statistical definitions:
Statistic Definition
Lower Quartile 25% of the sample is below the lower quartile and 75% above.
Lower quartiles have not been reported for sample sizes less than 4*.
Median 50% of the sample is below the median and 50% above.
Medians have not been reported for sample sizes of less than 4*.
Average This is the mean of the entire sample.
Averages have not been reported for sample sizes of less than 4*.
Upper Quartile 75% of the sample is below the upper quartile and 25% above.
Upper quartiles have not been reported for sample sizes less than 4*.
Note: * This is to ensure no individual is identifiable in the results and only valid statistics are reported.
Participants were asked if they based their remuneration policy on “Base + Benefits” or a Total Fixed Remuneration (TFR) approach where benefits are salary sacrificed. Where a ‘Base + Benefits’ approach applied, the Base Salary and Benefits were totalled to find the equivalent TFR, which is used in the survey to compare remuneration.
Participants were asked to provide two short term incentive (STI) figures: (i) the Actual amount paid at the last review date and (ii) the Target STI, if performance is at 100% of expectation at the next review. These results were used to calculate the Total Actual Remuneration (TAR) and the Total Target Remuneration (TTR).
Survey Results for Positions Submitted
Of the roles surveyed, all positions had sufficient data to have a statistically valid analysis. Data presented contains an overview on each of the positions. The following information should be noted when interpreting the tables:
• Total Actual Remuneration – This is likely understated as a small percentage of companies did not provide the Actual STI paid in the past year: in some cases no incentive payment was made as targets were not reached however due to a high level of movement in many cases it was related to new hires not yet being eligible for STIs.
• Qualifications and Years of Experience – – In some cases the number of respondents in these categories will be less than the total number of respondents that submitted data for the remuneration category. This relates to the data not being easily obtained or the companies not providing this detail.
• For clarity and where appropriate, when the survey results have been expressed as a %, these figures have been rounded to the nearest number.

64 2015/2016 remuneration survey search | recruit | sustain 65
WHS/HSE Manager
Key Purpose To support development and maintenance of a safe work environment by applying WHS skills and knowledge of the WHS evidence base to develop, implement and evaluate WHS strategy and programs.Solve WHS problems based on conceptual and technical knowledge, analysis of evidence and critical thought mediated by experience.
Typical Key Dimensions No. employees on site(s) responsible for: 300 – 2,000No. of sites: 2 - 5No staff Reporting: 1 - 5No Dotted line Reports: 1 - 10 NB: The above ranges of dimensions are based on large organisations. If your company falls outside these ranges, please indicate this on the data sheet.
Reports to National WHS manager.Smaller organisations MD/CEO. Operations Manager.HR Manager.
Alternative Titles Health and Safety Manager WHS Manager
Key Accountabilities Planning- Establish WHS management plan for the division which supports the organisation-wide WHS plan. Operational activities - Provide WHS specialist advice, technical and management support to the commercial business
units(s)/division.- Undertake risk assessment of more complex tasks. - Develop and implement strategies to prevent and minimise workplace fatality, injury, disease and ill
health.- Develop and/or implement the SMS processes.- Support managers in activities foster a positive WHS culture. - Coordinate and manage the audit program for divisional operations and ensure that identified issues
are integrated into the business and site WHS plans.- Evaluate auditing and incident investigation procedures. - Establish and implement procedures for safety/risk management and emergencies.- Ensure the business’ division’s WHS activities and operations are conducted in compliance with
applicable laws, regulations and company code.- Conduct investigations into workplace incidents. - Support organisational change within area of control to achieve WHS objectives and strategy.Engagement - Engage with site management teams to ensure that WHS roles, responsibilities and expectations are
understood by all. - Engage with and support site based WHS practitioners. - Consult and communicate with all levels of stakeholders.- Liaise with relevant authorities regarding WHS issues. Training - Conduct WHS training needs analysis.- Develop/commission WHS training to address identified needs.- Implement, monitor and evaluate effectiveness of WHS training. - Support and coach operational managers and site-based WHS staff.- Ensure divisional induction covers staff’s WHS/HSE accountabilities and new managers are coached
on their WHS/HSE responsibilitiesAdministration/Reporting - Ensure maintenance of appropriate WHS records.- Ensure appropriate compilation, analysis and reporting of work injury/ illness statistics. Staff Management - Manage and provide regular feedback to ensure appropriate action and development of all direct
reports.- Build strong relationships with ‘dotted line’ reports and their managers to ensure their WHS advice,
competence and knowledge is up to date.
Qualifications - Tertiary WHS qualifications.- Certified WHS Professional.
Typical experience 5-10 years.
Note: Where the term “division” is used, this could represent the whole organization for smaller to medium size companies (i.e. under 1,000 employees)
WHS/HSE Advisor/Coordinator
Key Purpose To contribute to maintenance of a safe work environment by effectively using a range of WHS tools and processes to implement WHS programs and drive compliance.
Typical Key Dimensions No. employees on site(s) responsible for: 50 - 300 No. of sites: 1-2 No. staff Reporting: Nil No. Dotted line Reports: NilNB: The above ranges of dimensions are based on large organisations. If your company falls outside these ranges, please indicate this on the data sheet.
Reports to WHS/HSE manager in larger organisations. In SME may report to manager/CEO with advice provided by contracted consultant.
Alternative Titles WHS Advisor
Key Accountabilities Planning- Assist with implementing the division’s WHS plans and strategies. Operational activities - Encourage the prompt reporting of hazards and incidents.- Support management and staff awareness of WHS responsibilities and accountabilities.- Contribute to and support WHS consultation and participation processes. - Support and encourage workplace parties in fostering a positive WHS culture. - Coordinate and undertake hazard identification, inspections, Job Hazard Analyses. - Undertake risk assessment of non complex tasks. - Develop and document procedures and safe work method statements.- Coordinate and contribute to implementation of activities prevent workplace fatality, injury disease
an ill health.- Monitor compliance with workplace policies and procedures including conducting workplace audits
of contractors. - Coordinate and participate in incident and emergency response.- Conduct/participate in investigations into workplace incidents. - Assist in the evaluation of auditing and incident investigation procedures.- Assist in implementing actions resulting from SMS and other audits.Engagement - Engage with and support HSRs, WHS committees, supervisors and managers. - Liaise with relevant authorities regarding WHS.Training - Design and conduct safety inductions.- Develop and conduct local topic specific training.- Support/mentor HSRs and supervisors.Administration/Reporting - Maintain WHS records including hazard and risk registers and other manifests.- Manage WHS information system.- Compile, analyse and report work injury/illness statistics.Staff Management - Nil
Qualifications - WHS Diploma/Advanced Diploma (VET).- Tertiary WHS qualifications.- Certified WHS Practitioner/Certified WHS Professional.
Typical experience: 3-5 years

66 2015/2016 remuneration survey search | recruit | sustain 67
General Manager WHS/HSE
Key Purpose To initiate, develop and maintain a safe work environment by applying high level strategic and/or specialist skills to work with Boards, executives, senior managers and others to lead, plan and drive WHS strategies and programs across the organisation.
Typical Key Dimensions No. employees on site(s) responsible for: 2,000 – 5,000 Number of sites: 11 - 50No of staff Reporting: 11 - 50No of dotted line Reports: 20 – 50NB: The above ranges of dimensions are based on large organisations. If your company falls outside these ranges, please indicate this on the data sheet.
Reports to Global Head of Health Safety and Environment (in multi-national organisations) CEOGM Human Resources GM Risk
Alternative Titles Head of Health and Safety Group Health and Safety ManagerDirector of Health, Safety and Environment
Key accountabilities Planning- Develop and implement the WHS strategy and high level annual plans for the entire business. - Develop and implement succession plans for the members of the WHS senior management.Operational activities - Provide leadership, vision, WHS specialist and managerial support across the organisation to
manage WHS to minimise fatalities, injuries, disease and ill- health.- Oversee the design and implementation of robust and fit-for-purpose WHS management systems. - Advise senior and operational managers on appropriate strategies and activities to foster a positive
WHS culture.- Lead organisational change to drive a positive safety culture and achieve WHS objectives and
strategy. - Ensure the business’ WHS activities and operations are conducted in compliance with applicable
laws, regulations and company code of conduct.- Lead investigation into workplace fatalities and capture “lessons learnt” for executive and Board. - Establish priorities for action within an organisation wide risk profile taking account of criticality of
riskEngagement - Engage with Board, executives, senior management team and operational managers in a complex
commercial environment. - Develop and gain commitment at all levels to the WHS strategic direction for the business.- Ensure that the expectations are understood by the executive and l management teams. - Build key external stakeholder relationships including authorities and regulatory bodies for
nationwide or cross-border WHS issues.- Advise and mentor National WHS Manager and the senior safety team.- Serve as the primary external spokesperson on WHS including communicating with shareholders,
financial and investment communities and other key stakeholders on WHS matters.Training - Identify organisational WHS training and staffing needs for the next five years and ensure processes
are developed to meet these needs. - Coach the senior management team to ensure deep understanding of their WHS responsibilities and
the business benefits of robust WHS strategies.- Integrate ‘lessons learnt’ into training programsAdministration/Reporting - Interpret trends and provide appropriate written and oral reports to senior managers and Board.Staff management - Manage and provide regular feedback to ensure appropriate action and development of all direct
reports.- Build strong relationships with ‘dotted line’ reports and their managers to ensure their WHS advice,
competence and knowledge is up to date.
Qualifications - Tertiary WHS qualifications preferably masters.- Chartered WHS Professional.
Typical experience 10 years plus.
National WHS/HSE Manager
Key Purpose To initiate, develop and maintain a safe work environment by applying specialist skills and knowledge of the WHS evidence base to develop, implement and evaluate WHS strategy and programs across a national scope or division.
Typical Key Dimensions No. employees on site(s) responsible for: 2,000 – 5,000No. of sites: 6 - 10No. staff Reporting: 6 - 10No. of Dotted line Reports: 20 – 30NB: The above ranges of dimensions are based on large organisations. If your company falls outside these ranges, please indicate this on the data sheet.
Reports to General Manager WHS.Smaller organisations MD/CEO. Operations Manager.HR Manager.
Alternative Titles National Health and Safety Manager
Key accountabilities Planning- Establish the organisational WHS management plan.- Develop and implement plans for WHS initiatives across the organisation/division.Operational activities - Provide WHS specialist advice and technical support to the commercial business unit.- Ensure integrity of WHS risk assessment and risk management processes. - Develop strategies to prevent and minimise workplace fatality, injury, disease and ill health. - Develop SMS processes.- Advise and support managers on appropriate strategies and activities to foster a positive WHS
culture.- Lead and support organisational change to achieve positive safety culture, WHS objectives and
implementation strategy- Oversight, lead and manage the WHS performance evaluation processes including audit programs
and ensure identified issues are integrated into the business WHS plans.- Evaluate auditing and incident investigation procedures.- Ensure the business’ division’s WHS activities and operations are conducted in compliance with
applicable laws, regulations and company code of conduct.- Establish procedures for WHS/risk management and emergencies - Lead investigation into incidents with a potential for fatality or major injury fatalities and capture
“lessons learnt” into overall corporate programmes.- Establish priorities for action within an organisation wide risk profile taking account of criticality of
riskEngagement - Engage with site and divisional management teams to ensure that WHS roles, responsibilities and
expectations are understood by all. - Engage with and support site based WHS practitioners and professionals and peer professionals. - Consult and communicate with all levels of stakeholders.- Liaise with relevant authorities regarding WHS issues.Training - Identify organisational WHS training and staffing needs.- Support and coach site based WHS personnel and operational managers. - Coach new managers and supervisors joining the organisation to ensure they are aware of their
WHS/HSE responsibilities.- Integrate ’lessons learnt’ into training programsAdministration/Reporting - Interpret trends and provide appropriate written and oral reports to senior managers.Staff management - Manage and provide regular feedback to ensure appropriate action and development of all direct
reports.- Build strong relationships with ‘dotted line’ reports and their managers to ensure their WHS advice,
competence and knowledge is up to date.
Qualifications - Tertiary WHS qualifications preferably masters.- Certified WHS Professional/Chartered WHS Professional.
Typical experience 5-10 years.

68 2015/2016 remuneration survey search | recruit | sustain 69
Claims/IM/RTW Coordinator/Advisor
Key Purpose To support effective claims and injury management by using a range of tools and processes to administer injury management and workers compensation programs.
Typical Key Dimensions No. employees on site(s) responsible for: 50 - 300 No.of sites: 1-2 No. staff Reporting: Nil No. Dotted line Reports: NilNB: The above ranges of dimensions are based on large organisations. If your company falls outside these ranges, please indicate this on the data sheet.
Reports to Workers Compensation/Return to Work ManagerHuman Resources ManagerWHS/HSE ManagerIn SME may report directly to Finance Manager with support from outsourced providers
Alternative Titles Workers Compensation Coordinator/Advisor. Injury & Claims Management Advisors/Co-ordinate/Officer.
Key accountabilities Planning- Assist with implementing the SME/division’s Workers Compensation / Claims/ Return to Work plans Operational activities - Support management and staff awareness of Workers Compensation responsibilities and
accountabilities.- Assist in the coordination and implementation of workplace injury management policies, procedures
and programs.- Facilitate the return to work of injured staff.- Process workers compensation and injury management documentation and reporting. - Review claims and escalate where necessary.- Encourage the prompt reporting of incidents and a positive Workers Compensation/Safety culture.- Monitor compliance with workplace policies and procedures.- Provide support to the commercial business unit to minimise the cost of claims and deliver
successful return to work outcomes.- Implement fit-for-purpose Workers Compensation management processes - Ensure the business’ Workers Compensation activities and operations are conducted in compliance
with applicable laws, regulations and company code of conduct.- Monitor effectiveness of service providers (e.g. rehabilitation).- Ensure the business passes relevant audits and maintains certifications Engagement - Engage with and support supervisors and managers. - Liaise with relevant authorities regarding Workers Compensation.- Liaise with injured party and 3rd party suppliers (e.g. Medical, Insurance/Rehab) to expedite the
Claims and Return to Work process. - Liaising with actuaries to reduce premiumsTraining - Develop and conduct local topic specific training.- Support/mentor supervisors.Administration/reporting - Maintain Workers Compensation records. - Manage Workers Compensation information system.- Compile, analyse and report work injury/illness statistics internally.- Provide appropriate reports and data to external stakeholders (e.g. WorkCover).Staff management - Nil
Qualifications - Qualification or related experience in the Injury Management field including WorkCover/WorkSafe accreditation as a Return to Work Coordinator.
- Ideally tertiary qualifications in a related field (e.g. Health, WHS, Human Resources).
Typical experience 1-5 years experience
Claims/IM/Workers Comp Manager
Key Purposes To develop and drive the implementation of workers compensation programs in order to reduce claim costs and accelerate effective return to work outcomes for injured workers.Lead the workers compensation team, provide technical subject matter expertise and problem solving
Typical Key Dimensions No. employees on site(s) responsible for: 300 – 2,000No. of sites: 2 - 5No staff Reporting: 1 - 5No Dotted line Reports: 1 - 10 NB: The above ranges of dimensions are based on large organisations. If your company falls outside these ranges, please indicate this on the data sheet.
Reports to National WHS /HSE Manager (in a large organisation)GM Finance GM HR or MD (in a small to medium organisation)Group Head of Workers CompensationFinance Director
Alternative Titles Workers Compensation Manager /Injury & Claims Manager/Case Manager/Return to Work Manager/State Injury and Claims Manager
Key accountabilities Planning- Develop and implement the Workers Compensation management plan for the business/division and
ensure it supports the organisation-wide plan. - Develop and implement resourcing plan for Workers Compensation function.Operational activities - Provide leadership, Workers Compensation specialist and managerial support to the commercial
business unit to minimise the cost of claims and deliver successful return to work outcomes.- Design and implementation of robust and fit-for-purpose Workers Compensation management
systems. - Advise operational managers on appropriate strategies and activities to foster a positive Workers
Compensation culture.- Work with the WHS team to establish and implement effective procedures for safety/risk
management and return to work activities where required support divisional change to achieve Workers Compensation objectives and strategy.
- Ensure the division’s Workers Compensation activities and operations are conducted in compliance with applicable laws, regulations and company code of conduct.
- Manage any required licence (e.g. self insurance) for the business/division.- Develop and/or implement strategies to reduce workplace injuries and facilitate early return to work.Engagement - Engage with site management teams and operational managers to ensure that Workers
Compensation roles, responsibilities and expectations are understood by all. - Engage with and support site based Workers Compensation/Return to Work practitioners. - Liaise with relevant authorities and regulatory bodies regarding Workers Compensation issues.- Advise and mentor the Workers Compensation team.- Liaise with the WHS Leadership to identify and manage high-risk activities that could lead to
injuries. - Liaise with insurance, rehab providers and actuaries. - Liaising with actuaries to reduce premiums. Training - Conduct divisional Workers Compensation training needs analysis.- Ensure training is implemented to meet training needs and monitored for effectiveness.- Ensure divisional inductions cover Workers Compensation accountabilities and new managers are
coached on their responsibilities.- Coach the divisional management team to ensure deep understanding of their Workers
Compensation responsibilities and the business benefits of robust strategies.- Keep up –to- date with developments in Workers Compensation field, including legislation,
regulations, accreditation, guidelines and best practice.Administration/reporting - Ensure Workers Compensation records are maintained.- Ensure appropriate written and oral reports are provided to senior managers where appropriate.- Ensure appropriate reports and data are provided to external stakeholders where appropriate.Staff management - Manage and provide regular feedback to ensure appropriate action and development of all direct
reports.- Build strong relationships with ‘dotted line’ reports to ensure their Workers Compensation advice,
competence and knowledge is up to date.
Qualifications - Prefer tertiary qualifications in a related field (e.g. Human Resources, safety, Finance).- Qualification or related experience in the Injury Management field including WorkCover/WorkSafe
accreditation as a return to Work Coordinator
Typical experience Minimum 5-10 years experience
Note: Where the term “division” is used, this could represent the whole organization for smaller to medium size companies (i.e. under 1,000 employees.

70 2015/2016 remuneration survey search | recruit | sustain 71
Environment Advisor
Key Purpose To assist in the implementation and operation of the organisation’s environmental management system (EMS) and to perform ongoing reporting and compliance-related tasks.
Typical Key Dimensions No. employees on site(s) responsible for: 500 – 3,000No. of sites: 1No staff Reporting: N/A No Dotted line Reports: N/A Size of Projects Managed: $1 - $10,000NB: The above ranges of dimensions are based on large organisations. If your company falls outside these ranges, please indicate this on the data sheet.
Reports to HSE Manager National Environment ManagerHead of EnvironmentGeneral Environment Manager
Alternative Titles Environment CoordinatorEnvironment Officer
Key accountabilities Planning- Contribute to the provision of a sustainable workplace by ensuring all environment plans, procedures
and process changes incorporate the requirements of all environment policies and practicesOperational activities - Conduct workplace audits and risk assessments - Implement EMS- Assist in addressing identified actions resultant from
audits at sites as required- Liaise with relevant authorities in respect to all environmental issues- Keep up-to-date with developments in the environment field including legislation, regulations,
guidelines and best practice- Facilitate and implement site and corporate environment management systems and reporting
systems - Coordinate the environment aspects and impacts register- Assist management in reaching environment objectives and targets- Implementation of environmental improvement projects - Conduct internal environmental audits- Communicate concerns and improvement initiatives to supervisor and managementEngagement - Provide service and support to line management in order to achieve understanding of risks and
opportunities in environment related matters- Assist in the development of systems that ensure that environment issues are identified, evaluated
and controlled in accordance with related policies- Implement policies and standards Training - Design environment induction/coaching/training programs- Conduct environment induction programs- Facilitate environment coaching and training programsAdministration/Reporting - Maintain accurate records and filing systems- Statutory reporting (e.g. NGERS, EEO, NPI) as appropriate- Compile and analyse the work environment
Staff management N/A
Qualifications Tertiary qualifications in engineering, science or equivalent
Typical experience 3 years plus
Group/GM Workers Compensation
Key Purpose To develop and manage a Workers Compensation programme across the organisation, applying high level strategic and specialist skills to work with senior management and key external stakeholders (e.g. insurers, service providers, regulators) whilst leading the Workers Compensation team.
Typical Key Dimensions No. employees on site(s) responsible for: From 2000 – 5,000No.of sites: 6-10 No. staff Reporting: 6-10 No. Dotted line Reports: 20-30NB: The above ranges of dimensions are based on large organisations. If your company falls outside these ranges, please indicate this on the data sheet.
Reports to Head of Finance Head of HSE/HR/Risk/InsuranceGM HSE/HR/Risk
Alternative Titles Group or National Workers Comp Manager/National Injury & Claims Manager GM Risk & Insurance
Key accountabilities Planning- Develop and implement the Workers Compensation strategy and high level annual plans for the
entire business. - Develop and implement succession plans for Workers Compensation senior management.Operational activities - Provide leadership, vision, Workers Compensation specialist and managerial support to the
commercial business unit to minimise the cost of claims and deliver successful Return to Work outcomes.
- Oversee the design and implementation of robust and fit-for-purpose Workers Compensation management systems.
- Advise senior and operational managers on appropriate strategies and activities to foster a positive Workers Compensation culture.
- Where required lead organisational change to achieve Workers Compensation objectives and strategy.
- Ensure the business’ Workers Compensation activities and operations are conducted in compliance with applicable laws, regulations and company code of conduct.
- Manage any required licence (e.g. self insurance) across multiple jurisdictions.Engagement - Engage with senior management team and operational managers in a complex commercial
environment. - Develop and gain senior management commitment to the Workers Compensation strategic direction
for the business.- Ensure that the expectations are understood by all management teams. - Liaise with relevant authorities and regulatory bodies regarding nationwide or cross-border Workers
Compensation issues.- Advise and mentor the Workers Compensation team.- Liaise with the senior WHS Leadership to identify and manage high-risk activities that could lead to
injuries. - Serve as the primary external spokesperson on Workers Compensation including communicating
with shareholders, financial and investment communities and other key stakeholders on Workers Compensation matters.
Training - Identify organisational Workers Compensation training needs and staffing requirements for the next
5 years and ensure processes are developed to meet these needs.- Coach the senior management team to ensure deep understanding of their Workers Compensation
responsibilities and the business benefits of robust strategies.- Keep up –to- date with developments in Workers Compensation field, including legislation,
regulations, accreditation, guidelines and best practice.Administration/reporting - Provide appropriate written and oral reports to senior managers and Board (including premium
projections).- Provide appropriate reports and data to external stakeholders.Staff management - Manage and provide regular feedback to ensure appropriate action and development of all direct
reports.- Build strong relationships with ‘dotted line’ reports and their managers to ensure their Workers
Compensation advice, competence and knowledge is up to date.
Qualifications - Keep up –to- date with developments in Workers Compensation field, including legislation, regulations, accreditation, guidelines and best practice.
Typical experience 10 years plus experience

72 2015/2016 remuneration survey search | recruit | sustain 73
Environment Manager
Key Purpose To contribute to the organisation’s success through developing, implementing and promoting environmental systems and procedures and leading environmental awareness across the business.
Typical Key Dimensions No. employees on site(s) responsible for: 200 – 3,000 No. of sites: 2 - 6No. staff Reporting: 1 - 5No. Dotted line Reports: 1 - 20 NB: The above ranges of dimensions are based on large organisations. If your company falls outside these ranges, please indicate this on the data sheet.
Reports to National Environment ManagerNational HSE Manager
Alternative Titles Environmental SuperintendantEnvironmental Compliance Manager
Key accountabilities Planning- Establish a management plan for the division which supports the organisation-wide environmental
management plan - Design training plans and implement environmental initiatives across the divisionOperational activities - Develop and maintain Environmental Management System certification and audit action plans- Evaluate environmental auditing and incident investigation procedures and issues- Consult and communicate with all levels of stakeholders concerning environment-related issues- Establish procedures and mitigation strategies for risk and emergency management for environment
related issues - Develop and/or implement strategies to reduce environment concerns and ensure these meet
business needs- Ensure divisional induction covers employee environment accountabilities and new managers are
coached on their environment responsibilitiesEngagement - Provide environmental technical support to the division and business including advising Site
Managers and coaching and mentoring site-based environment staff- Manage the environmental audit program for divisional operations and ensure that identified issues
are integrated into the business and site- Environmental plans- Ensure that the expectations are understood by all site management teams and that the divisional
environmental plans include these expectationsTraining - Identify and develop programs to meet divisional environmental training needs- Keep up-to-date with developments in the environment field including legislation, regulations,
guidelines and best practiceAdministration/reporting - Report EMS and audit performance and report these to key stakeholders- Ensure regular corrective and preventive action reporting to senior management Staff management - Manage and provide regular feedback to and ensure the appropriate development of all direct
reports- Build strong relationships with ‘dotted-line’ reports and their managers to ensure their environment
competence and knowledge is up-to-date
Qualifications Degree or postgraduate qualifications in environmental science/engineering or related field
Typical experience Minimum 5-10 years relevant experience
Note: Where the term ‘division’ is used, this could represent the whole organisation for smaller to medium size companies (i.e. under 1,000 employees)
Sustainability Advisor
Key Purpose Work closely with senior stakeholders to help educate, identify, measure and manage social, environmental and economic issues and opportunities that will deliver efficiencies/business improvements through sustainable practicesTo work across the organisation to achieve key environmental and social commitments, address risks, and meet both mandatory reporting requirements and voluntary reporting through standalone or integrated reporting processes
Typical Key Dimensions No. employees on site(s) responsible for: 1000 plus No. of sites: 1 - 50No. staff Reporting: 0No. Dotted line Reports: 0 NB: The above ranges of dimensions are based on large organisations. If your company falls outside these ranges, please indicate this on the data sheet.
Reports to Sustainability ManagerEnvironment Manager / National Environment ManagerHead of Environment / Sustainability
Key accountabilities Operational activities - Work with key internal and external stakeholders to establish guidelines and measurement systems
to identify/quantify savings and triple bottom line improvements- Work with the business to incorporate required data collection systems and analysis for legislated
reporting requirements and improved business planning processe- Identify opportunities to obtain funding for product stewardship initiatives (such as National
Packaging Covenant, Product Stewardship Council, government schemes etc)- Ensure consistent sustainability messages are developed and delivered to a broader internal and
external audience – the annual sustainability report or contribution to integrated report being a key deliverable
- Deliver the annual sustainability report (or contribution to company financial report) and other ongoing sustainability communications
Engagement - Engage with key points of contact across the organisation to collect sustainability data, deliver
training and communicate sustainability outcomes- Assist in representing the organisation externally on sustainability-related mattersTraining - Keep abreast of evolving standards, legislation and community expectation regarding sustainability
measurement and reporting - Monitor industry trends and identify best practice in relevant organisations both domestically and
internationallyAdministration/reporting - Identify, compile and analyse sustainability metrics- Prepare (or assist in the preparation) of internal and external sustainability reports and/or contribute
sustainability-related data to integrated annual reports- Maintain sustainability information systemStaff management - Provide mentorship and guidance to junior and/or graduate-level staff as applicable
Qualifications Relevant degree, e.g. business, marketing, sustainability or environmental science/engineeringStrong analytical, communication and stakeholder engagement skills
Typical experience 3 - 5 years experience in sustainability or a related discipline

74 2015/2016 remuneration survey search | recruit | sustain 75
Head of Environment and Sustainability
Key Purpose To identify and manage the environment risks (legal, reputation and operational) and value creation opportunities relevant to the business.To set the strategic direction, assess environment performance and provide best practice strategic tactical and technical advice to the business from internal and external experts.NB: The above ranges of dimensions are based on large organisations. If your company falls outside of these ranges, please indicate this on the data sheet.
Typical Key Dimensions No. employees on site(s) responsible for: 5,000 – 10,000No. of sites: 11 - 50No. staff Reporting: 11 - 50No. Dotted line Reports: 1-10 Size of Projects Managed: typically $50,000 - $1,000,000
Reports to Global Head of Health Safety and Environment (in multi-national organisations)GM RiskCEOManaging Director
Alternative Titles General Manager of Environment Sustainability General Manager of Climate ChangeGroup Head of Environment/Sustainability
Key accountabilities Planning- Develop commercially robust and proactive strategic plan for environment and sustainability for the
business - Identify value creation opportunities, marketing strategies and resource requirements; develop
business cases- Present and gain executive / board commitment to the environment strategic direction for the
business - Mobilise resources within the business to deliver on the environment plan- Develop and maintain systems to collect and present key environment parameters and emerging
issues to senior management- Encourage positive environment practices in all operations and design areas across the business- Provide thought leadership and vision to manage Environment and Sustainability issues in the best
interests of the business and stakeholders Operational activities - Develop both internal and external networks and resource base to support the delivery of
environment plan across the business - Site environment monitoring and incident management overview and auditingEngagement - Educate, coach and influence the executive team to ensure deep understanding of environment
issues, opportunities, risks and responsibilities - Lead the development and delivery of appropriate environment systems, processes standards and
ensure their implementation within the business- Scan for and establish mutually beneficial partnerships with key government and Environment and
Sustainability stakeholders- Liaise with relevant authorities and regulatory bodies in respect to nationwide or cross-border
environment issues- Build and maintain working relationships with key personnel in regulatory and government agencies,
industry participants suppliers and customers- Establish excellent networks within the group of companies to cross fertilise environment skills sets
across regions (if applicable)- Serve as the principle expert in Environment and Sustainability issues within the businessTraining - Identify organisational environment training needs and staffing requirements for next 5 years and
ensure processes are developed to meet these needs; work with business and HR to deliver plan- Keep abreast of developments in the environment field, including legislation, regulations, guidelines
and best practice- Monitor industry and community trends and develop action plans to best position the businessAdministration/reporting - Ensure relevant internal and external regulatory and voluntary reporting obligations (e.g. NGER,
EEO, NPI, DJSI) are met- Interpret trends and provide appropriate written and oral reports to senior managers and Board.Staff management - Manage and provide regular feedback to ensure appropriate action and development of all direct
reports.- Build strong relationships with ‘dotted line’ reports and their managers to ensure their
environmental and sustainability advice, competence and knowledge is up to date.
Qualifications Degree in environmental science / engineering or other relevant discipline, and/or additional postgraduate qualifications
Typical experience Substantial (10 + years) experience in a senior management capacity gained within a major business
National Environment Manager
Key Purpose To lead the development and delivery of appropriate environment (technical) systems, processes, standards, and outcomes in the organisation utilising both internal and external networks and resources. To develop and maintain reporting systems to comply with the relevant Environment and Emissions Acts.To build a culture committed to Environment and Sustainability. NB: The above ranges of dimensions are based on large organisations. If your company outside these ranges, please indicate this on the data sheet.
Typical Key Dimensions No. employees on site(s) responsible for: 500 – 3,000No. of sites: Approx. 5 – 20 No. staff Reporting: 1 - 5 No. Dotted line Reports: 0 - 20
Reports to Global Head of Health Safety and Environment (in multinational organisations)CEOGM RiskHead of Environment
Alternative Titles Environment Manager Environment Sustainability Manager
Key accountabilities Planning- Maintain overview of site assessments, remediation, legal cases and monitor all site environmental
impacts - To identify and develop strategies to deal with emerging environment issues that arise through
legislative or community led actions- Provide leadership for the National Environment Plan and strategies to achieve the business
objectives Operational activities - Develop both internal and external networks and resources base to support the delivery of
environment projects- Develop and maintain key relationships with internal and external key stakeholders- Site environment monitoring and incident management overview and auditingEngagement - Educate management with regard to Environment issues and responsibilities- Lead the development and delivery of appropriate environment systems, processes and standards - Scan for and establish mutually beneficial partnerships with key government and environment
stakeholders- Liaise with relevant authorities and regulatory bodies in respect to nationwide or cross-border
environment issuesTraining - Identifying organisational environment training needs and staffing requirements for next 5 years and
ensure processes are developed to meet these needs- Keep up to date with developments in the environment field including legislation, regulations,
guidelines and best practiceAdministration/reporting - Ensure relevant internal and external regulatory and voluntary reporting obligations (e.g. NGER,
EEO, NPI, DJSI) are met- Interpret trends and provide appropriate written and oral reports to senior managers and Board.Staff management - Manage and provide regular feedback to ensure appropriate action and development of all direct
reports.- Build strong relationships with ‘dotted line’ reports and their managers to ensure their
environmental and sustainability advice, competence and knowledge is up to date.
Qualifications Tertiary qualifications in environmental science / engineering or a related discipline
Typical experience Minimum of 5 - 10 years relevant experience in the environment field

76 2015/2016 remuneration survey
melbourne | head officet: +61 3 9663 5513
sydneyt: +61 2 9263 8521
pertht: +61 8 9218 8159
new zealand t: +64 22 431 6500