Embed Size (px)
Citation preview
UK I FRANCE I ITALY
Safety and security Annual report 2013/14
© SPA Future Thinking 2014 Page 2 of 73
UK I FRANCE I ITALY
Confidentiality Please note that the copyright in the attached report is owned by TfL and the provision of information under Freedom of Information Act does not give the recipient a right to re-use the information in a way that would infringe copyright (for example, by publishing and issuing copies to the public). Brief extracts of the material may be reproduced under the fair dealing provisions of the Copyright, Designs and Patents Act 1988 for the purposes of research for non-commercial purposes, private study, criticism, review and news reporting. Details of the arrangements for reusing the material owned by TfL for any other purpose can be obtained by contacting us at [email protected] Prepared by: SPA Future Thinking Laystall House, 8 Rosebery Avenue London, EC1R 4TD Prepared for: Transport for London TfL ref: 10112 SPA FT ref: 1528/ds/bw Date: February 2014
© SPA Future Thinking 2014 Page 3 of 73
UK I FRANCE I ITALY
Contents
Key messages .................................................................................................... 4
Background, objectives and method .................................................................. 7
Background ..................................................................................................... 7
Research objectives ....................................................................................... 8
Method ............................................................................................................ 8
Concerns about personal security ...................................................................... 9
Typology of worry ........................................................................................... 9
Underlying worry ........................................................................................... 11
When Londoners most feel worried .............................................................. 12
Where Londoners most feel worried ............................................................. 13
Impact of underlying worry on quality of life .................................................. 14
Taking precautions against crime ................................................................. 15
Impact of taking precautions against crime ................................................... 17
Experiences of worrying incidents ................................................................ 19
When last felt worried ................................................................................... 21
Where last felt worried .................................................................................. 22
Nature of last worrying incident ..................................................................... 25
Extent of worry on last occasion ................................................................... 27
Impact of last worrying incident on travel behaviour ..................................... 28
Taking precautions as a result of last worrying incident ................................ 29
Unwelcome sexual behaviour ........................................................................... 32
Willingness to discuss incidents of unwelcome sexual behaviour ................. 32
Incidence of experiencing unwelcome sexual behaviour .............................. 33
When unwelcome sexual behaviour occurred .............................................. 34
Where unwelcome sexual behaviour occurred ............................................. 35
Nature of unwelcome sexual behaviour experienced ................................... 36
Reporting of incidents ................................................................................... 37
Drunken behaviour ....................................................................................... 38
Appendix – questionnaire ................................................................................. 40
© SPA Future Thinking 2014 Page 4 of 73
UK I FRANCE I ITALY
Key messages This report looks at Londoners’ views and experiences of their security when travelling on public transport. It combines data from the four waves of TfL’s Safety and Security study conducted in 2013. The report examines the extent to which users of public transport in London have an underlying worry about their personal security while using the transport system and also looks at the incidence of events which caused concern. As we have built up a robust base of those who have experienced unwelcome sexual behaviour, we are able to report on the nature of these, where and when they occurred and whether or not they were reported. Using TfL’s typology of fear, three quarters are unworried about their personal security when on or around the public transport network in London. They have neither a general underlying fear nor have they experienced any specific event in the last three months which made them fearful. One in ten have an unexpressed fear. They have experienced an incident which made them worry but are generally not worried about their safety. Some 7% are anxious, having an underlying worry but no recent incident and a further 7% are worried, having both a general fear and experiencing a recent incident. Women, BAME Londoners and those form social class groups C2DE are most likely to be either anxious or worried. One in eight have an underlying worry and approaching three in ten of these claim that this fear reduces their quality of life. This translates to 4% of the total population. Among all Londoners, a quarter say that the walk to and from a stop or station is where they are most likely to worry about their personal security. A further quarter find the wait at a stop or station the most worrying stage of their journey. Only one in seven say that the travelling on the bus, tube or train itself is the most worrying time. As outlined in the report however, the majority of incidents that cause Londoners to feel worried happen on board: approaching two thirds occurred on board the bus or train with one in five happening at the stop or station and one in seven, while getting to or from the stop or station. The reason for this discrepancy is unknown, although there are some hypotheses. Proximity to others – rather than being alone – generally increases feelings of safety, and this may be more likely to occur on board public transport than when waiting for or getting to/from it. This could explain why Londoners are most likely to feel worried when not on board. The same reason – the proximity
© SPA Future Thinking 2014 Page 5 of 73
UK I FRANCE I ITALY
of others – may also explain why most incidents occur on board, where there are more people around to cause worrying incidents. The on board section of a journey may also account for most of the journey time, giving more opportunities for anti-social behaviour to take place. Not surprisingly, the majority of Londoners are most likely to be worried about their personal security after dark. Two fifths take precautions against crime when using public transport. The precautions taken most often are sitting near other people, travelling with someone else and paying particular attention to one’s belongings. Travelling with someone else is the one precaution which boosts feelings of security the most (38% feel markedly safer by taking this measure). Taking precautions does impact on quality of life but only 7% say that it has a marked impact. Having to change one’s travel patterns (the mode, route or time of travel) has the biggest negative impact on quality of life. Those most likely to feel worried during the day are more likely to claim that this impacts on their quality of life than those most likely to feel worried after dark. The precautions taken to mitigate fear by those most fearful during the day also impact quality of life to a greater extent. This may well be linked to the fact that worrying incidents happening during the day are more repetitive/ numerous than those happening after dark. Some 18% of Londoners have experienced an incident which caused them to worry about their personal security in the last three months. Women, BAME Londoners and those aged 16-24 are most likely to have experienced a worrying incident recently (approaching a quarter of these groups). Londoners experiencing a recent worrying incident are split evenly between those who were very or quite worried by the incident and those who were only a little or not very worried by it. Disabled Londoners are more likely to have been very or quite worried by the recent incident (65%). The most common incidents are the threatening behaviour of other passengers (7% of all Londoners), experiencing drunken passengers (3%) and large groups of schoolchildren or youths (3%). Threatening behaviour can happen at any time of the day but experiencing drunken passengers and/ or large groups of schoolchildren and youths is more likely to happen after dark. Experiencing busy environments and large crowds is most likely to stop Londoners using a mode either for good or temporarily (19%), followed by anti-social behaviour, threatening behaviour, strangers or suspicious looking people and large groups of schoolchildren or youths. We might tentatively deduce that incidents which might re-occur at regular intervals at the same time and place would be more likely to cause Londoners to switch mode than one-off incidents like coming across drunken passengers.
© SPA Future Thinking 2014 Page 6 of 73
UK I FRANCE I ITALY
There is not a significant difference in the impact on use of mode by time of day of last worrying incident. Some 7% of Londoners report having experienced unwelcome sexual behaviour when using public transport in the last 12 months. Women and those aged 16-24 are twice as likely to have experienced this. Half of those incidents happen in the evening (5pm – 11pm) and a quarter during the afternoon (12 noon – 5pm). These incidents are most likely to occur on a bus, while waiting at stops or stations, or on the Tube. During the evening they are more likely to occur while waiting at stops or stations. The vast majority of these incidents go unreported, mainly because they were considered to be only minor or where the victim was able to deal with the situation easily by moving away for example. However one in six did not report the incident because they are deterred by a perception that there will be too many questions asked, suggesting there is scope to encourage increased reporting of incidents. There is no difference in the level of reporting incidents by the time of day at which they occurred. Some 3% of Londoners report that the last time they felt worried on public transport, it was because of drunken passengers. Most of these incidents happen after dark (71%). For 8% of those being worried through encountering drunken behaviour, their experience has stopped them using the mode of transport either permanently or temporary. This impact is marginally higher if the event happened after dark. Approaching half have taken precautions as a result of their experience with drunken passengers, in line with the reaction to other types of worrying incidents.
© SPA Future Thinking 2014 Page 7 of 73
UK I FRANCE I ITALY
Background, objectives and method Background TfL’s Enforcement and On Street Directorate (EOS) is committed to improving the safety and security of London’s transport system. In order to understand the safety concerns of Londoners, EOS consults residents through regular research. The research findings feed into strategies for improvement, and provide important metrics on Londoners’ perceptions. This year’s annual report is based on four waves of research conducted in 2013 and focusses on the public’s general level of worry about personal security when travelling on public transport in London and the incidence of worrying events in the last three months. It examines the impact of general fear and worrying events on passengers’ behaviour. Wherever possible we also further examine results for the after dark time period making comparisons with the daytime period. We cover these topics under the following headings: General feelings of fear / worry while travelling on public transport in
London Impact of worry on quality of life Where and when Londoners feel worried Taking precautions against crime Experiences of worrying incidents in the last three months Extent of worry on last occasion experienced an incident Where last incident took place Nature of incident Unwelcome sexual behaviour Drunken behaviour Unwelcome sexual behaviour and drunken behaviour in context
© SPA Future Thinking 2014 Page 8 of 73
UK I FRANCE I ITALY
Research objectives The primary objectives of the research are to: Determine and monitor the impact of concerns over crime and anti-social
behaviour on Londoners’ use of public transport Gather the reasons behind any concerns around public transport use
Method The findings presented in this report are taken from all interviews conducted throughout 2013. This comprised interviews with 4,122 adult London residents. The results are weighted to represent the London population in terms of age, gender, ethnicity, working status and location (inner/outer London). Interviews are conducted by telephone. All Londoners with a landline telephone are in scope for the research. For each interview, a random person in the household is selected using the ‘next birthday rule’ – an established market research technique which helps to avoid over-interviewing particular groups of people who are known to be more likely to answer the telephone. Each quarter selected modules of questions are put to respondents according to a pre-agreed schedule. This allows us to gain feedback on a wide range of issues without overburdening the respondent. Core questions and key performance monitoring questions are included in all waves of the research and asked of everyone. The questionnaire used for the surveys in 2013 has evolved over time, meaning that in some cases questions reported in previous years are not present this time, while some new questions are reported for the first time. A copy of the most recent questionnaire is found in the appendix of this report.
© SPA Future Thinking 2014 Page 9 of 73
UK I FRANCE I ITALY
Concerns about personal security Over the last year, EOS and SPA Future Thinking have been working to better understand Londoners’ perceptions of personal security. This has involved creating a new set of questions which have been trialled and refined since autumn 2012. Unlike previous measures, the new questions focus on those Londoners who have experienced incidents that make them worried about their personal security and, because the proportion of Londoners in this category is relatively low, it has taken a year to build up sufficient data for detailed analysis. This is presented here.
Typology of worry Along with academics and input from TfL, a typology of worry has been developed to understand Londoners perceptions and experiences. This is defined in the table below.
Name Definition / characteristic Unworried Reports no general worry, and no episodes of worry Unexpressed fear Reports no general worry, but specific episodes Anxious Reports general worry, but no specific episodes Worried Reports general worry, and specific episodes Don’t know Doesn’t know (a small sub-group of respondents)
Three quarters of Londoners fall into the ‘unworried’ category, which means that they are generally unworried about their personal security in London and have experienced no incidents that made them feel worried in the last three months. A further 11% of Londoners have experienced an incident which made them worried in the last three months, but have no underlying worry (they are generally ‘not at all worried’ or ‘not very worried’ about their personal security when using public transport in London). The remainder are divided equally between those who are categorised as ‘anxious’ (meaning they have an underlying worry but without experiencing any specific incidents in the last three months), making up 7% of the Capital’s population and the ‘worried’ group (who report both underlying concern and
© SPA Future Thinking 2014 Page 10 of 73
UK I FRANCE I ITALY
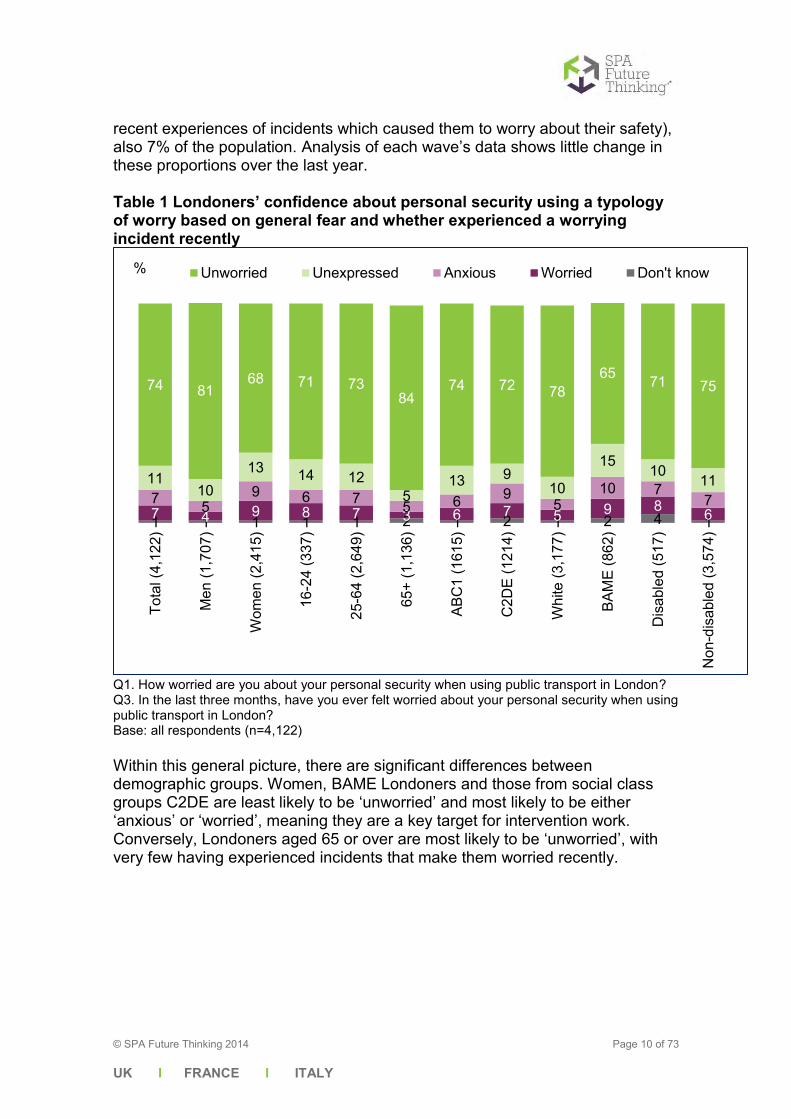
recent experiences of incidents which caused them to worry about their safety), also 7% of the population. Analysis of each wave’s data shows little change in these proportions over the last year. Table 1 Londoners’ confidence about personal security using a typology of worry based on general fear and whether experienced a worrying incident recently
Q1. How worried are you about your personal security when using public transport in London? Q3. In the last three months, have you ever felt worried about your personal security when using public transport in London? Base: all respondents (n=4,122) Within this general picture, there are significant differences between demographic groups. Women, BAME Londoners and those from social class groups C2DE are least likely to be ‘unworried’ and most likely to be either ‘anxious’ or ‘worried’, meaning they are a key target for intervention work. Conversely, Londoners aged 65 or over are most likely to be ‘unworried’, with very few having experienced incidents that make them worried recently.
1 1 1 1 1 2 1 2 1 2 4 1 7 4 9 8 7 3 6 7 5 9 8 6 7 5
9 6 7 5 6 9 5
10 7 7
11 10
13 14 12 5
13 9 10
15 10
11
74 81 68 71 73
84 74 72 78
65 71 75
Tota
l (4,
122)
Men
(1,7
07)
Wom
en (2
,415
)
16-2
4 (3
37)
25-6
4 (2
,649
)
65+
(1,1
36)
ABC
1 (1
615)
C2D
E (1
214)
Whi
te (3
,177
)
BAM
E (8
62)
Dis
able
d (5
17)
Non
-dis
able
d (3
,574
)
Unworried Unexpressed Anxious Worried Don't know%
© SPA Future Thinking 2014 Page 11 of 73
UK I FRANCE I ITALY
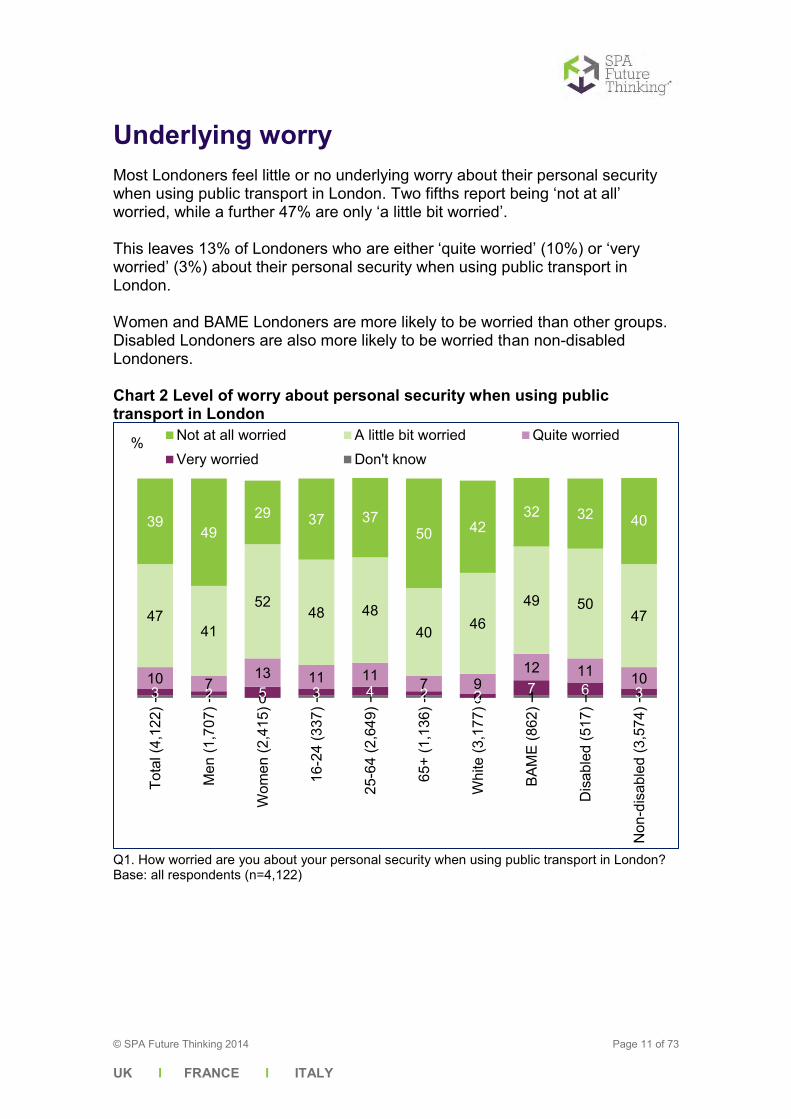
Underlying worry Most Londoners feel little or no underlying worry about their personal security when using public transport in London. Two fifths report being ‘not at all’ worried, while a further 47% are only ‘a little bit worried’. This leaves 13% of Londoners who are either ‘quite worried’ (10%) or ‘very worried’ (3%) about their personal security when using public transport in London. Women and BAME Londoners are more likely to be worried than other groups. Disabled Londoners are also more likely to be worried than non-disabled Londoners. Chart 2 Level of worry about personal security when using public transport in London
Q1. How worried are you about your personal security when using public transport in London? Base: all respondents (n=4,122)
1 1 0 1 1 1 0 1 1 1 3 2 5 3 4 2 2 7 6 3 10 7
13 11 11 7 9 12 11 10
47 41
52 48 48
40 46 49 50
47
39 49
29 37 37 50 42
32 32 40
Tota
l (4,
122)
Men
(1,7
07)
Wom
en (2
,415
)
16-2
4 (3
37)
25-6
4 (2
,649
)
65+
(1,1
36)
Whi
te (3
,177
)
BAM
E (8
62)
Dis
able
d (5
17)
Non
-dis
able
d (3
,574
)
Not at all worried A little bit worried Quite worriedVery worried Don't know
%
© SPA Future Thinking 2014 Page 12 of 73
UK I FRANCE I ITALY
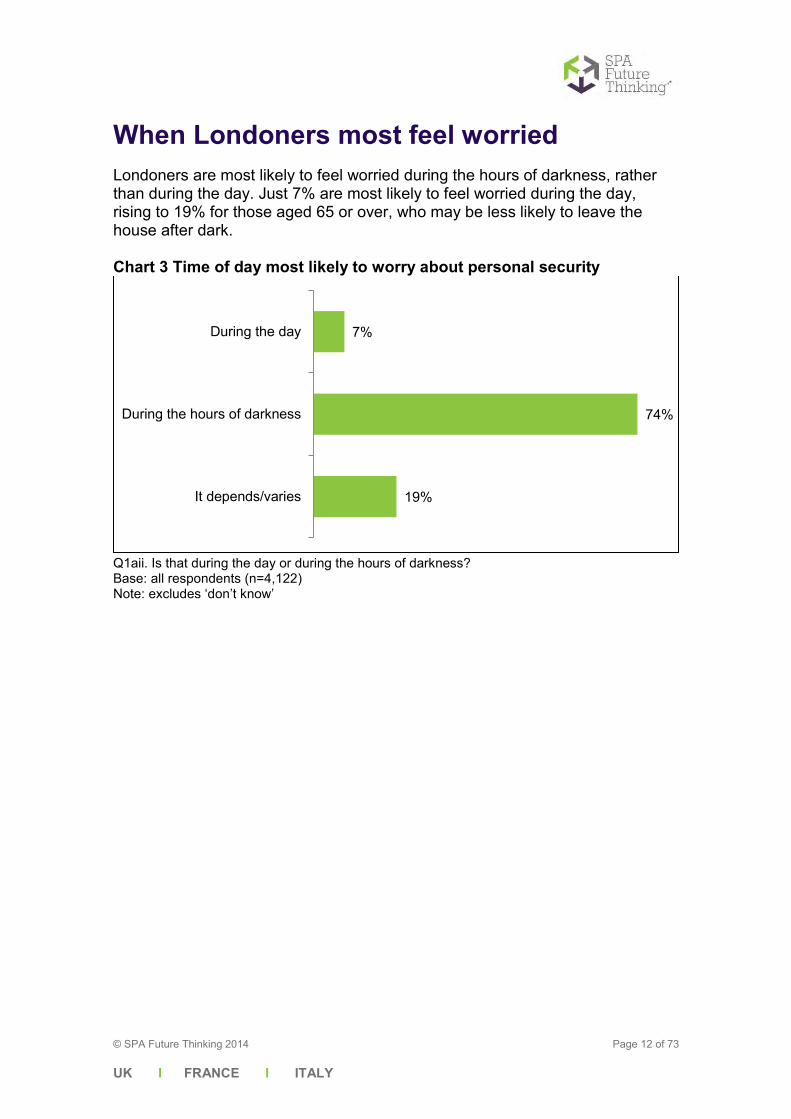
When Londoners most feel worried Londoners are most likely to feel worried during the hours of darkness, rather than during the day. Just 7% are most likely to feel worried during the day, rising to 19% for those aged 65 or over, who may be less likely to leave the house after dark. Chart 3 Time of day most likely to worry about personal security
Q1aii. Is that during the day or during the hours of darkness? Base: all respondents (n=4,122) Note: excludes ‘don’t know’
7%
74%
19%
During the day
During the hours of darkness
It depends/varies
© SPA Future Thinking 2014 Page 13 of 73
UK I FRANCE I ITALY
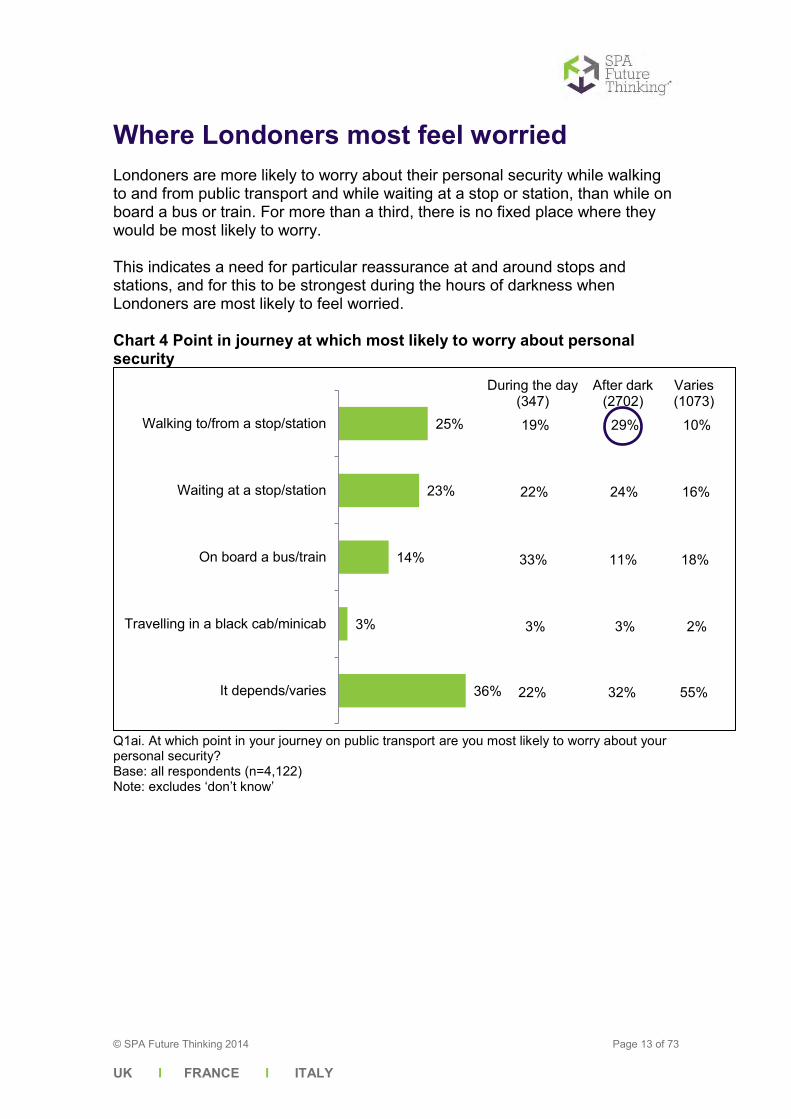
Where Londoners most feel worried Londoners are more likely to worry about their personal security while walking to and from public transport and while waiting at a stop or station, than while on board a bus or train. For more than a third, there is no fixed place where they would be most likely to worry. This indicates a need for particular reassurance at and around stops and stations, and for this to be strongest during the hours of darkness when Londoners are most likely to feel worried. Chart 4 Point in journey at which most likely to worry about personal security
Q1ai. At which point in your journey on public transport are you most likely to worry about your personal security? Base: all respondents (n=4,122) Note: excludes ‘don’t know’
25%
23%
14%
3%
36%
Walking to/from a stop/station
Waiting at a stop/station
On board a bus/train
Travelling in a black cab/minicab
It depends/varies
During the day (347)
Varies (1073)
After dark (2702)
19%
22%
33%
3%
22%
29%
24%
11%
3%
32%
10%
16%
18%
2%
55%
© SPA Future Thinking 2014 Page 14 of 73
UK I FRANCE I ITALY
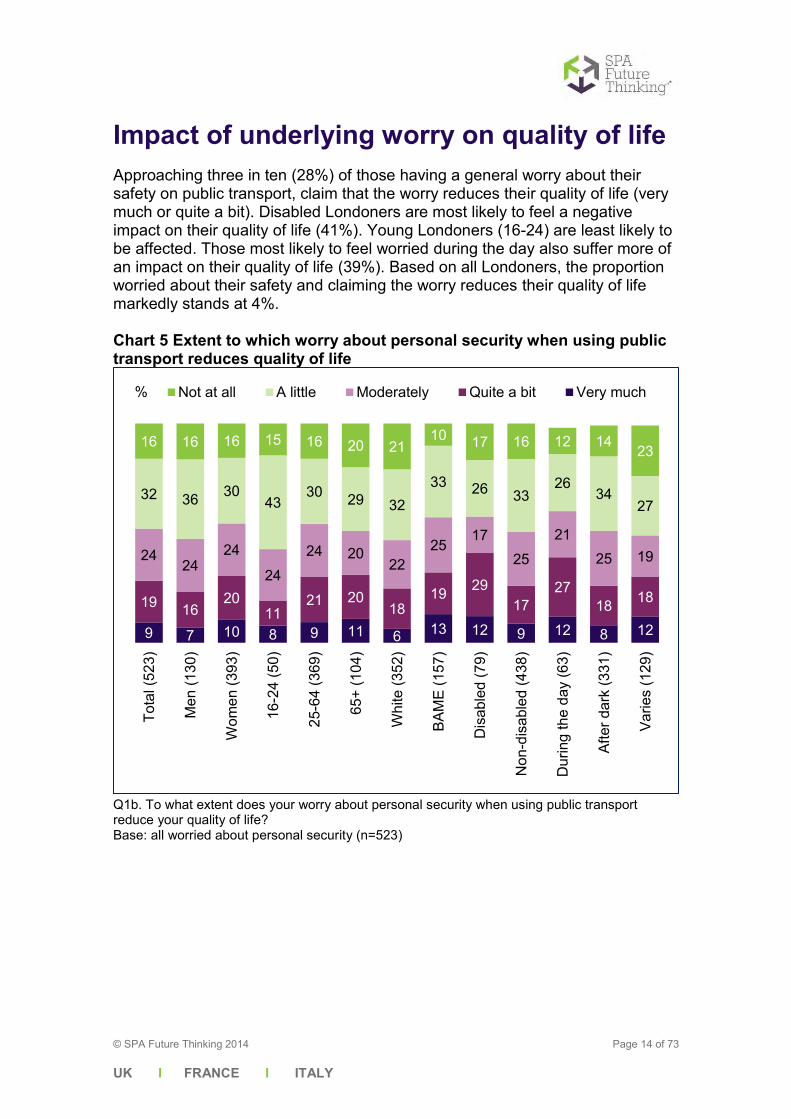
Impact of underlying worry on quality of life Approaching three in ten (28%) of those having a general worry about their safety on public transport, claim that the worry reduces their quality of life (very much or quite a bit). Disabled Londoners are most likely to feel a negative impact on their quality of life (41%). Young Londoners (16-24) are least likely to be affected. Those most likely to feel worried during the day also suffer more of an impact on their quality of life (39%). Based on all Londoners, the proportion worried about their safety and claiming the worry reduces their quality of life markedly stands at 4%. Chart 5 Extent to which worry about personal security when using public transport reduces quality of life
Q1b. To what extent does your worry about personal security when using public transport reduce your quality of life? Base: all worried about personal security (n=523)
9 7 10 8 9 11 6 13 12 9 12 8 12
19 16 20
11 21 20
18 19 29
17 27
18 18
24 24
24
24
24 20 22
25 17
25
21 25 19
32 36 30 43
30 29 32 33 26 33
26 34
27
16 16 16 15 16 20 21 10 17 16 12 14
23
Tota
l (52
3)
Men
(130
)
Wom
en (3
93)
16-2
4 (5
0)
25-6
4 (3
69)
65+
(104
)
Whi
te (3
52)
BAM
E (1
57)
Dis
able
d (7
9)
Non
-dis
able
d (4
38)
Dur
ing
the
day
(63)
Afte
r dar
k (3
31)
Varie
s (1
29)
Not at all A little Moderately Quite a bit Very much%
© SPA Future Thinking 2014 Page 15 of 73
UK I FRANCE I ITALY
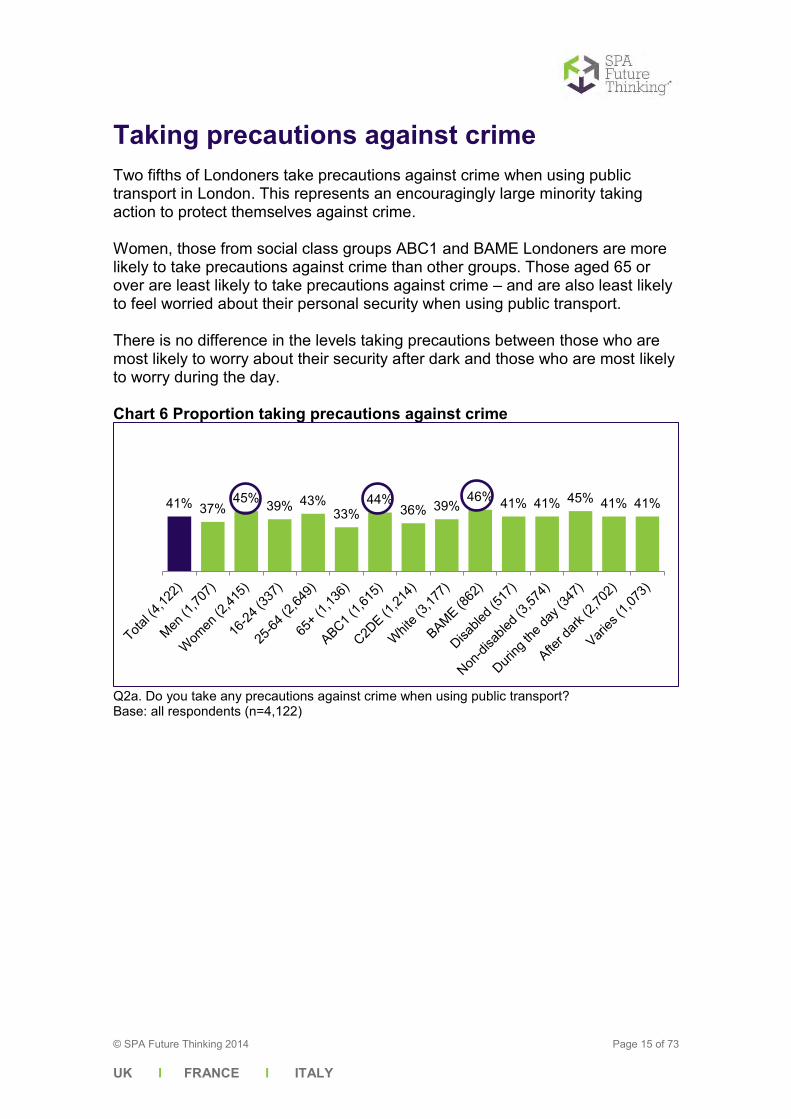
Taking precautions against crime Two fifths of Londoners take precautions against crime when using public transport in London. This represents an encouragingly large minority taking action to protect themselves against crime. Women, those from social class groups ABC1 and BAME Londoners are more likely to take precautions against crime than other groups. Those aged 65 or over are least likely to take precautions against crime – and are also least likely to feel worried about their personal security when using public transport. There is no difference in the levels taking precautions between those who are most likely to worry about their security after dark and those who are most likely to worry during the day. Chart 6 Proportion taking precautions against crime
Q2a. Do you take any precautions against crime when using public transport? Base: all respondents (n=4,122)
41% 37% 45% 39% 43%
33% 44%
36% 39% 46% 41% 41% 45% 41% 41%

© SPA Future Thinking 2014 Page 16 of 73
UK I FRANCE I ITALY
The most common precautions that Londoners take tend to relate to proximity to others – either sitting near other people (47%) or specifically travelling with someone else (31%). 30% of those who take precautions say they keep an eye on their belongings. Women take a wider range of precautions than men, as do younger Londoners compared with those in older age groups. Those most fearful after dark are more likely to sit near other people than those fearful during the day. Table 7 Precautions against crime taken
Total Men Women 16-24 25-64 65+ During the day
After dark Varies
Base 1,679 597 1082 133 1,165 381 152 1,109 418 Sat near to other people 47% 38% 54% 44% 49% 37% 35% 51% 40%
Travelled with someone else 31% 20% 40% 49% 29% 24% 27% 34% 24%
Look after my belongings 30% 32% 28% 27% 30% 35% 32% 27% 40%
Travel at a different time of day 23% 19% 25% 31% 21% 20% 20% 25% 15%
Used a different route 21% 18% 23% 32% 20% 10% 17% 22% 17%
Avoided using that mode 16% 13% 19% 21% 16% 9% 17% 16% 15%
Stay aware / vigilant 12% 15% 9% 2% 13% 14% 13% 12% 12% Only take necessities with me 5% 3% 6% 2% 5% 11% 6% 5% 6%
Carry a personal alarm 4% 1% 6% 3% 3% 6% 4% 3% 4%
Q2ai Which of the following precautions do you take? Base: all who take precautions against crime when travelling on public transport (n=1,679)
© SPA Future Thinking 2014 Page 17 of 73
UK I FRANCE I ITALY
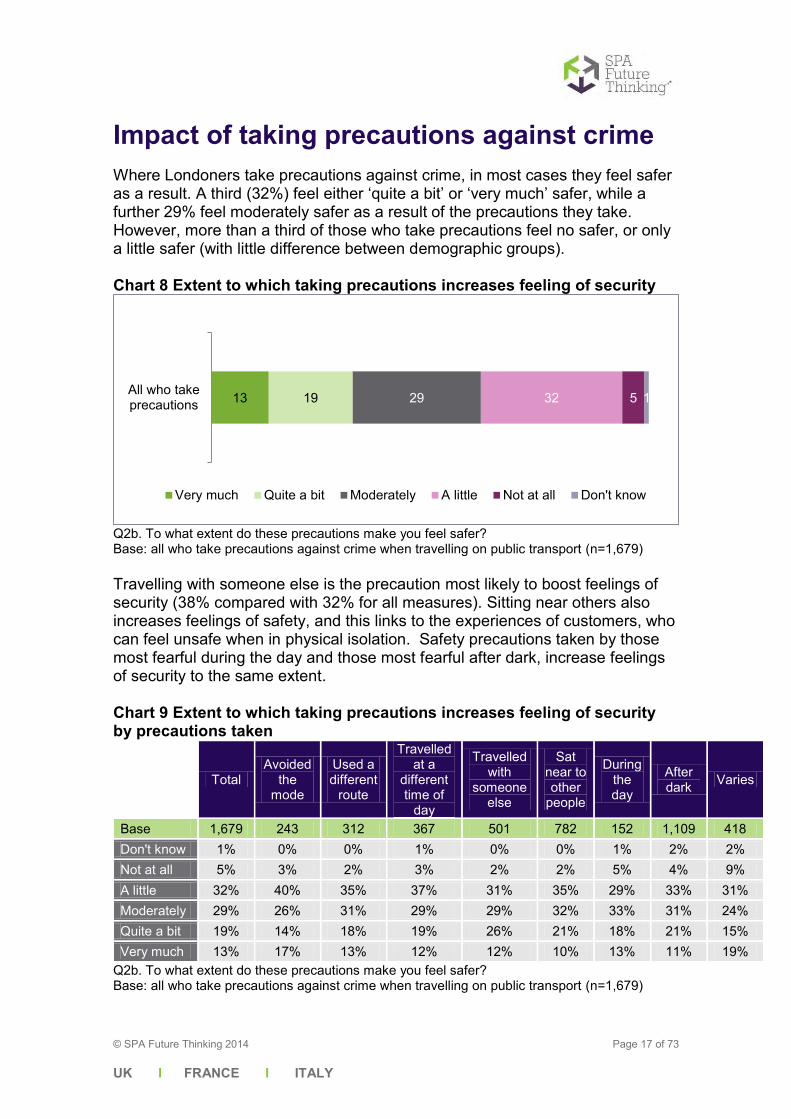
Impact of taking precautions against crime Where Londoners take precautions against crime, in most cases they feel safer as a result. A third (32%) feel either ‘quite a bit’ or ‘very much’ safer, while a further 29% feel moderately safer as a result of the precautions they take. However, more than a third of those who take precautions feel no safer, or only a little safer (with little difference between demographic groups). Chart 8 Extent to which taking precautions increases feeling of security
Q2b. To what extent do these precautions make you feel safer? Base: all who take precautions against crime when travelling on public transport (n=1,679) Travelling with someone else is the precaution most likely to boost feelings of security (38% compared with 32% for all measures). Sitting near others also increases feelings of safety, and this links to the experiences of customers, who can feel unsafe when in physical isolation. Safety precautions taken by those most fearful during the day and those most fearful after dark, increase feelings of security to the same extent. Chart 9 Extent to which taking precautions increases feeling of security by precautions taken
Total Avoided
the mode
Used a different
route
Travelled at a
different time of
day
Travelled with
someone else
Sat near to other
people
During the day
After dark Varies
Base 1,679 243 312 367 501 782 152 1,109 418 Don't know 1% 0% 0% 1% 0% 0% 1% 2% 2% Not at all 5% 3% 2% 3% 2% 2% 5% 4% 9% A little 32% 40% 35% 37% 31% 35% 29% 33% 31% Moderately 29% 26% 31% 29% 29% 32% 33% 31% 24% Quite a bit 19% 14% 18% 19% 26% 21% 18% 21% 15% Very much 13% 17% 13% 12% 12% 10% 13% 11% 19%
Q2b. To what extent do these precautions make you feel safer? Base: all who take precautions against crime when travelling on public transport (n=1,679)
13 19 29 32 5 1 All who takeprecautions
Very much Quite a bit Moderately A little Not at all Don't know

© SPA Future Thinking 2014 Page 18 of 73
UK I FRANCE I ITALY
Asked how much these precautions reduce quality of life, generally only a small proportion (7%) say that they do to any significant degree. This rises to one in six when we include those saying the precautions have a moderate impact on quality of life. Having to change one’s travel arrangements (either the mode, route or time of travel) has the biggest negative impact on quality of life. Chart 10a Impact of precautions taken on quality of life
Total Avoided the mode
Used a different
route
Travelled at a
different time of day
Travelled with
someone else
Sat near to other
people
Base 1,679 248 320 371 505 798 Don't know 1% 1% 1% 1% 1% 1% Not at all 58% 31% 42% 41% 47% 54% A little 24% 37% 33% 35% 29% 27% Moderately 9% 16% 11% 12% 12% 11% Quite a bit 5% 10% 9% 7% 8% 5% Very much 2% 7% 4% 4% 3% 2%
Q2c. To what extent do these precautions reduce your quality of life? / Q2ai Which of the following precautions do you take? Base: all who take precautions against crime when travelling on public transport (n=1,679) Precautions taken by those most fearful during the day have more of a negative impact than precautions taken by those most fearful after dark. Chart 10b Impact of precautions taken on quality of life
Total Worried during the day
Worried after dark It varies
Base 1,679 152 1,109 418 Don't know 1% 1% 1% 2% Not at all 58% 50% 57% 64% A little 24% 25% 27% 17% Moderately 9% 12% 9% 8% Quite a bit 5% 9% 5% 5% Very much 2% 4% 2% 4%
Q2c. To what extent do these precautions reduce your quality of life? / Q2ai Which of the following precautions do you take? Base: all who take precautions against crime when travelling on public transport (n=1,679)
© SPA Future Thinking 2014 Page 19 of 73
UK I FRANCE I ITALY
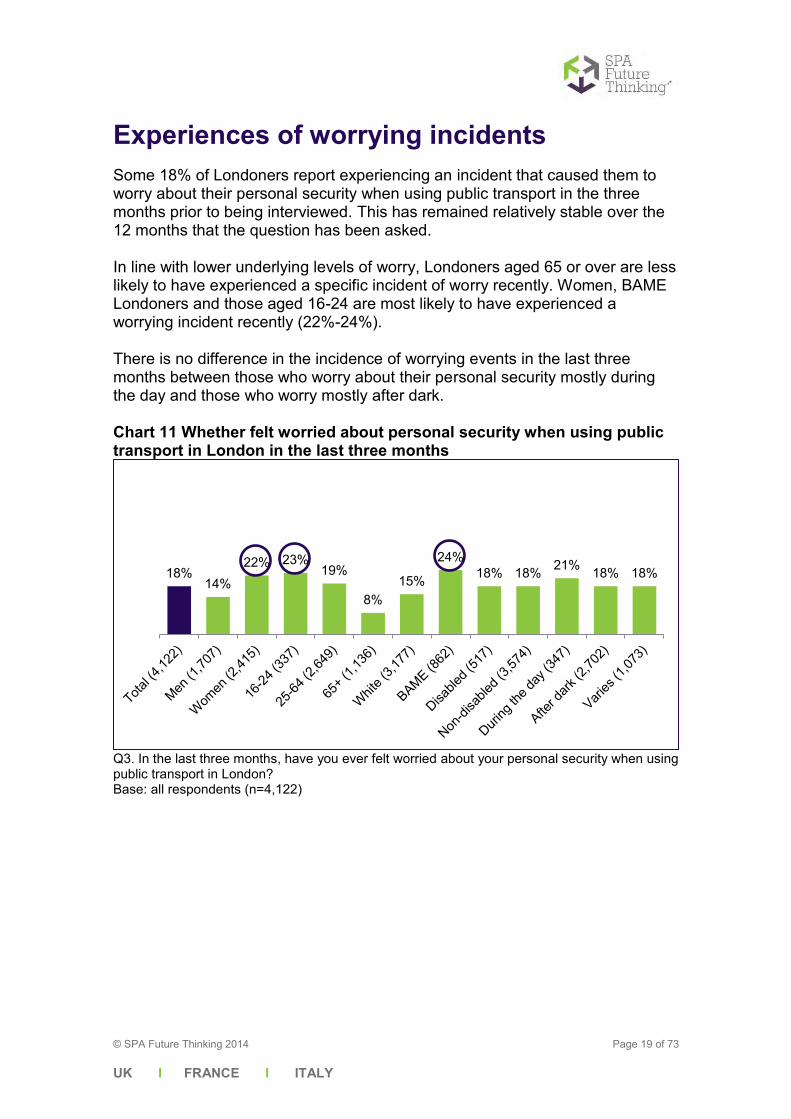
Experiences of worrying incidents Some 18% of Londoners report experiencing an incident that caused them to worry about their personal security when using public transport in the three months prior to being interviewed. This has remained relatively stable over the 12 months that the question has been asked. In line with lower underlying levels of worry, Londoners aged 65 or over are less likely to have experienced a specific incident of worry recently. Women, BAME Londoners and those aged 16-24 are most likely to have experienced a worrying incident recently (22%-24%). There is no difference in the incidence of worrying events in the last three months between those who worry about their personal security mostly during the day and those who worry mostly after dark. Chart 11 Whether felt worried about personal security when using public transport in London in the last three months
Q3. In the last three months, have you ever felt worried about your personal security when using public transport in London? Base: all respondents (n=4,122)
18% 14%
22% 23% 19%
8% 15%
24% 18% 18% 21% 18% 18%
© SPA Future Thinking 2014 Page 20 of 73
UK I FRANCE I ITALY
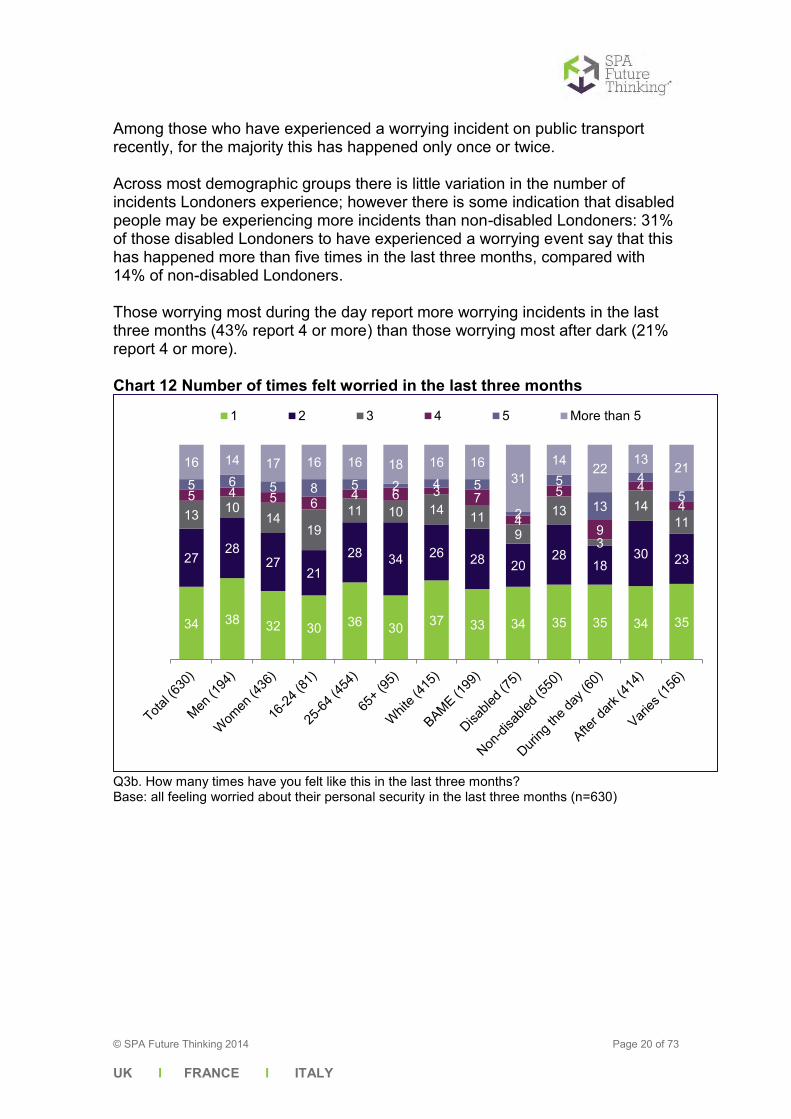
Among those who have experienced a worrying incident on public transport recently, for the majority this has happened only once or twice. Across most demographic groups there is little variation in the number of incidents Londoners experience; however there is some indication that disabled people may be experiencing more incidents than non-disabled Londoners: 31% of those disabled Londoners to have experienced a worrying event say that this has happened more than five times in the last three months, compared with 14% of non-disabled Londoners. Those worrying most during the day report more worrying incidents in the last three months (43% report 4 or more) than those worrying most after dark (21% report 4 or more). Chart 12 Number of times felt worried in the last three months
Q3b. How many times have you felt like this in the last three months? Base: all feeling worried about their personal security in the last three months (n=630)
34 38 32 30 36 30 37 33 34 35 35 34 35
27 28
27 21
28 34 26 28 20 28
18 30 23
13 10 14
19 11 10 14 11
9
13
3
14 11
5 4 5 6 4 6 3 7
4
5
9
4 4
5 6 5 8 5 2 4 5
2
5
13
4 5
16 14 17 16 16 18 16 16 31
14 22 13 21
1 2 3 4 5 More than 5
© SPA Future Thinking 2014 Page 21 of 73
UK I FRANCE I ITALY
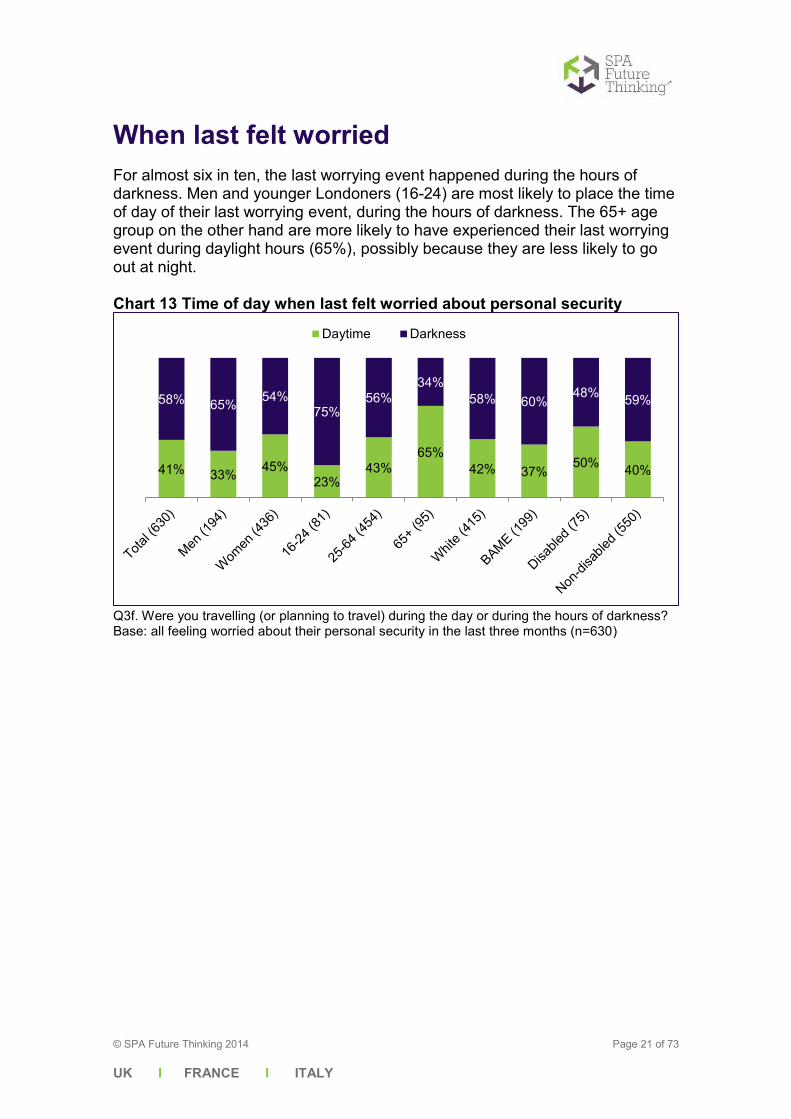
When last felt worried For almost six in ten, the last worrying event happened during the hours of darkness. Men and younger Londoners (16-24) are most likely to place the time of day of their last worrying event, during the hours of darkness. The 65+ age group on the other hand are more likely to have experienced their last worrying event during daylight hours (65%), possibly because they are less likely to go out at night. Chart 13 Time of day when last felt worried about personal security
Q3f. Were you travelling (or planning to travel) during the day or during the hours of darkness? Base: all feeling worried about their personal security in the last three months (n=630)
41% 33% 45% 23%
43% 65%
42% 37% 50% 40%
58% 65% 54% 75%
56% 34%
58% 60% 48% 59%
Daytime Darkness

© SPA Future Thinking 2014 Page 22 of 73
UK I FRANCE I ITALY
Where last felt worried In half of cases, the last worrying event happened in connection with a bus journey. Three in ten reported that it happened in connection with an Underground journey and one in five, a train journey. If this could be mapped on to operational data on passenger numbers, we could calculate whether worrying behaviour is comparatively more likely to occur with a particular mode. Incidents occurring after dark are more likely than those occurring during the day, to be associated with train journeys. Chart 14 Mode of transport on which felt worried on last occasion
Q3di. What mode of transport were you using (or planning to use) when you felt like this? Base: all feeling worried about their personal security in the last three months (n=630)
49%
29%
20%
2%
Bus
Tube
Train
Others
During the day (289)
After dark (335)
53%
30%
16%
1%
47%
28%
23%
3%
© SPA Future Thinking 2014 Page 23 of 73
UK I FRANCE I ITALY
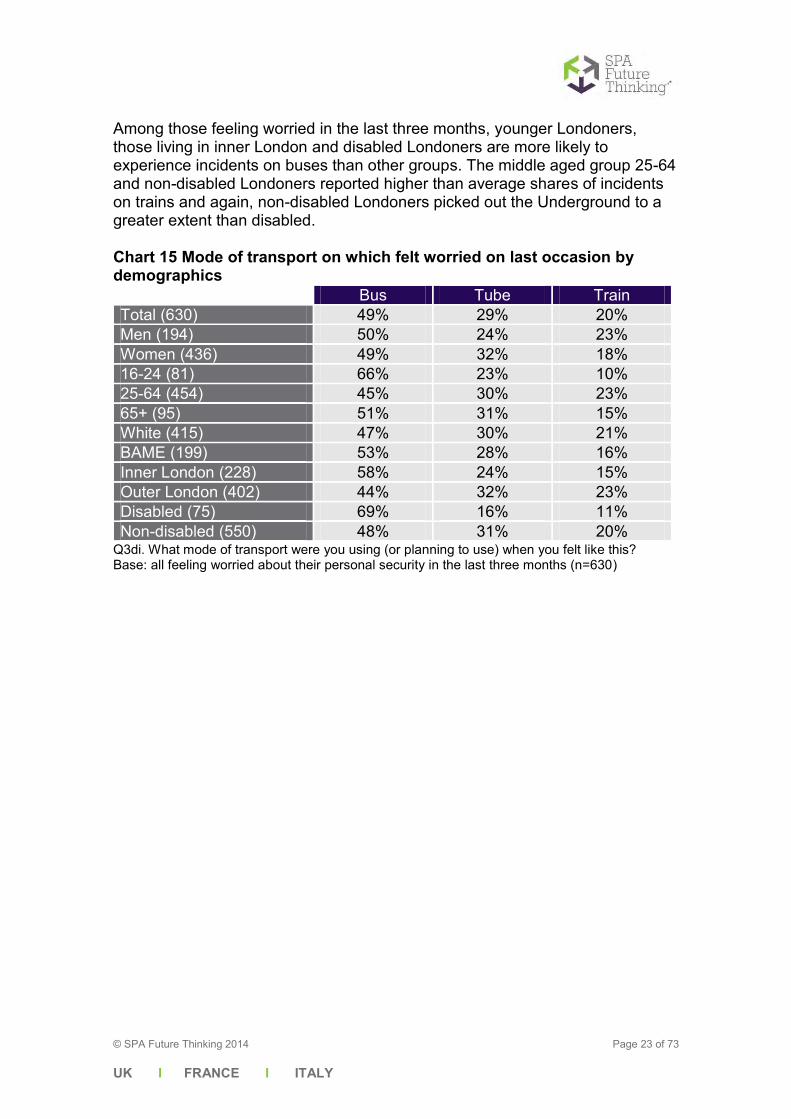
Among those feeling worried in the last three months, younger Londoners, those living in inner London and disabled Londoners are more likely to experience incidents on buses than other groups. The middle aged group 25-64 and non-disabled Londoners reported higher than average shares of incidents on trains and again, non-disabled Londoners picked out the Underground to a greater extent than disabled. Chart 15 Mode of transport on which felt worried on last occasion by demographics
Bus Tube Train Total (630) 49% 29% 20% Men (194) 50% 24% 23% Women (436) 49% 32% 18% 16-24 (81) 66% 23% 10% 25-64 (454) 45% 30% 23% 65+ (95) 51% 31% 15% White (415) 47% 30% 21% BAME (199) 53% 28% 16% Inner London (228) 58% 24% 15% Outer London (402) 44% 32% 23% Disabled (75) 69% 16% 11% Non-disabled (550) 48% 31% 20%
Q3di. What mode of transport were you using (or planning to use) when you felt like this? Base: all feeling worried about their personal security in the last three months (n=630)
© SPA Future Thinking 2014 Page 24 of 73
UK I FRANCE I ITALY
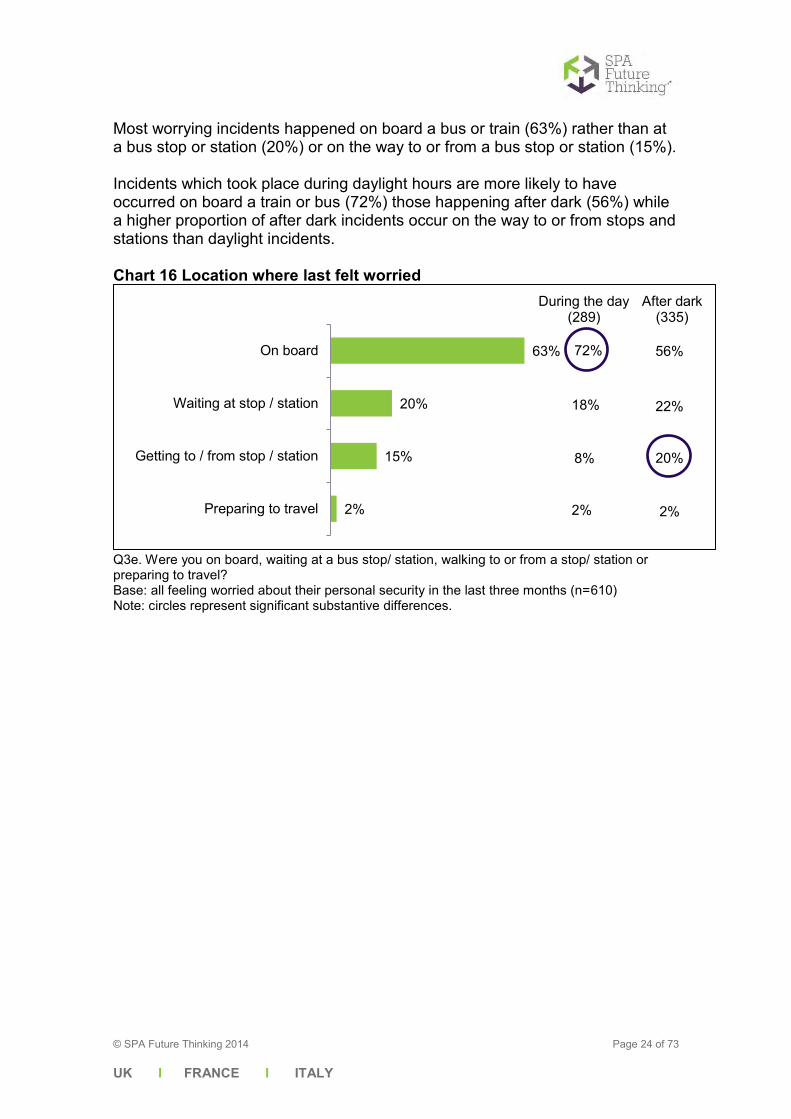
Most worrying incidents happened on board a bus or train (63%) rather than at a bus stop or station (20%) or on the way to or from a bus stop or station (15%). Incidents which took place during daylight hours are more likely to have occurred on board a train or bus (72%) those happening after dark (56%) while a higher proportion of after dark incidents occur on the way to or from stops and stations than daylight incidents. Chart 16 Location where last felt worried
Q3e. Were you on board, waiting at a bus stop/ station, walking to or from a stop/ station or preparing to travel? Base: all feeling worried about their personal security in the last three months (n=610) Note: circles represent significant substantive differences.
63%
20%
15%
2%
On board
Waiting at stop / station
Getting to / from stop / station
Preparing to travel
During the day (289)
After dark (335)
72% 56%
22% 18%
20% 8%
2% 2%

© SPA Future Thinking 2014 Page 25 of 73
UK I FRANCE I ITALY
Nature of last worrying incident By far the most common worrying incident experienced by the travelling public is threatening behaviour by other passengers mentioned by 37% of those experiencing incidents (or 7% of all Londoners). The next most common incidents are drunken passengers (18%) and large groups of schoolchildren/ youths (18%) or 3% each among the total London population. While incidents of threatening behaviour are split evenly between daytime and night time, experiences of drunken passengers, large groups of schoolchildren/ youths and anti-social behaviour are more likely to occur after dark. Chart 17 Nature of incident on last occasion felt worried
Q3g. What made you feel worried? Base: all feeling worried about their personal security in the last three months (n=630) Answers over 4% shown
37%
18%
18%
8%
7%
6%
6%
5%
Threatening behaviour of other passengers
Drunken passengers
Large groups of school children / youths
Anti-social behaviour
Physical isolation
Being a victim of crime
Busy environment / large crowds of people
Other people /strangers / suspicious lookingpeople / behaviour
During the day 46% After dark 53% Don’t know 1%
During the day 29% After dark 71%
During the day 36% After dark 64%
During the day 19% After dark 81%
© SPA Future Thinking 2014 Page 26 of 73
UK I FRANCE I ITALY
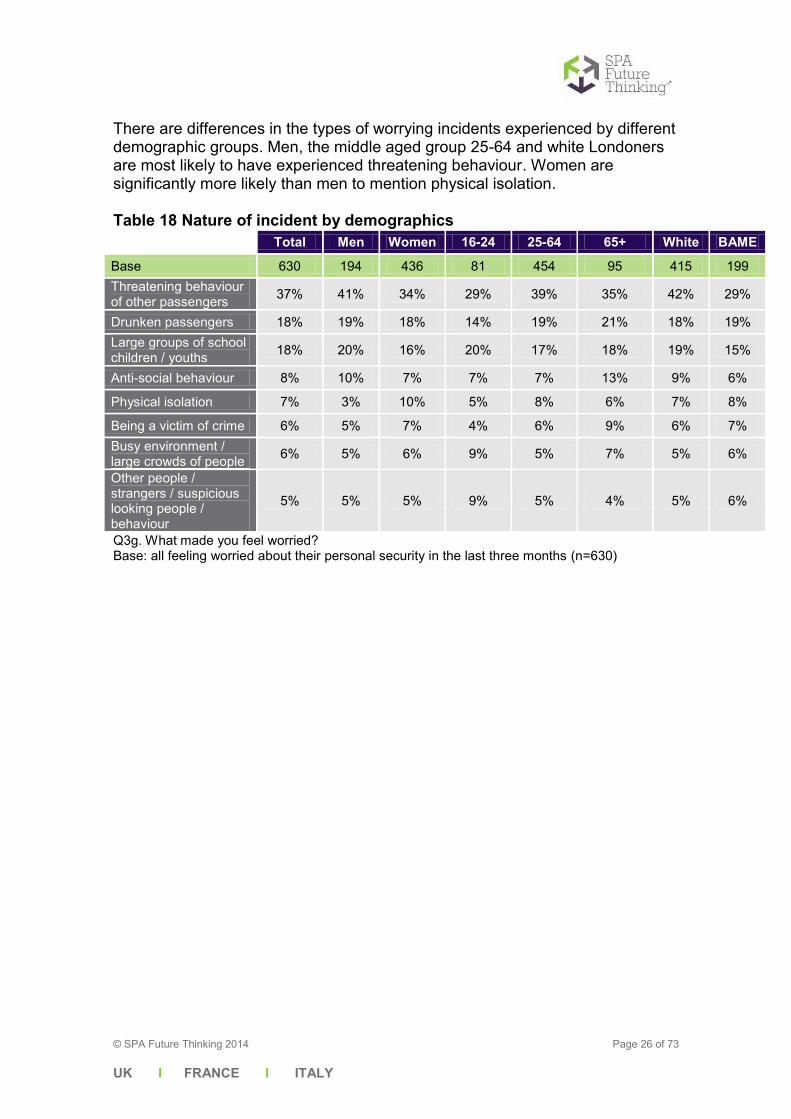
There are differences in the types of worrying incidents experienced by different demographic groups. Men, the middle aged group 25-64 and white Londoners are most likely to have experienced threatening behaviour. Women are significantly more likely than men to mention physical isolation. Table 18 Nature of incident by demographics
Total Men Women 16-24 25-64 65+ White BAME
Base 630 194 436 81 454 95 415 199 Threatening behaviour of other passengers 37% 41% 34% 29% 39% 35% 42% 29%
Drunken passengers 18% 19% 18% 14% 19% 21% 18% 19% Large groups of school children / youths 18% 20% 16% 20% 17% 18% 19% 15%
Anti-social behaviour 8% 10% 7% 7% 7% 13% 9% 6%
Physical isolation 7% 3% 10% 5% 8% 6% 7% 8%
Being a victim of crime 6% 5% 7% 4% 6% 9% 6% 7% Busy environment / large crowds of people 6% 5% 6% 9% 5% 7% 5% 6%
Other people / strangers / suspicious looking people / behaviour
5% 5% 5% 9% 5% 4% 5% 6%
Q3g. What made you feel worried? Base: all feeling worried about their personal security in the last three months (n=630)
© SPA Future Thinking 2014 Page 27 of 73
UK I FRANCE I ITALY
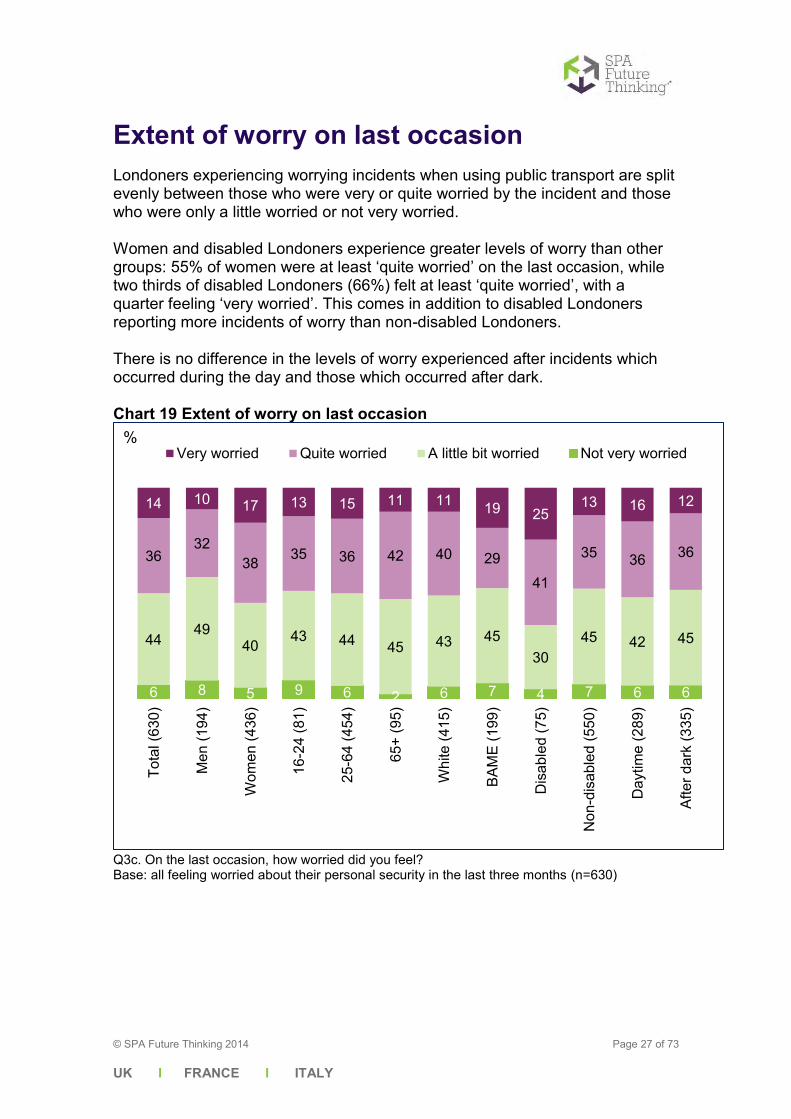
Extent of worry on last occasion Londoners experiencing worrying incidents when using public transport are split evenly between those who were very or quite worried by the incident and those who were only a little worried or not very worried. Women and disabled Londoners experience greater levels of worry than other groups: 55% of women were at least ‘quite worried’ on the last occasion, while two thirds of disabled Londoners (66%) felt at least ‘quite worried’, with a quarter feeling ‘very worried’. This comes in addition to disabled Londoners reporting more incidents of worry than non-disabled Londoners. There is no difference in the levels of worry experienced after incidents which occurred during the day and those which occurred after dark. Chart 19 Extent of worry on last occasion
Q3c. On the last occasion, how worried did you feel? Base: all feeling worried about their personal security in the last three months (n=630)
6 8 5 9 6 2 6 7 4 7 6 6
44 49
40 43 44 45 43 45 30
45 42 45
36 32
38 35 36 42 40 29 41
35 36 36
14 10 17 13 15 11 11 19 25 13 16 12
Tota
l (63
0)
Men
(194
)
Wom
en (4
36)
16-2
4 (8
1)
25-6
4 (4
54)
65+
(95)
Whi
te (4
15)
BAM
E (1
99)
Dis
able
d (7
5)
Non
-dis
able
d (5
50)
Day
time
(289
)
Afte
r dar
k (3
35)
Very worried Quite worried A little bit worried Not very worried%
© SPA Future Thinking 2014 Page 28 of 73
UK I FRANCE I ITALY
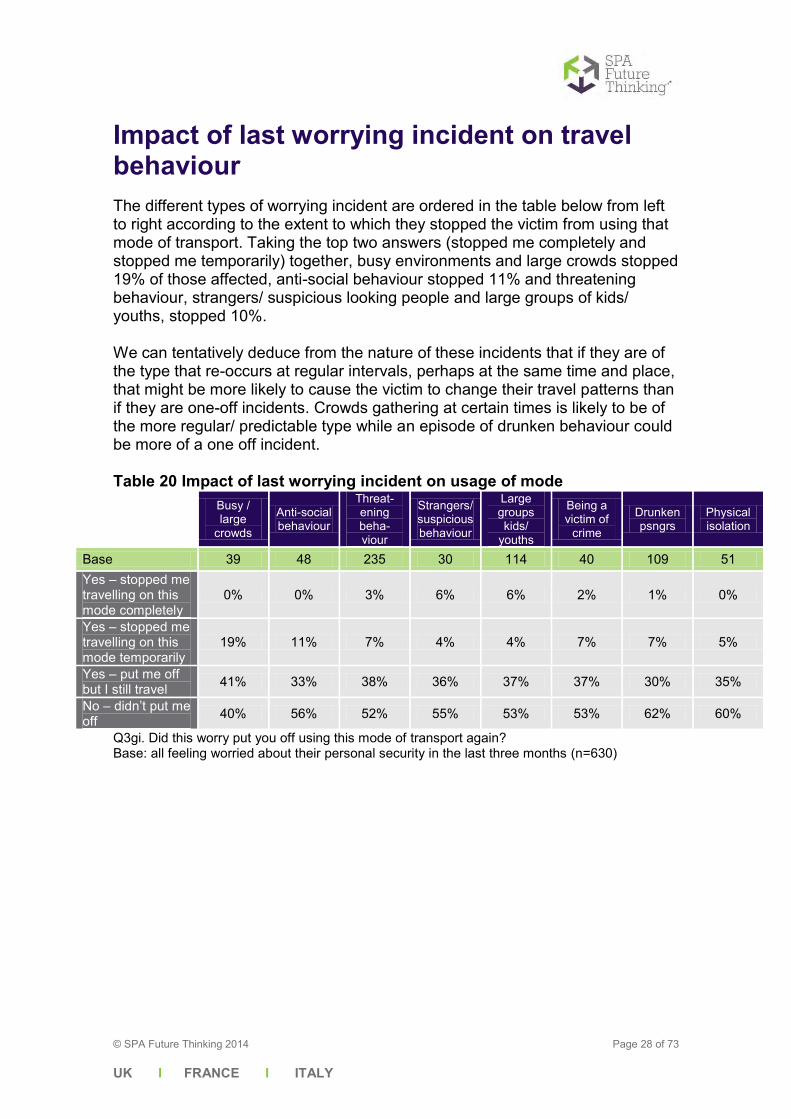
Impact of last worrying incident on travel behaviour The different types of worrying incident are ordered in the table below from left to right according to the extent to which they stopped the victim from using that mode of transport. Taking the top two answers (stopped me completely and stopped me temporarily) together, busy environments and large crowds stopped 19% of those affected, anti-social behaviour stopped 11% and threatening behaviour, strangers/ suspicious looking people and large groups of kids/ youths, stopped 10%. We can tentatively deduce from the nature of these incidents that if they are of the type that re-occurs at regular intervals, perhaps at the same time and place, that might be more likely to cause the victim to change their travel patterns than if they are one-off incidents. Crowds gathering at certain times is likely to be of the more regular/ predictable type while an episode of drunken behaviour could be more of a one off incident. Table 20 Impact of last worrying incident on usage of mode
Busy / large
crowds
Anti-social behaviour
Threat-ening beha-viour
Strangers/ suspicious behaviour
Large groups kids/
youths
Being a victim of
crime
Drunken psngrs
Physical isolation
Base 39 48 235 30 114 40 109 51 Yes – stopped me travelling on this mode completely
0% 0% 3% 6% 6% 2% 1% 0%
Yes – stopped me travelling on this mode temporarily
19% 11% 7% 4% 4% 7% 7% 5%
Yes – put me off but I still travel 41% 33% 38% 36% 37% 37% 30% 35%
No – didn’t put me off 40% 56% 52% 55% 53% 53% 62% 60%
Q3gi. Did this worry put you off using this mode of transport again? Base: all feeling worried about their personal security in the last three months (n=630)
© SPA Future Thinking 2014 Page 29 of 73
UK I FRANCE I ITALY
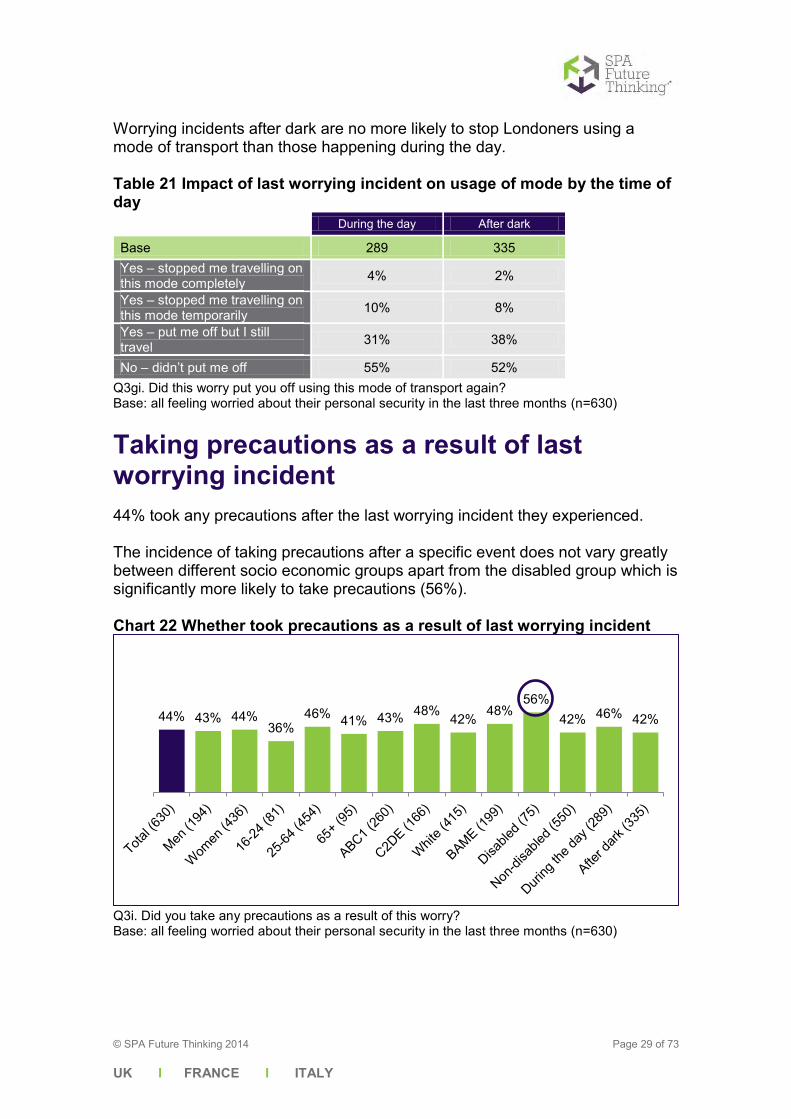
Worrying incidents after dark are no more likely to stop Londoners using a mode of transport than those happening during the day. Table 21 Impact of last worrying incident on usage of mode by the time of day
During the day After dark
Base 289 335 Yes – stopped me travelling on this mode completely 4% 2%
Yes – stopped me travelling on this mode temporarily 10% 8%
Yes – put me off but I still travel 31% 38%
No – didn’t put me off 55% 52% Q3gi. Did this worry put you off using this mode of transport again? Base: all feeling worried about their personal security in the last three months (n=630)
Taking precautions as a result of last worrying incident 44% took any precautions after the last worrying incident they experienced. The incidence of taking precautions after a specific event does not vary greatly between different socio economic groups apart from the disabled group which is significantly more likely to take precautions (56%). Chart 22 Whether took precautions as a result of last worrying incident
Q3i. Did you take any precautions as a result of this worry? Base: all feeling worried about their personal security in the last three months (n=630)
44% 43% 44% 36%
46% 41% 43% 48% 42% 48% 56%
42% 46% 42%
© SPA Future Thinking 2014 Page 30 of 73
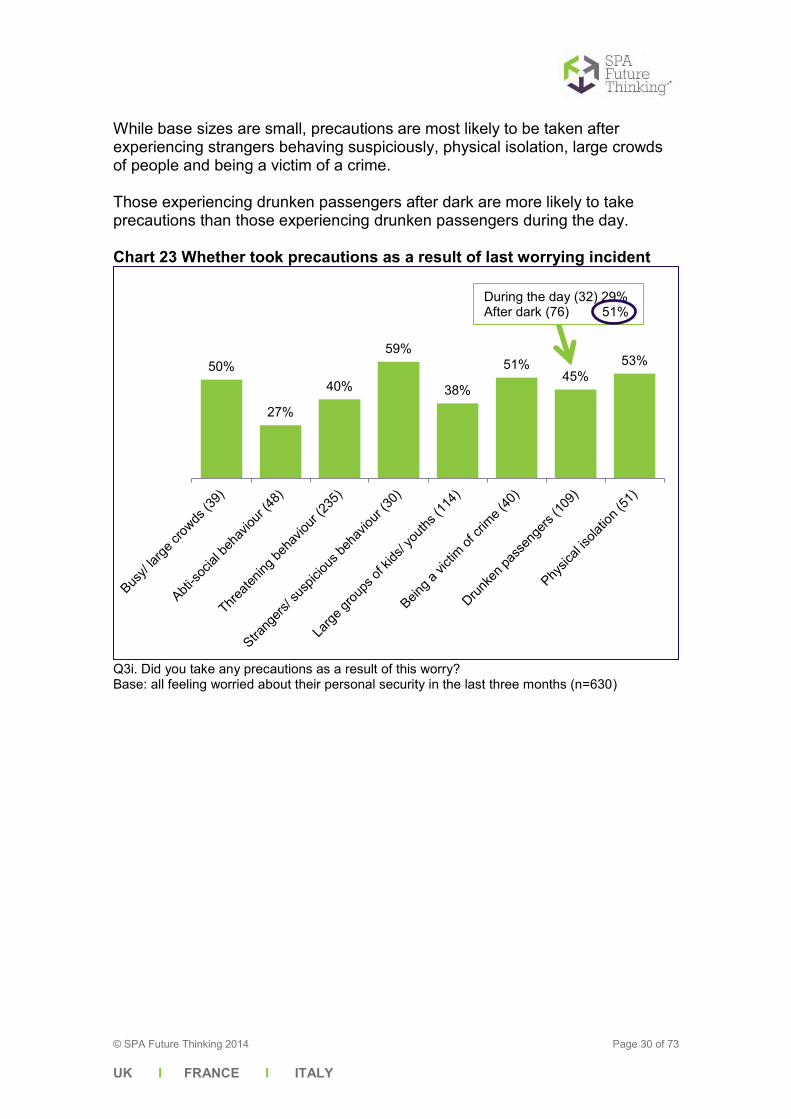
UK I FRANCE I ITALY
While base sizes are small, precautions are most likely to be taken after experiencing strangers behaving suspiciously, physical isolation, large crowds of people and being a victim of a crime. Those experiencing drunken passengers after dark are more likely to take precautions than those experiencing drunken passengers during the day. Chart 23 Whether took precautions as a result of last worrying incident
Q3i. Did you take any precautions as a result of this worry? Base: all feeling worried about their personal security in the last three months (n=630)
50%
27%
40%
59%
38%
51% 45%
53%
During the day (32) 29% After dark (76) 51%

© SPA Future Thinking 2014 Page 31 of 73
UK I FRANCE I ITALY
Asked which precautions they took as a result of their last worrying incident, a quarter sat near to other people, one in seven used a different route, another one in seven travelled with someone else, one in eight avoided using that mode of transport and another one in eight travelled at a different time of day. Those whose last worrying incident happened after dark are more likely to take the precaution of travelling with someone else than those whose last worrying incident happened during the day. Chart 24 Precautions taken as a result of last worrying incident
Q3j. Which of the following precautions did you take? Base: all taking precautions as a result of last worrying incident (n=273) The base sizes for those taking precautions for different types of incident are too small to look at precautions taken by type of incident.
26%
15%
14%
13%
12%
Sat near to other people
Used a different route
Travelled with someone else
Avoided using that mode oftransport
Travelled at a different time ofday
During the day (130)
After dark (140)
31% 23%
17% 14%
18% 9%
12% 13%
13% 11%
© SPA Future Thinking 2014 Page 32 of 73
UK I FRANCE I ITALY
Unwelcome sexual behaviour Over the duration of the survey we have asked a series of questions about Londoners’ experiences of unwelcome sexual behaviour on and around the public transport network. Such incidents are thankfully rare. Over the course of 2013, some 218 people in the survey reported experiencing unwelcome sexual behaviour while using public transport in London. Having this number allows us for the first time to report findings for these questions with robust numbers of respondents at a total sample level.
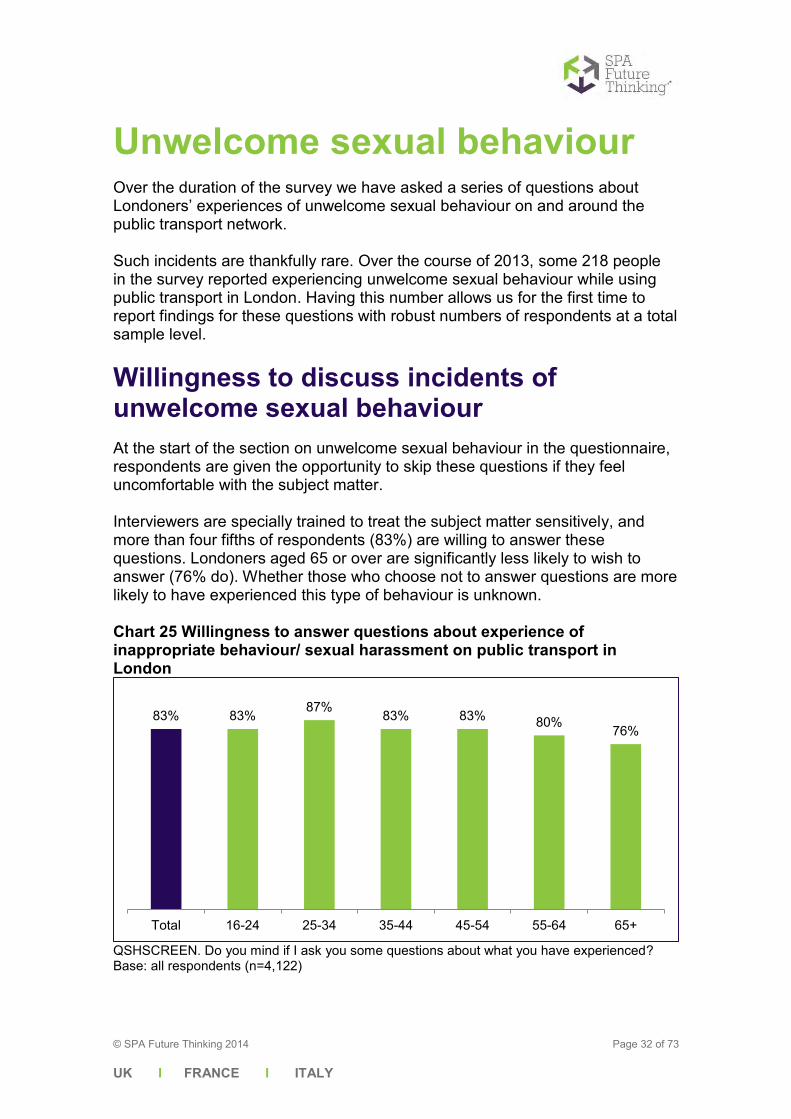
Willingness to discuss incidents of unwelcome sexual behaviour At the start of the section on unwelcome sexual behaviour in the questionnaire, respondents are given the opportunity to skip these questions if they feel uncomfortable with the subject matter. Interviewers are specially trained to treat the subject matter sensitively, and more than four fifths of respondents (83%) are willing to answer these questions. Londoners aged 65 or over are significantly less likely to wish to answer (76% do). Whether those who choose not to answer questions are more likely to have experienced this type of behaviour is unknown. Chart 25 Willingness to answer questions about experience of inappropriate behaviour/ sexual harassment on public transport in London
QSHSCREEN. Do you mind if I ask you some questions about what you have experienced? Base: all respondents (n=4,122)
83% 83% 87% 83% 83% 80% 76%
Total 16-24 25-34 35-44 45-54 55-64 65+
© SPA Future Thinking 2014 Page 33 of 73
UK I FRANCE I ITALY
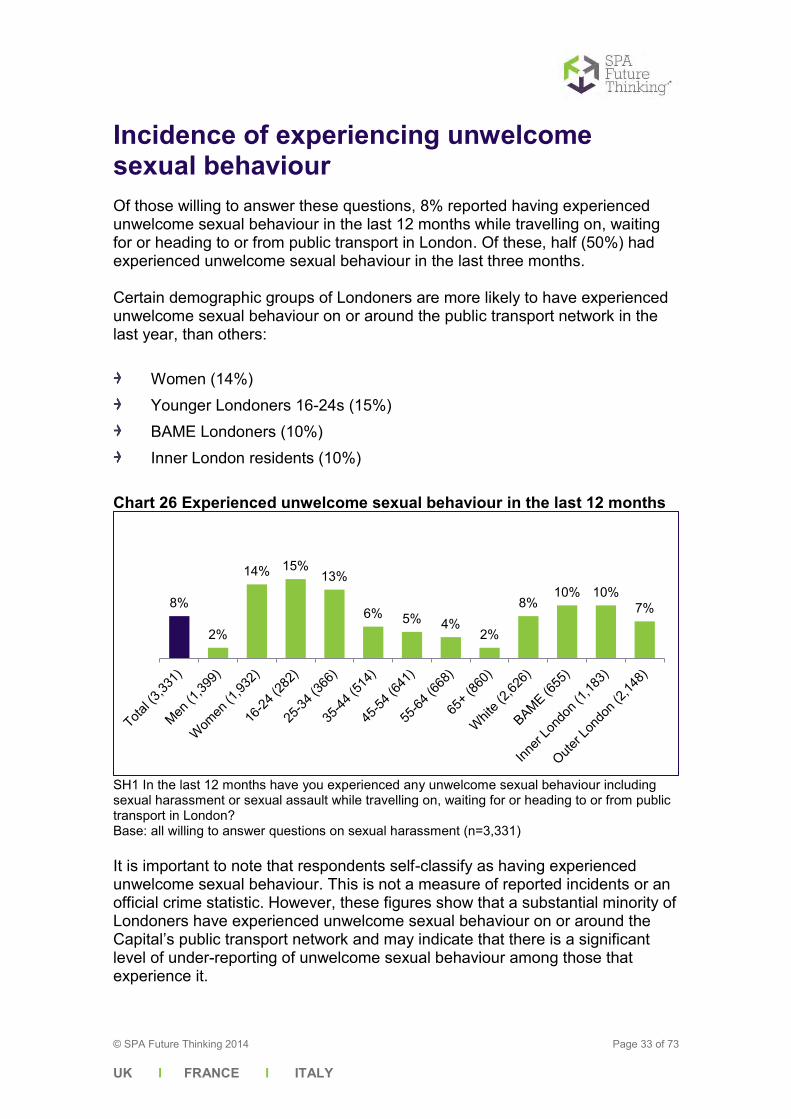
Incidence of experiencing unwelcome sexual behaviour Of those willing to answer these questions, 8% reported having experienced unwelcome sexual behaviour in the last 12 months while travelling on, waiting for or heading to or from public transport in London. Of these, half (50%) had experienced unwelcome sexual behaviour in the last three months. Certain demographic groups of Londoners are more likely to have experienced unwelcome sexual behaviour on or around the public transport network in the last year, than others: Women (14%) Younger Londoners 16-24s (15%) BAME Londoners (10%) Inner London residents (10%)
Chart 26 Experienced unwelcome sexual behaviour in the last 12 months
SH1 In the last 12 months have you experienced any unwelcome sexual behaviour including sexual harassment or sexual assault while travelling on, waiting for or heading to or from public transport in London? Base: all willing to answer questions on sexual harassment (n=3,331) It is important to note that respondents self-classify as having experienced unwelcome sexual behaviour. This is not a measure of reported incidents or an official crime statistic. However, these figures show that a substantial minority of Londoners have experienced unwelcome sexual behaviour on or around the Capital’s public transport network and may indicate that there is a significant level of under-reporting of unwelcome sexual behaviour among those that experience it.
8%
2%
14% 15% 13%
6% 5% 4% 2%
8% 10% 10%
7%
© SPA Future Thinking 2014 Page 34 of 73
UK I FRANCE I ITALY
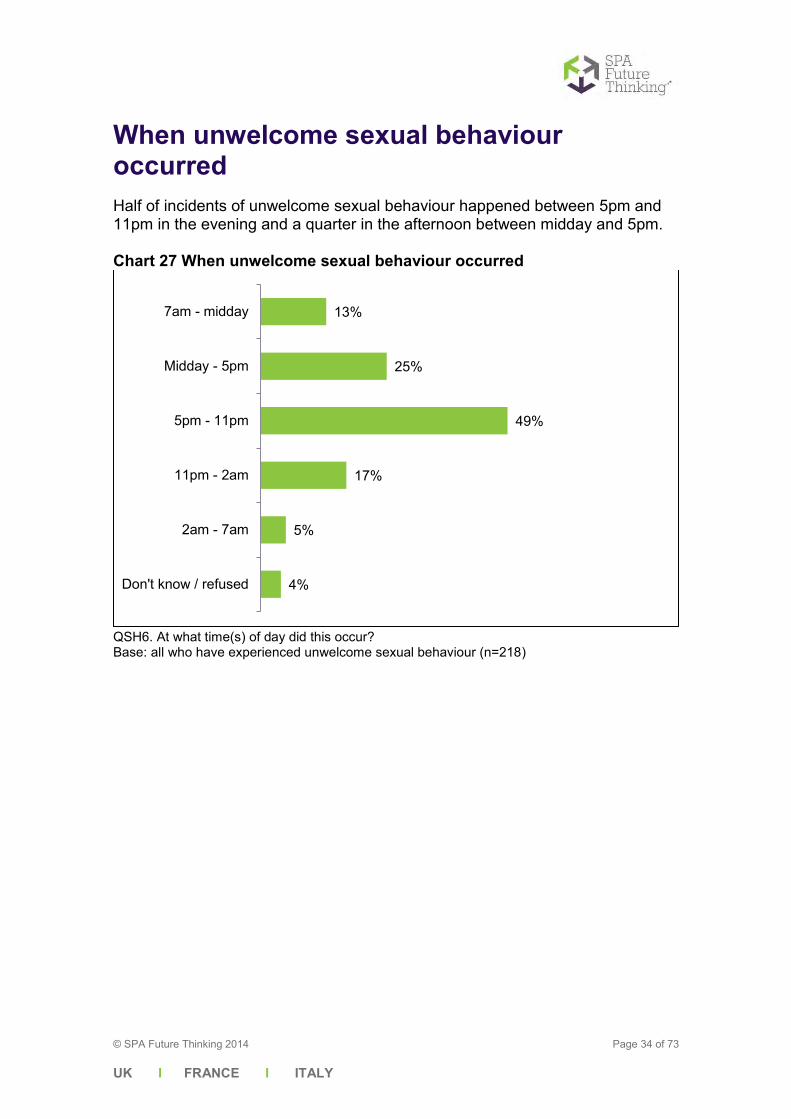
When unwelcome sexual behaviour occurred Half of incidents of unwelcome sexual behaviour happened between 5pm and 11pm in the evening and a quarter in the afternoon between midday and 5pm. Chart 27 When unwelcome sexual behaviour occurred
QSH6. At what time(s) of day did this occur? Base: all who have experienced unwelcome sexual behaviour (n=218)
13%
25%
49%
17%
5%
4%
7am - midday
Midday - 5pm
5pm - 11pm
11pm - 2am
2am - 7am
Don't know / refused
© SPA Future Thinking 2014 Page 35 of 73
UK I FRANCE I ITALY
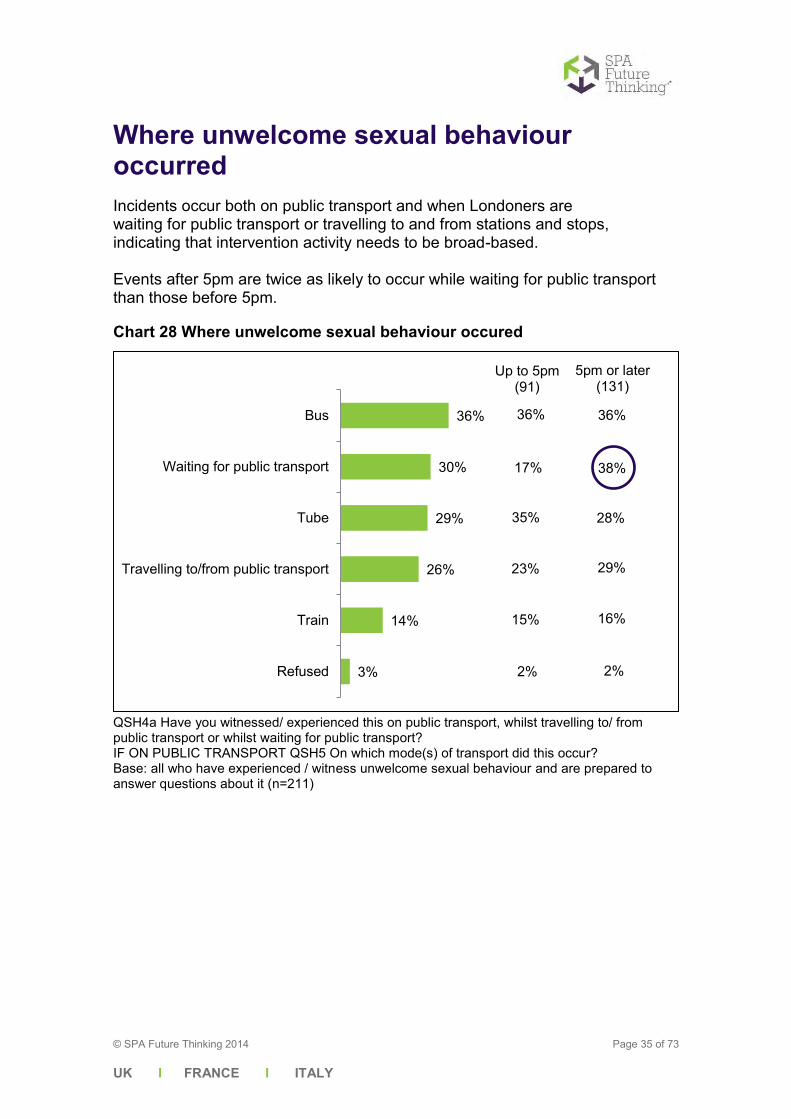
Where unwelcome sexual behaviour occurred Incidents occur both on public transport and when Londoners are waiting for public transport or travelling to and from stations and stops, indicating that intervention activity needs to be broad-based. Events after 5pm are twice as likely to occur while waiting for public transport than those before 5pm.
Chart 28 Where unwelcome sexual behaviour occured
QSH4a Have you witnessed/ experienced this on public transport, whilst travelling to/ from public transport or whilst waiting for public transport? IF ON PUBLIC TRANSPORT QSH5 On which mode(s) of transport did this occur? Base: all who have experienced / witness unwelcome sexual behaviour and are prepared to answer questions about it (n=211)
36%
30%
29%
26%
14%
3%
Bus
Waiting for public transport
Tube
Travelling to/from public transport
Train
Refused
Up to 5pm (91)
5pm or later (131)
36% 36%
38% 17%
29% 23%
2% 2%
28% 35%
16% 15%
© SPA Future Thinking 2014 Page 36 of 73
UK I FRANCE I ITALY
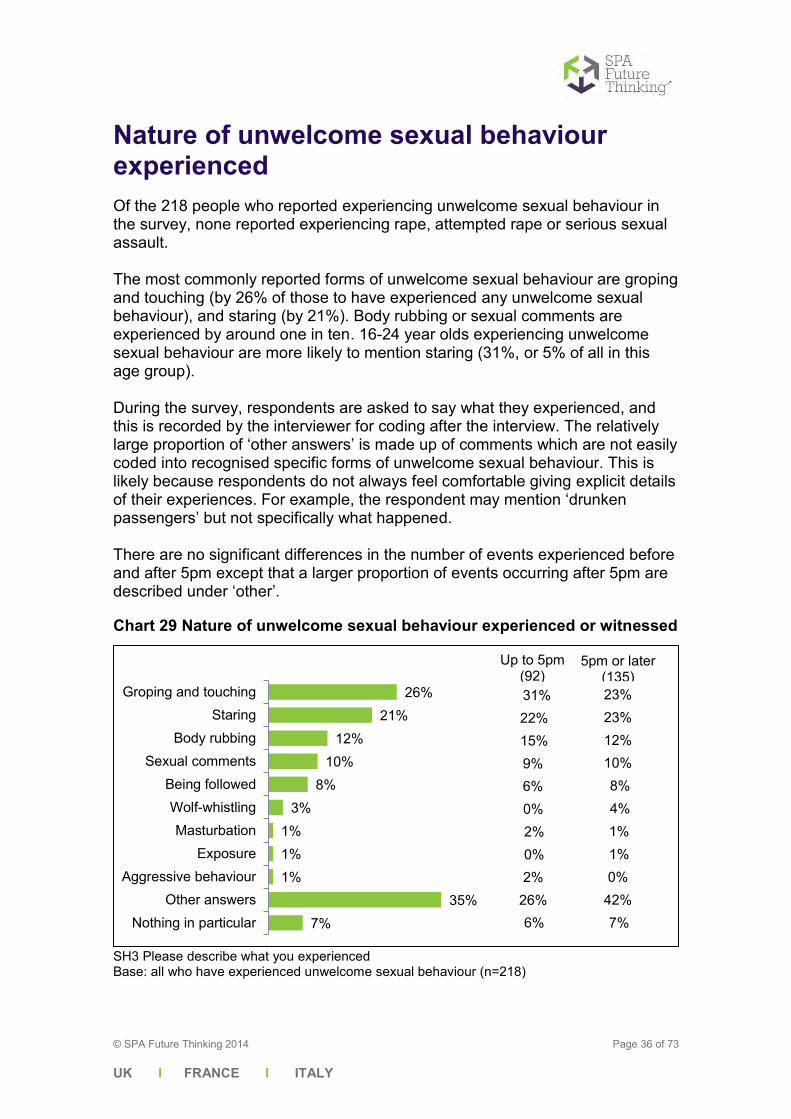
Nature of unwelcome sexual behaviour experienced Of the 218 people who reported experiencing unwelcome sexual behaviour in the survey, none reported experiencing rape, attempted rape or serious sexual assault. The most commonly reported forms of unwelcome sexual behaviour are groping and touching (by 26% of those to have experienced any unwelcome sexual behaviour), and staring (by 21%). Body rubbing or sexual comments are experienced by around one in ten. 16-24 year olds experiencing unwelcome sexual behaviour are more likely to mention staring (31%, or 5% of all in this age group). During the survey, respondents are asked to say what they experienced, and this is recorded by the interviewer for coding after the interview. The relatively large proportion of ‘other answers’ is made up of comments which are not easily coded into recognised specific forms of unwelcome sexual behaviour. This is likely because respondents do not always feel comfortable giving explicit details of their experiences. For example, the respondent may mention ‘drunken passengers’ but not specifically what happened. There are no significant differences in the number of events experienced before and after 5pm except that a larger proportion of events occurring after 5pm are described under ‘other’.
Chart 29 Nature of unwelcome sexual behaviour experienced or witnessed
SH3 Please describe what you experienced Base: all who have experienced unwelcome sexual behaviour (n=218)
26% 21%
12% 10%
8% 3%
1% 1% 1%
35% 7%
Groping and touchingStaring
Body rubbingSexual comments
Being followedWolf-whistlingMasturbation
ExposureAggressive behaviour
Other answersNothing in particular
Up to 5pm (92)
5pm or later (135)
31% 23% 23% 22%
10% 9%
4% 0%
0% 2%
12% 15%
8% 6%
1% 2% 1% 0%
42% 26% 7% 6%
© SPA Future Thinking 2014 Page 37 of 73
UK I FRANCE I ITALY
As seen with the overall incidence of worrying events, the nature of reported incidents varies according to demographic characteristics of the person experiencing it. Though sample sizes are too small for robust analysis, even when combining four waves of data, it appears that Londoners aged 16-24 are more likely to experience a range of incidents than older Londoners.
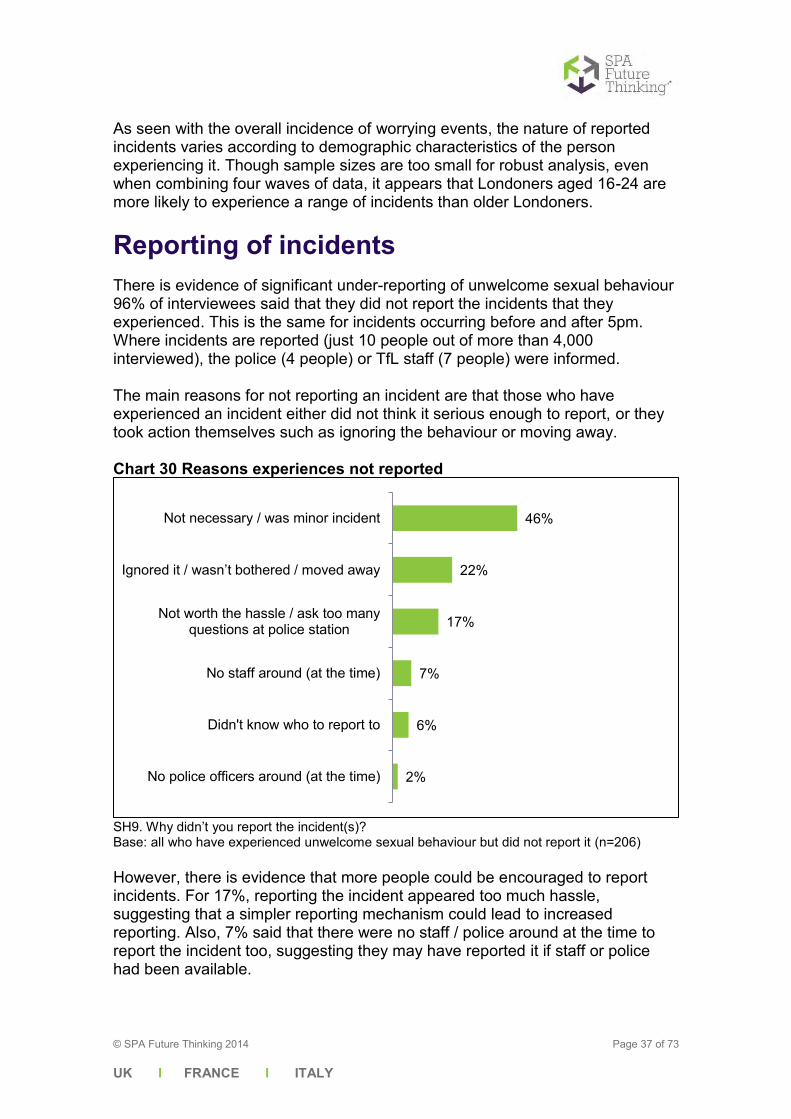
Reporting of incidents There is evidence of significant under-reporting of unwelcome sexual behaviour 96% of interviewees said that they did not report the incidents that they experienced. This is the same for incidents occurring before and after 5pm. Where incidents are reported (just 10 people out of more than 4,000 interviewed), the police (4 people) or TfL staff (7 people) were informed. The main reasons for not reporting an incident are that those who have experienced an incident either did not think it serious enough to report, or they took action themselves such as ignoring the behaviour or moving away. Chart 30 Reasons experiences not reported
SH9. Why didn’t you report the incident(s)? Base: all who have experienced unwelcome sexual behaviour but did not report it (n=206) However, there is evidence that more people could be encouraged to report incidents. For 17%, reporting the incident appeared too much hassle, suggesting that a simpler reporting mechanism could lead to increased reporting. Also, 7% said that there were no staff / police around at the time to report the incident too, suggesting they may have reported it if staff or police had been available.
46%
22%
17%
7%
6%
2%
Not necessary / was minor incident
Ignored it / wasn’t bothered / moved away
Not worth the hassle / ask too manyquestions at police station
No staff around (at the time)
Didn't know who to report to
No police officers around (at the time)
© SPA Future Thinking 2014 Page 38 of 73
UK I FRANCE I ITALY
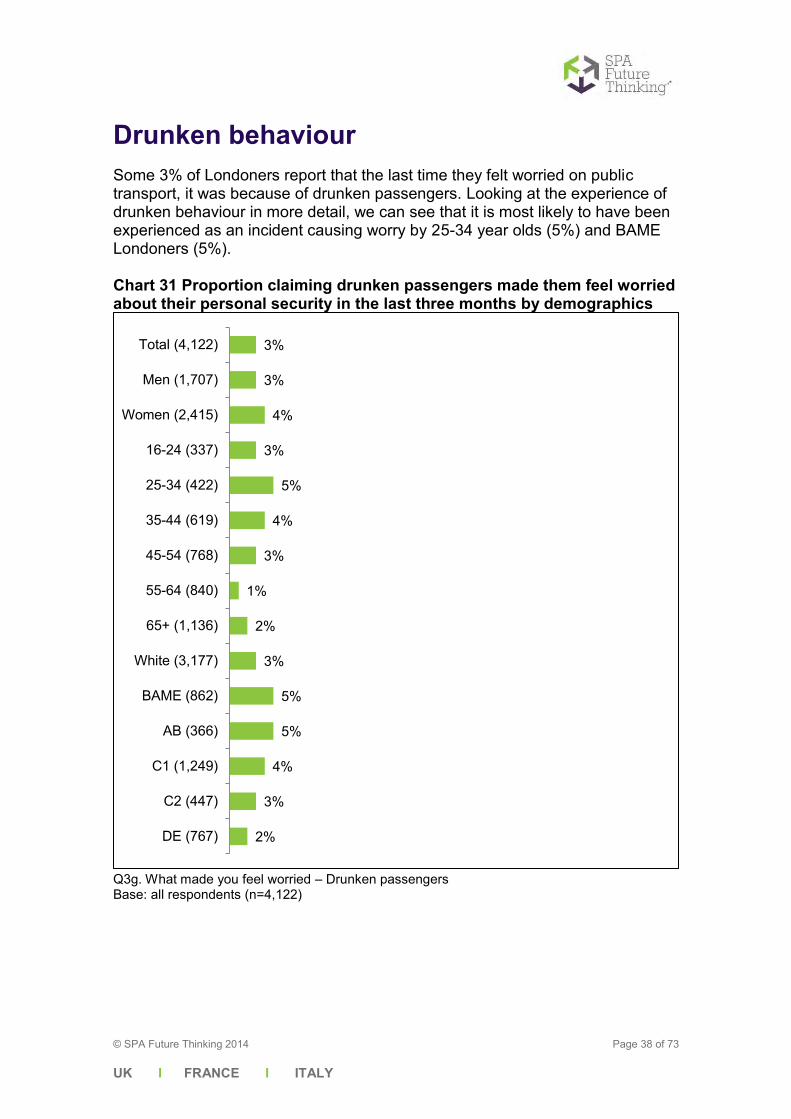
Drunken behaviour Some 3% of Londoners report that the last time they felt worried on public transport, it was because of drunken passengers. Looking at the experience of drunken behaviour in more detail, we can see that it is most likely to have been experienced as an incident causing worry by 25-34 year olds (5%) and BAME Londoners (5%). Chart 31 Proportion claiming drunken passengers made them feel worried about their personal security in the last three months by demographics
Q3g. What made you feel worried – Drunken passengers Base: all respondents (n=4,122)
3%
3%
4%
3%
5%
4%
3%
1%
2%
3%
5%
5%
4%
3%
2%
Total (4,122)
Men (1,707)
Women (2,415)
16-24 (337)
25-34 (422)
35-44 (619)
45-54 (768)
55-64 (840)
65+ (1,136)
White (3,177)
BAME (862)
AB (366)
C1 (1,249)
C2 (447)
DE (767)
© SPA Future Thinking 2014 Page 39 of 73
UK I FRANCE I ITALY
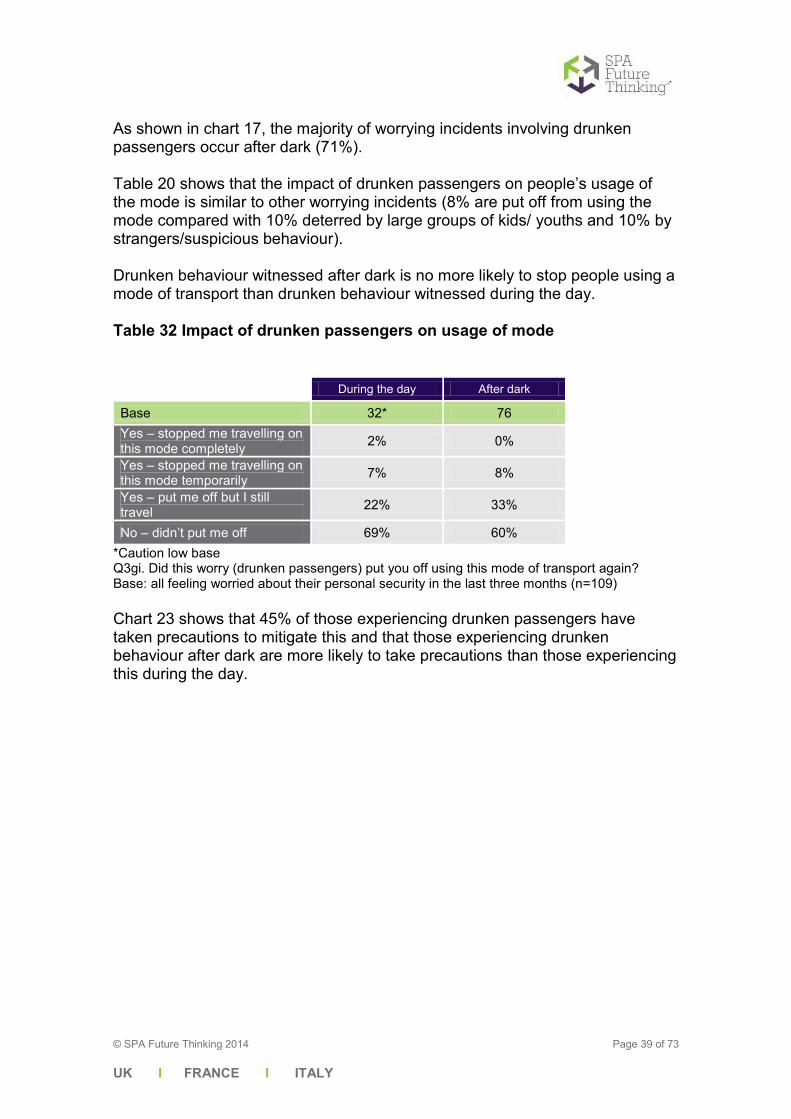
As shown in chart 17, the majority of worrying incidents involving drunken passengers occur after dark (71%). Table 20 shows that the impact of drunken passengers on people’s usage of the mode is similar to other worrying incidents (8% are put off from using the mode compared with 10% deterred by large groups of kids/ youths and 10% by strangers/suspicious behaviour). Drunken behaviour witnessed after dark is no more likely to stop people using a mode of transport than drunken behaviour witnessed during the day. Table 32 Impact of drunken passengers on usage of mode
During the day After dark
Base 32* 76 Yes – stopped me travelling on this mode completely 2% 0%
Yes – stopped me travelling on this mode temporarily 7% 8%
Yes – put me off but I still travel 22% 33%
No – didn’t put me off 69% 60% *Caution low base Q3gi. Did this worry (drunken passengers) put you off using this mode of transport again? Base: all feeling worried about their personal security in the last three months (n=109) Chart 23 shows that 45% of those experiencing drunken passengers have taken precautions to mitigate this and that those experiencing drunken behaviour after dark are more likely to take precautions than those experiencing this during the day.

© SPA Future Thinking 2014 Page 40 of 73
UK I FRANCE I ITALY
Appendix – questionnaire TfL attitudes to safety & security study all quarters full questionnaire Good morning/afternoon/evening. My name is ….. and I am calling from SPA Future Thinking, an independent research agency. We are carrying out a survey on behalf of Transport for London about transport issues in the capital and travelling around London. The survey will take about XX minutes depending on your answers (JAN/JUL/APRIL/OCT = 15/15/20/25) QBIRTHDAY: To be sure we talk to a cross-section of Londoners, please can I speak to the person aged 16 or over in your household who celebrates their birthday next? IF NOT AVAILABLE, RECORD NAME OF PERSON AND MAKE APPOINTMENT TO CALL BACK. REPEAT INTRODUCTION. May I assure you that we are a member of the Market Research Society and follow their strict Code of Conduct. As such you will not be subject to follow-up sales of any kind and all your answers will remain confidential to Transport for London and the research agencies working on their behalf. Before we start, may I just check a couple of classification questions? ALL QUARTERS QGENDER: (Do not ask)
1. Male 2. Female
ALL QUARTERS QEXEMPT: Do you or does anyone in your household work in any of these organisations? READ OUT
1. London Transport/Transport for London CLOSE 2. London Underground CLOSE 3. British/National Rail/ Train operating company CLOSE 4. Taxi or Minicab firms* CONTINUE 5. Bus or coach operators CLOSE 6. Marketing/PR/journalism/advertising/ Market research CLOSE 7. (None/Don’t know)* CONTINUE
© SPA Future Thinking 2014 Page 41 of 73
UK I FRANCE I ITALY
ALL QUARTERS AGE: Before we start, may I just ask what your age was last birthday? ENTER EXACT AGE USE -1 FOR REFUSED CATI TO CODE TO FOLLOWING AGE BANDS:
1. 16-34 2. 35-54 3. 55+
IF REFUSED THANK AND CLOSE ALL QUARTERS IF AGED 15 OR LESS QAGE2: Is it possible to speak to someone aged 16 or over please?
1. Yes – Take referral 2. No – Close
NOTE FOR SCRIPTER – PLEASE PROGRAMME ANSWERS TO READ INTO DUMMYAGE ALL QUARTERS QBOROUGH: Which London borough do you live in?
1. Barking & Dagenham 18. Hillingdon 2. Barnet 19. Hounslow 3. Bexley 20. Islington 4. Brent 21. Kensington & Chelsea 5. Bromley 22. Kingston-upon-Thames 6. Camden 23. Lambeth 7. City of London 24. Lewisham 8. City of Westminster 25. Merton 9. Croydon 26. Newham 10. Ealing 27. Redbridge 11. Enfield 28. Richmond-upon-Thames 12. Greenwich 29. Southwark 13. Hackney 30. Sutton 14. Hammersmith & Fulham 31. Tower Hamlets 15. Haringey 32. Waltham Forest 16. Harrow 33. Wandsworth 17. Havering 34. Not in a London Borough –
CLOSE 35. (Don’t know)
CLOSE IF DO NOT LIVE IN ANY LONDON BOROUGH (CODE 34) MONITORING QUOTA ON BOROUGH INTERVIEWS IF DON’T KNOW BOROUGH TAKE FROM SAMPLE
© SPA Future Thinking 2014 Page 42 of 73
UK I FRANCE I ITALY
TRAVEL MODES & FREQUENCY SECTION ALL QUARTERS ASK ALL QFREQ_BUS: Typically, how often do you use a bus to get around London? INTERVIEWER NOTE: IF RESPONDENT SAYS IT VARIES ASK HOW OFTEN THEY WOULD USE THE MAJORITY OF THE TIME OVER THE COURSE OF A YEAR IF CAN’T REMEMBER CODE AS ‘NOT IN THE LAST 12 MONTHS’ PROBE AS PER PRECODES
1. 5 or more days a week 2. 3-4 days a week 3. 2 days a week 4. Once a week 5. Once a fortnight 6. Once a month 7. Less often than once a month 8. Not in the last 12 months 9. (Never)
ALL QUARTERS ASK ALL QFREQ_TUBE: Typically, how often do you use the tube to get around London? ALL QUARTERS ASK ALL QFREQ_DLR: Typically, how often do you use the Docklands Light Railway to get around London? ALL QUARTERS ASK ALL QFREQ_TRAIN: Typically, how often do you use a train to get around London? OCTOBER ONLY ASK ALL QFREQ_MBIKE: Typically, how often do you use a motorbike/ scooter/moped (either as a rider or pillion/ passenger) to get around London? APRIL AND OCTOBER ONLY ASK ALL QFREQ_BIKE: Typically, how often do you use a bicycle to get around London?
© SPA Future Thinking 2014 Page 43 of 73
UK I FRANCE I ITALY
OCTOBER ONLY ASK ALL QFREQ_TAXI: Typically, how often do you use a black cab/ taxi to get around London? OCTOBER ONLY ASK ALL QFREQ_CAB: Typically, how often do you use a minicab to get around London? OCTOBER ONLY ASK ALL QFREQ_TRAM: Typically, how often do you use Trams to get around London?
© SPA Future Thinking 2014 Page 44 of 73
UK I FRANCE I ITALY
APRIL AND OCTOBER ONLY ASK ALL QWALK: How often do you walk in London? By this I mean where you walked for 5 minutes or longer. INTERVIEWER NOTE: IF RESPONDENT SAYS IT VARIES ASK HOW OFTEN THEY WOULD WALK THE MAJORITY OF THE TIME OVER THE COURSE OF A YEAR IF RESPONDENT CAN’T REMEMBER CODE AS ‘NOT IN THE LAST 12 MONTHS’ PROBE AS PER PRECODES
1. 5 or more days a week 2. 3-4 days a week 3. 2 days a week 4. Once a week 5. Once a fortnight 6. Once a month 7. Less often than once a month 8. Not in the last 12 months 9. (Never)
INTERVIEWER NOTES ON WHICH WALKING TRIPS TO INCLUDE/EXCLUDE:
Include: 1. walks made as part of a greater journey e.g. to bus
stop/station/car, if 5 minutes or longer 2. all walks longer than 5 minutes e.g. a) walk to the postbox on the corner b) walk to get a paper, pint of milk c) stopping at dry cleaners/bank/etc. on the way to somewhere else d) walks on street between shops e) walk to car if parked on street f) interchange between Buses
Exclude: 1. walks made as part of a greater journey e.g. to bus
stop/station/car if less than 5 mins 2. interchange between Underground lines/ National Rail lines 3. walk from house to car on drive 4. walk from train to station car-park 5. walk from shops or building e.g. hospital to associated car park 6. walks between shops in a shopping centre 7. jogging for health/sport (but do include walk to gym) 8. walking the dog
© SPA Future Thinking 2014 Page 45 of 73
UK I FRANCE I ITALY
QFREQ_CAR: Typically, how often do you use a car or van (either as a driver or a passenger) to get around London? By this I mean any trip you may use a car or a van for. INTERVIEWER: INCLUDE ALL CAR/ VAN TRIPS, NO TRIPS TO BE EXCLUDED IF RESPONDENT SAYS IT VARIES ASK HOW OFTEN THEY WOULD USE THE MAJORITY OF THE TIME OVER THE COURSE OF A YEAR PROBE AS PER PRECODES
1. 5 or more days a week 2. 3-4 days a week 3. 2 days a week 4. Once a week 5. Once a fortnight 6. Once a month 7. Less often than once a month 8. Not in the last 12 months 9. (Never)

© SPA Future Thinking 2014 Page 46 of 73
UK I FRANCE I ITALY
WHENUSE & TIMENIGHT ASK IF QFREQ_BUS CODES 1-6 SS3BUSa Do you use London Buses regularly during daytime hours and/or after dark? MULTICODING ALLOWED
1. During daytime hours 2. After dark 3. (Don’t use regularly)
ASK IF QFREQ_TUBE CODES 1-6 SS3TUBEa Do you use London Underground regularly during daytime hours and/or after dark? MULTICODING ALLOWED
1. During daytime hours 2. After dark 3. (Don’t use regularly)
ASK IF QFREQ_TRAIN CODES 1-6 SS3TRAINa Do you use National Rail trains regularly during daytime hours and/or after dark? MULTICODING ALLOWED
1. During daytime hours 2. After dark 3. (Don’t use regularly)
ASK IF QFREQ_DLR CODES 1-6 SS3DLRa Do you use London the Docklands Light Railway regularly during daytime hours and/or after dark? MULTICODING ALLOWED
1. During daytime hours 2. After dark 3. (Don’t use regularly)
ASK IF QFREQ_TRAM CODES 1-6 SS3TRAMa Do you use London trams regularly during daytime hours and/or after dark? MULTICODING ALLOWED
1. During daytime hours 2. After dark 3. (Don’t use regularly)
© SPA Future Thinking 2014 Page 47 of 73
UK I FRANCE I ITALY
ASK IF QFREQ_CAR CODES 1-6 SS3CARVANa Do you drive a car or a van regularly during daytime hours and/or after dark? MULTICODING ALLOWED
1. During daytime hours 2. After dark 3. (Don’t use regularly)
ASK IF QFREQ_BIKE CODES 1-6 SS3BICYCLEa Do you ride a bicycle regularly during daytime hours and/or after dark? MULTICODING ALLOWED
1. During daytime hours 2. After dark 3. (Don’t use regularly)
ASK IF QFREQ_BLACKCAB CODES 1-6 SS3BLACKCABa Do you use a black cab/ taxi regularly during daytime hours and/or after dark? MULTICODING ALLOWED
1. During daytime hours 2. After dark 3. (Don’t use regularly)
© SPA Future Thinking 2014 Page 48 of 73
UK I FRANCE I ITALY
ASK IF QFREQ_MINICAB CODES 1-6 SS3MINICABa Do you use a minicab regularly during daytime hours and/or after dark? MULTICODING ALLOWED
1. During daytime hours 2. After dark 3. (Don’t use regularly)
ASK IF QFREQ_MOTORBIKE CODES 1-6 SS3MOTORBIKEa Do you ride a motorbike regularly during daytime hours and/or after dark? MULTICODING ALLOWED
1. During daytime hours 2. After dark 3. (Don’t use regularly)
ASK IF QWALK CODES 1-6 SS3WALKa Do you walk regularly during daytime hours and/or after dark? MULTICODING ALLOWED
1. During daytime hours 2. After dark 3. (Don’t use regularly)

© SPA Future Thinking 2014 Page 49 of 73
UK I FRANCE I ITALY
PUBTRANRESIST ALL QUARTERS ASK ALL SS4 I am now going to read out a number of things that other people have said stops them from using public transport in London more often, and I would like you to tell me whether or not each applies to you personally? READ OUT & CODE ALL THAT APPLY ADD IF NECESSARY: Does this feature stop you from using public transport in London more often? CATI TO RANDOMISE ORDER
1. Cost of tickets 2. Risk of accidents 3. Fear of crime on the bus/train (i.e. robbery, assault or pickpocketing) 4. Fear of crime getting to and waiting for the bus/train (i.e. robbery, assault
or pickpocketing) 5. Fear of terrorist attacks 6. Concern about anti-social behaviour of others 7. Unreliable services 8. Dirty environment on the bus/train 9. Dirty environment getting to the bus/train 10. Lack of information about how to use public transport services 11. Slow journey times 12. Overcrowded services 13. Don’t understand how to buy bus tickets 14. Fear about knife crime (THIS SHOULD ALWAYS BE ASKED LAST) 15. Graffiti 16. (None of these)
© SPA Future Thinking 2014 Page 50 of 73
UK I FRANCE I ITALY
ALL QUARTERS ASK ALL SSCRIME1 Thinking for the moment just about travelling during the day, do concerns about safety from crime or anti-social behaviour affect the frequency with which you XXXXX during the day. READ OUT. SINGLE CODE. And what about XXXX? REMIND OF SCALE AS NECESSARY.
a) Travel by London Underground ALL QUARTERS b) Travel on London Buses ALL QUARTERS c) Travel by National rail ALL QUARTERS d) Walk APRIL AND OCTOBER ONLY e) Cycle APRIL AND OCTOBER ONLY f) Travel on trams OCTOBER ONLY g) Travel on the DLR OCTOBER ONLY h) Travel by Black cab OCTOBER ONLY i) Travel by minicab OCTOBER ONLY j) Travel by car OCTOBER ONLY k) Travel by bike/moped/scooter OCTOBER ONLY
1. A lot 2. A little 3. Hardly at all 4. Or not at all 5. (I have no need to travel by this means) 6. (Don’t know)
© SPA Future Thinking 2014 Page 51 of 73
UK I FRANCE I ITALY
ALL QUARTERS ASK ALL SSCRIME2 Thinking now about travelling at night, do concerns about safety from crime or anti-social behaviour affect the frequency with which you XXXXX at night. READ OUT. SINGLE CODE. And what about XXXX? REMIND OF SCALE AS NECESSARY.
a) Travel by London Underground ALL QUARTERS b) Travel on London Buses ALL QUARTERS c) Travel by National rail ALL QUARTERS d) Walk APRIL AND OCTOBER ONLY e) Cycle APRIL AND OCTOBER ONLY f) Travel on trams OCTOBER ONLY g) Travel on the DLR OCTOBER ONLY h) Travel by Black cab OCTOBER ONLY i) Travel by minicab OCTOBER ONLY j) Travel by car OCTOBER ONLY k) Travel by bike/moped/scooter OCTOBER ONLY
1. A lot 2. A little 3. Hardly at all 4. Or not at all 5. (I have no need to travel by this means) 6. (Don’t know)
© SPA Future Thinking 2014 Page 52 of 73
UK I FRANCE I ITALY
NEW QUESTIONS ALL QUARTERS ALL QUARTERS Q1. How worried are you about your personal security when using public transport in London?
1. Not at all 2. A little bit worried 3. Quite worried 4. Very worried 5. (Don’t know)
ALL QUARTERS Q1ai At what point in your journey on public transport are you most likely to worry about your personal security? READ OUT & SINGLE CODE ONLY
1. Walking to/from a stop/station 2. Waiting at a stop/station 3. Riding a bus/train 4. Travelling in a black cab or minicab 5. Depends/varies 6. Don’t know
ALL QUARTERS Q1aii. And is that during the day or during the hours of darkness? PROMPT IF NECESSARY
1. During the day 2. During the hours of darkness 3. Depends/varies 4. (Don’t know)
ALL QUARTERS IF CODES 3 OR 4 AT Q1 Q1b. To what extent does your worry about personal security when using public transport reduce your quality of life?
1. Not at all 2. A little 3. Moderately 4. Quite a bit 5. Very much 6. (Don’t know)
© SPA Future Thinking 2014 Page 53 of 73
UK I FRANCE I ITALY
ALL QUARTERS ASK ALL Q2a. Do you take any precautions against crime when using public transport?
1. Yes 2. No
ALL QUARTERS IF YES AT Q2a Q2ai Which of the following precautions do you take? READ OUT AND CODE ALL THAT APPLY
1. Avoided using that mode of transport 2. Used a different route 3. Travelled at a different time of day 4. Travelled with someone else 5. Sat near to other people 6. Other (please specify) 7. None
ALL QUARTERS IF TAKES ANY PRECAUTIONS (CODE 1 at Q2a) Q2b. To what extent do these precautions make you feel safer?
1. Not at all 2. A little 3. Moderately 4. Quite a bit 5. Very much 6. (Don’t know)
ALL QUARTERS IF TAKES ANY PRECAUTIONS (CODE 1 at Q2a) Q2c. And to what extent do they reduce your quality of life? (THE PRECAUTIONS THAT THE RESPONDENT TAKES)
1. Not at all 2. A little 3. Moderately 4. Quite a bit 5. Very much 6. (Don’t know)
© SPA Future Thinking 2014 Page 54 of 73
UK I FRANCE I ITALY
ALL QUARTERS ASK ALL Q3. In the last three months, have you ever felt worried about your personal security when using public transport in London?
1. Yes 2. No 3. (Don’t know)
ALL QUARTERS IF YES AT Q3 Q3b. How many times have you felt like this in the last three months? ENTER NUMBER DK IS NOT ALLOWED ALL QUARTERS IF YES AT Q3 Q3c. On the last occasion, how worried did you feel?
1. Not very worried 2. A little bit worried 3. Quite worried 4. Very worried 5. (Can’t remember)
ALL QUARTERS IF YES AT Q3 Q3di. What mode of transport were you using (or planning to use) when you felt like this?
1. Bus 2. Tube 3. Train 4. DLR 5. Tram 6. Black cab 7. Mini cab 8. Other (specify) 9. (Can’t remember)
IF CODE 7 AT Q3di Q3dii Was the minicab pre-booked through a licensed minicab operator, either by yourself or someone else?
1. Yes (pre-booked) 2. No (not pre-booked) 3. (Can’t remember)

© SPA Future Thinking 2014 Page 55 of 73
UK I FRANCE I ITALY
ALL QUARTERS IF CODES 1 – 5 AT Q3di Q3e. And were you…
1. Walking to/from a stop/station? 2. Waiting at a stop/station? 3. On board this mode of transport? 4. Preparing to travel 5. Somewhere else (please specify) 6. (Don’t know / can’t remember)
ALL QUARTERS IF YES AT Q3 Q3f. Were you travelling (or planning to travel) during the day or during the hours of darkness?
1. During the day 2. During the hours of darkness 3. (Can’t remember)
ALL QUARTERS IF YES AT Q3 Q3fi. Did the incident take place in the borough that you live in, or elsewhere in London?
1. In your borough 2. Elsewhere in London 3. Don’t know / can’t remember
© SPA Future Thinking 2014 Page 56 of 73
UK I FRANCE I ITALY
ALL QUARTERS IF YES AT Q3 Q3g. What made you feel worried? DO NOT READ OUT
1. Being a victim of crime 2. Graffiti / vandalism 3. Threatening behaviour of other passengers 4. Threatening behaviour of driver / staff 5. Large groups of school children / youths 6. Drunken passengers 7. Witnessing someone being robbed / mugged 8. Witnessing someone being assaulted 9. Seeing someone using illegal drugs 10. Seeing someone sleeping rough 11. Lack of a police presence 12. Lack of a staff presence 13. Physical isolation 14. Being pickpocketed 15. Busy environment / large crowds of people 16. Other (please specify)
ALL QUARTERS IF YES AT Q3 Q3gi. Did this worry put you off using this mode of transport again?
1. No, it didn’t put me off 2. Yes, it put me off but I still travel 3. Yes, it stopped me travelling on this mode temporarily 4. Yes, it stopped me travelling on this mode completely
ALL QUARTERS IF CODE 1 AT Q3 Q3i. Did you take any precautions as a result of this worry?
1. Yes 2. No
© SPA Future Thinking 2014 Page 57 of 73
UK I FRANCE I ITALY
ALL QUARTERS IF YES AT Q3i Q3j Which of the following precautions did you take? READ OUT AND CODE ALL THAT APPLY
1. Avoided using that mode of transport 2. Used a different route 3. Travelled at a different time of day 4. Travelled with someone else 5. Sat near to other people 6. Other (please specify) 7. None
ALL QUARTERS IF YES AT Q3i Q3k. To what extent did you feel safer as a result of taking this action?
1. Not at all 2. A little 3. Moderately 4. Quite a bit 5. Very much 6. (Don’t know)
ALL QUARTERS IF YES AT Q3 Q3l. What could TfL have done in this situation to help you feel safer? DO NOT READ OUT
1. More CCTV 2. Increased police presence 3. More staff at stations 4. Advertising to encourage more responsible behaviour 5. Improved lighting 6. More staff on board public transport 7. Other (specify) 8. (Nothing)
© SPA Future Thinking 2014 Page 58 of 73
UK I FRANCE I ITALY
POLICE RESPONSE ALL QUARTERS ASK ALL PRLOND1 It is the responsibility of the police, TfL and other partners to deal with anti-social behaviour and crime on and around the transport system, so how much would you agree or disagree that.... The police, TfL and other partners are dealing with the anti-social behaviour and crime issues that matter on the ......... in London
a) Buses b) Underground c) National Rail
1. Strongly agree 2. Slightly agree 3. Neither agree nor disagree 4. Slightly disagree 5. Strongly disagree 6. (Don’t know)

© SPA Future Thinking 2014 Page 59 of 73
UK I FRANCE I ITALY
ASB APRIL AND OCTOBER ONLY ASB4. Which of the following have you witnessed when using public transport in the last 3 months? This can be when actually on board the transport or when waiting at a station or stop. CATI TO RANDOMISE LIST READ OUT & CODE ALL THAT APPLY
1. Someone eating hot food (i.e. chips, burgers, kebabs etc) on public transport
2. Someone speaking loudly on a mobile phone on public transport 3. Someone listening to music loud enough that others can hear it on public
transport 4. Someone dropping litter on public transport 5. Someone drinking alcohol on public transport 6. Someone being drunk on public transport 7. Someone not vacating priority seating for someone more in need 8. Someone shouting or swearing at other passengers 9. Someone shouting or swearing at the driver or other staff 10. Someone taking up more than one seat 11. Someone pushing and shoving to get on or off the vehicle 12. Someone spitting on public transport 13. Someone smoking on public transport 14. School children / youths behaving badly on public transport 15. Someone not paying their fare 16. Someone bullying someone else (children or adults) 17. Someone begging 18. (None of these)
APRIL AND OCTOBER ONLY ASK FOR ALL CODED AT ASB4 ASB5b. And which mode of transport was it? MULTICODE POSSIBLE
1. Tube 2. Bus 3. Train 4. DLR 5. Tram 6. Other – please specify
© SPA Future Thinking 2014 Page 60 of 73
UK I FRANCE I ITALY
MINICAB SAFETY OCTOBER ONLY ASK ALL EXCEPT TAXI & MINICAB COMPANY EMPLOYEE (NOT CODE 4 @ QEXEMPT) I’d now like to ask you about illegal cabs. OCTOBER ONLY ASK ALL EXCEPT TAXI & MINICAB COMPANY EMPLOYEE (NOT CODE 4 @ QEXEMPT) TT1 Only black cab drivers can pick up passengers in the street or at ranks. Minicab drivers are breaking the law if they pick up passengers unless they have booked either in person or over the phone. In these circumstances it is the driver not the passenger who is committing the offence. Were you aware of this? SINGLE CODE
1. Yes 2. No 3. (Don’t know)
OCTOBER ONLY ASK ALL EXCEPT TAXI & MINICAB COMPANY EMPLOYEE (NOT CODE 4 @ QEXEMPT) TT2 During the last three months, have you been approached anywhere in London by anyone offering you a taxi or minicab service? SINGLE CODE
1. Yes 2. No 3. (Don’t know)
OCTOBER ONLY ASK IF ‘YES’ @ TT2. NO/ DON’T KNOW @ TT2 GO TO TT10. TT3 Has this happened…. XXX? (being approached by anyone offering you a taxi or minicab service) SINGLE CODE
a) in your local area or town centre? b) in Central London ?
1. Yes 2. No 3. (Don’t know)

© SPA Future Thinking 2014 Page 61 of 73
UK I FRANCE I ITALY
OCTOBER ONLY IF BEEN APPROACHED IN LOCAL AREA (CODE 1 @ TT3a) ASK TT4a. IF BEEN APPROACHED IN LONDON (CODE 1 @ TT3b) ASK TT4b TT4 Roughly, how many times would you say this has happened XXX (IN YOUR LOCAL AREA OR TOWN CENTRE/ IN CENTRAL LONDON) in the last three months? PROBE AS PER PRECODES SINGLE CODE
a) in your local area or town centre b) in Central London
1. Once 2. Two or three times 3. Four or five times 4. Six or more times 5. (Don’t know)
OCTOBER ONLY ASK ALL EXCEPT TAXI & MINICAB COMPANY EMPLOYEE (CODE 4 @ QEXEMPT) TT10 During the last three months, have you approached a minicab driver on the street anywhere in London to ask if they are available for hire? SINGLE CODE
1. Yes 2. No 3. (Don’t know)
© SPA Future Thinking 2014 Page 62 of 73
UK I FRANCE I ITALY
OCTOBER ONLY TE29a Have you seen a ticket inspector on board public transport, or at a stop/station in the last three months? MULTICODE; PROMPT AS APPROPRIATE
1. Yes on bus 2. Yes on Tube 3. Yes on train 4. Yes on DLR 5. Yes on Tube 6. Yes on Tram 7. Yes, but can’t remember mode 8. No/can’t remember
REVINSPPOL OCTOBER ONLY I’d like to ask just a few questions about fare evasion on public transport in London. TEAD1 Do you recall seeing or hearing any advertising or messages about fare evasion on public transport in London? READ OUT IF NECESSARY
1. Yes 2. No
IF NO, GO TO SS31 OCTOBER ONLY TEAD2 What do you remember about the advertising? PROBE: What was the advertising trying to say? DO NOT READ OUT
1. You will be fined 2. It’s a crime 3. You have to pay your fare 4. Remember to swipe your Oyster card 5. Ticket inspectors look just like you 6. Other (specify)

© SPA Future Thinking 2014 Page 63 of 73
UK I FRANCE I ITALY
OCTOBER ONLY ASK ALL SS31 If you get stopped by a ticket inspector without the correct ticket or pass on public transport, which of the following actions do you think can be taken? READ OUT, MULTICODE
1. Nothing 2. Penalty fare 3. Possible prosecution 4. Verbal warning 5. Escorted off 6. Other
OCTOBER ONLY SS32 And, is this the same for all modes of transport (bus, Tube, train)?
1. Yes 2. No 3. (Don’t know)
OCTOBER ONLY IF CODE 2 at SS32 SS33 Why do you say that? PROBE ON WHY RESPONDENT THINKS THAT ENFORCEMENT ACTIVITY IS DIFFERENT ON DIFFERENT MODES, WHICH ARE BETTER / LESS WELL ENFORCED AND WHY OPEN ENDED RESPONSE OCTOBER ONLY SS30 And in your opinion how well are penalty fares enforced on XXX? READ OUT/ REMIND OF SCALE AS NECESSARY/ SINGLE CODE
1. Very well enforced 2. Quite well 3. Not very well 4. Not at all well enforced 5. (Don’t Know)
CATI TO ROTATE ORDER
a. London Underground b. London buses c. National Rail

© SPA Future Thinking 2014 Page 64 of 73
UK I FRANCE I ITALY
ALL QUARTERS SEXUAL HARASSMENT
Continuing to help us understand about personal safety - and now, in particular inappropriate behaviour or sexual harassment in and around public transport in London. This might include inappropriate behaviour such as comments, staring or touching. Transport for London is keen to understand what experiences people have had so that it can better understand what is happening to help prevent it in future. ALL QUARTERS SHSCREEN. Do you mind if I ask you some questions about what you have experienced? If you would prefer not to answer I will move on to the next set of questions. SINGLE CODE
1. Yes you can ask Go to SH1 2. No Move on to BOROUGH QUESTIONS 3. (Would rather not say) Move on to BOROUGH QUESTIONS
ALL QUARTERS SH1. In the last 12 months have you experienced any unwelcome sexual behaviour including sexual harassment or sexual assault while travelling on, waiting for or heading to or from public transport in London? SINGLE CODE
1. Yes Go to SH2 2. No Move on to BOROUGH QUESTIONS 3. (Would rather not say) Move on to BOROUGH QUESTIONS
ALL QUARTERS SH2. Has this occurred in the last three months? SINGLE CODE
1. Yes Go to SH3 2. No Go to SH3 3. (Would rather not say) Go to SH3
ALL QUARTERS SH3. Please describe to me what you have experienced. INTERVIEWER NOTE: PROBE FULLY BUT SENSITIVELY. Do not prompt and allow the respondent to use own language. Do not use wording below to describe what the respondent says. RECORD ANSWER VERBATIM OPEN ENDED – CODED BY CODING TEAM TO AGREED CODE FRAME

© SPA Future Thinking 2014 Page 65 of 73
UK I FRANCE I ITALY
ALL QUARTERS SH4a. Have you experienced/witnessed this: MULTI CODE
1. On public transport Go to SH5 2. Whilst travelling to/from public transport Go to SH6 3. Whilst waiting for public transport Go to SH6 4. (Refused) Go to SH6
ALL QUARTERS SH5. On which mode(s) of transport did this occur? MULTI CODE
1. Buses 2. Underground/ tube 3. DLR (Docklands Light Railway) 4. Train 5. Black cab/ Taxi 6. Minicab (not black cab) 7. Tram 8. Riverboat 9. London Overground 10. (Refused)
SH5b. Was the minicab pre-booked through a licensed minicab operator either by yourself or someone else?
1. Yes (pre-booked) 2. No (not pre-booked) 3. (Can’t remember)
ALL QUARTERS SH6. At what time(s) of day did this occur? MULTI CODE
1. Morning 7am-noon 2. Afternoon noon-5pm 3. Evening 5pm-11pm 4. Between 11pm & 2am 5. Between 2am & 7am 6. (Don’t know) 7. (Refused)
© SPA Future Thinking 2014 Page 66 of 73
UK I FRANCE I ITALY
ALL QUARTERS SH7. Did you report this to anyone? SINGLE CODE
1. Yes (all of the time) Go to SH8 2. Yes (some incidents) Go to SH8 3. No Go to SH9 4. (Refused) Go to BOROUGH QUESTIONS
ALL QUARTERS SH8. To whom did you report it? MULTI CODE
1. Police 2. Member of staff 3. Support service 4. Other (specify) 5. (Refused)
ALL QUARTERS SH9. Why did you not report the incident(s)? OPEN-ENDED, PROBE FULLY

© SPA Future Thinking 2014 Page 67 of 73
UK I FRANCE I ITALY
BOROUGH INTERVIEWS MY REMAINING QUESTIONS ARE ABOUT TRAVELLING WITHIN YOUR BOROUGH. INTERVIEWER INSTRUCTION: CLARIFY WHERE NECESSARY: BY BOROUGH WE MEAN YOUR LOCAL AREA. ALL QUARTERS SSCRIME3 Thinking about when you are travelling within [INSERT BOROUGH AT QBOROUGH], do concerns about safety from crime or anti-social behaviour affect the frequency with which you XXXXX. Would you say these concerns affect the frequency… INTERVIEWER INSTRUCTION: CLARIFY WHERE NECESSARY: BY BOROUGH WE MEAN YOUR LOCAL AREA READ OUT SINGLE CODE And what about XXXX? REMIND OF SCALE AS NECESSARY
a) Travel by London Underground during the day b) Travel on London Buses during the day c) Travel by National rail during the day d) Travel by London Underground after dark e) Travel on London Buses after dark f) Travel by National rail after dark
1. A lot 2. A little 3. Hardly at all 4. Or not at all 5. Not applicable 6. (I have no need to travel by this means) 7. (Don’t know)
Q3BR Which of the following modes of transport do you most often use in your local area? READ OUT. SINGLE CODED
1. Bus 2. Tube 3. Train 4. Don’t use any of these modes (DON’T READ OUT) 5. Use them equally (DON’T READ OUT) (SCRIPT WRITER: RANDOMLY
SELECT BUS/TUBE/TRAIN FOR NEXT QUESTIONS)
© SPA Future Thinking 2014 Page 68 of 73
UK I FRANCE I ITALY
THIS QUESTION SHOULD NOT BE ASKED. THIS IS A DUMMY QUESTION TO CHECK PREVIOUS ANSWERS. SCRIPT WRITER: RECODE QUESTION ABOVE SO CODE 5 FALLS INTO CODES 1, 2 OR 3 Q3BRDUMMY Which of the following modes of transport do you most often use in your local area? SINGLE CODED
1. Bus 2. Tube 3. Train 4. Don’t use any of these modes
IF BUS/TUBE/TRAIN at Q3BR QFREQBR: Typically, how often do you use A BUS/THE TUBE/THE TRAIN in your local area? INTERVIEWER NOTE: IF RESPONDENT SAYS IT VARIES ASK HOW OFTEN THEY WOULD USE THE MAJORITY OF THE TIME OVER THE COURSE OF A YEAR IF CAN’T REMEMBER CODE AS ‘NOT IN THE LAST 12 MONTHS’ PROBE AS PER PRECODES
1. 5 or more days a week 2. 3-4 days a week 3. 2 days a week 4. Once a week 5. Once a fortnight 6. Once a month 7. Less often than once a month 8. Not in the last 12 months 9. (Never)
IF BUS/TUBE/TRAIN at Q3BR SS5aBR And how safe do you feel on the BUS/THE TUBE/THE TRAIN in your local area? Do you feel….? READ OUT SINGLE CODE
1. Very safe 2. Quite safe 3. Not very safe 4. Not at all safe 5. (Don’t know)
© SPA Future Thinking 2014 Page 69 of 73
UK I FRANCE I ITALY
IF BUS / TUBE / TRAIN AT Q3BR Q3aBR On average, how often do you see Police Officers or PCSOs (Police Community Support Officers) ON THE BUS / TUBE / TRAIN network in your local area? Would you say it was...? READ OUT
1. More than once a day 2. Once a day 3. Up to once a week 4. Up to once a month 5. Up to once every 3 months 6. Up to once every 6 months 7. Not in the last 6 months 8. Never
IF BUS / TUBE / TRAIN AT Q3BR Q3bBR. To what extent does it make you feel safer to see police on the BUS / TUBE / TRAIN network in your local area? READ OUT
1. Not at all 2. A little 3. Moderately 4. Quite a bit 5. Very much 6. (Don’t know) 7. (Never seen police on network in local area)
IF BUS / TUBE / TRAIN AT Q3BR Q3cBR. Have you spoken to the police on the BUS/TUBE/TRAIN network in your local area in the last 3 months?
1. Yes 2. No 3. (Cannot remember)
© SPA Future Thinking 2014 Page 70 of 73
UK I FRANCE I ITALY
IF YES AT Q3cBR Q3eBR. On a scale of 0 to 10, where 10 means you are extremely satisfied and zero means you are extremely dissatisfied, how satisfied or dissatisfied were you with the experience on the last occasion you spoke to the police on the BUS/TUBE/TRAIN network?
0 Not at all satisfied ……….10 Extremely satisfied ALLOW DON’T KNOW IF 0-6 AT Q3eBR, ask: Q3fBR Please can you tell me why you were dissatisfied with your experience on the last occasion you spoke to the police on the BUS/TUBE/TRAIN network? WHAT ELSE? WHAT ELSE? PROBE TO NEGATIVE. IF NO OR DON’T KNOW AT Q3cBR SSPCTaBR. Have you seen the police talking to members of the public in the last 3 months on the BUS/TUBE/TRAIN network in your local area?
1. Yes 2. No 3. (Can’t remember / don’t know)
© SPA Future Thinking 2014 Page 71 of 73
UK I FRANCE I ITALY
CLASSIFICATION ALL QUARTERS Finally I would just like to ask you a few more questions about yourself so we can classify your answers ALL QUARTERS QETHNICITY: To which of these ethnic groups do you consider you belong? READ OUT AND CODE ONE ONLY A: White
1. British 2. Irish 3. Any other White background
B: Mixed 4. White and Black Caribbean 5. White and Black African 6. White and Asian 7. Any other Mixed background
C: Asian or Asian British 8. Indian 9. Pakistani 10. Bangladeshi 11. Any other Asian background
D: Black or Black British 12. Caribbean 13. African 14. Any other Black background
E: Chinese or Other Ethnic Group 15. Chinese 16. Any other ethnic group 17. (Refused)
© SPA Future Thinking 2014 Page 72 of 73
UK I FRANCE I ITALY
ALL QUARTERS ASK ALL QDISABILITY a: Do you have any long-term physical or mental impairment which limits your daily activities or the work you can do, including problems due to old age? PROBE AS PER PRECODES. MULTICODE. DO NOT ALLOW DK
1. Mobility impairment ASK QDISABILITY b 2. Age related mobility difficulties ASK QDISABILITY b 3. Visual impairment 4. Hearing impairment 5. Learning difficulty 6. Mental health condition 7. Serious long term illness 8. Asthma 9. Arthritis 10. (Refused) 11. Other (Specify) ASK QDISABILITY b 12. (None)
ALL QUARTERS ASK IF MOBILITY IMPAIRMENT/ AGE RELATED (CODE 1/2/11 @ QDISABILITY) OTHERS SEE QEMPLOYMENT QDISABILITY b: Do you ever use a wheelchair when travelling around London?
1. Yes 2. No
ALL QUARTERS ASK ALL QEMPLOYMENT: Are you …? READ OUT + MULTICODING ALLOWED e.g. might work part time and be a part time student
1. Working full time (30+ hours a week) 2. Working part time (less than 30 hours a week) 3. A full time student 4. A part time student 5. Not working – looking for work 6. Not working (not looking for work) 7. Retired 8. Looking after family and home 9. Other (please write in) 10. (Refused)
© SPA Future Thinking 2014 Page 73 of 73
UK I FRANCE I ITALY
ALL QUARTERS QSEG: What is the occupation of the chief income earner in your household? PROBE FOR: INDUSTRY SECTOR TYPE OF WORK DONE MANUAL/ NON-MANUAL SKILLED/ SEMI SKILLED JOB TITLE/ POSITION SIZE OF COMPANY NUMBER RESPONSIBLE FOR (IF MANAGER/SELF EMPLOYED) QUALIFICATIONS HELD RELEVANT TO JOB
1. A 2. B 3. C1 4. C2 5. D 6. E 7. (Refused)
QPOSTCODE: So that Transport for London can understand the views of Londoners within small geographical areas, please can I take a note of your post code? Interviewer to record post code. ENTER ‘REF’ FOR REFUSED ASK ALL QRECONT: Transport for London often wishes to speak to Londoners to obtain their opinion on transport issues. Would you be happy to take part in any future research?
1. Yes 2. No
NEW - ASK IF QRECONT = 1 QRECONT2: Please can I take a note of your email address – this will only be used for a follow-up survey on behalf of Transport for London ENTER EMAIL ADDRESS; check each letter of email address with respondent ALL QUARTERS QNAME: And finally, for proof of this interview, may I please take a note of your name ENTER NAME THANK AND CLOSE