Embed Size (px)
Citation preview
Safety and Sustainability Panel
Date: 15 July 2014
Item 6: Structures and Tunnels Investment Portfolio – Managing Safety Risks
This paper will be considered in public
1 Summary 1.1 The purpose of this paper is to describe the risk assessment approach used by
Surface Transport Asset Management to evaluate the safety, functionality and environmental risks associated with Surface assets. This follows a request from Finance and Policy Committee members in March 2014 when considering project authority for the Surface Transport Structures and Tunnels Investment Portfolio (STIP) implementation. The paper describes the risk scores for the STIP and explains why they will have different levels of risk following completion of works. The paper also describes the interim measures in place for these assets to ensure safety is maintained prior to the completion of works.
2 Recommendation 2.1 The Panel is asked to note this paper.
3 Background 3.1 There are over 1,800 structures on the Transport for London Road Network
(TLRN), including 475 bridges and footbridges, 676 retaining walls and 281 subways. There are also 12 major road tunnels, including Blackwall, Rotherhithe and Limehouse. In 2010/11, a major study was undertaken to determine the interventions and investment needed to reduce the risk profile held against these structures and reverse the impact of decades of under-investment that preceded TfL’s ownership.
3.2 Investment has been secured for the highest priority structures, including Hammersmith Flyover, Upper Holloway Bridge, Ardleigh Green Railway Bridge, Highbury Corner Bridge and Fore Street Tunnel. Up to £500m has been allocated in the TfL business plan to bring these structures into a state of good repair – this is referred to as Structures and Tunnels Investment Portfolio (STIP). Appendix 1 includes a map of the structure locations and a table with a picture and brief description of each.
4 Risk Based Prioritisation Description of risk based approach
4.1 A risk based Value Management approach is used to prioritise all capital works on Surface Transport assets. The approach is used to assess the level of risk an
1
asset poses to the delivery of TfL goals and objectives. For example, the risk a bridge poses to the delivery of the Surface Outcome of Reliable Roads takes account of: (a) Event – determines the specific event, say a component failure, which is a
risk to Reliable Roads. The event is determined through an analysis of inspection data which is used to grade bridges and their components into condition categories that range from Very Good to Very Poor. Appendix 2 shows the number of structures in each of the condition categories.
(b) Likelihood of the event – the condition, component type, material and other influencing factors, such as vehicle restrictions, are used to assess the likelihood that the event will happen. Therefore, as the condition of a bridge/component deteriorates the likelihood that the event wi ll occur increases.
(c) Consequence of the event – the impact on road journey reliability if the event occurs, this takes account of the type of event (e.g. minor fault, local failure or major component failure), safety impacts of the event, traffic volume, congestion and diversions caused by restricting or closing the bridge, length of time required to undertake the repair and the costs.
4.2 Together, the likelihood and consequence are used to evaluate the risk the event poses to the reliability of our roads. Appendix 3 shows the risk categories and matrix used to asses an event. This approach is consistent across asset types, enabling the risks associated with one asset type, say a bridge, to be directly compared with the risks on other assets types, such as carriageway, lighting, drainage, traffic signals and bus infrastructure.
4.3 The risk score is divided by the cost of the works to produce a Value for Money score, in accordance with the Office of Government Commerce (OCG) guidance on Management of Value.
4.4 The 2012/13 and 2013/14 Assurance Reviews of Surface Transport’s asset renewal capital programmes cited this approach as industry best practice. Risk scores for STIP
4.5 The risk scores for STIP are shown in Appendix 4 – it shows safety, functionality, environment and total risk scores for each asset, both pre and post intervention. The post intervention risk is referred to as the Residual Risk. The figures show that STIP will have a major impact on risk reduction – reducing the total risk across this portfolio of structures from £42.1m to £1.97m per annum.
4.6 One asset, Blackwall Tunnel, has a noticeably higher residual risk after the works – the annual risk reduces from £3.3m to £1.2m. This residual risk is due to the high consequences (length of traffic diversion and congestion caused) associated with tunnel restrictions and closures. The planned works will deliver considerably lower likelihoods, for example of asset faults and failures. To further reduce the likelihood would require the installation of multiple back-up systems for key mechanical and electrical equipment – this has a poor benefits/cost ratio as the costs are disproportionally higher than the benefits achieved. More impactful solutions, such as the construction of Silverton Tunnel, are required to reduce the consequence side of the equation.
4.7 Explanations for other lesser residual risks are provided in Appendix 4.
2
5 Managing Safety 5.1 The structures in the portfolio will be brought to a state of good repair over the
next ten years. In the interim, as with all TfL owned assets, safety and functionality risks will be managed through the well established regime of inspection, monitoring, routine maintenance and interim measures.
5.2 TfL adheres to the national code of practice for bridge and tunnel inspections – for example, on bridges a General Inspection every two years and a Principal Inspection every six years. Further to this, and as recommended by the national code of practice, TfL developed a Risk Based Inspection (RBI) process for Principal Inspections. This enables the frequency of Principal Inspections to be varied from 2 to 12 years based on a range of factors. TfL’s RBI approach is now being adopted by other UK highway authorities.
5.3 Appendix 5 describes the interim measures for the STIP assets to ensure risks are suitably managed until the works are delivered.
List of appendices to this report:
Appendix 1: STIP Structures Appendix 2: Bridges by Condition Category Appendix 3: AMD Risk Categories and Matrix Appendix 4: STIP Risk Scores Appendix 5: STIP Interim Measures List of Background Papers: None Contact Officer: Dana Skelley, Asset Management Director Number: 020 3054 1413 Email: [email protected]
3
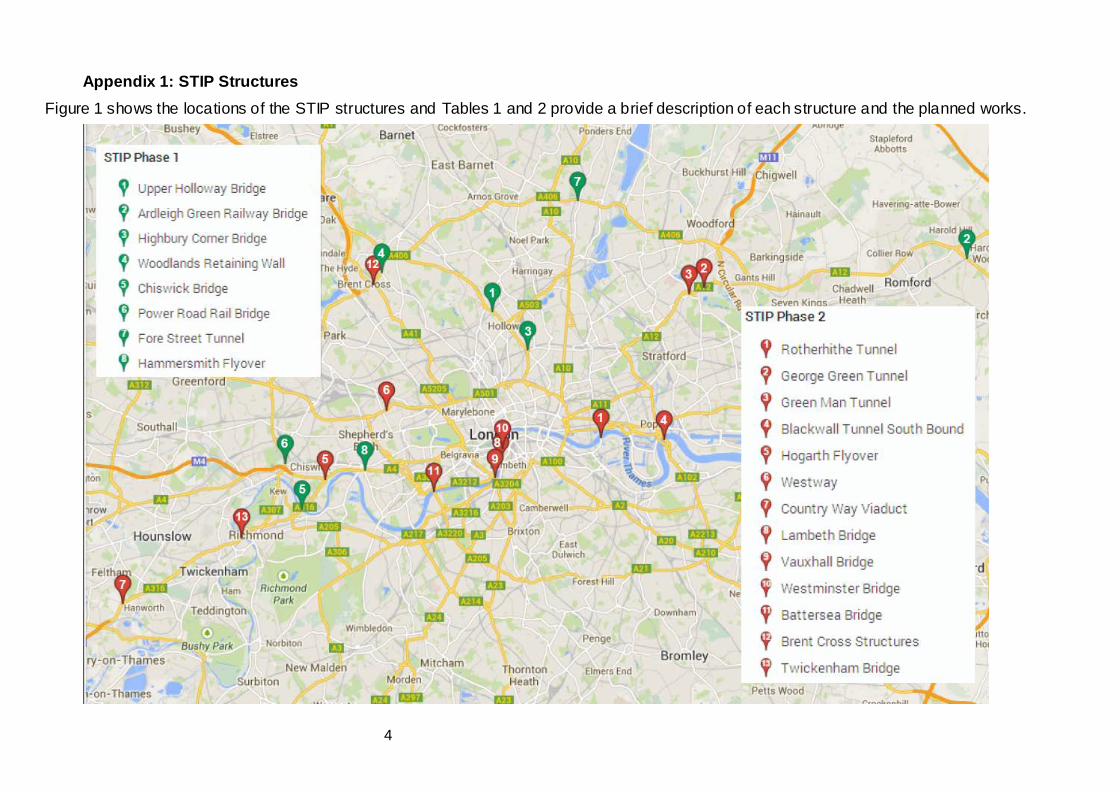
Appendix 1: STIP Structures
Figure 1 shows the locations of the STIP structures and Tables 1 and 2 provide a brief description of each structure and the planned works.
4
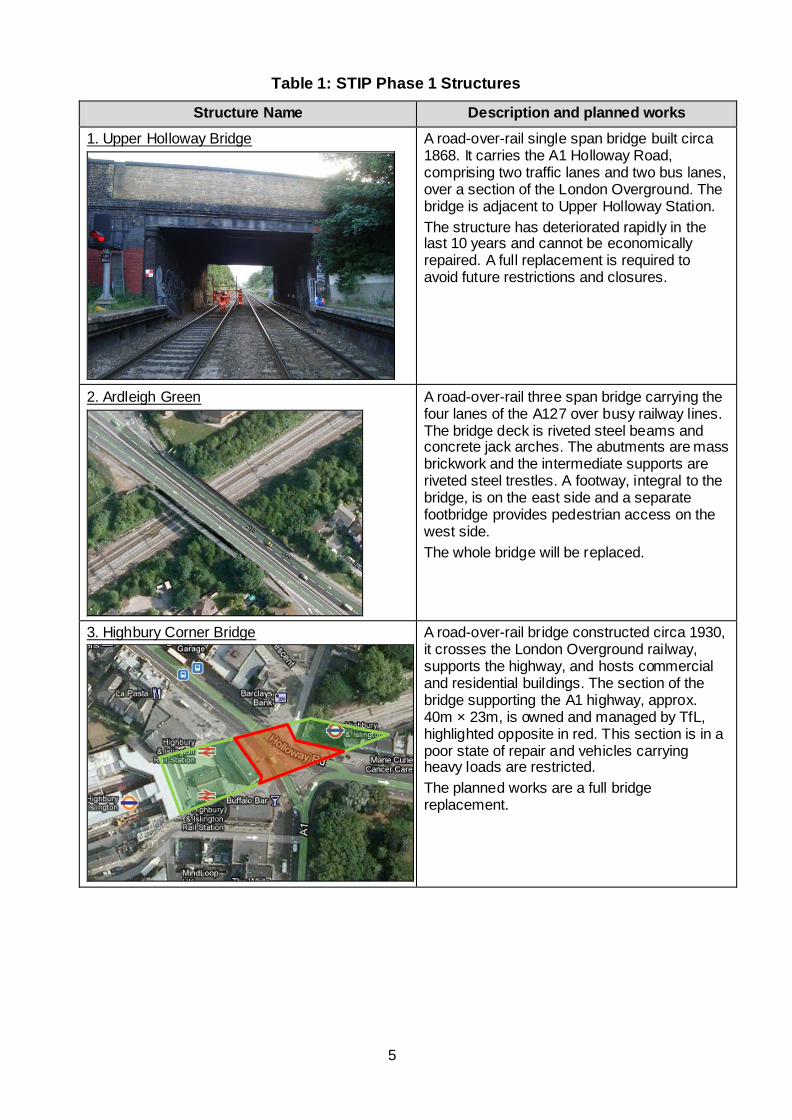
Table 1: STIP Phase 1 Structures
Structure Name Description and planned works
1. Upper Holloway Bridge
A road-over-rail single span bridge built circa 1868. It carries the A1 Holloway Road, comprising two traffic lanes and two bus lanes, over a section of the London Overground. The bridge is adjacent to Upper Holloway Station. The structure has deteriorated rapidly in the last 10 years and cannot be economically repaired. A full replacement is required to avoid future restrictions and closures.
2. Ardleigh Green
A road-over-rail three span bridge carrying the four lanes of the A127 over busy railway lines. The bridge deck is riveted steel beams and concrete jack arches. The abutments are mass brickwork and the intermediate supports are riveted steel trestles. A footway, integral to the bridge, is on the east side and a separate footbridge provides pedestrian access on the west side. The whole bridge will be replaced.
3. Highbury Corner Bridge
A road-over-rail bridge constructed circa 1930, it crosses the London Overground railway, supports the highway, and hosts commercial and residential buildings. The section of the bridge supporting the A1 highway, approx. 40m × 23m, is owned and managed by TfL, highlighted opposite in red. This section is in a poor state of repair and vehicles carrying heavy loads are restricted. The planned works are a full bridge replacement.
5
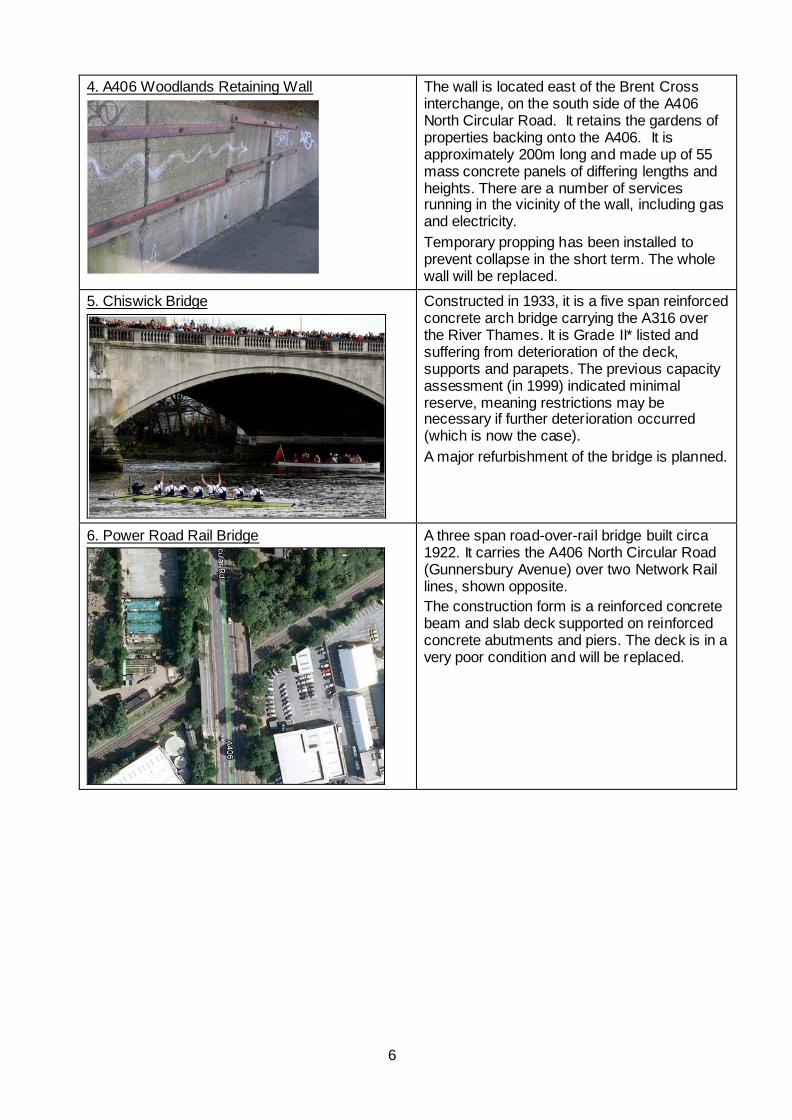
4. A406 Woodlands Retaining Wall
The wall is located east of the Brent Cross interchange, on the south side of the A406 North Circular Road. It retains the gardens of properties backing onto the A406. It is approximately 200m long and made up of 55 mass concrete panels of differing lengths and heights. There are a number of services running in the vicinity of the wall, including gas and electricity. Temporary propping has been installed to prevent collapse in the short term. The whole wall will be replaced.
5. Chiswick Bridge
Constructed in 1933, it is a five span reinforced concrete arch bridge carrying the A316 over the River Thames. It is Grade II* listed and suffering from deterioration of the deck, supports and parapets. The previous capacity assessment (in 1999) indicated minimal reserve, meaning restrictions may be necessary if further deterioration occurred (which is now the case). A major refurbishment of the bridge is planned.
6. Power Road Rail Bridge
A three span road-over-rail bridge built circa 1922. It carries the A406 North Circular Road (Gunnersbury Avenue) over two Network Rail lines, shown opposite. The construction form is a reinforced concrete beam and slab deck supported on reinforced concrete abutments and piers. The deck is in a very poor condition and will be replaced.
6
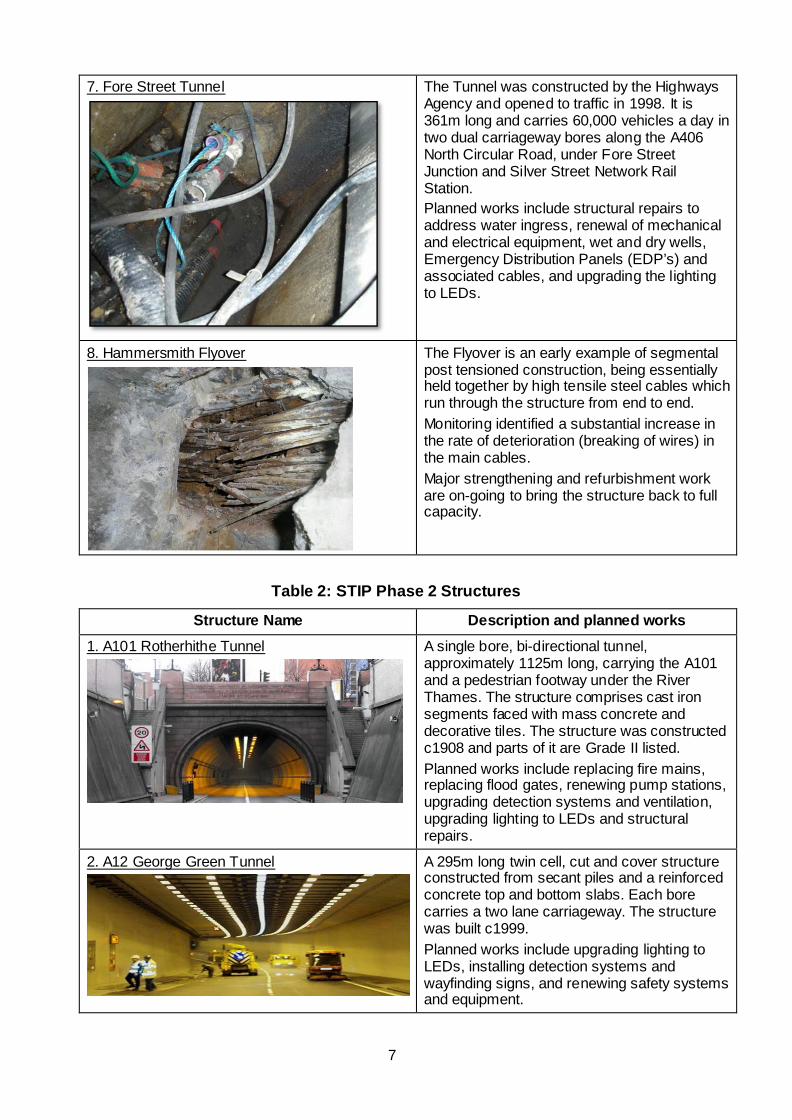
7. Fore Street Tunnel
The Tunnel was constructed by the Highways Agency and opened to traffic in 1998. It is 361m long and carries 60,000 vehicles a day in two dual carriageway bores along the A406 North Circular Road, under Fore Street Junction and Silver Street Network Rail Station. Planned works include structural repairs to address water ingress, renewal of mechanical and electrical equipment, wet and dry wells, Emergency Distribution Panels (EDP’s) and associated cables, and upgrading the lighting to LEDs.
8. Hammersmith Flyover
The Flyover is an early example of segmental post tensioned construction, being essentially held together by high tensile steel cables which run through the structure from end to end. Monitoring identified a substantial increase in the rate of deterioration (breaking of wires) in the main cables. Major strengthening and refurbishment work are on-going to bring the structure back to full capacity.
Table 2: STIP Phase 2 Structures
Structure Name Description and planned works
1. A101 Rotherhithe Tunnel
A single bore, bi-directional tunnel, approximately 1125m long, carrying the A101 and a pedestrian footway under the River Thames. The structure comprises cast iron segments faced with mass concrete and decorative tiles. The structure was constructed c1908 and parts of it are Grade II listed. Planned works include replacing fire mains, replacing flood gates, renewing pump stations, upgrading detection systems and ventilation, upgrading lighting to LEDs and structural repairs.
2. A12 George Green Tunnel
A 295m long twin cell, cut and cover structure constructed from secant piles and a reinforced concrete top and bottom slabs. Each bore carries a two lane carriageway. The structure was built c1999. Planned works include upgrading lighting to LEDs, installing detection systems and wayfinding signs, and renewing safety systems and equipment.
7
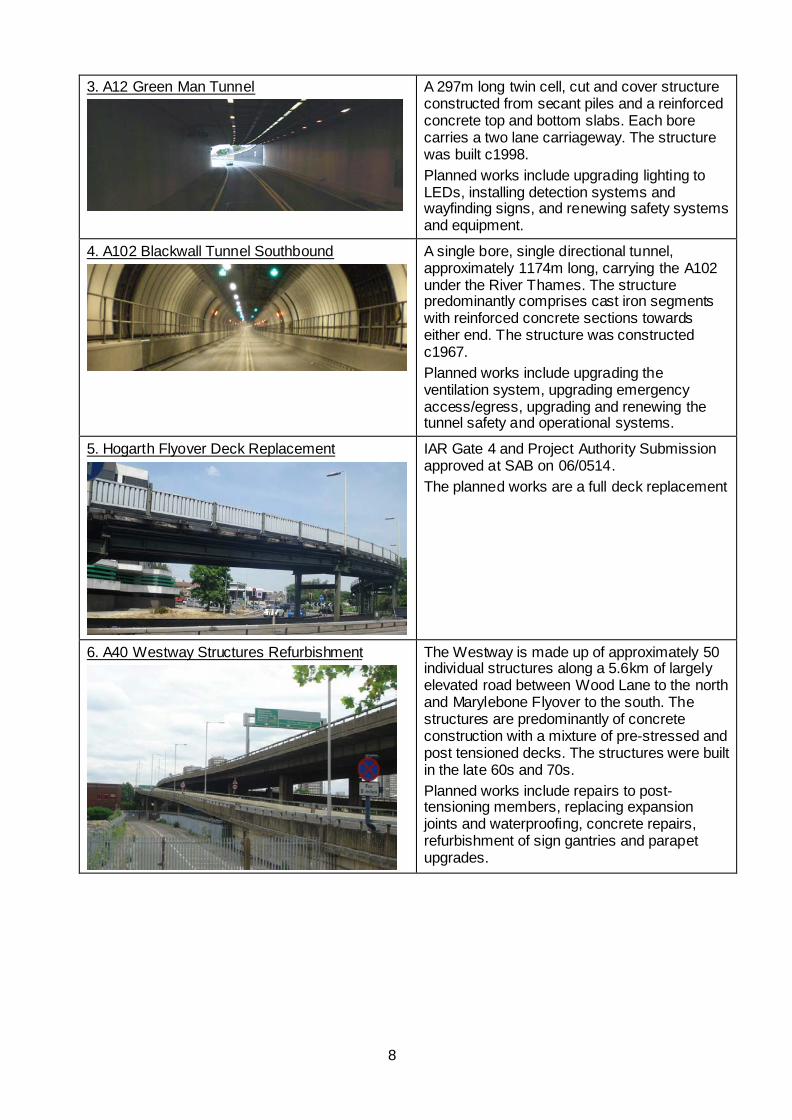
3. A12 Green Man Tunnel
A 297m long twin cell, cut and cover structure constructed from secant piles and a reinforced concrete top and bottom slabs. Each bore carries a two lane carriageway. The structure was built c1998. Planned works include upgrading lighting to LEDs, installing detection systems and wayfinding signs, and renewing safety systems and equipment.
4. A102 Blackwall Tunnel Southbound
A single bore, single directional tunnel, approximately 1174m long, carrying the A102 under the River Thames. The structure predominantly comprises cast iron segments with reinforced concrete sections towards either end. The structure was constructed c1967. Planned works include upgrading the ventilation system, upgrading emergency access/egress, upgrading and renewing the tunnel safety and operational systems.
5. Hogarth Flyover Deck Replacement
IAR Gate 4 and Project Authority Submission approved at SAB on 06/0514. The planned works are a full deck replacement
6. A40 Westway Structures Refurbishment
The Westway is made up of approximately 50 individual structures along a 5.6km of largely elevated road between Wood Lane to the north and Marylebone Flyover to the south. The structures are predominantly of concrete construction with a mixture of pre-stressed and post tensioned decks. The structures were built in the late 60s and 70s. Planned works include repairs to post-tensioning members, replacing expansion joints and waterproofing, concrete repairs, refurbishment of sign gantries and parapet upgrades.
8
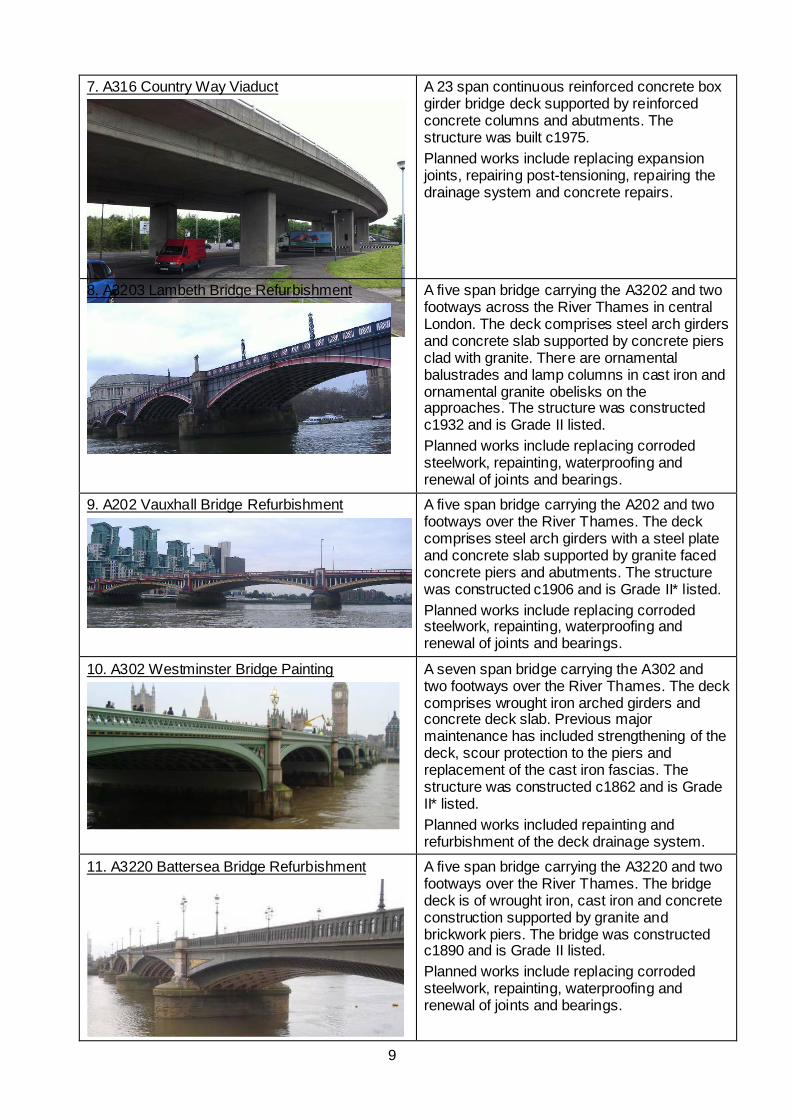
7. A316 Country Way Viaduct
A 23 span continuous reinforced concrete box girder bridge deck supported by reinforced concrete columns and abutments. The structure was built c1975. Planned works include replacing expansion joints, repairing post-tensioning, repairing the drainage system and concrete repairs.
8. A3203 Lambeth Bridge Refurbishment
A five span bridge carrying the A3202 and two footways across the River Thames in central London. The deck comprises steel arch girders and concrete slab supported by concrete piers clad with granite. There are ornamental balustrades and lamp columns in cast iron and ornamental granite obelisks on the approaches. The structure was constructed c1932 and is Grade II listed. Planned works include replacing corroded steelwork, repainting, waterproofing and renewal of joints and bearings.
9. A202 Vauxhall Bridge Refurbishment
A five span bridge carrying the A202 and two footways over the River Thames. The deck comprises steel arch girders with a steel plate and concrete slab supported by granite faced concrete piers and abutments. The structure was constructed c1906 and is Grade II* listed. Planned works include replacing corroded steelwork, repainting, waterproofing and renewal of joints and bearings.
10. A302 Westminster Bridge Painting
A seven span bridge carrying the A302 and two footways over the River Thames. The deck comprises wrought iron arched girders and concrete deck slab. Previous major maintenance has included strengthening of the deck, scour protection to the piers and replacement of the cast iron fascias. The structure was constructed c1862 and is Grade II* listed. Planned works included repainting and refurbishment of the deck drainage system.
11. A3220 Battersea Bridge Refurbishment
A five span bridge carrying the A3220 and two footways over the River Thames. The bridge deck is of wrought iron, cast iron and concrete construction supported by granite and brickwork piers. The bridge was constructed c1890 and is Grade II listed. Planned works include replacing corroded steelwork, repainting, waterproofing and renewal of joints and bearings.
9
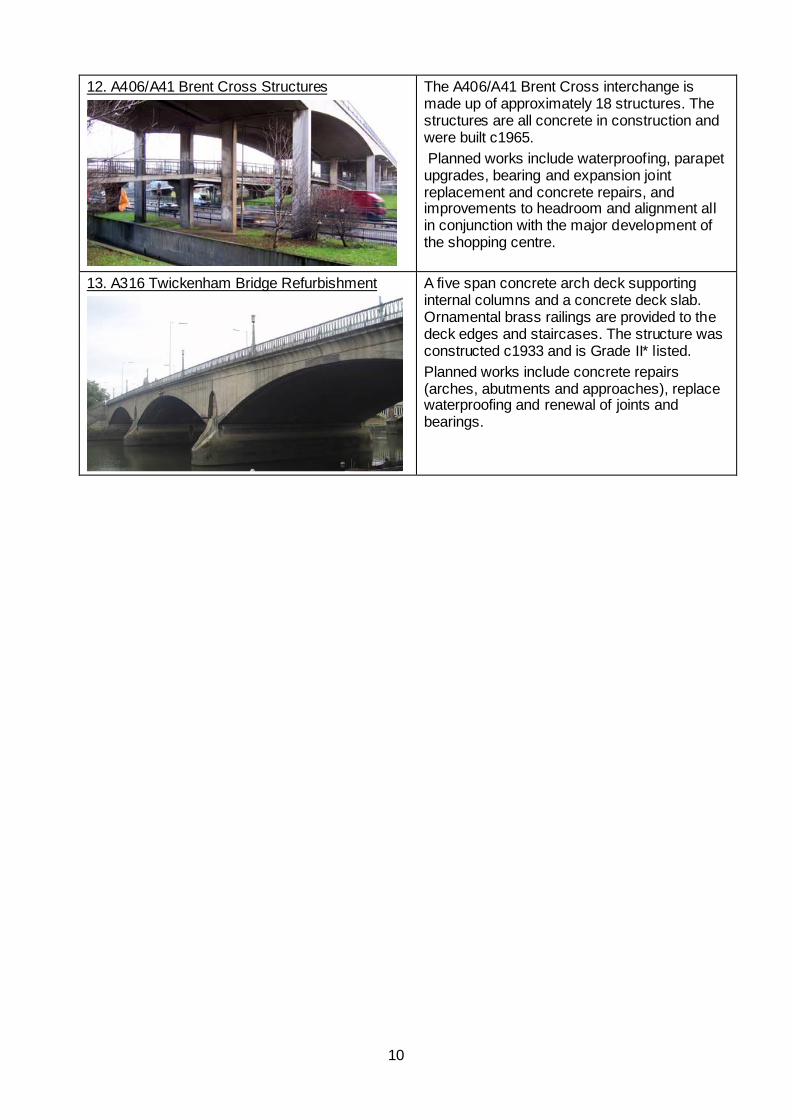
12. A406/A41 Brent Cross Structures
The A406/A41 Brent Cross interchange is made up of approximately 18 structures. The structures are all concrete in construction and were built c1965. Planned works include waterproofing, parapet upgrades, bearing and expansion joint replacement and concrete repairs, and improvements to headroom and alignment all in conjunction with the major development of the shopping centre.
13. A316 Twickenham Bridge Refurbishment
A five span concrete arch deck supporting internal columns and a concrete deck slab. Ornamental brass railings are provided to the deck edges and staircases. The structure was constructed c1933 and is Grade II* listed. Planned works include concrete repairs (arches, abutments and approaches), replace waterproofing and renewal of joints and bearings.
10
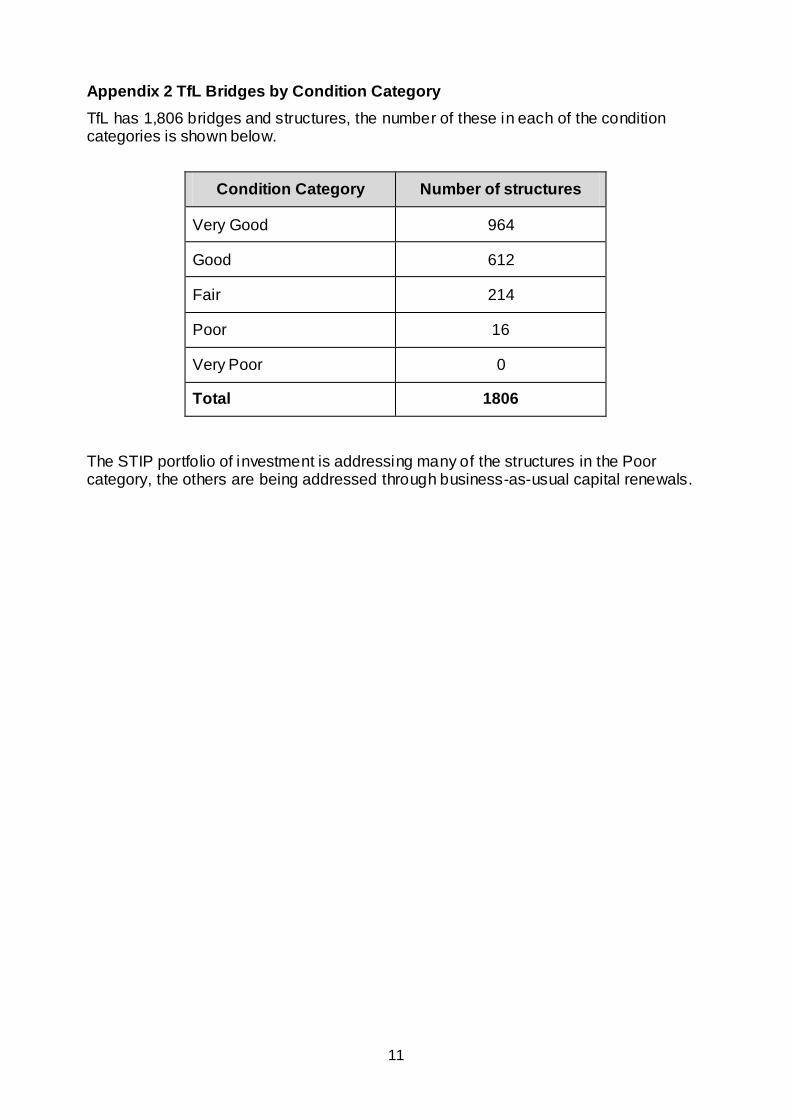
Appendix 2 TfL Bridges by Condition Category TfL has 1,806 bridges and structures, the number of these in each of the condition categories is shown below.
Condition Category Number of structures
Very Good 964
Good 612
Fair 214
Poor 16
Very Poor 0
Total 1806
The STIP portfolio of investment is addressing many of the structures in the Poor category, the others are being addressed through business-as-usual capital renewals.
11
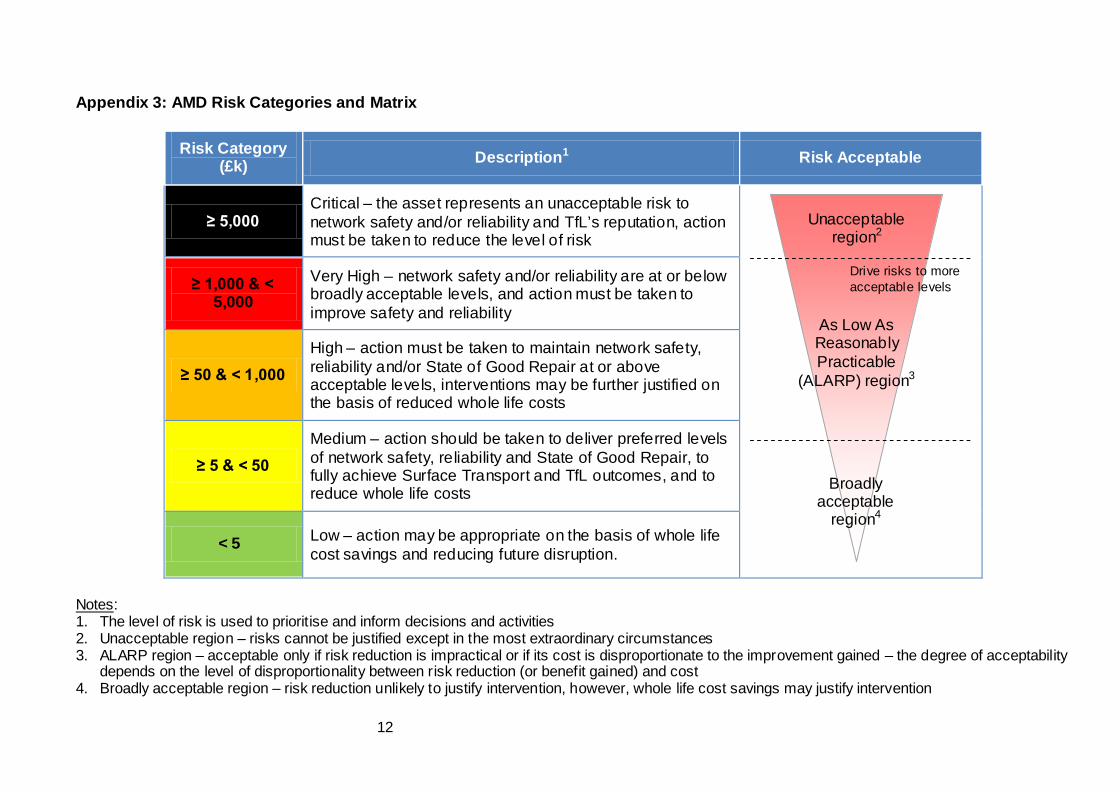
Appendix 3: AMD Risk Categories and Matrix
Risk Category (£k) Description1 Risk Acceptable
≥ 5,000 Critical – the asset represents an unacceptable risk to network safety and/or reliability and TfL’s reputation, action must be taken to reduce the level of risk
≥ 1,000 & < 5,000
Very High – network safety and/or reliability are at or below broadly acceptable levels, and action must be taken to improve safety and reliability
≥ 50 & < 1,000 High – action must be taken to maintain network safety, reliability and/or State of Good Repair at or above acceptable levels, interventions may be further justified on the basis of reduced whole life costs
≥ 5 & < 50 Medium – action should be taken to deliver preferred levels of network safety, reliability and State of Good Repair, to fully achieve Surface Transport and TfL outcomes, and to reduce whole life costs
< 5 Low – action may be appropriate on the basis of whole life cost savings and reducing future disruption.
Notes: 1. The level of risk is used to prioritise and inform decisions and activities 2. Unacceptable region – risks cannot be justified except in the most extraordinary circumstances 3. ALARP region – acceptable only if risk reduction is impractical or if its cost is disproportionate to the improvement gained – the degree of acceptability
depends on the level of disproportionality between risk reduction (or benefit gained) and cost 4. Broadly acceptable region – risk reduction unlikely to justify intervention, however, whole life cost savings may justify intervention
Unacceptable region2
As Low As Reasonably Practicable
(ALARP) region3
Broadly acceptable
region4
Drive risks to more acceptable levels
12
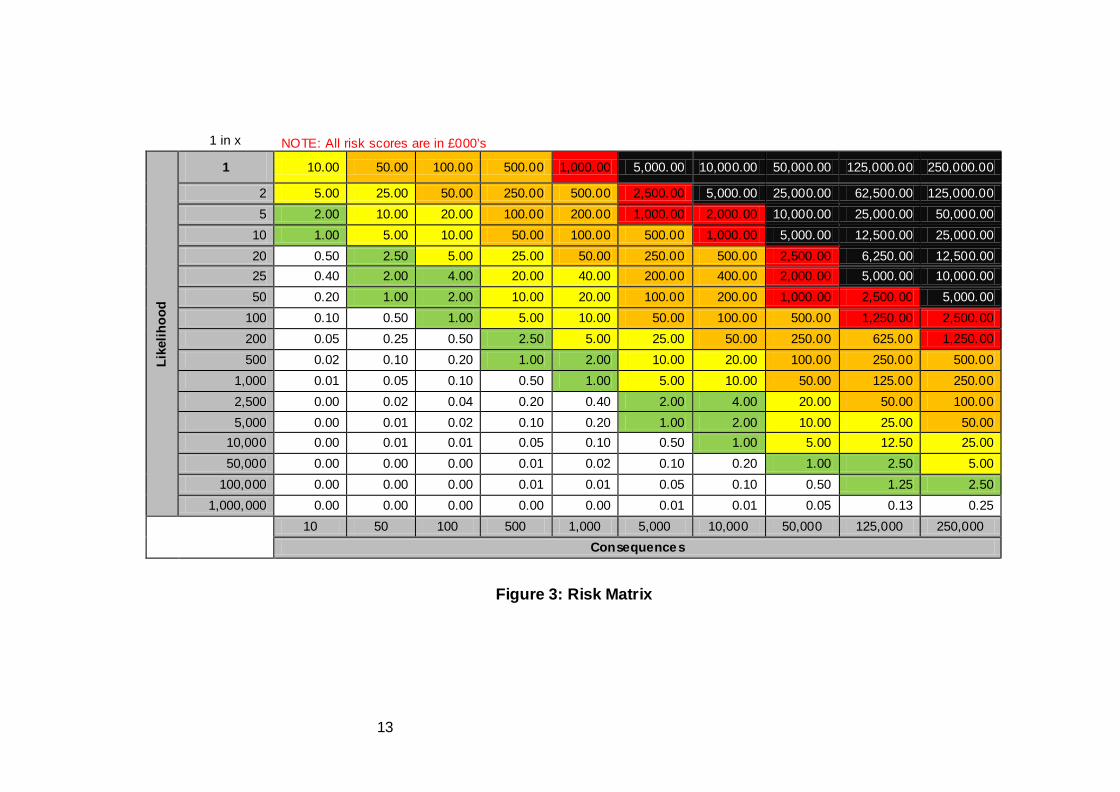
1 in x NOTE: All risk scores are in £000’s Li
kelih
ood
1 10.00 50.00 100.00 500.00 1,000.00 5,000.00 10,000.00 50,000.00 125,000.00 250,000.00
2 5.00 25.00 50.00 250.00 500.00 2,500.00 5,000.00 25,000.00 62,500.00 125,000.00 5 2.00 10.00 20.00 100.00 200.00 1,000.00 2,000.00 10,000.00 25,000.00 50,000.00
10 1.00 5.00 10.00 50.00 100.00 500.00 1,000.00 5,000.00 12,500.00 25,000.00 20 0.50 2.50 5.00 25.00 50.00 250.00 500.00 2,500.00 6,250.00 12,500.00 25 0.40 2.00 4.00 20.00 40.00 200.00 400.00 2,000.00 5,000.00 10,000.00 50 0.20 1.00 2.00 10.00 20.00 100.00 200.00 1,000.00 2,500.00 5,000.00
100 0.10 0.50 1.00 5.00 10.00 50.00 100.00 500.00 1,250.00 2,500.00 200 0.05 0.25 0.50 2.50 5.00 25.00 50.00 250.00 625.00 1,250.00 500 0.02 0.10 0.20 1.00 2.00 10.00 20.00 100.00 250.00 500.00
1,000 0.01 0.05 0.10 0.50 1.00 5.00 10.00 50.00 125.00 250.00 2,500 0.00 0.02 0.04 0.20 0.40 2.00 4.00 20.00 50.00 100.00 5,000 0.00 0.01 0.02 0.10 0.20 1.00 2.00 10.00 25.00 50.00
10,000 0.00 0.01 0.01 0.05 0.10 0.50 1.00 5.00 12.50 25.00 50,000 0.00 0.00 0.00 0.01 0.02 0.10 0.20 1.00 2.50 5.00
100,000 0.00 0.00 0.00 0.01 0.01 0.05 0.10 0.50 1.25 2.50 1,000,000 0.00 0.00 0.00 0.00 0.00 0.01 0.01 0.05 0.13 0.25
10 50 100 500 1,000 5,000 10,000 50,000 125,000 250,000 Consequences
Figure 3: Risk Matrix
13
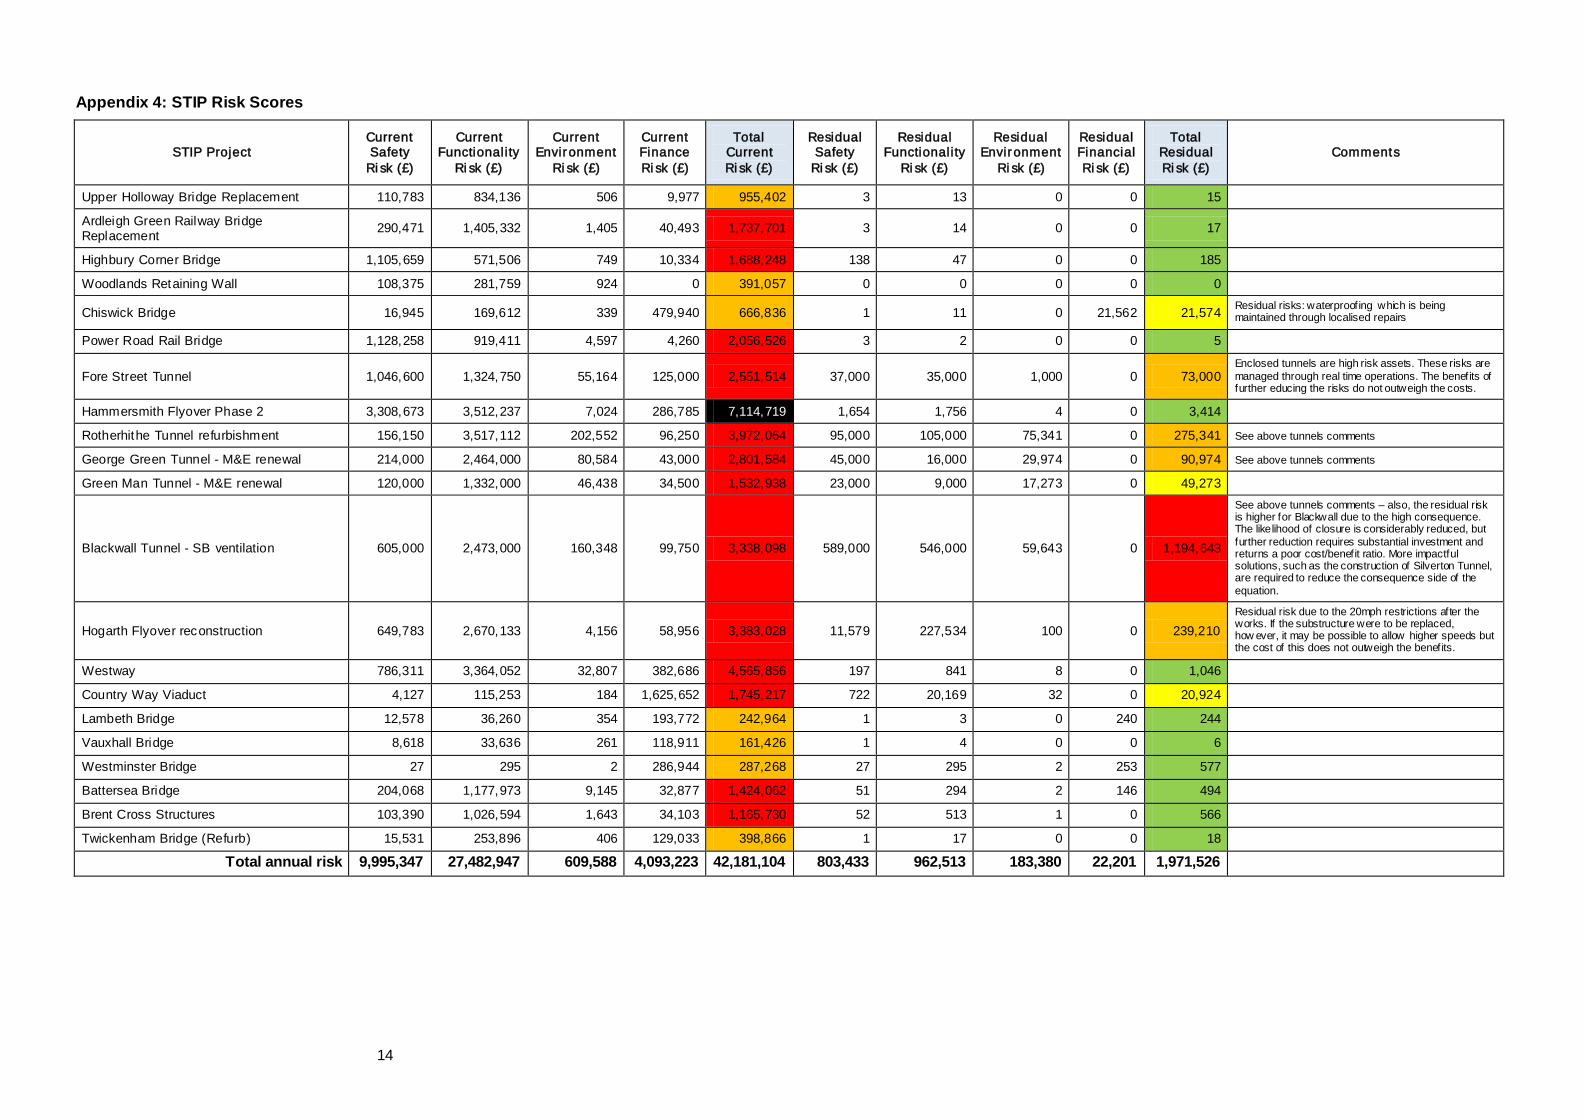
Appendix 4: STIP Risk Scores
STIP Project Current Safety
Ri sk (£)
Current Functionality
Ri sk (£)
Current Environment
Ri sk (£)
Current Finance Ri sk (£)
Total Current Ri sk (£)
Residual Safety
Ri sk (£)
Residual Functionality
Ri sk (£)
Residual Environment
Ri sk (£)
Residual Financial Ri sk (£)
Total Residual Ri sk (£)
Comments
Upper Holloway Bridge Replacement 110,783 834,136 506 9,977 955,402 3 13 0 0 15
Ardleigh Green Railway Bridge Replacement 290,471 1,405,332 1,405 40,493 1,737,701 3 14 0 0 17
Highbury Corner Bridge 1,105,659 571,506 749 10,334 1,688,248 138 47 0 0 185
Woodlands Retaining Wall 108,375 281,759 924 0 391,057 0 0 0 0 0
Chiswick Bridge 16,945 169,612 339 479,940 666,836 1 11 0 21,562 21,574 Residual risks: waterproofing which is being maintained through localised repairs
Power Road Rail Bridge 1,128,258 919,411 4,597 4,260 2,056,526 3 2 0 0 5
Fore Street Tunnel 1,046,600 1,324,750 55,164 125,000 2,551,514 37,000 35,000 1,000 0 73,000 Enclosed tunnels are high risk assets. These risks are managed through real time operations. The benefits of further educing the risks do not outweigh the costs.
Hammersmith Flyover Phase 2 3,308,673 3,512,237 7,024 286,785 7,114,719 1,654 1,756 4 0 3,414
Rotherhithe Tunnel refurbishment 156,150 3,517,112 202,552 96,250 3,972,064 95,000 105,000 75,341 0 275,341 See above tunnels comments
George Green Tunnel - M&E renewal 214,000 2,464,000 80,584 43,000 2,801,584 45,000 16,000 29,974 0 90,974 See above tunnels comments
Green Man Tunnel - M&E renewal 120,000 1,332,000 46,438 34,500 1,532,938 23,000 9,000 17,273 0 49,273
Blackwall Tunnel - SB ventilation 605,000 2,473,000 160,348 99,750 3,338,098 589,000 546,000 59,643 0 1,194,643
See above tunnels comments – also, the residual risk is higher for Blackwall due to the high consequence. The likelihood of closure is considerably reduced, but further reduction requires substantial investment and returns a poor cost/benefit ratio. More impactful solutions, such as the construction of Silverton Tunnel, are required to reduce the consequence side of the equation.
Hogarth Flyover reconstruction 649,783 2,670,133 4,156 58,956 3,383,028 11,579 227,534 100 0 239,210 Residual risk due to the 20mph restrictions after the works. If the substructure were to be replaced, how ever, it may be possible to allow higher speeds but the cost of this does not outweigh the benefits.
Westway 786,311 3,364,052 32,807 382,686 4,565,856 197 841 8 0 1,046 Country Way Viaduct 4,127 115,253 184 1,625,652 1,745,217 722 20,169 32 0 20,924 Lambeth Bridge 12,578 36,260 354 193,772 242,964 1 3 0 240 244 Vauxhall Bridge 8,618 33,636 261 118,911 161,426 1 4 0 0 6 Westminster Bridge 27 295 2 286,944 287,268 27 295 2 253 577 Battersea Bridge 204,068 1,177,973 9,145 32,877 1,424,062 51 294 2 146 494 Brent Cross Structures 103,390 1,026,594 1,643 34,103 1,165,730 52 513 1 0 566 Twickenham Bridge (Refurb) 15,531 253,896 406 129,033 398,866 1 17 0 0 18
Total annual risk 9,995,347 27,482,947 609,588 4,093,223 42,181,104 803,433 962,513 183,380 22,201 1,971,526
14
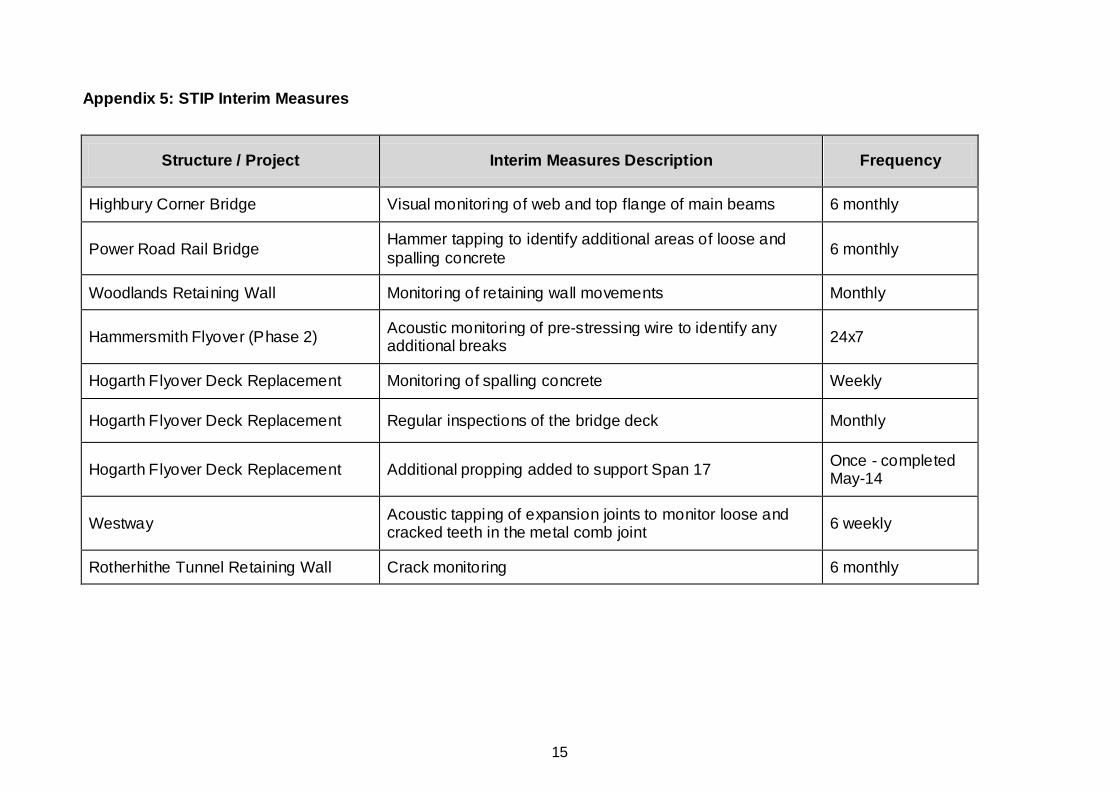
Appendix 5: STIP Interim Measures
Structure / Project Interim Measures Description Frequency
Highbury Corner Bridge Visual monitoring of web and top flange of main beams 6 monthly
Power Road Rail Bridge Hammer tapping to identify additional areas of loose and spalling concrete 6 monthly
Woodlands Retaining Wall Monitoring of retaining wall movements Monthly
Hammersmith Flyover (Phase 2) Acoustic monitoring of pre-stressing wire to identify any additional breaks 24x7
Hogarth Flyover Deck Replacement Monitoring of spalling concrete Weekly
Hogarth Flyover Deck Replacement Regular inspections of the bridge deck Monthly
Hogarth Flyover Deck Replacement Additional propping added to support Span 17 Once - completed May-14
Westway Acoustic tapping of expansion joints to monitor loose and cracked teeth in the metal comb joint 6 weekly
Rotherhithe Tunnel Retaining Wall Crack monitoring 6 monthly
15