Embed Size (px)
Citation preview
Risø-R-1504(EN)
Safety assessment of ammonia as atransport fuel
Nijs Jan Duijm, Frank Markert, Jette Lundtang Paulsen
Risø National LaboratoryRoskildeDenmark
February 2005
Author: Nijs Jan Duijm, Frank Markert, Jette Lundtang Paulsen Title: Safety assessment of ammonia as a transport fuel Department: System Analysis Department
Risø-R-1504(EN) February 2005
ISSN 0106-2840 ISBN 87-550-3415-2
Contract no.: EU-FP5 contract ENK6-CT-2001-00580 (“ACCEPT”) Group's own reg. no.: PSP 1225070
Sponsorship:
Cover :
Pages: 41 Tables: 5 References: 7
Abstract: This report describes the safety study performed as part of the EU supported project “Ammonia Cracking for Clean Electric Power Technology” The study addresses the following activities: safety of operation of the ammonia-powered vehicle under normal and accident (collision) conditions, safety of transport of ammonia to the refuelling stations and safety of the activities at the refuelling station (unloading and refuelling). Comparisons are made between the safety of using ammonia and the safety of other existing or alternative fuels. The conclusion is that the hazards in relation to ammonia need to be controlled by a combination of technical and regulatory measures. The most important requirements are: − Advanced safety systems in the vehicle − Additional technical measures and regulations are required to
avoid releases in maintenance workshops and unauthorised maintenance on the fuel system.
− Road transport of ammonia to refuelling stations in refrigerated form
− Sufficient safety zones between refuelling stations and residential or otherwise public areas.
When these measures are applied, the use of ammonia as a transport fuel wouldn’t cause more risks than currently used fuels (using current practice).
Risø National Laboratory Information Service Department P.O.Box 49 DK-4000 Roskilde Denmark Telephone +45 46774004 [email protected] Fax +45 46774013 www.risoe.dk
Contents
Preface 5
1 Methodology of safety assessment 6 1.1 Scope of the study 6 1.1.1 Risk parameters 6 1.1.2 Comparison of safety aspects of ammonia with other transport fuels 7 1.2 Use of Ammonia 7 1.3 Regulatory aspects 8 1.3.1 “Seveso-II” 8 1.3.2 RID and ADR 9 1.3.3 Local regulations 9
2 Safety assessment of the ammonia-driven vehicle 10 2.1 Description of the ammonia tank system design principles 10 2.2 Failure and hazard analysis of the ammonia tank system 11 2.2.1 Lifecycle phases 11 2.2.2 Hazard identification: HazOp and FMECA 12 2.3 Ammonia tank system safety functions and reliability allocation 14 2.3.1 Requirements for tank structural integrity 14 2.3.2 Safety system reliability allocation 15 2.3.3 Safety during maintenance 17 2.3.4 Accident scenarios 17 2.4 Comparison with LPG driven vehicles 17 2.5 Comparison with gasoline-driven cars 18 2.6 Comparison with methanol-powered vehicles 19 2.7 Comparison with hydrogen-powered vehicles 19 2.8 Comparison between risk from the different fuels 21 2.9 Conclusions and recommendations 22 2.9.1 Risk acceptance 22
3 Safety assessment of ammonia distribution to fuelling stations 24 3.1 Risk assessment of conventional road transport of hazardous materials and transport fuels 24 3.1.1 Studies on hazardous road transport 24 3.1.2 Accident statistics for heavy duty vehicles 24 3.2 Scenario analysis of transport of ammonia in a road tanker from the medium storage to the filling station 26 3.3 Risk assessment of additional transport of ammonia 26 3.4 Comparison of risk of transportation of different fuels 29 3.4.1 Consideration of additional requirements and specifications for ammonia transport by road tankers 29 3.4.2 Individual Risk along the transport route and comparison 30
4 Safety assessment of ammonia refuelling stations 33 4.1 Description of ammonia refuelling station principles 33 4.2 Failure and hazard analysis of the ammonia refuelling station 34 4.3 Findings from consequence assessment 36 4.4 Fuelling station safety functions and reliability allocation 36 4.5 Comparison with fuelling stations for other fuels (LPG and gasoline) 37 4.6 Conclusions and recommendations 37
Risø-R-1504(EN) 3
5 Conclusions 39 5.1 Uncertainty 40
6 References 41 Annexes: Annex A – Comparison of Ammonia with other transport fuels Annex B – Guideline for safe handling of ammonia in laboratories Annex C – Allowable permeability of ammonia tanks in ammonia-driven
vehicles Annex D – Failure and accident probabilities Annex E – Safety assessment of ammonia as a transport fuel - Annex E -
Consequence assessment of accident scenarios Annex F – HazOp and FMEA Tables and results
4 Risø-R-1504(EN)
Preface This study is performed as part of the project within the European Commision’s 5th framework programme: “Ammonia Cracking for Clean Electric Power Technology”. Work package 6 of this study considers the possible constraints in using ammonia as a transport fuel due to health and safety concerns.
The main aim of this study is to perform comparative safety studies for the most important elements or life cycle phases in using ammonia as an ordinary fuel in cars, i.e. safety of the car itself, safety at the refuelling station, and safety of road transport of ammonia to the refuelling stations. These studies have been performed using conventional QRA (Quantified Risk Analysis) techniques and studies for similar systems (e.g. distribution of LPG for transport). Special attention has been paid to accidental conditions (“collision”) with respect to integrity of tanks and piping, and the consequences (fatalities, injuries) of loss of containment from tanks or piping.
The system design is evaluated for safety improvement using hazard identification and hazard analysis methods (HAZOP and FMECA). Recommendations for improvement of safety are provided along with the risk assessment.
Comparisons are made with the hazards of other fuels, either widely used (gasoline, Liquid Petroleum Gas – LPG) or possible alternatives for fuel-cell powered vehicles (hydrogen, methanol).
Separate work package activities reported in this report and its annexes are:
• Review and assessment of properties of ammonia, relevant for health, environment and safety in connection to application as a bridge fuel, and in comparison to alternative and conventional fuels (methanol, hydrogen, gasoline and CNG). The review includes acute and long-term toxicity, flammability, handling requirements, and environmental issues (Annex A).
• Comparative consequence calculations (extent of adverse effects in case of a number of accident scenarios) for ammonia and the alternative or conventional fuels (Annex E)
Risø-R-1504(EN) 5
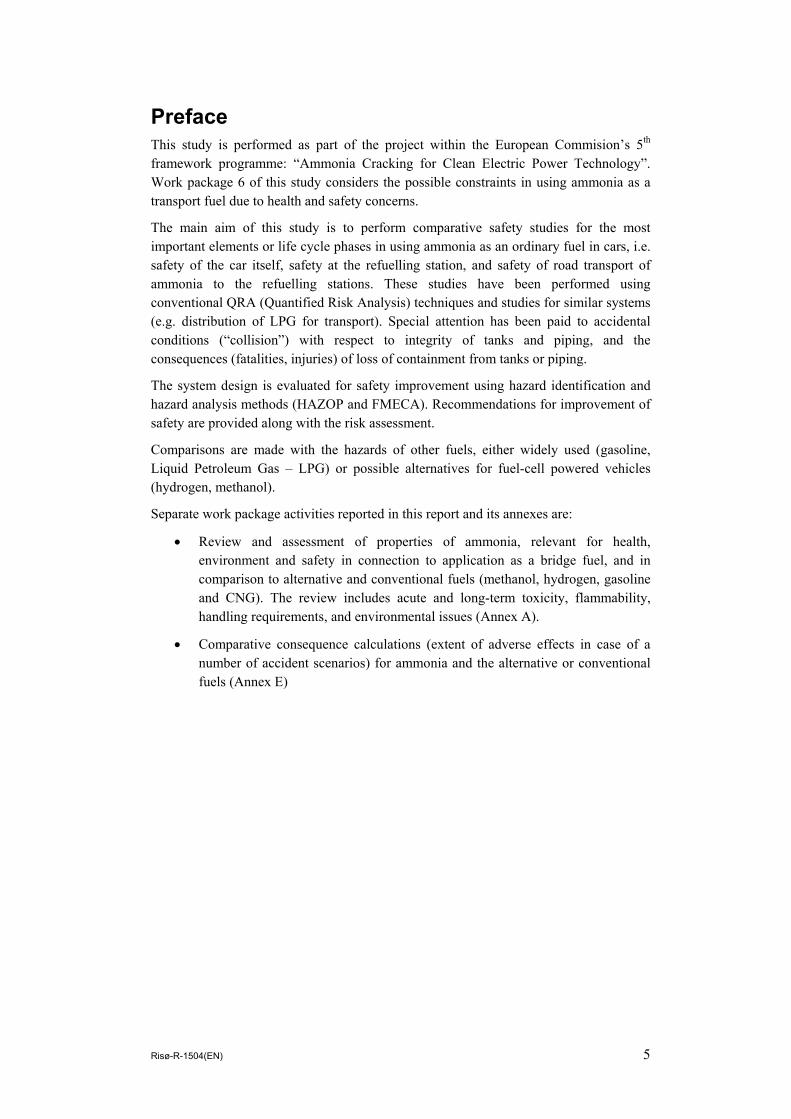
1 Methodology of safety assessment 1.1 Scope of the study Ammonia is a widely used chemical in the process industry. It is produced and transported in large quantities. The use as a fuel for road traffic will increase the volume of the handled ammonia at production facilities and main, large scale storage facilities, but not change the existing structure or safety considerations. The part of the distribution chain that has to be developed as a new infrastructure is the distribution from medium scale depots to filling stations, and the handling at filling stations. Safety in relation to these activities, together with the presence of ammonia in general vehicles on the road, will be the main consideration for accepting ammonia as a fuel for road traffic. Safety aspects of the other parts of the chain (production, shipping and large scale storage) are based on existing, accepted technologies and depend fully on local conditions with respect to land-use planning and safety distances.
Filling stations
Storage (medium scale)
Figure 1 Flow of ammonia
Production and Storage (centralized)
Truck transport User transport
Figure 1 shows the flow of ammonia from production to the consumers. In this study the safety in relation to the truck transport, the refuelling station and the consumer vehicle will be treated. The study for the safety of the truck is concentrated about accidents during transport, with release of ammonia, and the consequences for a third party. The study of the truck transport is based on probabilistic method, based on experience and for the consequence of the release dispersion models is used. The safety studies of the refuelling station and the vehicle system concern both possibilities of release of ammonia, which can influence people and the surrounding. Also failures of the equipment, which can cause damage to the system itself, is treated. The study of the refuelling station and the consumer vehicle is mainly based on HAZOP analysis. A FMEA analysis has been used to decide which safety equipments are necessary for the systems.
1.1.1 Risk parameters With respect to assessing relevant risk parameters, different philosophies can be used, depending on what “target” of risk is in focus: a representative of the uninvolved public (“third party”), the society or groups within society, or users of the vehicles. The different risk parameters depend on various conditions:
The local approach for a third party being present next to the road. Here the risk is proportional to the risk per accident and the number of hazardous vehicles (tank cars and private cars fuelled by the hazardous fuel) passing by or another “intensity” parameter (e.g. the quantity of handled fuel at a nearby refuelling
•
6 Risø-R-1504(EN)

station). The relevant parameter is the individual risk (Note that individual risk is a geographical quantity, i.e. it present a spatial distribution of risk – the name suggests misleadingly that the risk is attached to individuals). This approach will be used for evaluation of the risk of transport of the fuels and the refuelling station.
The social consideration (how many people can be killed by an accident country-wide). This risk depends (it is more complex than a proportional relationship) on risk per accident, population density along the route, total number of km/year for the hazardous vehicles. In order to calculate societal risk, the local conditions need to be known. In this comparative, general study, this parameter will not be used.
•
•
•
Risk for a hazardous-vehicle driver (driver’s risk) depends on the risk per accident and the number of km driven by the driver. The risk calculations for the ammonia-powered vehicles come very close to such a “vehicle-attached” individual, though this risk is expressed as a function of distance from the vehicle, so it provides information for the third party risk as well.
Risk for a non-hazardous-vehicle driver (third-party driver’s risk) depends on the risk per accident, the intensity of the hazardous vehicle on the road (proportional to the total km/year of the hazardous vehicles) and the number of km driven by the driver him/herself. This risk is not explicitly accounted for, but the risk distances around the ammonia-driven vehicles are the required input to evaluate this risk.
1.1.2 Comparison of safety aspects of ammonia with other transport fuels Ammonia should be compared to a number of alternative fuels with respect to safety and acceptability. The most relevant fuels for comparison are:
− Gasoline
− Liquid Petroleum Gas, LPG
− Hydrogen
Gasoline (petrol, motor spirit) is the most common fuel for (private) motor vehicles at present, widely accepted, though more flammable than e.g. diesel fuel.
LPG, a mixture of propane and butane, is very similar in physical behaviour and technology with respect to storage, distribution and fuelling. Ammonia and LPG are distributed and stored at filling stations as a pressurised gas with a pressure of 6 – 10 bar.
Pressurised hydrogen is the most probable alternative hydrogen carrier, but difficult to identify the technological solutions at this moment. Unknown variables are pressure, temperature (liquefied hydrogen being considered) or storage using hydrides.
1.2 Use of Ammonia Ammonia is one of the most commonly used inorganic chemicals within the chemical industry. It is used for production of fertiliser, nitrates, explosives, nitric acid, amines, amides and textiles. Within the petrochemical industry it is used to neutralise acids in crude oil.
In many areas Ammonia is used as protection gas e.g. by heat treatment of steel. The gas can be split up into its elements hydrogen and nitrogen, using a catalyst. The
Risø-R-1504(EN) 7

thermodynamic properties of ammonia make it well suited as a medium in cooling systems, heat pumps and similar systems. Ammonia NH3 is a colourless, highly irritating gas with a sharp, suffocating odour. It dissolves easily in water and liquid ammonia evaporates quickly. It is commonly sold in liquid forms (dissolved in water or in pressurised tanks).
Large amounts of ammonia are produced naturally in soil by bacteria, decaying plants and animals, and animal wastes. Ammonia is a key intermediate in the nitrogen cycle and is essential for many biological processes.
For industrial purposes ammonia is synthesised from its elements nitrogen and hydrogen in large quantities. Exposure to anhydrous ammonia can cause blindness, lung damage, burns, or death. Symptoms include burning of the eyes, nose and throat after breathing even small amounts. See Appendix B.
1.3 Regulatory aspects Storage, transport and handling of hazardous goods, including ammonia, LPG, gasoline and similar fuels, are subject to a variety of international, European, and national regulations. Additionally, regulations are in force that regulate the specifications, testing and maintenance of pressurised equipment (tanks and piping). For specific combinations of hazardous substances and applications, e.g. the use of LPG as a fuel in passenger cars, specific regulations and/or standards have been developed: The ECE UN Regulation 67 covers requirements for LPG vessels in vehicles, construction, and approval but this regulations does not cover the control system. Similar regulations need to be developed for ammonia, or any other alternative, hazardous fuel, like natural gas or hydrogen. At present, the lack of appropriate regulation in the EU on the use of hydrogen in vehicles is considered a problem in the further development of hydrogen systems. The same situation would apply to ammonia systems in vehicles.
It can be expected that ammonia applications would need to follow equivalent regulations as for NG and LPG, i.e. the regulations would include:
− Specifications for equipment in relation to required safety level (perhaps performance based requirements);
− Requirements that all components need a priori approval;
− Requirements on workshops installing and maintaining the ammonia systems;
− Requirements on authority control of the systems;
− Requirements on periodic inspection.
1.3.1 “Seveso-II” The European Council Directive “96/82/EC on the control of major-accident hazards involving dangerous substances” (European Council, 1997) (“Seveso-II directive”) regulates the production, handling and storing of hazardous substances. All relevant fuels for this study (ammonia, LPG, gasoline, methanol, hydrogen) are explicitly or implicitly (by means of the hazard classifications) subject to this directive. Industrial installations that have on their site a larger quantity of these substances than the threshold quantities are required to implement a major-accident prevention plan, which includes maintaining risk analysis and implementing specific safety management requirements. For ammonia, LPG and Natural Gas the threshold level (for the lower hazardous category – the directive distinguishes “low tier” and “high tier” installations) amounts to 50 tons. For
8 Risø-R-1504(EN)

hydrogen, the corresponding amount is 5 tons, for methanol 500 tons, and for gasoline 2500 tons (amendment 2003/105/EC). As a consequence, it is recommended that refuelling stations’ storage capacity does not exceed the Seveso “low tier” threshold of 50 tons ammonia.
1.3.2 RID and ADR The RID (Regulations concerning the International Carriage of Dangerous Goods by Rail) and ADR (European Agreement concerning the International Carriage of Dangerous Goods by Road) regulate the conditions of the transport of dangerous goods by rail and road, respectively. The regulations are based on a set of substance classifications and they describe for different types of substances the principal requirements and conditions for packaging, including pressure vessels. The ADR regulates construction of packaging, tanks, vehicles, and requirements and conditions for loading and unloading, equipment and personnel at the vehicle, and documentation.
1.3.3 Local regulations In all national countries exist regulations that cover storage and transportation of hazardous materials, covering ammonia. E.g. in Denmark, for transportable pressure vessels larger than 12 l, the Danish Occupational Health Agency and the Danish Emergency Management Agency have stipulated requirements for construction (steel), and requirements for storage. In general, permits are required for storage of pressurised gases.
Risø-R-1504(EN) 9

2 Safety assessment of the ammonia-driven vehicle
2.1 Description of the ammonia tank system design principles The tank system for the ammonia storage is very similar to the principles used for LPG. But in this case additional safety systems are included in the design, see Figure 2
The tank itself is based on a concept developed by Advanced Lightweight Engineering, consisting of carbon fibres with a inner lining of polyethylene (PE). This construction is tested for LPG vehicles. The advantage over steel tanks is that it excludes (which has been proven for LPG) explosive failure if the tank in a fire. When heated by fire, the lining will melt and the contents will release through the porous fibres and burn in the fire.
The tank system includes the tubing to a filling-hose connection point where the tank can be filled at a filling station. This part contains three systems to reduce the possibility of ammonia release:
1 After filling the tank, the liquid ammonia in the tubing between the filling-hose connection and the tank will be extracted by vacuum-purging the tubing through the filling hose before disconnecting. This means that there is only a very small amount of ammonia in the tube outside the tank (safety system 1)
2 To avoid overfilling of the tank, the tubing will be closed on a high level indication from the tank. In conventional LPG tanks, this system is based on a float-operated valve. Reliability analysis and –allocation (see below) of the final design will determine whether this system is adequate, or whether redundancy is required (safety system 2);
3 A no-return check valve system is mounted on the tank to avoid flow from the tank into the tube to the filling-hose connection. This is included in conventional LPG tanks, but also here, reliability analysis and –allocation (see below) of the final design will determine whether redundancy is required (safety system 3)
4 On the tank, a high-pressure relief system is mounted to cope with too high pressures as a consequence of overfilling and temperature rise. This venting system needs to release the ammonia in a controlled way, preferably to a point in the fuel delivery system before the reformer, as to convert the ammonia to harmless substances before emission (safety system 4).
The last part of the system consists of the connection from the tank to the reformer. Part of this connection is the evaporator/pressure reducer. In this equipment, heat is provided (from the fuel cell cooling water) to evaporate the liquefied ammonia, and the pressure is reduced to the working pressure in the remainder of the fuel delivery system, which is approx. 1.5 bar overpressure. This part of the system includes two elements to ensure safe operation:
1 The main valve on the tank controls the gas flow to the evaporator and reformer. In conventional LPG systems, this is a electromagnetic valve, that opens when it is activated (i.e. is closes when the electrical power fails). The activation is linked to a control system that determines when the valve needs to be closed, including situation when the down-flow tubing system fails. Detection can be in different ways, e.g. by high flow detection and gas sensors. The amount of gas that can leak through the down-flow
10 Risø-R-1504(EN)

tubing system is limited by reducing the tube diameter between the tank and the evaporator. For the power requirements for the target system, the maximum operation flow can pass without too high pressure loss is 8 g/s. This can be reached by a 2 mm ID (inner diameter) tubing. This relatively small diameter will reduce the consequences (release rates) of damages to the tubing before or after the evaporator (safety system 5)
2 The evaporator is to be designed in such a way that it never closes completely. This avoids pressurisation of the tube section between the tank and the evaporator when the main valve is closed (safety system 6)
The hardware parts of safety systems 2, 3, 4, and 5 are typically put together in a “multi-valve” that is mounted on the inner core of the tank.
Safety System 1Safe connection toFilling station anddepressurization
of filling line
Safety System 6Depressurization of
liquid line after operation
Safety System 5Abort flow to evaporator
in case of damage orleakage
Safety System 4Pressure relief and
safe venting of ammonia
Safety System 2Avoid overfilling
Safety System 3Avoid backflow from
tank to filling line
Tank
Heating(Excess heat from
Fuel Cell)
Vaporizer
To reformer
Multivalve components
Figure 2. Principle of the ammonia tank system design.
2.2 Failure and hazard analysis of the ammonia tank system 2.2.1 Lifecycle phases The life cycle phases for the ammonia powered vehicle system include the following phases:
− Commissioning (first time fill of the tank)
− Start
− Run (full load, low load)
− Stop
− Fuelling
− Maintenance
− Destruction
Risø-R-1504(EN) 11

This study is based on a design stage of the full system and the analysis is therefore restricted to general considerations on some of the important phases, while others cannot be analysed without a more concrete knowledge of the system. This study addresses the following analyses:
− A safety study of the car system during normal operation (start-up and running);
− Requirements for refuelling;
− A safety study of the refuelling stations
− Some considerations regarding risk levels and requirements for maintenance work on the car tank system.
2.2.2 Hazard identification: HazOp and FMECA To secure a safe system in the car, two studies for identifying potential hazards have been carried out using the primarily design of the system. The two methods used are a FMEA and a HAZOP study. The hazards in focus are releases of ammonia. The main purpose of the analysis is to design a sufficient safety system that prevents unnecessary releases during filling and driving. The FMEA analysis identified some need for safety systems, which are illustrated on Figure 2. This concerns primarily the tank system.
The main results from the FMEA analysis are:
− To secure that the connection system in the filling line are empty both before filling and after a filling a vacuum check has to be carried out to prevent a release of ammonia.
− A pressure relief system has to be installed on the tank to prevent the tank from overpressure in case of overfilling.
− An external frame to prevent the tank from damage in a collision is proposed
− In case the external detector detects ammonia the current to magnetic valve should be cut-off.
− Furthermore was identified need for ammonia detectors both inside the system and outside the system. Inside to prevent unreformed ammonia to get into the fuel cells and outside to detect external releases of ammonia
The schemes from the analysis are in Appendix F.
The HAZOP analysis was then carried out to supplement the FMEA analysis, as the FMEA analysis takes its starting point in a failure mode of a component and looks at the resulting consequences on the system, while the HAZOP analysis takes the starting point in a deviation of the process parameters, the consequences of this deviation and then the cause for this deviation is assessed.
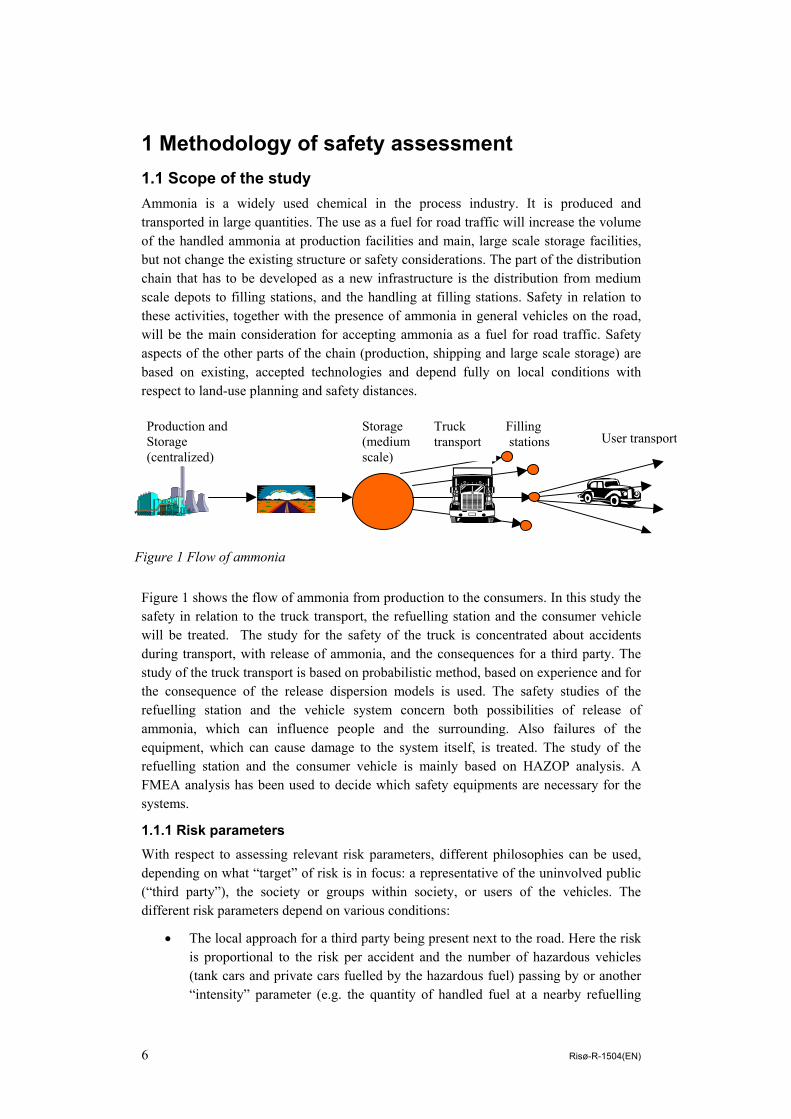
The main results from the HAZOP analysis are that the proposed safety systems will prevent the potential events found during the HAZOP study. The results are seen in the following scheme (Table 1). Schemes from the total analysis are in Appendix F.
12 Risø-R-1504(EN)
Table 1 Results of the HAZOP study of the car system
System Event Safeguard Conclusion Fill line to tank
Release due to check valve on tank fails and valve at connection fails as well on disconnection. Release by filling
Disconnection safety system on car. Line empty Concentration based alarm, emergency shut down of fuelling station
The safety system prevents a release of ammonia
Tank Release Safe design of the tank. The tank is designed to withstand a collision. External frame to protect tank on impact. In case of fire the lining will melt and cause only slow release. A level indicator protects overfilling and valves close at max. level. Gas alarm is installed Safety system on compressor and vacuum compressor to prevent damage on tank Max. flow valve in pipe from tank.
The safeguard will prevent damage of the tank and a total release will only happen in very severe accidents. Small punctures with a leak will be detected by the gas alarm. This will also detect gas leakages from other parts of the ammonia system. The max flow valve in pipe fron tank and narrow pipes decrease a leak from this system.
Evaporator Down-flow section on high pressure due to evaporator failure. Down flow system not designed for high pressure. Fuel cells will be destroyed and leaks can occur
High-pressure alarm on down flow section closes main valve. Gas alarm installed
The safety system will protect the down flow system and the fuel cells.
Reformers Overheating
Temperature control on burner Temperature control on El. reformer
Burners and burner flue gas
Release of burner fuel through the compressor
Check valve on compressor
This can happen in case the burner outlet is blocked.
Absorbers Poisoned absorbers will allow NH3 into the fuel cells and damage these
NH3 sensor
Fuel cells
Leakages from the system are limited and will be detected by the gas alarm
Risø-R-1504(EN) 13
2.3 Ammonia tank system safety functions and reliability allocation
2.3.1 Requirements for tank structural integrity In order to reduce the possibility for damage during accidents, requirements have to be defined for the structural integrity of the ammonia fuel tank in the car. The probability of rupture of the tank during road accidents should be extremely low compared to the potential for other accident consequences (fatalities). Therefore, we suggest requiring that the tank structure (including any surrounding substructure to secure the tank) can absorb the energy of two frontally colliding cars of 2000 kg each at 100 km/h. In that case, each car has to absorb its own total kinetic energy
)(½ 2 NmmVW =
where
m mass of vehicle (kg),
V the velocity (m/s).
The accident defined above corresponds to an energy of 0.4⋅106 Nm. According to the NASS GESS data1 (National Highway Traffic Safety Administration, 2001), 1.8% of all accidents happens at velocities over 97 km/h, and 69% of these accidents causes severe damage to the car. Out of 1000 of these high-speed and severe-damage accidents, 8 accidents concern frontal (head-on) collisions, and 0.4 of those involve medium or heavy vehicles.
By linking the NASS GES fatality rate (1 out of 382 accidents has fatal consequences, data for 1999 to 2001) to the fatality rate per vehicle km (0.9 fatalities per 100 million vehicle km), one concludes that the general accident rate is about 350 per 100-million vehicle-km. If we assume that out of the high-speed, severe damage, frontal accidents with heavy vehicles, 10% of the events will lead to an ammonia tank rupture (because the absorbed energy exceeds the design values), we estimate that tank rupture may happen with a probability of 2⋅10-4 per 100-million vehicle-km (i.e. the likelihood of tank rupture is a factor 5000 lower than the likelihood of a fatal accident). The event tree is presented in Figure 3.
Based on at least 50 billion vehicle km using LPG cars in the Netherlands since 19832 without reported tank rupture, the probability of this event can be estimated to be less than 2⋅10-3 per 100 million vehicle km. Conventional LPG installations are subject to the American regulations FMVSS303 and the European ECE R34. These regulations involve head-on, side-on and rear-on impact tests at 48 and 35 km/h. Our more stringent requirement means that the probability of tank rupture of the ammonia tank will be lower than for the conventional LPG installations.
1 The NASS GES database is a collection of samples of detailed accident data from the US. For all
records, a weight factor is included that describes how representative the sampled accident is in relation to the national accident statistics. Using this weight, the expected frequency of specific types of accidents (as described in the text) can be estimated
2 This 50 billion vehicle km is based on the average yearly km/vehicle. Due to the tax structure, LPG cars are assumed to drive more than average km/year, this may possibly reduce the estimated probability.
14 Risø-R-1504(EN)

0.1
0.04 0.00004
0.01
High-speed & severe damage accident
Other accident
Frontal collision
Heavy vehicle involved
Tank rupture
No tank rupture
No heavy vehicles
No tank rupture
No tank rupture
Figure 3 Conditional probability of tank rupture in an ammonia driven passenger car when the tank structure is designed to withstand frontal collision at 100 km/h.
2.3.2 Safety system reliability allocation For the operational phase of the passenger car, we distinguish the three likeliest possibilities for serious releases of ammonia. One reason is damage caused when the car is involved in an accident (physical impact and fire), one is overfilling of the tank, and the last one is a failure of the regulator causing overpressure in the fuel delivery system.
The relations between events and conditions for accidents are included in a Bayesian network as shown in Figure 4. The likelihood of damage to a part of the ammonia system depends on the severity of the damage to the car as a whole, and the speed at the time of impact. Relations between these factors and accidents in general can be deducted from (National Highway Traffic Safety Administration, 2001). Based on these factors, damage to the ammonia system components is assumed as to match experiences with gasoline and LPG vehicles. The components are the tank itself (assuming total failure), the tubing between the tank and the filling-hose connection, the tube between the tank and the evaporator/regulator (filled with liquefied ammonia) and the tubing between the evaporator/regulator and the reformer (filled with vaporised ammonia). Releases (or the condition of the releases) from these last three components depend on the functioning of some safety systems and the evaporator (if the evaporator/regulator fails, the down-flow tubing may be at full tank pressure). The reliability of the safety systems is chosen as to keep the likelihood of releases from the tubing only a factors 10 higher than the likelihood of total failure of the tank. This result follows the requirements for failure on demand following mechanical impact:
− Safety system 3 (non-return flow system): 0.01.
− Safety system 5 (main valve): 0.01.
Risø-R-1504(EN) 15
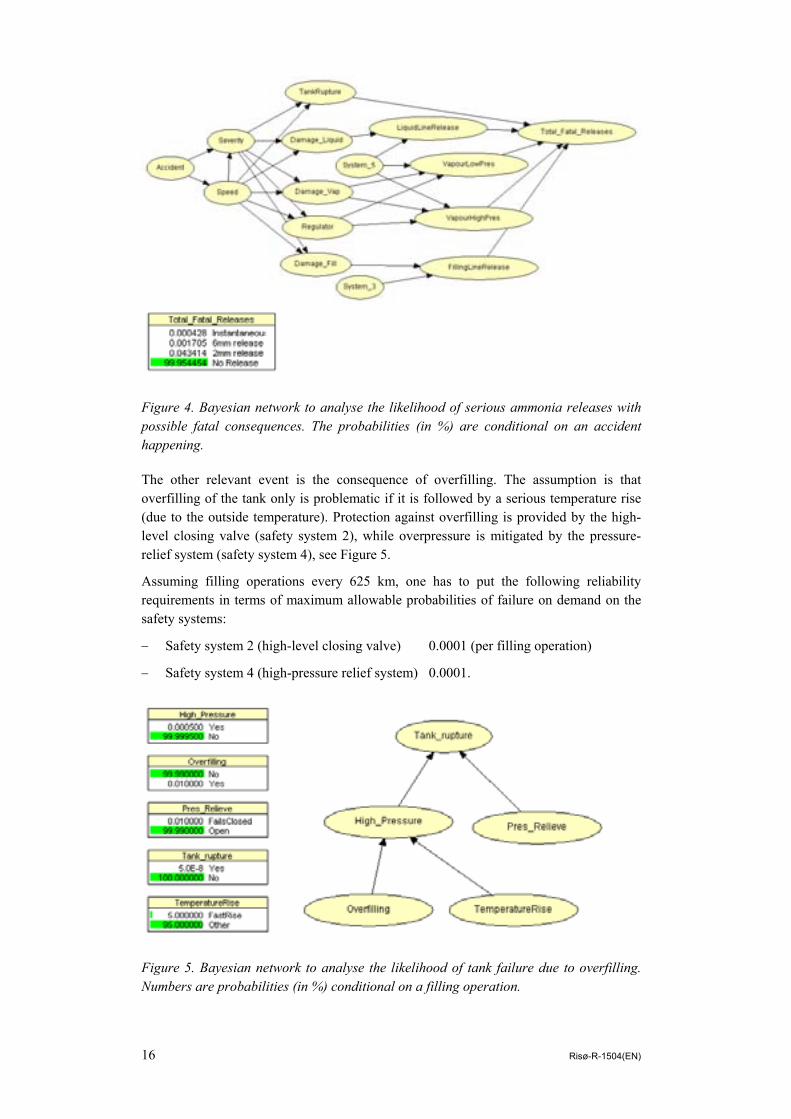
Figure 4. Bayesian network to analyse the likelihood of serious ammonia releases with possible fatal consequences. The probabilities (in %) are conditional on an accident happening.
The other relevant event is the consequence of overfilling. The assumption is that overfilling of the tank only is problematic if it is followed by a serious temperature rise (due to the outside temperature). Protection against overfilling is provided by the high-level closing valve (safety system 2), while overpressure is mitigated by the pressure-relief system (safety system 4), see Figure 5.
Assuming filling operations every 625 km, one has to put the following reliability requirements in terms of maximum allowable probabilities of failure on demand on the safety systems:
− Safety system 2 (high-level closing valve) 0.0001 (per filling operation)
− Safety system 4 (high-pressure relief system) 0.0001.
Figure 5. Bayesian network to analyse the likelihood of tank failure due to overfilling. Numbers are probabilities (in %) conditional on a filling operation.
16 Risø-R-1504(EN)
Failure of the pressure regulator is based on a Safety Integrity Level (SIL) of the pressure regulator of class 3-4. This SIL corresponds to a failure rate of 10-8 per hour. Assuming an average velocity of 60 km/hour, the failure rate becomes 0.017 per 100 millions km.
2.3.3 Safety during maintenance As seen on Figure 2 the components in the tank system are more complicated as in a conventional car using petrol. Especially there are a number of moving components such as magnetic valves, the fill-level and a connected safety system. In a conventional car the fuel tank is not a part involved in regular maintenance like the motor and filters. The fuel tank is replaced when leaking and this does not happen for all cars in their lifetime in perhaps 15 years. In the ammonia system the maintenance of the car system is maintenance of the moving parts and the safety system. An assumption is that maintenance is required on average every 100 thousand kilometres, which correspond in average to about every 7th year. This corresponds to 1000 maintenance actions per 100 million km. An assumption is also that a release will happen (in a workshop) one time for every 1000 maintenance actions, which mean that there will be:
1 release of ammonia per 100 million km. due to maintenance
By comparing this with the likelihood of other failure possibilities, both for the vehicle, the tank transport and the refuelling station, it appears that this release frequency is the most likely – an factor 10 higher than the likelihood of a small puncture in a vehicle tank during a collision, and a factor 10000 higher than the likelihood of release from a road tanker. This means that the hazards during maintenance need to be taken seriously into account by means of:
− The demand for education of the maintenance staff in the workshops;
− Additional technical safety equipment in workshops
− The use of personal protection equipment (ppe) by maintenance staff
− Avoiding unauthorised maintenance on the ammonia fuel system.
2.3.4 Accident scenarios The final set of accident scenarios is listed in Annex D, together with the assessed probabilities based on the considerations and requirements described in the sections above.
2.4 Comparison with LPG driven vehicles Conventional LPG systems have been the basis for the design principles for the ammonia storage systems. Both fuels are pressure-liquefied under similar conditions. Therefore also the possible incidents and accidents are quite similar:
− Release of LPG following a vehicle accident. For conventional LPG systems with steel tanks, the failure of the tank in a fire is a realistic (and observed) scenario, see Figure 6;
− Overfilling of the tank. In this case, the likelihood of overfilling due to the non-redundant mechanical floater system is a factor 10 higher than in the ammonia system;
Risø-R-1504(EN) 17
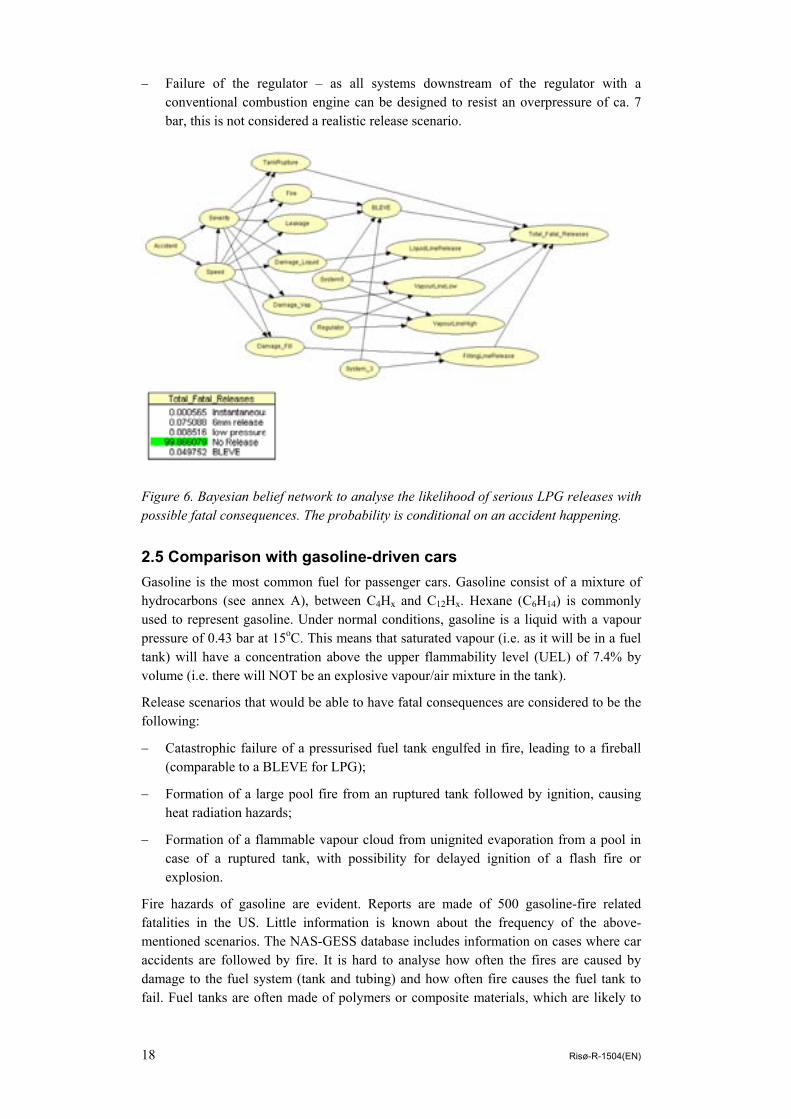
− Failure of the regulator – as all systems downstream of the regulator with a conventional combustion engine can be designed to resist an overpressure of ca. 7 bar, this is not considered a realistic release scenario.
Figure 6. Bayesian belief network to analyse the likelihood of serious LPG releases with possible fatal consequences. The probability is conditional on an accident happening.
2.5 Comparison with gasoline-driven cars Gasoline is the most common fuel for passenger cars. Gasoline consist of a mixture of hydrocarbons (see annex A), between C4Hx and C12Hx. Hexane (C6H14) is commonly used to represent gasoline. Under normal conditions, gasoline is a liquid with a vapour pressure of 0.43 bar at 15oC. This means that saturated vapour (i.e. as it will be in a fuel tank) will have a concentration above the upper flammability level (UEL) of 7.4% by volume (i.e. there will NOT be an explosive vapour/air mixture in the tank).
Release scenarios that would be able to have fatal consequences are considered to be the following:
− Catastrophic failure of a pressurised fuel tank engulfed in fire, leading to a fireball (comparable to a BLEVE for LPG);
− Formation of a large pool fire from an ruptured tank followed by ignition, causing heat radiation hazards;
− Formation of a flammable vapour cloud from unignited evaporation from a pool in case of a ruptured tank, with possibility for delayed ignition of a flash fire or explosion.
Fire hazards of gasoline are evident. Reports are made of 500 gasoline-fire related fatalities in the US. Little information is known about the frequency of the above-mentioned scenarios. The NAS-GESS database includes information on cases where car accidents are followed by fire. It is hard to analyse how often the fires are caused by damage to the fuel system (tank and tubing) and how often fire causes the fuel tank to fail. Fuel tanks are often made of polymers or composite materials, which are likely to
18 Risø-R-1504(EN)
fail at relatively low temperatures, thereby avoiding the possibility of high pressure built-up in the (intact) tank. But at 100oC, the vapour pressure of gasoline is 1.6 bar, and a rupture at this pressure would certainly generate a fast-burning fireball.
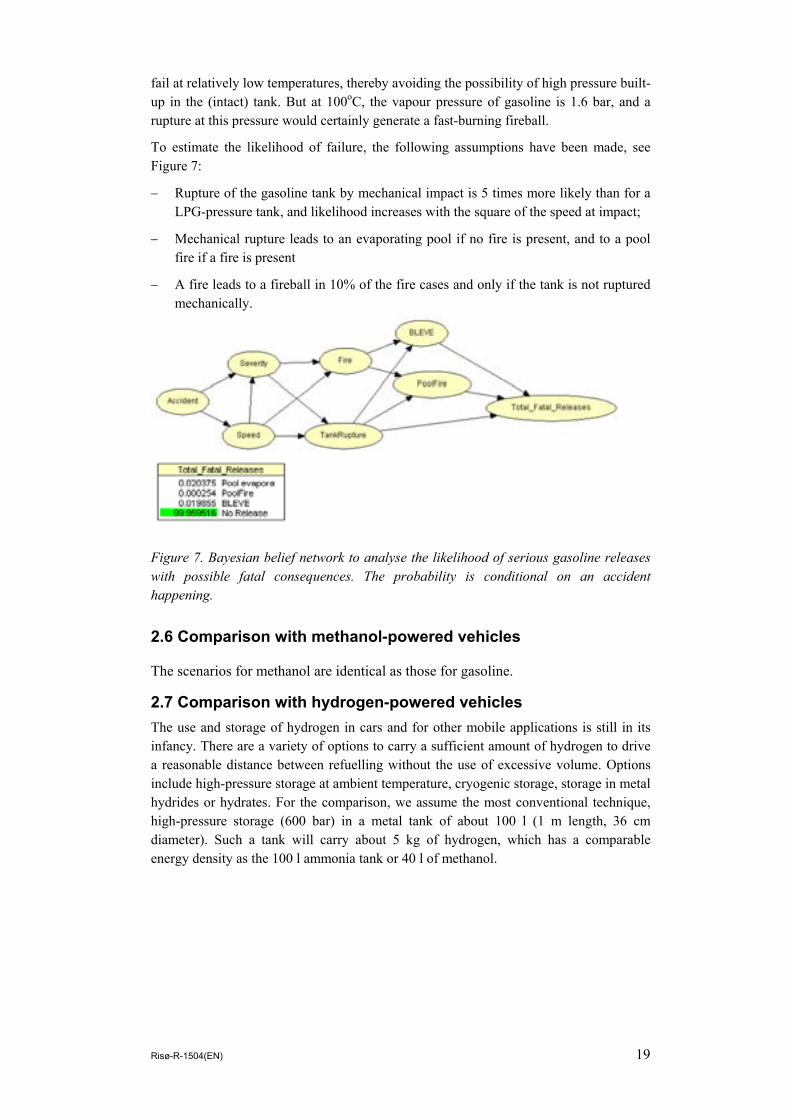
To estimate the likelihood of failure, the following assumptions have been made, see Figure 7:
− Rupture of the gasoline tank by mechanical impact is 5 times more likely than for a LPG-pressure tank, and likelihood increases with the square of the speed at impact;
− Mechanical rupture leads to an evaporating pool if no fire is present, and to a pool fire if a fire is present
− A fire leads to a fireball in 10% of the fire cases and only if the tank is not ruptured mechanically.
Figure 7. Bayesian belief network to analyse the likelihood of serious gasoline releases with possible fatal consequences. The probability is conditional on an accident happening.
2.6 Comparison with methanol-powered vehicles The scenarios for methanol are identical as those for gasoline.
2.7 Comparison with hydrogen-powered vehicles The use and storage of hydrogen in cars and for other mobile applications is still in its infancy. There are a variety of options to carry a sufficient amount of hydrogen to drive a reasonable distance between refuelling without the use of excessive volume. Options include high-pressure storage at ambient temperature, cryogenic storage, storage in metal hydrides or hydrates. For the comparison, we assume the most conventional technique, high-pressure storage (600 bar) in a metal tank of about 100 l (1 m length, 36 cm diameter). Such a tank will carry about 5 kg of hydrogen, which has a comparable energy density as the 100 l ammonia tank or 40 l of methanol.
Risø-R-1504(EN) 19

Safety System 1
Safe connection toFilling station
Safety System 4Pressure relief
Safety System 5Abort flow to regulatorin case of damage or
leakage
Pressure regulator
Safety System 3 Avoid backflow from
tank to filling line
Tank
To fuel cellMultivalve components
ID 3 mmID 6 mm
Figure 8 Possible configuration of a high-pressure hydrogen tank system
Assuming the tank is made of high-quality steel, the wall thickness of the tank is expected to be ca. 25 mm (this will give a material stress of about 420 N/mm2 – other materials, such as composites, can be used as well). It is extremely unlikely that such a massive tank (with a weight over 250 kg) will be damaged in any car crash. The only failure mechanism for the tank as such is a fire engulfment. With a heat transfer of about 100 kW/m2 it will take about 10-15 min to reach a temperature in the order of 1000 K, at which the material is likely to lose it strength. Overfilling can be easily avoided by controlling the fill pressure (maximum compressor pressure) at the filling stations, as there is no liquid that will expand with a temperature change. Therefore we recognize the following scenarios:
− Tank failure with fireball due to fire engulfment when all safety systems (including a pressure relief valve) fail in closed mode;
− Venting from the pressure relief valve in case of fire engulfment. A diameter of 0.8 mm will provide a mass flow that is sufficient to vent the gas during the heating of the tank in 10 min. The released gas will burn; the flame will be at a few cm length and not pose any additional hazard.
− Failure of the shut-off valve and failure of the regulator – as the systems downstream of the regulator (e.g. the fuel cell) will not be able to resist a pressure of 600 bar, such a failure would result in a high-pressure release, restricted by the diameter of the line from the tank to the regulator. This scenario will also occur when this line is punctured before the regulator, when the shut-off valve fails.
− Rupture of the filling line together with failure of the check valve that normally prevents backflow through the filling line. As the filling line is larger (e.g. ID 6 mm as in the ammonia case), this would result in a larger high-pressure release than a failure of the line to the fuel cell.
20 Risø-R-1504(EN)
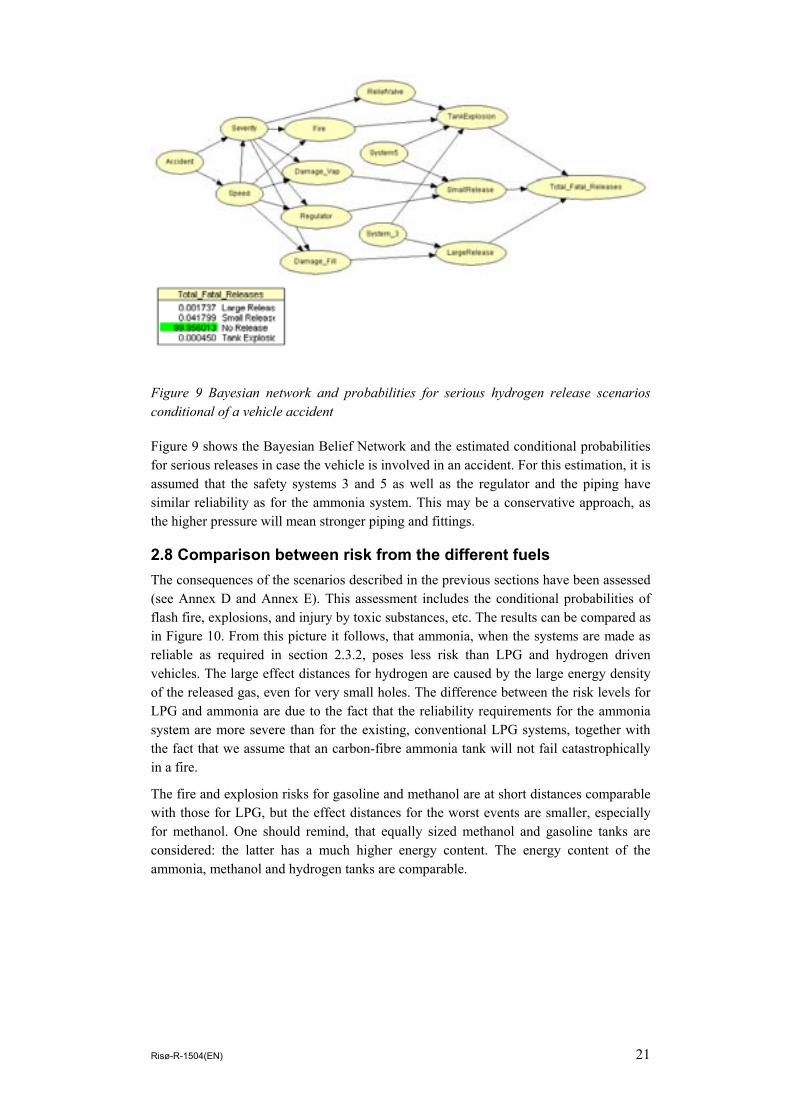
Figure 9 Bayesian network and probabilities for serious hydrogen release scenarios conditional of a vehicle accident
Figure 9 shows the Bayesian Belief Network and the estimated conditional probabilities for serious releases in case the vehicle is involved in an accident. For this estimation, it is assumed that the safety systems 3 and 5 as well as the regulator and the piping have similar reliability as for the ammonia system. This may be a conservative approach, as the higher pressure will mean stronger piping and fittings.
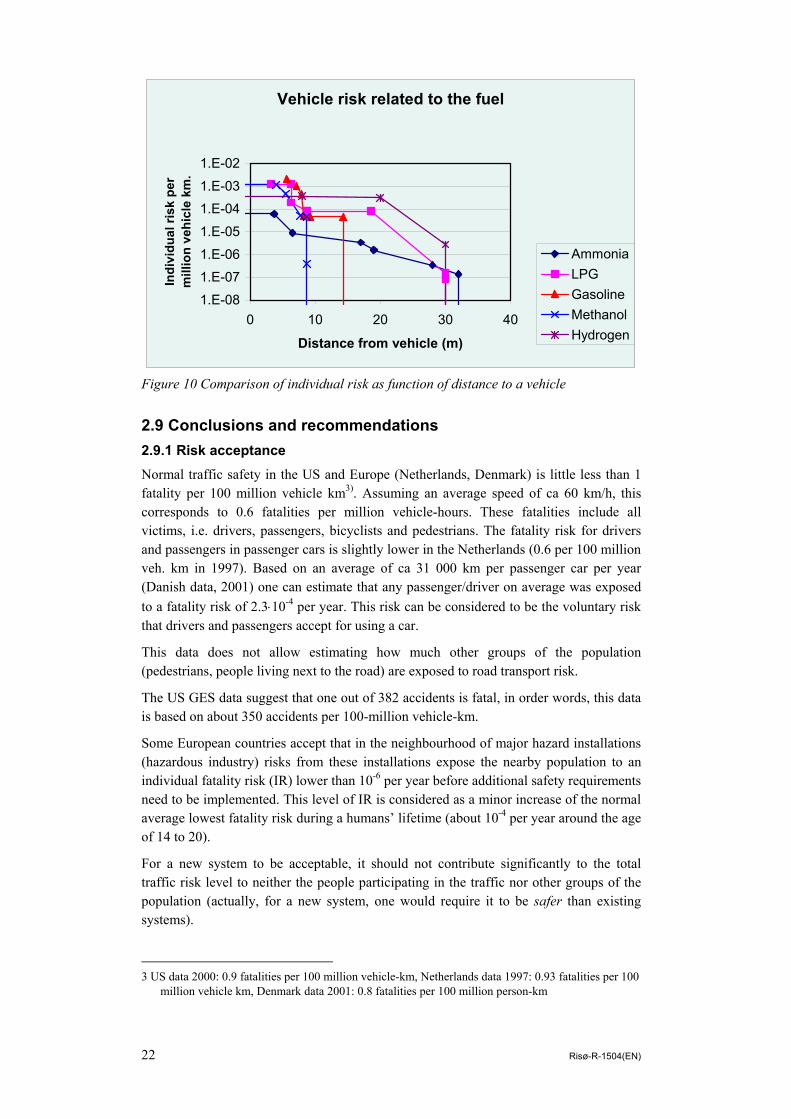
2.8 Comparison between risk from the different fuels The consequences of the scenarios described in the previous sections have been assessed (see Annex D and Annex E). This assessment includes the conditional probabilities of flash fire, explosions, and injury by toxic substances, etc. The results can be compared as in Figure 10. From this picture it follows, that ammonia, when the systems are made as reliable as required in section 2.3.2, poses less risk than LPG and hydrogen driven vehicles. The large effect distances for hydrogen are caused by the large energy density of the released gas, even for very small holes. The difference between the risk levels for LPG and ammonia are due to the fact that the reliability requirements for the ammonia system are more severe than for the existing, conventional LPG systems, together with the fact that we assume that an carbon-fibre ammonia tank will not fail catastrophically in a fire.
The fire and explosion risks for gasoline and methanol are at short distances comparable with those for LPG, but the effect distances for the worst events are smaller, especially for methanol. One should remind, that equally sized methanol and gasoline tanks are considered: the latter has a much higher energy content. The energy content of the ammonia, methanol and hydrogen tanks are comparable.
Risø-R-1504(EN) 21
Vehicle risk related to the fuel
1.E-08
1.E-07
1.E-06
1.E-05
1.E-04
1.E-03
1.E-02
0 10 20 30 40
Distance from vehicle (m)
Indi
vidu
al ri
sk p
erm
illio
n ve
hicl
e km
.
AmmoniaLPGGasolineMethanolHydrogen
Figure 10 Comparison of individual risk as function of distance to a vehicle
2.9 Conclusions and recommendations 2.9.1 Risk acceptance Normal traffic safety in the US and Europe (Netherlands, Denmark) is little less than 1 fatality per 100 million vehicle km3). Assuming an average speed of ca 60 km/h, this corresponds to 0.6 fatalities per million vehicle-hours. These fatalities include all victims, i.e. drivers, passengers, bicyclists and pedestrians. The fatality risk for drivers and passengers in passenger cars is slightly lower in the Netherlands (0.6 per 100 million veh. km in 1997). Based on an average of ca 31 000 km per passenger car per year (Danish data, 2001) one can estimate that any passenger/driver on average was exposed to a fatality risk of 2.3⋅10-4 per year. This risk can be considered to be the voluntary risk that drivers and passengers accept for using a car.
This data does not allow estimating how much other groups of the population (pedestrians, people living next to the road) are exposed to road transport risk.
The US GES data suggest that one out of 382 accidents is fatal, in order words, this data is based on about 350 accidents per 100-million vehicle-km.
Some European countries accept that in the neighbourhood of major hazard installations (hazardous industry) risks from these installations expose the nearby population to an individual fatality risk (IR) lower than 10-6 per year before additional safety requirements need to be implemented. This level of IR is considered as a minor increase of the normal average lowest fatality risk during a humans’ lifetime (about 10-4 per year around the age of 14 to 20).
For a new system to be acceptable, it should not contribute significantly to the total traffic risk level to neither the people participating in the traffic nor other groups of the population (actually, for a new system, one would require it to be safer than existing systems).
3 US data 2000: 0.9 fatalities per 100 million vehicle-km, Netherlands data 1997: 0.93 fatalities per 100
million vehicle km, Denmark data 2001: 0.8 fatalities per 100 million person-km
22 Risø-R-1504(EN)

For the acceptance of ammonia, an a priori requirement will be that fatality due to ammonia release from the passenger vehicles needs to be a factor of 1000 lower than the “normal” fatality rate per km. Such a requirement does not guarantee acceptance by the public, as the risk perception of being victim in a car accident or the being exposed to an ammonia release depends on many other factors than probability alone.
Probably a single event would rise considerable concern: with 100 % penetration of ammonia systems, the number above would correspond to ca. 1 ammonia related fatal event per year in countries like Netherlands or Denmark, which would be unacceptable.
Risø-R-1504(EN) 23

3 Safety assessment of ammonia distribution to fuelling stations
3.1 Risk assessment of conventional road transport of hazardous materials and transport fuels
3.1.1 Studies on hazardous road transport A number of previous studies on risks related to transport by road of hazardous materials including gasoline, LPG and ammonia have been performed. TNO performed an extensive study related to LPG in the Netherlands in the early eighties (TNO, 1983). This study used an empirical approach towards accident statistics and release probabilities, and using consequence models to predict individual risk along transport routes. Brockhof (Brockhof, 1992) investigated the contributions of different failure mechanisms during accidents with road tankers and applied an empirical approach for individual and societal risk levels. Accident data in this study is mainly Danish.
AVIV (AVIV, 1994) performed a study building further on the TNO LPG study, including data from other countries. The release distribution proposed by Brockhof’s study is included in the final risk model by AVIV.
The Danish Transport Council performed a study on hazardous goods transport (Rømer and others, 2000). This study is with respect to road transport mainly based on the work by Brockhof. The study summarises a German study called “THESEUS”. Differences in estimated releases between the work by Brockhof and THESEUS are suggested to be due to differences between German and Danish traffic conditions, incompleteness of reported data (overrepresentation of serious accidents in databases) and the German focus on accidents between trucks.
3.1.2 Accident statistics for heavy duty vehicles The risk models in the references mentioned in the previous section are all based on an analysis of hazardous goods release potential under the condition of an accident with a hazardous goods vehicle. In other words, the analyses derive conditional probabilities for a release once an accident has happened. For the total risk picture, the probability of such an accident needs to be included. However, how these accidents are defined is relevant. The accident probability is determined by accident statistics, and depends on how the accident data are collected – it can be expected that reporting of minor accidents is incomplete. AVIV has addressed this problem. The relevant accident data – which corresponds to the way Dutch accident data is collected – is based on “serious accidents”, i.e. accidents that lead to fatalities or hospitalisation of any of the involved parties. The study by Brockhof does not discuss this item. This means that results from different studies may need to be “corrected” for possible offset of the accident rates due to cut-off of small accidents before comparison. But for our purpose, where we want to compare different fuel transport options, this difference may be irrelevant as long as accident rates are similar for the different vehicles.
24 Risø-R-1504(EN)

Table 2 Truck accident rates according to three studies
Truck accident rate per 100 million vehicle km
Road/traffic type TNO LPG study4
AVIV study5 Brockhof’s study6
All roads 44 22 39
Motorways (100 to 120 km/h limit)
20 [1 - 200] 11
Motorways (100 km/h limit) 4.3
Rural (80 km/h limit) 50 [5 - 240] 47 30
Urban (50 km/h limit) 70 [17 – 480] 29 420
Table 3 Conditional probability of a "large" release (by AVIV and TNO defined as more than 100 kg) in case a road tanker with a thick-walled tank (pressure tank) is involved in an accident.
Conditional probability of a large release
Road/traffic type TNO LPG study7
AVIV study8 Brockhof’s study9
All roads 0.05
Motorways (100 to 120 km/h limit)
0.039
Motorways (100 km/h limit) 0.029
Rural (80 km/h limit) 0.026 0.020
Urban (50 km/h limit) 0.013 0.013
4 The TNO LPG study Dutch uses data for accidents (before 1982) with trucks without trailers and
tractors with and without trailers. The data covers accidents where persons in a vehicle involved in the accident are injured, i.e. accidents without injury, or accidents with injured pedestrians or (motor) cyclists are excluded.
5 The AVIV data is based on Dutch accident statistics 1990-1992 for heavy duty vehicles (trucks and tractors with and without trailers) and only includes accidents where persons in a vehicle involved in the accident are hospitalised or fatally injured. If the definition by the TNO LPG study is used, the average accident rate is 25 per 100 million vehicle km.
6 The accident rates by Brockhof are based on a collection of Danish accident descriptions (based on police reports) and road characteristics from 1982-1986. Accident rates relate to accidents involving trucks (not defined in detail). There is no information about the severity of the accidents. The accident rates are transformed into regression formulae for different road types, and accounting for truck percentage and traffic intensity. The final accident rates are calculated using information about the total length of the road types in Denmark.
7 Based on Dutch accident data before 1982
8 The AVIV data is a correction on the conditional probabilities by Brockhof to reproduce the Dutch observation of a frequency of 0.1 large release (>100 kg) per year from 1978 to 1992.
9 Conditional failure is derived from a deterministic model of the effect of collision energy, structural integrity of the tank, and statistical analysis of the type of impact in a large (Danish and US) collection of accident reports.
Risø-R-1504(EN) 25

In this study, a truck accident rate of 30 per 100 million km is used to represent the roads and conditions for fuel delivery to filling stations. Again, this being a comparative study, the absolute value of this truck accident rate is not critical to the final result.
3.2 Scenario analysis of transport of ammonia in a road tanker from the medium storage to the filling station
In this analysis the risk for a release of ammonia from a road tanker accident is assessed. The input for the analysis is:
• 15% of the cars will use Ammonia as fuel. • Capacity of the road tanker is 44 m3, which correspond 23.9 t of Ammonia. • Fill rate of the filling station is 50 t every 14th day. • Distance from decentralized storage to filling station is determined to be 50
km. • Car efficiency is 8kg/100km
The risk for a release from road tankers can be calculated using a model for a single refueling station.
50 km
Truck transport 50 t /14 days
Storage (medium scale)
Filling station
Ammonia used/year= 50*52/2= 1300 t/year.
1.3 mill kg. requires 1300/23,9 transports of 50 km of the road tanker = 2720 km
Data from a study in Denmark (Brockhof, 1992) gives for road tankers:
30 incidents pr. 100 million road-tanker km. and 2% will give a release. This results in
6.00*10-3 accidents pr. 1 mill km with release from road tankers.
For the single fuelling station scenario, a road tanker drives 2720 km. pr year/pr filling station, results in 1.65*10-5 accidents pr. year pr. filling station with release of ammonia from a road tanker.
3.3 Risk assessment of additional transport of ammonia The study by Brockhof (Brockhof, 1992) includes a fault tree analysis for tank cars transporting flammable and toxic hazardous goods by pressure vessels (used for LPG and anhydrous ammonia) and thin walled semitrailers (used for gasoline and methanol). The analysis covers the consequences of a road accident (collision or roll-over), not the consequences of spontaneous malfunctions, ruptures or human errors. The information
26 Risø-R-1504(EN)

from this fault tree analysis, including the numerical data, has been used in this study and applied to ammonia, LPG, gasoline and methanol. Brockhof’s analysis includes four failure mechanisms: Puncture of the tank, rupture of the tank due to impact, failure due to abrasion (thin-walled tanks only) and rupture due to fire. These mechanisms have been transferred into four failure modes: small puncture (5 mm diameter hole) large puncture (75 mm diameter hole, corresponding to a 3” hole as used in the LPG study10 (TNO, 1983), instantaneous release (complete rupture) and a fireball or BLEVE (not for ammonia), see Figure 11 for ammonia. Here the failure modes correspond to an instantaneous, large and small toxic vapour cloud, respectively. The distribution between instantaneous releases and large holes is according to (AVIV, 1994).
Figure 11 Bayesian belief network for failure of an ammonia tank car (truck with pressure vessel) in case of a road accident.
For LPG, the number of possible consequences is larger, depending on whether or not (delayed) ignition occurs, and whether the ignition causes a flash fire (without significant overpressure) or an (unconfined) vapour cloud explosion (VCE), see Figure 12. The data on probability of direct and delayed ignition is an estimation based on the information from (TNO, 1983) and (AVIV, 1994). The likelihood between VCE and flash fire is taken from (Committee for the Prevention of Disasters, 1999).
10 The AVIV study on hazardous transport by road considers a 3” hole as pessimistic and proposed to
use a 2” hole size
Risø-R-1504(EN) 27

Figure 12 Bayesian belief network for failure of a LPG tank car (truck with pressure vessel) in case of a road accident
In case of a thin-walled tank car, abrasion is a possible failure mechanism; this is included in Figure 13. In case of thin-walled vessels, the likelihood of puncture and tank rupture is larger, but the likelihood of ignition is (slightly) lower.
Figure 13 Bayesian belief network for failure of a thin-walled semitrailer for transportation of gasoline of methanol in case of a road accident
28 Risø-R-1504(EN)

3.4 Comparison of risk of transportation of different fuels In Annex E the consequence calculations are included corresponding to the Loss of Containment events as introduced in the previous section. The risk (expressed as Individual Risk depending on distance from a tanker) for ammonia tank trailers is shown in Figure 14. The Figure shows the risk connected to the conventional transportation by trailers with a single pressurised 45 m3 tank. Failure of such a tank leads to fatal consequences up to a distance of 800 m.
Comparison of ammonia transport options
1.E-05
1.E-04
1.E-03
1.E-02
0 200 400 600 800 1000
Distance from road tanker (m)
Indi
vidu
al ri
sk p
er m
illio
n ta
nker
km
.
Pressurised Conventional 45m3 tank
Pressurised Partitioned (4)Conventional Construction
Pressurised Partitioned (4)Improved Strength
Cryogenic, Partitioned (4),Improved Strength
Figure 14 Individual risk of different technological solutions for the transportation of ammonia by road tankers.
3.4.1 Consideration of additional requirements and specifications for ammonia transport by road tankers One of the options for decreasing the potential of releases of ammonia is to divide a single pressure tank into smaller ones. The likelihood of several tanks failing in the same accident will be considerably smaller than the likelihood of failure of only one of the tanks, that absorbs the energy from the collision impact. However, the failure models as described in (Brockhof, 1992) are based on the assumption, that the contents of the tank absorbs the collision energy. As a consequence, smaller tanks require less energy to rupture, provided the construction is similar. This is demonstrated in Table 4. Note that for a conventional large tank, the collision with a passenger car (assumed mass 1000 kg) is not likely to damage the tank, while this may happen for the small pressure tanks.
The resulting Individual Risk as function of distance to the road tanker is shown in Figure 14 (“partitioned, conventional construction”). One of the solutions is to improve the resistance to impact of the tanks by some energy absorbing construction to a level comparable to the resistance of the original large tank (Partitioned, improved strength”)
Risø-R-1504(EN) 29

Table 4 Conditional probabilities of tank damage for single or multiple pressure tanks on a road tanker, in case of a collision. The numbers for a 12 m tank correspond to the numbers used by Brockhof (cf. Table 3), the numbers for a 3 m tank (i.e. 4 tanks on a tanker instead of a single tank) are derived considering the differences in energy needed to rupture a tank.
Likelihood of tank damage at a road with a speed limit of 80 km/h
12 m long pressure tank 3 m long pressure tank Collision: head-on end-on side-on head-on end-on side-on Tanker-truck 12% 8.9% 23.8% 19.7% 30.2% 44.7% 40.7% Tanker-van 8% 0.0% 0.9% 0.7% 6.1% 23.8% 17.6% Tanker-car 81% 0.0% 0.0% 0.0% 0.1% 2.3% 2.4% All collisions: 1.1% 2.9% 2.4% 4.1% 9.0% 8.1%
Still, the distances where fatal consequences can occur are considerable, as compared to the transport of LPG (see below). Therefore another option is to transport ammonia in cryogenic form, i.e. at a temperature around the boiling point of ammonia, but still in strong separated pressure tanks. As the flash fraction during catastrophic failure of one such tank is negligible for cryogenic ammonia, and evaporation of ammonia is a slow process, the amount of ammonia in the air is much lower, and the effect distances are accordingly shorter (see Figure 14, “Cryogenic, Partitioned, Improved Strength”).
3.4.2 Individual Risk along the transport route and comparison Figure 14 shows Individual Risk as a function of distance to the road tanker, but a better way is to show the Individual Risk as function of distance to the road, see Figure 15. This Figure also shows the risk of transporting comparable amounts of gasoline or LPG; these amounts are made comparable with respect to the amount finally used by the cars (i.e. corrected for the “tank to wheel” efficiency of ammonia, LPG and gasoline). The road is a single route to a refueling station, using the scenario as described in section 3.2. (If a road is part of routes to several refueling stations, the risks have to be multiplied by the number of refueling station serviced by the road). From this Figure we can draw the following conclusions:
1. Generally accepted risk criteria of Individual Risk of 10-6 per year are not exceeded along the route to a single refueling station by any of the fuel modalities using conventional technology
2. Risk due to conventional transport technologies for ammonia extend to much larger distances than for conventional transport of LPG and gasoline
3. The risk due to cryogenic transport of ammonia in advanced partitioned pressure containers is equal, if not lower, than for LPG, and comparable to transport of gasoline.
30 Risø-R-1504(EN)

Transport risk - route from intermediate storage to refuelling station
1.E-10
1.E-09
1.E-08
1.E-07
1.E-06
0 200 400 600 800 1000
Distance from road (m)
Indi
vidu
al ri
skAmmonia(Conventional)Ammonia (PartionedImproved)Ammonia (CryogenicPartioned)LPG
Gasoline
Figure 15 Risk due to transportation of fuel along the transportation route
Risø-R-1504(EN) 31

32 Risø-R-1504(EN)
4 Safety assessment of ammonia refuelling stations
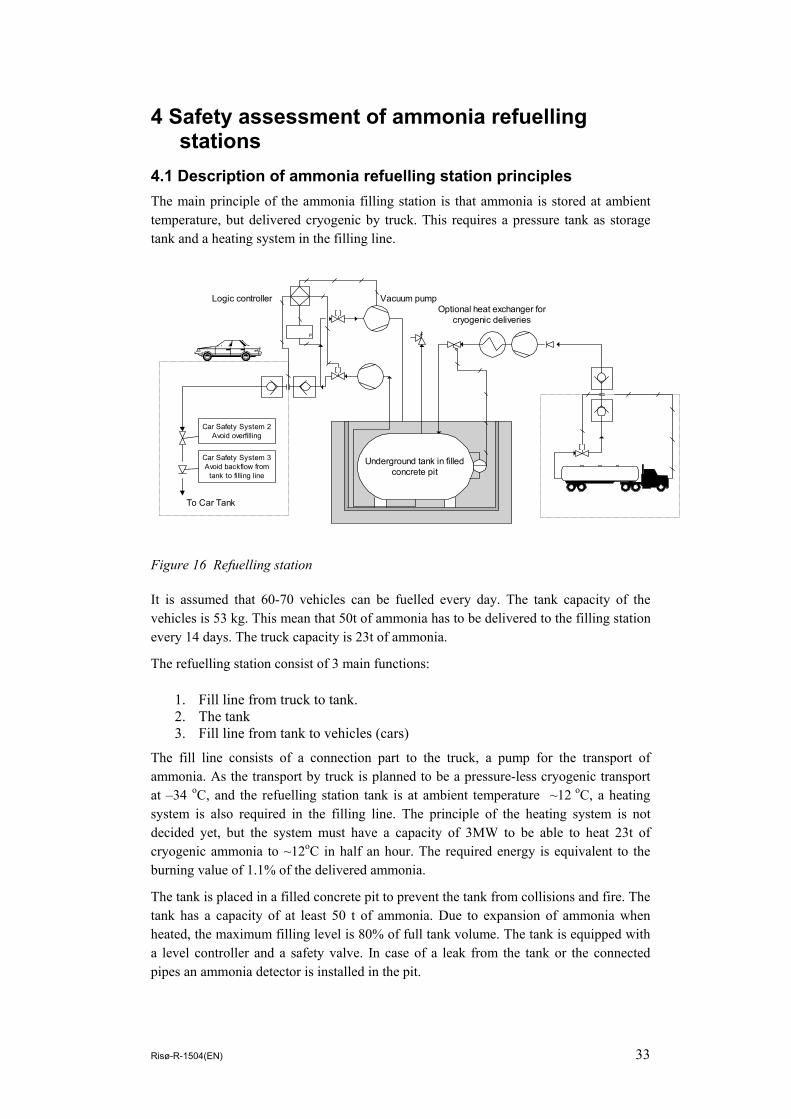
4.1 Description of ammonia refuelling station principles The main principle of the ammonia filling station is that ammonia is stored at ambient temperature, but delivered cryogenic by truck. This requires a pressure tank as storage tank and a heating system in the filling line.
Car Safety System 3Avoid backflow from
tank to filling line
Car Safety System 2Avoid overfilling
To Car Tank
Underground tank in filledconcrete pit
P
Vacuum pumpLogic controllerOptional heat exchanger for
cryogenic deliveries
Figure 16 Refuelling station
It is assumed that 60-70 vehicles can be fuelled every day. The tank capacity of the vehicles is 53 kg. This mean that 50t of ammonia has to be delivered to the filling station every 14 days. The truck capacity is 23t of ammonia.
The refuelling station consist of 3 main functions:
1. Fill line from truck to tank. 2. The tank 3. Fill line from tank to vehicles (cars)
The fill line consists of a connection part to the truck, a pump for the transport of ammonia. As the transport by truck is planned to be a pressure-less cryogenic transport at –34 oC, and the refuelling station tank is at ambient temperature ~12 oC, a heating system is also required in the filling line. The principle of the heating system is not decided yet, but the system must have a capacity of 3MW to be able to heat 23t of cryogenic ammonia to ~12oC in half an hour. The required energy is equivalent to the burning value of 1.1% of the delivered ammonia.
The tank is placed in a filled concrete pit to prevent the tank from collisions and fire. The tank has a capacity of at least 50 t of ammonia. Due to expansion of ammonia when heated, the maximum filling level is 80% of full tank volume. The tank is equipped with a level controller and a safety valve. In case of a leak from the tank or the connected pipes an ammonia detector is installed in the pit.
Risø-R-1504(EN) 33

The fill line to the vehicles consists of 2 systems: one for filling the vehicles and one for emptying the line after the filling, to prevent release of ammonia when disconnecting the line.
4.2 Failure and hazard analysis of the ammonia refuelling station A HAZOP analysis has been performed on the ammonia refueling station. The main problem addressed is release of NH3
The HAZOP analysis was performed on the basis of the PI- diagram Figure 16 of the refueling station. The aim of the analysis was to optimize the design due to prevention of unwanted events and in case this is not possible how to mitigate the consequences of these events. The amount of ammonia in the systems in question: Truck 25 t Refuelling station 50 t Car 0.05 t
The results from the HAZOP are the following:
1. Fill line to tank
In case of damage of the fill line system check valves must be installed to prevent larger amount of NH3 release.
To prevent the truck to leave the filling system with the hose still connected an interlock system is proposed to be installed e.g. the car key is used in the filling system.
As the transport by truck is planned to be a pressure-less cryogenic transport at –34 oC, and the refuelling station tank is at ambient temperature ~12 oC, a heating system is required in the filling line. To heat 25 t of NH3 from –34 oC to 12 oC in half an hour require a heating system on 3 MW. The heating system is not designed yet, but the energy demand is ~1,1 % of the heated NH3, if NH3 is used as energy source. The amount of NH3 in the heating system is not known, while it depends on the system. A separate analysis must be performed on the heating system. A heating system on 3 MW is not a small system and must be expected to contain a certain amount of NH3
2. Tank
To prevent damage of the tank by collision or fire, the tank is proposed to be underground in a filled concrete pit.
Damage of the tank can also happen by overfilling and heating. To prevent overfilling a level controller must be installed which close the filling line at a certain level in the tank. The worst-case scenario for overfilling is by a failure in the heating system with the consequence that NH3 at –34 oC is filled into the tank. Assumed that the maximum filling level is 80% and the amount of NH3 at this level is 50t at 12 oC. The volume of 50t of NH3 is 80.5 m3. This means that the total tank volume is ~100 m3. If the tank is filled 80% with NH3 at –34 oC the amount of NH3 at 80% level is 55t. The 55 t of NH3 will be heated to ambient temperature 12 oC and the volume will increase to 88.5 m3, which is ~88% of a full tank. To exceed the volume of the full tank it requires a temperature on 62 oC. and this is not seen as a possible event.
Overfilling can also happen in case the level controller fails and the tank will be pressurized to the max pressure of the filling pump. The design of the tank must ensure
34 Risø-R-1504(EN)
that the maximum allowable pressure in the tank is above the maximum pressure of the pump. A safety valve is installed on top of the tank.
3. Fill line to car
In case of damage of this fill line, check valves must be installed to prevent larger amount of NH3 release. As for the truck connection an interlock must be installed to prevent the car to leave the refuelling station with the hose still connected.
4. Vacuum system
A vacuum system is installed to empty the hoses and prevent a release of NH3 when disconnecting the hose from the car. A pressure control system is installed to ensure that disconnection can only be performed at a certain low pressure.
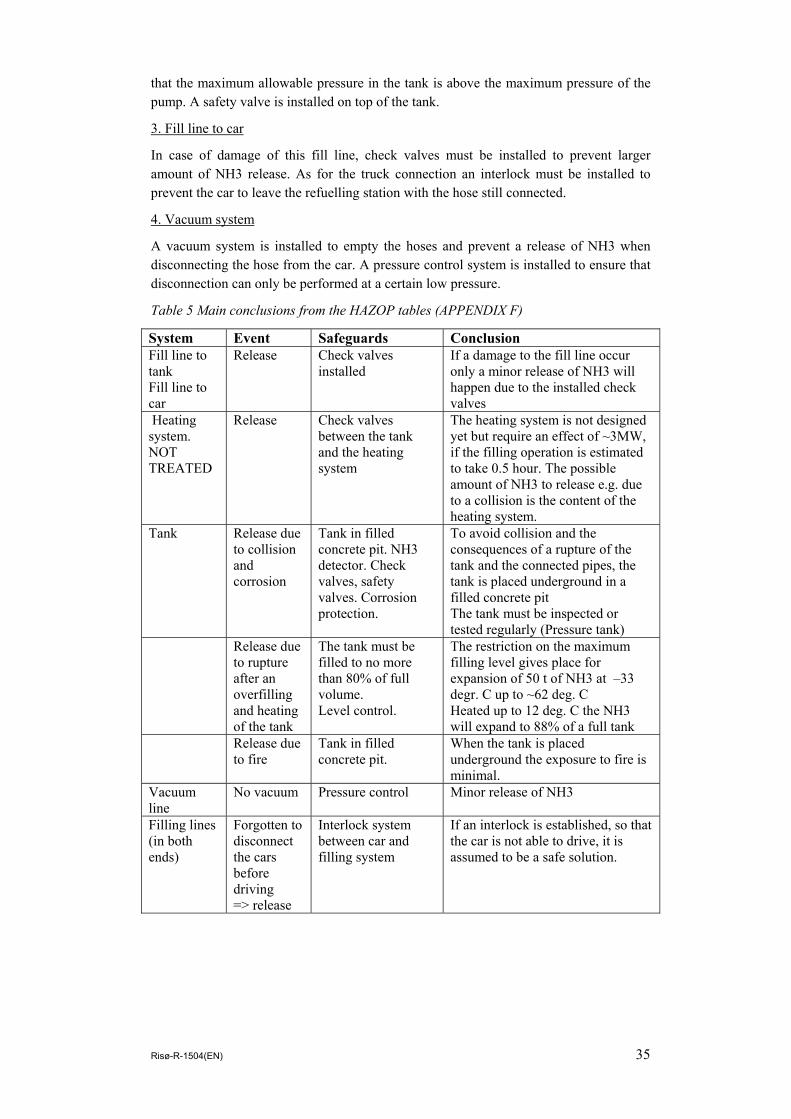
Table 5 Main conclusions from the HAZOP tables (APPENDIX F)
System Event Safeguards Conclusion Fill line to tank Fill line to car
Release Check valves installed
If a damage to the fill line occur only a minor release of NH3 will happen due to the installed check valves
Heating system. NOT TREATED
Release Check valves between the tank and the heating system
The heating system is not designed yet but require an effect of ~3MW, if the filling operation is estimated to take 0.5 hour. The possible amount of NH3 to release e.g. due to a collision is the content of the heating system.
Tank Release due to collision and corrosion
Tank in filled concrete pit. NH3 detector. Check valves, safety valves. Corrosion protection.
To avoid collision and the consequences of a rupture of the tank and the connected pipes, the tank is placed underground in a filled concrete pit The tank must be inspected or tested regularly (Pressure tank)
Release due to rupture after an overfilling and heating of the tank
The tank must be filled to no more than 80% of full volume. Level control.
The restriction on the maximum filling level gives place for expansion of 50 t of NH3 at –33 degr. C up to ~62 deg. C Heated up to 12 deg. C the NH3 will expand to 88% of a full tank
Release due to fire
Tank in filled concrete pit.
When the tank is placed underground the exposure to fire is minimal.
Vacuum line
No vacuum Pressure control Minor release of NH3
Filling lines (in both ends)
Forgotten to disconnect the cars before driving => release
Interlock system between car and filling system
If an interlock is established, so that the car is not able to drive, it is assumed to be a safe solution.
Risø-R-1504(EN) 35

4.3 Findings from consequence assessment The delivery of ammonia or LPG takes place at existing refuelling stations where the main delivery exists of gasoline. It is assumed that the physical lay-out of the refuelling station is such, that the delivery of gasoline, an any fire hazards resulting from that, does not interfere with the delivery of ammonia (or LPG) by tank car to the refuelling station. Annex D contains an analysis of the expected frequencies of a variety of possible release scenarios. For ammonia, these scenarios are:
• Rupture of the road tanker tank
• Rupture of the (underground) storage tank
• Release through a large, 50 mm hole (rupture of the unloading arm or hose between the road tanker and the refuelling station)
• Release through a 13 mm diameter hole (rupture of the delivery hose from the refuelling station to the car)
• Release through a 5 mm puncture (leak of pipe or hose)
The consequences of these scenarios (see annex E) are very similar to the scenarios for the road tanker transport – differences are due to the different hole sizes, in combination with the fact that the duration of the larger releases can be longer (assuming one fails to interrupt the flow through the rupture from the storage tank at the refuelling station). Fatal distances can reach up to 470 m in case of instantaneous failure of a pressure tank (conventional transport) which can be reduced to little more than 200 m by applying (semi) refrigerated transport in separated tanks – in that case, release from the heating system through a rupture in the 50 mm piping or hose is more serious, with a fatality distance of 475 m.
4.4 Fuelling station safety functions and reliability allocation For all ruptures and leaks in hoses and pipelines (including the hoses for delivery to the car), the expected failure frequencies as presented in Annex D assume that a blocking system with a Probability of Failure of Demand of 0.01 (essentially a SIL 2 system) blocks off the failed hose or the section of the failed pipe before a major release occurs. It appears that the release of ammonia from relatively small leaks (e.g. 5 mm leaks in the delivery hose) can cause considerable fatality distances (up to 150 m) if not immediate action is taken (fatality increases when the exposure duration increases).
It is therefore recommended that rupture of the 50 mm hose (the road tanker unloading facility) as well as the 13 mm hose (the delivery hose for the passenger cars) are protected by another, independent system of SIL 2 (PFD 0.01). This system could react on unbalance in flow and/or pressure drop in the system. Risks for this option will be denoted “extra safeguards”.
In case refrigerated ammonia is unloaded from the road tanker, the refuelling station needs an evaporation unit. Introducing a new piece of equipment increases the possibility of failure. We assume that the design is such, that releases can not be larger than for the hoses (i.e. the pipe diameters are not larger than the assumed 50 mm for the unloading
36 Risø-R-1504(EN)

hose. The hoses are still the most likely points of failure (as compared to fixed piping), and the increased likelihood of failure from the evaporator is neglected in this study.
4.5 Comparison with fuelling stations for other fuels (LPG and gasoline)
The combination of consequences and expected failure frequencies (Annex E and Annex D, respectively) are presented in the form of a risk-distance graph (see Figure 17. The comparison is based on the handling of fuel with equivalent energy contents (“tank –to-wheel” comparison). As described above, the small ammonia releases have comparatively large fatality distances. Using “conventional” delivery and handling of ammonia (this includes blocking systems for ruptures and leakages, but these are common for all fuels in this comparison), a safety distance to and individual risk level of 10-6 per year would be more than 150 m. By using extra safeguards, this distance can be reduced to some 70 to 120 m, but this still considerably larger than for gasoline and LPG (some 30 to 40 m, respectively). As shown in Figure 17, there is relatively little difference between LPG and ammonia in the largest effect distances, especially the effects of catastrophic releases due to complete storage tank failure.
By using refrigerated ammonia to be delivered by the road tankers, the consequences of the larger events are diminished to distances less than for LPG, but this is at negligible risk levels.
Refuelling station
1.E-111.E-101.E-091.E-081.E-071.E-061.E-051.E-041.E-03
1 10 100 1000
Distance from refuelling station (m)
Indi
vidu
al ri
sk p
er y
ear
Ammonia(conventional)LPG
Gasoline
Ammonia (extrasafeguards)Ammonia(refrigerated)
Figure 17 Individual risk as distance from a refuelling station for fuelling of equal energy amounts of ammonia, LPG and gasoline. The options "ammonia (extra safeguards)" and "ammonia (refrigerated)" include both the extra safeguards to mitigate hose ruptures.
4.6 Conclusions and recommendations Ammonia refuelling stations will require a safety distance to residential areas, or areas otherwise frequented by the general public, which are considerably larger than those needed for LPG or normal gasoline stations, from 120 up to 400 m depending on the
Risø-R-1504(EN) 37

number of redundant safeguards installed, if an individual risk criterion of 10-6 per year is applied. For LPG, comparable distances would be 40 to 80 m.
The storage tank need to be located underground as to avoid any possible impact (physical or from fires). The likelihood of catastrophic failure of such a tank is reduced considerably as compared to above ground tanks, according to current practice for LPG tanks. For environmental reasons (avoiding leakages to the soil), the tank needs to be isolated from the ground, e.g. by using a (sand-filled) concrete pit.
The unloading, storage, and delivery systems need to be protected with additional, independent reliable safeguards that shut off the flow to any damaged section as compared to the conventional protection systems for LPG refuelling stations.
The use of refrigerated ammonia by the road tankers has relatively little effect on reducing the risk level around the refuelling station. It reduces the consequences of the worst possible accident (instantaneous failure of the road tanker at the refuelling station), but this has no significant contribution the risk level around the refuelling station.
38 Risø-R-1504(EN)
5 Conclusions This study addressed the safety aspects of the use of ammonia as a fuel in ordinary road vehicles. Three aspects have been considered explicitly:
• Risks of ammonia in the (passenger) cars;
• Risks of increased transport of ammonia by road tankers to the refuelling stations; and
• Risks of handling (unloading, storing and delivering) ammonia at refuelling stations.
There are also risks in the production and at storage facilities, but these risks are very local, partly confined to existing hazardous (production) facilities, and in any case very local, and therefore these aspects need to be considered (and can be solved) as a part of local land-use planning. These aspects are not considered to be prohibitive for the extended use of ammonia as a transport fuel.
With respect to the risks at the level of individual vehicles, it is necessary to implement advanced fuel tanks and safety systems, which are beyond the current practice (as compared to LPG (Liquid Petroleum Gas)-driven vehicles). When these safety systems are implemented, the risks of using ammonia is similar, if not lower than for the other fuels (the maximum fatality distances is marginally larger than for LPG, but the risks for lesser releases is lower). It should be noted that a first assessment of a system based on pressurised hydrogen shows a risk slightly larger than for LPG.
Special attention is required to ensure safe maintenance on ammonia-powered vehicles. A first estimate suggests, that the likelihood of releases of ammonia during the life cycle of the vehicle (calculated per km) is largest during maintenance: this probability is estimated to be ten times higher than any other releases for the vehicle.
With respect to transport of ammonia by conventional road tankers, large releases show large consequence distances (more than 600 m) as compared to the transport of LPG and gasoline. Though, conventional transport in the quantities assumed in this study (a penetration of 15%), will not cause risk levels along the transport routes to exceed individual risk levels of 10-6 per year. Nevertheless, risk-reducing options are strongly needed.
A solution that causes the risk levels to drop below the risks for LPG requires that ammonia be transported in refrigerated form (i.e. the temperature of the ammonia is very close to its boiling point), in road tankers carrying typically four separated (pressure) tanks of about 11 m3 each, which are as resilient against impact and abrasion as conventional (large) pressure tanks. The heat required to evaporate the ammonia at the refuelling stations corresponds to about 1% of the energy content.
With respect to handling of ammonia at refuelling stations, it appears, that small, but long-lasting releases of ammonia due to e.g. leaks and ruptures of hoses, cause serious dangers at distances up to 150 m distance, which are considerably longer than the comparable distances for gasoline or LPG (where similar distances are about 40 m). This requires additional technical safeguards to reduce the likelihood of these releases (It is especially important to stop the release as soon as possible to interrupt exposure). But
Risø-R-1504(EN) 39

also in case these safeguards are in place, safety distances around these ammonia-refuelling stations should be no less than 70 m
An overall conclusion is that the hazards in relation to ammonia need to be (and probably can be) controlled by a combination of technical and regulatory options. The most important additional requirements are:
• Advanced safety systems in the vehicle
• Additional technical measures and regulations are required to avoid releases in maintenance workshop and unauthorised maintenance on the fuel system.
• Road transport in refrigerated form
• Sufficient safety zones between refuelling stations and residential or otherwise public areas.
When these measures are applied, the use of ammonia as a transport fuel would be no more dangerous than currently used fuels (using current practice).
It should be emphasised, that this study does not exclude any accidents where the release of ammonia from a car will kill a driver, passenger or other individuals, but is expected that this will happen no more often, than that people are killed by burning gasoline or LPG. The acceptance of ammonia will not be based on the results of numerical risk analysis, but will also be influenced by the public’s perception of the threats of ammonia, and people tend to be more horrified by toxic substances than by fires. This public perception cannot and should not be ignored or dismissed.
5.1 Uncertainty It has been attempted to use best available data for the estimates of failure frequencies and consequence assessment. But due to the need to use assumptions in case of lack of data and experience, the absolute level of the risk estimates (e.g. safety distances) contains a significant uncertainty. With respect to the comparative studies, the relative ranking is considered to be much more reliable, as assumptions are used consistently for the analysis of the different fuel systems. But mainly due to the different nature of the substances and their impact, some uncertainty remains here as well. The uncertainty in the comparative studies between LPG and gasoline on one hand and ammonia on the other relates to modelling impact and likelihood of fire and explosion compared to toxic impact, and the modelling of dense and buoyant vapour dispersion from evaporating pools for LPG/gasoline and ammonia, respectively.
40 Risø-R-1504(EN)

6 References
AVIV, 1994, Fundamenteel onderzoek naar kanscijfers voor risicoberekeningen bij wegtransport gevaarlijke stoffen (Basic research into probabilities for risk calculations for roudtransport of dangerous substances, in Dutch), Enschede, Netherlands.
Brockhof, L. H., 1992, A Risk Management Model for Transport of Dangerous Goods - Main Report, Vol. EUR 14675 EN, Commission of the European Communities, Joint Research Centre, Inst. for Systems Eng. and Informatics.
Committee for the Prevention of Disasters, 1999, Guidelines for quantitative risk assessment ("Purple Book"), Vol. CPR 18E, Sdu Uitgevers, The Hague, Netherlands.
European Council, 14-1-1997, Council Directive 96/82/EC of 9 December 1996 on the control of major-accident hazards involving dangerous substances, Official J.Eur.Commun, Vol. L 10, pp. 13-33.
National Highway Traffic Safety Administration, 2001, National Automotive Sampling System (NASS), General Estimates System (GES), Analytical User's Manual 1988-2001, U. S. Department of Transportation, National Highway Traffic Safety Administration, National Center for Statistics and Analysis, Washington, D.C. 20590.
Rømer, H. G, Styhr Petersen, H. J, Jørgensen, N. O, and Brockhof, L. H., 2000, Risikomodeller for transport af farligt gods i Danmark (Riskmodels for transport of dangerous goods in Denmark, in Danish), Vol. Notat nr. 00.02, Transportrådet, Copenhagen.
TNO, 1983, LPG, A Study, A comparative analysis of the risks inherent in the storage, transshipment, transport and use of LPG and motor spirit, 10 Main Report LPG, TNO, Apeldoorn, Netherlands.
Risø-R-1504(EN) 41

Annex A – Comparison of Ammonia with other transport fuels
42 Risø-R-1504(EN)

1 General information
1.1 The NFPA no. 704 index – a system of hazard identification In the following the NFPA index (Anon, 1976) is described and indices are given for the relevant substances for this study. The index is intended for emer-gency personal in particular fire fighters to be prepared to handle fires and emergencies at fixed installations, e.g. at chemical processing equipment, stor-age and warehousing rooms and laboratories. The index informs a fire fighter about the precautions to take to protect himself from injury while fighting a fire in the area. Each hazard is rated from 0 to 4 (Anon, 1976), page 3-131). The rating system gives a rough overview on possible hazards, but is not meant to be very adequate. In general meanings the rating inform a fire-fighter on how to approach in different situations according to the highest rating found. This is: 4 “too dangerous to approach with standard fire-fighting equipment and
procedures. Withdraw and obtain expert advice on how to handle”; 3 “Fire can be fought using methods intended for extremely hazardous
situations, such as unmanned monitors or personal protective equipment which prevents all bodily contact”;
2 “Can be fought with standard procedures, but hazards are present which require certain equipment or procedures to handle safely”;
1 “Nuisance hazards present which require some care, but standard fire-fighting procedures can be used”;
0 “ No special hazards which require special measures” Ratings are given for three types of hazards and occasionally supplemented by some special symbols e.g. when the use of fire fighting water may be danger-ous. The three categories are: Health (Anon, 1976)- single exposure is evaluated varying from few seconds up to an hour. In emergency situations the rescue personal (fire fighters) are exposed to demanding physical exertion. This may be expected to intensify the health ef-fects, but special local conditions need to be considered as well. The rating is considering this and based on normal protective equipment used by the fire fighters. 4: Materials too dangerous to health to expose fire fighters. A few whiffs of
vapour could cause death, or the vapour or liquid could be fatal on pene-trating the fire fighter’s normal protective clothing. Protective clothing and breathing apparatus available to average fire department will not pro-vide adequate protection against inhalation or skin contact with these ma-terials.
3: Materials extremely hazardous to health but areas may be entered with extreme care. Full protective clothing, self-contained breathing apparatus, rubber gloves, boots, and bands around legs, arms and waist should be provided. No skin surface should be exposed.

2: Materials hazardous to health but areas may be entered freely with self-contained breathing apparatus.
1: Materials only slightly hazardous to health. 0: Materials which on exposure under fire conditions would offer no health
hazards beyond of ordinary combustible material. Flammability (Anon, 1976) – The basis for the ranking for this hazard is the susceptibility to burning of the materials which has an influence on the method on how to attack-ing the fire: 4: Very flammable gases or very volatile flammable liquids. If possible,
shut off flow and keep cooling water streams on exposed tanks of con-tainers. Withdrawal may be necessary.
3: Materials which can be ignited under almost all normal temperature con-ditions. Water may be ineffective because of the low flash point of the materials.
2: Materials which must be moderately heated before ignition will occur. Water spray may be used to extinguish the fire because the material can be cooled below its flash point.
1: Materials that must be preheated before ignition can occur. Water may cause frothing if it gets below the surface of the liquid and turns to steam. However, water fog gently applied to the surface will cause frothing which will extinguish the fire.
0: Materials that will not burn. Reactivity (Stability) hazards (Anon, 1976) - The ranking within the reactivity hazards is based on the sus-ceptibility of materials to release energy either by themselves or in combination with other materials. Hereunder it is considered fire exposure along with condi-tions of shock and pressure. 4: Material that is so susceptible to detonation that it is too dangerous for
fire fighters to approach the fire. Vacate the area. 3: Materials, which when heated and under confinement are capable of
detonation. These materials are too dangerous to fight with hand lines, but may be kept from detonating if unmanned portable monitors or hose holders can be set up from behind explosion-resistant locations.
2: Materials, which will undergo a violent chemical change at elevated tem-peratures and pressures. Use portable monitors, hose holders or straight hose streams from a distance to cool the tanks and the material in them. Use caution.
1: Materials, which are normally stable but may become unstable in combi-nation with other materials or at elevated temperatures and pressures. Normal precautions in approaching any fire should suffice.
0: Materials, which are normally stable and, therefore, do not produce any reactivity hazard to firemen.
Risø-R-1504(EN) Annex A 3
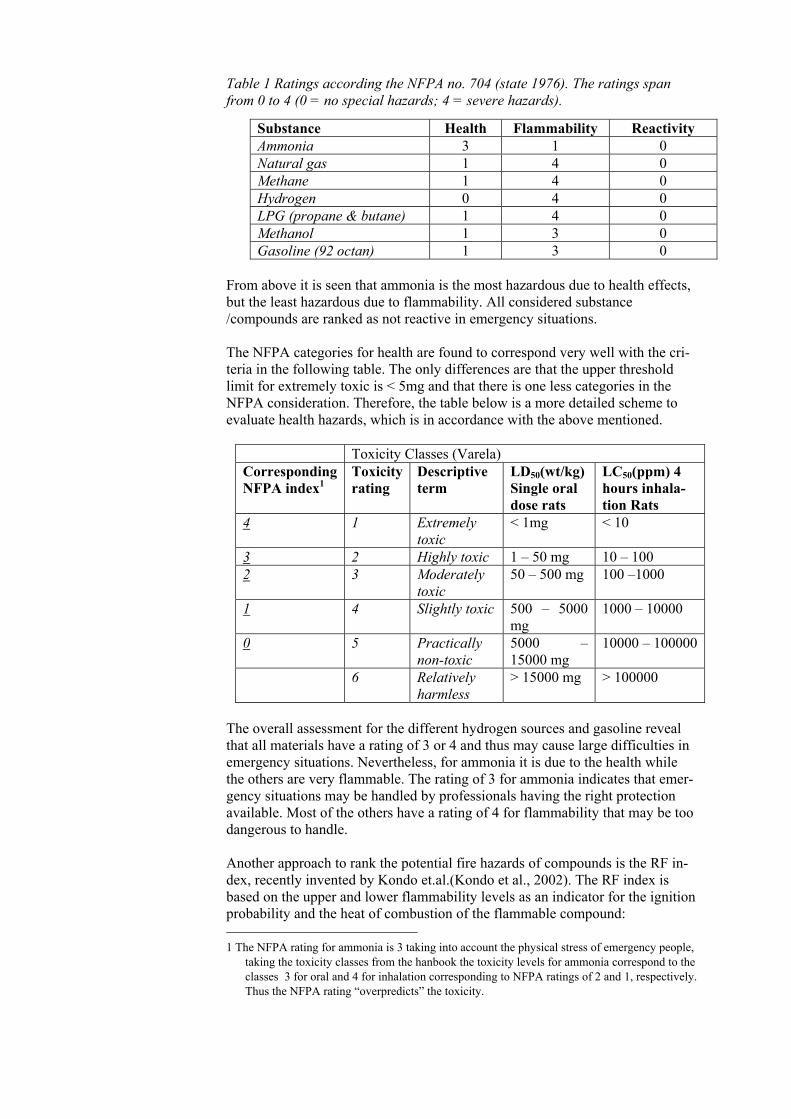
Table 1 Ratings according the NFPA no. 704 (state 1976). The ratings span from 0 to 4 (0 = no special hazards; 4 = severe hazards).
Substance Health Flammability Reactivity Ammonia 3 1 0 Natural gas 1 4 0 Methane 1 4 0 Hydrogen 0 4 0 LPG (propane & butane) 1 4 0 Methanol 1 3 0 Gasoline (92 octan) 1 3 0
From above it is seen that ammonia is the most hazardous due to health effects, but the least hazardous due to flammability. All considered substance /compounds are ranked as not reactive in emergency situations. The NFPA categories for health are found to correspond very well with the cri-teria in the following table. The only differences are that the upper threshold limit for extremely toxic is < 5mg and that there is one less categories in the NFPA consideration. Therefore, the table below is a more detailed scheme to evaluate health hazards, which is in accordance with the above mentioned.
Toxicity Classes (Varela) Corresponding NFPA index1
Toxicity rating
Descriptive term
LD50(wt/kg) Single oral dose rats
LC50(ppm) 4 hours inhala-tion Rats
4 1 Extremely toxic
< 1mg < 10
3 2 Highly toxic 1 – 50 mg 10 – 100 2 3 Moderately
toxic 50 – 500 mg 100 –1000
1 4 Slightly toxic 500 – 5000 mg
1000 – 10000
0 5 Practically non-toxic
5000 – 15000 mg
10000 – 100000
6 Relatively harmless
> 15000 mg > 100000
The overall assessment for the different hydrogen sources and gasoline reveal that all materials have a rating of 3 or 4 and thus may cause large difficulties in emergency situations. Nevertheless, for ammonia it is due to the health while the others are very flammable. The rating of 3 for ammonia indicates that emer-gency situations may be handled by professionals having the right protection available. Most of the others have a rating of 4 for flammability that may be too dangerous to handle. Another approach to rank the potential fire hazards of compounds is the RF in-dex, recently invented by Kondo et.al.(Kondo et al., 2002). The RF index is based on the upper and lower flammability levels as an indicator for the ignition probability and the heat of combustion of the flammable compound: 1 The NFPA rating for ammonia is 3 taking into account the physical stress of emergency people,
taking the toxicity classes from the hanbook the toxicity levels for ammonia correspond to the classes 3 for oral and 4 for inhalation corresponding to NFPA ratings of 2 and 1, respectively. Thus the NFPA rating “overpredicts” the toxicity.

0.5
U = upperflammability limit (vol %)L = lowerflammability limit (vol. %)
kJQ = heat of ombustionmol
gM = molecular mass of fuelmol
1
c
QURF numberL M
− = −
Substance RF number [kJ/g] Ammonia 7 Methane 40 Hydrogen 402 Propane 52 Butane 59 Methanol 29 –41 (different Flam.
Limits found) Ethanol 39
It is seen that the RF index is rather sensitive to the parameters. According to it ammonia is by far the less hazardous compound due to ignition probability and hazard. Hydrogen is by far the most hazardous substance.
2 References Cited
Anon, 1976, Identification of the hazards of materials & Tables and Charts, in GP McKinnon and K Tower (eds), Fire Protection Handbook: Boston Massachusetts, Na-tional Fire Protection Association, p. 3-129-3-210.
Varela, J. (ed.), 1995 p. 35, Hazardous Materials – Handbook for Emergency Respond-ers ISBN 0-442-02-104-6, van Nostrand Reinhold, USA
Kondo,S, A Takahashi, K Tokuhashi, A Sekiya, 2002, RF number as a new index for assessing combustion hazard of flammble gases: Journal of hazardous materials, v. A93, p. 259-267.
Data in the following when not indicated otherwise are taken form Roth Weller, Gefährliche Chemische Reaktionen, ecomed, update 8/2004
Risø-R-1504(EN) Annex A 5
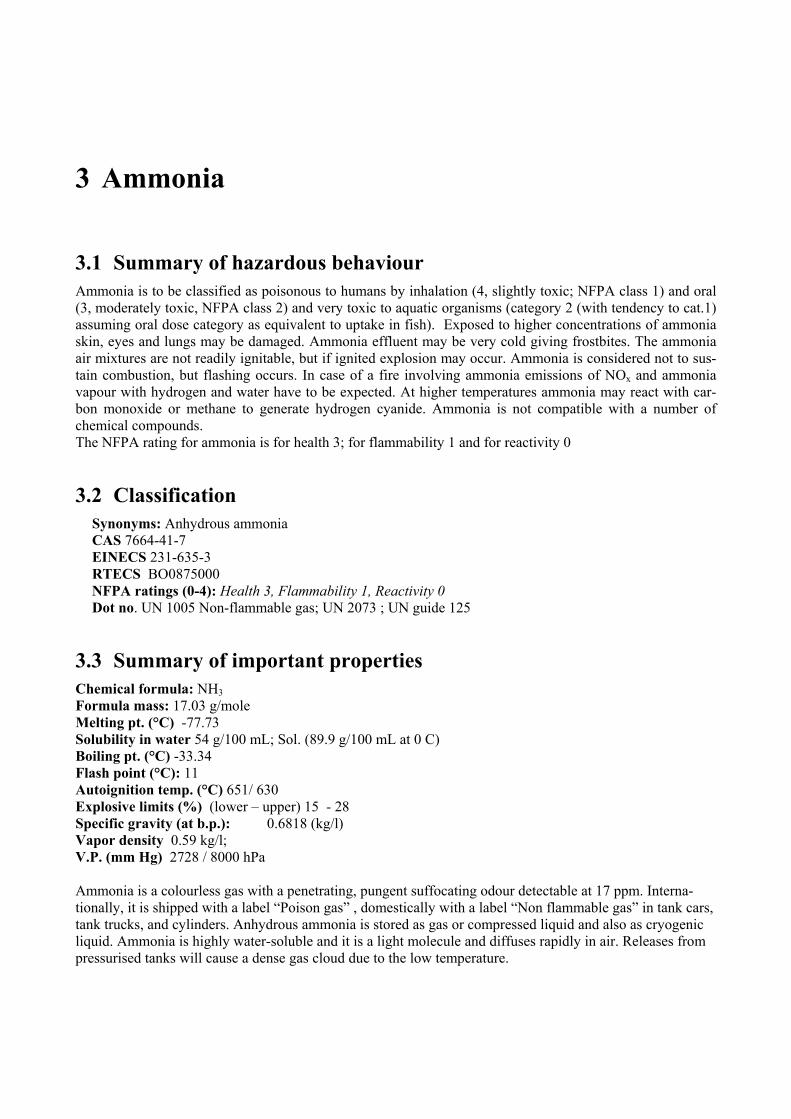
3 Ammonia
3.1 Summary of hazardous behaviour Ammonia is to be classified as poisonous to humans by inhalation (4, slightly toxic; NFPA class 1) and oral (3, moderately toxic, NFPA class 2) and very toxic to aquatic organisms (category 2 (with tendency to cat.1) assuming oral dose category as equivalent to uptake in fish). Exposed to higher concentrations of ammonia skin, eyes and lungs may be damaged. Ammonia effluent may be very cold giving frostbites. The ammonia air mixtures are not readily ignitable, but if ignited explosion may occur. Ammonia is considered not to sus-tain combustion, but flashing occurs. In case of a fire involving ammonia emissions of NOx and ammonia vapour with hydrogen and water have to be expected. At higher temperatures ammonia may react with car-bon monoxide or methane to generate hydrogen cyanide. Ammonia is not compatible with a number of chemical compounds. The NFPA rating for ammonia is for health 3; for flammability 1 and for reactivity 0
3.2 Classification Synonyms: Anhydrous ammonia CAS 7664-41-7 EINECS 231-635-3 RTECS BO0875000 NFPA ratings (0-4): Health 3, Flammability 1, Reactivity 0 Dot no. UN 1005 Non-flammable gas; UN 2073 ; UN guide 125
3.3 Summary of important properties Chemical formula: NH3 Formula mass: 17.03 g/mole Melting pt. (°C) -77.73 Solubility in water 54 g/100 mL; Sol. (89.9 g/100 mL at 0 C) Boiling pt. (°C) -33.34 Flash point (°C): 11 Autoignition temp. (°C) 651/ 630 Explosive limits (%) (lower – upper) 15 - 28 Specific gravity (at b.p.): 0.6818 (kg/l) Vapor density 0.59 kg/l; V.P. (mm Hg) 2728 / 8000 hPa Ammonia is a colourless gas with a penetrating, pungent suffocating odour detectable at 17 ppm. Interna-tionally, it is shipped with a label “Poison gas” , domestically with a label “Non flammable gas” in tank cars, tank trucks, and cylinders. Anhydrous ammonia is stored as gas or compressed liquid and also as cryogenic liquid. Ammonia is highly water-soluble and it is a light molecule and diffuses rapidly in air. Releases from pressurised tanks will cause a dense gas cloud due to the low temperature.

3.4 Environmental hazards Ammonia has some environmental effects and is very toxic when released into aqueous environments. Other effects /limitations are: Air: contribution to acid rains & NOx emissions; green house potential Water: Very toxic to aquatic organisms (R50); LC50 trout: 0.16 – 1.1 mg/l /96 hours; CSB (Chemischer Sau-erstof Bedarf): 2200 g/l (undiluted ammonia) (see Agrolinz MSDS ) Soil: inhibits activity of micro-organisms in earth. Ground water: Threshold value for drinking water is applied.
3.5 Human hazards Acute: Toxic by inhalation. Higher concentrations (in %) causes burns to eyes, skin and mucus membranes Rapid evaporation of the liquid can cause frostbite LCLO inhalation man 5000 ppm in 5 min LC50 inhalation rats: 2000 ppm in 4 hours LD50 oral 350 mg/kg Long term MAK-Wert 50 ml/m3 (ppm); 35mg/m3; spitzenbegr. Kat. I Hazard symbols: T poisonous; N environmental hazards; flammable; poisonous by inhalation; very poison-ous for organisms in water
3.6 Fire hazards Ignition: Hard to ignite Fire emissions: nitrous gases , ammonia, hydrogen and water Extinguishing: carbon dioxide; do not use water
3.7 Compatibility with other compounds Ammonia reacts corrosive with many non-ferrous metal and alloys, such as copper, brass. Ammonia reacts violently with acids
Hazardous reactions are known with the following compounds: Exothermic reactions:
Acetaldehyd, acrolein, Barium, halogenic borium, bromine, brom penta fluoride, hydrogen bromide, cal-cium, chlorodinitrobenzene, chloro-silane, chloro trifluoride, chloro compounds hydrogen chloride, chro-mium trioxide, chromylchloride, dimethyl-sulphate, di-nitrogenoxide, ethyleneoxide (polymerisation), fluo-rine, hydrogen fluoride, halogens, hypochloric acid, potassium chlorate, carbon dioxide, methyl mercaptane, nitryl chloride, oxidisers, phosgene, phosphorousoxide, hydrogen phosphoride, Platinium catalyser, propinyl chloride, acids, sulphur dioxide, hydrogen sulphide, nitrogen oxides, nitrogen peroxide, tetra methyl amino ammonia (degradation)
Ignition or ignitable gases: Borium, chlorine, pentaborane, phosphorous oxide, nitrous acid
Risø-R-1504(EN) Annex A 7

Explosions/ explosible mixtures: Ammonium chlorite, (antimonwasserstoff (heat)), calcium, chlorine, chloroazide, chloro-dinitro benzene, chlorformamidiniumnitrat, chlorites, chloro benzene, chromium trioxide, chromylchloride, dichloroethane (liquid ammonia), dichlorooxide, di fluoro trioxide, gold, gold chloride, halogens, iodium , air, magnesium perchlorate, sodium hypochlorite (dry), oxidisers, pikrinic acid, mercury with water, mercury hypoiodid, oxygen, sulphur, silver, silver chloride & nitrate (under storage), tri chloro-nitrogen, sulfinyl chloride, haologenic tellurium compounds, hydrogenperoxide Generation of hazardous gases: Carbon monoxide (heat), methane (heat) both give hydrogen cyanide
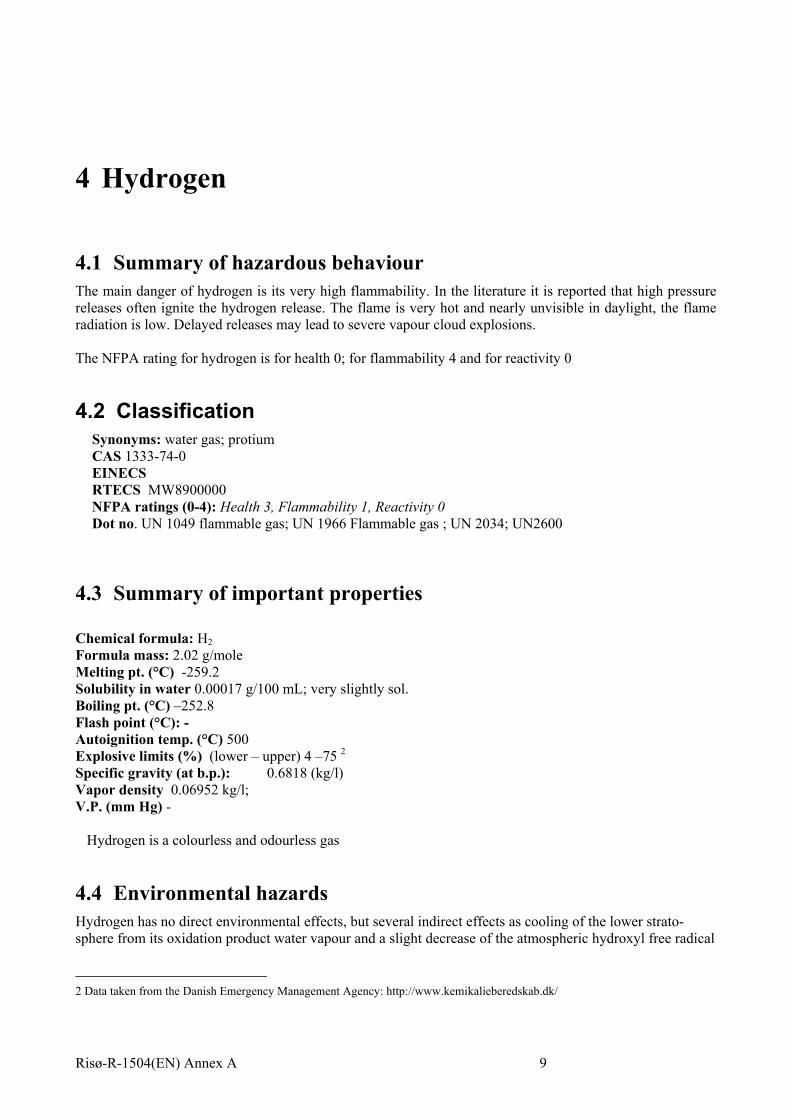
4 Hydrogen
4.1 Summary of hazardous behaviour The main danger of hydrogen is its very high flammability. In the literature it is reported that high pressure releases often ignite the hydrogen release. The flame is very hot and nearly unvisible in daylight, the flame radiation is low. Delayed releases may lead to severe vapour cloud explosions. The NFPA rating for hydrogen is for health 0; for flammability 4 and for reactivity 0
4.2 Classification Synonyms: water gas; protium CAS 1333-74-0 EINECS RTECS MW8900000 NFPA ratings (0-4): Health 3, Flammability 1, Reactivity 0 Dot no. UN 1049 flammable gas; UN 1966 Flammable gas ; UN 2034; UN2600
4.3 Summary of important properties Chemical formula: H2 Formula mass: 2.02 g/mole Melting pt. (°C) -259.2 Solubility in water 0.00017 g/100 mL; very slightly sol. Boiling pt. (°C) –252.8 Flash point (°C): - Autoignition temp. (°C) 500 Explosive limits (%) (lower – upper) 4 –75 2 Specific gravity (at b.p.): 0.6818 (kg/l) Vapor density 0.06952 kg/l; V.P. (mm Hg) -
Hydrogen is a colourless and odourless gas
4.4 Environmental hazards Hydrogen has no direct environmental effects, but several indirect effects as cooling of the lower strato-sphere from its oxidation product water vapour and a slight decrease of the atmospheric hydroxyl free radical
2 Data taken from the Danish Emergency Management Agency: http://www.kemikalieberedskab.dk/
Risø-R-1504(EN) Annex A 9

concentration are being discussed at the moment. Most of the hydrogen is taken up by the biosphere and de-graded by biological processes.
4.5 Human hazards Hydrogen is not poisonous
4.6 Fire hazards Ignition: Hydrogen is at the lower ignition limit ignited as easily as other fuels, though at higher concentra-tions near the stoichiometric mixture the ignition energy decrease to very low energies. Fire emissions: water vapour Extinguishing: jet fire from pressurized release by closing off the source , cooling
4.7 Compatibility with other compounds Hydrogen gives explosive mixtures with a number of substances such as oxygen, chlorine and fluorine . It also reacts with other halogenes, metal oxides, carbon and organic compounds. Reactive on metal catalysts. Hydrogen is generated by the reaction of acids with metals.

5 LPG (Liquid Petroleum Gas, Propane/Butane)
5.1 Summary of hazardous behaviour LPG is a very common fuel and has been intensively investigated to improve the overall safety. Storage may lead to BLEVES and vapour cloud explosions. The NFPA rating for LPG (propane & butane) is for health 1; for flammability 4 and for reactivity 0.
5.2 Classification Synonyms: Liquefied petroleum gas; Flüssiggas CAS 68476-85-7 EINECS RTECS NFPA ratings (0-4): Health 1, Flammability 4, Reactivity 0 Dot no. UN 1075
5.3 Summary of important properties Chemical formula: C3H6 – C4H10 Formula mass: 42 – 58 g /mol Melting pt. (°C) –188 (propane) Solubility in water all insoluable Boiling pt. (°C) -42 (propane) Flash point (°C): -104 3 (propane) Autoignition temp. (°C) 470 / 450 (propane) 3 Explosive limits (%) (lower – upper) 2.1 –9.5 Specific gravity (at b.p.): (kg/l) Vapor density 2.0196 kg/l; V.P. (kPa) 830 LPG is a colourless, odorless mixture of gases or a liquid when under pressure of different compounds like butane, butene propane, propene
5.4 Environmental hazards Water: insoluble in water, not dangerous to water
3 Data taken from the Danish Emergency Management Agency: http://www.kemikalieberedskab.dk/
Risø-R-1504(EN) Annex A 11
5.5 Human hazards Long term OSHA: the legal airborne permissible exposure limit (PEL) is 1000 ppm averaged over 8-hours workshift MAC (Propane) 1000 ml/m3 (ppm); 1800 mg/m3
5.6 Fire hazards Ignition: extremely flammable (Classification symbol: Fx; Keep away from children, storage in a well-ventilated room or area, keep away from ignition sources, smoking prohibited) Fire emissions: water, carbon monoxide and carbon dioxide
5.7 Compatibility with other compounds Explosion when mixed with air, hazardous reaction with bariumperoxide and chlordioxid
6 Methanol
6.1 Summary of hazardous behaviour Methanol is widely used in the daily life and industrial production, but is rather new to be considered as a future fuel. Methanol is slightly toxic, but is a liquid at ambient conditions. It ignites readily and as burning rather rapidly.
The NFPA rating for methanol is for health 1; for flammability 3 and for reactivity 0
6.2 Classification Synonyms: Methylalcohol CAS 67-56-1 EINECS 2006596 RTECS NFPA ratings (0-4): Health 1, Flammability 3, Reactivity 0 Dot no. UN 1230
6.3 Summary of important properties Chemical formula: CH3OH Formula mass: 32.04 g/mol Melting pt. (°C) -98.9 Solubility in water miscible Boiling pt. (°C) 64.7 Flash point (°C): 12 / 11 1 Autoignition temp. (°C) 455 / 464 4 Explosive limits (%) (lower – upper) 5.5 – 44
Specific gravity (at b.p.): 0.6818 (kg/l) Vapor density 0.59 kg/l; V.P. (mm Hg): 2728 / 8000 hPa Methanol is a colourless liquid at room temperature with a characteristic fresh odour (2000 ppm).
6.4 Environmental hazards Miscible with water, substance is dangerous to water (wassergefährdendere Stoff WGK 1)
4 Data taken from the Danish Emergency Management Agency: http://www.kemikalieberedskab.dk/
Risø-R-1504(EN) Annex A 13

6.5 Human hazards MAK-value: 200ml/m3, is absorbed through the skin. Poisonous and danger of irreversible harms by inhala-tion, swallowing and skin contact
6.6 Fire hazards Methanol is easy to ignite , burning with a blue flame
6.7 Compatibility with other compounds Methanol reacts at room temperature violently with alkali metals generating hydrogen. Is giving explosive products when mixed with strong acids (e.g. nitric or perchlorate acid) or strong oxidisers.

7 Natural gas / methane
7.1 Summary of hazardous behaviour Natural gas (NG) is a slightly varying mixture of several gases. The main hazards are due to the high flam-mability of the gas that may lead to explosions. Liquefied methane is very cold and may give frost bites when handled improperly. The NFPA rating for natural gas is 1 for health, 4 for flammability and 0 for reactivity
7.2 Classification Synonyms: Erdgas (German); main component is Methane CAS 8006-14-2 (74-82-8) EINECS 200-812-7 RTECS NFPA ratings (0-4): Health 1, Flammability 4, Reactivity 0 Dot no. UN 1971 (pressurized); 1972 (liquid)
7.3 Summary of important properties Chemical formula: CH4 Formula mass: 16.04 g/mol Melting pt. (°C) -184 Solubility in water insoluable Boiling pt. (°C) 162 Flash point (°C): - Autoignition temp. (°C) 595 Explosive limits (%) (lower – upper) 4.4 - 17 Specific gravity : 0.717 (kg/l) Natural gas is a mixture of different gases with the main component methane usually with about 90 %. The composition changes after origin of the gas and therefore the properties may vary somewhat. In parentheses the properties of the pure main compound methane are listed.
7.4 Environmental hazards Methane is recognized as a greenhouse gas
7.5 Human hazards Methane is not toxic
Risø-R-1504(EN) Annex A 15

7.6 Fire hazards Ignition: very easy to ignite at all ambient temperatures
7.7 Compatibility with other compounds Incompatible with strong oxidisers eg. Chlorine and fluorine, mixture of liquid methane and liquid oxygen is explosive.
8 Gasoline
8.1 Summary of hazardous behaviour Gasoline is a mixture of easy ignitable hydrocarbons e.g containing pentane, hexane, heptane, octane etc.. It is widely used as a common fuel. It burns readily at ambient conditions with a yellow flame. It is dangerous to the water and soil environment. It may be depending on the actual composition be cancerous. The gasolines NFPA rating is 1 for health, 3 for flammability and 0 for reactivity.
8.2 Classification Synonyms: - CAS 8032-32-4 106602-80-6 EINECS 2324537 RTECS NFPA ratings (0-4): Health 1, Flammability 3, Reactivity 0 Dot no. UN 1203
8.3 Summary of important properties Chemical formula: CnH2n+1 (n= 4 ..12) Formula mass: n.a.mixture Melting pt. (°C) Solubility in water insoluable Boiling pt. (°C) 38 - 103 Flash point (°C): <-20 - 55 Autoignition temp. (°C) >220 Explosive limits (%) (lower – upper) 0.6 - 8 Specific gravity : 0.69 – 0.71 (kg/l) Vapour pressure: 51 – 404 hPa (20oC) Vapour density: denser than air, 2.7 – 5.0 Gasoline is a mixture of a number of hydrocarbons ranging from C4 to C12. The odour is characteristic at 300 ppm.
8.4 Environmental hazards Gasoline is dangerous to water and a common soil pollutant
Risø-R-1504(EN) Annex A 17

8.5 Human hazards Depending on the actual mixture gasoline may be cancerous .
8.6 Fire hazards Ignition: gasoline mixture with a boiling point below 21oC is very easily ignitable, while gasolines in the boiling point range between 21 – 55 oC is classified as igniteable.
8.7 Compatibility with other compounds Gasoline is generating explosive mixtures with air.

Annex B – Guideline for safe handling of ammonia in laboratories
Risø-R-1504(EN) 43
Contents
1 Ammonia 3
1.1 General about Ammonia 3 1.2 Use of Ammonia 3 1.3 Potential health hazards 3 Risk by respiration 3 Risk by contact 4 What is the treatment after exposure to anhydrous ammonia ? 4 What tests can be done if a person has been exposed to anhydrous ammonia? 4 What symptoms should persons be most concerned about? 4 Preventive actions 4 1.4 Handling and storage 5 Storage and transport 5 Release of anhydrous ammonia 5 Fire and explosions risks 5 1.5 Choice of materials 6 Equipment Safety 6
2 Risk analysis of the system and process 7
Plant description 7 Hazard identification 7 Safety systems 7 Conclusion 7
3 References 8
4 Risk Analysis Report 9
1 Ammonia
1.1 General about Ammonia Ammonia NH3 is a colourless, highly irritating gas with a sharp, suffocating odour. It dissolves easily in water and liquid ammonia evaporates quickly. It is commonly sold in liquid forms (dissolved in water or in pressurised tanks). Large amounts of ammonia are produced naturally in soil by bacteria, decaying plants and animals, and animal wastes. Ammonia is a key intermediate in the nitrogen cycle and is essential for many biological processes. For industrial purposes ammonia is synthesised from its elements nitrogen and hydrogen in large quantities.
1.2 Use of Ammonia Ammonia is one of the most common used inorganic chemicals within the chemical industry. It is used for production of fertiliser, nitrates, explosives, nitric acid, amins, amids and textiles. Within the petrochemical industry it is used to neutralise acid in crude oil. In many areas Ammonia is used as protection gas e.g. by heat treatment of steel. The gas can be split up into its elements hydrogen and nitrogen, using a cata-lyst. The thermodynamic properties of ammonia do it well suited as a medium in cooling systems, heat pumps and similar systems.
1.3 Potential health hazards Exposure to anhydrous ammonia can cause blindness, lung damage, burns, or death. Symptoms include burning of the eyes, nose and throat after breathing even small amounts.
Risk by respiration
Ammonia is a cauterising gas. The toxic attack on the mucous membranes is due to the consideration, that the alkaline solution of water dissolves the albu-men (protein) of the cell walls. Ammonia mainly attacks the upper respiratory passages, and eye exposure can cause serious corneal burns or blindness. Damage on the eye can occur up to a week after the exposition. Gaseous ammonia attacks moist skin and can in higher concentrations (2-3%) give burning pains. Low concentration can result in indisposition, headache or coughing. High concentration can result in spasm in the larynx and long time exposition oedema in the lungs. • At concentration around 10-20 mg/m3 (15-30 ppm) the smell of ammonia is
noticeable. • 70 mg/m3 (100 ppm) irritates the nose and can give burning feeling in the
eyes. • 200-350 mg/ m3 (280-400 ppm) is tolerable up to 0.5-1 hour.
• Concentration on 1200 mg/m3 (1700 ppm) is coughing causing and can result in severe damage by exposure less than 30 minutes.
• Exposures at concentrations of 2500-4500 mg/m3 (3500-6400 ppm) can be dangerous to life at 0.5-1 hours of exposure.
• Concentrations on 3500-7000 mg/m3 (5000-10000 ppm) are fatal at short exposure time (10-15 minutes).
Risk by contact
Ammonia in liquid form or as cold gas can cause frostbites and cauterising damage on skin and eyes. Liquid ammonia coming in contact with warmer ob-jects will violent boil and splashing will occur.
What is the treatment after exposure to anhydrous ammonia ?
There is no specific treatment for the effects of anhydrous ammonia. Immediate first aid includes providing fresh air, oxygen and flushing with water. Most people recover from a single low exposure to anhydrous ammonia without any delayed or long-term effects. After a severe exposure, injury to the eyes, lungs, skin, or digestive system may continue to develop for 18 to 24 hours, and delayed effects primarily to the respiratory system or the eyes are possible. Anhydrous ammonia is not known to cause cancer.
What tests can be done if a person has been exposed to anhydrous ammo-nia?
If a severe exposure has occurred, blood and urine analyses, chest x-rays, pul-monary function testing and other tests may show whether the lungs have been injured. Testing is not needed in every case. Special eye examinations may also be conducted.
What symptoms should persons be most concerned about?
People who continue to experience coughing, difficulty breathing or shortness of breath, wheezing or high-pitched voice, chest pain or tightness, increased pain or a discharge from exposed eyes, increased redness or pain or a pus-like discharge in the area of a skin burn or stomach pain or vomiting should consult a doctor or a hospital.
Preventive actions
To be safe handling anhydrous ammonia: • Wear personal protective equipment, including:
• goggles, • gloves, • long-sleeved shirt, • long pants, • and proper work shoes.
• Have water supply close by. and • Regularly inspect hoses and valves and replace them as needed. • Be careful not to fill a tank over 85 percent of capacity. • Bleed off hose pressure before disconnecting. • Stay clear of hose and valve openings. • Follow regulations when using equipment.

1.4 Handling and storage
Storage and transport
Anhydrous ammonia is compressed to liquid form and is stored in tanks isolated or not isolated. Boiling point of anhydrous ammonia is –33 oC and can stay in liquid form under pressure at normal temperature. If the pressure tank fails so that the gas or liquid flows out, the temperature in the tank will decrease very rapid to –33 oC or lower. At the same time the pressure will drop to atmospheric pressure. If the ammonia has to be stored at atmospheric pressure it must be cooled down to a temperature lower than –33 oC. Tanks containing ammonia must be kept separated from other chemicals, especially oxidising gasses such as clorine, bromine, iodine and acid.
Release of anhydrous ammonia
From cooled atmospheric storage Liquid anhydrous ammonia at -33°C will pour out and form a liquid pool where it hits a surface (e.g. ground). While hitting the surface, it will evaporate vio-lently (boil) until the underlying surface is cooled down. Mitigation will exist in limiting the pool: to spread (bund, pit), and to cover the pool with an isolating material (cloth), to prevent warm air to stimulate evaporation, and to limit re-lease of vapour. Under no conditions water should be added to such a pool, be-cause this causes violent boiling. Hazards related to this type of release are the toxic properties of the anhydrous ammonia vapour and frostbite due to the low temperatures of vapour and liquid.
From pressurised storage Leakage from pressured storage may cause jets with excess speeds of over 100 m/s and consisting of mixtures of small droplets and vapour. Due to mixing with air, all liquid in the jet can evaporate, causing further drop in temperature to -70°C. These jets can cause severe frostbite and cause toxic exposure. When the two-phase jet hits an object, the object becomes covered with a mixture of ice and liquid ammonia.
The last effect can help to mitigate the release: by covering and “catching” the jet, using suitable sheets and wide, flexible hoses, evaporation can be limited and the liquid fraction of the jet (about 75% by mass) can be directed into a pool, where evaporation takes place at a lower rate. HydroCare, Landskrona, Sweden, has developed procedures and tools (hoses) for “re-condensing” am-monia for these kind of spills1. Under no conditions water should be added to pools of liquid ammonia. If no other equipment is available, water curtains can be used (using special wide cone nozzles) to catch the ammonia that already has been evaporated.
Fire and explosions risks
Acids react with ammonia under development of heat. At larger amounts this heat development can have violent consequences. Ammonia burns in oxygen and nitrogen and water is developed. The gas, in cer-tain concentrations, can burn and explode in a mixture with air.
1 An instruction video for this methodology is available.
Ammonia and mercury can give explosive mixtures. Halogens e.g. chlorine and ammonia can give spontaneous explosions. Gas of ammonia burns in an atmos-phere of gasses of nitric acid. Ammonia explodes in contact with hypo-chlorine acid. Gas of ammonia mixed with air react violent with potassium chlorate. Violent reactions and explosions happen when gas of ammonia or liquid ammo-nia brings in contact with different halogen compounds. Liquid ammonia dis-solves alkali metals
1.5 Choice of materials
Equipment Safety
Equipment should be additives compatible and meet NH3 codes and standards. Any equipment replacement MUST be made "IN KIND" with the same materi-als of construction and the same specifications. Only a limited amount of materials are recommended for use with ammonia.
In the catalog EGO from Brdr. Dahls a list gives the information that the fol-
lowing metals can be used for ammonia. 316 SS 17-4 Ph stainless alloy 20 hastelloy c Steel can be used for anhydrous ammonia but not for aqueous ammonia. Different findings from web pages concerning “ corrosion+ammonia”
Anhydrous and aqueous ammonia are completely different with regard to corro-sion. Both types form a corrosive reaction with galvanised surfaces (Zinc) cop-per, brass, bronze, aluminium and its alloys. Carbon steel, stainless steels and polyethylene have been used successfully as tank/piping materials. Storage tanks are typically designed and stamped as ASME (The American Society of Mechanical Engineers) pressure vessels due to the high vapour pressures typically encountered. Research papers have been written on stress corrosion cracking (SCC) of carbon steels in anhydrous ammonia service. When anhydrous ammonia is stored, tanks are also required to meet the special requirements of ANSI K61.1 (which involves stress relief of welded joints and other tank design requirements)

2 Risk analysis of the system and process A risk analysis of a system is a structured going through of the system and its func-tions, with special reference to identification of causes and consequences of un-wanted events. The purpose of a risk analysis is to be able to implement safety sys-tems that reduce risks for persons, equipment and the environment. The unwanted events in focus for the system in question are • Explosions • Fire • Leak of unwanted matters • Injury of persons A risk analysis consists of four parts:
Plant description
A description of the plant its functions, goals, operation, chemicals used, ware-house, employed e.g. The description also include the placement of the plant and a drawing.
Hazard identification
A description of unwanted events or hazards in the plant if no control system was installed. This part is the most important part of the risk analysis and requires often the use of risk analysis methods to do a structured going through of the system to identify potential risks. As the unwanted events have been identified the consequence of these events have to be found and the root causes for the events assessed. To be able to determine the consequence of an event some help can be required in the form of dispersion models e.g.
Safety systems
What has been done to prevent the events to happen? If the consequence of an event is unacceptable for the persons or the environ-ment, both regarding the consequence of the event but also the probability for that the event will happen, safety systems must be installed to prevent the events to happen. These safety systems must be described in the report. Safety systems can be automatic control systems, alarm systems, procedures e.g.
Conclusion
Final assessment of the safety of the plant

3 References Anhydrous Ammonia Safety, Oklahoma Cooperative Extension Service. Divi-sion of Agricultural Sciences and Natural Resources. Anhydrous Ammonia Health Information. Ammonia Patient Information Sheet, Center for Disease Control and Prevention.
AGA Gas-Handbok, AGA AB, Sweden
Brdr. Dahls EGO catalogue
Pligter ved Risikobetonede aktiviteter. Arbejdstilsynet. Nr3 1985
4 Risk Analysis Report
Content: Description of the plant Purpose Function Construction and placement Main data Operation Events Hazard identification Consequences Failure analysis Safety systems Supervisory systems Control systems Procedures Construction Conclusion Appendices

Description of the plant
The description must be short and clear. A drawing of the plant must be a part
of the description.
Detailed information of the plant can be given in an appendix.
Project
name:
Date: Responsible
for the report:
Responsible for
the design :
Responsible
for the
operation:
Purpose:
What are the plant used for ?
Function :
What is going on in the plant and how ?
Construction and placement :
How is the plant build and how is it placed relative to the environment?
Main data :
The most important data for the plant must be described e.g. the size of the
plant, temperatures, pressures , the amount of chemicals in the process and
in the ware house.
Operation :
A description on the operation of the plant.
Who runs the plant?
What are their education ?
Who is responsible for the operation ?
When do it run?
Are there manual work connected to the operation?
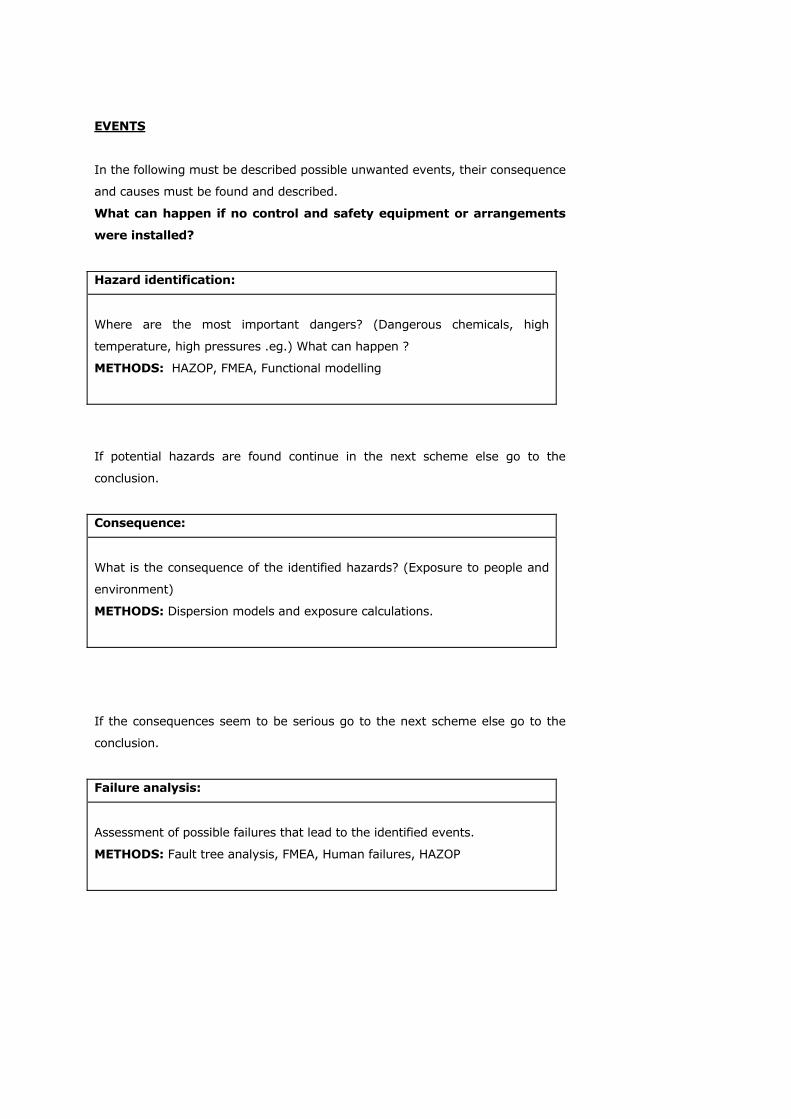
EVENTS
In the following must be described possible unwanted events, their consequence
and causes must be found and described.
What can happen if no control and safety equipment or arrangements
were installed?
Hazard identification:
Where are the most important dangers? (Dangerous chemicals, high
temperature, high pressures .eg.) What can happen ?
METHODS: HAZOP, FMEA, Functional modelling
If potential hazards are found continue in the next scheme else go to the
conclusion.
Consequence:
What is the consequence of the identified hazards? (Exposure to people and
environment)
METHODS: Dispersion models and exposure calculations.
If the consequences seem to be serious go to the next scheme else go to the
conclusion.
Failure analysis:
Assessment of possible failures that lead to the identified events.
METHODS: Fault tree analysis, FMEA, Human failures, HAZOP

Safety systems
In the following must be described which safety systems are installed or taken
to prevent the identified possible events
Supervisory systems:
Describe which systems are installed to give information of system state and
condition to be aware of abnormal situation and be able to prevent the un-
wanted events.
Control systems:
Describe the control systems installed, which prevent against unwanted
situations and events.
Procedures:
Describe which written procedures exist for safe operation of the plant.
Construction:
Is there in the construction of the plant an in-build safety against unwanted
events? Requirements to the use of personals safety equipment?
Conclusion
Conclusion:
Which events are identified?
Which preventive installations or requirements exist to avoid these events?
Uncertainties in the analysis? Lack of data?
Evaluation
Signature:
Annex C – Allowable permeability of ammonia tanks in ammonia-driven vehicles
44 Risø-R-1504(EN)

Annex C
Allowable permeability of Ammonia tank
wall
max 10 ppm NH3
0% NH3 100% NH3
air (boundary layer)
ammonia In order to avoid perception of ammonia, we have to guarantee that the concentration outside the wall of the tank is always below the smelling level. Ammonia permeates through the wall and through the boundary layer outside the wall. The concentration at the wall depends on the ratio between the diffusion resistance of the wall and the diffusion boundary. If the resistance of the wall is large compared to the resistance of the boundary layer, the concentration at the wall will be low and v.v. To guarantee a low concentration at the wall means that we have to look for the situation with the biggest resistance of the boundary layer. The diffusion through the boundary layer is proportional with the concentration gradient, the (molecular) diffusion coefficient for the ammonia-in-air diffusion, and inversely proportional to the thickness of the (laminar) boundary layer. If the air was completely still, the boundary layer would be infinitely thick, and the resistance thereby infinitely large. In practice, the air is moving always, even in a closed space (garage) due to ventilation and temperature differences. The problem is thus to find a realistic maximum thickness for this boundary layer. The first approach is to look for free convection motions. As ammonia is lighter than air, diffusion of ammonia will cause the ammonia/air mixture outside the wall to be lighter than air, similarly as if the tank would be heating the air around it. Based on the similarity between mass transfer and heat transfer, we can calculate the mass transfer from a vertical flat plate under free convention due to concentration gradients. One can derive that the expressions are also valid for tubes with diameters corresponding to L/2.5, this is the nearest we can get to tank-shaped geometries using classical textbooks. We have set the wall concentration at 10 ppm and the typical vertical length scale L at 1000 mm (diameter 400 mm). This yields a mass transfer rate of about 1.8⋅10-9 kg/m2s, see attached table. In other words, if the permeability through the wall itself is less than 1.8⋅10-9 kg/m2s, the concentration at the outside will be less than 10 ppm. Results are not very sensitive for the length scale, a length scale of 5 m (corresponding to a tank diameter of 2 m) gives a mass transfer rate of 1.2⋅10-9 kg/m2s. Ref: ERG Eckert, RM Drake, Heat and Mass Transfer, 2nd ed. McGraw Hill, London, 1959, Chapter 11, Chapter 16

free convenction due to concentration gradient
Molar mass of air M_air 29 kg/kmolMolar mass of the gas M_gas 17 kg/kmolConcentration at infinity C_infinity 0 mol/mol 0 kg/kgConcentration at the wall C_wall 0.00001 mol/mol 5.862E-06 kg/kg
Temperature T 288 KStandard air density rho_a_0 1.293 kg/m3length scale (vertical dimension) L 1 mdensity at infinity rho_inf 1.225656 kg/m3density at the wall rho_wall 1.225651 kg/m3Viscosity nu 1.50E-05 m2/sDiffusion Coef gas-air D 2.50E-05 m2/s
Grashof Diffusion number Gr_D 1.80E+05Schmidt Diffusion number Sc 6.00E-01Laminar Nusselt Diffusion number Nu_D 1.01E+01 Gr<10+9
mass transfer Coeff h_D 2.52E-04 m/smas transfer rate m_flux 1.81E-09 kg/sm2
Annex D – Failure and accident probabilities
Risø-R-1504(EN) 45

Annex D – Failure and accident probabilities D.1 Vehicle release probabilities Table 1 Probabilities of consequences of accidents with ammonia powered passenger cars
Table 2 Probabilities of consequences of accidents with LPG powered passenger cars
D.2. Hazardous road transport failure probabilities The conditional failure and consequence probabilities for tank cars are based on the event tree model by Brockhof. The model is transferred into a Bayesian net. Bayesian nets are more flexible than event trees, several events can contribute to the same outcome.
The model by Brockhof does not address explicitly the size of the release in case of a failure and the type of consequence. The following assumptions have been made in addition to the data presented by Brockhof:
Consequence Scenario (chain of events) Expected frequency per 109 km
Complete rupture of fuel tank with complete loss of contents
1) Fuel tank fails on impact 0.015
2) Fuel tank fails due to overfilling and safety systems fail 0.0008
Release through the 6 mm diameter fill line due to accident
Tube connection fails and valves fail to close 0.053
Release through 2 mm diameter connection between tank and evaporator.
Tube connection between tank and evaporator fails and valve (safety system or between fails and valves fail to close failure of the evaporator
0.104
Evaporator/regulator fails during operation and causes failure of the system due to overpressure
0.166
Small hole (1 mm diameter) in the vapour line between evaporator and reformer
Puncture in the tubing system, valves fail to close (or safety system fails to detect the puncture)
1
Release due to error during maintenance work
Release through tube connection due to wrong operation while tank system is pressurised
10 (estimate)
Consequence Scenario (chain of events) Expected frequency per 109 km
1) Fuel tank fails on impact 0.02 Complete rupture of fuel tank followed by flash fire or explosion 2) Fuel tank fails due to overfilling
and safety systems fail 0.016
BLEVE of the tank Tank fails due to fire engulfment 1.7 Release through a 6 mm diameter tube due to accident
Tube connection fails and valves fail to close 2.6
Low pressure vapour release Tube connection fails and valves fail to close 0.3

− Puncture leads to a large hole
− Impact leading to failure of the tank (head-on, end-on or side-on) leads to complete failure (with instantaneous release of the whole contents of the tank) in 35% of the cases, and to a large hole in the remaining 65%. This is in agreement with data from the US as referenced by the AVIV study.
− Failure due to fire impact leads to complete failure.
And for flammable gases (LPG):
− The presence of an initial fire leads to direct ignition (This means, in combination with the assumption above, that failure due to fire leads to a BLEVE)
− Ignition in cases of failure due to puncture or impact follows the assumptions by the TNO LPG study for large holes, i.e. 10% direct ignition, 5% delayed ignition, 85% no ignition. (The TNO LPG study assumes higher ignition probabilities for instantaneous releases, but we assume that our (Brockhof’s) model covers this through the “failure due to fire impact” scenario)
Figure 1 shows the Bayesian network. Abrasian is not contributing to major releases of thick-walled tanks. Results for accidents on rural roads are presented in Table 3
Figure 1 Bayesian net describing the conditional probabilities of dangerous consequences of an accident with an LPG road tanker.

Table 3 Conditional probabilities of consequences of accidents with conventional (LPG) road tankers for rural roads (80 km/h speed limit).
Consequence Scenario (chain of events) Conditional probability
BLEVE (Fire ball due to rupture of tank, instantaneous release of contents and violent combustion)
1) Impact fails tank completely + direct ignition
2) Initial fire fails tank
0.00498
Instantaneous Cloud followed by an Unconfined Vapour Cloud Explosion (UVCE or flash fire)
Impact fails tank completely + delayed ignition
0.00025
Unignited Vapour Cloud Impact fails tank completely, no ignition
0.00423
Large Jet Fire (from large hole in tank)
1) Puncture + direct ignition
2) Impact fails tank partly + direct ignition
0.00114
Large flash fire (continuous release from large hole)
1) Puncture + delayed ignition
2) Impact fails tank partly + delayed ignition
0.00054
Large unignited vapour cloud
1) Puncture, no ignition
2) Impact fails tank partly, no ignition
0.00917
Minor releases All “initial releases” in sofar these do not contribute to failure by fire impact.
0.09917
No Release 0.88052 D.3. Loss of containment events at the refuelling station We assume that the delivery of ammonia or LPG takes place at existing refuelling stations where the main delivery exists of gasoline. But we will also assume that the physical lay-out of the refuelling station is such, that the delivery of gasoline, an any fire hazards resulting from that, does not interfere with the delivery of ammonia (or LPG) by tank car to the refuelling station. This requires among others that there is sufficient distance between the unloading of ammonia or LPG and the delivery of petrol to the consumer cars. Also, the “pit” that is recommended for the unloading bay of the ammonia tank car should be constructed in such a way, that leaked petrol from the station cannot run into this pit.
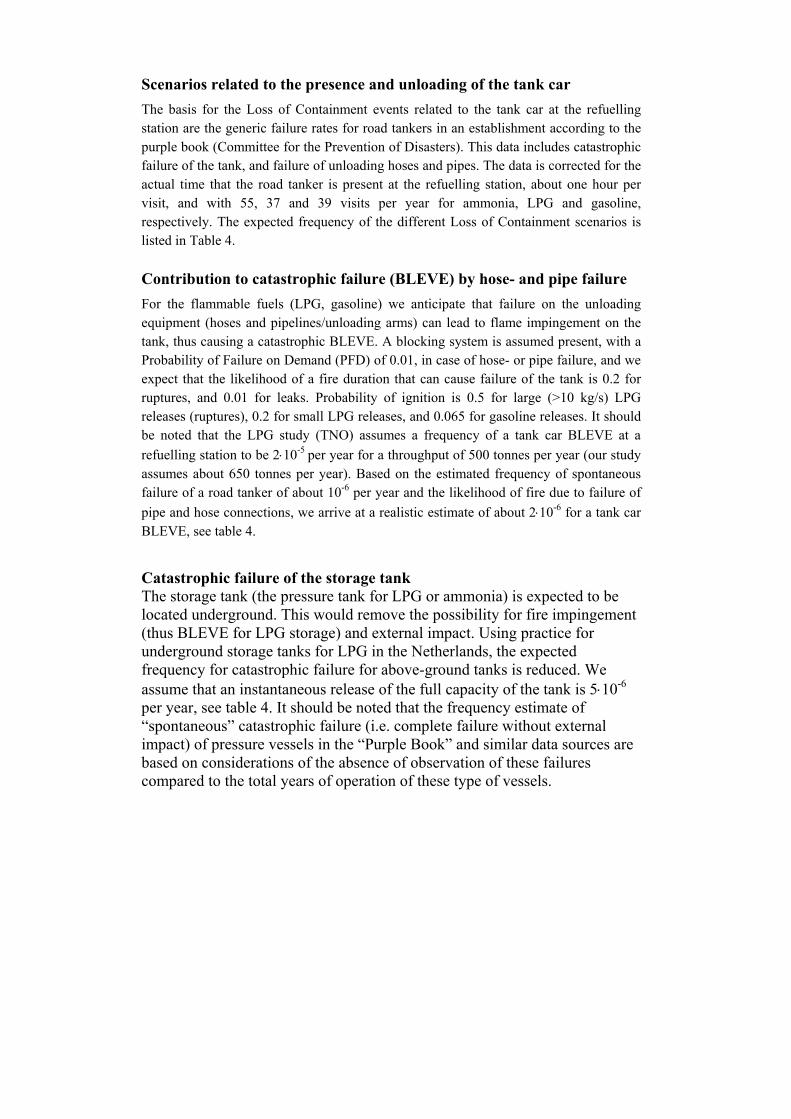
Scenarios related to the presence and unloading of the tank car The basis for the Loss of Containment events related to the tank car at the refuelling station are the generic failure rates for road tankers in an establishment according to the purple book (Committee for the Prevention of Disasters). This data includes catastrophic failure of the tank, and failure of unloading hoses and pipes. The data is corrected for the actual time that the road tanker is present at the refuelling station, about one hour per visit, and with 55, 37 and 39 visits per year for ammonia, LPG and gasoline, respectively. The expected frequency of the different Loss of Containment scenarios is listed in Table 4. Contribution to catastrophic failure (BLEVE) by hose- and pipe failure For the flammable fuels (LPG, gasoline) we anticipate that failure on the unloading equipment (hoses and pipelines/unloading arms) can lead to flame impingement on the tank, thus causing a catastrophic BLEVE. A blocking system is assumed present, with a Probability of Failure on Demand (PFD) of 0.01, in case of hose- or pipe failure, and we expect that the likelihood of a fire duration that can cause failure of the tank is 0.2 for ruptures, and 0.01 for leaks. Probability of ignition is 0.5 for large (>10 kg/s) LPG releases (ruptures), 0.2 for small LPG releases, and 0.065 for gasoline releases. It should be noted that the LPG study (TNO) assumes a frequency of a tank car BLEVE at a refuelling station to be 2⋅10-5
per year for a throughput of 500 tonnes per year (our study assumes about 650 tonnes per year). Based on the estimated frequency of spontaneous failure of a road tanker of about 10-6 per year and the likelihood of fire due to failure of pipe and hose connections, we arrive at a realistic estimate of about 2⋅10-6 for a tank car BLEVE, see table 4.
Catastrophic failure of the storage tank The storage tank (the pressure tank for LPG or ammonia) is expected to be located underground. This would remove the possibility for fire impingement (thus BLEVE for LPG storage) and external impact. Using practice for underground storage tanks for LPG in the Netherlands, the expected frequency for catastrophic failure for above-ground tanks is reduced. We assume that an instantaneous release of the full capacity of the tank is 5⋅10-6 per year, see table 4. It should be noted that the frequency estimate of “spontaneous” catastrophic failure (i.e. complete failure without external impact) of pressure vessels in the “Purple Book” and similar data sources are based on considerations of the absence of observation of these failures compared to the total years of operation of these type of vessels.
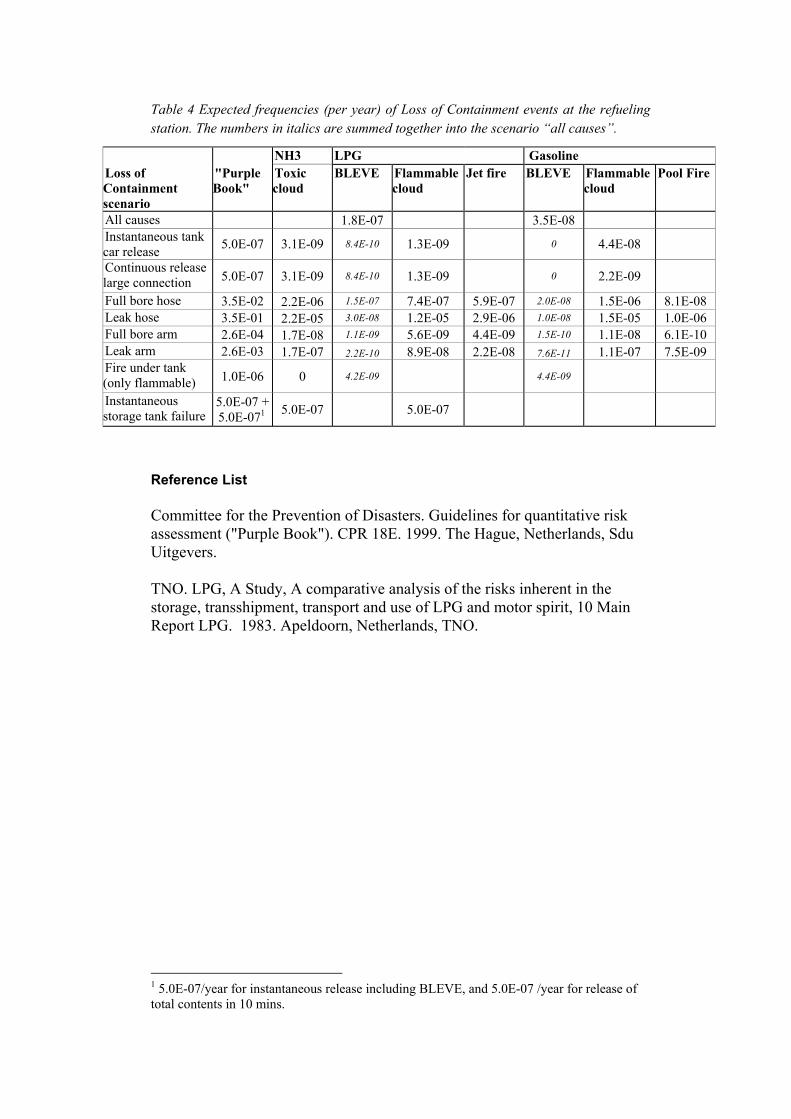
Table 4 Expected frequencies (per year) of Loss of Containment events at the refueling station. The numbers in italics are summed together into the scenario “all causes”.
NH3 LPG Gasoline Loss of Containment scenario
"Purple Book"
Toxic cloud
BLEVE Flammable cloud
Jet fire BLEVE Flammable cloud
Pool Fire
All causes 1.8E-07 3.5E-08 Instantaneous tank car release 5.0E-07 3.1E-09 8.4E-10 1.3E-09 0 4.4E-08
Continuous release large connection 5.0E-07 3.1E-09 8.4E-10 1.3E-09 0 2.2E-09
Full bore hose 3.5E-02 2.2E-06 1.5E-07 7.4E-07 5.9E-07 2.0E-08 1.5E-06 8.1E-08 Leak hose 3.5E-01 2.2E-05 3.0E-08 1.2E-05 2.9E-06 1.0E-08 1.5E-05 1.0E-06 Full bore arm 2.6E-04 1.7E-08 1.1E-09 5.6E-09 4.4E-09 1.5E-10 1.1E-08 6.1E-10 Leak arm 2.6E-03 1.7E-07 2.2E-10 8.9E-08 2.2E-08 7.6E-11 1.1E-07 7.5E-09 Fire under tank (only flammable) 1.0E-06 0 4.2E-09 4.4E-09
Instantaneous storage tank failure
5.0E-07 + 5.0E-071 5.0E-07 5.0E-07
Reference List Committee for the Prevention of Disasters. Guidelines for quantitative risk assessment ("Purple Book"). CPR 18E. 1999. The Hague, Netherlands, Sdu Uitgevers. TNO. LPG, A Study, A comparative analysis of the risks inherent in the storage, transshipment, transport and use of LPG and motor spirit, 10 Main Report LPG. 1983. Apeldoorn, Netherlands, TNO.
1 5.0E-07/year for instantaneous release including BLEVE, and 5.0E-07 /year for release of total contents in 10 mins.

Annex E – Safety assessment of ammonia as a transport fuel - Consequence assessment of accident scenarios
46 Risø-R-1504(EN)
Author: Nijs Jan Duijm Title: Safety assessment of ammonia as a transport fuel - Annex E - Consequence assessment of accident scenarios Department: System Analysis Department
Risø-R-ACCEPT_E(EN) February 2005
ISSN 0106-2840 ISBN ISBN 87-550-3415-2 (main report)
Contract no.: EU-FP5 contract ENK6-CT-2001-00580 (“ACCEPT”) Group's own reg. no.: PSP 1225070
Sponsorship:
Cover :
Pages: Tables: References:
Abstract: This annex contains a description of consequence models for the calculation of the effects of releases of Ammonia, LPG (propane), gasoline (petrol), methanol, and (pressurised) hydrogen. Calculations of effect distances for selected accident scenarios covering accidents with private cars, fuel road tankers and at refuelling stations are provided.
Risø National Laboratory Information Service Department P.O.Box 49 DK-4000 Roskilde Denmark Telephone +45 46774004 [email protected] Fax +45 46774013 www.risoe.dk
Contents
Preface 4
1 Consequence models 5 1.1 Outflow models 5 1.1.1 “RELIEF” model 5 1.1.2 Vapour outflow 5 1.1.3 Liquid outflow 5 1.1.4 Pool evaporation 6 1.1.5 Instantaneous release - ACE 6 1.2 Dispersion models 6 1.3 Fires and explosion 7 1.3.1 Fireball – BLEVE 7 1.3.2 Flash fire 7 1.3.3 Pool fire 7 1.3.4 Vapour Cloud Explosion (VCE) 8 1.4 Damage models 8 1.4.1 Toxicity 8 1.4.2 Heat radiation 8 1.4.3 Flash fire 9 1.4.4 Explosion 9
2 Results of consequence analysis - Vehicles 11 2.1 Vehicle accidents with ammonia 11 2.1.1 Consequences for complete rupture 11 2.1.2 Pressurised liquid release from a 6 mm rupture 13 2.1.3 Pressurised liquid release from a 2 mm rupture 13 2.1.4 Small vapour release 14 2.2 Vehicle accidents with LPG 15 2.2.1 Consequences for complete rupture of LPG tank 15 2.2.2 BLEVE of LPG car tank 16 2.2.3 Liquid release through a 6 mm diameter tube 17 2.2.4 High-pressure vapour release from a 6 mm diameter tube 17 2.2.5 Low-pressure vapour release from a 6 mm tube 18 2.3 Vehicle accidents with gasoline 19 2.3.1 Gasoline tank BLEVE 19 2.3.2 Pool evaporation of gasoline from a ruptured tank 19 2.3.3 Gasoline pool fire 20 2.4 Vehicle accidents with methanol 20 2.4.1 Methanol tank BLEVE 21 2.4.2 Pool evaporation of methanol from a ruptured tank 21 2.4.3 Methanol pool fire 22 2.5 Vehicle accidents with hydrogen 22
3 Results of consequence analysis – road transport of fuels 25 3.1 Transport of ammonia 25 3.2 Transport of LPG 29 3.3 Transport of gasoline 30
Risø-R-1504(EN) Annex E 3

Preface This annex to report “Safety assessment of ammonia as a transport fuel” Risø-R-1504(EN) describes in detail the background of the consequence analysis for the safety assessments in the main report.
The consequence models used are described in chapter 1. The calculations for the releases from vehicles, road transport of fuel and releases from refuelling stations are described in chapters 2 to 4, respectively.
4 Risø-R-1504(EN) Annex E
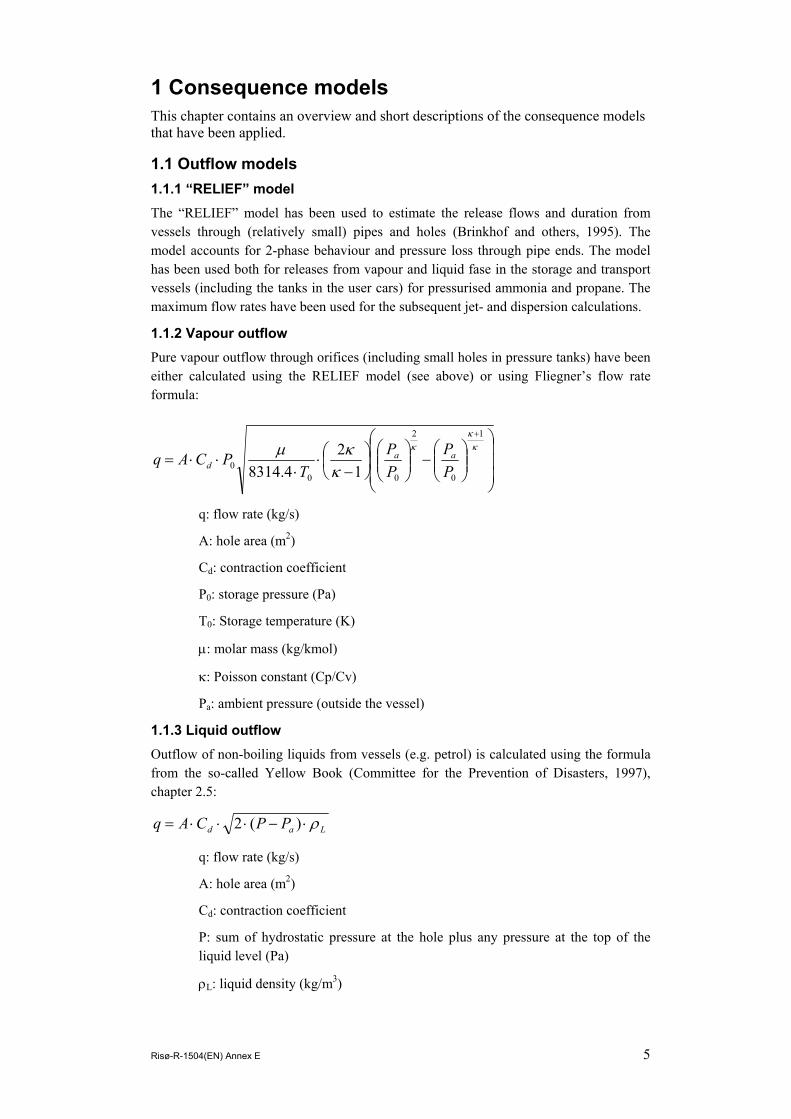
1 Consequence models This chapter contains an overview and short descriptions of the consequence models that have been applied.
1.1 Outflow models 1.1.1 “RELIEF” model The “RELIEF” model has been used to estimate the release flows and duration from vessels through (relatively small) pipes and holes (Brinkhof and others, 1995). The model accounts for 2-phase behaviour and pressure loss through pipe ends. The model has been used both for releases from vapour and liquid fase in the storage and transport vessels (including the tanks in the user cars) for pressurised ammonia and propane. The maximum flow rates have been used for the subsequent jet- and dispersion calculations.
1.1.2 Vapour outflow Pure vapour outflow through orifices (including small holes in pressure tanks) have been either calculated using the RELIEF model (see above) or using Fliegner’s flow rate formula:
−
−⋅
⋅⋅⋅=
+κ
κκ
κκµ
1
0
2
000 1
24.8314 P
PPP
TPCAq aa
d
q: flow rate (kg/s)
A: hole area (m2)
Cd: contraction coefficient
P0: storage pressure (Pa)
T0: Storage temperature (K)
µ: molar mass (kg/kmol)
κ: Poisson constant (Cp/Cv)
Pa: ambient pressure (outside the vessel)
1.1.3 Liquid outflow Outflow of non-boiling liquids from vessels (e.g. petrol) is calculated using the formula from the so-called Yellow Book (Committee for the Prevention of Disasters, 1997), chapter 2.5:
Lad PPCAq ρ⋅−⋅⋅⋅= )(2
q: flow rate (kg/s)
A: hole area (m2)
Cd: contraction coefficient
P: sum of hydrostatic pressure at the hole plus any pressure at the top of the liquid level (Pa)
ρL: liquid density (kg/m3)
Risø-R-1504(EN) Annex E 5

Pa: ambient pressure (outside the vessel)
1.1.4 Pool evaporation Evaporation of liquids (such as petrol) from the surface is performed using the models provided by the Yellow Book , chapter 3.5. In the case of the release of pressurised gases (such as pressurised ammonia and propane), part of the release may form a pool, with subsequent evaporation.
1.1.5 Instantaneous release - ACE If a pressurised vessel instantaneously fails, the pressurised contents are depressurised rapidly. The phenomena during depressurisation are very complex and have been subject to various small- and medium scale experiments. The approach used here is the ACE-model (Airborne Concentration Estimate) (Deaves and others, 2001) and (Gilham and others, 1999) up to the end of the explosive growth state. From that point onwards, the SLaM model (Shallow Layer Model) is used to estimate the turbulent expansion, dispersion and drift by the wind (Ott and Nielsen, 1996). The SLaM model takes the following cloud conditions at the end of the explosive growth state from the ACE model as input:
− Asymptotic cloud volume at the end of the explosive growth phase;
− Cloud radius at the end of the explosive growth phase;
− Turbulence intensity in the cloud at the end of the explosive growth phase (which is typically between 25 and 35 m/s)
1.2 Dispersion models Jet releases from relatively small holes (punctures and ruptured pipes) are calculated using the jet/plume model of the GreAT package (Ott, 1999). The model produces short time-averaged concentration predictions.
For instantaneous releases from ruptured pressurised tanks, the shallow layer model SLAM has been used , with the results of the ACE model as input for the initial cloud (see above).
Plumes drifting with the wind do not affect the whole surroundings, only the sector to which the wind will blow the cloud. This is included in the risk calculations as the conditional probability of being in the affected sector. The conditional risk is then α/2π.
Sector angle α
The consequence calculations are performed for weather conditions D2 (neutral stability, 2 m/s wind speed at 10 m height), unless conditions at D5 (5 m/s wind speed) produced longer effect distances (for instantaneous releases, higher wind speeds tend to carry the hazardous concentrations further away)
6 Risø-R-1504(EN) Annex E

1.3 Fires and explosion
1.3.1 Fireball – BLEVE Fireballs, often described as a BLEVE (Boiling Liquid Expanding Vapour Explosion) occur when tanks with liquid-pressurised gasses instantaneously rupture and when the flammable material is ignited immediately. The explosive flashing causes intensive mixing of the material with air, supporting the burning rate. The hot, burning material rises in the air, carrying with it still cold droplets (the flashing causes the material to cool to the boiling point). Propane and butane and similar hydrocarbons cause fireballs with intense radiation. Though the initial rupture initiates shockwaves that can cause damage, the main hazard of hydrocarbon fireballs is the intense heat radiation.
The calculation of fireball, its size, rise and radiation impact are calculated using the model described in the Yellow Book, chapter 6. Some of the iterative expressions to estimate atmospheric transmissivity of radiation (depending on humidity and carbon-dioxide concentration) are simplified to allow the calculation to be performed by a simple spreadsheet.
1.3.2 Flash fire Flash fires occur when flammable gas is mixed with air before it is ignited (delayed ignition). In 60% of the cases with delayed ignition, there will be no pressure effects (Committee for the Prevention of Disasters, 1999). Burning will pass through the premixed cloud with a fast flame-front velocity. The area (volume) affected by the flash fire is estimated to correspond to half of the lower flammability level (LFL) of the gas as predicted by a dispersion calculation. The factor one-half is chosen to account for 1) that dispersion models do not explicitly estimate concentration fluctuations, i.e. ignitable “pockets” of gas can exist outside the calculated LFL contour, and 2) during mixing, the cloud will expand due to the temperature rise (a factor of 2 in concentration corresponds to a double volume, i.e. a temperature rise of the flammable part of the cloud to 300 degree C on average).
Flash fires can develop into vapour cloud explosions (VCE). The overpressures caused by the burning depend on the flame speed in the cloud. The flame speed is increased by turbulence in the cloud and the obstruction of the expansion by obstacles. Flammable clouds over open, flat grounds develop seldom into a VCE.
For the ignition probability, a probability of 50% in one minute and longer is taken, which is thought to be relevant for traffic situations, see the Purple book, . For clouds passing in short times, the following expression is applied:
)1( 120/tignitiondelayed eP −−=
with t the time of the cloud to be diluted below ½LFL in seconds.
1.3.3 Pool fire Fires for non-boiling liquids, either bunded or with free boundaries, are called pool fires. If the liquids are “simple” substances, like pentane, heptane, etc., the formation of toxic combustion products can be ignored and the main hazard is the heat radiation. Heat radiation is predicted using a model described in (Rew and Hulbert, 1996), again slightly simplified to allow the use of a simple spreadsheet.
Risø-R-1504(EN) Annex E 7

1.3.4 Vapour Cloud Explosion (VCE) The overpressure caused by vapour cloud explosions (from methane, propane or hydrogen releases) depends on the combustion energy in the cloud and the obstruction by obstacles around the ignition point. The most appropriate model is the Multi-Energy Model as described in the Yellow Book, chapter 5 . According to the Purple Book , 40% of delayed ignitions cause explosions. The overpressure effects depend on the obstruction. We assume that only one third of the cloud will be in an obstructed region that will lead to the strongest overpressure effects (blast strength 10 in the Multi-Energy Model), and that this region will be at two thirds of the maximum downwind distance to ½LFL. This can be justified by the fact that the road will be an unobstructed area for the relatively small cloud around a (passenger) vehicle, and that the transport routes to refuelling stations are likely to be rural, open roads. Only if fatality distances are larger than one third of the maximum downwind distance to ½LFL, the explosion effects will be larger than the effects of the flash fire.
1.4 Damage models 1.4.1 Toxicity The toxic impact of ammonia is modelled using a Probit function. For a description of the Probit function see , (Committee for the Prevention of Disasters, 1992), (Lees, 1996). The Probit function is directly related to the fraction of the population that will be fatally injured. A Probit outcome of 5 corresponds to 50% fatality (cf. LC50). The Probit function applied in this project for ammonia is , (Arts and others, 2000):
)ln(5.16Pr 2tC+−=
Where C is the concentration (in ppm) and t is the time of exposure (in min.). Following a study on the effect on short duration exposure and the effect of fluctuating concentrations it was recommended to use as a minimum exposure duration in this Probit expression 1 min. That means that even if the exposure to the toxic concentration in the passing cloud is less than 1 min., then 1 min. is still used in the expression (As the time of passage of the ammonia cloud from a ruptured tank in a passenger car is only about 20 s, the results are expected to be conservative).
1.4.2 Heat radiation Likewise toxicity, the impact of radiation on people is predicted using a Probit function. The Probit function used is,
)ln(56.238.36Pr 3/4 tqrad ⋅+−=
Here qrad is the radiative heat flux (W/m2) and t the exposure time (s). Radiative heat fluxes over 35 kW/m2 are supposed to be fatal irrespective of the exposure duration. For the exposure time a maximum of 20 s is used to reflect that people can escape from the fire . (It can be questioned whether we should account for the fact that on an accident scene, some injured people cannot escape). The actual duration of e.g. a BLEVE from a vehicle LPG tank is some 2 s.
Heat radiation less than 12.5 kW/m2 is not expected to be fatal, as people will have the possibility to escape from the fire.
8 Risø-R-1504(EN) Annex E
1.4.3 Flash fire
All people that are present in the cloud at the moment of the flash fire are expected to die. The boundaries for the flash fire are the ½LFL (LFL = Lower Flammability Level) concentration limits of the cloud. ½LFL instead of LFL is used corresponding to current practice to account for concentration fluctuations not predicted by the (time) averaged dispersion models and for the fact that the gas cloud will expand when burning.
1.4.4 Explosion Pressure effects on people outdoors can cause fatal injury by lung damage, impact of the head or impact of the whole body (ear damage can also be caused, but this will not be fatal, and this will be ignored in this study). Probit functions for these injury types are proposed in the Green Book , depending on the overpressure and impulse from the pressure wave. It is noted that the criterion of fatality at peak pressures over 0.3 barg according to the gives larger consequence distances than these Probit functions.
Risø-R-1504(EN) Annex E 9

10 Risø-R-1504(EN) Annex E
2 Results of consequence analysis - Vehicles
2.1 Vehicle accidents with ammonia The following Table 1 shows the different types of ammonia releases. Scenario Release rate Release
duration 10% fatality
distance Complete rupture of fuel tank due to accident or overfilling
53 kg total, 18 kg instantaneously in the air
instantaneous emission followed by pool evaporation
19 m
Release through the 6 mm diameter fill line due to accident
0.27 kg/s, total mass released 50 kg
decrease after 150 s, total duration 230 s
17 m
Release through 2 mm diameter connection between tank and evaporator. This includes rupture of the line between evaporator and reformer and failure of the evaporator
0.03 kg/s, total mass released 50 kg without intervention
Release rate is reduced to 10% after 2000 s
3.7 m
Small hole (1 mm diameter) in the vapour line between evaporator and reformer
0.003 kg/s > 1 hour without intervention
0.3 m
Table 1 Overview of release scenarios for ammonia-powered vehicles
2.1.1 Consequences for complete rupture The consequence assessment is based on a100 l tank filled to 78% by volume, which corresponds to a total content of 53 kg ammonia. A complete rupture will cause a part of the contents to flash from liquid to vapour. This amounts to about 15% of the tank’s contents. The explosive expansion will force droplets at boiling temperature to be entrained in the vapour cloud while others are pressed to the ground and other fixed obstacles. The total mass remaining airborne is estimated to be almost 19 kg, the rest will form a cold evaporating liquid pool below the ruptured tank.
The initial cloud formed by the explosive expansion is estimated to be a semi-sphere of about 9 m3 and a diameter of 5 m. From here, a dispersion model calculates entrainment of air, slumping and movement with the wind. Figure 1 shows the concentration decay (the maximum concentration observed at positions on the cloud centreline while moving) and the corresponding expected fatality rate for unprotected persons at those positions. At the lowest wind speed, the cloud passes the position at 40 m downwind within 60 s, and the fatality rate is based on the maximum concentration in combination with a 1 min. exposure time. The actual dose (integrated value of concentration over time) is less this assumed exposure, providing a conservative (safe) estimate of fatality. The violent mixing during the expansion causes the cloud to be mixed to concentrations almost below the 100% fatality level.
Risø-R-1504(EN) Annex E 11

1000
10000
100000
1000000
0 5 10 15 20 25 30 35
Distance (m)
Con
cent
ratio
n (p
pm)
0.0%
20.0%
40.0%
60.0%
80.0%
100.0%
Conc. 2 m/s Conc. 5 m/s
Fatality 2 m/s Fatality 5 m/s
Figure 1 Maximum concentration and fatality rate after an instantaneous release of ammonia from a vehicle tank at 2 and 5 m/s wind speed. This assessment only includes the initial cloud.
1000
10000
100000
1000000
0 10 20 30 40 50
Distance (m)
Con
cent
ratio
n (p
pm)
0%
20%
40%
60%
80%
100%
Mor
talit
y
Concentration Mortality
Figure 2 Results of the dispersion calculations of the ammonia evaporating from the ground pool after an instantaneous rupture of the vehicle tank at 2m/s wind speed.
The remaining liquid will rapidly (in about 1 s) spread out to its final size of 9 m2 on the ground. From this ammonia will evaporate, starting at a relatively high evaporation rate of about 1kg/s over the first few seconds. This evaporation will decrease due to the cooling of the ground, after 1 min., the evaporation rate is about 0.2 kg/s. It will take 3 minutes for all the ammonia to be evaporated from the ground.
The ammonia that evaporates from the ground is, even at its boiling point, lighter than air and will raise upwards (in contrast to two-phase mixed jets of ammonia, that become dense due to the cold air). Dispersion calculations have been performed, using the evaporation averaged over the first minute. Fatality calculations assume a 2 min exposure. It turns out that the ammonia from the pool causes the largest fatality distances in this case, see Figure 2.
12 Risø-R-1504(EN) Annex E

2.1.2 Pressurised liquid release from a 6 mm rupture This scenario arises from the possibility of a failure of the tubing to fill the tank, while the systems to shut off the flow to the tube also fail. The assumption is that in that case the total content of the tank is released through the rupture, driven by the internal pressure of the tank. It is assumed that the outflow will be as liquid being the worst case. As the filling tube is connected to the top of the tank, this means we assume that the car is overturned. In the course of the release, the pressure will drop. The outflow rate as a function of time (result from the RELIEF model) is shown in Figure 3.
Ammonia Liquid Release 6 mm hole(RELIEF model)
00.050.1
0.150.2
0.250.3
0 100 200 300 400
Time (s)
Flow
rate
(kg/
s)
100 l tank, 80% fill level
Figure 3 Outflow as function of time for a 6 mm rupture and liquid outflow.
1000
10000
100000
1000000
0 10 20 30 40
Distance (m)
Con
cent
ratio
n (p
pm)
0%
20%
40%
60%
80%
100%Fa
talit
yConcentration Fatality
6 mm hole
Figure 4 Result for dispersion calculations for a release of liquefied ammonia through a 6 mm hole at 2 m/s wind speed.
The dispersion calculations are shown in Figure 4.
2.1.3 Pressurised liquid release from a 2 mm rupture This scenario is representative for all ruptures in the connection between the tank and the reformer. As the tubing between the tank and the vaporiser is thought to be a thin 2 mm tube, the flow through this tube will restrict the flow in all cases. Conditions are similar as for the 6 mm rupture. In normal (upright) position the tube takes liquid ammonia from the bottom of the tank. Results are shown in Figure 5.
Risø-R-1504(EN) Annex E 13

1000
10000
100000
1000000
0 2 4 6 8 10Distance (m)
Con
cent
ratio
n (p
pm)
0%
20%
40%
60%
80%
100%
Fata
lity/
Ris
k
Concentration Fatality
Figure 5 Results of dispersion calculations for a liquid ammonia release through a 2 mm hole at 2 m/s wind speed.
2.1.4 Small vapour release This scenario represents a small (1 mm) puncture of the low-pressure part of the connection between the vaporiser and the reformer. In this case ammonia vapour will be released (which is a buoyant, lighter-than-air gas), see Figure 6
1000
10000
100000
1000000
0 0.5 1 1.5 2
Distance (m)
Con
cent
ratio
n (p
pm)
0%
20%
40%
60%
80%
100%
Mor
talit
y
Concentration Mortality
Figure 6 Results from dispersion calculations for an ammonia vapour release from a 1 mm hole at 1.5 barg at 2 m/s wind speed.
14 Risø-R-1504(EN) Annex E

2.2 Vehicle accidents with LPG Scenario Release rate Release
duration 10% fatality
distance Complete rupture of fuel tank due to accident or overfilling, followed by flash fire or vapour cloud explosion
23 kg total, 15,7 kg instantaneously in the air
Instantaneous emission followed by pool evaporation. Cloud passes in ca 10 s.
30 m
BLEVE of the tank 23 kg Fireball duration 2 s
13.7 m
Liquid release through a 6 mm diameter tube due to accident
0.25 kg/s, total mass released 23 kg
90 s 18.9 m
Vapour release from a 6 mm diameter tube due to accident
0.04 kg/s, total mass released 23 kg without intervention
Ca. 10 min. (without intervention)
8.8 m
Low pressure vapour release from a 6 mm tube
0.008 kg/s, total mass released 23 kg without intervention
Ca 45 min. (without intervention)
3.2 m
Table 2 Overview of release scenarios for LPG-powered vehicles
2.2.1 Consequences for complete rupture of LPG tank This consequence assessment is very similar to the one presented for ammonia in section 2.1.1, except that the damage will be caused by the possible combustion of LPG (flash fire) in stead of toxic impact. The assessment is based on a 56 l tank filled to 80% by volume, which corresponds to a total content of 23 kg propane (propane is used to represent LPG). A complete rupture will cause a part of the contents to flash from liquid to vapour. This amounts to about 26% of the tank’s contents. The explosive expansion will force droplets at boiling temperature to be entrained in the vapour cloud while others are pressed to the ground and other fixed obstacles. The total mass remaining airborne is estimated to be almost 16 kg; the rest will form a cold evaporating liquid pool below the ruptured tank.
The initial cloud formed by the explosive expansion is estimated to be a semi-sphere of about 3 m3 and a diameter of 4 m. From here, a dispersion model calculates entrainment of air, slumping and movement with the wind. Figure 7 shows the concentration decay (the maximum concentration observed at positions on the cloud centreline while moving) and the corresponding expected fatality rate for unprotected persons, which is 10% (being the chance of ignition for a cloud passing within ca 10 s) in the cloud where concentration is over ½LFL.
An explosion can cause fatalities within a radius of 6 m from the centre of the explosion. with reference to the assumptions explained in section 1.3.4, this means that this will not increase the individual risk as compared to the flash fire.
The remaining liquid will rapidly (in about 1 s) spread out to its final size of 2.5 m2 on the ground. From this LPG will evaporate, starting at a relatively high evaporation rate of about 2 kg/s over 5 seconds. After this, the just over 7 kg of LPG on the ground will be evaporated. As this is a fast process, the release is almost instantaneous, and it appears, that the calculations with the instantaneous release model predicts lower concentrations than the continuous model, which would produce less reliable results in this case, see Figure 8
Risø-R-1504(EN) Annex E 15
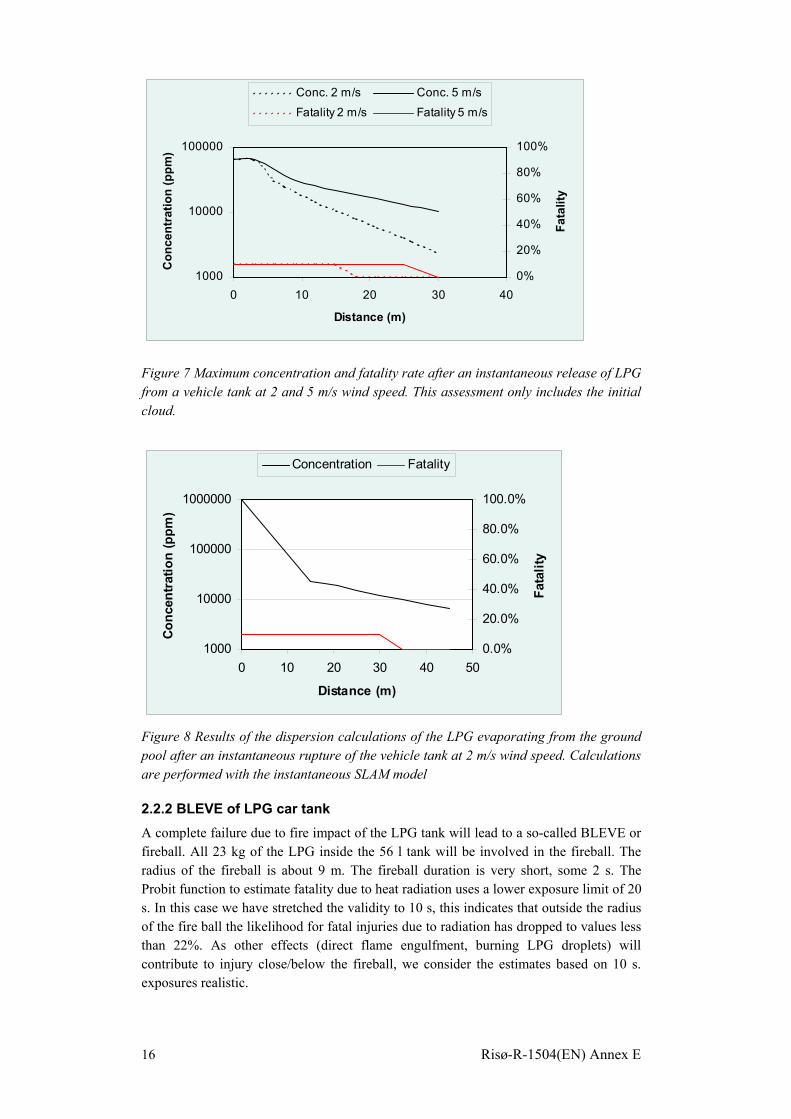
1000
10000
100000
0 10 20 30 40
Distance (m)
Con
cent
ratio
n (p
pm)
0%
20%
40%
60%
80%
100%
Fata
lity
Conc. 2 m/s Conc. 5 m/s
Fatality 2 m/s Fatality 5 m/s
Figure 7 Maximum concentration and fatality rate after an instantaneous release of LPG from a vehicle tank at 2 and 5 m/s wind speed. This assessment only includes the initial cloud.
1000
10000
100000
1000000
0 10 20 30 40 50
Distance (m)
Conc
entr
atio
n (p
pm)
0.0%
20.0%
40.0%
60.0%
80.0%
100.0%
Fata
lity
Concentration Fatality
Figure 8 Results of the dispersion calculations of the LPG evaporating from the ground pool after an instantaneous rupture of the vehicle tank at 2 m/s wind speed. Calculations are performed with the instantaneous SLAM model
2.2.2 BLEVE of LPG car tank A complete failure due to fire impact of the LPG tank will lead to a so-called BLEVE or fireball. All 23 kg of the LPG inside the 56 l tank will be involved in the fireball. The radius of the fireball is about 9 m. The fireball duration is very short, some 2 s. The Probit function to estimate fatality due to heat radiation uses a lower exposure limit of 20 s. In this case we have stretched the validity to 10 s, this indicates that outside the radius of the fire ball the likelihood for fatal injuries due to radiation has dropped to values less than 22%. As other effects (direct flame engulfment, burning LPG droplets) will contribute to injury close/below the fireball, we consider the estimates based on 10 s. exposures realistic.
16 Risø-R-1504(EN) Annex E
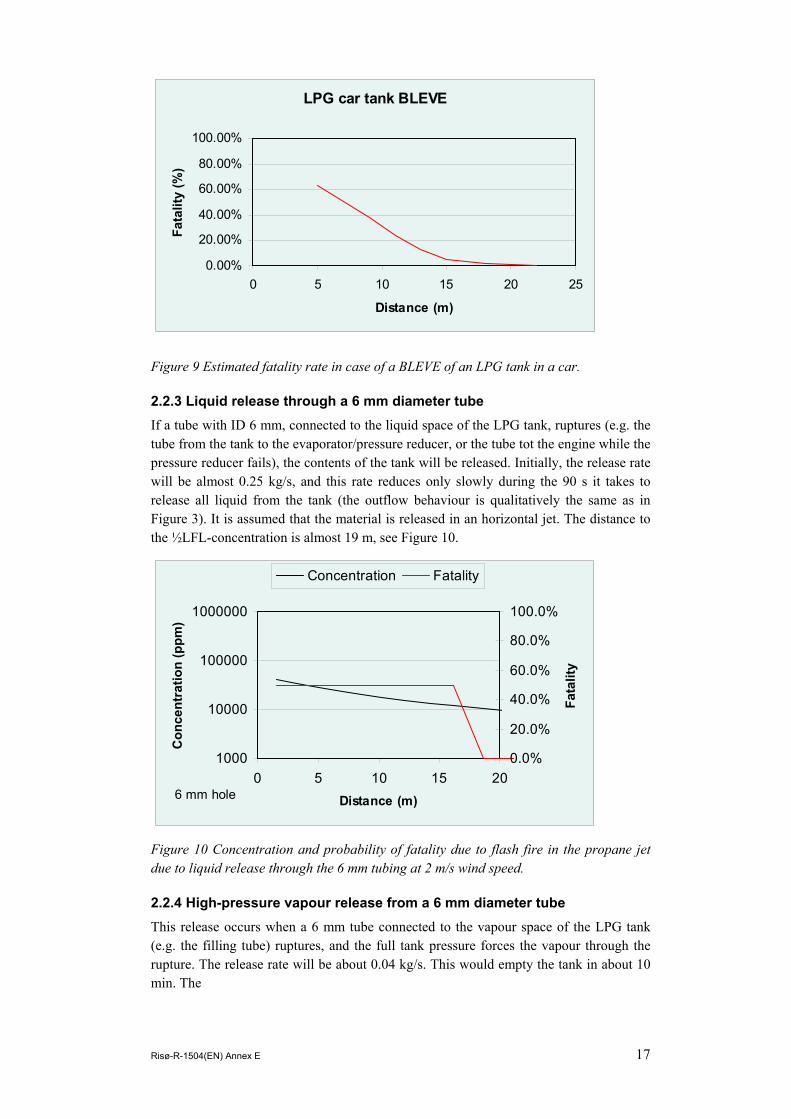
LPG car tank BLEVE
0.00%
20.00%
40.00%
60.00%
80.00%
100.00%
0 5 10 15 20 25
Distance (m)
Fata
lity
(%)
Figure 9 Estimated fatality rate in case of a BLEVE of an LPG tank in a car.
2.2.3 Liquid release through a 6 mm diameter tube If a tube with ID 6 mm, connected to the liquid space of the LPG tank, ruptures (e.g. the tube from the tank to the evaporator/pressure reducer, or the tube tot the engine while the pressure reducer fails), the contents of the tank will be released. Initially, the release rate will be almost 0.25 kg/s, and this rate reduces only slowly during the 90 s it takes to release all liquid from the tank (the outflow behaviour is qualitatively the same as in Figure 3). It is assumed that the material is released in an horizontal jet. The distance to the ½LFL-concentration is almost 19 m, see Figure 10.
1000
10000
100000
1000000
0 5 10 15 20Distance (m)
Con
cent
ratio
n (p
pm)
0.0%
20.0%
40.0%
60.0%
80.0%
100.0%
Fata
lity
Concentration Fatality
6 mm hole
Figure 10 Concentration and probability of fatality due to flash fire in the propane jet due to liquid release through the 6 mm tubing at 2 m/s wind speed.
2.2.4 High-pressure vapour release from a 6 mm diameter tube This release occurs when a 6 mm tube connected to the vapour space of the LPG tank (e.g. the filling tube) ruptures, and the full tank pressure forces the vapour through the rupture. The release rate will be about 0.04 kg/s. This would empty the tank in about 10 min. The
Risø-R-1504(EN) Annex E 17
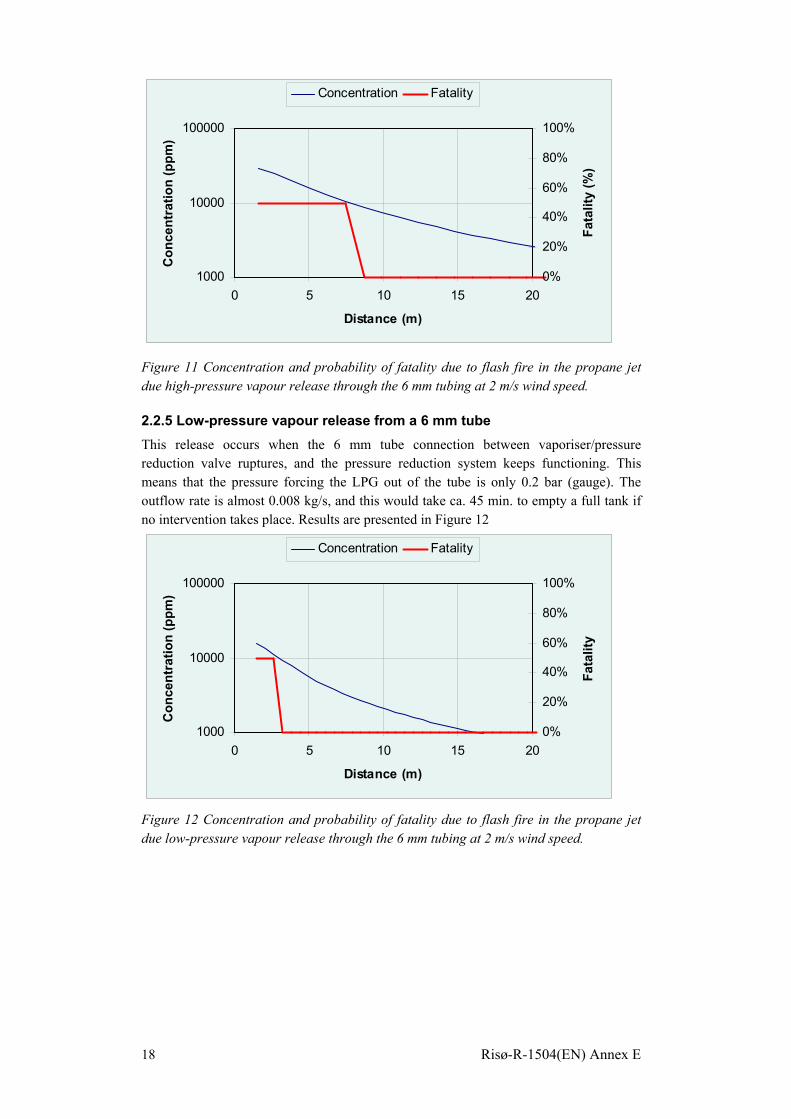
1000
10000
100000
0 5 10 15 20
Distance (m)
Con
cent
ratio
n (p
pm)
0%
20%
40%
60%
80%
100%
Fata
lity
(%)
Concentration Fatality
Figure 11 Concentration and probability of fatality due to flash fire in the propane jet due high-pressure vapour release through the 6 mm tubing at 2 m/s wind speed.
2.2.5 Low-pressure vapour release from a 6 mm tube This release occurs when the 6 mm tube connection between vaporiser/pressure reduction valve ruptures, and the pressure reduction system keeps functioning. This means that the pressure forcing the LPG out of the tube is only 0.2 bar (gauge). The outflow rate is almost 0.008 kg/s, and this would take ca. 45 min. to empty a full tank if no intervention takes place. Results are presented in Figure 12
1000
10000
100000
0 5 10 15 20
Distance (m)
Con
cent
ratio
n (p
pm)
0%
20%
40%
60%
80%
100%Fa
talit
y
Concentration Fatality
Figure 12 Concentration and probability of fatality due to flash fire in the propane jet due low-pressure vapour release through the 6 mm tubing at 2 m/s wind speed.
18 Risø-R-1504(EN) Annex E
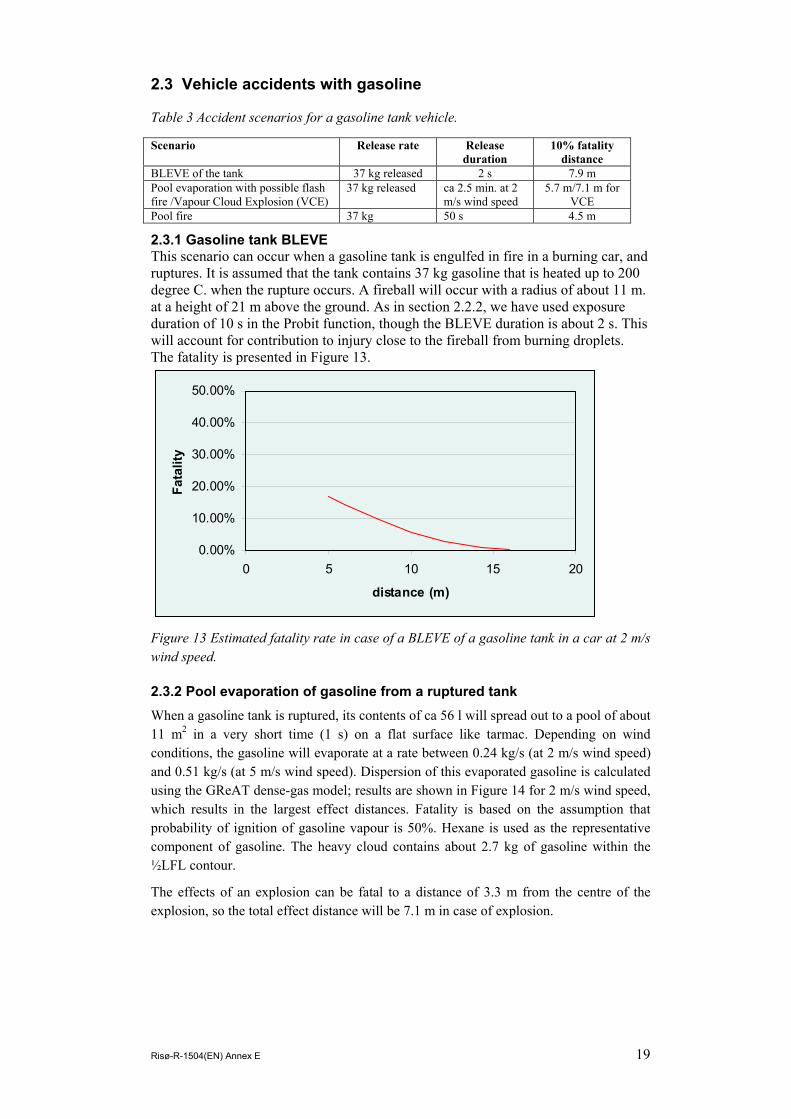
2.3 Vehicle accidents with gasoline
Table 3 Accident scenarios for a gasoline tank vehicle.
Scenario Release rate Release duration
10% fatality distance
BLEVE of the tank 37 kg released 2 s 7.9 m Pool evaporation with possible flash fire /Vapour Cloud Explosion (VCE)
37 kg released ca 2.5 min. at 2 m/s wind speed
5.7 m/7.1 m for VCE
Pool fire 37 kg 50 s 4.5 m
2.3.1 Gasoline tank BLEVE This scenario can occur when a gasoline tank is engulfed in fire in a burning car, and ruptures. It is assumed that the tank contains 37 kg gasoline that is heated up to 200 degree C. when the rupture occurs. A fireball will occur with a radius of about 11 m. at a height of 21 m above the ground. As in section 2.2.2, we have used exposure duration of 10 s in the Probit function, though the BLEVE duration is about 2 s. This will account for contribution to injury close to the fireball from burning droplets. The fatality is presented in Figure 13.
0.00%
10.00%
20.00%
30.00%
40.00%
50.00%
0 5 10 15 20
distance (m)
Fata
lity
Figure 13 Estimated fatality rate in case of a BLEVE of a gasoline tank in a car at 2 m/s wind speed.
2.3.2 Pool evaporation of gasoline from a ruptured tank When a gasoline tank is ruptured, its contents of ca 56 l will spread out to a pool of about 11 m2 in a very short time (1 s) on a flat surface like tarmac. Depending on wind conditions, the gasoline will evaporate at a rate between 0.24 kg/s (at 2 m/s wind speed) and 0.51 kg/s (at 5 m/s wind speed). Dispersion of this evaporated gasoline is calculated using the GReAT dense-gas model; results are shown in Figure 14 for 2 m/s wind speed, which results in the largest effect distances. Fatality is based on the assumption that probability of ignition of gasoline vapour is 50%. Hexane is used as the representative component of gasoline. The heavy cloud contains about 2.7 kg of gasoline within the ½LFL contour.
The effects of an explosion can be fatal to a distance of 3.3 m from the centre of the explosion, so the total effect distance will be 7.1 m in case of explosion.
Risø-R-1504(EN) Annex E 19

1000
10000
100000
1000000
0 5 10 15 20
Distance (m)
Con
cent
ratio
n (p
pm)
0.0%
20.0%
40.0%
60.0%
80.0%
100.0%
Fata
lity
Concentration Fatality
Figure 14 Dispersion of gasoline that originates from an evaporating pool at 2 m/s wind speed.
2.3.3 Gasoline pool fire Instead of an evaporating pool, the vapour immediately above the pool can be ignited, and a pool fire will occur. In this case, all gasoline will burn in less than a minute. For the injury estimates we assume exposure over 20 s; (we assume people to be able to escape from the fire in that time). The effect distance is about 4.5 m from the fire.
0
10
20
30
40
50
60
0 2 4 6 8 10
Distance from fire (m)
Inci
dent
hea
t flu
x (k
W/m
2)
0%10%20%30%40%50%60%70%80%90%100%
Fata
lity
Heat flux Fatality
Figure 15 Heat flux and fatality around a gasoline pool fire.
2.4 Vehicle accidents with methanol Table 4 Accident scenarios for a methanol tank vehicle.
Scenario Release rate Release duration
10% fatality distance
BLEVE of the tank 41 kg released 2 s 5.5 m Pool evaporation with possible flash fire and vapour cloud explosion
41 kg released ca 10 min (at 2 m/s wind speed)
4
Pool fire 41 kg
20 Risø-R-1504(EN) Annex E
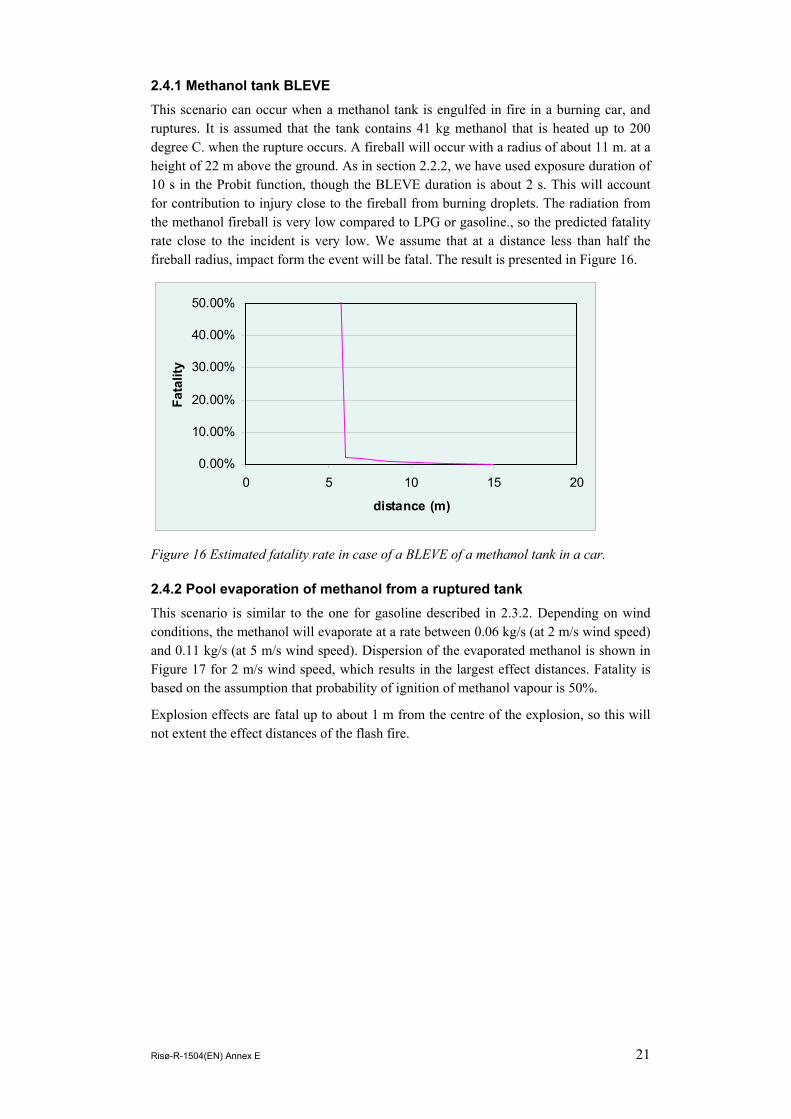
2.4.1 Methanol tank BLEVE This scenario can occur when a methanol tank is engulfed in fire in a burning car, and ruptures. It is assumed that the tank contains 41 kg methanol that is heated up to 200 degree C. when the rupture occurs. A fireball will occur with a radius of about 11 m. at a height of 22 m above the ground. As in section 2.2.2, we have used exposure duration of 10 s in the Probit function, though the BLEVE duration is about 2 s. This will account for contribution to injury close to the fireball from burning droplets. The radiation from the methanol fireball is very low compared to LPG or gasoline., so the predicted fatality rate close to the incident is very low. We assume that at a distance less than half the fireball radius, impact form the event will be fatal. The result is presented in Figure 16.
0.00%
10.00%
20.00%
30.00%
40.00%
50.00%
0 5 10 15 20
distance (m)
Fata
lity
Figure 16 Estimated fatality rate in case of a BLEVE of a methanol tank in a car.
2.4.2 Pool evaporation of methanol from a ruptured tank This scenario is similar to the one for gasoline described in 2.3.2. Depending on wind conditions, the methanol will evaporate at a rate between 0.06 kg/s (at 2 m/s wind speed) and 0.11 kg/s (at 5 m/s wind speed). Dispersion of the evaporated methanol is shown in Figure 17 for 2 m/s wind speed, which results in the largest effect distances. Fatality is based on the assumption that probability of ignition of methanol vapour is 50%.
Explosion effects are fatal up to about 1 m from the centre of the explosion, so this will not extent the effect distances of the flash fire.
Risø-R-1504(EN) Annex E 21

1000
10000
100000
1000000
0 5 10 15 20 25
Distance (m)
Con
cent
ratio
n (p
pm)
0.0%
20.0%
40.0%
60.0%
80.0%
100.0%
Fata
lity
Concentration Fatality
Figure 17 Dispersion of methanol that originates from an evaporating pool at 2 m/s wind speed.
2.4.3 Methanol pool fire This scenario is similar as the one described for gasoline in section 2.3.3. In this case, all methanol will burn in about three minutes. The pool diameter is about 3.7 m For the injury estimates we assume exposure over 20 s; (we assume people to be able to escape from the fire in that time). The effect distance is about 4.5 m, one meter outside the fire itself, see Figure 18.
05
101520253035404550
0 2 4 6 8 10
Distance from fire (m)
Inci
dent
hea
t flu
x (k
W/m
2)
0%10%20%30%40%50%60%70%80%90%100%
Fata
lity
Heat flux Fatality
Figure 18 Heat flux and fatality around a methanol pool fire
2.5 Vehicle accidents with hydrogen The scenario for comparing the use of ammonia with hydrogen is pressure storage (600 bar) at ambient temperature. A 100 l pressure vessel will contain about 5.5 kg hydrogen, which has a comparable energy content as about 40 kg of methanol and a 100 l ammonia tank.
22 Risø-R-1504(EN) Annex E

Table 5 Accident scenarios for a hydrogen-powered vehicle.
Scenario Release rate Release duration
10% fatality distance
Rupture/explosion of the tank 5.5 kg released 1 s 8 m Release through 6 mm ruptured piping followed by flash fire or explosion
0.6 kg/s over the first 5 s.
15 s (the flow is reduced to less than 10% of the
initial flow)
30
Release through 3 mm fitting followed by flash fire or explosion
0.23 kg/s over the first 5 s
40 s 20
Rupture/explosion of the tank follows only when there is a fire engulfment of the tank, longer than 10 min while the pressure relief systems have failed. A fireball will form of about 5 m radius and rise to about 15 m height. Pressure effects will be fatal to a distance of 5 m from the tank. It is difficult to estimate the heat radiation from the fireball. Hydrogen has a very low emissivity, but other substances may be ejected in the fireball. If 20% of the heat of the fireball is emitted as radiative heat, the 35 kW/m2 heat flux is exceeded up to 8 m from the tank.
Even with small holes, the amount of hydrogen that will escape is extremely large. The release rate drops quickly when the pressure inside the vessel drops. For 6 mm holes, the initial release is about 1 kg/s; averaged over the first 5 s it is about 0.6 kg/s. It will empty the tank within about 10-20 s. For a 3 mm hole (a typical size for the connection from the tank to the regulator – even a smaller piping would do), the release starts at 0.23 kg/s.
It is reported that many hydrogen releases are ignited (reference to HSL?) because of the extremely low ignition energy for hydrogen for some of its explosive range. To account for this, the likelihood of delayed ignition is doubled as compared to section 1.3.2. This is shown in Figure 19.
1000
10000
100000
1000000
0 10 20 30 40
Distance (m)
Con
cent
ratio
n (p
pm)
0%
20%
40%
60%
80%
100%M
orta
lity
Concentration 3 mm hole Concentration 6 mm holeMortality 3 mm hole Mortality 6 mm hole
Figure 19 Concentration decay and mortality for the two hydrogen jet release scenarios.
Risø-R-1504(EN) Annex E 23

24 Risø-R-1504(EN) Annex E
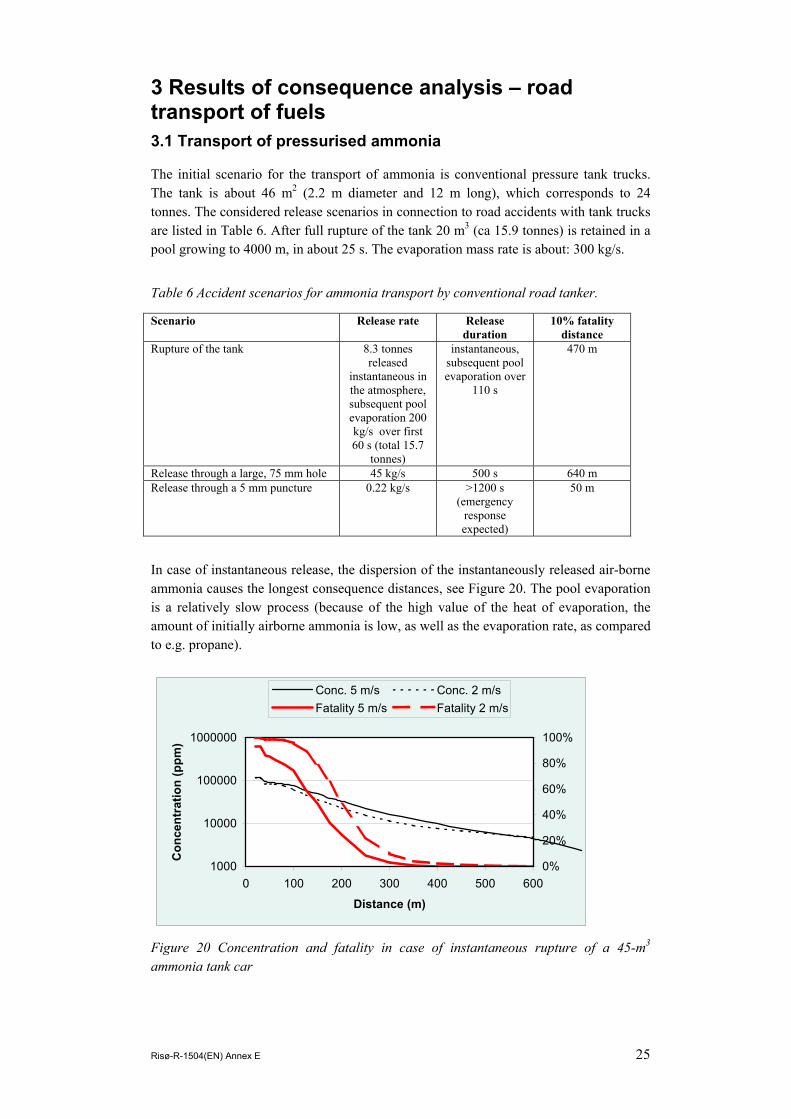
3 Results of consequence analysis – road transport of fuels 3.1 Transport of pressurised ammonia
The initial scenario for the transport of ammonia is conventional pressure tank trucks. The tank is about 46 m2 (2.2 m diameter and 12 m long), which corresponds to 24 tonnes. The considered release scenarios in connection to road accidents with tank trucks are listed in Table 6. After full rupture of the tank 20 m3 (ca 15.9 tonnes) is retained in a pool growing to 4000 m, in about 25 s. The evaporation mass rate is about: 300 kg/s.
Table 6 Accident scenarios for ammonia transport by conventional road tanker.
Scenario Release rate Release duration
10% fatality distance
Rupture of the tank 8.3 tonnes released
instantaneous in the atmosphere, subsequent pool evaporation 200 kg/s over first 60 s (total 15.7
tonnes)
instantaneous, subsequent pool evaporation over
110 s
470 m
Release through a large, 75 mm hole 45 kg/s 500 s 640 m Release through a 5 mm puncture 0.22 kg/s >1200 s
(emergency response expected)
50 m
In case of instantaneous release, the dispersion of the instantaneously released air-borne ammonia causes the longest consequence distances, see Figure 20. The pool evaporation is a relatively slow process (because of the high value of the heat of evaporation, the amount of initially airborne ammonia is low, as well as the evaporation rate, as compared to e.g. propane).
1000
10000
100000
1000000
0 100 200 300 400 500 600
Distance (m)
Con
cent
ratio
n (p
pm)
0%
20%
40%
60%
80%
100%
Conc. 5 m/s Conc. 2 m/sFatality 5 m/s Fatality 2 m/s
Figure 20 Concentration and fatality in case of instantaneous rupture of a 45-m3
ammonia tank car
Risø-R-1504(EN) Annex E 25
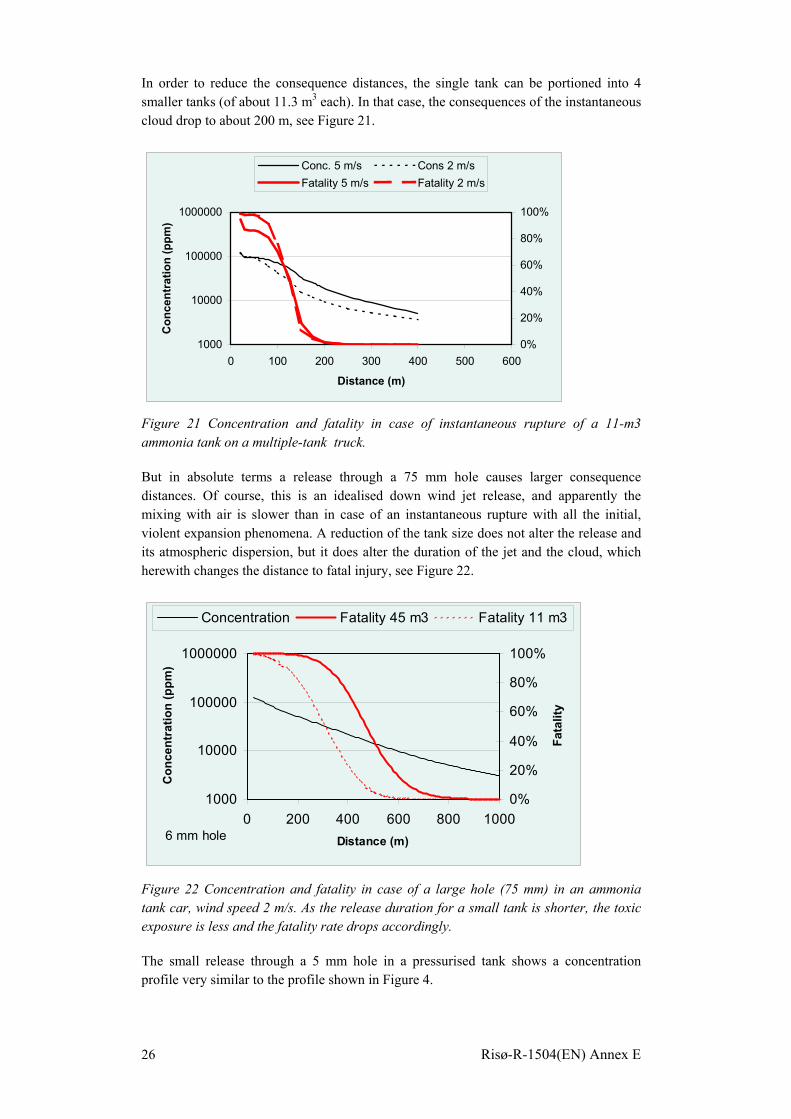
In order to reduce the consequence distances, the single tank can be portioned into 4 smaller tanks (of about 11.3 m3 each). In that case, the consequences of the instantaneous cloud drop to about 200 m, see Figure 21.
1000
10000
100000
1000000
0 100 200 300 400 500 600
Distance (m)
Con
cent
ratio
n (p
pm)
0%
20%
40%
60%
80%
100%
Conc. 5 m/s Cons 2 m/sFatality 5 m/s Fatality 2 m/s
Figure 21 Concentration and fatality in case of instantaneous rupture of a 11-m3 ammonia tank on a multiple-tank truck.
But in absolute terms a release through a 75 mm hole causes larger consequence distances. Of course, this is an idealised down wind jet release, and apparently the mixing with air is slower than in case of an instantaneous rupture with all the initial, violent expansion phenomena. A reduction of the tank size does not alter the release and its atmospheric dispersion, but it does alter the duration of the jet and the cloud, which herewith changes the distance to fatal injury, see Figure 22.
1000
10000
100000
1000000
0 200 400 600 800 1000Distance (m)
Con
cent
ratio
n (p
pm)
0%
20%
40%
60%
80%
100%
Fata
lity
Concentration Fatality 45 m3 Fatality 11 m3
6 mm hole
Figure 22 Concentration and fatality in case of a large hole (75 mm) in an ammonia tank car, wind speed 2 m/s. As the release duration for a small tank is shorter, the toxic exposure is less and the fatality rate drops accordingly.
The small release through a 5 mm hole in a pressurised tank shows a concentration profile very similar to the profile shown in Figure 4.
26 Risø-R-1504(EN) Annex E

3.2 Transport of refrigerated ammonia Instead of transporting ammonia in pressure-liquefied form, it is also possible to transport it in cryogenic or refrigerated-liquefied form at ambient pressure. This has the advantage, that in case of a loss of containment, there is no sudden flashing of the pressurised vapour, and outflow through is only driven by hydrostatic pressure.
In case of ammonia, it means that releases result in boiling pools on the ground. The ammonia from boiling pools is lighter than air, and these plumes will rise. This is demonstrated in the three plume cross sections in Figure 24, which show the dispersion of ammonia from the pool which occurs after a complete rupture of one of the four 11-m3 tanks of the truck. The highest concentrations occur with high wind speeds of ca. 10 m/s (wind speeds over 6 m/s typically occur in 30% of the time in Western European coastal areas, and lesser in in-land areas).
A comparison of the consequences of dispersion from an instantaneous boiling pool (evaporation rate ca. 125 kg/s over ca 1 min, see Figure 24) and evaporation from a the pool following outflow through a large hole (75 mm) (22 kg/s over ca 5 mins.), shows, that the consequence distances are largest in the latter case, both because the total buoyancy flux is lower (less plume rise) and the exposure duration is longer, see Figure 23.
1000
10000
100000
1000000
0 100 200 300 400Distance (m)
Con
cent
ratio
n (p
pm)
0%
20%
40%
60%
80%
100%
Fata
lity
Conc 5 m/s Conc 10 m/sFatality 5 m/s Fatality 10 m/s
Figure 23 Concentration (at ground level) and fatality following outflow of refrigerated ammonia from a 75 mm hole in a 11-m3 tank
The release scenarios for the refrigerated transport are listed in Table 7.
Table 7 Accident scenarios for ammonia transport by a refrigerated road tanker with 4 11-m3 tanks
Scenario Release rate Release duration
10% fatality distance
Rupture of the tank Evaporation rate 125 kg/s
Pool evaporation over 60 s
133 m
Release through a large, 75 mm hole 22 kg/s 310 s 208 m Release through a 5 mm puncture 0.1 kg/s >1200 s
(emergency response expected)
17 m
Risø-R-1504(EN) Annex E 27

Figure 24 Plume rise of refrigerated ammonia evaporating from a boiling pool at wind speeds of 2, 5, and 10 m/s, respectively.
28 Risø-R-1504(EN) Annex E
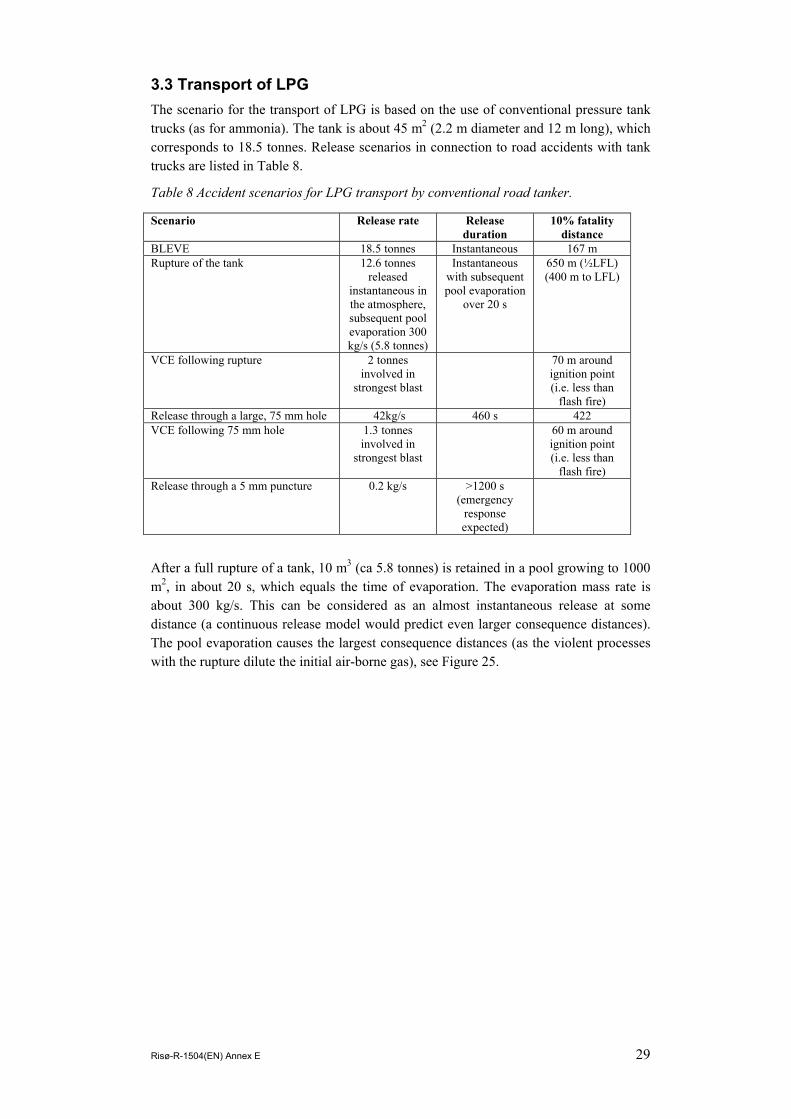
3.3 Transport of LPG The scenario for the transport of LPG is based on the use of conventional pressure tank trucks (as for ammonia). The tank is about 45 m2 (2.2 m diameter and 12 m long), which corresponds to 18.5 tonnes. Release scenarios in connection to road accidents with tank trucks are listed in Table 8.
Table 8 Accident scenarios for LPG transport by conventional road tanker.
Scenario Release rate Release duration
10% fatality distance
BLEVE 18.5 tonnes Instantaneous 167 m Rupture of the tank 12.6 tonnes
released instantaneous in the atmosphere, subsequent pool evaporation 300 kg/s (5.8 tonnes)
Instantaneous with subsequent pool evaporation
over 20 s
650 m (½LFL) (400 m to LFL)
VCE following rupture 2 tonnes involved in
strongest blast
70 m around ignition point (i.e. less than
flash fire) Release through a large, 75 mm hole 42kg/s 460 s 422 VCE following 75 mm hole 1.3 tonnes
involved in strongest blast
60 m around ignition point (i.e. less than
flash fire) Release through a 5 mm puncture 0.2 kg/s >1200 s
(emergency response expected)
After a full rupture of a tank, 10 m3 (ca 5.8 tonnes) is retained in a pool growing to 1000 m2, in about 20 s, which equals the time of evaporation. The evaporation mass rate is about 300 kg/s. This can be considered as an almost instantaneous release at some distance (a continuous release model would predict even larger consequence distances). The pool evaporation causes the largest consequence distances (as the violent processes with the rupture dilute the initial air-borne gas), see Figure 25.
Risø-R-1504(EN) Annex E 29

1000
10000
100000
1000000
0 200 400 600 800 1000 1200
Distance (m)
Con
cent
ratio
n (p
pm)
0%
20%
40%
60%
80%
100%
Fata
lity
Conc. 2 m/s Conc. 5 m/s
Fatality 2 m/s Fatality 5 m/s
Figure 25 Concentration and probability of fatality due to flash fire in case of instantaneous rupture of an LPG tank car – dispersion from the pool using the instantaneous SLAM model.
.
1000
10000
100000
1000000
0 100 200 300 400 500 600
Distance (m)
Con
cent
ratio
n (p
pm)
0.0%
20.0%
40.0%
60.0%
80.0%
100.0%
Fata
lity/
Ris
k
Concentration Fatality
6 mm hole
Figure 26 Concentration and fatality in case of a large hole (75 mm) in an LPG tank car, wind speed 2 m/s.
Figure 26 shows the concentration profile for an LPG release through a large hole.
3.4 Transport of gasoline For the transport of gasoline, traditional thin-walled road tankers are used. The possible accident scenarios are listed in Table 9. According to (TNO, 1983), the possibility of a BLEVE of a gasoline road tanker depends on the tank material (steel or aluminium). We have included the BLEVE scenario, assuming rupture of the tank at 200°C after fire impact, where the likelihood of sufficiently long fire impact is included in the fault tree/BBN according to (Brockhof, 1992).
30 Risø-R-1504(EN) Annex E

Table 9 Accident scenarios for gasoline transport by thin-walled road tanker.
Scenario Release rate Release duration
10% fatality distance
BLEVE 30 tonnes Instantaneous 150 m Rupture of the tank Pool evaporation
38 kg/s at 2 m/s wind speed (30
tonnes)
Pool evaporation over ca. 15 min.
290 m (½LFL) (180 m to LFL)
VCE following rupture 1.5 tonnes involved in
strongest blast
65 m around ignition point (i.e. less than
flash fire) Release through a large, 75 mm hole 19 kg/s, a pool
of 30 m diameter forms
Ca. 30 min. 160 m (½LFL) (100 m to LFL)
VCE following 75 mm hole 0.7 tonnes involved in
strongest blast
50 m around ignition point (i.e. less than
flash fire) Pool fire following large hole 19 kg/s Ca. 30 min 20 m Release through a 5 mm puncture 0.09 kg/s >1200 s
(emergency response expected)
7 m
Under the assumptions made for Vapour Cloud Explosions (only one third of the flammable cloud contents involved, ignition at two thirds of the distance to LFL), fatal impact of the VCE-s does not extend the flash fire distances. Figure 27 shows the concentration distribution following the evaporation of gasoline from the ground pool after rupture or a large hole (75 mm) in the tank.
1000
10000
100000
1000000
0 200 400 600 800
Distance (m)
Con
cent
ratio
n (p
pm)
0%
20%
40%
60%
80%
100%
Fata
lity/
Ris
k
Conc. (rupture) Conc. (75 mm hole)Fatality (rupture) Fatality (75 mm hole)
Figure 27 Concentration of gasoline vapour and likelihood of fatality due to flash fire or Vapour Cloud Explosion in case of a full rupture or a large hole in a thin-walled gasoline road tanker, at 2 m/s wind speed.
Risø-R-1504(EN) Annex E 31

3.5 Transport of Methanol The scenarios for methanol are similar to those for gasoline, but because of the lower flammability and vapour pressure, the consequence distances for each of the scenarios are less than for gasoline, cf. the assessment for the vehicle accident cases, see section 2.4.
32 Risø-R-1504(EN) Annex E

4 Results of consequence analysis – Refuelling stations
4.1 Ammonia
The accident scenarios for ammonia at the refuelling station are very similar to the scenarios for road transport, as the road tanker and its unloading are among the major sources of risk. Leakage is defined as a small, 5 mm diameter hole.
The other major source of risk is leakage or rupture of the delivery system from the refuelling station to the cars. Leakage is again a 5 mm diameter hole. Results of consequence analysis are presented in Table 10. One should note, that distances are related to distance from the release point. Release can take place either from the road tanker unloading facility, or from the delivery area – this can be rather different positions, as it is recommended to provide a spatial separation in order too avoid that fire from other fuels at the delivery area don’t affect the ammonia unloading facility.
It is assumed in the calculation that the liquid pool following the road tank rupture can spread at liberty (as for the road transport case), though it is recommended to provide a catchment area below or around the unloading facility.
Finally, there is a probability that the storage tank will fail. As the storage tank is continuously present, this causes a considerable contribution to the risk, and is calculated separately (see Figure 28). It is assumed that the tank is placed in a concrete underground pit, which will retain most of the liquid mass that will not evaporate instantaneously to a pool of about 100 m2. Evaporation from such a small pool will last for more than 30 mins. at an evaporation rate of 1 kg/s over this period. Average evaporation over the first 30 seconds will be about 7 kg/s. This will not contribute to an increase in the safety distance.
Risø-R-1504(EN) Annex E 33

Table 10 Accident scenarios for ammonia refuelling station.
Scenario Release rate Release duration
10% fatality distance
Rupture of underground storage tank total 50 tonnes, 16 released
instantaneously in the
atmosphere, remaining mass evaporates from restricted pool
Instantaneous, followed by
slow evaporation (less than 10
kg/s) over more than 30 min.
400 m
Rupture of the road tanker tank 8.3 tonnes released
instantaneous in the atmosphere, subsequent pool evaporation 200 kg/s over first 60 s (total 15.7
tonnes)
Instantaneous, subsequent pool evaporation over
110 s
470 m (Identical to road
transport scenario)
Release through a large, 50 mm hole (rupture of the unloading arm or hose between the road tanker and the refuelling station)
10 kg/s >1200 s (emergency
response expected)
373 m
Release through a 13 mm diameter hole (rupture of the delivery hose from the refuelling station to the car)
1 kg/s >1200 s (emergency
response expected)
114 m
Release through a 5 mm puncture (leak of pipe or hose)
0.22 kg/s >1200 s (emergency
response expected)
50 m (Identical to road
transport scenario)
100
1000
10000
100000
1000000
0 100 200 300 400 500 600 700 800
Distance (m)
Con
cent
ratio
n (p
pm)
0%
25%
50%
75%
100%
Conc. 5 m/s Conc. 2 m/s Fatality 5 m/s Fatality 2 m/s
Figure 28 Concentration and fatality following a catastrophic failure of the ammonia storage tank (50 tonnes capacity) - contribution from the instantaneously released airborne cloud.
4.2 LPG
The accident scenarios for the refuelling station are very similar to those for the road transport, see the remarks for ammonia. Results are presented in Table 11. Note that the
34 Risø-R-1504(EN) Annex E
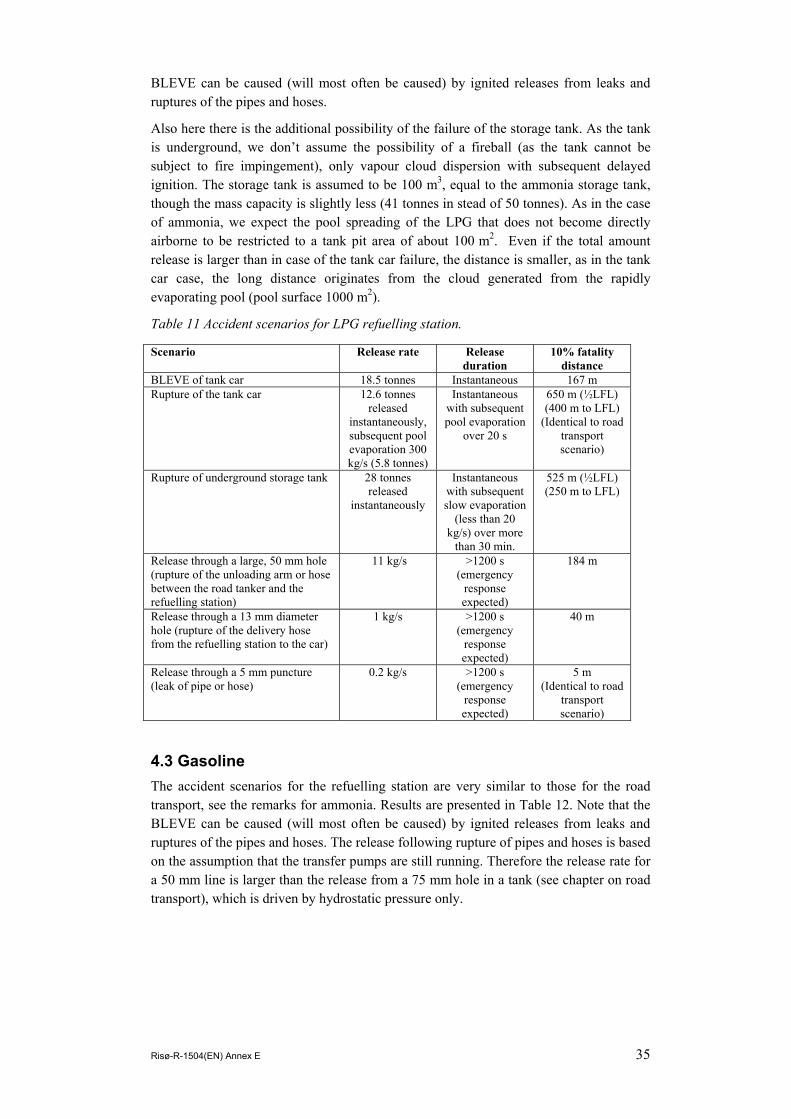
BLEVE can be caused (will most often be caused) by ignited releases from leaks and ruptures of the pipes and hoses.
Also here there is the additional possibility of the failure of the storage tank. As the tank is underground, we don’t assume the possibility of a fireball (as the tank cannot be subject to fire impingement), only vapour cloud dispersion with subsequent delayed ignition. The storage tank is assumed to be 100 m3, equal to the ammonia storage tank, though the mass capacity is slightly less (41 tonnes in stead of 50 tonnes). As in the case of ammonia, we expect the pool spreading of the LPG that does not become directly airborne to be restricted to a tank pit area of about 100 m2. Even if the total amount release is larger than in case of the tank car failure, the distance is smaller, as in the tank car case, the long distance originates from the cloud generated from the rapidly evaporating pool (pool surface 1000 m2).
Table 11 Accident scenarios for LPG refuelling station.
Scenario Release rate Release duration
10% fatality distance
BLEVE of tank car 18.5 tonnes Instantaneous 167 m Rupture of the tank car 12.6 tonnes
released instantaneously, subsequent pool evaporation 300 kg/s (5.8 tonnes)
Instantaneous with subsequent pool evaporation
over 20 s
650 m (½LFL) (400 m to LFL)
(Identical to road transport scenario)
Rupture of underground storage tank 28 tonnes released
instantaneously
Instantaneous with subsequent slow evaporation
(less than 20 kg/s) over more
than 30 min.
525 m (½LFL) (250 m to LFL)
Release through a large, 50 mm hole (rupture of the unloading arm or hose between the road tanker and the refuelling station)
11 kg/s >1200 s (emergency
response expected)
184 m
Release through a 13 mm diameter hole (rupture of the delivery hose from the refuelling station to the car)
1 kg/s >1200 s (emergency
response expected)
40 m
Release through a 5 mm puncture (leak of pipe or hose)
0.2 kg/s >1200 s (emergency
response expected)
5 m (Identical to road
transport scenario)
4.3 Gasoline The accident scenarios for the refuelling station are very similar to those for the road transport, see the remarks for ammonia. Results are presented in Table 12. Note that the BLEVE can be caused (will most often be caused) by ignited releases from leaks and ruptures of the pipes and hoses. The release following rupture of pipes and hoses is based on the assumption that the transfer pumps are still running. Therefore the release rate for a 50 mm line is larger than the release from a 75 mm hole in a tank (see chapter on road transport), which is driven by hydrostatic pressure only.
Risø-R-1504(EN) Annex E 35

Table 12 Accident scenarios for gasoline refuelling.
Scenario Release rate Release duration
10% fatality distance
BLEVE 30 tonnes Instantaneous 150 m Rupture of the tank Pool evaporation
38 kg/s at 2 m/s wind speed (30
tonnes)
Pool evaporation over ca. 15 min.
290 m (½LFL) (180 m to LFL)
(Identical to road transport scenario)
VCE following rupture 1.5 tonnes involved in
strongest blast
65 m around ignition point (i.e. less than
flash fire) Release through a large, 50 mm hole (rupture of the unloading arm or hose between the road tanker and the refuelling station)
25 kg/s, a pool of 34 m diameter
forms
Ca. 30 min. 201 m (½LFL) (100 m to LFL)
Pool fire following large hole 25 kg/s Ca. 30 min 35 m Release through a 13 mm diameter hole (rupture of the delivery hose from the refuelling station to the car)
1 kg/s , a pool of 7 m diameter
forms
Ca. 30 min 25 m (½LFL) (20 m to LFL)
Release through a 5 mm puncture (leak in pipe or hose)
0.09 kg/s >1200 s (emergency
response expected)
7 m (Identical to road
transport scenario)
36 Risø-R-1504(EN) Annex E

Risø-R-1504(EN) Annex E 37

5 References Arts, J. H. E., Mommers, C., and Muijser, H., 2000, Toxic Effects from Accidental
Releases of Hazardous Substances (TEARHS) - Lethal and non-lethal effects in rats upon exposure during short periods of time, Vol. V99.1136, TNO Nutrition and Food Research, Zeist, Netherlands.
Brinkhof, N, Duffield, J. S, and Nijsing, R, 1995, RELIEF User's Manual, Office for Official Publications of the European Communities, Luxembourg.
Brockhof, L. H., 1992, A Risk Management Model for Transport of Dangerous Goods - Main Report, Vol. EUR 14675 EN, Commission of the European Communities, Joint Research Centre, Inst. for Systems Eng. and Informatics.
Committee for the Prevention of Disasters, 1992, Methods for the determination of possible damage to people and objects resulting from releases of hazardous materials "green book", Vol. CPR 16E, ISBN 90-5307-052-4, Sdu Uitgevers, The Hague.
Committee for the Prevention of Disasters, 1997, Methods for the calculation of physical effects due to the releases of hazardous materials (liquids and gases) 'Yellow Book', Vol. CPR 14E, Sdu Uitgevers, The Hague.
Committee for the Prevention of Disasters, 1999, Guidelines for quantitative risk assessment ("Purple Book"), Vol. CPR 18E, Sdu Uitgevers, The Hague, Netherlands.
Deaves, D. M., Gilham, S., Mitchell, B. H., Woodburn, P., and Shepherd, A. M., 16-11-2001, Modelling of catastrophic flashing releases, Journal of Hazardous Materials, Vol. 88, No. 1, pp. 1-32.
Gilham, S., Mitchell, B. H., Woodburn, P., and Deaves, D. M., 1999, Modelling of catastrophic flashing releases of liquid, Vol. HSE Contract Research Report CRR 250/1999, HSE Books.
Lees, F. P., 1996, Loss Prevention in the Process Industries - Hazard Identification, Assessment and Control, 2nd, Butterworth-Heinemann, Oxford.
Ott, S., 1999, Documentation of the GREAT model package, Vol. (internal report), Risø, Roskilde.
Ott, S. and Nielsen, M., 1996, Shallow Layer Modelling of Dense Gas Clouds, Vol. Risø-R-901(EN), Contract EV5V-CT92-0069
ISBN 87-550-2188-3, Risø, Risø National Lab., Roskilde (DK). Systems Analysis.
Rew, P. J. and Hulbert, W. G., 1996, Development of Pool Fire Thermal Radiation Model, Vol. HSE Contract Research Report No. 96/1996, ISBN 0-7176-1084-5, HSE Books, Sudbury, Suffolk, U.K.
TNO, 1983, LPG, A Study, A comparative analysis of the risks inherent in the storage, transshipment, transport and use of LPG and motor spirit, 00 General Report, TNO, Apeldoorn, Netherlands.
38 Risø-R-1504(EN) Annex E

Annex F – HazOp and FMEA Tables and results
Risø-R-1504(EN) 47

Annex F – FMEA and HAZOP analysis schemes and results
CONTENT FMEA of the car system HAZOP of the car system HAZOP of the refuelling station


1 FMEA and HAZOP analysis of the car system To secure a safe system in the car, two studies for identifying potential hazards have been carried out using the primarily design of the system. The two methods used are a FMEA and a HAZOP study. The hazards in focus are releases of ammonia. The main purpose of the analysis is to decide a sufficient safety system that prevents unnecessary releases during filling and driving. The FMEA analysis identified some need for safety systems, which are illustrated on Figure 1. This concerns primarily the tank system.
Tank
Checkvalve
Floater
Magnetic valve
Pressure regulator(never fully closed)
Floatvalve
Connector tofilling hose
Level indicator
Ammonia vehicle tank
P
Heating(Excess heat from
Fuel Cell)
PLC
On high level,open magn. valve
Turn on/off
Valve open only onproper connect ion
Excess flowstop valve
On low pressureclose Magn. valve
Power control(?)
Vaporizer
To reformer
Multivalve components
P
On low pressureclose Magn. valve
Burstingdisc
Figure 1 Safety systems around the ammonia tank
The main results from the FMEA analysis:
• To secure that the connection system in the filling line are empty both before filling and after a filling a vacuum check has to be carried out to prevent a release of ammonia.
• A pressure relief system has to be installed on the tank to prevent the tank from overpressure in case of overfilling.
• An external frame to prevent the tank from damage in a collision is proposed • In case the external detector detects ammonia the current to magnetic valve
should be cut-off. • Furthermore was identified need for ammonia detectors both inside the
system and outside the system. Inside to prevent unreformed ammonia to get into the fuel cells and outside to detect external releases of ammonia
Next pages show the schemes from the FMEA analysis of the car system

Failure Mode and effect analysis (FMEA)
Component Failure mode Cause Effects and Detection Measures Safety System 1, Safe connection to filling station and depressurisation of filling line
Fails open mechanical, obstruction, wrong operation
loss of vacuum during normal operation, air/humidity in system at next fill. Then Safety Systems 2 and 3 are barriers between tank and environment
Check of vacuum before filling at filling station
Safety System 1, Safe connection to filling station and depressurisation of filling line
Fails closed mechanical, obstruction, wrong operation
Filling not possible
Filling hose leakage mechanical impact, Fatigue (pressure cycles)
Release of liquid ammonia during filling
Ammonia detection at filling station, inspection
Filling hose leakage loss of vacuum during normal operation, air/humidity in system at next fill
Check of vacuum before filling at filling station
Safety System 2, Stop filling at maximum fill level
Fails in open position malfunction, mechanical, leakage (seals)
overfilling of tank during filling Pressure relief system.(Safety System 4)
Safety System 2, Stop filling at maximum fill level
Fails in closed position malfunction, mechanical Filling not possible
Safety System 3, avoid backflow from tank to filling line
Fails in open position mechanical Filling hose remains at pressure and filled with ammonis, possibly tank emptied during emptying of filling hose, underpressure (vacuum) and collapse of empty tank
test of vacuum at filling hose at filling station before/after filling.
Safety System 3, avoid backflow from tank to filling line
Fails in closed position mechanical Filling not possible
Tank Small Leakage mechanical impact, Seals release of ammonia, detection through smell or drop in level
inspection, ammonia detector

Tank Major Leak mechanical impact, fire, overfilling
Major release of liquid ammonia, fatal injury
external frame to protect tank on impact. Pressure relief system. Fire will not be a problem - release will be slow and ammonia will burn off.
Safety System 5 Fails in open position mechanical, electrical (circuitcannot be cut)
ammonia supply to regulator cannot be closed, likely leakage through regulator with continuous supply to reformer, and possible release of ammonia through the fuel cell stack, fails to reduce ammonia supply in case of excess flow (release)
ammonia detection after the reformer or washer will indicate whether ammonia is leaking into the stack. The activation of the valve by electrical current can be monitored.
Safety System 5 Fails in closed position electrical (fail-safe), mechanical
No ammonia to regulator
Tubing to regulator leakage mechanical impact liquid ammonia release Current to magnetic valve should be cut-off on mechanical impact of tubing, ammonia detection outside tank, maximum flow restrictor
Regulator Fails open mechanical Full tank pressure on reformer, release of ammonia through fuel cell stack
ammonia detection after reformer, pressure indicator (high pressure alarm) after regulator
Regulator Fails closed mechanical No ammonia to reformer Evaporator Leakage ammonia side see tubing to regulator see tubing to regulator see tubing to regulator Evaporator Leakage between sides corrosion, wearing reaction between heat medium
(water) and ammonia, humidity in ammonia, further corrsion, release
maintenance, inspection, check of abnormal temperature behaviour (heat release - especially when not operating)
Tubing to reformer Leakage mechanical impact release of ammonia vapour (moderate pressure)
Current to magnetic valve should be cut-off on mechanical impact of tubing, ammonia detection outside tubing
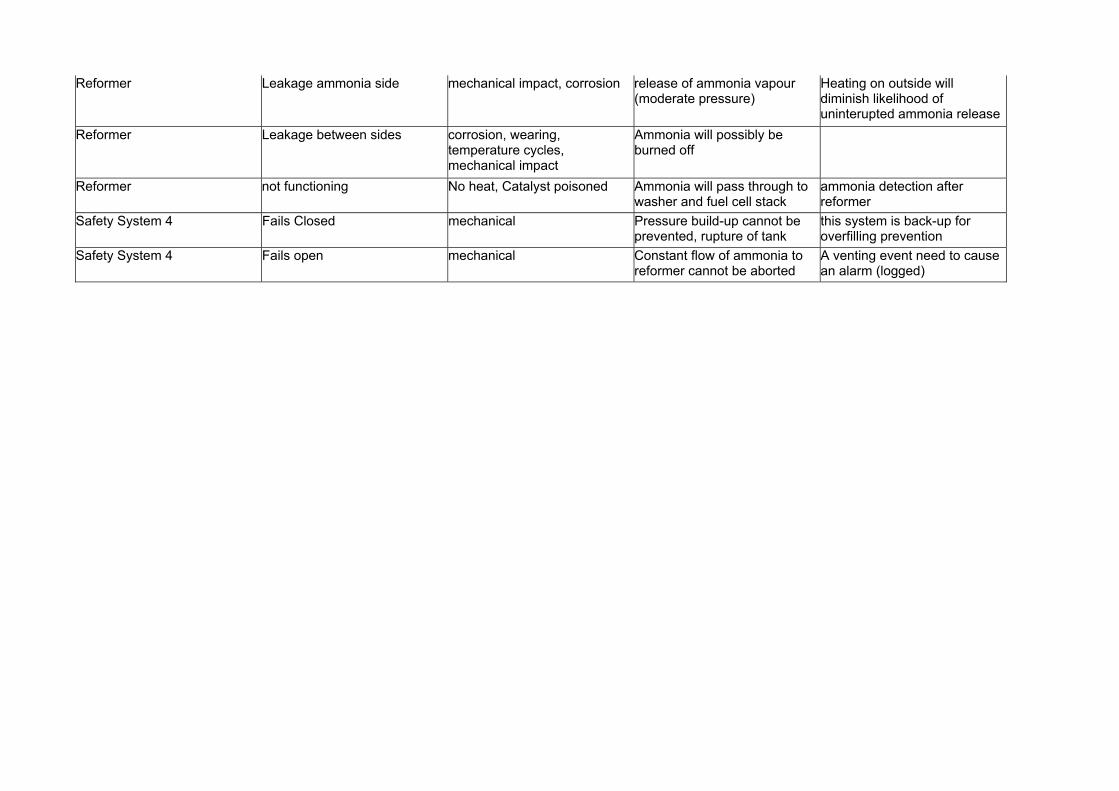
Reformer Leakage ammonia side mechanical impact, corrosion release of ammonia vapour (moderate pressure)
Heating on outside will diminish likelihood of uninterupted ammonia release
Reformer Leakage between sides corrosion, wearing, temperature cycles, mechanical impact
Ammonia will possibly be burned off
Reformer not functioning No heat, Catalyst poisoned Ammonia will pass through to washer and fuel cell stack
ammonia detection after reformer
Safety System 4 Fails Closed mechanical Pressure build-up cannot be prevented, rupture of tank
this system is back-up for overfilling prevention
Safety System 4 Fails open mechanical Constant flow of ammonia to reformer cannot be aborted
A venting event need to cause an alarm (logged)

2 Hazop analysis of the car system The HAZOP analysis was then carried out to supplement the FMEA analysis, as the FMEA analysis takes its starting point in a failure mode of a component and look at the resulting consequences on the system, while the HAZOP analysis takes the starting point in a deviation of the process parameters, the consequences of this deviation and then the cause for this deviation is assessed. The subdivision of the system for the HAZOP study is shown in Figure 2. The main results from the HAZOP analysis are that the proposed safety systems will prevent the potential events found during the HAZOP study. The results are seen in the following scheme. System Event Safeguard Conclusion Fill line to tank
Release due to check valve on tank fails and valve at connection fails as well on disconnection. Release by filling
Disconnection safety system on car. Line empty Concentration based alarm, emergency shut down of fuelling station
The safety system prevents a release of ammonia
Tank Release Safe design of the tank. The tank is designed to withstand a collision. External frame to protect tank on impact. In case of fire the lining will melt and cause only slow release. A level indicator protects overfilling and valves close at max. level. Gas alarm is installed Safety system on compressor and vacuum compressor to prevent damage on tank Max. flow valve in pipe from tank.
The safeguard will prevent damage of the tank and a total release will only happen in very severe accidents. Small punctures with a leak will be detected by the gas alarm. This will also detect gas leakages from other parts of the ammonia system. The max flow valve in pipe fron tank and narrow pipes decrease a leak from this system.
Evaporator Down-flow section on high pressure due to evaporator failure. Down flow system not designed for high pressure. Fuel cells will be destroyed and leaks can occur
High-pressure alarm on down flow section closes main valve. Gas alarm installed
The safety system will protect the down flow system and the fuel cells.
Reformers Overheating
Temperature control on burner Temperature control on El. reformer
Burners and burner flue gas
Release of burner fuel through the compressor
Check valve on compressor This can happen in case the burner outlet is blocked.
Absorbers Poisoned absorbers will allow NH3 into the fuel cells and damage these
NH3 sensor ?
Fuel cells
Leakages from the system are limited and will be detected by the gas alarm
Table 1 Results of the HAZOP study of the car system

2.1 Guide words
Guide Word More than No Low High Part of Also Other than Reverse Process Variable
Flow No Flow Low Flow High Flow Missing Ingredients Impurities Wrong
Substance Reverse Flow
Level Empty Low Level High Level Low Interface High Interface - -
Pressure Open to atmosphere Low Pressure High Pressure - - - Vacuum
Temperature Freezing Low Temperature
High Temperature - - - Auto
Refrigeration
Agitation No Agitation Poor Mixing Excessive Mixing
Irregular Mixing Foaming - Phase
Separation
Reaction No Reaction Slow Reaction Runaway Reaction
Partial Reaction Side Reaction Wrong
Reaction Decompo-
sition
Other Utility Failure External Leak External Rupture
Start up/ Shut down/
Maintenance

Car system
Tank
Ammonia car system
Heating(Excess heat
fromFuel Cell)
Vaporizer
El. reformer
Multivalvecomponents
reformer
Absorber B RecuperativeAbsorbers A
H2inH2out
Cooling waterAir in
Flue gas
Air
PEM Fuel cell
igure 2 Car system with subdivision for the HAZOP study F


Operational Phase: filling
Plant: Car Design/operating pressure 15 bar Plant section filling line to tank Design/operating temperature ambientHazop Group:
jepa,fram,nidu
Date 21-11-2003
Guide word Deviation Causes Consequences Safeguards Actions No No flow tank station compressor fails tank can't be filled
valves not open, connection not assured
tank can't be filled
max level reached OK line blocked, impurities in
system tank can't be filled
pressure in tank too high, control system failed
overfilled, see tank safety system no…
low Low flow leak, leaking connection release tank station compressor fails tank fills slowly
valves not completely open tank fills slowly line partly blocked tank fills slowly High high flow tank station compressor
pressure too high larger risk for overfilling and valve damage
Also impurities low grade in station tank, blocking in system, corrosion, undesired reactions
damage in tank filling system blocking and damage of system
Other than wrong substance wrong substance in filling station tank, wrong delivery
undesired reactions in system, damage to system, corrosion
connections are substance specific
station tank empty and other gases in vapour space, failure of control system
undesired reactions in system, damage to system, corrosion

Reverse reverseflow non return valve (check valve) on tank fails wile depressurising filling line
tank empties while lines are connected, possibly to vacuum (tank collapse). Filling line remains pressurised, possible outflow when valve and safety system on disconnection fails as well.
disconnection safety system on car and station side
check valve fails and valve at connection fails as well on disconnection
release disconnection safety system on car
No no pressure, se no flow Low low pressure No flow? Evaporation. 2-
phase
High high pressure Too high pressure from compressor
rupture of line and/tank and release
safety system on compressor
Reverse vacuum Vacuum compressor suckingpressure lower than design of filling line
line collapse safety system on vacuum compressor
Also-Phase two phase flow High temperature (vapour pressure > compressor pressure
limited ?
Other than-Phase gas phase same limited ? not compressible gas, wrong
substance, station tank empty
undesired reactions in system, damage to system, corrosion
No-Other Failure of utilities no power, no compressor pressure
no filling
utility failure while filling unable to depressurise and disconnect
car el system fails el-based alarm and safety systems don’t work
overfilling safeguard partly mechanic (redundancy),
fail-safe systems (valve close on power failure)
Low-Other Minor release Damage to line release while filling, unable to depressurise below ambient pressure
concentration based alarm, emergency shut down of filling station

High-Other Rupture Damage to line Release while filling concentration based alarm, emergency shut down of filling station

Operational Phase: All phases
Plant: Design/operating pressure 15 bar Plant section tank Design/operating temperature ambientHazop Group:
jepa,fram,nidu
Date 21-11-2003
Guide word Deviation Possible Causes Consequences Safeguards Actions Pressure no Atmospheric pressure Rupture Release of NH3 Valves open Release of NH3 low low pressure emty tank Problems upstream if P< Pmin rupture Release of NH3 low temperature no flow to system - no hazard high high pressure overfilled & temperature rise rupture if P>Pmax max. level close valve, relief
valve
Deformation of tank- collision rupture if P>Pmax Safe design fire rupture if P>Pmax Safe design (lining melts,
slow release)
reverse vacuum Valves open while vacuum compressor on.
Implosion of the tank Compressor runs only for limited time (don't empty tank)
Temperature Deviation Possible Causes Consequences Safeguards Actionsno freezing outside temp. below xx gr. C? no pressure
low low temperature outside temp. Low no pressure Evaporation from tank due to
a leak
high high temperature outside temp.high Fire rupture if P>Pmax Safe design (lining melts,
slow release)
reverse Auto refrigeration
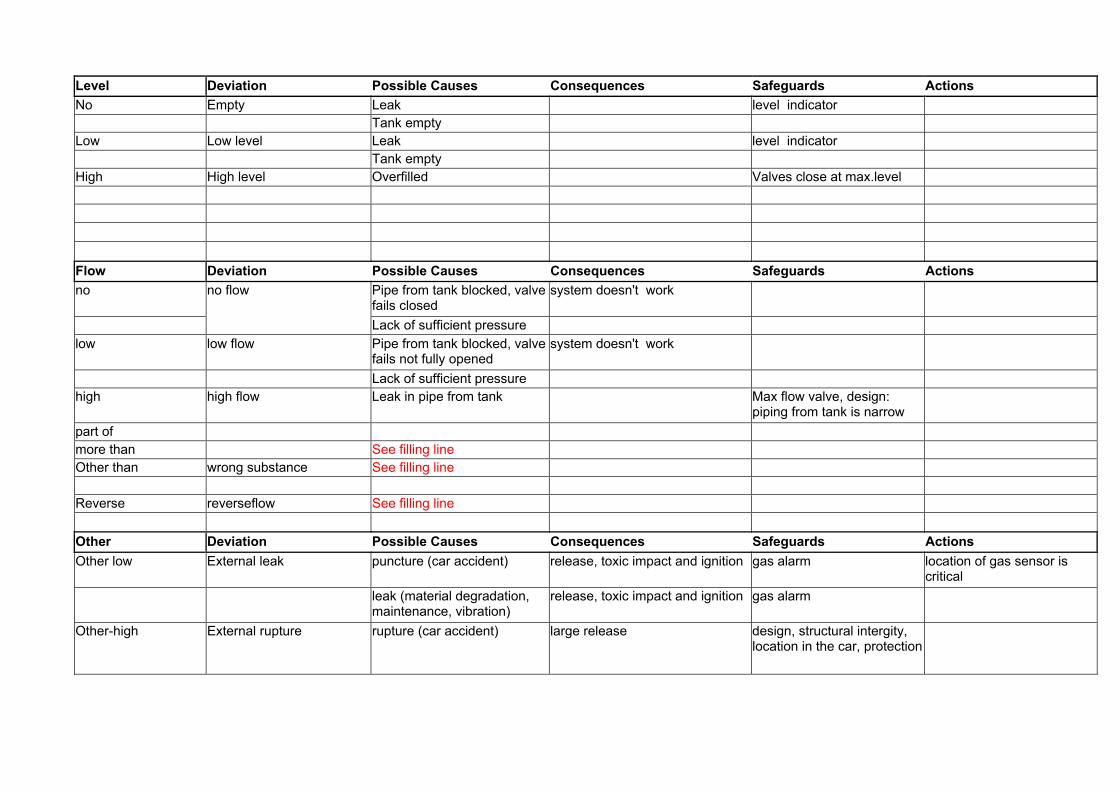
Level Deviation Possible Causes Consequences Safeguards ActionsNo Empty Leak level indicator Tank empty Low Low level Leak level indicator Tank empty High High level Overfilled Valves close at max.level Flow Deviation Possible Causes Consequences Safeguards Actionsno no flow Pipe from tank blocked, valve
fails closed system doesn't work
Lack of sufficient pressure low low flow Pipe from tank blocked, valve
fails not fully opened system doesn't work
Lack of sufficient pressure high high flow Leak in pipe from tank Max flow valve, design:
piping from tank is narrow
part of more than See filling line Other than wrong substance See filling line Reverse reverseflow See filling line Other Deviation Possible Causes Consequences Safeguards ActionsOther low External leak puncture (car accident) release, toxic impact and ignition gas alarm location of gas sensor is
critical leak (material degradation,
maintenance, vibration) release, toxic impact and ignition gas alarm
Other-high External rupture rupture (car accident) large release design, structural intergity, location in the car, protection
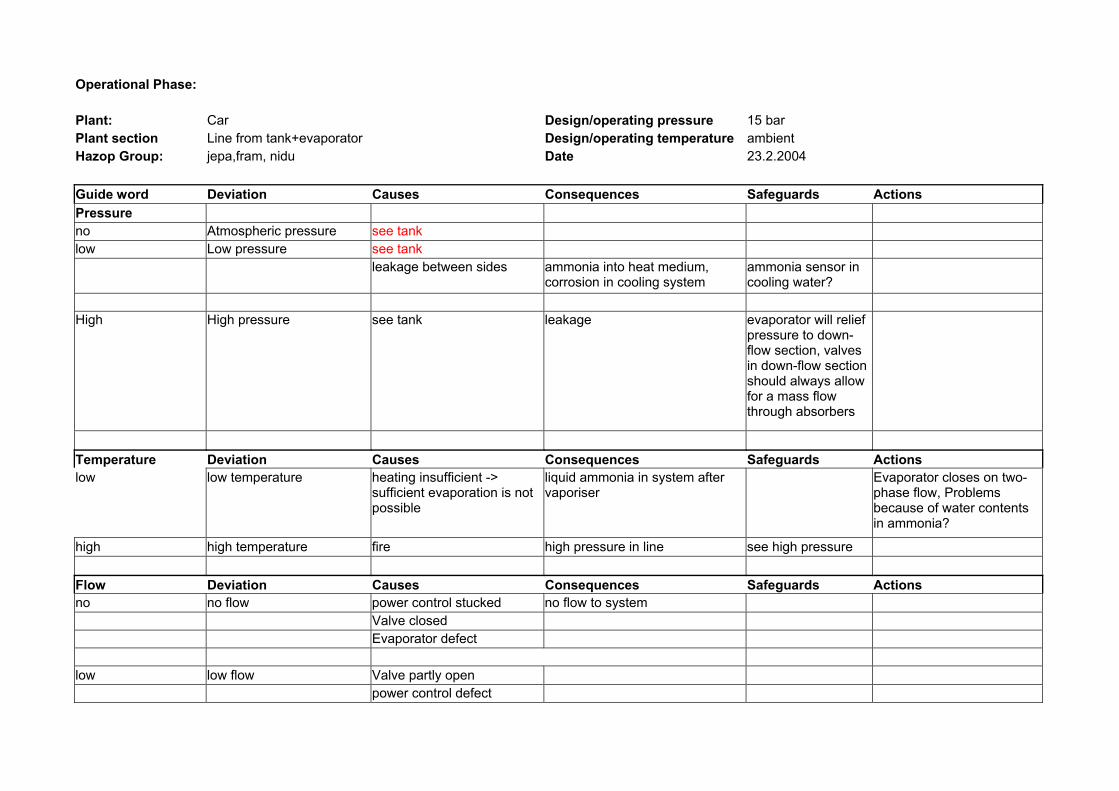
Operational Phase:
Plant: Car Design/operating pressure 15 bar Plant section Line from tank+evaporator Design/operating temperature ambientHazop Group:
jepa,fram, nidu
Date 23.2.2004
Guide word Deviation Causes Consequences Safeguards Actions Pressure no Atmospheric pressure see tank low Low pressure see tank leakage between sides ammonia into heat medium,
corrosion in cooling system ammonia sensor in cooling water?
High High pressure see tank leakage evaporator will relief
pressure to down-flow section, valves in down-flow section should always allow for a mass flow through absorbers
Temperature Deviation Causes Consequences Safeguards Actionslow low temperature heating insufficient ->
sufficient evaporation is not possible
liquid ammonia in system after vaporiser
Evaporator closes on two-phase flow, Problems because of water contents in ammonia?
high high temperature fire high pressure in line see high pressure Flow Deviation Causes Consequences Safeguards Actionsno no flow power control stucked no flow to system Valve closed Evaporator defect low low flow Valve partly open power control defect
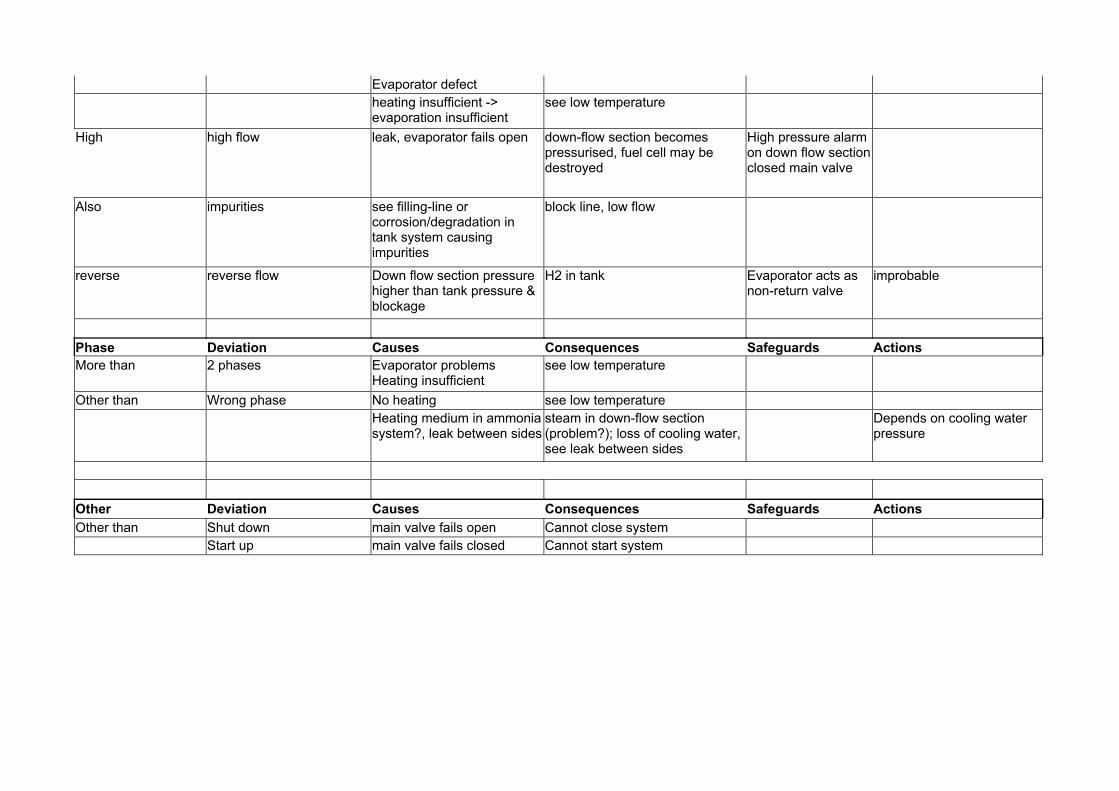
Evaporator defect heating insufficient ->
evaporation insufficient see low temperature
High high flow leak, evaporator fails open down-flow section becomes pressurised, fuel cell may be destroyed
High pressure alarm on down flow section closed main valve
Also impurities see filling-line or corrosion/degradation in tank system causing impurities
block line, low flow
reverse reverse flow Down flow section pressure higher than tank pressure & blockage
H2 in tank Evaporator acts as non-return valve
improbable
Phase Deviation Causes Consequences Safeguards ActionsMore than 2 phases Evaporator problems
Heating insufficient see low temperature
Other than Wrong phase No heating see low temperature Heating medium in ammonia
system?, leak between sidessteam in down-flow section (problem?); loss of cooling water, see leak between sides
Depends on cooling water pressure
Other Deviation Causes Consequences Safeguards ActionsOther than Shut down main valve fails open Cannot close system Start up main valve fails closed Cannot start system

Operational Phase: running/all phases
Plant: Car Design/operating pressure 2.5 bar abs Plant section Line to reformers Design/operating temperature ambientHazop Group:
jepa, fram, nidu
Date 23.2.04
Guide word Deviation Causes Consequences Safeguards Actions pressure no Atmospheric pressure rupture flow is restricted by
small pipe on tank; gas detecr/gas alarm
position of gas sensors is critical
low Low pressure Evaporator problems High High pressure Evaporator defect down-flow section becomes
pressurised design pressure above maximum tank pressure
Temperature Deviation Causes Consequences Safeguards Actionslow low temperature Insufficient heating to
evaporator
high high temperature fire Rupture/leakage of line valves in down-flow section should always allow for a mass flow through absorbers
Overheating by heat exchangers
Rupture/leakage of line Problem caused by faults in regulation of reformer
X
Flow Deviation Causes Consequences Safeguards Actionsno no flow evaporator problems no flow to reformers valves stucked

pipe rupture power control system defect low low flow evaporator problems control system checks
flow measurements and power output with valve settings and operation envelopes
optional?
Valves not sufficiently open leak gas alarm power control system defect High high flow power control system defect H2 is not used in PEM diagnostics in
control system?
reverse reverse flow see evaporator Other Deviation Causes Consequences Safeguards Actions Low External leak Leak in heat exchanger ammonia bypasses reformer, too
high ammonia level before absorbers

Operational Phase:
Plant: Car Design/operating pressure
2.5 bar
Plant section Reformers and output Design/operating temperature
~800 deg.C
Hazop Group:
jepa, nidu Date 25.feb. 2004
Rev. 6.Okt.2004
Guide word Deviation Causes Consequences Safeguards Actions Pressure no Atmospheric pressure No flow low low pressure leak in pipes NH3 to environment Leakages between sides se above high high pressure blockage/ pressure reg.
Defect No flow
Pressure reg. Failure Down flow pressurised Down flow valves should always dep. The system.or design pressure of down flow system above max. Tank pressure. Protection of the pressure sensitive components.
Temperature Deviation Causes Consequences Safeguards Actionslow low temperature burner insufficient due to air
problems No reforming, NH3 to down flow section
burner insufficient due H2 problems
No reforming, NH3 to down flow section
catalyst on burner side poisened
No reforming, NH3 to down flow section
high high temperature Low flow Material failure
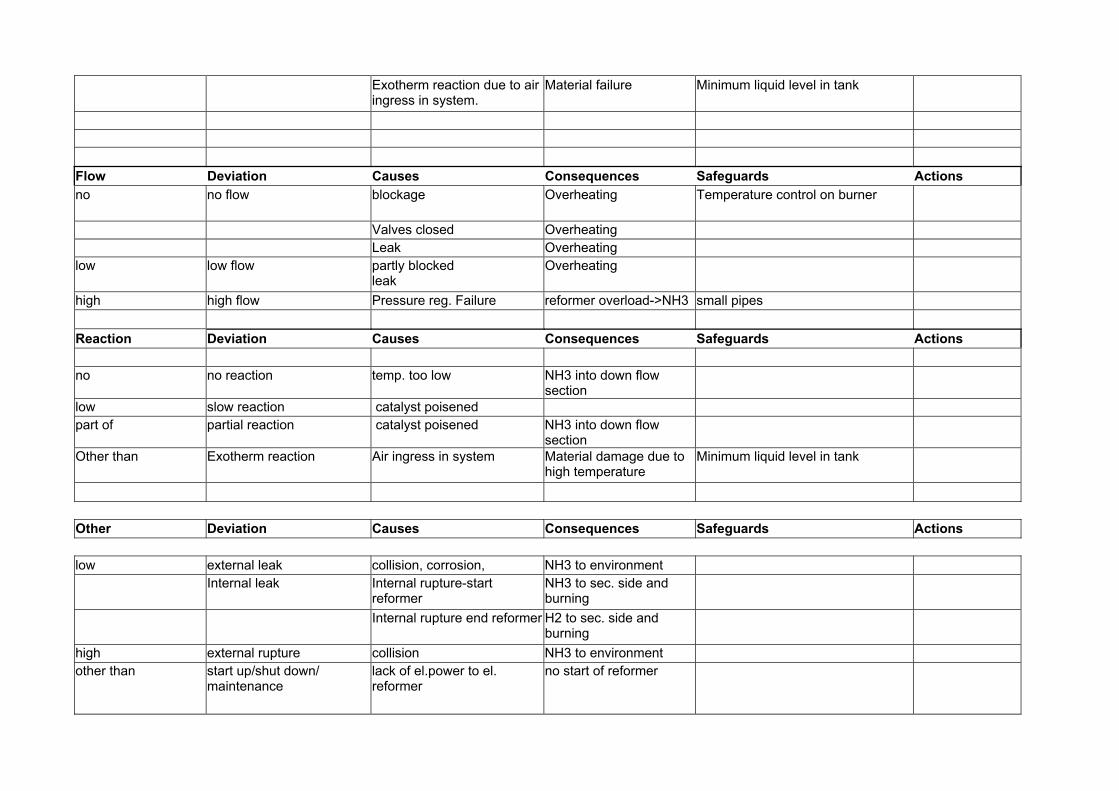
Exotherm reaction due to air ingress in system.
Material failure Minimum liquid level in tank
Flow Deviation Causes Consequences Safeguards Actionsno no flow blockage Overheating Temperature control on burner
Valves closed Overheating Leak Overheating low low flow partly blocked
leak Overheating
high high flow Pressure reg. Failure reformer overload->NH3 small pipes Reaction Deviation Causes Consequences Safeguards Actions no no reaction temp. too low NH3 into down flow
section
low slow reaction catalyst poisened part of partial reaction catalyst poisened NH3 into down flow
section
Other than Exotherm reaction Air ingress in system Material damage due to high temperature
Minimum liquid level in tank
Other Deviation Causes Consequences Safeguards Actions low external leak collision, corrosion, NH3 to environment Internal leak Internal rupture-start
reformer NH3 to sec. side and burning
Internal rupture end reformer H2 to sec. side and burning
high external rupture collision NH3 to environment other than start up/shut down/
maintenance lack of el.power to el. reformer
no start of reformer

valve do not close no stop of reformer Note: The only way of creating
underpressure in the system is by a vacuum condition in the tank when empty for liquid. Another potential source of underpressure could be an ejector effect of the air compressor to the burner on the feed flow to the burner.

Operational Phase:
Plant: Car Design/operating pressure 2.5 bar
Plant section Burner and burner flue gas Design/operating temperature
~800 deg.C
Hazop Group:
jepa, nidu Date 26.feb. 2004
6.oct.2004
Guide word Deviation Causes Consequences Safeguards Actions Pressure no Atmospheric pressure No burning - no heat low low pressure Insufficient burning high high pressure outlet blocked Reverse flow in air
compressor and release of burner fuel.
Non return valve on compressor
Temperature Deviation Causes Consequences Safeguards Actionslow low temperature burner insufficient due to air
problems No reforming, NH3 to down flow section
burner insufficient due H2 problems No reforming, NH3 to down flow section
catalyst on burner side poisened No reforming, NH3 to down flow section
high high temperature Low flow Failure in flow control to burner (
High flow to burner) Overheating Temperature
measurements of flue gas
Flow Deviation Causes Consequences Safeguards Actionsno no flow valve closed
pipe rupture blockage
temperature low- no reforming
low low flow partly blocked leak
temperature low- no reforming
unstable burner behaviour? Depends on fuel behaviour and catalyst ignition.
high high flow Failure in flow control to burner ( High flow to burner)
Overheating Temperaturemeasurements of flue gas

Reaction Deviation Causes Consequences Safeguards Actionsno no reaction problems with:
catalyst air H2
no cracking of NH3
low slow reaction problems with:catalyst air H2
insufficient cracking
high run away reaction, sec excess H2 + air Over heating
part of partial reaction catalyst poisened temp.too low-no reforming also side reaction NH3 in reaction other than wrong reaction, sec. excess H2 + air
NH3 in reaction or ?
explosion
Other Deviation Causes Consequences Safeguards Actionsno Air compressor failure Mech. or el. failure Incomplete combustion on
burner side Close burner if no air pressure
low external leak collision, corrosion, Release of H2 and NH3 NH3 sensor in ventilation system to passengers cabin?
Strategy concerning NH3 sensors and their position.
high external rupture collision Release of H2 and NH3 NH3 sensor in ventilation system to passengers cabin?
other than start up/shut down/ maintenance lack of el.power to el. reformer no start of reformer
valve do not close no stop of reformer Valve failures no start of reformer

Operational Phase: Start up Plant: Car Design/operating pressure 2.5 bar
Plant section El. reformer Design/operating temperature ~800 deg.C Hazop Group: jepa, nidu Date 25.02.2004 Rev. 6.oct. 2004 Guide word Deviation Causes Consequences Safeguards Actions Pressure no Atmospheric pressure no flow low Low pressure High High pressure Valves closed while heating
blokage down stream Rupture of reformer Design pressure higher than
max. Tank pressure.
Pressure regulator failed high flow Temperature Deviation Causes Consequences Safeguards Actionslow low temperature insufficient power Start up failed high high temperature power control defect Material failure Independent temperature
control
Flow Deviation Causes Consequences Safeguards Actionsno no flow blockage Start up failure
low low flow partly blockage slow start up
high high flow Pressure regulator failed Incomplete conversion of NH3 Reaction Deviation Causes Consequences Safeguards Actionsno no reaction low temperature NH3 down stream low Slow reaction low temperature
catalyst defect NH3 down stream
high part of catalyst poisened NH3 down stream also Other than Exotherm reaction Air ingress in system Material damage due to high
temperature Minimum liquid level in tank
Other Deviation Causes Consequences Safeguards Actionsno utility failure El. failure No reaction low external leak collision, corrosion, NH3 to environment high external rupture collision NH3 to environment

other than start up/shut down/ maintenance
lack of el.power to el. reformer
no start of reformer
Operational Phase:
Plant: Design/operating pressure Plant section Absorbers Design/operating temperature Hazop Group: jepa, nidu Date 01.03.2004 Guide word Deviation Causes Consequences Safeguards Actions Pressure no low high Material failure Design pressure
above maximum tank pressure
Temperature Deviation Causes Consequences Safeguards Actionslow high Flow Deviation Causes Consequences Safeguards Actionsno low high Reaction Deviation Causes Consequences Safeguards Actions no No reaction poisoned absorber Damage to fuel cells NH3 sensor ? x low slow reaction poisoned absorber Damage to fuel cells x part of partial reaction NH3 overload Damage to fuel cells x Other Deviation Causes Consequences Safeguards Actionsno low high other than

Operational Phase:
Plant: Car Design/operating pressure Plant section PEM fuel cell Design/operating temperature Hazop Group: jepa,nidu Date 01.03.2004 Rev 6.okt.2004 Guide word Deviation Causes Consequences Safeguards Actions Pressure no low high Pressure regulator failure Damage of cells. Leakage from
H2 to air. Possibility for fire. Release of NH3 from fuel cell
NH3 release restricted due to small diameter of pipe between tank and evaporizer. Emergency shut down valve
Unlikely to make a fuel cell to more than 2 bar pressure difference.
Temperature Deviation Causes Consequences Safeguards Actionslow high Flow Deviation Causes Consequences Safeguards Actionsno No power output low high Reaction Deviation Causes Consequences Safeguards Actions no No reaction Cell defect
wrong gas No power NH3 sensor ? x
low slow reaction Cell defect wrong gas
Low power x
part of partial reaction Cell defect wrong gas
low power x
Other Deviation Causes Consequences Safeguards Actionsno low high other than

3 Refuelling station system - HAZOP Study A HAZOP analysis has been performed on the ammonia refueling station. The main problem addressed is release of NH3 The HAZOP analysis was performed on the basis of the PI- diagram Fejl! Henvisningskilde ikke fundet. of the refueling station. The aim of the analysis was to optimize the design due to prevention of unwanted events and in case this is not possible how to mitigate the consequences of these events. . The amount of ammonia in the systems in question: Truck 25 t Refuelling station 50 t Car 0.05 t The results from the HAZOP are the following: 1. Fill line to tank In case of damage of the fill line system check valves must be installed to prevent larger amount of NH3 release. To prevent the truck to leave the filling system with the hose still connected an interlock system is proposed to be installed e.g. the car key is used in the filling system. As the transport by truck is planned to be a pressure-less cryogenic transport at –34 oC, and the refuelling station tank is at ambient temperature ~12 oC, a heating system is required in the filling line. To heat 25 t of NH3 from –34 oC to 12 oC in half an hour require a heating system on 3 MW. The heating system is not designed yet, but the energy demand is ~1,1 % of the heated NH3, if NH3 is used as energy source. The amount of NH3 in the heating system is not known, while it depends on the system. A separate analysis must be performed on the heating system. A heating system on 3 MW is not a small system and must be expected to contain a certain amount of NH3 2. Tank To prevent damage of the tank by collision or fire, the tank is proposed to be underground in a filled concrete pit. Damage of the tank can also happen by overfilling and heating. To prevent overfilling a level controller must be installed which close the filling line at a certain level in the tank. The worst-case scenario for overfilling is by a failure in the heating system with the consequence that NH3 at –34 oC is filled into the tank. Assumed that the maximum filling level is 80% and the amount of NH3 at this level is 50t at 12 oC. The volume of 50t of NH3 is 80.5 m3. This means that the total tank volume is ~100 m3. If the tank is filled 80% with NH3 at –34 oC the amount of NH3 at 80% level is 55t. The 55 t of NH3 will be heated to ambient temperature 12 oC and the volume will increase to 88.5 m3, which is ~88% of a full tank. To exceed the volume of the full tank it requires a temperature on 62 oC. and this is not seen as a possible event. Overfilling can also happen in case the level controller fails and the tank will be pressurized to the max pressure of the filling pump. The design of the tank must ensure that the maximum allowable pressure in the tank is above the maximum pressure of the pump. A safety valve is installed on top of the tank. 3. Fill line to car In case of damage of this fill line, check valves must be installed to prevent larger amount of NH3 release. As for the truck connection an interlock must be installed to prevent the car to leave the refuelling station with the hose still connected. 4. Vacuum system A vacuum system is installed to empty the hoses and prevent a release of NH3 when disconnecting the hose from the car. A pressure control system is installed to ensure that disconnection can only be performed at a certain low pressure.


3.1 Fuelling station system
Car Safety System 3Avoid backflow from
tank to filling line
Car Safety System 2Avoid overfilling
To Car Tank
Underground tank in filledconcrete pit
P
Vacuum pumpLogic controllerOptional heat exchanger for
cryogenic deliveries

3.1.1 Conclusions from the HAZOP study of the refuelling station
System Event Safeguards Conclusion Fill line to tank Fill line to car
Release Check valves installed If a damage to the fill line occur only a minor release of NH3 will happen due to the installed check valves
Heating system. NOT TREATED
Release Check valves between the tank and the heating system
The heating system is not designed yet but require an effect of ~3MW, if the filling operation is estimated to take 0.5 hour. The possible amount of NH3 to release e.g. due to a collision is the content of the heating system.
Tank Release due to
collision and corrosion
Tank in filled concrete pit. NH3 detector. Check valves, safety valves. Corrosion protection.
To avoid collision and the consequences of a rupture of the tank and the connected pipes, the tank is placed underground in a filled concrete pit The tank must be inspected or tested regularly (Pressure tank)
Release due to rupture after an overfilling and heating of the tank
The tank must be filled to no more than 80% of full volume. Level control.
The restriction on the maximum filling level give place for expansion of 50 t of NH3 at –33 deg.C up to ~62 deg. C Heated up to 12 deg. C the NH3 will expand to 88% of a full tank
Release due to fire
Tank in filled concrete pit.
When the tank is placed underground the exposure to fire is minimal.
Vacuum line No vacuum Pressure control and ? Minor release of NH3 Filling lines (in both ends)
Forgotten to disconnect the cars before driving => release
Interlock system between car and filling system
If an interlock is established, so that the car is not able to drive, it is assumed to be a safe solution.

Operational Phase: Filling refuelling station tank Plant: Refuelling station Design/operating pressure
Plant section Fill line toTank Design/operating temperature Hazop Group: jepa, nidu Date 18.10.2004
Pressure Deviation Causes Consequences Safeguards ActionsNo Atmospheric pressure connection valve stucked in open
position Release of NH3 check valve before compressor
Low low pressure No pressure from truck High high pressure Too high pressure from compressor rupture of line and/tank and release safety system on compressor Design pressure obove
compressor maximum pressure
Reverse vacuum Also-Phase two phase flow High temperature (vapour pressure
> compressor pressure Design
Flow Deviation Causes Consequences Safeguards ActionsNo No flow compressor fails tank can't be filled valves not open, connection not
assured tank can't be filled
max level reached OK line blocked, impurities in system tank can't be filled pressure in tank too high, control
system failed safety system no… see overfilling of tank
low Low flow leak, leaking connection release compressor fails tank fills slowly valves not completely open tank fills slowly line partly blocked tank fills slowly High high flow compressor pressure too high larger risk for overfilling and valve damage Design pressure of system above maximum
compressor pressure
Also impurities low grade in tankcar blocking in system, corrosion, undesired reactions
damage in tank filling system blocking and damage of system Other than wrong substance wrong substance in tankcar, worng
delivery undesired reactions in system, damaget to system, corrosion
connections are substance specific
Reverse reverseflow non return valve (check valve) on tank stucked
check valve fails and valve at connection fails as well on disconnection
release

Temperature Deviation Causes Consequences Safeguards ActionsLow Heat exchanger doesn't work See overfilling of tank High Temperature control doesn't work
Other Deviation Causes Consequences Safeguards ActionsOther than-Phase gas phase same limited Gas phase in suction line Evaporation in suction line due to
ambient heat compressor doesn't work Booster pump on truck
not condensable gas, wrong substance, station tank empty
undesired reactions in system, damaget to system, corrosion
No-Other Failure of utilities no power, no compressor pressure no filling
utility failure while filling Lack of heating cold NH3 in tank and danger of overfilling
Material damage due to low temperature Temperature control
Low-Other Minor release Damage to line release by filling High-Other Rupture Damage to line Release while filling concentration based alarm, emergency shut
down of filling operation Truck in pit during unloading to limit pool size and evaporation. Collision protection of unloading equipment , lines, valves and pumps.
Operational Phase:
Plant: Refuelling station Design/operating pressure 15bar / 8bar Plant section Tank Design/operating temperature 20 gr.C Hazop Group: jepa, nidu Date 18.10.2004
Pressure Deviation Causes Consequences Safeguards Actions no Open to atmosphere Leak
Tank or pipe connections, corrosion, material failure
NH3 release Tank in filled concrete pit NH3 detector Corrosion protection Periodic testing
low Low pressure Tank empty-control failure Control system high High pressure Collission NH3 release Tank in filled concrete pit
NH3 detector
High temperature See high temperature Overfilling Rupture of tank after increase of
temperature Design pressure of tank higher than filling pump maximum pressure High level control and alarms Minimum temperature of charge
No possibility for filling if the remaining empty storage capacity is less than 1 truck load.
Temperature Deviation Causes Consequences Safeguards Actionslow Heating on filling line failed Overfilling due to increase of liquid volume
( temperature increase in tank) Temperature control and alarm on filling line
high Fire NH3 release Tank in filled concrete pit NH3 detector
Fire Melting and release Tank in filled concrete pit NH3 detector
Control failure in heater None
Flow Deviation Causes Consequences Safeguards ActionsOther than Air in system Connection system Air collects in tank Periodic controlled venting and
analysis
Level Deviation Causes Consequences Safeguards Actionsno empty Control failure Leak
Tank or pipe connections NH3 detector
Low Low level Control failure Delivery failure
See no pressure
High High level Control failure See High pressure
Reaction Deviation Causes Consequences Safeguards Actions High Run away reaction? Mix with wrong substance Undesired reaction in tank. Damage of
system. Corrosion Connections are substance specific.
Reverse Decomposition?
Other Deviation Causes Consequences Safeguards Actionsno low External leak See no pressure high External rupture see high pressure
Operational Phase: filling a car Plant: Refuelling station Design/operating
pressure 15 bar
Plant section filling line to car connection Design/operating temperature
ambient
Hazop Group: jepa, nidu Date 18.Oct 2004
Flow Deviation Causes Consequences Safeguards ActionsNo No flow Compressor failure valves not open, connection not assured control system failure Leak in suction line Tank emty low Low flow Leak Compressor failure valves not completely open line partly blocked Vacuum line not closed Low level in tank High high flow tank station compressor pressure too high Also impurities low grade in station tank, damage in tank filling system Other than wrong substance wrong substance in filling station tank, wrong
delivery Damage of car system
station tank empty and other gases in vapour space, failure of control system
Reverse Reverse flow Compressor failure during filling none Other than-Phase gas phase same ? not compressible gas, wrong substance,
station tank empty
Pressure Deviation Causes Consequences Safeguards ActionsNo no pressure, se no flow Low low pressure No flow? Evaporation. 2-phase No fuelling operation if level in
underground tank is low.
High high pressure Too high pressure from compressor System design pressure above compressor maximum pressure.
Also-Phase two phase flow High temperature (vapour pressure > compressor pressure
?
Temperature Deviation Causes Consequences Safeguards ActionsNo Freezing
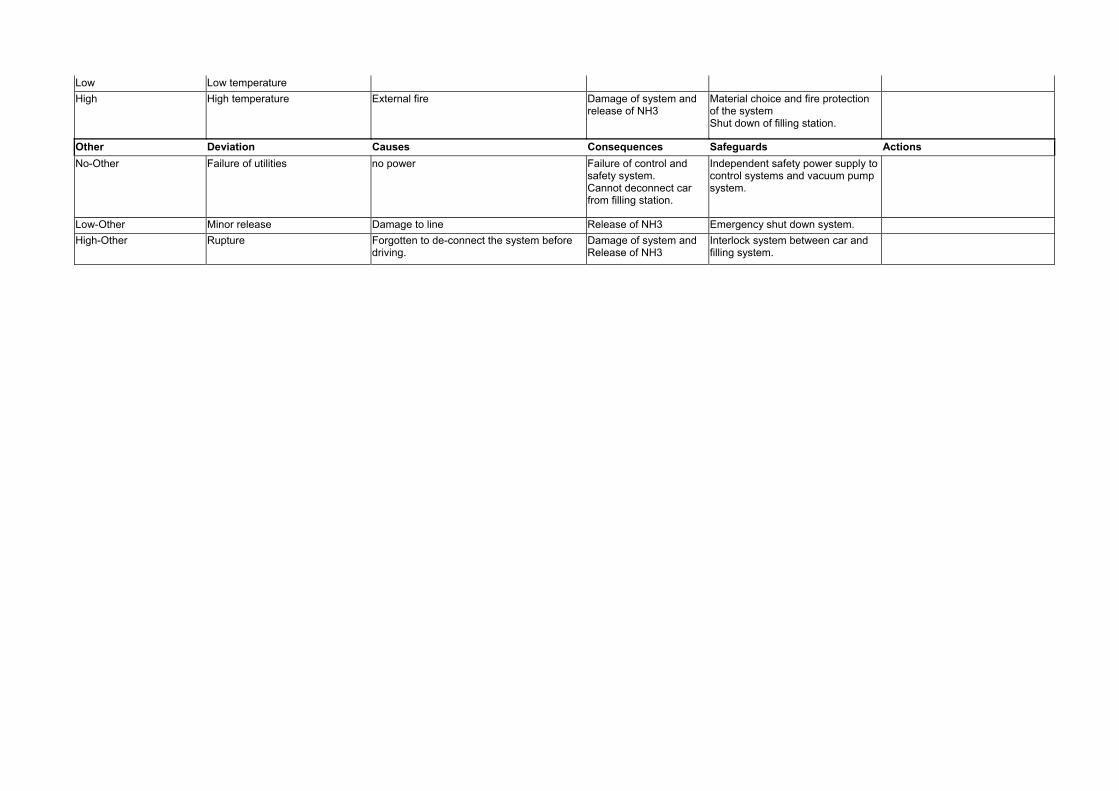
Low Low temperature High High temperature External fire Damage of system and
release of NH3 Material choice and fire protection of the system Shut down of filling station.
Other Deviation Causes Consequences Safeguards ActionsNo-Other Failure of utilities no power Failure of control and
safety system. Cannot deconnect car from filling station.
Independent safety power supply to control systems and vacuum pump system.
Low-Other Minor release Damage to line Release of NH3 Emergency shut down system. High-Other Rupture Forgotten to de-connect the system before
driving. Damage of system and Release of NH3
Interlock system between car and filling system.

Operational Phase: Emtying the filling system Plant: Refuelling station Design/operating pressure
Plant section Vacuum line Design/operating temperature Hazop Group: jepa, nidu Date 18.10.2004
Guide word Deviation Causes Consequences Safeguards Actions Pressure no Atmospheric pressure Leak on suction side during vacuum
pump operation Air in ground tank. System is tested before each
refuellig operation.
low high Hight pressure during required
operation of the vaccum system Vacuum pump failure NH3 in filling line after use. Pressure control on vacuum line.
Cannot disconnect.
Valve closed NH3 in filling line after use. Control system failure NH3 in filling line after use. Non-return valve stucked in open
position. NH3 in filling line after use.
Temperature Deviation Causes Consequences Safeguards Actionshigh High temperature short cut in electrical system Damage of system
Fire - release Use of classified components
Flow Deviation Causes Consequences Safeguards Actionsno Vacuum pump not running NH3 in filling line after use. Valve not open Control system failure low high Filling system still running Also Liquid in vacuum line Filling system still running Possible damage to vacuum system Designed to withstand liquid Depends on design of liquid
separator.
Other Deviation Causes Consequences Safeguards Actionsno Utility failure Vacuum pump not running Cannot disconnect Independent powersupply low External leak Cannot reach vacuum Cannot disconnect high External rupture Collision System collision protected. other than wrong substance In-leak during use of vacuum
system Air into system Water into system
Pressure control detects leakage.


Mission
To promote an innovative and environmentally sustainable technological development within the areas of energy, industrial technology and bioproduction through research, innovation and advisory services.
Vision
Risø’s research shall extend the boundaries for the understanding of nature’s processes and interactions right down to the molecular nanoscale.
The results obtained shall set new trends for the development of sustainable technologies within the fields of energy, industrial technology and biotechnology.
The efforts made shall benefit Danish society and lead to the development of new multi-billion industries.
www.risoe.dk


![GUIDANCE FOR INSPECTION OF AND LEAK DETECTION IN …...ammonia rail transport [Ref 9] and inspection of atmospheric, refrigerated ammonia storage tanks [Ref 12]. Ammonia is produced](https://img.pdfslide.net/doc/110x75/5e9aa764d2b29c0edf5f25bb/guidance-for-inspection-of-and-leak-detection-in-ammonia-rail-transport-ref.jpg)