Embed Size (px)
Citation preview

See discussions, stats, and author profiles for this publication at: https://www.researchgate.net/publication/268803432
IJVD 45(3) Paper 8
Data · November 2014
CITATIONS
0
READS
96
2 authors:
Some of the authors of this publication are also working on these related projects:
ecoDriver View project
Programme for Simulation Innovation (PSI) Theme3 View project
Samantha Jamson
University of Leeds
59 PUBLICATIONS 592 CITATIONS
SEE PROFILE
A. Hamish Jamson
University of Leeds
55 PUBLICATIONS 1,332 CITATIONS
SEE PROFILE
All content following this page was uploaded by Samantha Jamson on 26 November 2014.
The user has requested enhancement of the downloaded file.

Int. J. Vehicle Design, Vol. 45, No. 3, 2007 397
Copyright © 2007 Inderscience Enterprises Ltd.
Safety implications of a pedestrian protection system: the driver’s point of view
Samantha L. Jamson* and A. Hamish Jamson Institute for Transport Studies, University of Leeds, LS2 9JT, UK Fax: +44 (0)113 3435334 E-mail: [email protected] E-mail: [email protected] *Corresponding author
Abstract: Active pedestrian protection systems can mitigate the outcome of a collision. This study investigated whether an active bonnet could have any negative impacts on the driver as, when deployed, it partially occludes the driver’s visual field. When the bonnet was deployed, drivers decreased their speed. On straights, drivers maintained their speed and lateral control for up to three seconds of partial occlusion. For curved sections, this reduced to two seconds. When occlusion was lifted, drivers tended to then deviate in lane – a possible ‘panic’ effect. As drivers became more familiar with the system, they applied the brakes less.
Keywords: active bonnet; occlusion; driver performance; safety.
Reference to this paper should be made as follows: Jamson, S.L. and Jamson, A.H. (2007) ‘Safety implications of a pedestrian protection system: the driver’s point of view’, Int. J. Vehicle Design, Vol. 45, No. 3, pp.397–410.
Biographical notes: Samantha L. Jamson is a senior research fellow at the Institute for Transport Studies, University of Leeds. Her research interests are in the evaluation of driver performance, in particular relating to the safety of new vehicle systems. She has published in journals such as Ergonomics, Transportation Research and Safety Science.
A. Hamish Jamson manages the Driving Simulator and is a senior research fellow at the Institute for Transport Studies, University of Leeds. He is a Mechanical Engineer, his research focuses on the validation of driving simulators and has special interest in the field of vehicle dynamics and control.
1 Introduction
More than one million people worldwide are killed in road accidents every year, a third of which are pedestrians (The World Bank, 2006). Compared with injured vehicle occupants, pedestrians sustain more diverse injuries resulting in higher injury severity scores and mortality (Brainard, 1986). In a vehicle-pedestrian front impact, the vehicle bumper makes contact with the lower limbs, the bonnet then strikes the lower limb or pelvis and the head and upper torso then hit the surface of the bonnet or windscreen,
398 S.L. Jamson and A.H. Jamson
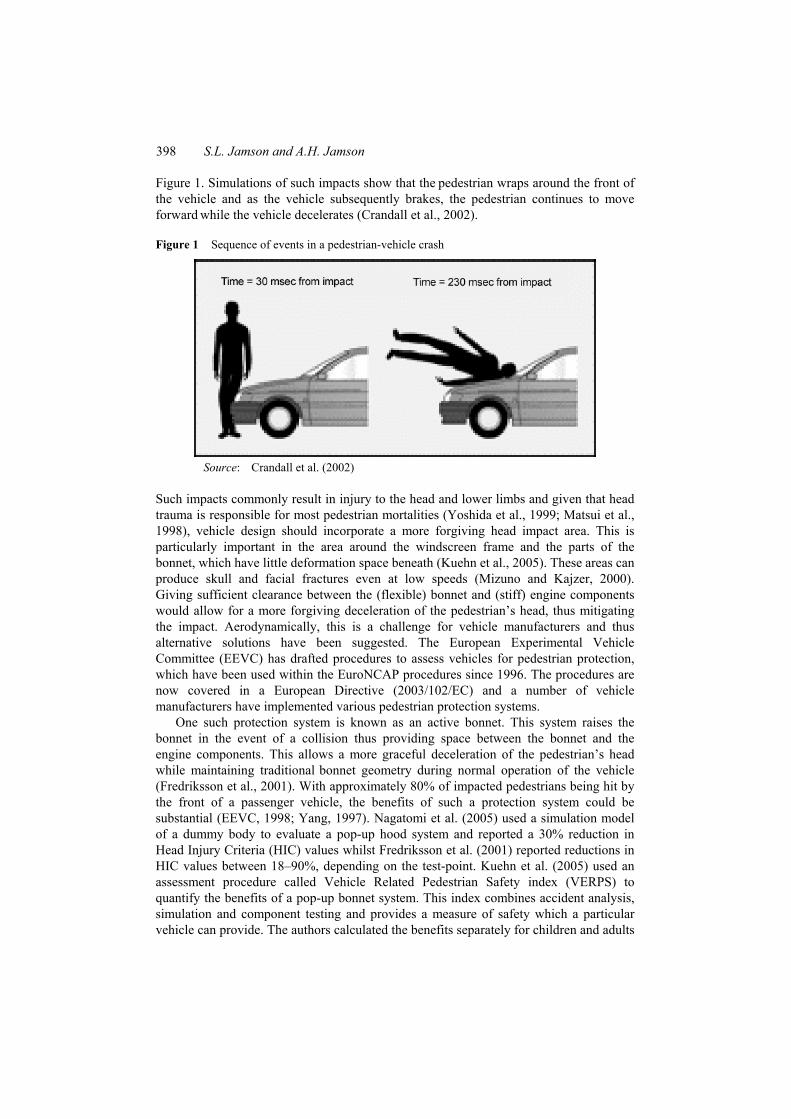
Figure 1. Simulations of such impacts show that the pedestrian wraps around the front of the vehicle and as the vehicle subsequently brakes, the pedestrian continues to move forward while the vehicle decelerates (Crandall et al., 2002).
Figure 1 Sequence of events in a pedestrian-vehicle crash
Source: Crandall et al. (2002)
Such impacts commonly result in injury to the head and lower limbs and given that head trauma is responsible for most pedestrian mortalities (Yoshida et al., 1999; Matsui et al., 1998), vehicle design should incorporate a more forgiving head impact area. This is particularly important in the area around the windscreen frame and the parts of the bonnet, which have little deformation space beneath (Kuehn et al., 2005). These areas can produce skull and facial fractures even at low speeds (Mizuno and Kajzer, 2000). Giving sufficient clearance between the (flexible) bonnet and (stiff) engine components would allow for a more forgiving deceleration of the pedestrian’s head, thus mitigating the impact. Aerodynamically, this is a challenge for vehicle manufacturers and thus alternative solutions have been suggested. The European Experimental Vehicle Committee (EEVC) has drafted procedures to assess vehicles for pedestrian protection, which have been used within the EuroNCAP procedures since 1996. The procedures are now covered in a European Directive (2003/102/EC) and a number of vehicle manufacturers have implemented various pedestrian protection systems.
One such protection system is known as an active bonnet. This system raises the bonnet in the event of a collision thus providing space between the bonnet and the engine components. This allows a more graceful deceleration of the pedestrian’s head while maintaining traditional bonnet geometry during normal operation of the vehicle (Fredriksson et al., 2001). With approximately 80% of impacted pedestrians being hit by the front of a passenger vehicle, the benefits of such a protection system could be substantial (EEVC, 1998; Yang, 1997). Nagatomi et al. (2005) used a simulation model of a dummy body to evaluate a pop-up hood system and reported a 30% reduction in Head Injury Criteria (HIC) values whilst Fredriksson et al. (2001) reported reductions in HIC values between 18–90%, depending on the test-point. Kuehn et al. (2005) used an assessment procedure called Vehicle Related Pedestrian Safety index (VERPS) to quantify the benefits of a pop-up bonnet system. This index combines accident analysis, simulation and component testing and provides a measure of safety which a particular vehicle can provide. The authors calculated the benefits separately for children and adults

Safety implications of a pedestrian protection system 399
and found that the VERPS score reduced markedly when a pop-up bonnet was introduced. Children were particularly protected as their smaller size means they are more likely to impact with the bonnet, rather than the windscreen or A-pillars.
The active bonnet system is one which has the potential to decrease the severity of pedestrian injuries. However, one of the characteristics of the active bonnet is that when deployed, it partially occludes the driver’s visual field. Therefore, whilst pedestrian safety is improved, there are unknown effects of such partial occlusion on driver performance. Previous research studies have used full occlusion paradigms as a way of, for example, quantifying distraction caused by in-vehicle technologies, such as route guidance systems. Table 1 lists a number of thresholds of visual demand found in the literature. These are thresholds which define the maximum amount of time drivers’ eyes should be off the road.
Table 1 Proposed visual demand thresholds
Source Measure Threshold
Single glance duration 2 seconds Zwahlen et al. (1988) Glance frequency 4 glances
ISO 15007-1 (1997) Single glance duration 2 seconds SAE J2396 (1999) Single glance duration 2.5 seconds
While Zwahlen et al. (1988) report some empirical evidence supporting their proposed thresholds, neither ISO 15007-1 (1997) nor SAE J2364 (1999) state the background for claiming their thresholds. Hence these rules should be considered as approximations, rather than a threshold above which safety decreases. Extended glances away from the forward view (or in this case occlusion of the forward view by the deployment of the system) could reduce the amount of visual information available. As a result of this, drivers’ control of the vehicle could be impaired.
As demonstrated in Senders et al.’s (1967) model of driver visual sampling and information processing, drivers are able to glance away from the forward view as long as the amount of external traffic information stored in the working memory can meet the demand of information input for the driving task. Hence, the difficulty of the driving task largely contributes to the duration that drivers can afford to glance away from the road scene ahead without compromising the ability to make satisfactory manoeuvres. For example, glances of 3 seconds might not lead to safety implications when driving at 10 mph on an open road. In contrast, a driver may not be able to afford glances of more than 1 second without endangering themselves and other road users when driving at 30 mph in an urban environment. External objects such as other road users or infrastructure layouts are easily predictable in the former situation but not in the latter. Hence, an assessment criterion that uses only glance duration without taking driving task difficulty into account is inappropriate. Indeed, Lai (2005) found that none of the secondary task performance measures (e.g., glance duration) was a reliable predictor of driving performance, without taking the influence of the difficulty of the driving task (e.g., driving speed) into account.
The study reported here attempted to quantify the amount of disruption to the normal driving task, when the system was deployed in a saloon car. The length of time that the active bonnet is employed for will also impact on driver performance and a vehicle
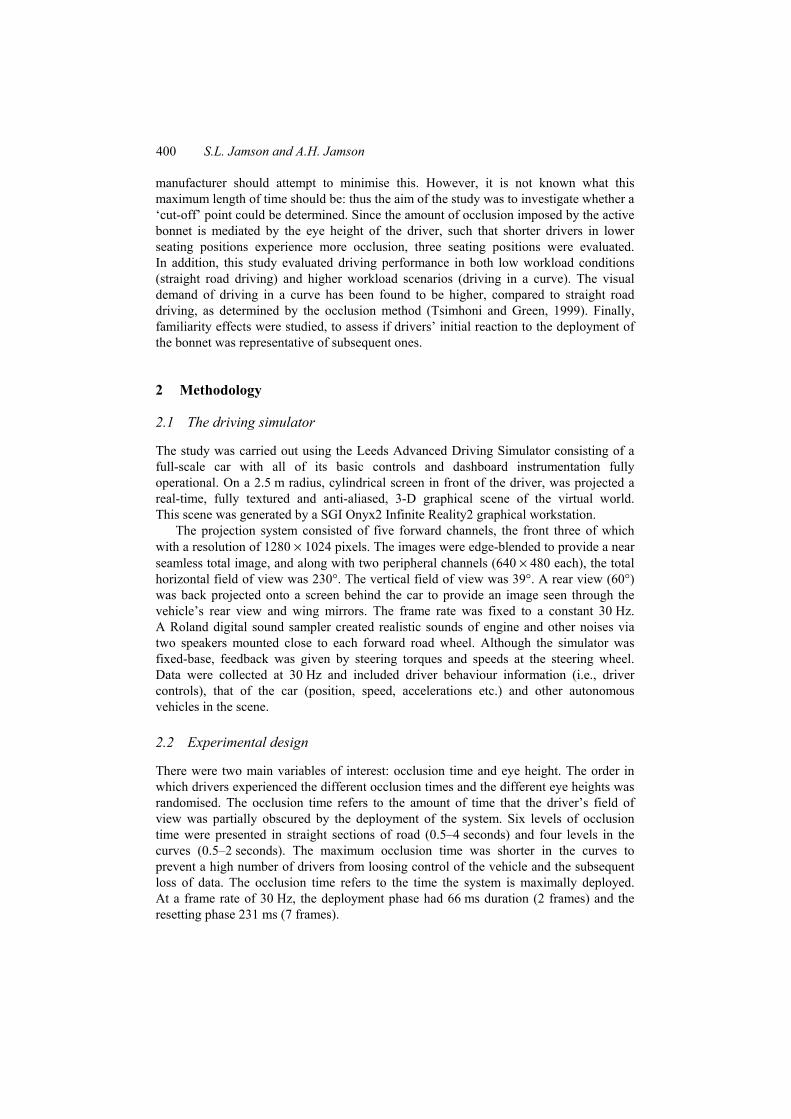
400 S.L. Jamson and A.H. Jamson
manufacturer should attempt to minimise this. However, it is not known what this maximum length of time should be: thus the aim of the study was to investigate whether a ‘cut-off’ point could be determined. Since the amount of occlusion imposed by the active bonnet is mediated by the eye height of the driver, such that shorter drivers in lower seating positions experience more occlusion, three seating positions were evaluated. In addition, this study evaluated driving performance in both low workload conditions (straight road driving) and higher workload scenarios (driving in a curve). The visual demand of driving in a curve has been found to be higher, compared to straight road driving, as determined by the occlusion method (Tsimhoni and Green, 1999). Finally, familiarity effects were studied, to assess if drivers’ initial reaction to the deployment of the bonnet was representative of subsequent ones.
2 Methodology
2.1 The driving simulator
The study was carried out using the Leeds Advanced Driving Simulator consisting of a full-scale car with all of its basic controls and dashboard instrumentation fully operational. On a 2.5 m radius, cylindrical screen in front of the driver, was projected a real-time, fully textured and anti-aliased, 3-D graphical scene of the virtual world. This scene was generated by a SGI Onyx2 Infinite Reality2 graphical workstation.
The projection system consisted of five forward channels, the front three of which with a resolution of 1280 × 1024 pixels. The images were edge-blended to provide a near seamless total image, and along with two peripheral channels (640 × 480 each), the total horizontal field of view was 230°. The vertical field of view was 39°. A rear view (60°) was back projected onto a screen behind the car to provide an image seen through the vehicle’s rear view and wing mirrors. The frame rate was fixed to a constant 30 Hz. A Roland digital sound sampler created realistic sounds of engine and other noises via two speakers mounted close to each forward road wheel. Although the simulator was fixed-base, feedback was given by steering torques and speeds at the steering wheel. Data were collected at 30 Hz and included driver behaviour information (i.e., driver controls), that of the car (position, speed, accelerations etc.) and other autonomous vehicles in the scene.
2.2 Experimental design
There were two main variables of interest: occlusion time and eye height. The order in which drivers experienced the different occlusion times and the different eye heights was randomised. The occlusion time refers to the amount of time that the driver’s field of view was partially obscured by the deployment of the system. Six levels of occlusion time were presented in straight sections of road (0.5–4 seconds) and four levels in the curves (0.5–2 seconds). The maximum occlusion time was shorter in the curves to prevent a high number of drivers from loosing control of the vehicle and the subsequent loss of data. The occlusion time refers to the time the system is maximally deployed. At a frame rate of 30 Hz, the deployment phase had 66 ms duration (2 frames) and the resetting phase 231 ms (7 frames).
Safety implications of a pedestrian protection system 401
Drawings were produced which showed various seating positions and occupant sizes and the associated effect on forward vision. A line was drawn from the occupant eye line at a tangent to the bonnet (undeployed) and where this line intersected the ground line, a distance was measured back to the front of the vehicle. The greatest distance measured to the front of the vehicle was judged to be worst case. This process showed that the effect on forward vision for the majority of cases was similar, with the exception of smaller occupants (5%ile) in a low seating position. Therefore, the two extremes of occupant sizes (5%ile and 95%ile) were used for this study assuming the normal driving positions for these occupants were fully forward/uppermost (5%ile) and fully rearward/lowest (95%ile). As the 5%ile fully down was easily the worst case, this was also included.
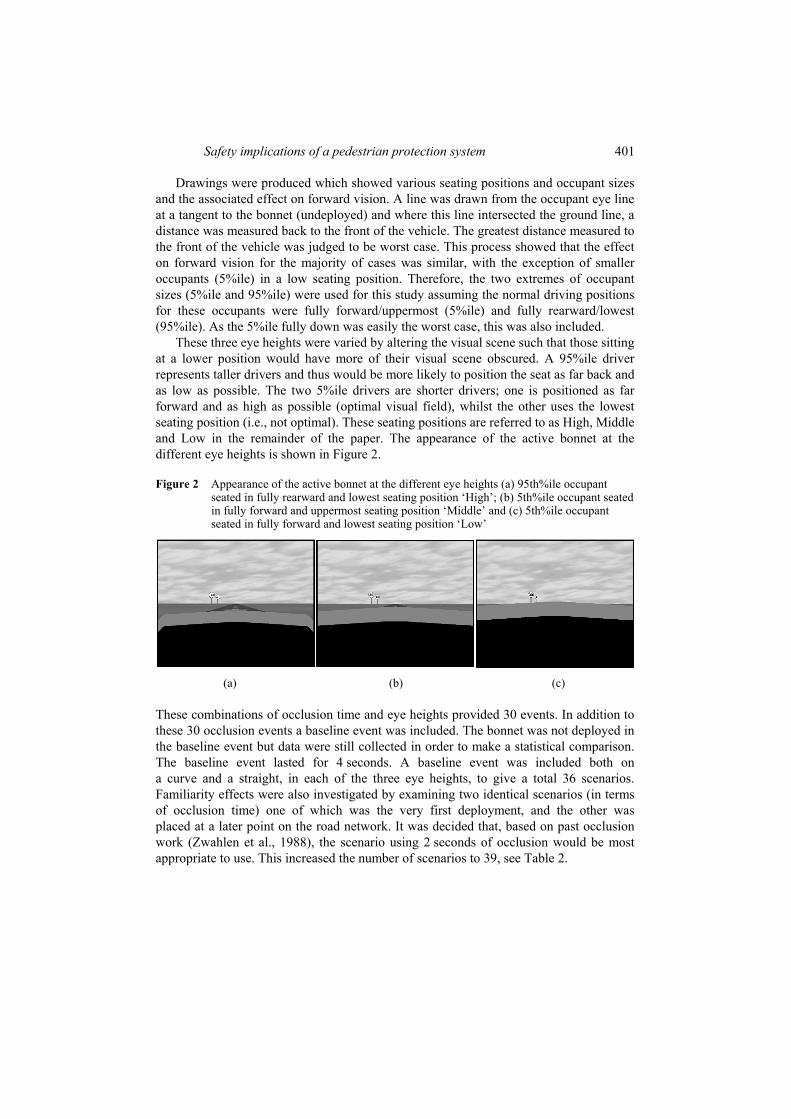
These three eye heights were varied by altering the visual scene such that those sitting at a lower position would have more of their visual scene obscured. A 95%ile driver represents taller drivers and thus would be more likely to position the seat as far back and as low as possible. The two 5%ile drivers are shorter drivers; one is positioned as far forward and as high as possible (optimal visual field), whilst the other uses the lowest seating position (i.e., not optimal). These seating positions are referred to as High, Middle and Low in the remainder of the paper. The appearance of the active bonnet at the different eye heights is shown in Figure 2.
Figure 2 Appearance of the active bonnet at the different eye heights (a) 95th%ile occupant seated in fully rearward and lowest seating position ‘High’; (b) 5th%ile occupant seated in fully forward and uppermost seating position ‘Middle’ and (c) 5th%ile occupant seated in fully forward and lowest seating position ‘Low’
(a) (b) (c)
These combinations of occlusion time and eye heights provided 30 events. In addition to these 30 occlusion events a baseline event was included. The bonnet was not deployed in the baseline event but data were still collected in order to make a statistical comparison. The baseline event lasted for 4 seconds. A baseline event was included both on a curve and a straight, in each of the three eye heights, to give a total 36 scenarios. Familiarity effects were also investigated by examining two identical scenarios (in terms of occlusion time) one of which was the very first deployment, and the other was placed at a later point on the road network. It was decided that, based on past occlusion work (Zwahlen et al., 1988), the scenario using 2 seconds of occlusion would be most appropriate to use. This increased the number of scenarios to 39, see Table 2.

402 S.L. Jamson and A.H. Jamson
Table 2 Matrix of testing scenarios
Seating position Occlusion time (secs) High Middle Low
2.0 Scenario 1 Scenario 14 Scenario 27 0.5 Scenario 2 Scenario 15 Scenario 28 1.0 Scenario 3 Scenario 16 Scenario 29 1.5 Scenario 4 Scenario 17 Scenario 30 2.0 Scenario 5 Scenario 18 Scenario 31 3.0 Scenario 6 Scenario 19 Scenario 32 4.0 Scenario 7 Scenario 20 Scenario 33
Straights
4.0 (baseline) Scenario 8 Scenario 21 Scenario 34 0.5 Scenario 9 Scenario 22 Scenario 35 1.0 Scenario 10 Scenario 23 Scenario 36 1.5 Scenario 11 Scenario 24 Scenario 37 2.0 Scenario 12 Scenario 25 Scenario 38
Curves
4.0 (baseline) Scenario 13 Scenario 26 Scenario 39
2.3 System design
The car manufacturer produced side-profile drawings to provide information on driver’s head position and bonnet length. An animation was created to give the illusion and the associated occlusion of the active bonnet system deploying and resetting. The animation recreated the dimensions of the system when deployed. The virtual bonnet had the same characteristics and behaviour as its real-life equivalent and occluded the view of the driver to the same extent. This was validated against car manufacturer data for the distance in front of the vehicle that is occluded by deployment of the system in the three different conditions. The noise of the active bonnet deploying was recorded and provided in .wav format. This was activated on deployment within the simulation.
2.4 Road layout
The simulated road layout was a general urban scene, Figure 3. The road was a single carriageway in each direction and each lane was 4 m wide. Multiple sections pasted end-on end (with varying road furniture such as buildings and trees) made up the complete road network. One deployment was triggered on each of these road sections. A car ahead was travelling at 40 km/h and participants were instructed to keep up with this car at all times. This was to ensure that drivers travelled at 40 km/h and also allowed the investigation of car-following behaviour. The bonnet was only deployed if the time headway between the two vehicles was 6 seconds or less, i.e., in a car-following situation.

Safety implications of a pedestrian protection system 403
Figure 3 Screen shots from the experimental road
2.5 Data collection and analysis
Data were collected on straight and curved pieces of road; each of these road pieces was divided into three sections of equal length (see Figure 4). The events were designed like this to provide comparative data: the length of time data was sampled was constant within events. The sampling period was different between events due to the fact that occlusion time varies.
Figure 4 Data collection on straight and curved sections of road
The straight section was 600 m long and deployments of the active bonnet occurred mid-way along this section. The curved section consisted of a 139.5 m, 419.5 m radius circular bend to the left followed by 177.1 m, 419.6 m radius circular bend to the right. The deployment of the bonnet occurred at the entrance to the bend.
It was assumed that the driver would react in one of three ways to the deployment of the active bonnet. They could apply the brakes, slow down using engine braking or maintain their speed. Associated with these reactions, we might also observe changes in lateral control of the vehicle. Depending on the amount of occlusion, drivers may exhibit a tendency to wander in their lane more. However, it should be noted that drivers may compensate for this decrease in performance by reducing their speed. Thus these two variables are often interrelated. The following measures were used as indices of driver behaviour.
404 S.L. Jamson and A.H. Jamson
• Speed was measured in the three road sections and measures of mean speed and changes in speed were also calculated.
• Braking behaviour was recorded and a measure of propensity to brake and the severity of that braking were calculated.
• Standard Deviation of Lateral Position (SDLP) is a measure of how absolute lateral position varies over time (or distance) and was used here as an indicator of lateral control.
• Time-to-line-crossing (TLC) is an alternative to SDLP and describes the instantaneous time for the edge of the wheel to cross the edge (or centre) line, should the vehicle remain on its current course with the same speed (Godthelp and Konings, 1981). As the vehicle approaches the edge or centre line, TLC decreases until it reaches a minimum.
The data were checked for normality and homogeneity of variance using the Kolmogorov-Smirnov and Levene tests respectively and subjected to Analysis of Variance (ANOVA) to identify changes in behaviour. All levels of interaction were included in the model. Comparisons were made between different eye heights, and occlusion times in the separate road sections. By comparing data obtained before, during and after occlusion, the effect of the deployment of the active bonnet was determined. Separate analyses were carried out for the straight and curved road environments.
A total of 35 participants were tested, recruited from an existing database. The sample included 17 males, with a reported average annual mileage of 13,020 miles. In addition, 18 females took part with a reported average annual mileage of 8080 miles. Participants were paid £10 and were told that the aim of the study was to establish the appropriate seating position for drivers.
3 Results
The results are divided into four sections; the first three sections focus on driving performance variables (speed, braking and lateral positioning). The fourth section presents the results for the learning effects. Within these four sections are presented the results for both the straight and curved roads.
3.1 Speed
A number of speed measures were taken. The first used a measure of mean speed across the three Road Sections of interest (before, during and after occlusion). For the straight sections of road, statistical analysis indicated that there was an effect of eye height and occlusion time on mean speed.
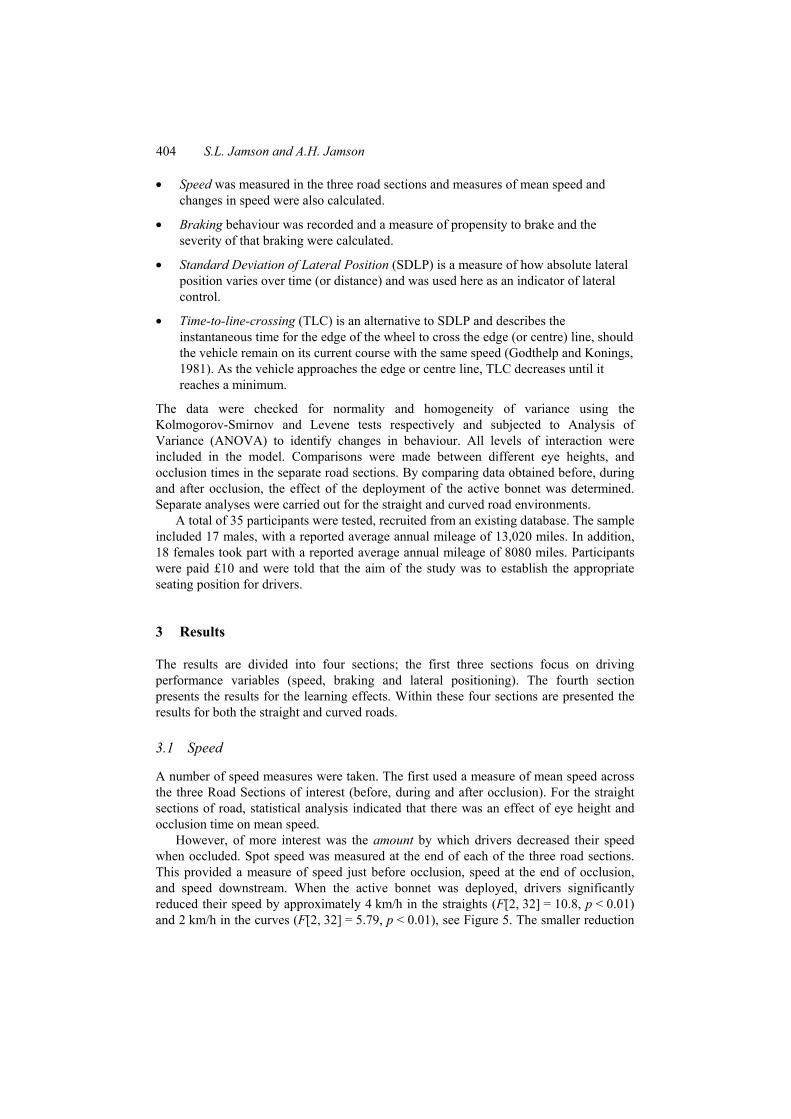
However, of more interest was the amount by which drivers decreased their speed when occluded. Spot speed was measured at the end of each of the three road sections. This provided a measure of speed just before occlusion, speed at the end of occlusion, and speed downstream. When the active bonnet was deployed, drivers significantly reduced their speed by approximately 4 km/h in the straights (F[2, 32] = 10.8, p < 0.01) and 2 km/h in the curves (F[2, 32] = 5.79, p < 0.01), see Figure 5. The smaller reduction
Safety implications of a pedestrian protection system 405
in speed in the curved sections is due to the fact that the occlusion times here were not as long as in the straights.
Figure 5 Mean speed before, during and after occlusion
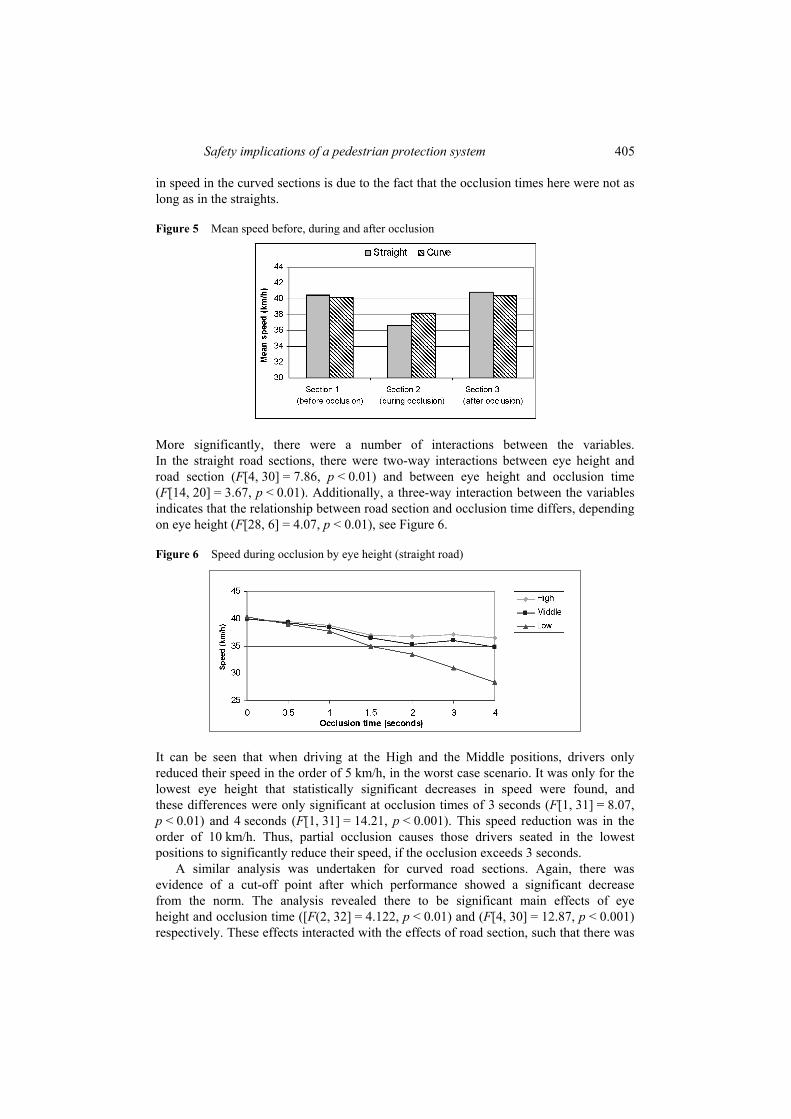
More significantly, there were a number of interactions between the variables. In the straight road sections, there were two-way interactions between eye height and road section (F[4, 30] = 7.86, p < 0.01) and between eye height and occlusion time (F[14, 20] = 3.67, p < 0.01). Additionally, a three-way interaction between the variables indicates that the relationship between road section and occlusion time differs, depending on eye height (F[28, 6] = 4.07, p < 0.01), see Figure 6.
Figure 6 Speed during occlusion by eye height (straight road)
It can be seen that when driving at the High and the Middle positions, drivers only reduced their speed in the order of 5 km/h, in the worst case scenario. It was only for the lowest eye height that statistically significant decreases in speed were found, and these differences were only significant at occlusion times of 3 seconds (F[1, 31] = 8.07, p < 0.01) and 4 seconds (F[1, 31] = 14.21, p < 0.001). This speed reduction was in the order of 10 km/h. Thus, partial occlusion causes those drivers seated in the lowest positions to significantly reduce their speed, if the occlusion exceeds 3 seconds.
A similar analysis was undertaken for curved road sections. Again, there was evidence of a cut-off point after which performance showed a significant decrease from the norm. The analysis revealed there to be significant main effects of eye height and occlusion time ([F(2, 32] = 4.122, p < 0.01) and (F[4, 30] = 12.87, p < 0.001) respectively. These effects interacted with the effects of road section, such that there was

406 S.L. Jamson and A.H. Jamson
a significant difference in the speed effect, depending on how much the visual scene was occluded by and for how long ([F(16, 18] = 4.122, p < 0.01). Looking at Figure 7, it can be seen that when driving at the High and the Middle positions, drivers only reduced their speed by approximately 5 km/h. However, when driving at the lowest eye height, drivers reduced their speed significantly more (up to 8 km/h). This difference was statistically significant only at the longest occlusion time of 2 seconds (F[1, 31] = 7.02, p < 0.01).
Figure 7 Speed during occlusion by eye height (curves)
Thus, when driving in a curve, partial occlusion caused those drivers seated in the lowest positions to significantly reduce their speed, if the occlusion exceeded 2 seconds.
3.2 Braking
Whilst the speed measurements analyses indicated that drivers decelerate during partial occlusion, it is not possible to establish whether this was due to ‘foot-off-accelerator’ braking or foot brake activation. To clarify this, the propensity to brake was recorded during each of the events, see Figure 8. It can be seen that as eye height becomes progressively lower, more drivers engage in braking. A chi-square analysis revealed that, in straight sections of road, this difference was significant for occlusion times of 3 seconds and over. This effect was significant for the lowest seating position only.
Figure 8 Number of drivers engaging in braking (straights)
Safety implications of a pedestrian protection system 407
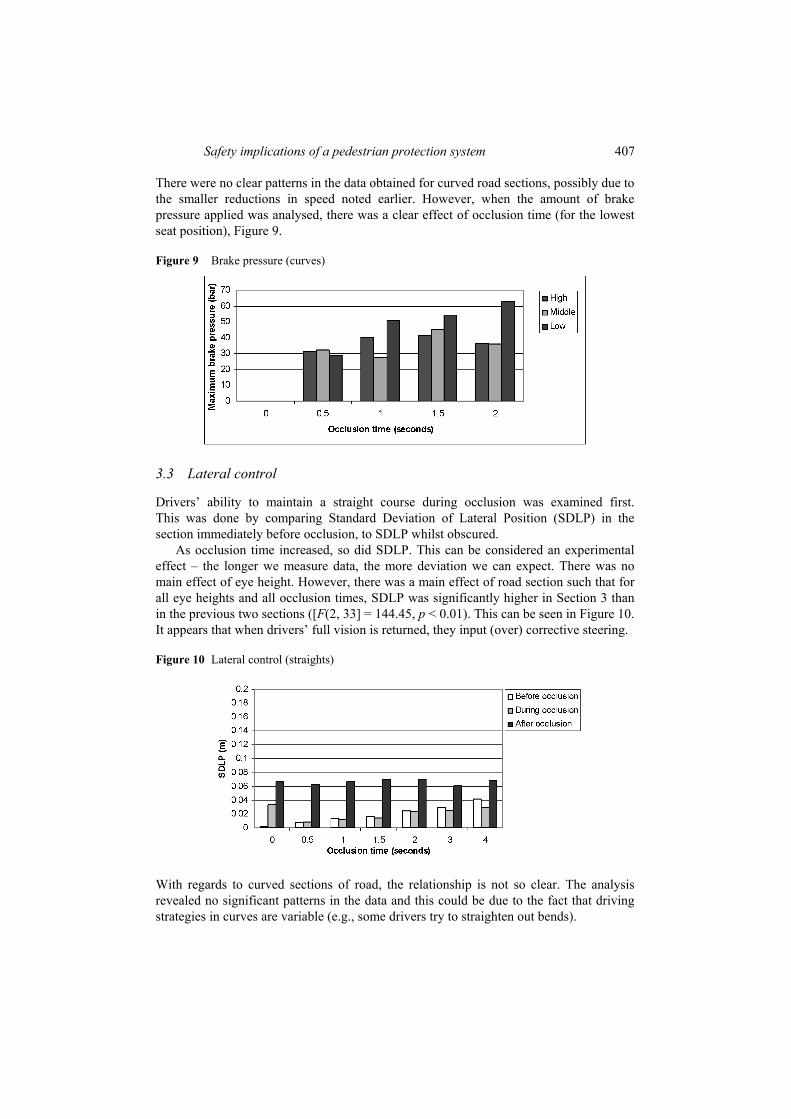
There were no clear patterns in the data obtained for curved road sections, possibly due to the smaller reductions in speed noted earlier. However, when the amount of brake pressure applied was analysed, there was a clear effect of occlusion time (for the lowest seat position), Figure 9.
Figure 9 Brake pressure (curves)
3.3 Lateral control
Drivers’ ability to maintain a straight course during occlusion was examined first. This was done by comparing Standard Deviation of Lateral Position (SDLP) in the section immediately before occlusion, to SDLP whilst obscured.
As occlusion time increased, so did SDLP. This can be considered an experimental effect – the longer we measure data, the more deviation we can expect. There was no main effect of eye height. However, there was a main effect of road section such that for all eye heights and all occlusion times, SDLP was significantly higher in Section 3 than in the previous two sections ([F(2, 33] = 144.45, p < 0.01). This can be seen in Figure 10. It appears that when drivers’ full vision is returned, they input (over) corrective steering.
Figure 10 Lateral control (straights)
With regards to curved sections of road, the relationship is not so clear. The analysis revealed no significant patterns in the data and this could be due to the fact that driving strategies in curves are variable (e.g., some drivers try to straighten out bends).
408 S.L. Jamson and A.H. Jamson
3.4 Familiarity effects
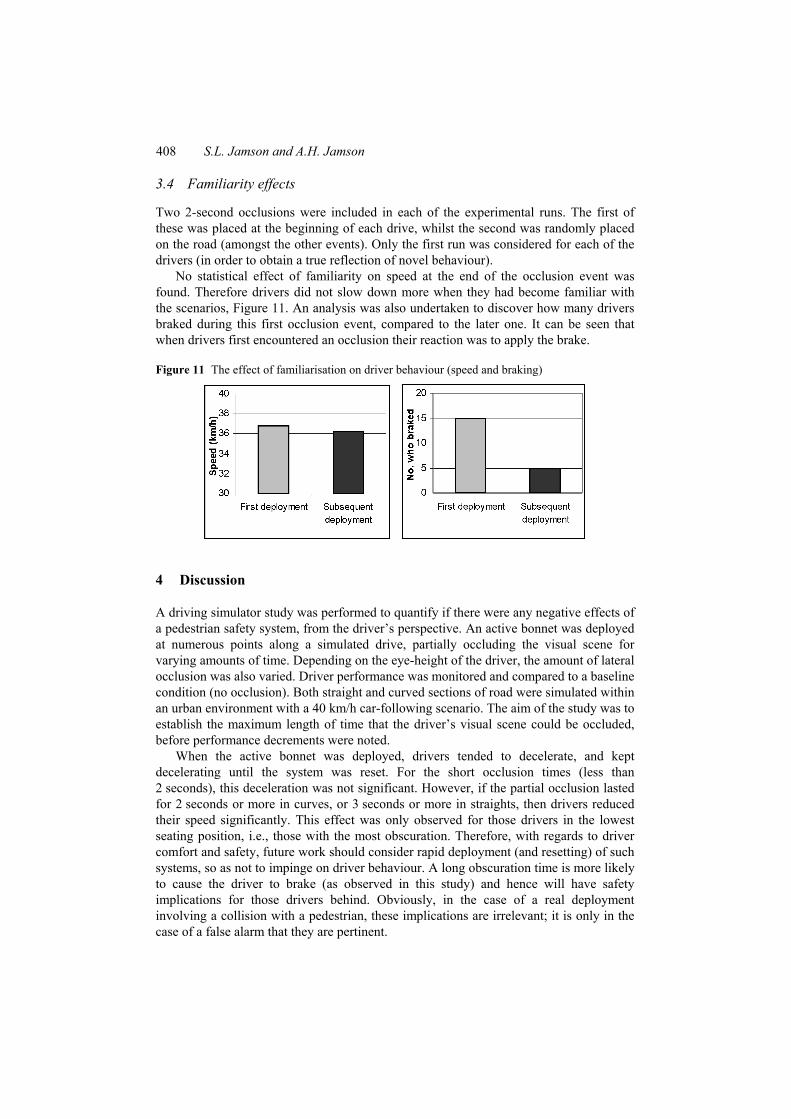
Two 2-second occlusions were included in each of the experimental runs. The first of these was placed at the beginning of each drive, whilst the second was randomly placed on the road (amongst the other events). Only the first run was considered for each of the drivers (in order to obtain a true reflection of novel behaviour).
No statistical effect of familiarity on speed at the end of the occlusion event was found. Therefore drivers did not slow down more when they had become familiar with the scenarios, Figure 11. An analysis was also undertaken to discover how many drivers braked during this first occlusion event, compared to the later one. It can be seen that when drivers first encountered an occlusion their reaction was to apply the brake.
Figure 11 The effect of familiarisation on driver behaviour (speed and braking)
4 Discussion
A driving simulator study was performed to quantify if there were any negative effects of a pedestrian safety system, from the driver’s perspective. An active bonnet was deployed at numerous points along a simulated drive, partially occluding the visual scene for varying amounts of time. Depending on the eye-height of the driver, the amount of lateral occlusion was also varied. Driver performance was monitored and compared to a baseline condition (no occlusion). Both straight and curved sections of road were simulated within an urban environment with a 40 km/h car-following scenario. The aim of the study was to establish the maximum length of time that the driver’s visual scene could be occluded, before performance decrements were noted.
When the active bonnet was deployed, drivers tended to decelerate, and kept decelerating until the system was reset. For the short occlusion times (less than 2 seconds), this deceleration was not significant. However, if the partial occlusion lasted for 2 seconds or more in curves, or 3 seconds or more in straights, then drivers reduced their speed significantly. This effect was only observed for those drivers in the lowest seating position, i.e., those with the most obscuration. Therefore, with regards to driver comfort and safety, future work should consider rapid deployment (and resetting) of such systems, so as not to impinge on driver behaviour. A long obscuration time is more likely to cause the driver to brake (as observed in this study) and hence will have safety implications for those drivers behind. Obviously, in the case of a real deployment involving a collision with a pedestrian, these implications are irrelevant; it is only in the case of a false alarm that they are pertinent.
Safety implications of a pedestrian protection system 409
Due to these observed decreases in speed, drivers were able to maintain control of the vehicle whilst their vision was partially obscured, although there were some observed effects when occlusion was lifted. Drivers tended to deviate in lane when full vision was returned. It could be concluded that this was a ‘panic’ effect, with drivers over-correcting their steering. This panic effect appeared to subside somewhat, in terms of their propensity to brake. Driver reaction to the first deployment was compared to a subsequent 2 seconds deployment. It was noted that whilst there were no differences in terms of speed reduction, when drivers first encountered an occlusion their reaction was to apply the brake. This reaction decreased on familiarity.
In conclusion, according to the scenarios tested in this study, drivers appear to be able to cope with partial occlusions of two seconds or less. As long as the active bonnet is able to reset itself within this timeframe, there should be no adverse effects on driver performance, in the event of a false alarm. The obvious benefits in terms of pedestrian safety will not be compromised by adverse effects on the driver. In order for vehicle manufacturers to take full advantage of an active bonnet system, further simulation and testing should develop algorithms that incorporate driving performance, the percentage of the windscreen occluded and the length of occlusion. This could be non-vehicle specific and allow designers to consider a range of occupants and seating positions.
Acknowledgements
This research was carried out on behalf of Jaguar Cars Ltd. The authors are grateful for the funding and technical guidance received via Martin Harvey at Jaguar.
References Brainard, B. (1986) ‘Injury profiles in pedestrian motor vehicle trauma’, Ann. Emerg. Med.,
Vol. 18, pp.881–883. Crandall, J.R., Bhalla, K.S. and Madeley, N.J. (2002) ‘Designing road vehicles for pedestrian
protection’, BMJ, Vol. 324, pp.1145–1148. EEVC (1998) ‘Improved test methods to evaluate pedestrian protection afforded by passenger
cars’, Report, European Experimental Vehicle Committee, Working Group 17, Document No. 100.
Fredriksson, R., Häland, Y. and Yang, J. (2001) ‘Evaluation of a new pedestrian head injury protection system with a sensor in the bumper and lifting of the bonnet’s rear part’, Proceedings of the 17th International Technical Conference on the Enhanced Safety of Vehicles, www-nrd.nhtsa.dot.gov/departments/nrd-01/esv/esv.html.
Godthelp, H. and Konings, H. (1981) ‘Levels of steering control; some notes on the time-to-line crossing concept’, Proceedings of the first European Annual Conference on Human Decision and Manual Control, Technical University, Delft, Netherlands.
ISO 15007-1 (1997) Road Vehicles – Transport Information and Control Systems – Man Machine Interface – Definitions and Metrics Related to the Measurement of Driver Visual Behaviour, ISO/TC22/SC13/WG8/N115, International Organisation for Standardisation, Geneva.
Kuehn, M., Froeming, R. and Schindler, V. (2005) ‘Assessment of vehicle related pedestrian safety’, Proceedings of the 19th International Technical Conference on the Enhanced Safety of Vehicles, http://www-nrd.nhtsa.dot.gov/departments/nrd-01/esv/19th/esv19.htm.
Lai, F.C.H. (2005) Driver Attentional Demand to Dual-task Performance, PhD Thesis, Institute for Transport Studies, University of Leeds.

410 S.L. Jamson and A.H. Jamson
Matsui, Y., Ishikawa, H. and Sasaki, A. (1998) ‘Validation of pedestrian upper legform impact test – reconstruction of pedestrian accidents’, Proceedings of the 16th International Technical Conference on the Enhanced Safety of Vehicles, http://www-nrd.nhtsa.dot.gov/departments/ nrd-01/esv/16th/esv16th.htm.
Mizuno, K. and Kajzer, J. (2000) ‘Head injuries in vehicle-pedestrian impact’, Proceedings of the SAE (Society of Automotive Engineers) 2000 World Congress, March 6–9, Detroit, Michigan, Warrendale, PA, SAE, SAE Paper No 2000-01-0157.
Nagatomi, K., Hanayama, K., Ishizaki, T., Sasaki, S. and Matsuda, K. (2005) ‘Development and full-scale dummy tests of a pop-up hood system for pedestrian protection. Assessment of vehicle related pedestrian safety’, Proceedings of the 19th International Technical Conference on the Enhanced Safety of Vehicles, http://www-nrd.nhtsa.dot.gov/departments/nrd-01/esv/ 19th/esv19.htm.
SAE J2364 (1999) Navigation and Route Guidance Function Accessibility while Driving, ISO/TC22/SC13/WG8/N232, International Organisation for Standardisation, Geneva.
Senders, J.W., Kristofferson, A.B., Levison, W.H., Dietrich, C.W. and Ward, J.L. (1967) ‘The attentional demand of automobile driving’, Highway Research Record, Vol. 195, pp.15–33.
The World Bank Group (2006) Road Safety. www.worldbank.org/html/fpd/transport/roads/ safety.htm.
Tsimhoni, O. and Green, P. (1999) ‘Visual demand of driving curves determined by visual occlusion’, Paper presented at the Vision in Vehicles 8 Conference, Boston, MA.
Yang, J.K. (1997) Injury Biomechanics in Car-pedestrian Collisions: Development, Validation and Application of Human-body Mathematical Models, Doctoral Thesis, Dept. of Injury Prevention, Chalmers University of Technology, Goeteborg, Sweden.
Yoshida, S., Igarashi, N., Takahashi, A. and Imaizumi, I. (1999) ‘Development of a vehicle structure with protective features for pedestrians’, SAE International Congress and Exposition, paper 1999-01-0075, Detroit, USA.
Zwahlen, H.T., Adams Jr., C.C. and DeBald, D.P. (1988) ‘Safety aspects of CRT touch panel controls in automobiles’, in Gale, A.G., Freeman, M.H., Haslegrave, C.M., Smith, P. and Taylor, S.P. (Eds.): Vision in Vehicles II, North-Holland, Amsterdam, pp.335–344.
View publication statsView publication stats