Embed Size (px)
Citation preview

- 1 -
Published 25 January 2018
Safety in Custody Statistics, England and Wales:
Deaths in Prison Custody to December 2017
Assaults and Self-harm to September 2017
Main Points
Number of deaths
continues to fall
There were 295 deaths in prison custody in the 12 months to
December 2017, down 17% from 354 in the previous year. Three
of these were homicides, the same as the previous year. There
were 70 self-inflicted deaths, down from 122 in the previous year, 2
of which were in the female estate, compared to 12 in the previous
12 months.
Self-harm incidents
continue to rise,
reaching record
highs
Self-harm reached a record high of 42,837 incidents in the 12
months to September 2017, up 12% from the previous year. The
number of incidents requiring hospital attendance rose by 15% to
3,007. Quarterly self-harm incidents rose by 10% to a record high
of 11,904 incidents.
Assaults and
serious assaults
continue to rise,
reaching record
highs
Assaults have continued to increase, reaching a record high of
28,165 incidents in the 12 months to September 2017, up 12%
from the previous year. Of these, 3,726 (13%) were serious
assaults, up 10% from the previous year. In the most recent
quarter, assault incidents increased by 10% to a new record high of
7,810.
Prisoner-on-prisoner assaults
continue to rise, reaching record
highs
There were 20,346 prisoner-on-prisoner assaults, up 9% from the
previous year, and the highest in the time series. Of these, 2,961
(15%) were serious assaults, up 11% from the previous year.
Prisoner-on-prisoner assaults saw a 10% increase in the latest
quarter, reaching a new quarterly record high of 5,645.
Assaults on staff continue to rise, reaching record
highs
There were 7,828 assaults on staff, up 22% from the previous
year. Serious assaults on staff reached 787 in the 12 months to
September 2017, up 3% on the previous period. Assaults on staff
in the latest quarter increased by 11%, reaching a new quarterly
record high of 2,225 incidents.
Safety in custody statistics cover deaths, self-harm and assaults in prison custody in England and
Wales, with figures in quarterly summary tables presented on a 12-month rolling basis over an
11-year time series. Supplementary annual tables, providing more in-depth statistics on deaths,
self-harm and assaults on a calendar year basis, underlying data files with pivot tables providing
lower level granularity, and a guidance technical document are also available alongside this
bulletin, and can be found at www.gov.uk/government/collections/safety-in-custody-statistics
- 2 -
1 Deaths: 12 months ending December 2017
Number of deaths continues to fall
In the 12 months to December 2017, there were 295 deaths in prison custody, down 59 from the previous year. Of these, 70 deaths were self-inflicted, down 52 from the previous year.
Figure 1: Quarterly 12-month rolling rate of deaths per 1,000 prisoners, 12 months ending December 2007 to 12 months ending December 2017, with annualised quarterly rates1
In the 12 months to December 2017 there were 295 deaths in prison custody, a decrease of 17%
from 354 in the previous year, at a rate of 3.4 deaths per 1,000 prisoners. The most recent
quarter saw the number of deaths increase to 82, up 19 from the three months to September
2017. Quarterly death figures should be considered with caution due to greater volatility and the
potential for seasonal effects. Long-term trends and more detail are presented in annual tables.
There were 70 apparent self-inflicted deaths, down 43% from 122 in the previous year. On a rate
basis this is 0.8 instances per 1,000 prisoners. Within the female estate, there were 2 self-
inflicted deaths at a rate of 0.5 per 1,000 prisoners, down from 12 incidents in the previous 12
months. There were 3 apparent homicides, the same as the previous year. Homicides in prison
custody remain relatively rare, accounting for around 1% of all deaths over the last ten years.
There were 184 deaths due to natural causes, a decrease of 10% from 204 in the previous year.
Natural-cause deaths were at a rate of 2.1 per 1,000 prisoners.
There were 38 deaths recorded as ‘other’ in the 12 months to December 2017, 34 of which are
‘awaiting further information’ prior to being classified. In some cases, the results of the toxicology
and post-mortem tests are inconclusive, meaning classification cannot be arrived at until inquest
(which can be a considerable time after the death), while other cases remain awaiting results at
the time of publication. There has been a particularly high number of deaths awaiting further
classification in this period. As a result, the number of deaths in the individual categories is not
directly comparable with earlier years: it is likely that numbers in some categories will be revised
upwards once classifications have been finalised.
1 The annualised quarterly rate is an estimate of the annual rate calculated from data in one quarter and also taking into account the number of days in that quarter.
- 3 -
2 Self-harm: 12 months to September 2017
Self-harm incidents continue to rise, reaching record highs
Self-harm has reached a record high of 42,837 incidents, up 12% from the previous year. The number of incidents also increased by 10% quarter on quarter, to a record high of 11,904. Incidents requiring hospital attendance rose by 15% to a record high of 3,007.
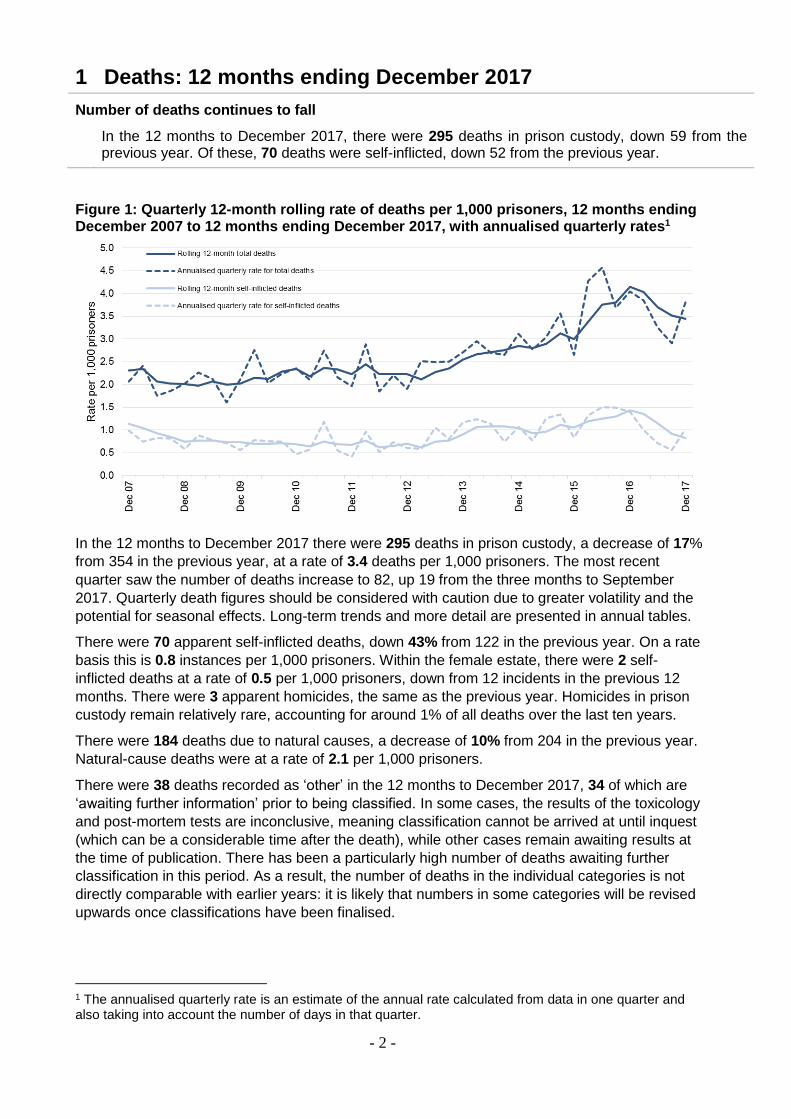
Figure 2: Quarterly 12-month rolling rate of self-harm incidents per 1,000 prisoners, 12
months ending September 2007 to 12 months ending September 2017, with annualised
quarterly rates
In the 12 months to September 2017, there were 42,837 reported incidents of self-harm (a rate of
501 per 1,000 prisoners), up 12% on the previous year. The number of self-harm incidents
requiring hospital attendance increased by 15% on the previous year to 3,007 while the
proportion of incidents that required hospital attendance remained broadly similar at 7.0%. The
number of self-harm incidents and those requiring hospital attendance are both the highest in the
time series.
The quarterly rate of incidents continued to increase in the three months to September 2017 to a
record high of 11,904 incidents (up 10% on the previous quarter), 807 of which required hospital
attendance, also the highest figure in the time series.
The number of prisoners who self-harmed in the 12 months to September 2017 was 11,248 (a
rate of 131 prisoners per 1,000), up 4% from the previous year. Those that self-harmed did so, on
average, 3.8 times, although a small number of prolific self-harmers have a disproportionate
impact on this figure. The majority of those who self-harm in prison do so only once a year.
Additional detail on this can be found in the annual self-harm tables.
- 4 -
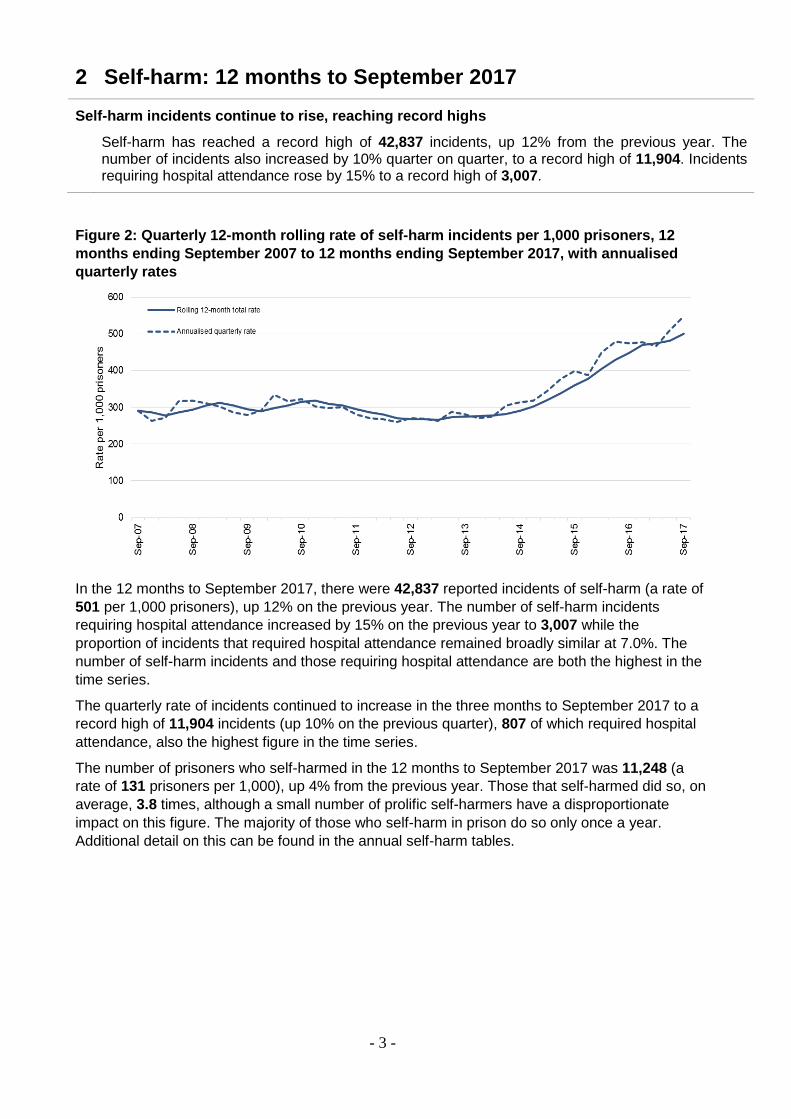
Figure 3: Quarterly 12-month rolling rate of self-harm incidents per 1,000 prisoners by
gender of establishment, 12 months ending September 2007 to 12 months ending
September 2017
Self-harm trends differ considerably by gender, with a rate of 427 incidents per 1,000 in male establishments (with incidents up 13% on the previous year) compared to a rate of 2,031 per 1,000 in female establishments (an increase of 9% in the number of incidents from the previous year). In the 12 months to September 2017, the number of self-harm incidents per self-harming male increased from 3.2 in the previous year to 3.4 while self-harm prolificacy among females also increased, from 6.3 to 7.0 incidents per self-harming individual. Self-harm incidents requiring hospital attendance have increased from the previous year in male establishments by 14% to 2,824, and in female establishments by 39% to 183 incidents. While self-harmers in female establishments were roughly twice as prolific as those in male establishments, the proportion of incidents that required hospitalisation was more than three times higher in male establishments (8.1% compared to 2.3% in female establishments).

- 5 -
3 Assaults: 12 months to September 2017
Assaults and serious assaults continue to rise, reaching record highs
Assaults have continued to rise, reaching a record high of 28,165 incidents in the 12 months to
September 2017, up 12% from the previous year. Of these, 3,726 were serious assaults, up 10%
from the previous year, to the highest level in the time series. Quarterly assaults also rose by 10%
to a record high of 7,810 incidents.
Figure 4: Quarterly 12-month rolling rate of total assaults by gender of establishment, 12
months ending September 2007 to 12 months ending September 2017, with annualised
quarterly rates
In the 12 months to September 2017, there were 28,165 assault incidents (a rate of 329 incidents per 1,000 prisoners), an increase of 12% on the previous year, and the highest level in the time series. In the latest quarter, there were 7,810 assaults, up 10% from the three months to June 2017.
- 6 -
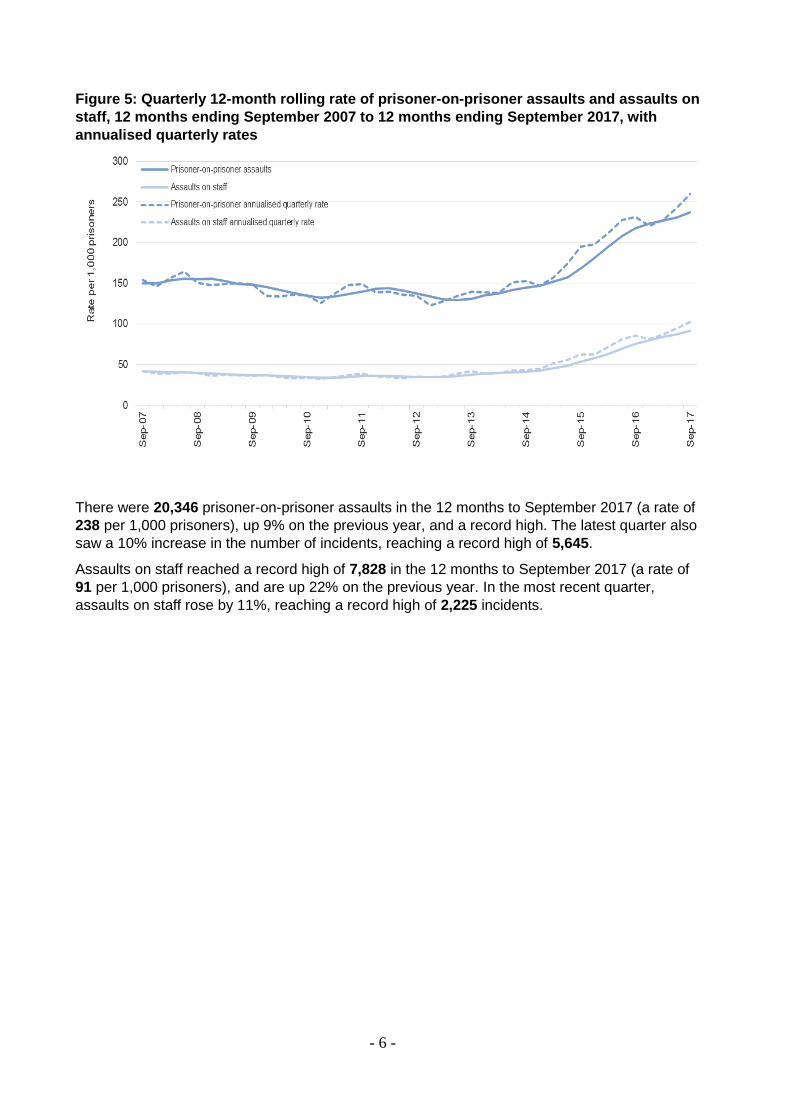
Figure 5: Quarterly 12-month rolling rate of prisoner-on-prisoner assaults and assaults on
staff, 12 months ending September 2007 to 12 months ending September 2017, with
annualised quarterly rates
There were 20,346 prisoner-on-prisoner assaults in the 12 months to September 2017 (a rate of
238 per 1,000 prisoners), up 9% on the previous year, and a record high. The latest quarter also
saw a 10% increase in the number of incidents, reaching a record high of 5,645.
Assaults on staff reached a record high of 7,828 in the 12 months to September 2017 (a rate of
91 per 1,000 prisoners), and are up 22% on the previous year. In the most recent quarter,
assaults on staff rose by 11%, reaching a record high of 2,225 incidents.

- 7 -
3.1 Serious assaults Serious assaults are those which fall into one or more of the following categories: a sexual
assault; requires detention in outside hospital as an in-patient; requires medical treatment for
concussion or internal injuries; or incurs any of the following injuries: a fracture, scald or burn,
stabbing, crushing, extensive or multiple bruising, black eye, broken nose, lost or broken tooth,
cuts requiring suturing, bites, temporary or permanent blindness.
Figure 6: Quarterly 12-month rolling rate of total serious assaults, serious prisoner-on-
prisoner assaults, and serious assaults on staff, 12 months ending September 2007 to 12
months ending September 2017, with annualised quarterly rates
In the 12 months to September 2017, there were 3,726 serious assaults, up 10% on the previous year, and the highest level in the time series. Of these, 2,961 (or 79%) were serious prisoner-on-prisoner assaults, up 11% on the previous year and also a record high. Over the same period, there were 787 serious assaults on staff, up 3% on the previous year.
In the latest quarter, there were 999 serious assaults, up 4% on the three months to June 2017, and a new record high. Of these, 799 (or 80%) were serious prisoner-on-prisoner assaults (up 4% to a new record high), and 211 were serious assaults on staff (up 3%).
After a prolonged period of stability in the time series, there has been a clear upward trend since
December 2012 in serious assault incidents of all types. The number of serious prisoner-on-
prisoner assaults is 2.8 times higher than in the 12 months to September 2012, while serious
assaults on staff have more than trebled.

- 8 -
Further Information
Accompanying files
As well as this bulletin, the following products are published as part of this release:
A technical guide providing further information on how the data are collected and
processed, as well as information on the revisions policy and legislation relevant to
sentencing trends and background on the functioning of the criminal justice system.
A set of summary tables for the latest quarter, and annual tables up to the latest calendar
year.
Underlying data files with pivot tables, giving lower level granularity.
National Statistics status
National Statistics status means that official statistics meet the highest standards of
trustworthiness, quality and public value.
All official statistics should comply with all aspects of the Code of Practice for Official
Statistics. They are awarded National Statistics status following an assessment by the UK
Statistics Authority’s (UKSA) regulatory arm. The UKSA considers whether the statistics meet the
highest standards of Code compliance, including the value they add to public decisions and
debate.
It is the Ministry of Justice’s responsibility to maintain compliance with the standards expected for
National Statistics. If we become concerned about whether these statistics are still meeting the
appropriate standards, we will discuss any concerns with the UKSA promptly. National Statistics
status can be removed at any point when the highest standards are not maintained, and
reinstated when standards are restored.
Contact Press enquiries should be directed to the Ministry of Justice press office:
Tel: 020 3334 3536
Email: [email protected]
Other enquiries about these statistics should be directed to:
Lucy Cuppleditch Prison and Probation Analytical Services Ministry of Justice 102 Petty France London SW1H 9AJ Email: [email protected]
Next update: 26 April 2018 URL: www.gov.uk/government/collections/safety-in-custody-statistics © Crown copyright
Produced by the Ministry of Justice.
Alternative formats are available on request from [email protected]
- 9 -
Annex A - Comparison of deaths in custody with the general
population
Annex A is updated annually on a calendar year basis when the underlying general population
data2 become available from the Office of National Statistics, coinciding with the annual
release of deaths in custody data.
The prison population is very different from the general population: around 95% of the prison
population are male, there are no prisoners aged under 15, and relatively few are over 60,
compared to the general population. As a result, rates of deaths in prison custody cannot be
compared directly with those for the general population. One technique used for comparing
mortality rates for different populations is known as the Standardised Mortality Ratio (SMR).
The SMR provides a means of making like for like comparisons of the death rate in prison
custody to that of the general population of England and Wales, by adjusting for age distribution
and gender. Figure A1 below presents the SMR of the prison population, compared to the
expected level from the general population. Where the likelihood of death is the same as would
be expected based on the general population, the SMR would have a value of 1 (depicted by the
green line - a ratio of 1:1). Due to the adjustments, there is a margin of error around the SMR
estimates, depicted on the graph as the range of values by lines around the point estimates,
within which there is 95% confidence the true value falls.
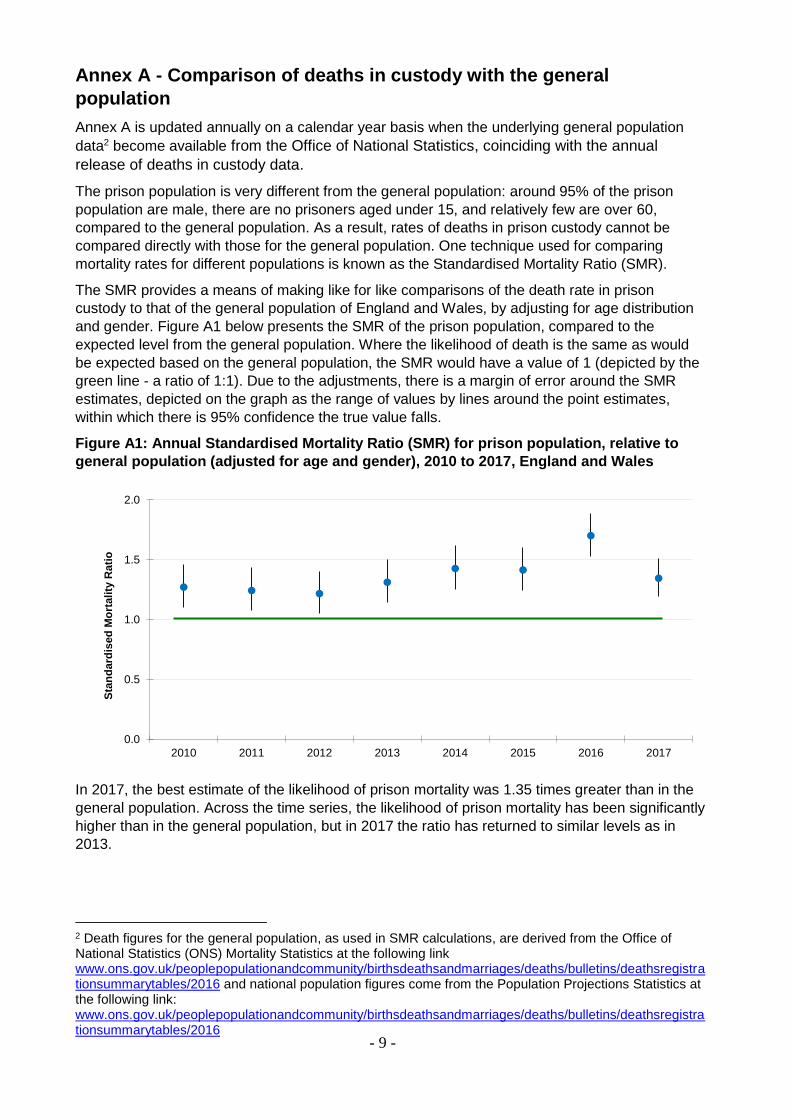
Figure A1: Annual Standardised Mortality Ratio (SMR) for prison population, relative to
general population (adjusted for age and gender), 2010 to 2017, England and Wales
0.0
0.5
1.0
1.5
2.0
2010 2011 2012 2013 2014 2015 2016 2017
Sta
nd
ard
ised
Mo
rta
lity
Ra
tio
In 2017, the best estimate of the likelihood of prison mortality was 1.35 times greater than in the
general population. Across the time series, the likelihood of prison mortality has been significantly
higher than in the general population, but in 2017 the ratio has returned to similar levels as in
2013.
2 Death figures for the general population, as used in SMR calculations, are derived from the Office of National Statistics (ONS) Mortality Statistics at the following link www.ons.gov.uk/peoplepopulationandcommunity/birthsdeathsandmarriages/deaths/bulletins/deathsregistrationsummarytables/2016 and national population figures come from the Population Projections Statistics at the following link: www.ons.gov.uk/peoplepopulationandcommunity/birthsdeathsandmarriages/deaths/bulletins/deathsregistrationsummarytables/2016
- 10 -
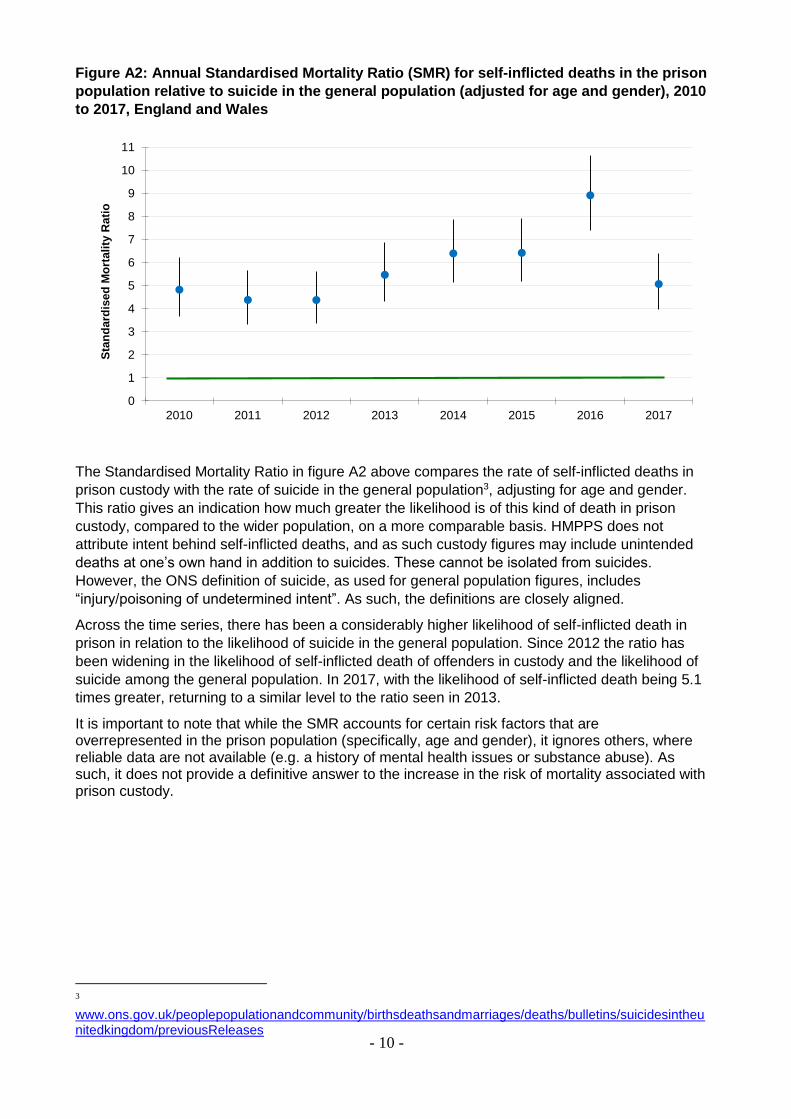
Figure A2: Annual Standardised Mortality Ratio (SMR) for self-inflicted deaths in the prison
population relative to suicide in the general population (adjusted for age and gender), 2010
to 2017, England and Wales
0
1
2
3
4
5
6
7
8
9
10
11
2010 2011 2012 2013 2014 2015 2016 2017
Sta
nd
ard
ised
Mo
rtali
ty R
ati
o
The Standardised Mortality Ratio in figure A2 above compares the rate of self-inflicted deaths in
prison custody with the rate of suicide in the general population3, adjusting for age and gender.
This ratio gives an indication how much greater the likelihood is of this kind of death in prison
custody, compared to the wider population, on a more comparable basis. HMPPS does not
attribute intent behind self-inflicted deaths, and as such custody figures may include unintended
deaths at one’s own hand in addition to suicides. These cannot be isolated from suicides.
However, the ONS definition of suicide, as used for general population figures, includes
“injury/poisoning of undetermined intent”. As such, the definitions are closely aligned.
Across the time series, there has been a considerably higher likelihood of self-inflicted death in
prison in relation to the likelihood of suicide in the general population. Since 2012 the ratio has
been widening in the likelihood of self-inflicted death of offenders in custody and the likelihood of
suicide among the general population. In 2017, with the likelihood of self-inflicted death being 5.1
times greater, returning to a similar level to the ratio seen in 2013.
It is important to note that while the SMR accounts for certain risk factors that are overrepresented in the prison population (specifically, age and gender), it ignores others, where reliable data are not available (e.g. a history of mental health issues or substance abuse). As such, it does not provide a definitive answer to the increase in the risk of mortality associated with prison custody.
3
www.ons.gov.uk/peoplepopulationandcommunity/birthsdeathsandmarriages/deaths/bulletins/suicidesintheunitedkingdom/previousReleases
- 11 -
Annex B – Deaths annual tables key findings Gender
The vast majority (over 97%) of deaths in custody occurred in the male estate. The number of deaths in the female estate fell by nearly two thirds in 2017 (from 22 to 8 incidents).
As a result, the cross-tabulations of characteristics with gender (e.g. age by gender, ethnicity by gender, etc.) are not presented below because they would be statistically meaningless and potentially misleading.
Age
In 2017, prisoners aged 60 and over were the most likely to die in custody, with 27.02 incidents per 1,000 prisoners. However, of the 130 deaths amongst this age group, all but one were classified as natural causes.
Self-inflicted deaths were most frequent among those aged 30 to 39, accounting for 40% of all incidents in 2017, but the age group with the highest rate of self-inflicted deaths was the 50-59 years bracket, at a rate of 1.17 per 1,000 prisoners. The rate (and number) of self-inflicted deaths decreased in all age groups between 2016 and 2017.
Those aged 60 and over accounted for 70% of all natural cause deaths in 2017, with those over 50 accounting for 86%.
Time in custody
The first few days of custody are particularly high-risk in terms of self-inflicted deaths. In 2017, 14% of all self-inflicted deaths occurred within the first week of custody, and 27% occurred within the first 30 days.
Moving between prisons poses an additional risk factor. In 2017, 23% of all self-inflicted deaths occurred within the first week in the current prison, and 49% occurred within the first 30 days.
Offence
In 2017, 44% self-inflicted deaths were by prisoners charged or sentenced to offences of violence against the person. Prisoners committing offences of violence against the person, robbery and theft account for 67% of self-inflicted deaths.
Ethnicity
In 2017, the rate of self-inflicted deaths was higher amongst White prisoners than BAME prisoners at a rate of 0.96 self-inflicted deaths per 1,000 prisoners compared to 0.44 per 1,000 prisoners for those of BAME ethnicity.
Although the rate of self-inflicted deaths fell from 2016 in both groups, the relative ratio remained unchanged, with White prisoners over twice as likely as BAME prisoners to suffer a self-inflicted death.
Nationality
In 2017, foreign nationals were more likely than UK nationals, to suffer a self-inflicted death, with rates of 1.44 and 0.44 per 1,000 prisoners, respectively.
The rate of self-inflicted deaths was particularly high among EEA nationals, at 2.48 incidents per 1,000 prisoners.
Status
In 2017, while those who received a determinate sentence accounted for the largest proportion of self-inflicted deaths (44%), this was lower than the overall share of determinate sentence prisoners in the population (67%). Conversely, prisoners on remand or an indeterminate sentence accounted for 29% and 21% of self-inflicted deaths in 2017 respectively yet their overall share of the population was only 11% and 12% respectively.
- 12 -
Method of self-inflicted death
Hanging remains the most common method of self-inflicted death for both males and females in 2017, accounting for over 90% of all incidents.
Of the 66 self-inflicted deaths with method of hanging or self-strangulation in 2017, bedding remains the most commonly used ligature type with 79% of incidents using this.
The most commonly used ligature point remains the window, accounting for 45% of all self-inflicted hanging or self-strangulation deaths in 2017.