Embed Size (px)
Citation preview

1
DRAFT
Safety in Mines Research Advisory Committee
Final Project Report1
Evaluation of the design criteria of
Regularly Spaced Dip Pillars (RSDP)
based on their in-situ performance
S.M. Spottiswoode, A. Milev, L.M. Linzer
and S. Majiet
Research agency: CSIR
Project number: SIM 04 03 01
Date: 6th March 2009
1 This project report was altered in response to reviews by the SIMRAC Rock Engineering subcommittee
and submitted to the MHSC in March 2009. Changes to the structure of SIMRAC have resulted in its
having been “lost” in the system. For public accessibility I have been encouraged to place it on the web.
It is now (February 2014) accessible at http://stevespot.yolasite.com/resources/RSDP.pdf.
2
Executive summary
Research was undertaken on behalf of the Mine Health and Safety Council to study the behaviour of regularly-spaced dip pillars (RSDPs) as they are employed in South African gold mining layouts. The purpose of the pillars is primarily to reduce the incidence and magnitude of seismic events by reducing the volume of elastic convergence. The design of these pillar layouts must therefore focus on preventing seismicity on a regional scale, and must ensure that the pillars themselves do not fail in a violent manner.
We analysed seismicity in two deep gold mines in terms of design parameters for Closely-Spaced Dip Pillars (CSDP) for mining of the Carbon Leader Reef (CLR) and for Sequential Grid Mining (SGM) on the Ventersdorp Contact Reef (VCR). Both used regularly-spaced dip pillars and backfill for regional support. More than 500 000 m2 of reef were mined over several years and induced more than 10 000 events of Local Magnitude greater than 0.0 per reef.
Four areas of work were undertaken for this project: an integrated analysis of seismicity and numerical modelling of mine deformations; moment tensor solutions; measurement and interpretation of tilt recordings; and strong ground studies. The seismic-modelling integration provided most of the results to meet the requirements of the Primary Outputs.
Primary Output 1: Evaluation of the design criteria of RSDP based on their in situ performance
At the CLR study area, the layout was designed to limit values of (strain) Energy Release Rate (ERR) to 30 MJ/m2 or less, and to a maximum Average Pillar Stress (APS) of 400 MPa. The designed stope spans and pillar sizes for the VCR mining were planned to an average ERR of 19 MJ/m2 and an APS of 596 MPa at the maximum depth. These values would only be reached after very extensive mining with pillars kept to the minimum size. As mining was not maximised and regional support was also provided by backfill, these values were not reached in the two study areas.
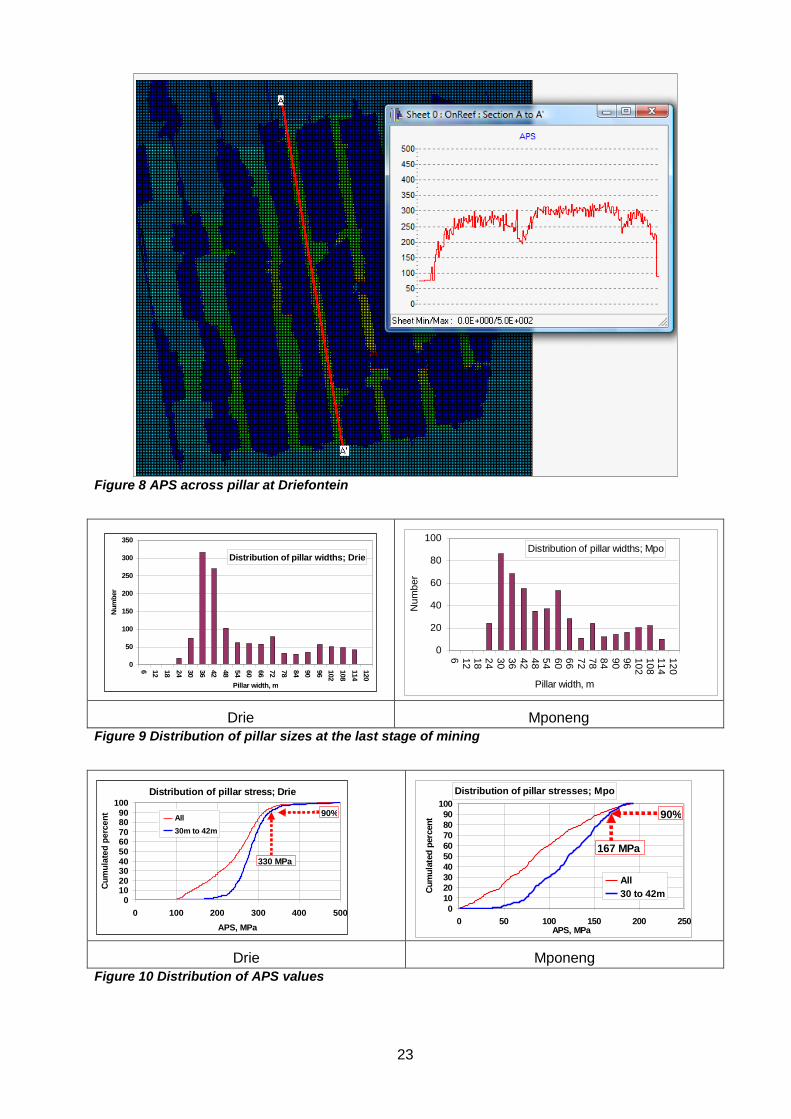
90% of faces at the last stage of mining studied had ERR values of less than 17.9 MJ/m2 on the CLR and 15.7 MJ/m2 on the VCR. Corresponding numbers for APS were 330 MPa and 167 MPa, respectively. All these values were well below the designed values.
Perhaps the main result of this study was that ERR was shown to be a robust measure of the amount of seismicity per area mined under a range of conditions and therefore a predictable amount of additional seismicity would occur under higher ERR conditions. Seismicity per strain energy release did not vary according to the order of mining, even for double-sided mining, and for panels approaching one another when mining towards the same pillar. Delaying mining away from the shaft until mining towards the shaft was does not reduce the average ERR and did not reduce seismicity significantly. In other words, three of the sequencing rules that have been applied to SGM appeared not to have been needed, or at least not so strictly applied, to control seismicity. A modelling exercise showed that adjacent panels interact more than panels on either side of a pillar. Another rule that called for mining first towards geological features that lie between raises does reduce seismicity. The rule related to managing inter-panel lead-lags was not studied in this project, having been the subject of anther recent study.
ERR as calculated in this project is the strain energy released per area mined between mining steps. It is essentially the same as the “classic” ERR that is calculated by most current numerical codes, but has the benefit of being directly related to strain energy release over the full history of mining.
Primary output 2: Identification of conditions under which RSDP mining works best as a rockburst control method
One of the big concerns about using regional support in the form of pillars is that these pillars may fail. We did not find any evidence for pillar failure, either from the seismic data or from studying ground tilting 90 m below reef.
3
The fact that seismicity per area mined was proportional to ERR right up to the highest values of ERR suggests that no “additional” seismic energy was released, as might be expected if pillars were failing. Most of the strain energy release modelling was based on mining within an elastic rock mass. Cap stress values were also introduced to simulate the additional strain energy release that might have occurred had pillars yielded. Extreme deformations were only encountered in the models at a cap stress of 300 MPa or less. The pillar strengths are therefore thought to be in excess of 300 MPa, and may be much greater. It was shown that backfill would play a more useful role in controlling convergence if pillars do fail than they do in the case of unfailed pillars.
Ground tilting was measured partly to determine whether any accelerated quasi-static (slow) ground deformations might follow seismic events, as might be expected for a yielding pillar. No significant changes in tilt were observed after seismic events, providing further support for our contention that pillars are not showing signs of failure.
Pillar stability is partly attributable to the pillars not containing faults with throws of the same order as the pillar width. As faults with throws greater than 30 m are rare in the Carletonville mining region, RSDP mining could be applied in this entire area.
Other output: Improved insight into the relationship between faults and dykes and pillars
Seismicity was much more strongly correlated with active stoping than with geological features marked on the 1:1000 plans, particularly for the CLR mining. All interpretations are likely to be better if the accuracy of seismic locations is improved.
The seismic response to faults and dykes was very different between to the two case studies. At the CLR site, faults increased the total amount of seismicity by about 20% and by an additional 36% near their intersection with dykes. Dykes did not increase seismicity significantly. In contrast, at the VCR site, faults did not cause more seismicity than unfaulted ground whereas dykes increased the total amount of seismicity by about 12%. Bracket pillars in excess of 30 m wide did not seem to be necessary.
Unfortunately, attempts at characterizing source mechanisms by moment tensor inversion were unsuccessful due to various problems including the orientations and polarities of geophones of the mine network.
Analysis and design methodologies that can be applied to other mine layout designs in tabular mines.
Analysis methodologies were developed and written into software that can be applied to other mine layouts. These methodologies include a new model for face stiffness and new methods of interpreting seismicity, both in terms of geological features and variations in monthly hazard. The automatic grouping of seismicity and mining into polygons (auto-polys) has proved to be a much more useful analysis methodology than the traditional fixed polygon approach. These methods can be applied to any other deep-level mining to judge its performance at controlling seismicity, for example, mining portions of existing regional support pillars.
The difficulty of obtaining a digital map containing accurate sequencing is currently a major barrier to application of this or any software or analysis where the history of mining must be known. At present, it appears that manual digitizing of mine plans is still needed in most, if not all, cases.
Research insights and questions
Preliminary interpretation of ground tilting and the spatial distribution of aftershocks and back-area events hints at providing new insights into time-dependent behaviour of the rock mass. It is possible that all time-dependent behaviour takes place in the fracture zone around the stopes.

4
Table of Contents
1 Introduction .............................................................................................................. 10
1.1 Structure of report .................................................................................................... 10
1.2 Pillar design considerations ...................................................................................... 10
1.3 Testing of design criteria .......................................................................................... 10
1.4 Energy Release Rate (ERR) ..................................................................................... 11
1.5 Excess Shear Stress (ESS) ...................................................................................... 15
1.6 Average Pillar Stress (APS) ...................................................................................... 15
2 Case studies............................................................................................................. 16
3 Methodology for integration of seismicity and modelling ........................................... 19
3.1 Application of cap stress ........................................................................................... 19
3.2 Software ................................................................................................................... 20
3.3 Meeting criteria ......................................................................................................... 22
3.4 Grouping seismicity into polygons ............................................................................ 24
3.5 Analysis with fixed polygons ..................................................................................... 24
3.6 Development of automatically generated polygons ................................................... 25
3.7 Pillar strength ........................................................................................................... 31
3.8 Double-sided mining and converging of panels ........................................................ 32
3.9 Influence of geological features ................................................................................ 36
3.10 Backfill ...................................................................................................................... 42
4 Instrumentation and analysis for determining the in situ behaviour of RSDPs........... 45
4.1 Interpretation of tilt data ............................................................................................ 45
4.2 Strong ground motion measurements ....................................................................... 46
4.3 Moment tensor inversions......................................................................................... 46
5 Conclusions .............................................................................................................. 48
6 References ............................................................................................................... 50
5
Table of Figures
Figure 1: A stope and face depiction on how face ERR is calculated within MINF. ................... 12
Figure 2 The graph describes the relationship of ERR for different calculations of ERR in the
numerical program MINF, with the added plot of ERR for a regular spaced long
wall (RG) and finite longwall. This is for small spans (distance between unmined
ground) ranging up to 25m................................................................................. 13
Figure 3 The graph describes the relationship of ERR for different calculations of ERR in the
numerical program MINF, with the added plot of ERR for a regular spaced long
wall (RG) and finite longwall. This is for large spans which range up to 54m. .... 14
Figure 4 Mining and seismic events with Magnitude M > 2.0. Seismic events in areas marked
“O” and “F” were excluded as they were considered to have been associated with
mining outside the modelled area or were more than 100 m from any mining. ... 18
Figure 5 A sketch illustrating strain energy released by mining: (a) for elastic rock mass; (b) for
a constant cap stress; and (c) for successive weakening of the fracture zone
close to the face. ............................................................................................... 20
Figure 6 Diagram to illustrate how seismic events (A & B) were attributed to mining. (a)
Gaussian function around the projection of each event to reef. (b) The events
with contoured released strain energy. (c) Contours of event influence are the
product of the values in (a) and (b). Event A is, in effect, moved as shown. ....... 22
Figure 7 Distribution functions of ERR for the two cases for all faces at the final mining
configuration. ..................................................................................................... 22
Figure 8 APS across pillar at Driefontein .................................................................................. 23
Figure 9 Distribution of pillar sizes at the last stage of mining ................................................... 23
Figure 10 Distribution of APS values ........................................................................................ 23
Figure 11 Depicts the mine plan of the area of interest at Driefontein 5E# and Mponeng
showing the polygons in different colours, viewed in MinView3D. ...................... 24
Figure 12 Cumulated apparent volume as a function of area mined (a) and strain energy
released (b) for fixed polygons ........................................................................... 25
Figure 13 Cumulated strain energy as a function of cumulated area mined for each of the
polygons in Figure 11 ........................................................................................ 25
Figure 14 Cumulated modelled strain energy as a function of cumulated area mined for auto
polygons. Data was sorted by increasing values of ERR before cumulating.
Note that ERR is the slope of the curve. ............................................................ 26
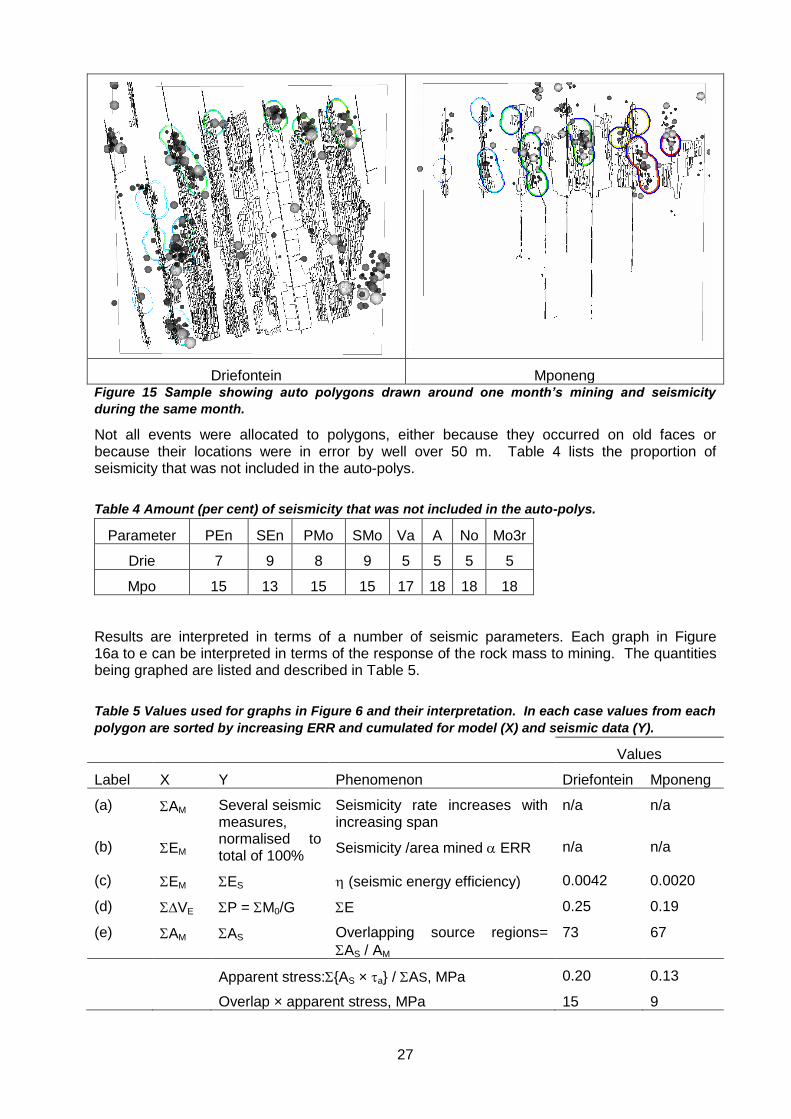
Figure 15 Sample showing auto polygons drawn around one month’s mining and seismicity
during the same month. ..................................................................................... 27
Figure 16 Cumulated seismicity and mining. Explanation for X and Y axes listed in Table 5. .. 28
Figure 17 Apparent Volume as a function of cumulated strain energy release, sort according to
area mined and to ERR. .................................................................................... 30
Figure 18 Cumulative apparent volume as a function of cumulative area mined (a) and
cumulative strain energy released (b) for Mponeng. .......................................... 30
6
Figure 19 Correlation between apparent volume per area mined as a function of ERR with data
from auto-polys binned or grouped in bins of approximately equal amounts of
strain energy release. ........................................................................................ 31
Figure 20 Effect of cap stress on strain energy release ........................................................... 31
Figure 21. Correlation of different measures of total seismicity with ERR for ranges of cap
stress. Polygon data were grouped into ten data points containing increasing
values of ERR and of approximately equal amounts of strain energy release. ... 32
Figure 22 Example of polygons that include double- and single-sided mining. ......................... 33
Figure 23 Cumulative seismicity as a function of cumulative strain energy release. Before
cumulating values, the data for mining steps and within polygons were sorted into
increasing distance between faces mining towards one another for double-sided
mining (“Both” in figure) and for increasing area mined for single-sided mining. 34
Figure 24 Plan view of hypothetical mining of the last four panels adjacent to a pillar. (a) is a
view of the entire mining layout and sequence. (b) shows the position of the last
four panels (A, B, C & D) in detail. ..................................................................... 35
Figure 25 Geological features as used by MINSINT (a) Mining in green, faults in yellow and
dykes in red. (b) Faults in green, fading to blue to show 40 m drop-off in
influence. Dykes in red, fading to green to show 40 m drop-off in influence. ..... 37
Figure 26 (a) Cumulative distributions of seismic locations from active mining faces at
Driefontein as well as the distribution of the mid-points of all elements in the
MINF model from active mining. A cumulated error function satisfies the
distribution of most events (b) Cumulative distributions of seismic locations from
the larger faults and dykes as shown in the 1:1000 mine plan as well as the
distribution of the mid-points of all elements in the MINF model from the
geological features ............................................................................................ 38
Figure 27 Testing the physical extent of the influence of geological structures on seismicity at
Driefontein. Data from polygons in the influence of geological features sorted in
increasing degree of influence while data from mining remote from geological
features have been sorted by increasing ERR. .................................................. 39
Figure 28 As with Figure 27 for data from Mponeng. ................................................................ 40
Figure 29 The relationship between ERR in polygons near faults or dykes and the degree of
influence geological influence on these polygons. ............................................. 41
Figure 30 Effect of backfill and cap stress on modelled strain energy release at Mponeng. ...... 42
Figure 31 Portion of an infinite series of raises and pillars, with mining taking place
simultaneously from blue towards red. ............................................................... 43
Figure 32 Cumulative strain energy as a function of percent mined for an infinite series of pillars
with infinite strength (“el”) and a cap strength of 400 MPa and with (“bf”) and
without (“1m”) backfill. ........................................................................................ 44
Figure 33 Cartoon showing opposite tilting for seismicity in hangingwall or footwall. ................ 46

7
Table of Tables
Table 1 Mining and layout design for two case studies. Reference to (M) for McGill (2005), (K)
for Klokow et al. (2002) and . Values marked with (E) have been calculated
using equations from Ryder and Jager (2002, p161) for infinitely replicating
stopes & pillars. Stope width and backfill information from Castelyn (Pers comm.
2003) (C). .......................................................................................................... 16
Table 2 Modelling parameters for two case studies .................................................................. 17
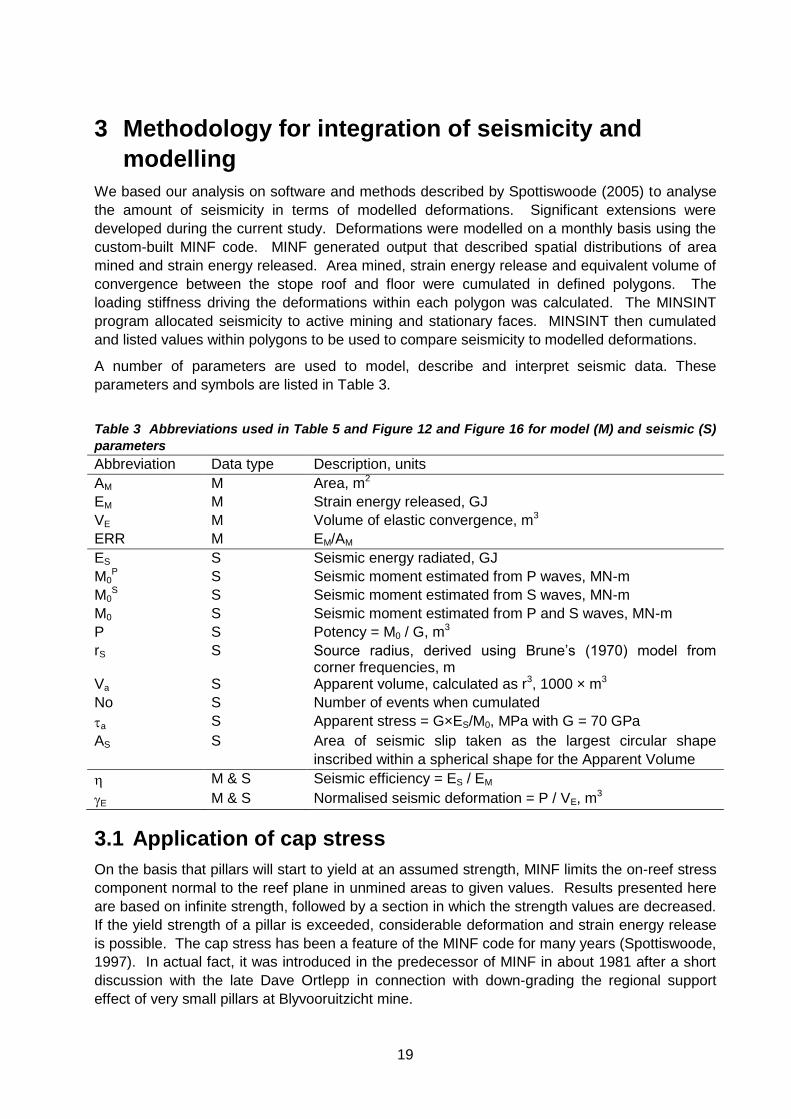
Table 3 Abbreviations used in Table 5 and Figure 12 and Figure 16 for model (M) and seismic
(S) parameters ................................................................................................... 19
Table 4 Amount (per cent) of seismicity that was not included in the auto-polys. ...................... 27
Table 5 Values used for graphs in Figure 6 and their interpretation. In each case values from
each polygon are sorted by increasing ERR and cumulated for model (X) and
seismic data (Y). ................................................................................................ 27
Table 6 Abbreviations used in Figure 21. Scaling in terms of source radius (r0) and stress drop
or apparent stress (τ). ........................................................................................ 31
Table 7 (a) Entire modelled mining layout showing order of mining and (b) with details showing
four final panels, A, B, C and D that are mining in four different sequences, as
shown in Table xx. Cap stress = 400 MPa. ....................................................... 36
Table 8 Contribution of geological features to the total amount of seismicity at Driefontein ...... 39
Table 9 As for Table 8 for data from Mponeng ......................................................................... 41
Table 10 Increase in seismicity due to the proximity of a fault or dyke. ..................................... 41
Table 12 Effect of backfill and cap stress on the total amount of modelled strain energy release
at Mponeng. ...................................................................................................... 42
8
Acknowledgements
Assistance from the following individuals is greatly appreciated:
Johan Klokow (Gold Fields)
Rick Ferreira (Gold Fields)
Frans Castelyn (Gold Fields)
Faan Mulder (Gold Fields)
Gerrit Coetzee (Gold Fields)
Rob McGill (AngloGold Ashanti)
Riaan Carstens (AngloGold Ashanti)
Marie Gerenger (ISSI)
Tony Ward (Seismogen)
Duncan Adams (MHSC)
Dr Woody Rymon-Lipinski (DME)
The following current and past CSIR personnel are thanked for their input during critical
discussions around the project data, analysis methodologies and results:
Dr John Napier (Retired)
Dr Ray Durrheim (Also Wits University)
Dr Dave Roberts
Dr Daniel de Carcenac
Dr Jan Kuijpers
Dr Terry Hagan (Now at UNISA)
Bryan Watson
Sarel Coetzer
Gökhan Güler (Now at TWP)
Jonas Machake of the CSIR diligently maintained underground sites at Mponeng and
Driefontein.
The authors of this report would like to express their thanks to MHSC the financial support for
this study and also for the SIM 05 03 02 project providing some of the data for the tilt analysis.
To the rock engineering staff of Mponeng Gold mine for making the underground sites available.

9
Glossary of abbreviations
CLR Carbon Leader Reef
CSDP Closely Spaced Dip Pillars
DME Department of Minerals and Energy
Drie Data from Driefontein 5 shaft mining
ERR Strain Energy Release Rate
ER Strain Energy Release associated with mining
ESS Excess Shear Stress
MHSC Mine Health and Safety Council
MINF MINing simulation using Fourier transforms
MINSINT MINing Seismicity INTegrator
PPV Peak Particle Velocity
Mpo Data from Mponeng mine
PPA Peak Particle Acceleration
SGMD Strong Ground Motion Detector
RE Rock Engineering
RSDP Regularly Spaced Dip Pillars
SGM Sequential Grid Mining
UCS Uniaxial Compressive Strength
VCR Ventersdorp Contact Reef
J Joules
N-m Newton-Metres, used for seismic moment
M; G; T Mega (106); Giga (109); Tera (1012)
Used to shorten numbers in Tables and Figures

10
1 Introduction
Deep-level mining of tabular reefs uses regional support to control seismicity. Many of the deep workings in the Carletonville gold mining district in South Africa have moved from strike stabilizing pillar systems to pillars and backfill for regional support (McGill, 2005, and Klokow et al, 2003).
Pillar mining is being practiced mostly in two forms, namely Sequential Grid Mining (Handley et al, 2000) and Closely Spaced Dip Pillar Mining (Klokow et al, 2003).
1.1 Structure of report
This report focuses on two areas of work from which the most useful results were obtained, namely an integrated analysis of seismicity and modelling, and interpretation of tilt and seismic data in terms of time-dependent behaviour of the rock mass. Short sections cover moment tensor inversions and strong ground motion recordings.
More details on this work can be found in a supplementary report that includes the project proposal and covers some areas of work in more detail, in particular the work on moment tensor inversions.
1.2 Pillar design considerations
Design consideration for dip pillar mining have been described for mining at Mponeng Mine using Sequential Grid Mining (SGM) by Handley et al. (2000) and McGill (2005) and for mining at Driefontain 5# using Closely Spaced Dip Pillar mining (CSDP) by Klokow et al. (2003). The principal design consideration is limitation of strain energy released from stope convergence, achieved using closely-spaced pillars aligned on dip. Pillars must be large enough not to fail. In addition, geological discontinuities are approached at small spans and then included, where possible, in bracket pillars.
McGill (2005, p421) listed other rules that are applied at Mponeng Mine for sequencing the mining:
Single-sided mining
o Mining takes place on only one side of raise at a time.
Controlling converging of panels
o Panel faces are not allowed to be within 70 m of one another while mining towards the same pillar.
Managing inter-panel leads/lags
Mine towards the solid
o Mining from each raise is first completed towards the shaft and then mining away from the shaft proceeds. This order of mining lends its name to the “Sequential” in “Sequential Grid Mining”.
Controlling mining volumes/concentrations
o This rule limits the number of crews working on each raise line to six, often decreasing to four during the final stages of extraction.
1.3 Testing of design criteria
This study attempts to test the validity of five design criteria that are particular to the two dip pillar methods described by McGill (2005) and Klokow et al. (2003). These are ERR, APS, double-sided mining, controlling converging panels and mining towards the solid. All five were strictly prescribed for SGM mining at Mponeng, although mining was often stopped before a
11
pillar line was reached, for example for reasons of poor grade, as if commonly encountered on the VCR. The CLR mining at Driefontein generally resulted in full spans. Panels containing strike-parallel faults were often stopped before the final pillar position.
The historical background to ERR and APS is described in the next sections. These criteria were tested in this report on two levels: have criteria been met and are they meaningful or useful? Most of the testing was done by comparing seismicity to mining. As seismicity is not the only measure of rock deformation, additional testing of pillar failure was done using records from tilt meters. It will be seen that ERR provides a robust estimator of seismicity per area mined and that there has been no evidence of pillar failure.
Three of the rules listed above relate to the order in which ground is mined. These will be tested by comparing different mining configurations in terms of the amount of seismicity per strain energy release.
Handley et al. (2000) and McGill (2005) argued that interaction between faces that advance simultaneously, either from a raise or towards a pillar, should be avoided. It was claimed, in effect, that stress and strain interactions would result in worse conditions than if the faces were advanced separately. In this report, we show that the seismicity is controlled by the amount of strain energy released, independent of the amount of mining, or whether mining takes place simultaneously in different directions. Double-sided mining and approaching within 70m of an approaching panel do not appear to increase the seismicity per area mined.
Similarly, mining at high ERR through “incorrect” sequencing” does not appear to increase the total amount of seismicity for the same final face positions.
1.4 Energy Release Rate (ERR)
1.4.1 Background
ERR originates from the theory of fracture mechanics developed in the 1920s. The theory of
fracture mechanics states that the energy release rate (ERR) is the rate of change of potential
energy with the crack area for a linear elastic material.
ERR = ERRc (1)
the critical energy release is a measure of fracture toughness. For a crack length of 2a in an
infinite plate where a remote tensile stress is applied, the energy release rate is described
mathematically as follows:
E
aERR
2
(2)
where E is Young’s Modulus, is the remotely applied stress and a is the half-crack length. At
the fracture the ERR = ERRc and the above equation describes the critical combination of the
stress and crack size for the failure and can be rewritten as:
E
aERR
cf
c
2
(3)
Where for a constant ERRc value, failure stress σf varies with a-1/2. The ERR is the driving force
of the fracture, while the ERRc is the material resistance to fracture (Andersen, 1994, pp 3-22).
1.4.2 ERR in the mining environment
In mining, virgin rock stresses are high, and removal of this rock through mining results in
energy changes due to the sag of the massive overlying strata and the redistribution of the
stresses from the mined to the unmined ground. In the 1960’s the concept of ERR was
12
introduced to mining and is a convenient measure of energy changes and stress concentrations
and some of their effects on the mining environment (Ryder, 1999, pp 46).
ERR in mining is described as the spatial rate of release of available energy ΔWA, for a small
advance, , on a particular mining face and is described mathematically as:
A
F
WERR
(Ryder, 2002, pp 233)
(4)
ERRF is used here as the “Face” to distinguish it from the “Multi-step” ERR (ERRM) defined
below and used in this project. ERRF can be written alternatively as
)(2
11212 VVqERERER
(5)
Where V1 and V2 are the volumes of elastic convergence at two stages of mining, ER is the
strain energy released and q is the vertical stress. Equation (5) is an expression of
conservation of energy, stating that the strain energy released going from any mining
configuration to a later configuration is independent of the order of mining.
1.4.2.1.1 Application of ERR
The concept of ERR is applied in a number of numerical packages because of the valuable
insights it brings: Map3D, MINSIM and MINF amongst others, have the ability to calculate ERR.
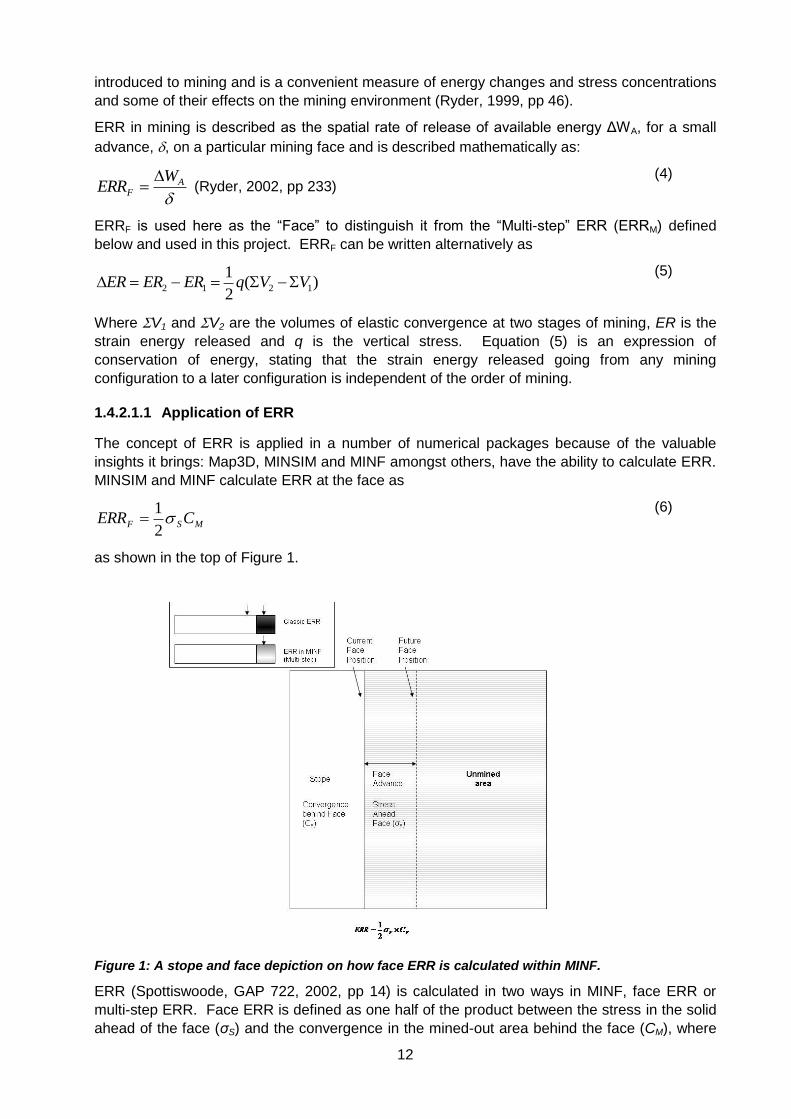
MINSIM and MINF calculate ERR at the face as
MSF CERR 2
1
(6)
as shown in the top of Figure 1.
Figure 1: A stope and face depiction on how face ERR is calculated within MINF.
ERR (Spottiswoode, GAP 722, 2002, pp 14) is calculated in two ways in MINF, face ERR or
multi-step ERR. Face ERR is defined as one half of the product between the stress in the solid
ahead of the face (σS) and the convergence in the mined-out area behind the face (CM), where
13
σS and CM are taken at the mid points of the elements immediately on either side of the face, as
defined in Equation (6). In contrast, multi-step ERR defines ERR in terms of the stress before
mining and the convergence after mining. In other words, it is equivalent to the work done in
mining each element (Spottiswoode, GAP 612c, 2002, pp 21-24).
MSM CERR 2
1
(8)
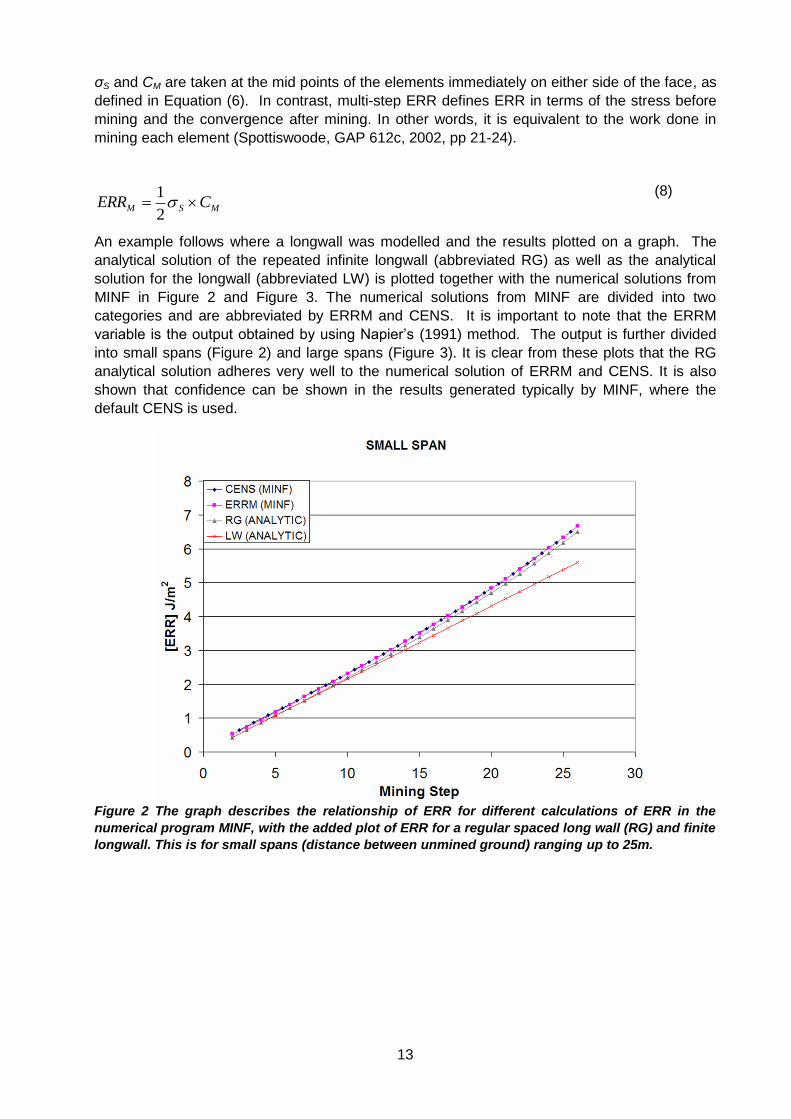
An example follows where a longwall was modelled and the results plotted on a graph. The
analytical solution of the repeated infinite longwall (abbreviated RG) as well as the analytical
solution for the longwall (abbreviated LW) is plotted together with the numerical solutions from
MINF in Figure 2 and Figure 3. The numerical solutions from MINF are divided into two
categories and are abbreviated by ERRM and CENS. It is important to note that the ERRM
variable is the output obtained by using Napier’s (1991) method. The output is further divided
into small spans (Figure 2) and large spans (Figure 3). It is clear from these plots that the RG
analytical solution adheres very well to the numerical solution of ERRM and CENS. It is also
shown that confidence can be shown in the results generated typically by MINF, where the
default CENS is used.
Figure 2 The graph describes the relationship of ERR for different calculations of ERR in the
numerical program MINF, with the added plot of ERR for a regular spaced long wall (RG) and finite
longwall. This is for small spans (distance between unmined ground) ranging up to 25m.
14
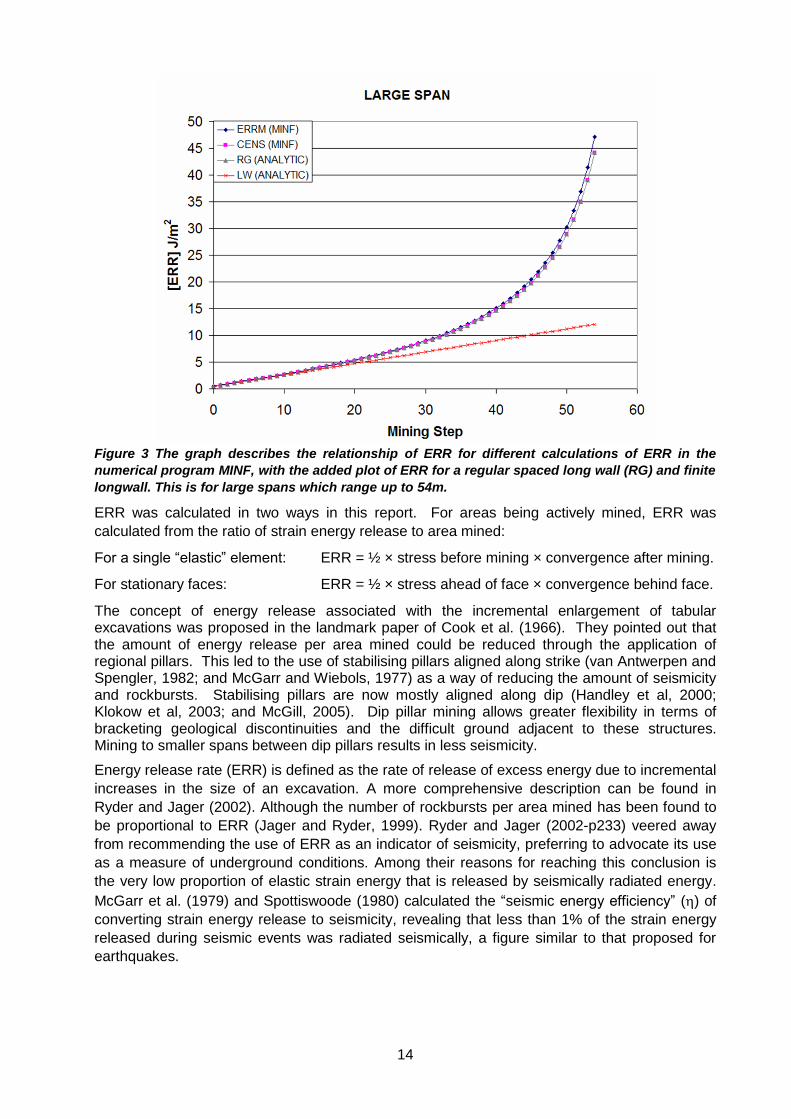
Figure 3 The graph describes the relationship of ERR for different calculations of ERR in the
numerical program MINF, with the added plot of ERR for a regular spaced long wall (RG) and finite
longwall. This is for large spans which range up to 54m.
ERR was calculated in two ways in this report. For areas being actively mined, ERR was
calculated from the ratio of strain energy release to area mined:
For a single “elastic” element: ERR = ½ × stress before mining × convergence after mining.
For stationary faces: ERR = ½ × stress ahead of face × convergence behind face.
The concept of energy release associated with the incremental enlargement of tabular excavations was proposed in the landmark paper of Cook et al. (1966). They pointed out that the amount of energy release per area mined could be reduced through the application of regional pillars. This led to the use of stabilising pillars aligned along strike (van Antwerpen and Spengler, 1982; and McGarr and Wiebols, 1977) as a way of reducing the amount of seismicity and rockbursts. Stabilising pillars are now mostly aligned along dip (Handley et al, 2000; Klokow et al, 2003; and McGill, 2005). Dip pillar mining allows greater flexibility in terms of bracketing geological discontinuities and the difficult ground adjacent to these structures. Mining to smaller spans between dip pillars results in less seismicity.
Energy release rate (ERR) is defined as the rate of release of excess energy due to incremental
increases in the size of an excavation. A more comprehensive description can be found in
Ryder and Jager (2002). Although the number of rockbursts per area mined has been found to
be proportional to ERR (Jager and Ryder, 1999). Ryder and Jager (2002-p233) veered away
from recommending the use of ERR as an indicator of seismicity, preferring to advocate its use
as a measure of underground conditions. Among their reasons for reaching this conclusion is
the very low proportion of elastic strain energy that is released by seismically radiated energy.
McGarr et al. (1979) and Spottiswoode (1980) calculated the “seismic energy efficiency” () of
converting strain energy release to seismicity, revealing that less than 1% of the strain energy
released during seismic events was radiated seismically, a figure similar to that proposed for
earthquakes.
15
1.5 Excess Shear Stress (ESS)
Ryder and Jager (2002) focussed attention on the use of excess shear stress (ESS) as the
most appropriate way to model seismicity, particularly on geological discontinuities. ESS is the
Coulomb excess stress on geological features or fractures. Though this may be extended to
consider energy release due to failure of intact rock, Jager and Ryder focussed instead on slip
on pre-existing geological faults. Mine layouts around major geological features are commonly
designed with the aid of ESS modelling.
ESS modelling was not done as part of this project for several reasons:
ERR or, more properly, the change in elastic strain energy, provides an objective and
robust measure of overall seismicity, as is shown in this report. The only assumption
that is made here regarding rock mass strength is that the stress on the rock to be
blasted out of the face in deep-level stopes is much lower than the stress from elastic
theory. The insensitivity of ERR to modelling assumptions makes it a far more objective
predictor of induced seismicity.
ESS is well suited for modelling major faults, such as those in the Klerksdorp and Free
State mining regions. There were no major geological faults in the study areas.
ESS modelling has had most success at predicting where seismicity will occur (e.g.
McKinnon and de la Barra, 2003). Predicting the size of seismic events remains very
dependent on many necessary assumptions about rock mass properties (e.g. Hofmann
and Murphy, 2007) as well as about the shape or position of slip planes.
Clearly, the simplicity and objectivity of ERR makes it a far more attractive measure of potential
seismicity than ESS. ESS modelling requires the user to make subjective assumptions
regarding the orientations of existing features and their characteristics.
1.6 Average Pillar Stress (APS)
Pillars are designed to hold up the entire weight of overburden and must therefore be assumed to have a certain strength, or load-carrying capability. The most commonly used measure of pillar strength is the average pillar stress (APS) which is simply the magnitude of the average vertical stress acting on the pillar. For convenience, the stress normal to the reef was used in this work as it is very similar in value to the vertical stress. The in-situ strength of regional pillars is still not well known. Ryder and Jager (2002, p270) mentioned a range of possible strengths (from 500 MPa down to 240 MPa).
The procedure to calculate APS for isolated pillars consists of averaging the stress values over all pillar elements, or dividing the total load by the pillar area. APS is not clearly defined for pillars that are not isolated but are connected to the vast amount of surrounding unmined ground as is the case for the pillars studied here. Our APS estimates are based on running averages across rows of elements.
16
2 Case studies
During the course of this project underground observations to study pillar deformations and stresses at both a Carbon Leader Reef mine (Driefontein 5E) and a Ventersdorp Contact Reef mine (Mponeng) were carried out.Dip pillar mining with backfill took place at both the Driefontein and the Mponeng sites, with stope access from haulages situated at about 80 m in the foot wall.
The largest part of the work in this project was undertaken using seismicity data interpreted in terms of modelled mining history (from raise to mining up to final pillar positions) and geological discontinuities. Underground experiments were also undertaken at both mines in the form of ground tilting measurements at Mponeng and strong ground motion recording at Driefontein. General information on the study areas with particular reference to the seismic-modelling work is provided here for the two mines in parallel (Table 1).
Table 1 Mining and layout design for two case studies. Reference to (M) for McGill (2005), (K) for
Klokow et al. (2002) and . Values marked with (E) have been calculated using equations from
Ryder and Jager (2002, p161) for infinitely replicating stopes & pillars. Stope width and backfill
information from Castelyn (Pers comm. 2003) (C).
Driefontein 5E# Mponeng
Actual S/W 1.0m & 2.2m (C) 1.4m (M)
Shaft Collar Elevation 150 m 180 m
Area Mined 1 057 896 m2 543 636 m2
First Date 1999/11/15 2002/9/15
Last Date 2007/01/15 2006/7/15
Number of mining steps digitised 86 47
Reef type CLR (K) VCR (M)
Dip Angle 24o 24o
Designed Pillar Size 40m (K) 30m (M)
Centre to Centre Spacing 180m (K) 210m (M)
Maximum Percentage Extraction 78% 86%
Range of Depths below surface 2857m-3481m 3055m-3679m
Design maximum ERR 30 MJ/m2
Maximum ERR, single stope 27 MJ/m2 (E) 38 MJ/m2 (E)
Average ERR, infinitely replicating
stopes/pillars
19 MJ/m2 (E) 32 MJ/m2 (E)
Design maximum APS 400 MPa (K) 596 MPa (C)
Mponeng Mine is part of the old Western Deep Levels gold mine, situated near Carletonville in South Africa. The mining method was changed from longwalling to Sequential Grid mining from 1996 onwards (McGill, 2005). Stopes are mined to an average stoping width of 1.4 m. Mining takes place exclusively on the Ventersdorp Contact Reef (VCR), which dips at about 24° to the South. Stopes are stabilized with backfill for both local and regional support and the faces are preconditioned as part of the blast cycle.
The area at Driefontein number five shaft Mponeng Mine was chosen for CSDP mining, partly because it was an isolated block of ground that would simplify the seismic analysis (Klokow, per comm., 2004). The CLR is split into two bands in the Western part of the area and has been mined at a wider stope width. It was only possible to backfill stopes below 41 level due to limitations of the backfill infrastructure.
17
Table 2 Modelling parameters for two case studies
Driefontein 5E# Mponeng
Modelled stope width 0.8 m and 2.0 m 1.2 m
Elements used in MINF model 256×256 256×256
Element size 6 m×6 m 6 m×6 m
Young’s modulus 70000 MPa 70000 MPa
Poisson’s ratio 0.20 0.20
Stress gradient 0.030 MPa/m 0.030 MPa/m
k – ratio 0.5 isotropic 0.5 isotropic
Backfill placement Full height, only below 41 level Full height
Backfill “a”-value 10 MPa 10 MPa
Backfill “b” values 0.40 0.40
The basic data for this study were obtained from mine plans at a scale of 1:1000 and catalogues of seismic data. The reef was very planar as could be seen from the consistent orientation (along dip) and spacing (down dip) of crosscuts and their intersections to reef. We were then able to approximate the reef geometry as a plane in each case, simplifying the modelling of deformations and stresses. Plastic failure ahead of the face and abutments was modelled by using a cap, or limiting, stress on reef elements (Spottiswoode, 1997).
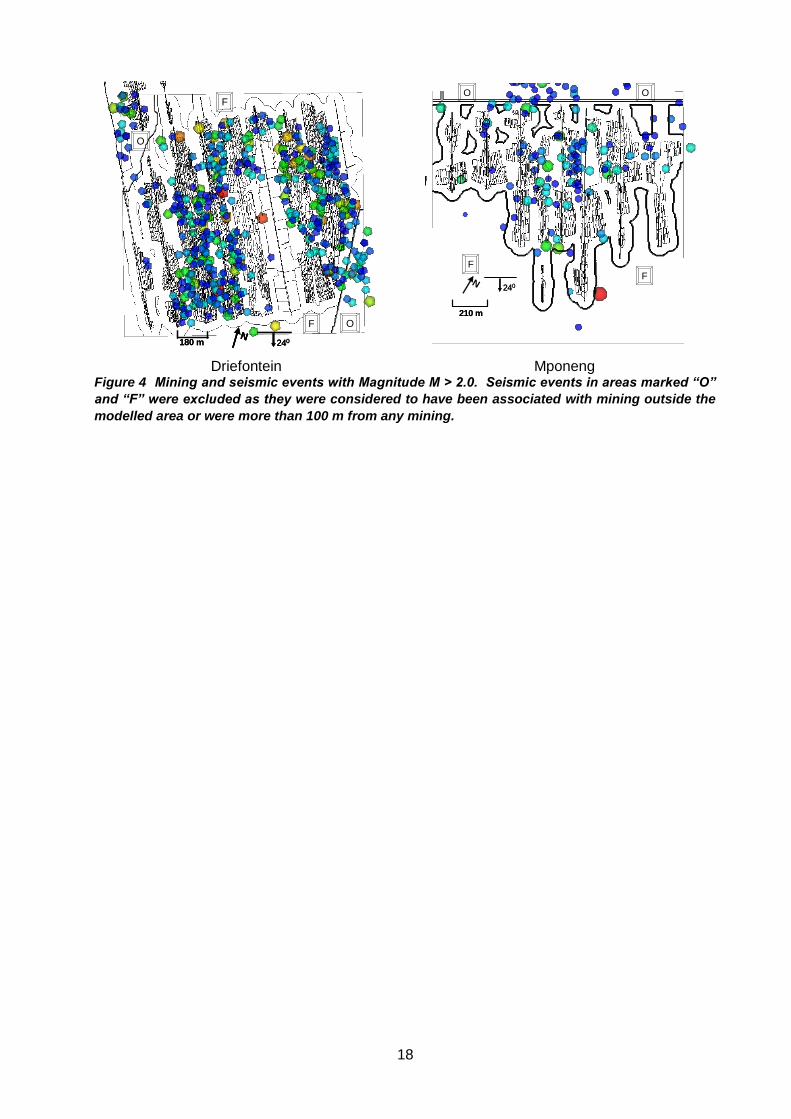
The face positions showing monthly face advance over several years were digitised and converted into arrays of square elements, each representing the amount of mining in each month using MinSim 2000. Mining parameters are shown in Table 1 and mine outlines in Figure 4. The study areas were chosen to contain a considerable amount of mining as well as being as isolated as possible from surrounding mining. This was not entirely the case: Figure 4 shows regions of mining and seismicity that were excluded from this study. Seismic data close to adjacent mining “O” and more than 100 m from any previous mining “F” were excluded from further analysis.
The seismic catalogues contained the date, time, location and seismic energy and seismic moment for each event. The energy was reported separately for P waves and S waves and the seismic moment was estimated separately for the P and S phases and assumed to be a pure shear source. Quality checks were performed and corrections made. About six weeks were missing from one data set, resulted in our rejection of two months of data. Some values of seismic energy were also unrealistically large, leading to values of apparent stress in excess of 50 MPa. These appear to be outliers and appeared to result from gross inaccuracies in calculations of seismic energy, ES. We reduced the impact of these anomalous values by limiting seismic energies to values derived from seismic moment and an upper estimate of apparent stress of 3 MPa using ES ≤ 3 MPa × M0/G.
The study areas are labelled “Driefontein” and “Mponeng” in this report and are also shortened to “Drie” and “Mpo”.
18
O
O
F
F
N240180 m
O
O
F
F
O
O
F
F
N240180 m
NN240240180 m
F
O O
F
210 m
240N
F
O O
F
F
O O
F
210 m210 m
240240N
Driefontein Mponeng Figure 4 Mining and seismic events with Magnitude M > 2.0. Seismic events in areas marked “O”
and “F” were excluded as they were considered to have been associated with mining outside the
modelled area or were more than 100 m from any mining.
19
3 Methodology for integration of seismicity and
modelling
We based our analysis on software and methods described by Spottiswoode (2005) to analyse
the amount of seismicity in terms of modelled deformations. Significant extensions were
developed during the current study. Deformations were modelled on a monthly basis using the
custom-built MINF code. MINF generated output that described spatial distributions of area
mined and strain energy released. Area mined, strain energy release and equivalent volume of
convergence between the stope roof and floor were cumulated in defined polygons. The
loading stiffness driving the deformations within each polygon was calculated. The MINSINT
program allocated seismicity to active mining and stationary faces. MINSINT then cumulated
and listed values within polygons to be used to compare seismicity to modelled deformations.
A number of parameters are used to model, describe and interpret seismic data. These
parameters and symbols are listed in Table 3.
Table 3 Abbreviations used in Table 5 and Figure 12 and Figure 16 for model (M) and seismic (S)
parameters
Abbreviation Data type Description, units
AM M Area, m2
EM M Strain energy released, GJ
VE M Volume of elastic convergence, m3
ERR M EM/AM
ES S Seismic energy radiated, GJ
M0P S Seismic moment estimated from P waves, MN-m
M0S S Seismic moment estimated from S waves, MN-m
M0 S Seismic moment estimated from P and S waves, MN-m
P S Potency = M0 / G, m3
rS S Source radius, derived using Brune’s (1970) model from corner frequencies, m
Va S Apparent volume, calculated as r3, 1000 × m3
No S Number of events when cumulated
a S Apparent stress = G×ES/M0, MPa with G = 70 GPa
AS S Area of seismic slip taken as the largest circular shape
inscribed within a spherical shape for the Apparent Volume
M & S Seismic efficiency = ES / EM
E M & S Normalised seismic deformation = P / VE, m3
3.1 Application of cap stress
On the basis that pillars will start to yield at an assumed strength, MINF limits the on-reef stress
component normal to the reef plane in unmined areas to given values. Results presented here
are based on infinite strength, followed by a section in which the strength values are decreased.
If the yield strength of a pillar is exceeded, considerable deformation and strain energy release
is possible. The cap stress has been a feature of the MINF code for many years (Spottiswoode,
1997). In actual fact, it was introduced in the predecessor of MINF in about 1981 after a short
discussion with the late Dave Ortlepp in connection with down-grading the regional support
effect of very small pillars at Blyvooruitzicht mine.
20
The loading stiffness was estimated with each polygon in an attempt to explain changes in the
character of seismicity with increasing ERR. S
tress
Displacement
Mine
EM
Str
ess
Displacement
Mine
Str
ess
Displacement
Str
ess
Displacement
Mine
EM
S
tress
Displacement
Mine
Crush
EM
Str
ess
Displacement
Mine
Crush
Str
ess
DisplacementS
tress
Displacement
Mine
Crush
EM
Str
ess
Displacement
Mine
Crush
EM
1
2
3Str
ess
Displacement
Mine
Crush
EM
1
2
3
(a) (b) (c)
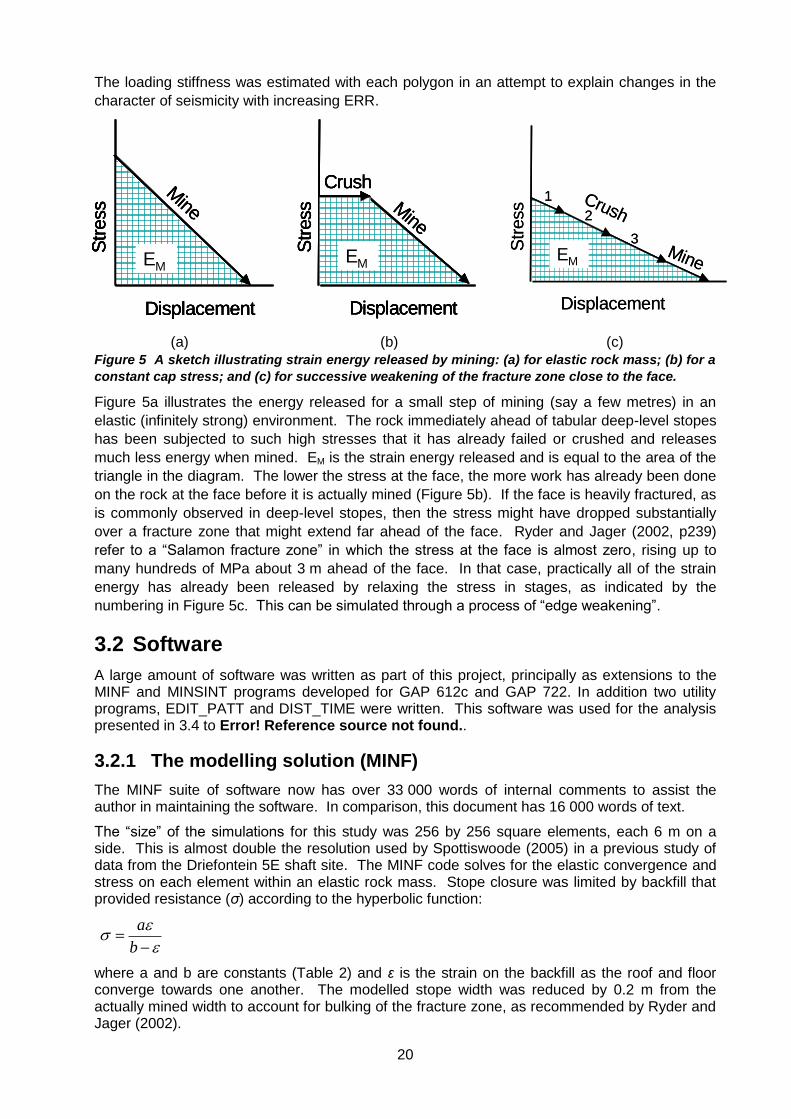
Figure 5 A sketch illustrating strain energy released by mining: (a) for elastic rock mass; (b) for a
constant cap stress; and (c) for successive weakening of the fracture zone close to the face.
Figure 5a illustrates the energy released for a small step of mining (say a few metres) in an
elastic (infinitely strong) environment. The rock immediately ahead of tabular deep-level stopes
has been subjected to such high stresses that it has already failed or crushed and releases
much less energy when mined. EM is the strain energy released and is equal to the area of the
triangle in the diagram. The lower the stress at the face, the more work has already been done
on the rock at the face before it is actually mined (Figure 5b). If the face is heavily fractured, as
is commonly observed in deep-level stopes, then the stress might have dropped substantially
over a fracture zone that might extend far ahead of the face. Ryder and Jager (2002, p239)
refer to a “Salamon fracture zone” in which the stress at the face is almost zero, rising up to
many hundreds of MPa about 3 m ahead of the face. In that case, practically all of the strain
energy has already been released by relaxing the stress in stages, as indicated by the
numbering in Figure 5c. This can be simulated through a process of “edge weakening”.
3.2 Software
A large amount of software was written as part of this project, principally as extensions to the MINF and MINSINT programs developed for GAP 612c and GAP 722. In addition two utility programs, EDIT_PATT and DIST_TIME were written. This software was used for the analysis presented in 3.4 to Error! Reference source not found..
3.2.1 The modelling solution (MINF)
The MINF suite of software now has over 33 000 words of internal comments to assist the author in maintaining the software. In comparison, this document has 16 000 words of text.
The “size” of the simulations for this study was 256 by 256 square elements, each 6 m on a side. This is almost double the resolution used by Spottiswoode (2005) in a previous study of data from the Driefontein 5E shaft site. The MINF code solves for the elastic convergence and stress on each element within an elastic rock mass. Stope closure was limited by backfill that provided resistance (σ) according to the hyperbolic function:
b
a
where a and b are constants (Table 2) and ε is the strain on the backfill as the roof and floor converge towards one another. The modelled stope width was reduced by 0.2 m from the actually mined width to account for bulking of the fracture zone, as recommended by Ryder and Jager (2002).

21
The MINF code provides for various types of plastic and brittle constitutive laws to approximate relaxation of the reef-normal stresses ahead of the face (Spottiswoode, 2001). The simplest of these will be applied in the report, namely limiting, or capping, the stress to a defined level (Spottiswoode, 1997) as in Figure 5b. Work was also done using the “edge weakening” model shown in Figure 5c. This work did not show behaviour that was dramatically different from the cap stress model, and results are not shown in this report.
3.2.2 The integration solution (MINSINT)
Seismicity was attributed to mining by the program MINSINT in a manner similar to that described by Spottiswoode (2004). The following factors were taken into consideration in planning the process of attributing, or distributing, seismicity to mining:
Seismicity is caused by the high stresses in the vicinity of the edges of the stopes, either at the faces or abutments. In particular, seismicity is associated with stress changes caused by active mining.
If seismicity is associated with faults or dykes, it will still occur under the influence of the mining, perhaps within a few tens of metres from the faces & abutments.
Seismic locations are prone to errors of about 40 m in the plane of the reef. As the geophones are located close to the plane of the reef, location errors are greater at right angles to the reef than in the reef plane. Nominal location errors in the plane of the reef are typically 40 m.
Seismic events have a finite dimension that increases with the event Magnitude and can be approximated by the source radius.
There is no clear rule to describe the potential of stationary faces for generating seismicity.
Quasi-static stress changes due to mining are therefore not always optimal as a spatial
predictor of seismicity. Nonetheless, we assumed that stationary faces retain a residual
propensity for failure, which is modelled by using face ERR and virtual mining of 1% on all of the
elements at all faces currently not being mined.
Based on these considerations, the hypocentre of each event was moved to the nearest likely mining, as follows:
projecting it perpendicularly onto a grid point on the reef plane;
erecting a 2-dimensional Gaussian error function around this grid point;
multiplying the Gaussian error function by the energy release associated with mining (see Figure 6);
choosing the position of the maximum value of this product; and
expanding the influence according to the event size.
The strength of each event was then expanded according to the source size. In the example in Figure 6, event A was moved to the nearest area of active mining while event B was attributed to the nearest stationary face. An oblique view was used in Figure 6. Event A located further off reef than event B, resulting in event A plotting further from the centre of the contour lines of influence in Figure 6.
22
AB
AB
AB
AB
Figure 6 Diagram to illustrate how seismic events (A & B) were attributed to mining. (a) Gaussian
function around the projection of each event to reef. (b) The events with contoured released
strain energy. (c) Contours of event influence are the product of the values in (a) and (b). Event A
is, in effect, moved as shown.
MINSINT was also use to group mining and seismicity in polygons (sections 3.4 to 3.6), to study
the influence of geological features (section 3.9) and aspects of double-sided mining (section
3.8).
3.3 Meeting criteria
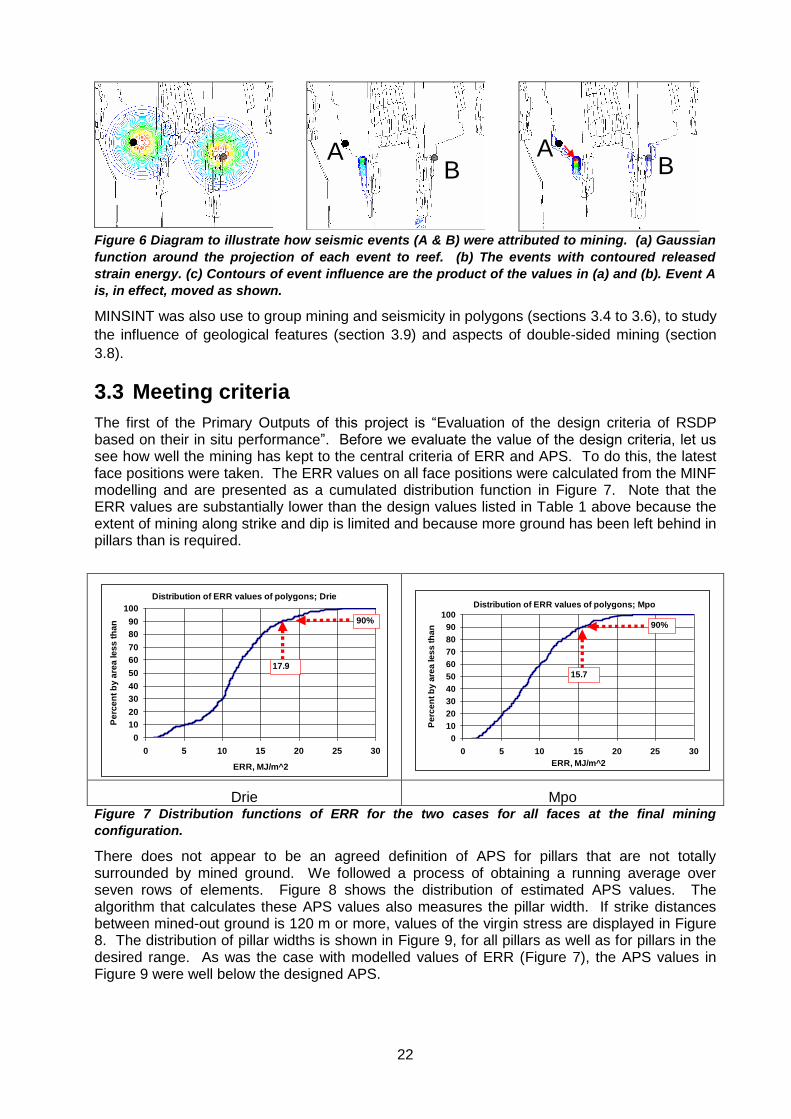
The first of the Primary Outputs of this project is “Evaluation of the design criteria of RSDP based on their in situ performance”. Before we evaluate the value of the design criteria, let us see how well the mining has kept to the central criteria of ERR and APS. To do this, the latest face positions were taken. The ERR values on all face positions were calculated from the MINF modelling and are presented as a cumulated distribution function in Figure 7. Note that the ERR values are substantially lower than the design values listed in Table 1 above because the extent of mining along strike and dip is limited and because more ground has been left behind in pillars than is required.
Distribution of ERR values of polygons; Drie
0
10
20
30
40
50
60
70
80
90
100
0 5 10 15 20 25 30
ERR, MJ/m^2
Pe
rce
nt
by
are
a le
ss
th
an 90%
17.9
Distribution of ERR values of polygons; Mpo
0
10
20
30
40
50
60
70
80
90
100
0 5 10 15 20 25 30
ERR, MJ/m^2
Pe
rce
nt
by
are
a le
ss
th
an 90%
15.7
Drie Mpo Figure 7 Distribution functions of ERR for the two cases for all faces at the final mining
configuration.
There does not appear to be an agreed definition of APS for pillars that are not totally surrounded by mined ground. We followed a process of obtaining a running average over seven rows of elements. Figure 8 shows the distribution of estimated APS values. The algorithm that calculates these APS values also measures the pillar width. If strike distances between mined-out ground is 120 m or more, values of the virgin stress are displayed in Figure 8. The distribution of pillar widths is shown in Figure 9, for all pillars as well as for pillars in the desired range. As was the case with modelled values of ERR (Figure 7), the APS values in Figure 9 were well below the designed APS.
23
Figure 8 APS across pillar at Driefontein
Distribution of pillar widths; Drie
0
50
100
150
200
250
300
350
6 12
18
24
30
36
42
48
54
60
66
72
78
84
90
96
102
108
114
120
Pillar width, m
Nu
mb
er
Distribution of pillar widths; Mpo
0
20
40
60
80
100
6 12
18
24
30
36
42
48
54
60
66
72
78
84
90
96
10
21
08
11
4
12
0
Pillar width, m
Nu
mb
er
Drie Mponeng
Figure 9 Distribution of pillar sizes at the last stage of mining
Distribution of pillar stress; Drie
0102030405060708090
100
0 100 200 300 400 500
APS, MPa
Cu
mu
late
d p
erc
en
t
All
30m to 42m
330 MPa
90%
Distribution of pillar stresses; Mpo
0
10
20
30
40
50
60
70
80
90
100
0 50 100 150 200 250APS, MPa
Cu
mu
late
d p
erc
en
t
All
30 to 42m
90%
167 MPa
Drie Mponeng
Figure 10 Distribution of APS values
24
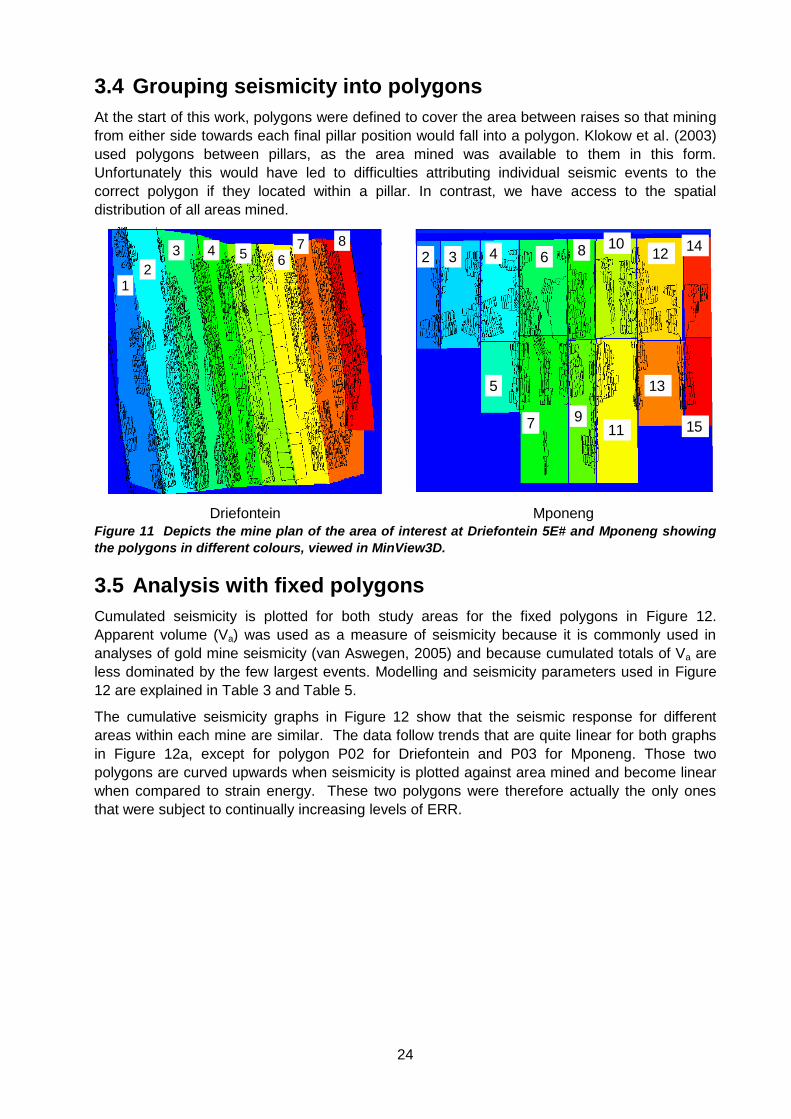
3.4 Grouping seismicity into polygons
At the start of this work, polygons were defined to cover the area between raises so that mining
from either side towards each final pillar position would fall into a polygon. Klokow et al. (2003)
used polygons between pillars, as the area mined was available to them in this form.
Unfortunately this would have led to difficulties attributing individual seismic events to the
correct polygon if they located within a pillar. In contrast, we have access to the spatial
distribution of all areas mined.
12
3 4 5 67 8
12
3 4 5 67 8
2 3 4
5
6 8 10
7 915
14
13
12
11
2 3 4
5
6 8 10
7 915
14
13
12
11
Driefontein Mponeng
Figure 11 Depicts the mine plan of the area of interest at Driefontein 5E# and Mponeng showing
the polygons in different colours, viewed in MinView3D.
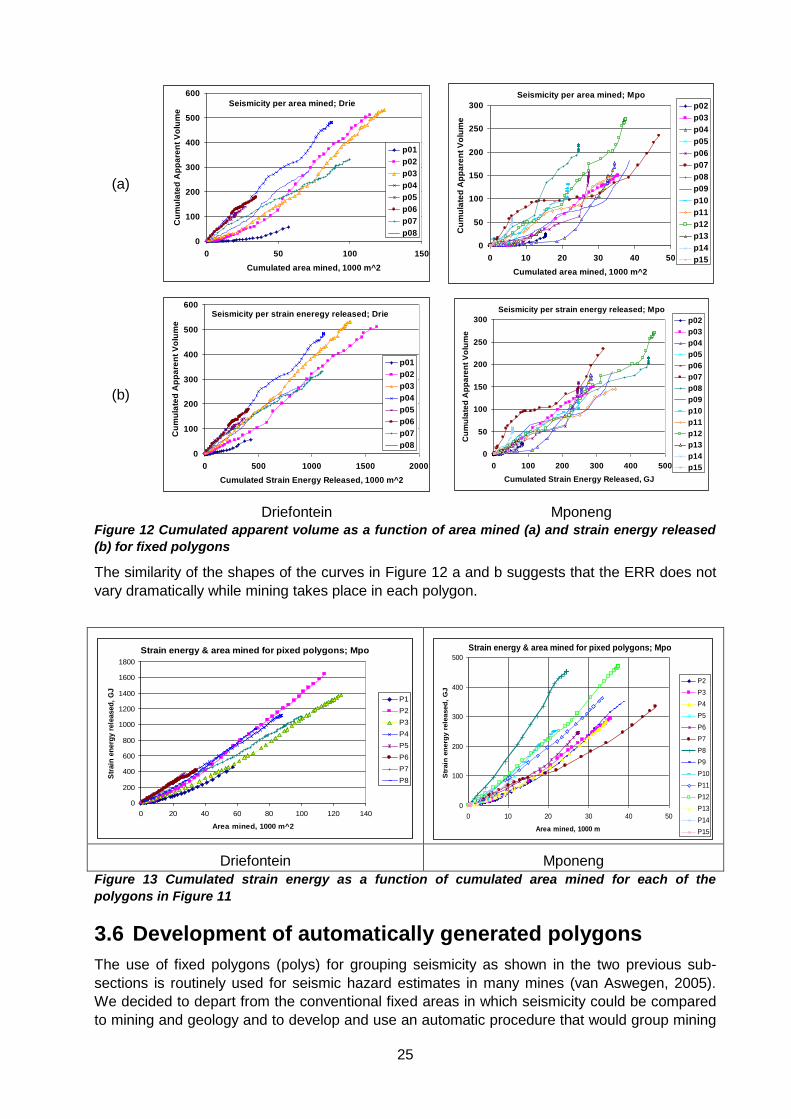
3.5 Analysis with fixed polygons
Cumulated seismicity is plotted for both study areas for the fixed polygons in Figure 12.
Apparent volume (Va) was used as a measure of seismicity because it is commonly used in
analyses of gold mine seismicity (van Aswegen, 2005) and because cumulated totals of Va are
less dominated by the few largest events. Modelling and seismicity parameters used in Figure
12 are explained in Table 3 and Table 5.
The cumulative seismicity graphs in Figure 12 show that the seismic response for different
areas within each mine are similar. The data follow trends that are quite linear for both graphs
in Figure 12a, except for polygon P02 for Driefontein and P03 for Mponeng. Those two
polygons are curved upwards when seismicity is plotted against area mined and become linear
when compared to strain energy. These two polygons were therefore actually the only ones
that were subject to continually increasing levels of ERR.
25
(a)
Seismicity per area mined; Drie
0
100
200
300
400
500
600
0 50 100 150
Cumulated area mined, 1000 m^2
Cu
mu
late
d A
pp
are
nt
Vo
lum
e
p01
p02
p03
p04
p05
p06
p07
p08
Seismicity per area mined; Mpo
0
50
100
150
200
250
300
0 10 20 30 40 50
Cumulated area mined, 1000 m^2
Cu
mu
late
d A
pp
are
nt
Vo
lum
e
p02
p03
p04
p05
p06
p07
p08
p09
p10
p11
p12
p13
p14
p15
(b)
Seismicity per strain eneregy released; Drie
0
100
200
300
400
500
600
0 500 1000 1500 2000
Cumulated Strain Energy Released, 1000 m^2
Cu
mu
late
d A
pp
are
nt
Vo
lum
e
p01
p02
p03
p04
p05
p06
p07
p08
Seismicity per strain energy released; Mpo
0
50
100
150
200
250
300
0 100 200 300 400 500
Cumulated Strain Energy Released, GJ
Cu
mu
late
d A
pp
are
nt
Vo
lum
e
p02
p03
p04
p05
p06
p07
p08
p09
p10
p11
p12
p13
p14
p15
Driefontein Mponeng
Figure 12 Cumulated apparent volume as a function of area mined (a) and strain energy released
(b) for fixed polygons
The similarity of the shapes of the curves in Figure 12 a and b suggests that the ERR does not
vary dramatically while mining takes place in each polygon.
Strain energy & area mined for pixed polygons; Mpo
0
200
400
600
800
1000
1200
1400
1600
1800
0 20 40 60 80 100 120 140
Area mined, 1000 m^2
Str
ain
en
erg
y r
ele
ased
, G
J
P1
P2
P3
P4
P5
P6
P7
P8
Strain energy & area mined for pixed polygons; Mpo
0
100
200
300
400
500
0 10 20 30 40 50
Area mined, 1000 m
Str
ain
en
erg
y r
ele
ased
, G
J
P2
P3
P4
P5
P6
P7
P8
P9
P10
P11
P12
P13
P14
P15
Driefontein Mponeng
Figure 13 Cumulated strain energy as a function of cumulated area mined for each of the
polygons in Figure 11
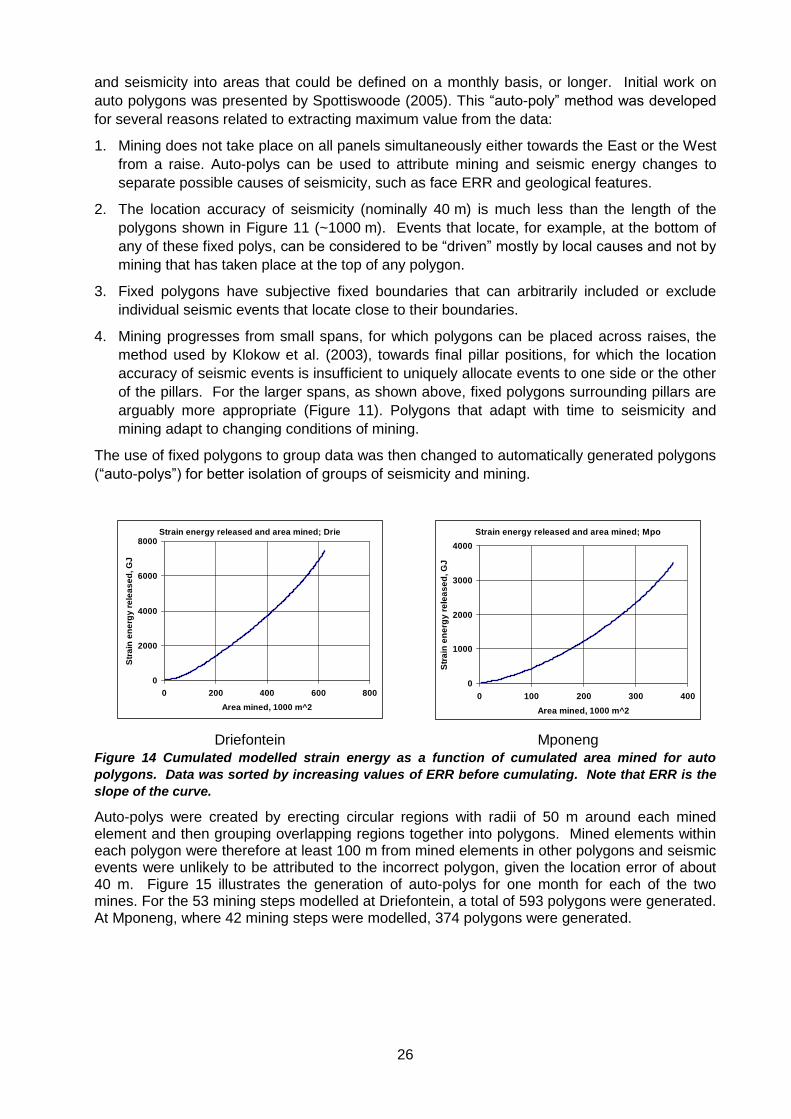
3.6 Development of automatically generated polygons
The use of fixed polygons (polys) for grouping seismicity as shown in the two previous sub-
sections is routinely used for seismic hazard estimates in many mines (van Aswegen, 2005).
We decided to depart from the conventional fixed areas in which seismicity could be compared
to mining and geology and to develop and use an automatic procedure that would group mining
26
and seismicity into areas that could be defined on a monthly basis, or longer. Initial work on
auto polygons was presented by Spottiswoode (2005). This “auto-poly” method was developed
for several reasons related to extracting maximum value from the data:
1. Mining does not take place on all panels simultaneously either towards the East or the West
from a raise. Auto-polys can be used to attribute mining and seismic energy changes to
separate possible causes of seismicity, such as face ERR and geological features.
2. The location accuracy of seismicity (nominally 40 m) is much less than the length of the
polygons shown in Figure 11 (~1000 m). Events that locate, for example, at the bottom of
any of these fixed polys, can be considered to be “driven” mostly by local causes and not by
mining that has taken place at the top of any polygon.
3. Fixed polygons have subjective fixed boundaries that can arbitrarily included or exclude
individual seismic events that locate close to their boundaries.
4. Mining progresses from small spans, for which polygons can be placed across raises, the
method used by Klokow et al. (2003), towards final pillar positions, for which the location
accuracy of seismic events is insufficient to uniquely allocate events to one side or the other
of the pillars. For the larger spans, as shown above, fixed polygons surrounding pillars are
arguably more appropriate (Figure 11). Polygons that adapt with time to seismicity and
mining adapt to changing conditions of mining.
The use of fixed polygons to group data was then changed to automatically generated polygons
(“auto-polys”) for better isolation of groups of seismicity and mining.
Strain energy released and area mined; Drie
0
2000
4000
6000
8000
0 200 400 600 800
Area mined, 1000 m^2
Str
ain
en
erg
y r
ele
as
ed
, G
J
Strain energy released and area mined; Mpo
0
1000
2000
3000
4000
0 100 200 300 400
Area mined, 1000 m^2
Str
ain
en
erg
y r
ele
as
ed
, G
J
Driefontein Mponeng
Figure 14 Cumulated modelled strain energy as a function of cumulated area mined for auto
polygons. Data was sorted by increasing values of ERR before cumulating. Note that ERR is the
slope of the curve.
Auto-polys were created by erecting circular regions with radii of 50 m around each mined element and then grouping overlapping regions together into polygons. Mined elements within each polygon were therefore at least 100 m from mined elements in other polygons and seismic events were unlikely to be attributed to the incorrect polygon, given the location error of about 40 m. Figure 15 illustrates the generation of auto-polys for one month for each of the two mines. For the 53 mining steps modelled at Driefontein, a total of 593 polygons were generated. At Mponeng, where 42 mining steps were modelled, 374 polygons were generated.
27
Driefontein Mponeng Figure 15 Sample showing auto polygons drawn around one month’s mining and seismicity
during the same month.
Not all events were allocated to polygons, either because they occurred on old faces or because their locations were in error by well over 50 m. Table 4 lists the proportion of seismicity that was not included in the auto-polys.
Table 4 Amount (per cent) of seismicity that was not included in the auto-polys.
Parameter PEn SEn PMo SMo Va A No Mo3r
Drie 7 9 8 9 5 5 5 5
Mpo 15 13 15 15 17 18 18 18
Results are interpreted in terms of a number of seismic parameters. Each graph in Figure 16a to e can be interpreted in terms of the response of the rock mass to mining. The quantities being graphed are listed and described in Table 5.
Table 5 Values used for graphs in Figure 6 and their interpretation. In each case values from each
polygon are sorted by increasing ERR and cumulated for model (X) and seismic data (Y).
Values
Label X Y Phenomenon Driefontein Mponeng
(a) AM Several seismic measures, normalised to total of 100%
Seismicity rate increases with increasing span
n/a n/a
(b) EM Seismicity /area mined ERR n/a n/a
(c) EM ES (seismic energy efficiency) 0.0042 0.0020
(d) VE P = M0/G E 0.25 0.19
(e) AM AS Overlapping source regions=
AS / AM
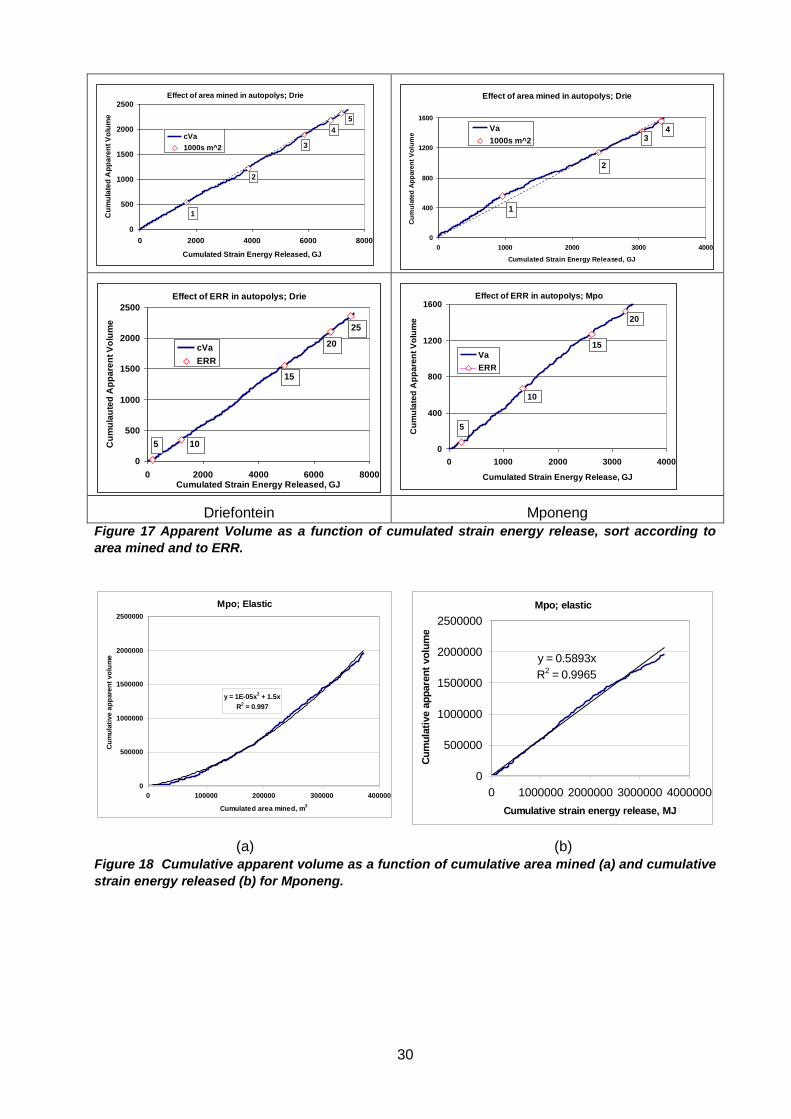
73 67
Apparent stress:{AS × a} / AS, MPa 0.20 0.13
Overlap × apparent stress, MPa 15 9
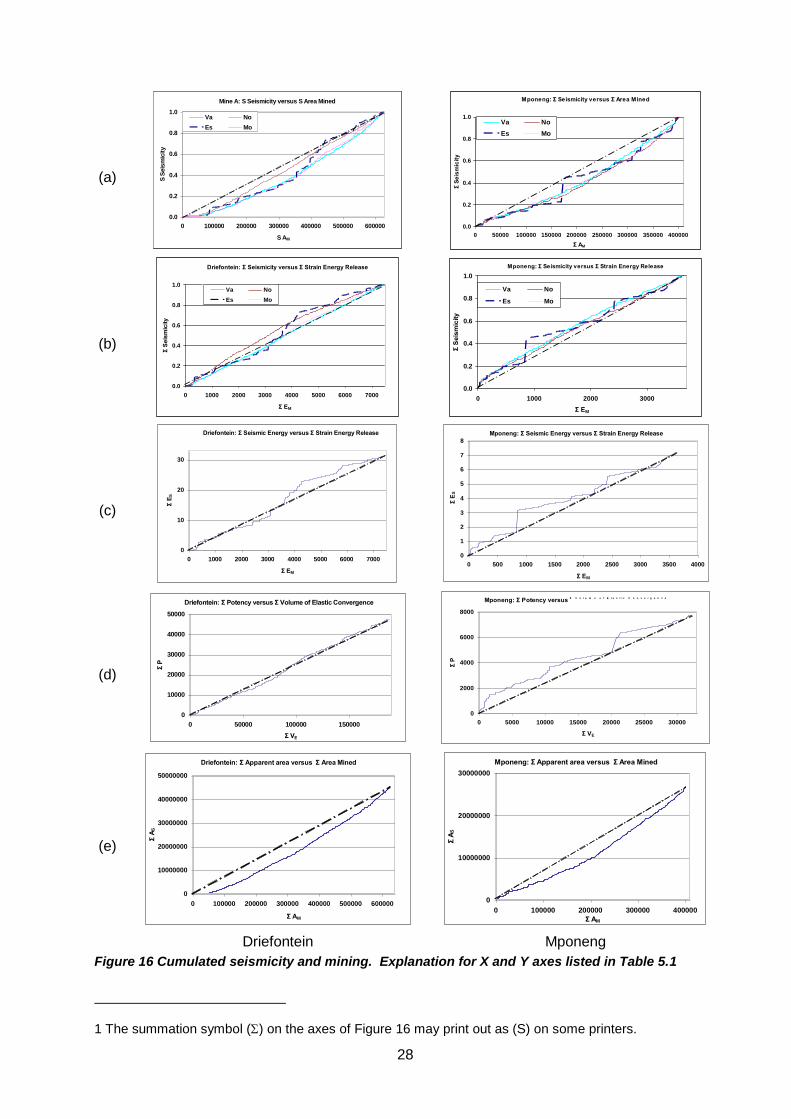
28
(a)
Mine A: S Seismicity versus S Area Mined
0.0
0.2
0.4
0.6
0.8
1.0
0 100000 200000 300000 400000 500000 600000
S AM
S S
eis
mic
ity
Va No
Es Mo
Mine A: S Seismicity versus S Area Mined
0.0
0.2
0.4
0.6
0.8
1.0
0 100000 200000 300000 400000 500000 600000
S AM
S S
eis
mic
ity
Va No
Es Mo
Mponeng: Σ Seismicity versus Σ Area Mined
0.0
0.2
0.4
0.6
0.8
1.0
0 50000 100000 150000 200000 250000 300000 350000 400000
Σ AM
Σ S
eis
mic
ity
Va No
Es Mo
(b)
Driefontein: Σ Seismicity versus Σ Strain Energy Release
0.0
0.2
0.4
0.6
0.8
1.0
0 1000 2000 3000 4000 5000 6000 7000
Σ EM
Σ S
eis
mic
ity
Va No
Es Mo
Mponeng: Σ Seismicity versus Σ Strain Energy Release
0.0
0.2
0.4
0.6
0.8
1.0
0 1000 2000 3000
Σ EM
Σ S
eis
mic
ity
Va No
Es Mo
(c)
Driefontein: Σ Seismic Energy versus Σ Strain Energy Release
0
10
20
30
0 1000 2000 3000 4000 5000 6000 7000
Σ EM
Σ E
S
Mponeng: Σ Seismic Energy versus Σ Strain Energy Release
0
1
2
3
4
5
6
7
8
0 500 1000 1500 2000 2500 3000 3500 4000
Σ EM
Σ E
S
(d)
Driefontein: Σ Potency versus Σ Volume of Elastic Convergence
0
10000
20000
30000
40000
50000
0 50000 100000 150000
Σ VE
Σ P
Mponeng: Σ Potency versus Σ V o l u m e o f E l a s t i c C o n v e r g e n c e
0
2000
4000
6000
8000
0 5000 10000 15000 20000 25000 30000
Σ VE
Σ P
(e)
Driefontein: Σ Apparent area versus Σ Area Mined
0
10000000
20000000
30000000
40000000
50000000
0 100000 200000 300000 400000 500000 600000
Σ AM
Σ A
S
Mponeng: Σ Apparent area versus Σ Area Mined
0
10000000
20000000
30000000
0 100000 200000 300000 400000
Σ AM
Σ A
S
Driefontein Mponeng
Figure 16 Cumulated seismicity and mining. Explanation for X and Y axes listed in Table 5.1
1 The summation symbol () on the axes of Figure 16 may print out as (S) on some printers.

29
Cumulative seismicity vs. area mined
The concave upwards shape of the graphs in Figure 16a indicate that the rate of seismicity per area mined (the slope of the graphs) increased with increasing levels of ERR. The least pronounced increase was for the event rate for Driefontein, perhaps indicating a steady growth of the fracture zone as mining advanced.
Cumulative seismicity vs. cumulative strain energy release
Figure 16b contrasts much more from Figure 16a than was the case for Figure 12a and Figure 12b. The increase in contrast when auto-polys are applied and the data sorted by ERR shows that seismicity per area mind is sensitive to changes in ERR. More particularly, the clustering of the graphs in Figure 16b about the constant rate of seismicity given by the dot-dashed lines is compatible with seismicity per area mined being proportional to ERR.
Cumulative seismic energy vs. cumulative strain energy release
Data for seismic energy was extracted from Figure 16a and plotted in Figure 16c to show the estimates of the seismic efficiency, or the proportion of released energy that was radiated seismically. The values of 0.4% and 0.2% derived from the slope of these graphs for the two mines were compatible with earlier work by Spottiswoode (1980).
Cumulative seismic potency vs. cumulative strain energy release
The estimates of E of 0.25 and 0.19 derived from Figure 16d are higher than most of the values reported by Milev and Spottiswoode (1997), but substantially lower than the original work of
McGarr and Wiebols (1977) who suggested that E should be equal to 1.0. As most of the
values of E reported by Milev and Spottiswoode (1997) were less than 0.1 and were based on seismic moments inferred from local mine magnitudes, we suggest that the current estimates are more accurate than those of Milev and Spottiswoode (1997) and that our values better represent the seismic response of mining on the CLR and VCR. The factor of four or five difference between our work and that of McGarr and Wiebols (1977) should be considered in
any future studies of E.
Cumulative apparent area vs. cumulative area mined
Figure 16e was introduced here to indicate the degree to which seismic events occur in the near field of one another. The degree of near-field influence within the suite of events is calculated by dividing the area of inferred slip by the corresponding area of mining and is called the “overlap factor” here and has values of 73 and 67 for the two data sets (Table 5). The high degree of overlap could occur either by shear planes slipping many times or by shear planes forming close to previously formed shear planes. For comparison, the overlap factor of the shear fractures over face advance of Error! Reference source not found. from Adams et al. (2002) is about 3.2. Inspection of the figures of Ortlepp (1997, p46) yield similarly low values of overlap factor.
Further interpretation
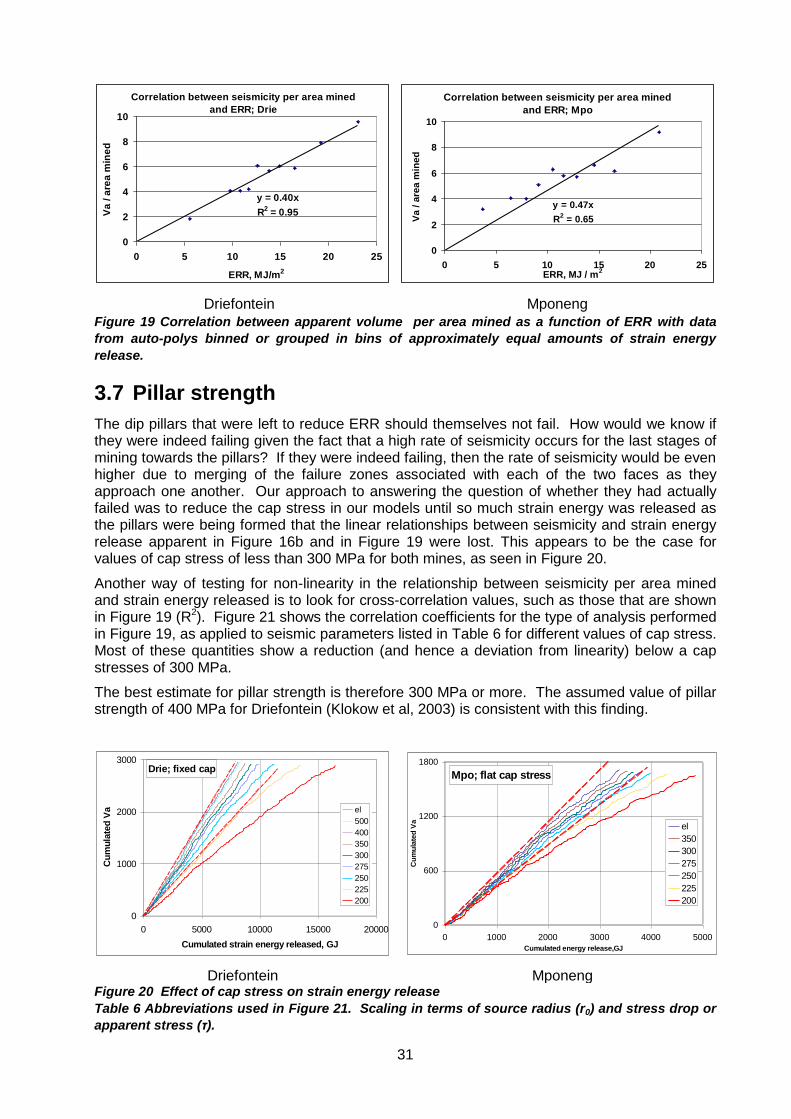
The difference in shape of the graphs of seismicity as a function of area mined and of strain energy released is dramatically illustrated in Figure 18 where it can be seen that cumulated apparent volume is a linear function of cumulated strain energy release for data from Mponeng. The proportionality of seismicity and strain energy released can also be tested by binning data points from polygons with similar values of ERR. Figure 19 shows excellent correlations between apparent stress per area mined and ERR for both mines.
30
Effect of area mined in autopolys; Drie
0
500
1000
1500
2000
2500
0 2000 4000 6000 8000
Cumulated Strain Energy Released, GJ
Cu
mu
late
d A
pp
are
nt
Vo
lum
e
cVa
1000s m^2
1
2
3
4
5
Effect of area mined in autopolys; Drie
0
400
800
1200
1600
0 1000 2000 3000 4000
Cumulated Strain Energy Released, GJ
Cu
mu
late
d A
pp
are
nt
Vo
lum
e
Va
1000s m^2
1
2
34
Effect of ERR in autopolys; Drie
0
500
1000
1500
2000
2500
0 2000 4000 6000 8000Cumulated Strain Energy Released, GJ
Cu
mu
lau
ted
Ap
pa
ren
t V
olu
me
cVa
ERR
5 10
15
20
25
Effect of ERR in autopolys; Mpo
0
400
800
1200
1600
0 1000 2000 3000 4000
Cumulated Strain Energy Release, GJ
Cu
mu
late
d A
pp
are
nt
Vo
lum
e
Va
ERR
5
10
15
20
Driefontein Mponeng
Figure 17 Apparent Volume as a function of cumulated strain energy release, sort according to
area mined and to ERR.
Mpo; Elastic
y = 1E-05x2 + 1.5x
R2 = 0.997
0
500000
1000000
1500000
2000000
2500000
0 100000 200000 300000 400000
Cumulated area mined, m2
Cu
mu
lati
ve a
pp
are
nt
vo
lum
e
Mpo; elastic
y = 0.5893x
R2 = 0.9965
0
500000
1000000
1500000
2000000
2500000
0 1000000 2000000 3000000 4000000
Cumulative strain energy release, MJ
Cu
mu
lati
ve a
pp
are
nt
vo
lum
e
(a) (b)
Figure 18 Cumulative apparent volume as a function of cumulative area mined (a) and cumulative
strain energy released (b) for Mponeng.
31
Correlation between seismicity per area mined
and ERR; Drie
y = 0.40x
R2 = 0.95
0
2
4
6
8
10
0 5 10 15 20 25
ERR, MJ/m2
Va
/ a
rea
min
ed
Correlation between seismicity per area mined
and ERR; Mpo
y = 0.47x
R2 = 0.65
0
2
4
6
8
10
0 5 10 15 20 25ERR, MJ / m
2
Va / a
rea m
ined
Driefontein Mponeng
Figure 19 Correlation between apparent volume per area mined as a function of ERR with data
from auto-polys binned or grouped in bins of approximately equal amounts of strain energy
release.
3.7 Pillar strength
The dip pillars that were left to reduce ERR should themselves not fail. How would we know if they were indeed failing given the fact that a high rate of seismicity occurs for the last stages of mining towards the pillars? If they were indeed failing, then the rate of seismicity would be even higher due to merging of the failure zones associated with each of the two faces as they approach one another. Our approach to answering the question of whether they had actually failed was to reduce the cap stress in our models until so much strain energy was released as the pillars were being formed that the linear relationships between seismicity and strain energy release apparent in Figure 16b and in Figure 19 were lost. This appears to be the case for values of cap stress of less than 300 MPa for both mines, as seen in Figure 20.
Another way of testing for non-linearity in the relationship between seismicity per area mined and strain energy released is to look for cross-correlation values, such as those that are shown in Figure 19 (R2). Figure 21 shows the correlation coefficients for the type of analysis performed in Figure 19, as applied to seismic parameters listed in Table 6 for different values of cap stress. Most of these quantities show a reduction (and hence a deviation from linearity) below a cap stresses of 300 MPa.
The best estimate for pillar strength is therefore 300 MPa or more. The assumed value of pillar strength of 400 MPa for Driefontein (Klokow et al, 2003) is consistent with this finding.
Drie; fixed cap
0
1000
2000
3000
0 5000 10000 15000 20000
Cumulated strain energy released, GJ
Cu
mu
late
d V
a el
500
400
350
300
275
250
225
200
Mpo; flat cap stress
0
600
1200
1800
0 1000 2000 3000 4000 5000
Cumulated energy release,GJ
Cu
mu
late
d V
a
el
350
300
275
250
225
200
Driefontein Mponeng Figure 20 Effect of cap stress on strain energy release
Table 6 Abbreviations used in Figure 21. Scaling in terms of source radius (r0) and stress drop or
apparent stress (τ).
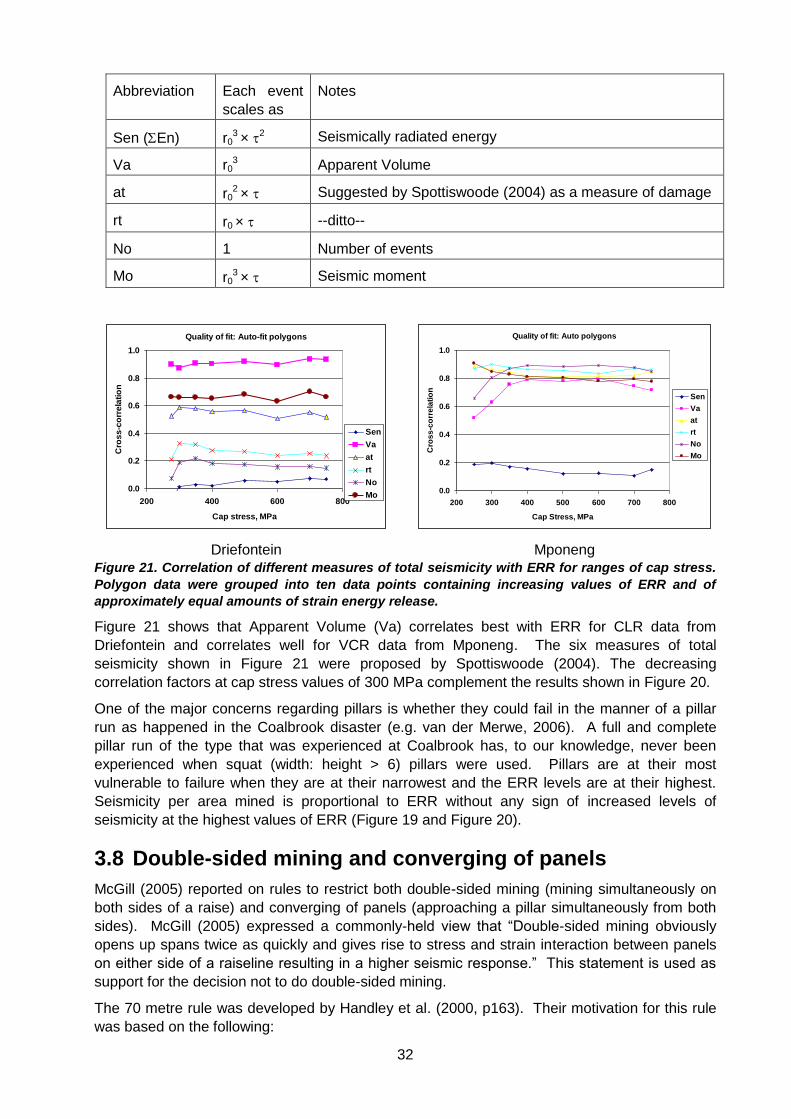
32
Abbreviation Each event
scales as
Notes
Sen (En) r03 × 2 Seismically radiated energy
Va r03 Apparent Volume
at r02 × Suggested by Spottiswoode (2004) as a measure of damage
rt r0 × --ditto--
No 1 Number of events
Mo r03 × Seismic moment
Quality of fit: Auto-fit polygons
0.0
0.2
0.4
0.6
0.8
1.0
200 400 600 800
Cap stress, MPa
Cro
ss
-co
rre
lati
on
Sen
Va
at
rt
No
Mo
Quality of fit: Auto polygons
0.0
0.2
0.4
0.6
0.8
1.0
200 300 400 500 600 700 800
Cap Stress, MPa
Cro
ss
-co
rre
lati
on
Sen
Va
at
rt
No
Mo
Driefontein Mponeng
Figure 21. Correlation of different measures of total seismicity with ERR for ranges of cap stress.
Polygon data were grouped into ten data points containing increasing values of ERR and of
approximately equal amounts of strain energy release.
Figure 21 shows that Apparent Volume (Va) correlates best with ERR for CLR data from
Driefontein and correlates well for VCR data from Mponeng. The six measures of total
seismicity shown in Figure 21 were proposed by Spottiswoode (2004). The decreasing
correlation factors at cap stress values of 300 MPa complement the results shown in Figure 20.
One of the major concerns regarding pillars is whether they could fail in the manner of a pillar
run as happened in the Coalbrook disaster (e.g. van der Merwe, 2006). A full and complete
pillar run of the type that was experienced at Coalbrook has, to our knowledge, never been
experienced when squat (width: height > 6) pillars were used. Pillars are at their most
vulnerable to failure when they are at their narrowest and the ERR levels are at their highest.
Seismicity per area mined is proportional to ERR without any sign of increased levels of
seismicity at the highest values of ERR (Figure 19 and Figure 20).
3.8 Double-sided mining and converging of panels
McGill (2005) reported on rules to restrict both double-sided mining (mining simultaneously on
both sides of a raise) and converging of panels (approaching a pillar simultaneously from both
sides). McGill (2005) expressed a commonly-held view that “Double-sided mining obviously
opens up spans twice as quickly and gives rise to stress and strain interaction between panels
on either side of a raiseline resulting in a higher seismic response.” This statement is used as
support for the decision not to do double-sided mining.
The 70 metre rule was developed by Handley et al. (2000, p163). Their motivation for this rule
was based on the following:
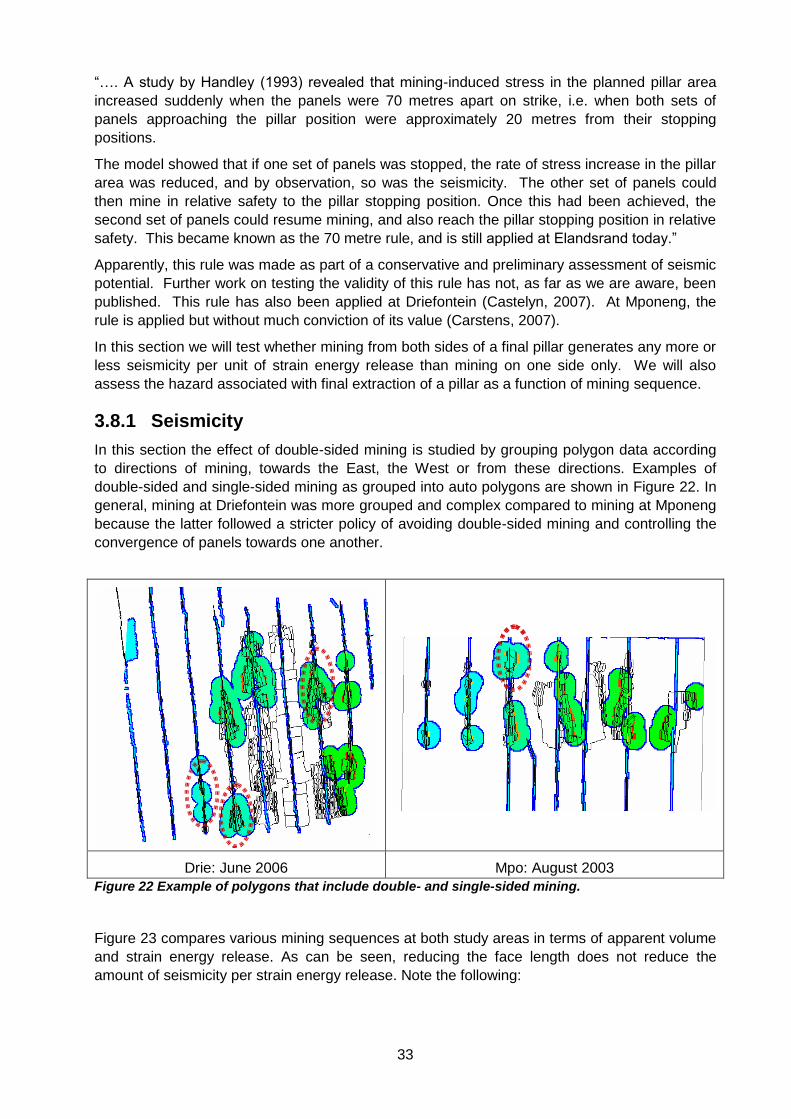
33
“…. A study by Handley (1993) revealed that mining-induced stress in the planned pillar area
increased suddenly when the panels were 70 metres apart on strike, i.e. when both sets of
panels approaching the pillar position were approximately 20 metres from their stopping
positions.
The model showed that if one set of panels was stopped, the rate of stress increase in the pillar
area was reduced, and by observation, so was the seismicity. The other set of panels could
then mine in relative safety to the pillar stopping position. Once this had been achieved, the
second set of panels could resume mining, and also reach the pillar stopping position in relative
safety. This became known as the 70 metre rule, and is still applied at Elandsrand today.”
Apparently, this rule was made as part of a conservative and preliminary assessment of seismic
potential. Further work on testing the validity of this rule has not, as far as we are aware, been
published. This rule has also been applied at Driefontein (Castelyn, 2007). At Mponeng, the
rule is applied but without much conviction of its value (Carstens, 2007).
In this section we will test whether mining from both sides of a final pillar generates any more or
less seismicity per unit of strain energy release than mining on one side only. We will also
assess the hazard associated with final extraction of a pillar as a function of mining sequence.
3.8.1 Seismicity
In this section the effect of double-sided mining is studied by grouping polygon data according
to directions of mining, towards the East, the West or from these directions. Examples of
double-sided and single-sided mining as grouped into auto polygons are shown in Figure 22. In
general, mining at Driefontein was more grouped and complex compared to mining at Mponeng
because the latter followed a stricter policy of avoiding double-sided mining and controlling the
convergence of panels towards one another.
Drie: June 2006 Mpo: August 2003
Figure 22 Example of polygons that include double- and single-sided mining.
Figure 23 compares various mining sequences at both study areas in terms of apparent volume
and strain energy release. As can be seen, reducing the face length does not reduce the
amount of seismicity per strain energy release. Note the following:
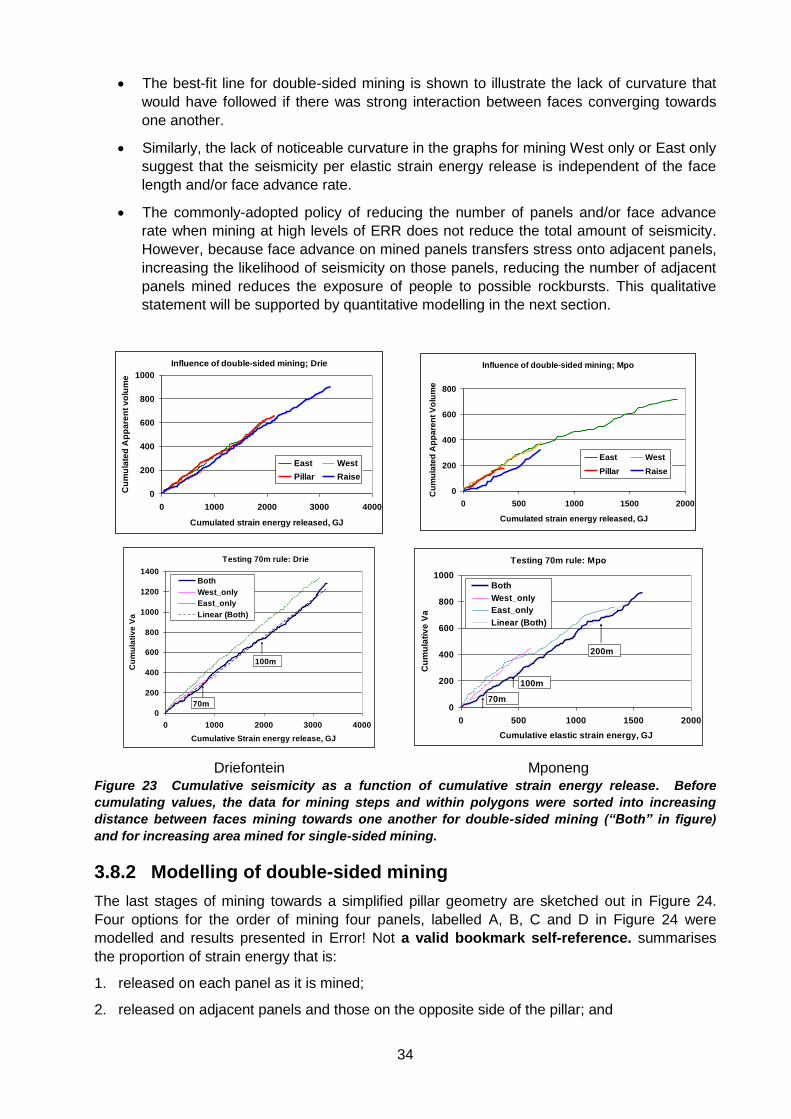
34
The best-fit line for double-sided mining is shown to illustrate the lack of curvature that
would have followed if there was strong interaction between faces converging towards
one another.
Similarly, the lack of noticeable curvature in the graphs for mining West only or East only
suggest that the seismicity per elastic strain energy release is independent of the face
length and/or face advance rate.
The commonly-adopted policy of reducing the number of panels and/or face advance
rate when mining at high levels of ERR does not reduce the total amount of seismicity.
However, because face advance on mined panels transfers stress onto adjacent panels,
increasing the likelihood of seismicity on those panels, reducing the number of adjacent
panels mined reduces the exposure of people to possible rockbursts. This qualitative
statement will be supported by quantitative modelling in the next section.
Influence of double-sided mining; Drie
0
200
400
600
800
1000
0 1000 2000 3000 4000
Cumulated strain energy released, GJ
Cu
mu
late
d A
pp
are
nt
vo
lum
e
East West
Pillar Raise
Influence of double-sided mining; Mpo
0
200
400
600
800
0 500 1000 1500 2000
Cumulated strain energy released, GJ
Cu
mu
late
d A
pp
are
nt
Vo
lum
e
East West
Pillar Raise
Testing 70m rule: Drie
0
200
400
600
800
1000
1200
1400
0 1000 2000 3000 4000
Cumulative Strain energy release, GJ
Cu
mu
lati
ve
Va
Both
West_only
East_only
Linear (Both)
70m
100m
Testing 70m rule: Mpo
0
200
400
600
800
1000
0 500 1000 1500 2000
Cumulative elastic strain energy, GJ
Cu
mu
lati
ve
Va
Both
West_only
East_only
Linear (Both)
70m
100m
200m
Driefontein Mponeng
Figure 23 Cumulative seismicity as a function of cumulative strain energy release. Before
cumulating values, the data for mining steps and within polygons were sorted into increasing
distance between faces mining towards one another for double-sided mining (“Both” in figure)
and for increasing area mined for single-sided mining.
3.8.2 Modelling of double-sided mining
The last stages of mining towards a simplified pillar geometry are sketched out in Figure 24.
Four options for the order of mining four panels, labelled A, B, C and D in Figure 24 were
modelled and results presented in Error! Not a valid bookmark self-reference. summarises
the proportion of strain energy that is:
1. released on each panel as it is mined;
2. released on adjacent panels and those on the opposite side of the pillar; and
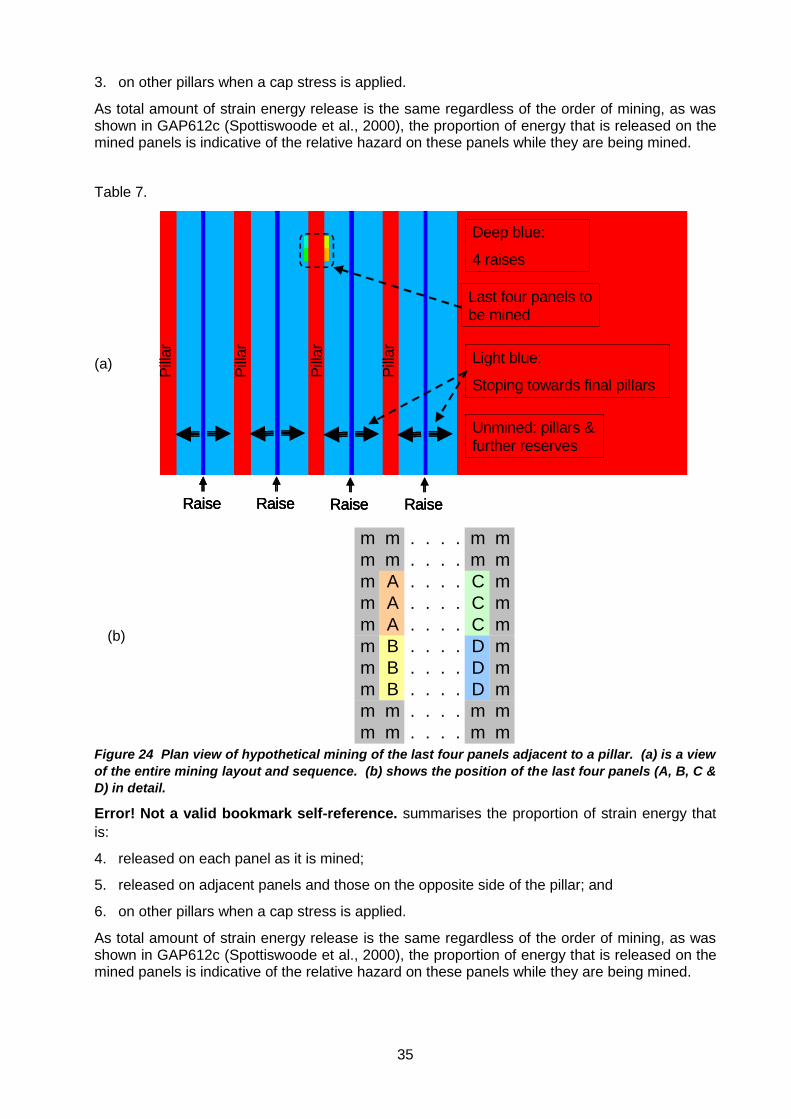
35
3. on other pillars when a cap stress is applied.
As total amount of strain energy release is the same regardless of the order of mining, as was shown in GAP612c (Spottiswoode et al., 2000), the proportion of energy that is released on the mined panels is indicative of the relative hazard on these panels while they are being mined.
Table 7.
(a)
Unmined: pillars & further reserves
Deep blue:
4 raises
Light blue:
Stoping towards final pillars
Pill
ar
Pill
ar
Pill
ar
Pill
ar
Last four panels to be mined
Raise Raise Raise Raise
Unmined: pillars & further reserves
Deep blue:
4 raises
Light blue:
Stoping towards final pillars
Pill
ar
Pill
ar
Pill
ar
Pill
ar
Last four panels to be mined
RaiseRaise RaiseRaise RaiseRaise RaiseRaise
(b)
m m . . . . m m
m m . . . . m m
m A . . . . C m
m A . . . . C m
m A . . . . C m
m B . . . . D m
m B . . . . D m
m B . . . . D m
m m . . . . m m
m m . . . . m m Figure 24 Plan view of hypothetical mining of the last four panels adjacent to a pillar. (a) is a view
of the entire mining layout and sequence. (b) shows the position of the last four panels (A, B, C &
D) in detail.
Error! Not a valid bookmark self-reference. summarises the proportion of strain energy that
is:
4. released on each panel as it is mined;
5. released on adjacent panels and those on the opposite side of the pillar; and
6. on other pillars when a cap stress is applied.
As total amount of strain energy release is the same regardless of the order of mining, as was shown in GAP612c (Spottiswoode et al., 2000), the proportion of energy that is released on the mined panels is indicative of the relative hazard on these panels while they are being mined.
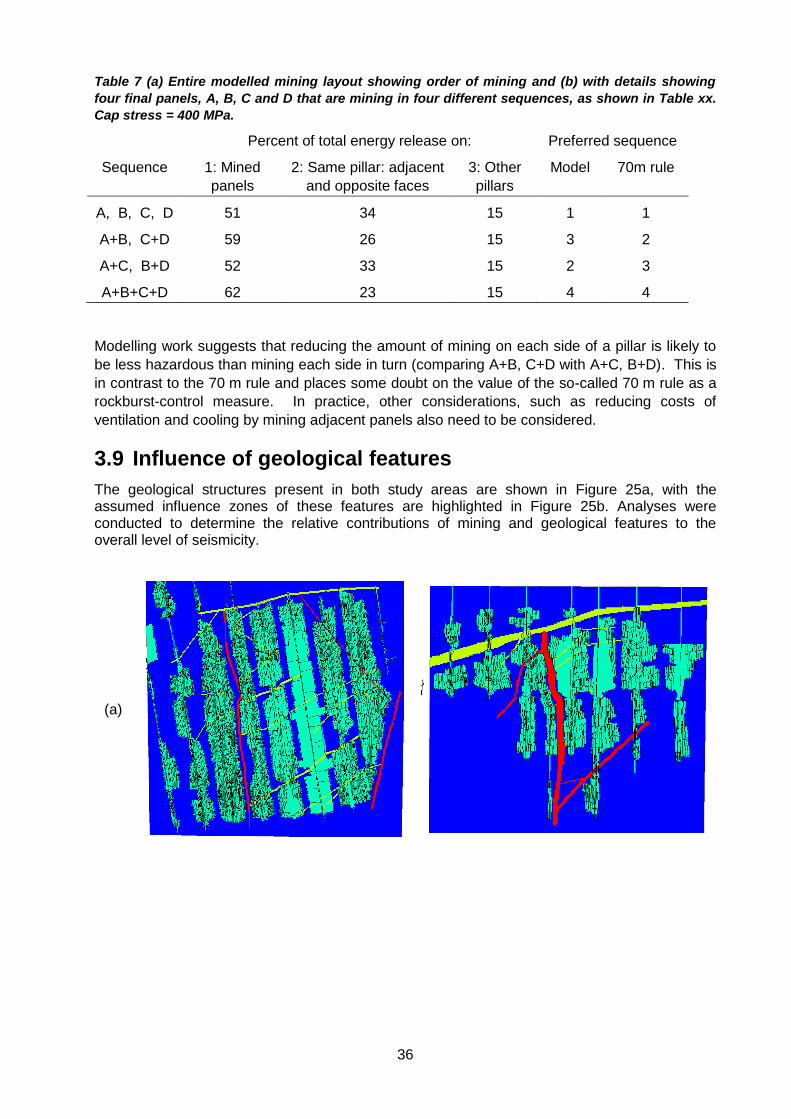
36
Table 7 (a) Entire modelled mining layout showing order of mining and (b) with details showing
four final panels, A, B, C and D that are mining in four different sequences, as shown in Table xx.
Cap stress = 400 MPa.
Percent of total energy release on: Preferred sequence
Sequence 1: Mined
panels
2: Same pillar: adjacent
and opposite faces
3: Other
pillars
Model 70m rule
A, B, C, D 51 34 15 1 1
A+B, C+D 59 26 15 3 2
A+C, B+D 52 33 15 2 3
A+B+C+D 62 23 15 4 4
Modelling work suggests that reducing the amount of mining on each side of a pillar is likely to
be less hazardous than mining each side in turn (comparing A+B, C+D with A+C, B+D). This is
in contrast to the 70 m rule and places some doubt on the value of the so-called 70 m rule as a
rockburst-control measure. In practice, other considerations, such as reducing costs of
ventilation and cooling by mining adjacent panels also need to be considered.
3.9 Influence of geological features
The geological structures present in both study areas are shown in Figure 25a, with the assumed influence zones of these features are highlighted in Figure 25b. Analyses were conducted to determine the relative contributions of mining and geological features to the overall level of seismicity.
(a)
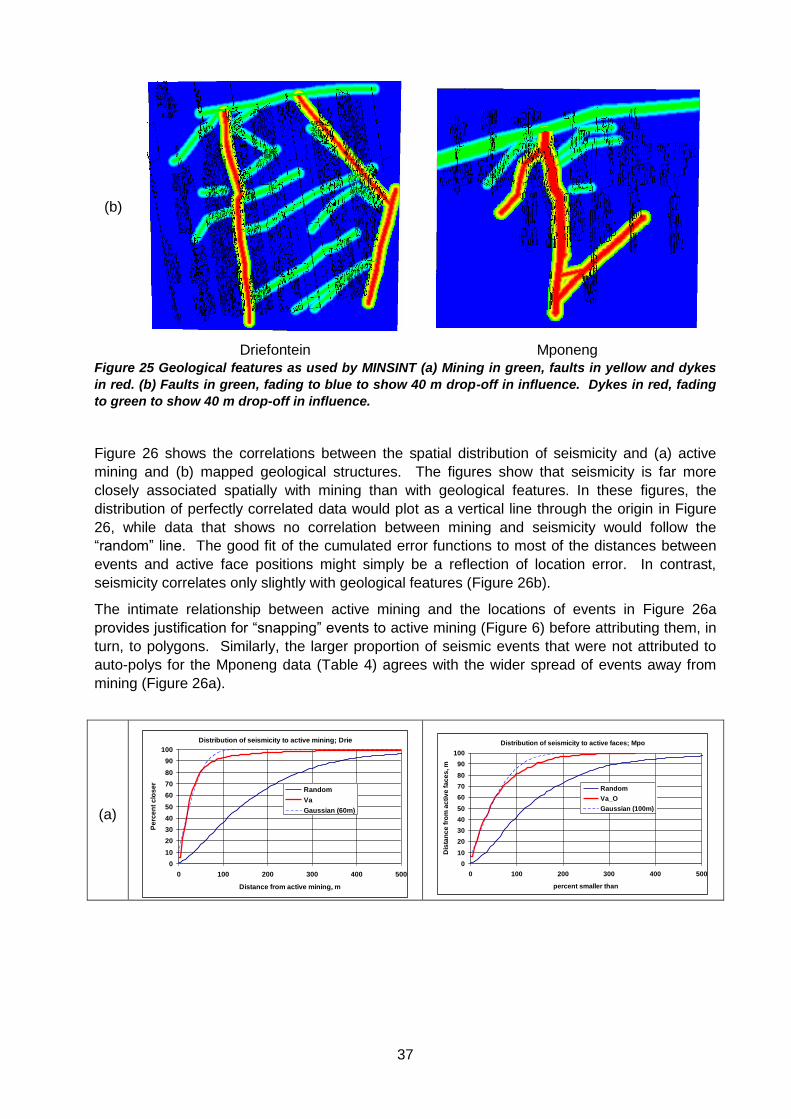
37
(b)
Driefontein Mponeng
Figure 25 Geological features as used by MINSINT (a) Mining in green, faults in yellow and dykes
in red. (b) Faults in green, fading to blue to show 40 m drop-off in influence. Dykes in red, fading
to green to show 40 m drop-off in influence.
Figure 26 shows the correlations between the spatial distribution of seismicity and (a) active
mining and (b) mapped geological structures. The figures show that seismicity is far more
closely associated spatially with mining than with geological features. In these figures, the
distribution of perfectly correlated data would plot as a vertical line through the origin in Figure
26, while data that shows no correlation between mining and seismicity would follow the
“random” line. The good fit of the cumulated error functions to most of the distances between
events and active face positions might simply be a reflection of location error. In contrast,
seismicity correlates only slightly with geological features (Figure 26b).
The intimate relationship between active mining and the locations of events in Figure 26a
provides justification for “snapping” events to active mining (Figure 6) before attributing them, in
turn, to polygons. Similarly, the larger proportion of seismic events that were not attributed to
auto-polys for the Mponeng data (Table 4) agrees with the wider spread of events away from
mining (Figure 26a).
(a)
Distribution of seismicity to active mining; Drie
0
10
20
30
40
50
60
70
80
90
100
0 100 200 300 400 500
Distance from active mining, m
Pe
rce
nt
clo
se
r
Random
Va
Gaussian (60m)
Distribution of seismicity to active faces; Mpo
0
10
20
30
40
50
60
70
80
90
100
0 100 200 300 400 500
percent smaller than
Dis
tan
ce
fro
m a
cti
ve
fa
ce
s, m
Random
Va_O
Gaussian (100m)
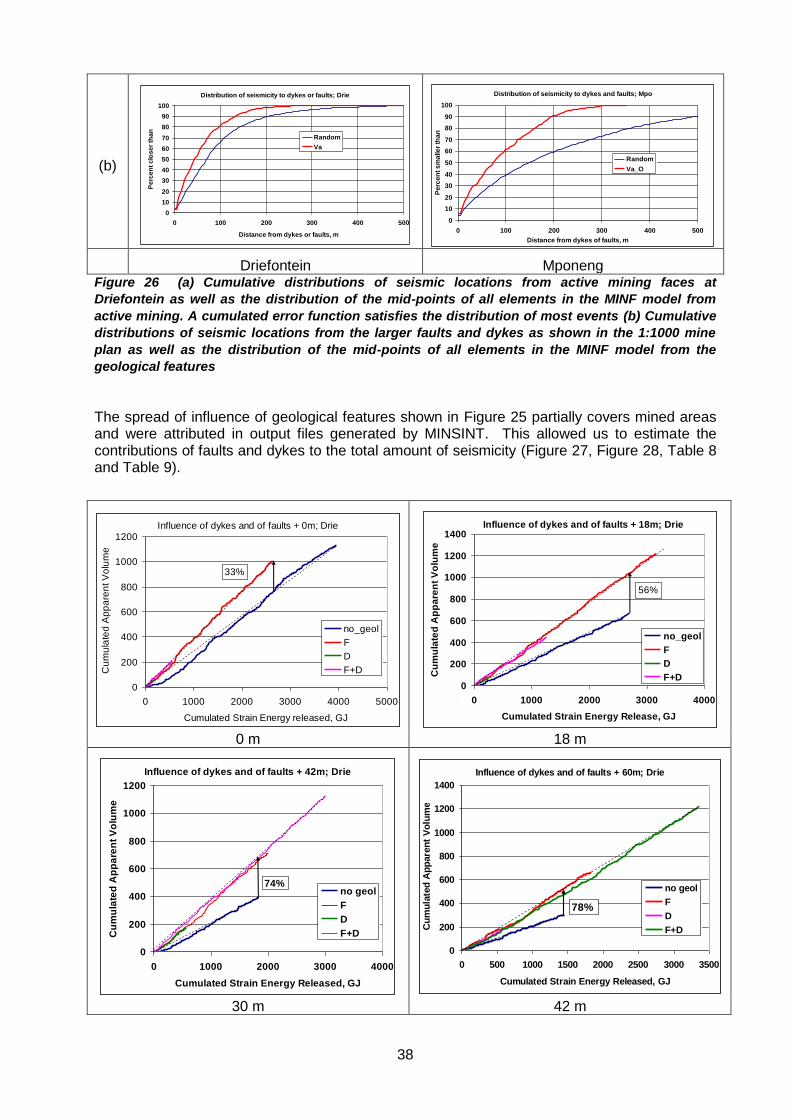
38
(b)
Distribution of seismicity to dykes or faults; Drie
0
10
20
30
40
50
60
70
80
90
100
0 100 200 300 400 500
Distance from dykes or faults, m
Pe
rce
nt
clo
se
r th
an
Random
Va
Distribution of seismicity to dykes and faults; Mpo
0
10
20
30
40
50
60
70
80
90
100
0 100 200 300 400 500
Distance from dykes of faults, m
Pe
rce
nt
sm
alle
r th
an
Random
Va_O
Driefontein Mponeng Figure 26 (a) Cumulative distributions of seismic locations from active mining faces at
Driefontein as well as the distribution of the mid-points of all elements in the MINF model from
active mining. A cumulated error function satisfies the distribution of most events (b) Cumulative
distributions of seismic locations from the larger faults and dykes as shown in the 1:1000 mine
plan as well as the distribution of the mid-points of all elements in the MINF model from the
geological features
The spread of influence of geological features shown in Figure 25 partially covers mined areas and were attributed in output files generated by MINSINT. This allowed us to estimate the contributions of faults and dykes to the total amount of seismicity (Figure 27, Figure 28, Table 8 and Table 9).
Influence of dykes and of faults + 0m; Drie
0
200
400
600
800
1000
1200
0 1000 2000 3000 4000 5000
Cumulated Strain Energy released, GJ
Cu
mu
late
d A
pp
are
nt V
olu
me
no_geol
F
D
F+D
33%
Influence of dykes and of faults + 18m; Drie
0
200
400
600
800
1000
1200
1400
0 1000 2000 3000 4000
Cumulated Strain Energy Release, GJ
Cu
mu
late
d A
pp
are
nt
Vo
lum
e
no_geol
F
D
F+D
56%
0 m 18 m
Influence of dykes and of faults + 42m; Drie
0
200
400
600
800
1000
1200
0 1000 2000 3000 4000
Cumulated Strain Energy Released, GJ
Cu
mu
late
d A
pp
are
nt
Vo
lum
e
no geol
F
D
F+D
74%
Influence of dykes and of faults + 60m; Drie
0
200
400
600
800
1000
1200
1400
0 500 1000 1500 2000 2500 3000 3500
Cumulated Strain Energy Released, GJ
Cu
mu
late
d A
pp
are
nt
Vo
lum
e
no geol
F
D
F+D
78%
30 m 42 m
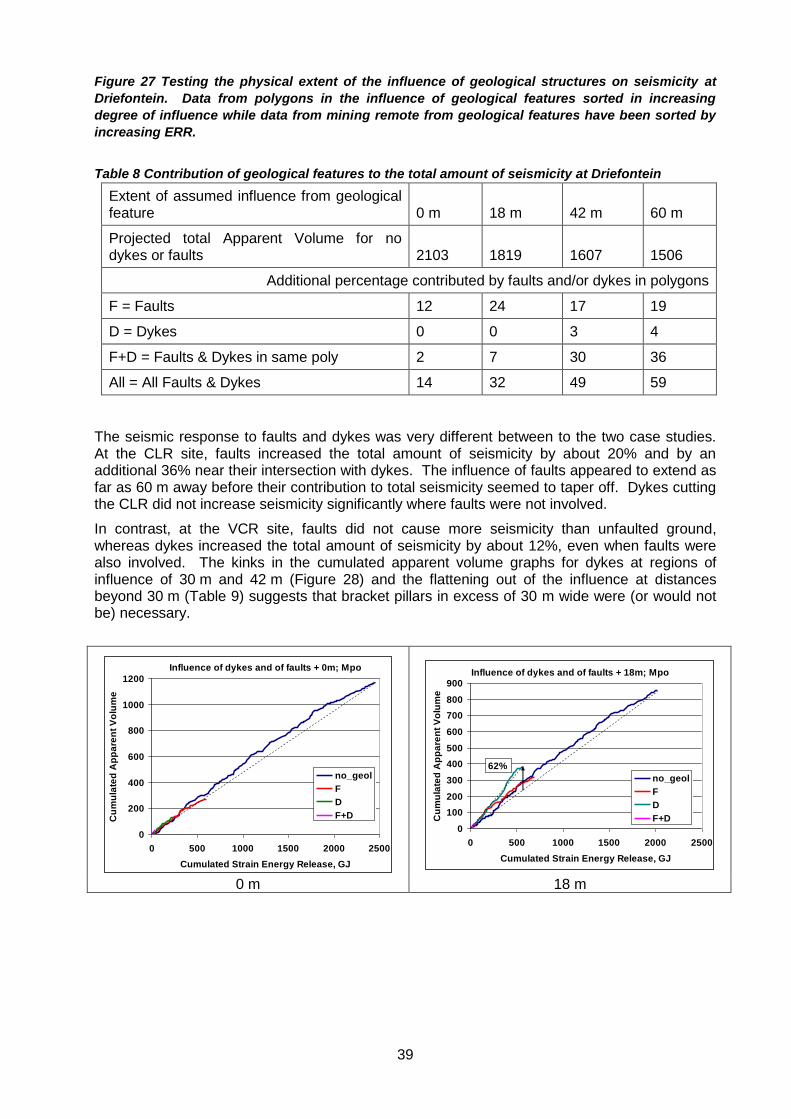
39
Figure 27 Testing the physical extent of the influence of geological structures on seismicity at
Driefontein. Data from polygons in the influence of geological features sorted in increasing
degree of influence while data from mining remote from geological features have been sorted by
increasing ERR.
Table 8 Contribution of geological features to the total amount of seismicity at Driefontein
Extent of assumed influence from geological feature 0 m 18 m 42 m 60 m
Projected total Apparent Volume for no dykes or faults 2103 1819 1607 1506
Additional percentage contributed by faults and/or dykes in polygons
F = Faults 12 24 17 19
D = Dykes 0 0 3 4
F+D = Faults & Dykes in same poly 2 7 30 36
All = All Faults & Dykes 14 32 49 59
The seismic response to faults and dykes was very different between to the two case studies. At the CLR site, faults increased the total amount of seismicity by about 20% and by an additional 36% near their intersection with dykes. The influence of faults appeared to extend as far as 60 m away before their contribution to total seismicity seemed to taper off. Dykes cutting the CLR did not increase seismicity significantly where faults were not involved.
In contrast, at the VCR site, faults did not cause more seismicity than unfaulted ground, whereas dykes increased the total amount of seismicity by about 12%, even when faults were also involved. The kinks in the cumulated apparent volume graphs for dykes at regions of influence of 30 m and 42 m (Figure 28) and the flattening out of the influence at distances beyond 30 m (Table 9) suggests that bracket pillars in excess of 30 m wide were (or would not be) necessary.
Influence of dykes and of faults + 0m; Mpo
0
200
400
600
800
1000
1200
0 500 1000 1500 2000 2500
Cumulated Strain Energy Release, GJ
Cu
mu
late
d A
pp
are
nt
Vo
lum
e
no_geol
F
D
F+D
Influence of dykes and of faults + 18m; Mpo
0
100
200
300
400
500
600
700
800
900
0 500 1000 1500 2000 2500
Cumulated Strain Energy Release, GJ
Cu
mu
late
d A
pp
are
nt
Vo
lum
e
no_geol
F
D
F+D
62%
0 m 18 m
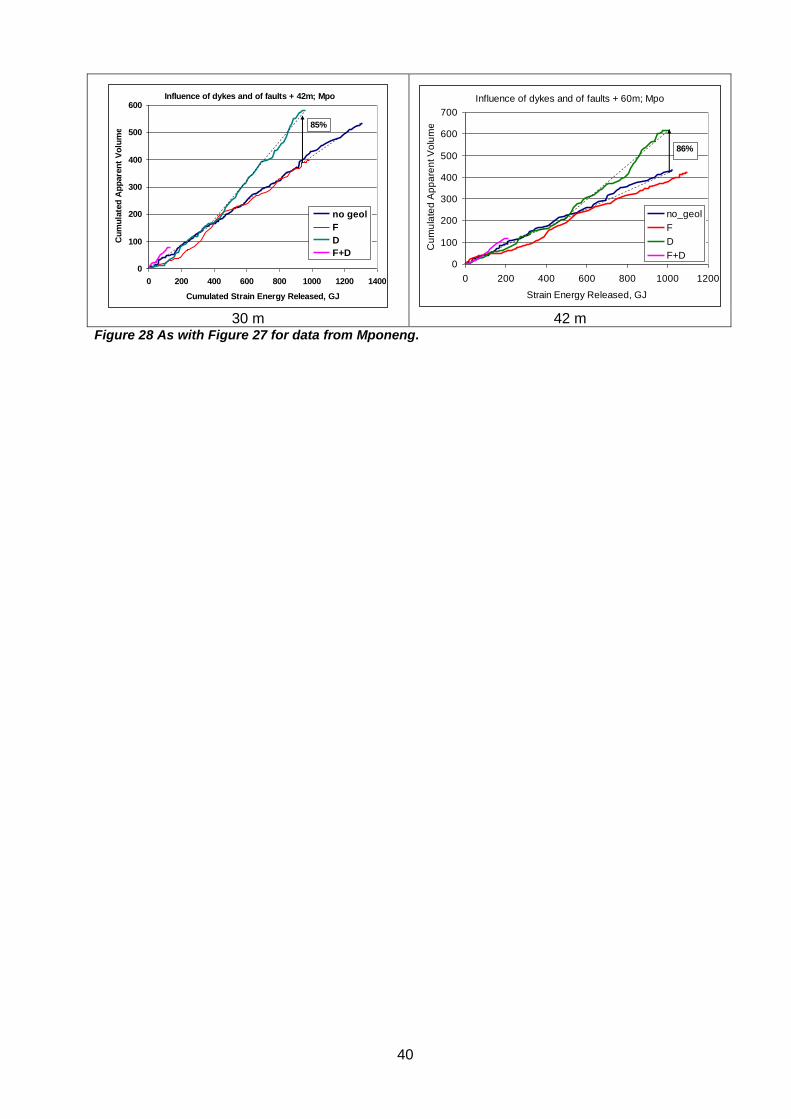
40
Influence of dykes and of faults + 42m; Mpo
0
100
200
300
400
500
600
0 200 400 600 800 1000 1200 1400
Cumulated Strain Energy Released, GJ
Cu
mu
late
d A
pp
are
nt
Vo
lum
e
no geol
F
D
F+D
85%
Influence of dykes and of faults + 60m; Mpo
0
100
200
300
400
500
600
700
0 200 400 600 800 1000 1200
Strain Energy Released, GJ
Cu
mu
late
d A
pp
are
nt V
olu
me
no_geol
F
D
F+D
86%
30 m 42 m
Figure 28 As with Figure 27 for data from Mponeng.
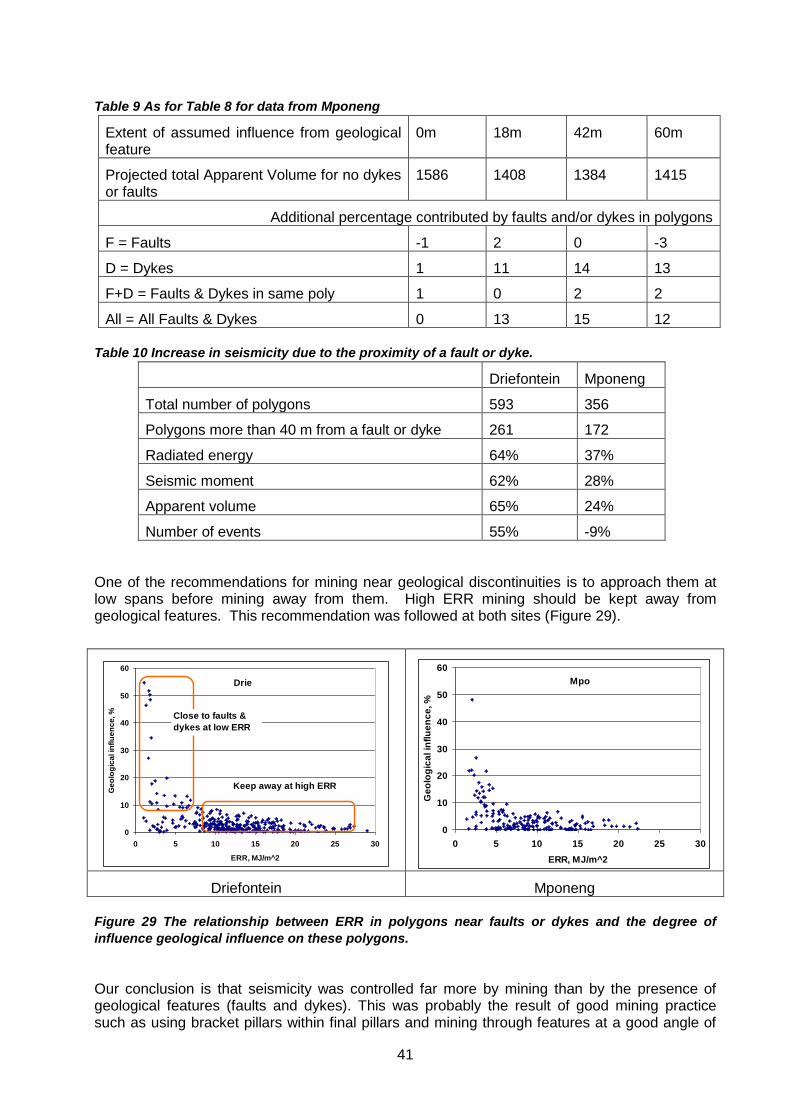
41
Table 9 As for Table 8 for data from Mponeng
Extent of assumed influence from geological feature
0m 18m 42m 60m
Projected total Apparent Volume for no dykes or faults
1586 1408 1384 1415
Additional percentage contributed by faults and/or dykes in polygons
F = Faults -1 2 0 -3
D = Dykes 1 11 14 13
F+D = Faults & Dykes in same poly 1 0 2 2
All = All Faults & Dykes 0 13 15 12
Table 10 Increase in seismicity due to the proximity of a fault or dyke.
Driefontein Mponeng
Total number of polygons 593 356
Polygons more than 40 m from a fault or dyke 261 172
Radiated energy 64% 37%
Seismic moment 62% 28%
Apparent volume 65% 24%
Number of events 55% -9%
One of the recommendations for mining near geological discontinuities is to approach them at low spans before mining away from them. High ERR mining should be kept away from geological features. This recommendation was followed at both sites (Figure 29).
Drie
0
10
20
30
40
50
60
0 5 10 15 20 25 30
ERR, MJ/m^2
Ge
olo
gic
al in
flu
en
ce
, % Close to faults &
dykes at low ERR
Keep away at high ERR
Mpo
0
10
20
30
40
50
60
0 5 10 15 20 25 30
ERR, MJ/m^2
Ge
olo
gic
al in
flu
en
ce
, %
Driefontein Mponeng
Figure 29 The relationship between ERR in polygons near faults or dykes and the degree of
influence geological influence on these polygons.
Our conclusion is that seismicity was controlled far more by mining than by the presence of geological features (faults and dykes). This was probably the result of good mining practice such as using bracket pillars within final pillars and mining through features at a good angle of
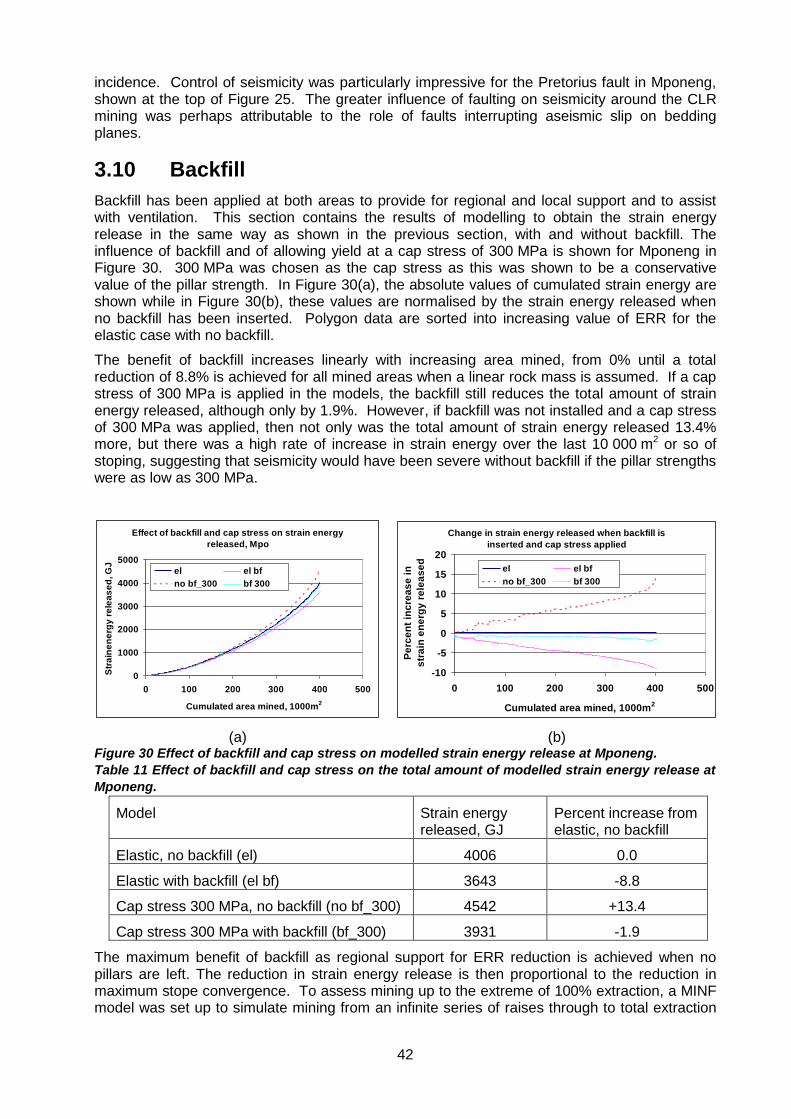
42
incidence. Control of seismicity was particularly impressive for the Pretorius fault in Mponeng, shown at the top of Figure 25. The greater influence of faulting on seismicity around the CLR mining was perhaps attributable to the role of faults interrupting aseismic slip on bedding planes.
3.10 Backfill
Backfill has been applied at both areas to provide for regional and local support and to assist with ventilation. This section contains the results of modelling to obtain the strain energy release in the same way as shown in the previous section, with and without backfill. The influence of backfill and of allowing yield at a cap stress of 300 MPa is shown for Mponeng in Figure 30. 300 MPa was chosen as the cap stress as this was shown to be a conservative value of the pillar strength. In Figure 30(a), the absolute values of cumulated strain energy are shown while in Figure 30(b), these values are normalised by the strain energy released when no backfill has been inserted. Polygon data are sorted into increasing value of ERR for the elastic case with no backfill.
The benefit of backfill increases linearly with increasing area mined, from 0% until a total reduction of 8.8% is achieved for all mined areas when a linear rock mass is assumed. If a cap stress of 300 MPa is applied in the models, the backfill still reduces the total amount of strain energy released, although only by 1.9%. However, if backfill was not installed and a cap stress of 300 MPa was applied, then not only was the total amount of strain energy released 13.4% more, but there was a high rate of increase in strain energy over the last 10 000 m2 or so of stoping, suggesting that seismicity would have been severe without backfill if the pillar strengths were as low as 300 MPa.
Effect of backfill and cap stress on strain energy
released, Mpo
0
1000
2000
3000
4000
5000
0 100 200 300 400 500
Cumulated area mined, 1000m2
Str
ain
en
erg
y r
ele
as
ed
, G
J
el el bf
no bf_300 bf 300
Change in strain energy released when backfill is
inserted and cap stress applied
-10
-5
0
5
10
15
20
0 100 200 300 400 500
Cumulated area mined, 1000m2
Pe
rce
nt
inc
rea
se
in
str
ain
en
erg
y r
ele
as
ed
el el bf
no bf_300 bf 300
(a) (b) Figure 30 Effect of backfill and cap stress on modelled strain energy release at Mponeng.
Table 11 Effect of backfill and cap stress on the total amount of modelled strain energy release at
Mponeng.
Model Strain energy released, GJ
Percent increase from elastic, no backfill
Elastic, no backfill (el) 4006 0.0
Elastic with backfill (el bf) 3643 -8.8
Cap stress 300 MPa, no backfill (no bf_300) 4542 +13.4
Cap stress 300 MPa with backfill (bf_300) 3931 -1.9
The maximum benefit of backfill as regional support for ERR reduction is achieved when no pillars are left. The reduction in strain energy release is then proportional to the reduction in maximum stope convergence. To assess mining up to the extreme of 100% extraction, a MINF model was set up to simulate mining from an infinite series of raises through to total extraction
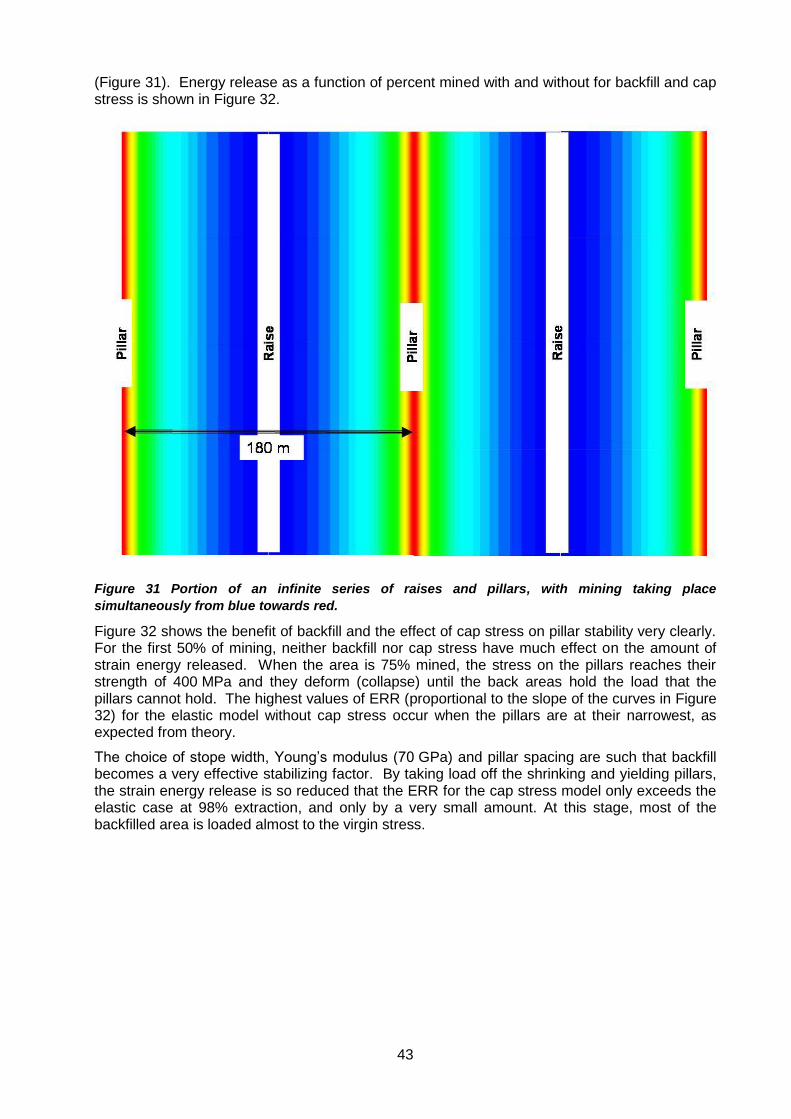
43
(Figure 31). Energy release as a function of percent mined with and without for backfill and cap stress is shown in Figure 32.
Figure 31 Portion of an infinite series of raises and pillars, with mining taking place
simultaneously from blue towards red.
Figure 32 shows the benefit of backfill and the effect of cap stress on pillar stability very clearly. For the first 50% of mining, neither backfill nor cap stress have much effect on the amount of strain energy released. When the area is 75% mined, the stress on the pillars reaches their strength of 400 MPa and they deform (collapse) until the back areas hold the load that the pillars cannot hold. The highest values of ERR (proportional to the slope of the curves in Figure 32) for the elastic model without cap stress occur when the pillars are at their narrowest, as expected from theory.
The choice of stope width, Young’s modulus (70 GPa) and pillar spacing are such that backfill becomes a very effective stabilizing factor. By taking load off the shrinking and yielding pillars, the strain energy release is so reduced that the ERR for the cap stress model only exceeds the elastic case at 98% extraction, and only by a very small amount. At this stage, most of the backfilled area is loaded almost to the virgin stress.
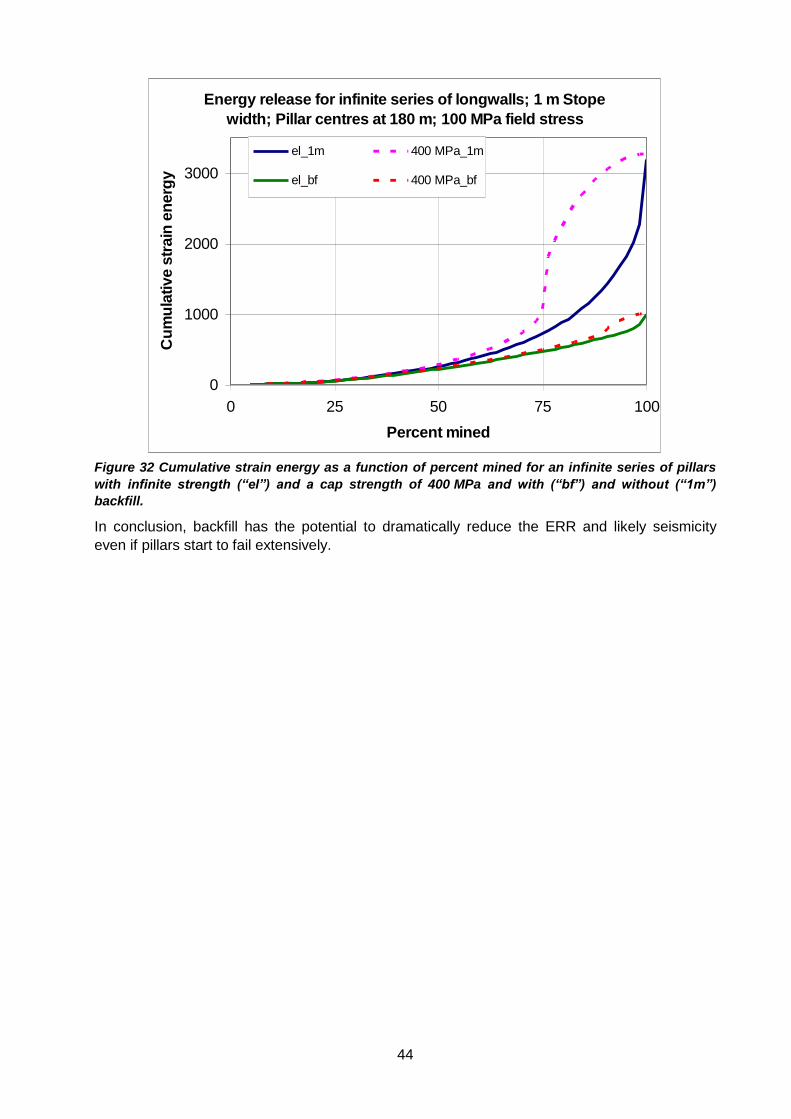
44
Energy release for infinite series of longwalls; 1 m Stope
width; Pillar centres at 180 m; 100 MPa field stress
0
1000
2000
3000
0 25 50 75 100
Percent mined
Cu
mu
lative s
train
en
erg
yel_1m 400 MPa_1m
el_bf 400 MPa_bf
Figure 32 Cumulative strain energy as a function of percent mined for an infinite series of pillars
with infinite strength (“el”) and a cap strength of 400 MPa and with (“bf”) and without (“1m”)
backfill.
In conclusion, backfill has the potential to dramatically reduce the ERR and likely seismicity
even if pillars start to fail extensively.
45
4 Instrumentation and analysis for determining the in
situ behaviour of RSDPs
Underground experiments were undertaken at both mines in the form of ground tilting measurements at Mponeng and strong ground motion recording at Driefontein. The seismic records were also examined in detail to determine source mechanisms, and hence to determine whether events were initiated on geological structures or in the face region.
These efforts all provided valuable insights into pillar behaviour, and in fact suggest a new model for understanding rockmass behaviour in deep level gold mining. However, in terms of satisfying the project brief, these outputs only partially answered the questions relating to RSDP behaviour and performance. This section highlights how the measurement and analysis tasks did address the primary outputs, and describes the additional insights that were gained in the performance of this work.
4.1 Interpretation of tilt data
Tiltmeters, strain-change meters and a reference trigger geophone were installed in the 113 Level Haulage West at Mponeng. The objective of this work was specifically to assist in extracting insights into the loads carried by the dip pillars and their behaviour during their formation.
Two types of tilt were recognised:
Coseismic tilt defined as the tilt during the seismic events or blasting, and
Aseismic tilt defined as the amount of tilt between seismic events.
The instrument was installed 89 m in the footwall, ahead of an active mining face. The tilt data were recorded by a triggered seismic recording system. The triggered data showed velocity and tilt data that correlated well in time, allowing for separation of the tilt data into coseismic and aseismic tilting.
Tilt recordings showed that the aseismic tilt was significantly less than the coseismic tilt. It was also observed that coseismic tilt jumps occurred in either direction, and were nearly always reversed. That is, the total amount of tilt in opposite directions was approximately equal, resulting in zero tilt after a set of events.
A possible mechanism for this behaviour is presented in Error! Reference source not found.. Four suggested sources of tilt are shown, marked as A to D, with A, B and C being shear slip ahead of the face and D being stope closure associated with face advance. All of these sources result in stope closure. Sources A and C are expected to result in counter-clockwise rotation or tilt at the site marked in the footwall, whereas sources B and D are expected to result in clockwise rotation or tilt. If source A or C follows source B or D, or vice versa, then opposite tilting would occur.
The question remains as to why in-stope closure consists of a greater proportion of aseismic (i.e. steady state) closure than is the case for tilt measurements made off-reef? Our preliminary interpretation is that the in-stope closure is dominated by deformations in the low-stress, fractured region around the mined-out area where very little seismicity takes place. Due to the low stresses acting in this region, these deformations have limited influence on the generally elastic rock mass between the stopes. The tiltmeter site is located 87 m in the footwall and ahead of the face. Therefore it is responding to the stress changes in the highly stressed region.
We suggest that seismicity forms the major reliever of stress in this region through failure of previously unfractured rock with simultaneous remobilization of the fracture zone. Slow, time-dependent deformations of the fracture zone have a lesser influence on regional deformations, as reflected by aseismic tilt measurements.
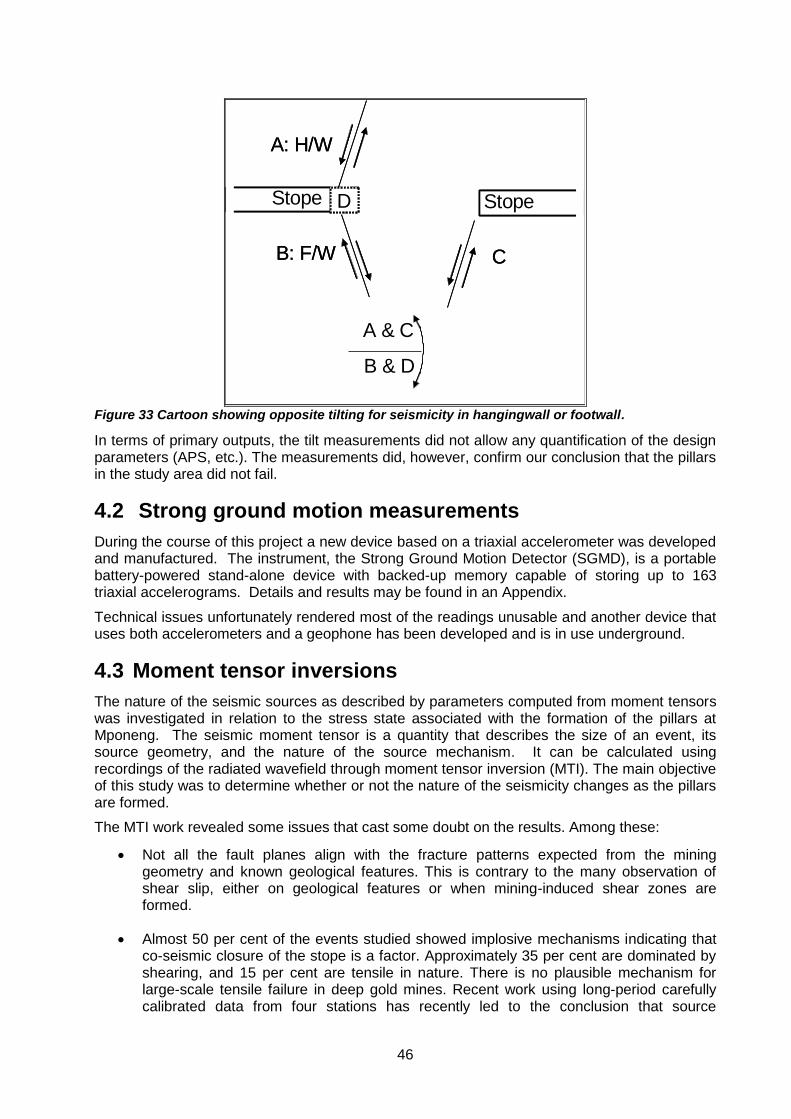
46
A: H/W
B: F/W
A & C
B & D
Stope D
C
Stope
A: H/W
B: F/W
A & C
B & D
Stope D
C
Stope
Figure 33 Cartoon showing opposite tilting for seismicity in hangingwall or footwall.
In terms of primary outputs, the tilt measurements did not allow any quantification of the design parameters (APS, etc.). The measurements did, however, confirm our conclusion that the pillars in the study area did not fail.
4.2 Strong ground motion measurements
During the course of this project a new device based on a triaxial accelerometer was developed and manufactured. The instrument, the Strong Ground Motion Detector (SGMD), is a portable battery-powered stand-alone device with backed-up memory capable of storing up to 163 triaxial accelerograms. Details and results may be found in an Appendix.
Technical issues unfortunately rendered most of the readings unusable and another device that uses both accelerometers and a geophone has been developed and is in use underground.
4.3 Moment tensor inversions
The nature of the seismic sources as described by parameters computed from moment tensors was investigated in relation to the stress state associated with the formation of the pillars at Mponeng. The seismic moment tensor is a quantity that describes the size of an event, its source geometry, and the nature of the source mechanism. It can be calculated using recordings of the radiated wavefield through moment tensor inversion (MTI). The main objective of this study was to determine whether or not the nature of the seismicity changes as the pillars are formed.
The MTI work revealed some issues that cast some doubt on the results. Among these:
Not all the fault planes align with the fracture patterns expected from the mining geometry and known geological features. This is contrary to the many observation of shear slip, either on geological features or when mining-induced shear zones are formed.
Almost 50 per cent of the events studied showed implosive mechanisms indicating that co-seismic closure of the stope is a factor. Approximately 35 per cent are dominated by shearing, and 15 per cent are tensile in nature. There is no plausible mechanism for large-scale tensile failure in deep gold mines. Recent work using long-period carefully calibrated data from four stations has recently led to the conclusion that source
47
mechanisms are predominantly shear with up to 60% implosive volume change (Boettcher et al, 2008).
Expected waveforms should have the appearance of a single uni-directional pulse, with the P-wave first motions in the direction of the line from the source to the geophone site. The success of MTI relies strongly on this principle holding true. However, it was found that this was not the case for many of the recorded seismograms.
Seismic sources radiate signals through a homogeneous rock mass such that approximately one half of the values of scalar moments estimated from P waves and from S waves recorded at different geophones should, on average, be greater than one half of the maximum value measured at all the geophones. This was only found to be the case for a minority of events recorded by 10 stations or more, suggesting that amplitudes are more widely spread than should be the case for random distributions over the radiation pattern. A very likely cause of this skewed spread of values could be focussing and de-focussing of ray paths.
Although these concerns greatly reduce our confidence in the MTIs performed in this work, it should be noted that this does not affect the confidence we have in other recorded seismic parameters. The values of event “size”, such as seismic moment and seismic energy, are not as sensitive to these problems as is the case for moment tensor inversions. In addition, listed values of seismic moment and energy are mostly used in a relative sense in this study. We therefore suggest that the bulk of the analysis is not significantly affected by problems that bedevilled the moment tensor work.
It was also found that some of the geophones were misaligned by up to 18°. It may be that this did not significantly affect interpretation of the waveforms, but the disjoint between waveform components suggests that we are either dealing with a misalignment problem, or that the sub-horizontal layering and stoping lead to ray paths bending more in a one direction than the other.
It has not been possible to characterise source mechanisms in the study area with any confidence. Clearly, the result from MTI inversion of waveforms recorded by the relatively insensitive mine networks must be carefully evaluated and treated with suspicion if they do not provide a consistent and mechanistically viable picture of failure mechanisms.
48
5 Conclusions
Four areas of work were undertaken for this project: an integrated analysis of seismicity and numerical modelling of mine deformations; moment tensor solutions; measurement and interpretation of tilt recordings; and strong ground studies. The seismic-modelling integration provided most of the results to meet the requirements of the Primary Outputs.
At the CLR study area, the layout was designed to limit values of (strain) Energy Release Rate (ERR) to 30 MJ/m2 or less, and to a maximum Average Pillar Stress (APS) of 400 MPa. The designed stope spans and pillar sizes for the VCR mining were planned to an average ERR of 19 MJ/m2 and an APS of 596 MPa at the maximum depth. These values would only be reached after very extensive mining with pillars kept to the minimum size. As mining was not maximised and regional support was also provided by backfill, these values were not reached in the two study areas.
90% of faces at the last stage of mining studied had ERR values of less than 17.9 MJ/m2 on the CLR and 15.7 MJ/m2 on the VCR. Corresponding numbers for APS were 330 MPa and 167 MPa, respectively. All these values were well below the designed values.
Perhaps the main result of this study was that ERR was shown to be a robust measure of the amount of seismicity per area mined under a range of conditions and therefore a predictable amount of additional seismicity would occur under higher ERR conditions. Seismicity per strain energy release did not vary according to the order of mining, even for double-sided mining, and for panels approaching one another when mining towards the same pillar. Delaying mining away from the shaft until mining towards the shaft was does not reduce the average ERR and did not reduce seismicity significantly. In other words, three of the sequencing rules that have been applied to SGM appeared not to have been needed, or at least not so strictly applied, to control seismicity. A modelling exercise showed that adjacent panels interact more than panels on either side of a pillar. Another rule that called for mining first towards geological features that lie between raises does reduce seismicity. The rule related to managing inter-panel lead-lags was not studied in this project, having been the subject of anther recent study.
ERR as calculated in this project is the strain energy released per area mined between mining steps. It is essentially the same as the “classic” ERR that is calculated by most current numerical codes, but has the benefit of being directly related to strain energy release over the full history of mining.
One of the big concerns about using regional support in the form of pillars is that these pillars may fail. We did not find any evidence for pillar failure, either from the seismic data or from studying ground tilting 90 m below reef.
The fact that seismicity per area mined was proportional to ERR right up to the highest values of ERR suggests that no “additional” seismic energy was released, as might be expected if pillars were failing. Most of the strain energy release modelling was based on mining within an elastic rock mass. Cap stress values were also introduced to simulate the additional strain energy release that might have occurred had pillars yielded. Extreme deformations were only encountered in the models at a cap stress of 300 MPa or less. The pillar strengths are therefore thought to be in excess of 300 MPa, and may be much greater. It was shown that backfill would play a more useful role in controlling convergence if pillars do fail than they do in the case of unfailed pillars.
Ground tilting was measured partly to determine whether any accelerated quasi-static (slow) ground deformations might follow seismic events, as might be expected for a yielding pillar. No significant changes in tilt were observed after seismic events, providing further support for our contention that pillars are not showing signs of failure.
Pillar stability is partly attributable to the pillars not containing faults with throws of the same order as the pillar width. As faults with throws greater than 30 m are rare in the Carletonville mining region, RSDP mining could be applied in this entire area.
49
Seismicity was much more strongly correlated with active stoping than with geological features marked on the 1:1000 plans, particularly for the CLR mining. All interpretations are likely to be better if the accuracy of seismic locations is improved.
The seismic response to faults and dykes was very different between to the two case studies. At the CLR site, faults increased the total amount of seismicity by about 20% and by an additional 36% near their intersection with dykes. Dykes did not increase seismicity significantly. In contrast, at the VCR site, faults did not cause more seismicity than unfaulted ground whereas dykes increased the total amount of seismicity by about 12%. Bracket pillars in excess of 30 m wide did not seem to be necessary.
Unfortunately, attempts at characterizing source mechanisms by moment tensor inversion were unsuccessful due to various problems including the orientations and polarities of geophones of the mine network.
Analysis methodologies were developed and written into software that can be applied to other mine layouts. These methodologies include a new model for face stiffness and new methods of interpreting seismicity, both in terms of geological features and variations in monthly hazard. The automatic grouping of seismicity and mining into polygons (auto-polys) has proved to be a much more useful analysis methodology than the traditional fixed polygon approach. These methods can be applied to any other deep-level mining to judge its performance at controlling seismicity, for example, mining portions of existing regional support pillars.
The difficulty of obtaining a digital map containing accurate sequencing is currently a major barrier to application of this or any software or analysis where the history of mining must be known. At present, it appears that manual digitizing of mine plans is still needed in most, if not all, cases.
Preliminary interpretation of ground tilting and the spatial distribution of aftershocks and back-area events hints at providing new insights into time-dependent behaviour of the rock mass. It is possible that all time-dependent behaviour takes place in the fracture zone around the stopes.
50
6 References
Adams G. R., Jager A. J. and Roering C. (1981) Investigation of rock fracture around deep-level gold mine stopes. Proc. 22nd U.S.Symp. Rock Mech., pp. 213-218.
Andersen, T.L. (1994). Fracture Mechanics: Fundamentals and Applications, CRC Publishers.
Andersen, L.M. (2001). A relative moment tensor inversion technique applied to seismicity induced by mining. Ph.D Thesis. University of the Witswatersrand, Johannesburg, 204 pp
Boettcher, M.S., McGarr, A., Durrheim, R.J., Spottiswoode, S., Milev, A., Linzer, L., Johnston, M.J.S. and Sell, R.W. (2008) A broadband, wide dynamic range investigation of earthquakes in deep South African gold mines, abstract, Seismological Research Letters Volume 79, No. 2 on page 311.
Cook, N.G.W, Hoek, E., Pretorius, J.P.G, Ortlepp, W.D. and Salamon, M.D.G. (1966) Rock Mechanics applied to rockbursts. J. S. Afr. Inst. Min. Metall., pp 435-714.
Dahm, T. (1996). Relative moment tensor inversion based on ray theory: theory and results, Geophys. J. Int. 124, 245–257.
Feignier, B. and Young, R.P. (1992). Moment tensor inversion of induced microseismic events: Evidence of nonshear failures in the –4 < M < –2 moment magnitude range, Geophys. Res. Lett. 19, 1503 – 1506.
Felzer, K. R., and Brodsky, E. E., (2006) Decay of aftershock density with distance indicates triggering by dynamic stresses, Nature, Vol 441, no. 8, Jun 2006, pp. 735 - 738.
Franklin, J.A., Bennet, A.G., Silveira, J.F.A., Egger, P., Penman, A.D.M., Sherwood, D.E., Dunnicliff, C.J., Green, G.E., Tesch, W.J and Wilson, S.D., 1977. Suggested Methods for monitoring rock movements using Inclinometers and tiltmeters. Rock Mechanics, 10, 12: 185-199.
Goldbach, O.D., Rangasamy, T., Linzer, L.M., Kataka, M.O., Spottiswoode, S.M. and du Pisani, P. (2006). SIM 04 03 03 Final Project Report: Lead-lag design criteria and seismicity patterns. 395pp.
Goldbach, O.D., T. Rangasamy, L.M. Linzer, M.O. Kataka and S.M. Spottiswoode (2008), Optimum lead-lag distances in South African gold mines, The 6th International Symposium on Ground Support in Mining and Civil Engineering Construction, Cape Town, April 2008.
Hanks, T.C. 1982. fmax. Bull. Seism. Soc. Am., v72, pp1867-1879.
Handley M.F., De Lange J.A.J., Essrich F. and Banning J.A. (2000). A review of Sequential Grid Mining method employed at Elandsrand Gold Mine. J.S. Afr. Inst. Min. Metall., Vol. 100. no.3, pp. 157-168.
Hofmann, G.F. and Murphy, S.K. (2007) Coulomb Stress Triggering for seismic hazard assessment of geological structures in underground mines, SANIRE Symposium and also 2007 - 1st Canada-U.S. Rock Mechanics Symposium (Vancouver)
Jager, A.J. and Ryder J.A. (1999) A Handbook on Rock Engineering Practice for tabular hardrock mines. SIMRAC, Johannesburg.
Jost, M.L. and Herrmann, R.B. (1989). A student’s guide and review of moment tensors, Seism. Res. Lett. 60, 37–57.
Kgarume, T.E., Spottiswoode, S.M. and Durrheim, R.J. (2008) Statistical properties of mine tremor aftershocks, submitted to PAGEOPH SPECIAL ISSUE: INDUCED SEISMICITY.
Klokow, J.W., Riemer, K.L. and Ferreira, R.I. (2003) An initial assessment of the closely spaced dip –pillar mining layout as practiced at Driefontein Gold Mine. ISRM 2003- Technology roadmap for rock mechanics, S. A. Inst. Min. Metall., pp655-633.
51
Lenhardt, W.A. and Hagan, T.O. (1990). Observations and possible mechanisms of pillar associated seismicity at great depth. Technical challenges in deep mining. Johannesburg, South African Institute of Mining and Metallurgy, pp1183-1184.
Malan, D.F. 1999. Time-dependent behaviour of deep level tabular excavations in hard rock. Rock Mech. Rock Engng., vol. 32, no. 2, pp. 123-155.
McGarr, A. and Green, R.W.E., 1978. Microtremor sequences and tilting in a deep mine., Bulletin of the Seismological society of America, 68, 6: 1679-1697.
McGarr, A. and Wiebols, G.A. (1977) Influence of Mine Geometry and closure volume on Seismicity in deep level mine. Int. J. Rock Mech. Min. Sci., & Geomech. Abstr., vol. 14, pp 139-145.
McGill, R.B., 2005. Strategies to manage seismicity in a deep VCR environment on Mponeng, 6th Intl Symposium on Rockbursts and Seismicity in mines, Perth, Australia: 419-424.
McKinnon, S.D. and de la Barra, I.G. (2003) Stress field analysis at the El Teniente Mine: evidence for N–S compression in the modern Andes Journal of Structural Geology 25 2125–2139.
Milev, A.M., Spottiswoode S.M. and Stewart R.D., 1999. Dynamic response of the rock surrounding deep level mining excavations. Proc. 9th ISRM, G. Vonille & P. Berset (Editors), Paris’99: 1109-1114.
Milev, A.M. and Spottiswoode, S.M., 2005. Strong motion and site response in deep South African mines. Journal of South African Institute of Mining and Metallurgy. 105: 515-524.
Napier, J.A.L. (1991) Energy changes in a rock mass containing multiple discontinuities. J. S. Afr. Inst. Min. Metall., Vo. 91, pp 145-157.
Pretorius, M. (2008) Pers. comm.
Ryder J. A and Jager A. J. editors (2002): A textbook on Rock Mechanics for tabular hard rock mines. 1st Edition, SIMRAC: Johannesburg.
Share, P-E. (2007) Dynamic and Quasi-static Deformations of the Rocks Derived from Underground Seismic and Tilt Data, Geophysics Honours Project, University of Witwatersrand.
Sileny, J. and Milev A.M. (2006). Source Mechanism of Mining Induced Seismic Events - Resolution of Double Couple and Non Double Couple Models. Tectonophysics, 2008, in print.
Spottiswoode, S.M. (1988) Total seismicity, and the application of ESS analysis to mine layouts. J. S. Afr. Inst. Min. Metall. 88 : 109-116.
Spottiswoode, S.M. 1993. Seismic attenuation in deep-level mines, 3rd Intl Symposium on Rockbursts and Seismicity in mines, Balkema, pp409-414.
Spottiswoode, S.M. (1997). Energy Release rate with limits to on-reef stress Proc. 1st Southern African Rock Engineering Symposium, Ed. RG Gurtunca and TO Hagan, SANGORM, pp252-258, 1997.
Spottiswoode, S.M., Napier, J.A.L.N., Milev, A. and Vieira, F.M.V. (2000) The Relationship between ERR and seismic energy release for different geotechnical areas, Final Project Report, GAP612c, SIMRAC.
Spottiswoode, S.M. and Milev A.M. (2002). A methodology and computer program for applying improved, inelastic ERR for the design of mine layouts on planar reefs, Final Project Report, GAP 722, SIMRAC.
Spottiswoode, S.M., Napier, J.A.L. and Kataka, M. (2003). Seismology in the design of mine layouts. 30th International Conference of Safety in Mines Research Institutes, S. A. Inst. Min. Metall., pp187-199.

52
Spottiswoode, S.M. (2004a). A seismic and modelling analysis of dip-pillar mining. Submitted to: 2nd International Seminar on Deep and High Stress Mining, South African Institute of Mining and Metallurgy, 2004.
Spottiswoode, S.M. (2004b). Integration of seismicity and modelling made simple, SANIRE 2004 – The Miner’s Guide through the Earth’s Crust, South African National Institute of Rock Engineering, pp 63-69.
Spottiswoode, S.M. (2005). Mine Layout Design and Medium-term Prediction of Seismicity, 5th Intl Symposium on Rockbursts and Seismicity in mines, Perth, Australia, pp 211-218.
Spottiswoode, S.M. & Linzer, L.M. (2005). A Hybrid Location Methodology, Journal of the South African Institute for Mining & Metallurgy., pp 417-426.
Spottiswoode S.M. and Milev A.M. (2006). A study of mine stability using records of ground tilting, paper ARMA/USRMS 06-1168, the 41st U.S. Symposium on Rock Mechanics Golden, Colorado, June 17-21, 2006.
Spottiswoode, S.M., Linzer, L.M. and Majiet, S. Energy and stiffness of mine models and seismicity, Accepted by 1st Southern Hemisphere International Rock Mechanics Symposium, Perth, Australian Centre of Geomechanics, 16-19 September 2008.
van Antwerpen, H.E.F. and Spengler, M.G. (1982) The effect of mining-related seismicity on excavations at East Rand Propriety Mines, Limited. In 1st Intl. Symposium on Rockbursts and Seismicity in Mines, Johannesburg, S. Afr. Inst. of Min. Metall : pp. 29-37.
van Aswegen, G., Malan, F. and Lachenicht, R., The effect of mining rate on seismicity, Final
Project Report 5.1.3 for Deepmine 5.1.3, DM513-REP-001-00.
Van Aswegen, G. (2005) Routine seismic hazard assessment in South African mines. 6th Intl
Symposium on Rockbursts and Seismicity in mines, Perth, Australia, pp. 437-444.
van der Merwe, J.N. (2006) Beyond Coalbrook: what did we really learn?, Journal of South African Institute of Mining and Metallurgy. 106, 857.
Young, B. (2005). Comparison of seismic location methods in a South African gold mine, SAGA conference, Cape Town, September 2005. Also presented in his BSC (Hons) final project in 2005.