Embed Size (px)
Citation preview

Journal of International Development
J. Int. Dev. 22, 1134–1145 (2010)
Published online in Wiley Online Library
(wileyonlinelibrary.com) DOI: 10.1002/jid.1751
SAFETY NETS OR INVESTMENT IN THEFUTURE: DOES FOOD AID HAVE
ANY LONG-TERM IMPACT ONCHILDREN’S GROWTH?
CATHERINE PORTER*
Department of Economics, University of Oxford, Oxford, UK
Abstract: This article investigates child nutrition in rural Ethiopia, examining anthropo-
metric information collected on children aged below 5 years in 1995, and again almost
10 years later for the now young adults in 2004. It finds that children who were malnourished in
their early years are far more likely to be stunted 10 years later on. The article examines the
role that food aid plays in mitigating the impact of adverse events and finds that it does have a
lasting effect and could have even more impact if well targeted and delivered. The findings
underline the importance of investing in early childhood nutrition and tailoring public
programmes to meet the needs of children. Copyright # 2010 John Wiley & Sons, Ltd.
Keywords: Ethiopia; nutrition; children
1 INTRODUCTION
Risk, unexpected adverse events, seasonal deprivation and crises are an everyday fact of
life for many poor households, not least in developing countries. Poor men, women and
children have found many creative solutions to protect themselves and their households
from the adverse consequences of such events and to maintain their food consumption
above subsistence levels as much as possible. Poorer people tend to be exposed to more
risk, and also have fewer resources to deal with adverse events when they materialise.
Many developing countries do not have formal social protection systems that are part of
the social contract. Rather, when widespread crises occur, ad hoc and often external
interventions (government or external donors or a combination of both) are needed in order
to provide short-term support to the hungry. In addition there are households or individuals
*Correspondence to: Catherine Porter, Department of Economics, University of Oxford, Manor Road, OxfordOX1 3UQ, UK. E-mail: [email protected]
Copyright # 2010 John Wiley & Sons, Ltd.

Safety nets or Investment in the Future 1135
who are in a situation of chronic poverty, due to low assets, social exclusion, ill health or
disability, and who also rely on what informal or public support is available to them.
In Ethiopia, this is certainly the case, and in 2009 the Government of Ethiopia estimated
that 6.2 million people were in need of food aid.1 Very young children are particularly
vulnerable to the consequences of malnutrition, showing higher mortality than older children
and adults. Images of children are frequently used to garner support for emergency food-aid
programmes in rich donor countries, and yet relatively little is known about the longer-term
impacts of emergency aid on children due to the lack of high-quality data in developing
countries, especially those that are vulnerable to food crises and famines. Specifically, there
are very few surveys that follow the same children over time, in order to assess such impacts.
This study examines the nutritional status of children born in Ethiopia the early 1990s,
followed through 10 years up to 2004. We examine the persistence of stunting throughout
childhood, and also the impacts of food aid distribution in the medium term. The sample
also offers a comparison group for the children who are the first to be covered by the
Productive Safety Net Programme (PSNP), a more comprehensive national safety net that
was introduced in 2004.
The focus of our study is those who were in early childhood (defined as up to the age of
5 years) at the start of the survey period. We wished to examine over as long a period as
possible how the physical development of children exposed to certain adverse events in
early childhood progressed, comparing children from households who are all poor relative
to international standards, but with a degree of inequality even within the sample. We
compare more and less poor children, those who had better or worse nutritional status and
members of households that did and did not receive food aid. We do not have information
on food consumption of each individual in any given household, so we cannot directly
observe nutritional intakes. Instead, we infer nutritional outcomes by observing children’s
anthropometric status (height and weight) in the early years, and their subsequent growth
over the 10-year period.
2 OTHER EVIDENCE ON EARLY CHILDHOOD DEVELOPMENT IN THE
CONTEXT OF CRISIS
This section outlines where this article fits into a small but growing literature that uses
quantitative evidence to document the importance of early childhood nutrition, in
particular, those linking early childhood conditions with later-life outcomes. There is an
established consensus that the first 5 years of life are extremely important, and that adverse
events experienced in this time may even have permanent effects. Literature in medicine,
biology, economics, developmental psychology and sociology has documented the
importance of the early childhood years in terms of life-chances as measured by outcomes,
such as adult height, illness and earnings, mostly in the developed world. Barker (1992)
documents the foetal and early childhood origins of illness experienced in adulthood.
Almond (2006) in the economics literature finds a significant impact of the 1918 US
influenza epidemic on adult height of a cohort of children as yet unborn but in the womb at
the time of the pandemic. Grantham-McGregor et al. (2007) provide a multidimensional
overview of the evidence for a number of developing countries in Africa, Asia and
Latin America, and show that poor nourishment in early childhood inhibits cognitive
1Ethiopian Disaster Prevention and Preparedness Committee. See http://www.dppc.gov.et/ [accessed 8th January2010].
Copyright # 2010 John Wiley & Sons, Ltd. J. Int. Dev. 22, 1134–1145 (2010)
DOI: 10.1002/jid

1136 C. Porter
development, leading to poor schooling outcomes and worse health in adulthood.
Alderman et al. (2006) show that drought and civil war in Zimbabwe affected children’s
height several years later. Dercon and Porter (2009) show, using the same data on Ethiopia
used by this study, that very young children during the 1984 Ethiopian famine grew up to be
around 3 cm shorter than their unaffected peers, 20 years on from the crisis. On a more
positive note, a small body of evidence is available on the longer-term impacts of a
nutritional intervention in Guatamala, see for example Maluccio et al. (2009).
For a comprehensive review of the economics literature on health over the life-course,
see Strauss and Thomas (2008). Cunha et al. (2006) outline a formal economic model that
incorporates certain key empirical insights into child development, and is the theoretical
underpinning of this paper. In particular, the authors suggest that there are certain
development processes in very early childhood that if not achieved may be irreversible:
children who miss out on these developments may well never catch up. Secondly, the
authors outline the possibility of complementarities between different dimensions of child
development, for example between psycho-social skills and cognitive development. This
builds on earlier economic models based on the ‘health production function’ Grossman
(1972) that essentially try to simplify the complex biological and sociological process of
child development into a set of inputs (such as the amount and quality of food, exposure to
germs, quality of drinking water) and link those to health outcomes, such as incidence of
disease or height, as cumulative measure of nutrition.
3 FOOD AID, FAMINE AND DROUGHT RELIEF IN ETHIOPIA
Ethiopia’s climate is notoriously dry with erratic rainfall, and there have been several
severe famines in living memory, most notably in 1974 and 1984, though many also before
that (Pankhurst, 1986). In 1994–1995 at the time of the original study, food aid was
organised into free distribution (FD) and food-for-work (FFW) programmes.
Clay et al. (1999) show that there were considerable targeting errors in the distribution of
food aid at this time. Their study, based on 1996 data, finds no significant association
between household food insecurity (vulnerability) and receipt of food aid. Jayne et al.
(2001) find large differences in food aid allocations across regions that cannot be explained
by observable regional characteristics such as per capita income and rainfall. They also find
wide variations in the criteria used to identify recipient households across regions. Similar
findings from the same data show that inertia of the authorities in changing the location of
food aid distribution, due possibly to fixed costs (such as the set-up of a village distribution
station or recruitment of local administrators) led to food allocations that did not
necessarily reach the neediest—if a village had received food aid in the past then it would
be more likely to be a current recipient (Jayne et al., 2002).
Other studies on the impact of childhood nutrition in Ethiopia include Yamano et al.
(2005) and Quisumbing (2003). Quisumbing (2003) uses the Ethiopian Rural Household
Survey (ERHS) dataset up to 1997 to examine the effects of FD and FFW on child
nutritional status. These differ depending on whether the food aid was delivered free or via
FFW, and the sex of the child. She finds that both FFW and FD have a positive direct impact
on weight for height. Households that received FD showed improvements in girls’
nutrition, while for those receiving food from FFW nutrition improved for boys.
In 2005, the Government of Ethiopia introduced a more comprehensive, predictable and
transparent safety net scheme—the PSNP. The PSNP still includes a work component and
Copyright # 2010 John Wiley & Sons, Ltd. J. Int. Dev. 22, 1134–1145 (2010)
DOI: 10.1002/jid

Safety nets or Investment in the Future 1137
free food/cash distribution at the core of the programme, with supposedly more predictable
aid every year, a greater focus on asset building, and a further component meant to improve
the prospects for households to ‘graduate’ from the scheme.2 This is known as the Other
Food Security Programme (Government of Ethiopia, 2004). The PSNP has also moved
away from food distribution to a mixture of cash and food (sometimes for the same
household). In 2008, only approximately 45 per cent of the programme’s transfers were in
food, 55 per cent in cash. This marks a significant departure in donor policies, although
dramatic increases in food prices have reduced the purchasing power of those receiving
cash and many households have said they would prefer food to guarantee their
consumption levels (Hobson, 2009).
A small number of recent studies have examined the effect of the PSNP on children’s
welfare outcomes in the short-term. Hoddinott et al. (2009) use the official PSNP
evaluation data to examine child schooling and time use. Using the Young Lives dataset,3
Woldehanna (2009) examines the impact of the PSNP on children’s time use and schooling,
as does Orkin (2010) including qualitative research in one particular village. The findings
of all three papers indicate that whilst the safety net may be adding income to a household,
the work requirement can lead to increase in children’s working hours. Future work on the
Young Lives data will be able to assess whether the impacts of food aid are significantly
improved following the reform of the programmes compared to this study.
4 DATA
We use information from the ERHS, collected by the University of Addis Ababa with the
University of Oxford and the International Food Policy Research Institute (IFPRI). The
dataset spans 10 years from 1994 to 2004. The ERHS is small (covering 15 villages), but
representative of the main agricultural systems of the country (see Dercon and Krishnan
(1998) for more details on the sampling process and background to the villages). The
survey collected information on household assets, consumption and income as well as risk and
adverse events experienced by the household, and the education and health of individual
members as well as anthropometric measurements. Just under 1500 households were surveyed
in the first round, and attrition has been relatively low at the household level, at around three per
cent per annum. There is more attrition at the individual level which we discuss below.
The focus of our study is those who were in early childhood at the start of the survey in
1994. We have a sample of 468 children from 387 households who were aged under 5 years
in 1995, the third round of the survey.4 We have also have information on their height and
weight 10 years later in the sixth round, 2004, as well as their grade in school. To measure
the stock of nutritional achievement of the children, we use the height-for-age z-score
(HAZ).5 HAZ are recommended by the World Health Organisation (WHO) as a measure of
child development as they are a good indicator of the cumulative investments in child
2See Pankhurst (2009) for a discussion on the complex issues surrounding graduation and vulnerability in theEthiopian context.3Young Lives is a four-country longitudinal study of childhood poverty over 15 years in Ethiopia as well as Peru,India and Vietnam.(www.younglives.org.uk)4We could have based the sample on those aged under 60 months in Round 1, but in the analysis we can utiliselagged data (i.e. from the first two rounds) in order to circumvent some econometric concerns. Hence, for thisreason, the youngest child for which we have information in Round 1 is 11 months in 1995.5Raw data for the comparison groups available at: http://www.who.int/childgrowth/standards/height_for_age/en/index.html.
Copyright # 2010 John Wiley & Sons, Ltd. J. Int. Dev. 22, 1134–1145 (2010)
DOI: 10.1002/jid

Table 1. Descriptive statistics
Mean Standard deviation
Height (cm) 1995 86.829 11.298
HAZ 1995 �2.450 1.686
Height 2004 135.068 11.956
HAZ 2004 �2.274 1.451
Real aid per capita (1994 Birr) 13.277 56.118
Real consumption per cap (ex aid) 76.309 75.640
Relative rainfall (1–5) 2.968 1.351
Nr ill in household 0.669 1.129
Agricultural loss �0.230 0.206
Number female adults 1.632 1.045
Number female 5–15 1.137 0.993
Number female under 5 0.725 0.787
Number female elderly 0.139 0.361
Number male 5–15 1.151 1.104
Number male under 5 0.828 0.785
Number male elderly 0.084 0.285
Sex (female¼ 2) 1.445 0.497
Sex of HH head (female¼ 0) 0.836 0.370
Livestock units 3.051 4.069
Rainfall perception index 0.596 0.353
Public works in 2002 0.347 0.476
Food aid in 2002 0.234 0.423
Number of observations per round 436
1138 C. Porter
nutrition. They show the height of the child relative to a reference group of healthy children
of exactly the same age. This allows for comparison with other empirical studies. We
calculated height-for-age and weight-for-age z-statistics (WAZ) using the latest WHO
standards.6 A HAZ score of zero means that a child has the average height for their age,
where the average is calculated using the healthy comparison group. A negative HAZ
(or WAZ) means that the child is below the average height (weight) for a healthy child of
the same age and sex. A HAZ (WAZ) of below two is defined as stunted (or underweight),
and below three as severely stunted (or underweight). With an average HAZ of �2.45 for
the whole sample in 1995, this sample overall is stunted compared to the healthy
international comparison group. Otherwise stated, the z-score of �2 means that 97.7 per
cent of healthy children are taller than this, thus the median height of a 3-year old boy
in the reference group would be 100 cm (HAZ of 0.0) while a boy of the same age with a
z-score of �2.0 is 11 cm shorter. Table 1 shows descriptive statistics for the sample used in
the analysis.
6WHO has recently compiled a new dataset for under-5s based on a broader reference group of healthy childrenfrom seven countries, two of which were developing countries (the WHO Multicentre Growth Reference Study,MGRS) (see de Onis et al., 2007). The new reference group is selected from healthy, breastfed children in all sevencountries, and is meant to indicate a more prescriptive approach (e.g. how healthy children should grow—theunconstrained pattern). In the same symposium that created the new dataset for under 5s in 2006 recommendationswere made to introduce new references for older children, particularly with regard to the shortcomings regardingweight/BMI indicators (body mass index¼weight in kilograms squared, divided by height in centimeters). Thelatest data are based on a WHO recalibration of the original American (NCHS) reference group for children over 5.
Copyright # 2010 John Wiley & Sons, Ltd. J. Int. Dev. 22, 1134–1145 (2010)
DOI: 10.1002/jid

Safety nets or Investment in the Future 1139
5 DISCUSSION OF METHODOLOGY
Our concern is to quantitatively estimate the nutritional status of children in 2004,
examining whether undernutrition in their early childhood has caused a slowing of long-
term growth, or whether the children have caught up with their peers in the intervening
decade. Further, we are interested in examining whether food aid has played any long-term
role in child growth.
We draw on the approach outlined in Section 2 above (e.g. Alderman et al., 2006) for our
empirical specification, and outline a model that specifies height, Hit as a proxy for long-
term nutritional status, as a function of child characteristics Xi, (such as sex, birth order
and genetic characteristics), household characteristics Xh (wealth, nutritional availability,
composition of the household, characteristics of parents) and community characteristics Xc
(rainfall, general nutrition availability). Height can be thought of as a ‘stock’ of nutrition
(de Onis et al., 2007) and, therefore, we would appropriately include the lagged levels of
height in a model.
Hit ¼ f ðHit�1;Xi;Xh;Xc; uÞ (1)
Included in the household characteristics would also be receipt of food aid. Ideally, we
would like to know how much food aid was allocated directly to each child, but we only
have household-level information. Even when food aid has been allocated to the most
needy households, its effectiveness also depends on how it is distributed among household
members.
Our empirical specification is then
Hit ¼ aþ b1Hit�1 þ g i þX
bjXit þX
bkXht þX
bsXct þ eit (2)
where Xit captures time-varying child characteristics Xht are household time-
varying characteristics and Xct at the community level (we also control for community
fixed effects). The main econometric concern is that time-invariant variables g i that
are unobservable to us may be correlated with both the ‘current’ (2004) and previous
(1995) height estimates, for example, the household’s general approach to child
nutrition, or genetic factors. Since height is measured by enumerators, we assume that
any measurement error is likely to be random, though our empirical strategy does help to
deal with this problem. We take the difference in height over the two periods in order to
ensure that our results are not correlated with any unobserved factors about the child or
household that do not change over time (the fixed effect) that would cause us to spuriously
overestimate the causal effect of nutrition in early childhood on future height, and use an
instrumental variables strategy (First-Difference Generalised Method Of Moments, GMM)
where we include twice-lagged height (e.g. height in the first period of 1994) as the
instrument for height in 1995. We report the appropriate specification tests in the results
section, in order to confirm that our strategy is suitable. The assumption necessary for
consistency of the estimates is that there is no serial correlation in time varying but
unobserved characteristics such as innate healthiness. We acknowledge that this is a strong
assumption. For a more technical discussion of this problem, see Blundell and Bond (1998)
or Wooldridge (2001).
Copyright # 2010 John Wiley & Sons, Ltd. J. Int. Dev. 22, 1134–1145 (2010)
DOI: 10.1002/jid

Table 2. Standard poverty measures, by round
Year Headcount Poverty gap Sq-poverty gap Mean consumptionamongst poor (Birr)
1994 0.39 0.16 0.08 26.80
1995 0.44 0.19 0.10 25.70
2004 0.23 0.07 0.04 30.26
Source: ERHS data, poverty line is 44.3 Birr per adult (1994 prices), per month
1140 C. Porter
6 ANALYSIS OF NUTRITIONAL STATUS IN 1995
Ethiopia is a very poor country, and poverty as measured by a consumption deficit remains
pervasive, especially in rural areas. Table 2 shows poverty statistics for the full sample in
1994, 1995 and 2004 of the ERHS survey.
In 1994 at the start of the survey, 39 per cent of households are below the poverty line.
We use a very low poverty line (at around 30 US cents per day), to be comparable with other
studies using the ERHS data. Dercon and Krishnan (1998) calculated this as the amount
needed to reach food consumption of 2000 calories per day (and proportionally lower for
women and children), plus a very small amount of non-food expenditure on fuel. We can
see that poverty falls by all measures over the 10-year period, though in 2004 there are still
more than a quarter of all households in poverty.
In Table 3, we focus on 1995, the baseline for nutritional status in our analysis.
Comparing children from households that were below the poverty line, we see that their
height is unsurprisingly lower than those above poverty it (and remember that this is an
extremely austere poverty line). We find that the overall HAZ is significantly lower (at 5 per
cent using a t-test) for children living in poor households rather households above the
poverty line. The proportion of stunted children in both groups is not significantly different,
but the proportion of very stunted children higher for the poor. Even for relatively better-off
households, the proportion of very stunted children is high at 31 per cent. We find no
significant differences in height for age by sex, confirming other studies of rural Ethiopia
(e.g. Hoddinott et al., 2009). A similar pattern applies for weight-for-age, with non-poor
children significantly heavier than the poor children.
Applying the same tests (i.e. on poverty status in round 1) to height for age in 2004, we
see no significant differences later on in life (aged 10–15 years). We note, however, that to
be included in our sample in 2004 the child must have survived into that year. There are also
other reasons that children are not followed through to the 2004 survey (for example,
households moving, lost roster cards) so we examine the differences between those who are
still in our sample and those who do not in the robustness checks.
Table 3. Nutritional status of poor and non-poor children under five (in 1995)
Poor Mean (HAZ) Mean (WAZ) Mean (stunted) Mean (V.stunted)
Non-poor �2.319 �1.461 0.542 0.314
Poor �2.656�� �1.910�� 0.537 0.388�
Notes: Poor is defined in the text and Tables 1 and 2 as consumption below 44.3 birr per month.�Significant at 90 per cent;��Significant at 95 per cent.
Copyright # 2010 John Wiley & Sons, Ltd. J. Int. Dev. 22, 1134–1145 (2010)
DOI: 10.1002/jid
Safety nets or Investment in the Future 1141
We can analyse the determinants of height-for-age in 1995 based on some characteristics of
the child, including age, sex, birth order and recent illness, as well as household
characteristics, including composition of the household, assets, receipt of food aid and any
adverse events that may have occurred. Measures of the adverse events include rainfall (which
may also be better than expected), a self-reported agricultural loss index comprising eight
potential adverse events that may happen to crops such as frost, animal trampling, insects and
crop-diseases. Also we include illness within the household. We use real consumption per
adult equivalent, and the same for the receipt of food aid (with 1994 as the base year).
We are interested in whether nutritional status in 1995 predicts that of 2004—in other words
whether there is persistence in nutritional outcomes. If there is, it indicates the difficulty of over-
coming poverty in rural Ethiopia, and that nutritional interventions for under-5s could have a lasting
impact in breaking the inter-generational cycle of poverty. Similarly, preventing severe nutritional
deprivation in early life or mitigating the nutritional impacts of adverse events in a timely
fashion can have lasting benefits beyond the already important alleviation of suffering in a crisis.
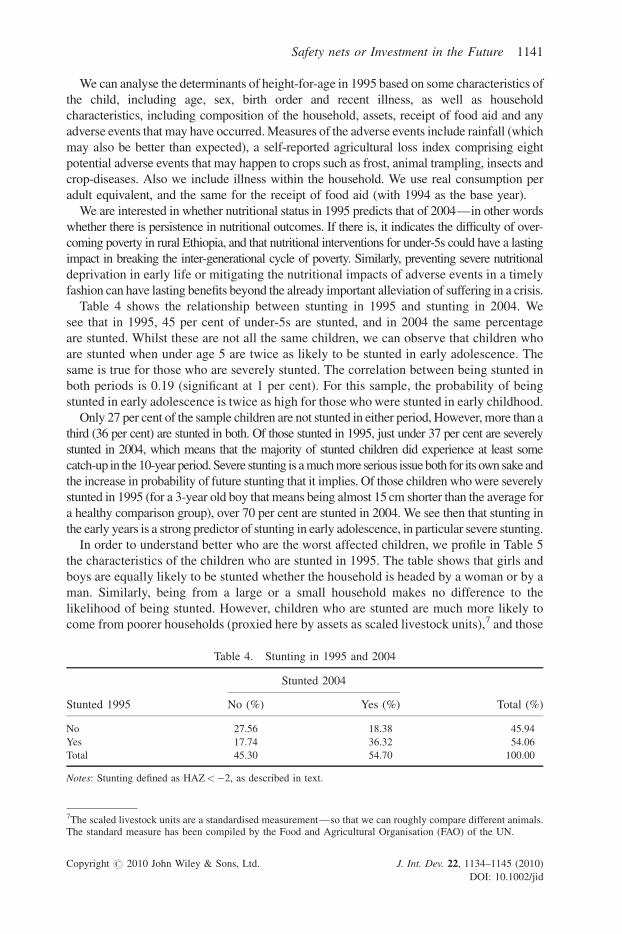
Table 4 shows the relationship between stunting in 1995 and stunting in 2004. We
see that in 1995, 45 per cent of under-5s are stunted, and in 2004 the same percentage
are stunted. Whilst these are not all the same children, we can observe that children who
are stunted when under age 5 are twice as likely to be stunted in early adolescence. The
same is true for those who are severely stunted. The correlation between being stunted in
both periods is 0.19 (significant at 1 per cent). For this sample, the probability of being
stunted in early adolescence is twice as high for those who were stunted in early childhood.
Only 27 per cent of the sample children are not stunted in either period, However, more than a
third (36 per cent) are stunted in both. Of those stunted in 1995, just under 37 per cent are severely
stunted in 2004, which means that the majority of stunted children did experience at least some
catch-up in the 10-year period. Severe stunting is a much more serious issue both for its own sake and
the increase in probability of future stunting that it implies. Of those children who were severely
stunted in 1995 (for a 3-year old boy that means being almost 15 cm shorter than the average for
a healthy comparison group), over 70 per cent are stunted in 2004. We see then that stunting in
the early years is a strong predictor of stunting in early adolescence, in particular severe stunting.
In order to understand better who are the worst affected children, we profile in Table 5
the characteristics of the children who are stunted in 1995. The table shows that girls and
boys are equally likely to be stunted whether the household is headed by a woman or by a
man. Similarly, being from a large or a small household makes no difference to the
likelihood of being stunted. However, children who are stunted are much more likely to
come from poorer households (proxied here by assets as scaled livestock units),7 and those
Table 4. Stunting in 1995 and 2004
Stunted 2004
Stunted 1995 No (%) Yes (%) Total (%)
No 27.56 18.38 45.94
Yes 17.74 36.32 54.06
Total 45.30 54.70 100.00
Notes: Stunting defined as HAZ<�2, as described in text.
7The scaled livestock units are a standardised measurement—so that we can roughly compare different animals.The standard measure has been compiled by the Food and Agricultural Organisation (FAO) of the UN.
Copyright # 2010 John Wiley & Sons, Ltd. J. Int. Dev. 22, 1134–1145 (2010)
DOI: 10.1002/jid

Table 5. Characteristics of children, by nutritional status
Non-stunted Stunted Total
Height-for-age �0.71 �3.50� �2.45
Weight-for-age �1.12 �2.05� �1.64
Age in months 39.01 37.97� 38.45
Sex (female¼ 2) 0.56 0.55 0.56
Household size 7.24 7.24 7.24
Sex of HH Head (female¼ 0) 0.86 0.85 0.86
Livestock units 3.20 2.57� 2.86
Real consumption/adult (exc. Food aid) 68.11 67.80 67.94
Real food aid/adult 2.34 0.58� 1.39
Agricultural loss �0.18 �0.18 �0.18
Nr ill in household 0.38 0.48 0.44
Notes: Real consumption and food aid have been deflated to 1994 Ethiopian Birr. No causal links assumed.�Significant at 90 per cent.
1142 C. Porter
that receive less food aid. Including food aid, we test whether total consumption is different
between both groups, and find no differences.
We are interested in two main questions. Firstly, is there any catch-up in growth over the
10-year period, or are children who are short for their age or sex always going to remain so?
Second, is there any impact of food aid on subsequent growth? As noted in the econometric
strategy, we can estimate growth between 1995 and 2004 using methods that do not
spuriously pick up ‘third factors’ unobserved to us and attribute them to causal effects of
undernutrition in childhood. We also use lagged values of food aid received for the same
reasons—there could be something unobservable about the household (or child) that is
correlated both with the amount of food aid received and with height. This strategy is also
useful when measurement error is present. We use the methodology outlined in Section 5
above and show the results in Table 6.
We would expect a negative coefficient on the lagged height-for-age coefficient if there is
any catch-up (i.e. the shorter children grow faster)—a coefficient of�1 would mean complete
catch-up. In this case the coefficient is relatively low, which indicates quite limited levels of
catch-up. The amount of food aid received in the ‘snapshot’ we have when the child was under
5 years appears to be very significant. We do not have enough data to ascertain whether there
are differential impacts for boys or girls, though Quisumbing (2003) does find some which
relate to the method of distribution between 1994 and 1997. Some questions were asked in the
sixth round (2004) survey about experiences during the 2002 drought. We, therefore, include a
dummy variable indicating whether the household received food aid free, or through
participation in public works during 2002. Participation in public works is not significant
for our sample, and food aid is positively related to growth (though our estimates of this are
slightly less precise—a p-value of 0.12, or significant only at 88 per cent).
7 ROBUSTNESS CHECKS
Because we used an instrumental variables strategy, we run the risk that our estimates will
be less consistent and possibly biased compared to the standard Ordinary Least Squares
(OLS). To test for weak instruments (that the instrument we use does not have enough
explanatory power to accurately predict a value), we present in Table 5 above the
Copyright # 2010 John Wiley & Sons, Ltd. J. Int. Dev. 22, 1134–1145 (2010)
DOI: 10.1002/jid

Table 6. Determinants of nutritional status in 2004
Change in HAZ
HAZ 1995 �0.138���
(0.047)
Food aid received in 1995 0.008���
(0.002)
Consumption (exc. aid) 0.002�
(0.001)
Relative rainfall 0.016
(0.241)
Rel. rain (1 year ago) 0.401���
(0.147)
Sex �0.142
(0.126)
Public works 2002 0.097
(0.188)
Food aid 2002 0.247
(0.162)
Constant �1.593
�1.174
Observations 362
Kleibergen–Paap rk Wald F statistic 206.226
Notes: IV-GMM estimation. Standard errors in parenthesis.�Significant at 90 per cent; Significant at 95 per cent; ���Significant at 99 per cent.
Safety nets or Investment in the Future 1143
Kleibergen–Paap test statistic for significance, which is well above the critical value. This
means that our estimates are highly unlikely to suffer from inconsistency and bias of less
than 1 per cent which can be a problem when instruments are ‘weak’ (Murray, 2006).
A further issue is that we may be concerned that our sample is different from the total
sample, given that we are only using information on children of a certain age. We have
height and weight information on 254 children in round one who are either not present
in later rounds, or who have missing height or weight data for one of the later rounds. The
435 children, who are in our sample, may be from households that are somehow ‘different’
from the rest of the sample, or be somehow individually different. We may also be
concerned with attrition—our sample includes only those children for whom we have a full
set of anthropometric data across the years to undertake the analysis. Whilst we are not
choosing children other than on their age and the fact that they have data available for all
rounds we are interested in, there may be some underlying differences to those we do not
observe in all rounds (e.g. if weaker, shorter children have died between rounds).
To resolve both these concerns, in Table 7 we compare our sample with the sample of
235 children who were similarly aged in 1994 but who were not included in the analysis
due to missing data. The sample children are slightly shorter but slightly heavier, although
the differences are not significant.
8 CONCLUSIONS
This paper has examined the nutritional status of children when they were aged below
5 years in 1995, and again almost 10 years later in 2004. We find that children who are
Copyright # 2010 John Wiley & Sons, Ltd. J. Int. Dev. 22, 1134–1145 (2010)
DOI: 10.1002/jid
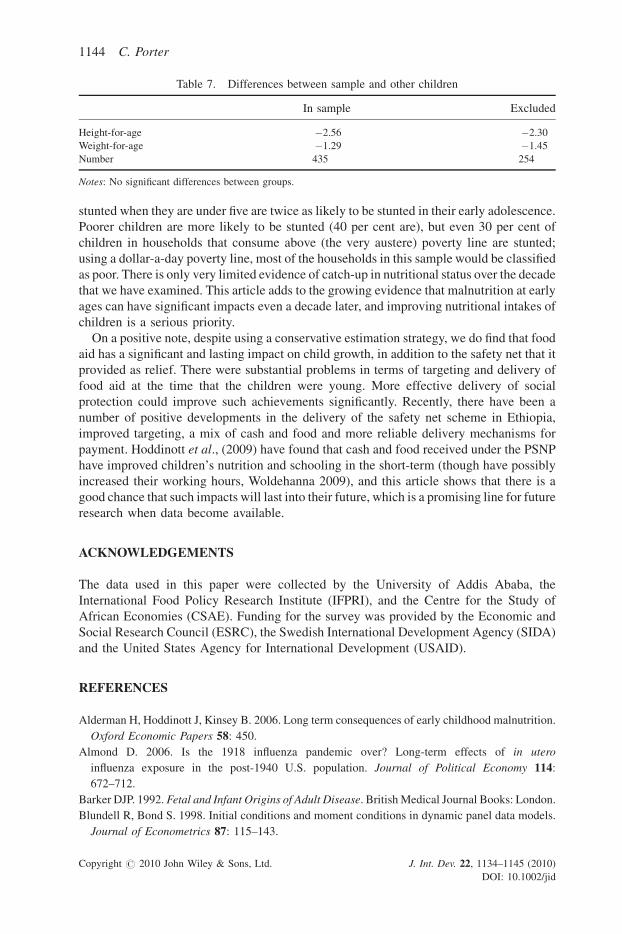
Table 7. Differences between sample and other children
In sample Excluded
Height-for-age �2.56 �2.30
Weight-for-age �1.29 �1.45
Number 435 254
Notes: No significant differences between groups.
1144 C. Porter
stunted when they are under five are twice as likely to be stunted in their early adolescence.
Poorer children are more likely to be stunted (40 per cent are), but even 30 per cent of
children in households that consume above (the very austere) poverty line are stunted;
using a dollar-a-day poverty line, most of the households in this sample would be classified
as poor. There is only very limited evidence of catch-up in nutritional status over the decade
that we have examined. This article adds to the growing evidence that malnutrition at early
ages can have significant impacts even a decade later, and improving nutritional intakes of
children is a serious priority.
On a positive note, despite using a conservative estimation strategy, we do find that food
aid has a significant and lasting impact on child growth, in addition to the safety net that it
provided as relief. There were substantial problems in terms of targeting and delivery of
food aid at the time that the children were young. More effective delivery of social
protection could improve such achievements significantly. Recently, there have been a
number of positive developments in the delivery of the safety net scheme in Ethiopia,
improved targeting, a mix of cash and food and more reliable delivery mechanisms for
payment. Hoddinott et al., (2009) have found that cash and food received under the PSNP
have improved children’s nutrition and schooling in the short-term (though have possibly
increased their working hours, Woldehanna 2009), and this article shows that there is a
good chance that such impacts will last into their future, which is a promising line for future
research when data become available.
ACKNOWLEDGEMENTS
The data used in this paper were collected by the University of Addis Ababa, the
International Food Policy Research Institute (IFPRI), and the Centre for the Study of
African Economies (CSAE). Funding for the survey was provided by the Economic and
Social Research Council (ESRC), the Swedish International Development Agency (SIDA)
and the United States Agency for International Development (USAID).
REFERENCES
Alderman H, Hoddinott J, Kinsey B. 2006. Long term consequences of early childhood malnutrition.
Oxford Economic Papers 58: 450.
Almond D. 2006. Is the 1918 influenza pandemic over? Long-term effects of in utero
influenza exposure in the post-1940 U.S. population. Journal of Political Economy 114:
672–712.
Barker DJP. 1992. Fetal and Infant Origins of Adult Disease. British Medical Journal Books: London.
Blundell R, Bond S. 1998. Initial conditions and moment conditions in dynamic panel data models.
Journal of Econometrics 87: 115–143.
Copyright # 2010 John Wiley & Sons, Ltd. J. Int. Dev. 22, 1134–1145 (2010)
DOI: 10.1002/jid

Safety nets or Investment in the Future 1145
Clay DC, Molla D, Habtewold D. 1999. Food aid targeting in Ethiopia: a study of who needs it and
who gets it. Food Policy 24: 391–409.
Cunha F, Heckman JJ, Lochner L, Masterov DV. 2006. Interpreting the Evidence on Life Cycle Skill
Formation in Handbook of the Economics of Education. Elsevier: North Holland.
de Onis M, Garza C, Onyango AW, Borghi E. 2007. Comparison of the WHO child growth standards
and the CDC 2000 growth charts. Journal of Nutrition 137: 144–148.
Dercon S, Krishnan P. 1998. Changes in poverty in rural Ethiopia 1989–1995: measurement,
robustness tests and decomposition, CSAE Working Paper Series Oxford, Centre for the Study
of African Economies.
Dercon S, Porter C. 2009. Long term consequences of childhood malnutrition: evidence from the
Ethiopian famine of 1984. Mimeo, University of Oxford.
Government of Ethiopia. 2004. Productive Safety Net Programme: Programme Implementation
Manual. Addis Ababa, Ministry of Agriculture and Rural Development.
Grantham-McGregor S, Cheung YB, Cueto S, Glewwe P, Richter L, Strupp B. 2007. Develop-
mental potential in the first 5 years for children in developing countries. The Lancet 369:60–70.
Grossman M. 1972. The Demand for Health: A Theoretical and Empirical Investigation. NBER
Publishing: Massachusetts.
Hobson M. 2009. The food price crisis and its impact on the productive safety net program in 2008.
Humanitarian Exchange Magazine 42. http://www.odihpn.org/report.asp?id=2997
Hoddinott J, Gilligan DO, Taffesse AS. 2009. The impact of Ethiopia’s productive safety
net program on schooling and child labor. Journal of Development Studies 45(10): 1684–1706.
Jayne TS, Strauss J, Yamano T, Molla D. 2001. Giving to the poor? Targeting of food aid in rural
Ethiopia. World Development 29: 887–910.
Jayne TS, Strauss J, Yamano T, Molla D. 2002. Targeting of food aid in rural Ethiopia: chronic need
or inertia? Journal of Development Economics 68: 247–288.
Maluccio JA, Hoddinott J, Behrman JR, Martorell R, Quisumbing AR, Stein AD. 2009. The impact of
improving nutrition during early childhood on education among guatemalan adults. The Economic
Journal 119: 734–763.
Murray MP. 2006. Avoiding invalid instruments and coping with weak instruments. Journal of
Economic Perspectives 20(4): 111–132.
Orkin K. 2010. In the Child’s Best Interests? Legislation on Children’s Work in Rural Ethiopia.
Journal of International Development 22(8): 1102–1114.
Pankhurst A. 2009. Rethinking safety nets and household vulnerability in Ethiopia: implications of
household cycles, types and shocks. Paper presented at World Conference of Humanitarian
Studies, Groenigen.
Pankhurst R. 1986. The history of famine and epidemics in Ethiopia: prior to the twentieth century
Addis Ababa. Relief and Rehabilitation Commission.
Quisumbing AR. 2003. Food aid and child nutrition in rural Ethiopia. World Development 31:
1309–1324.
Strauss J, Thomas D. 2008. Health over the life course. In Handbook of Development Economics,
Vol. 4, Schultz T, Strauss J (eds). North-Holland: Oxford.
Woldehanna T. 2009. Productive safety net programme and children’s time use between work and
schooling in Ethiopia. Working Paper 40, Oxford, Young Lives.
Wooldridge JM. 2001. Econometric Analysis of Cross Section and Panel Data. MIT Press: Cam-
bridge.
Yamano T, Alderman H, Christiaensen L. 2005. Child growth, shocks, and food aid in rural Ethiopia.
American Journal of Agricultural Economics 87: 273–288.
Copyright # 2010 John Wiley & Sons, Ltd. J. Int. Dev. 22, 1134–1145 (2010)
DOI: 10.1002/jid