Embed Size (px)
Citation preview
SagePoint Equipment 100Q3 2009 Performance Review
An Analysis of Public Communications EquipmentCompanies from a Valuation and M&A Perspective
January 8, 2010
Prepared By:
For more information contact David Michaels at (858) 926-5950 or [email protected]
Table of Contents
Section
• SagePoint Equipment 100 Universe
• SagePoint’s Viewpoint – Key Takeaways
• Stock Performance
• Q3 Performance Versus Estimates
• Revenue & EPS Growth
• Margin Analysis
• Revenue Multiples
• EBITDA Multiples
• P/E Multiples
• Balance Sheet Strength
• Detailed Financial Metrics By Company
• Introduction to SagePoint
2
Page
3-4
5-6
7-8
9-10
11-14
15-19
20-21
22-23
24-25
26
27-32
33
SagePoint Equipment 100 – Q3 2009
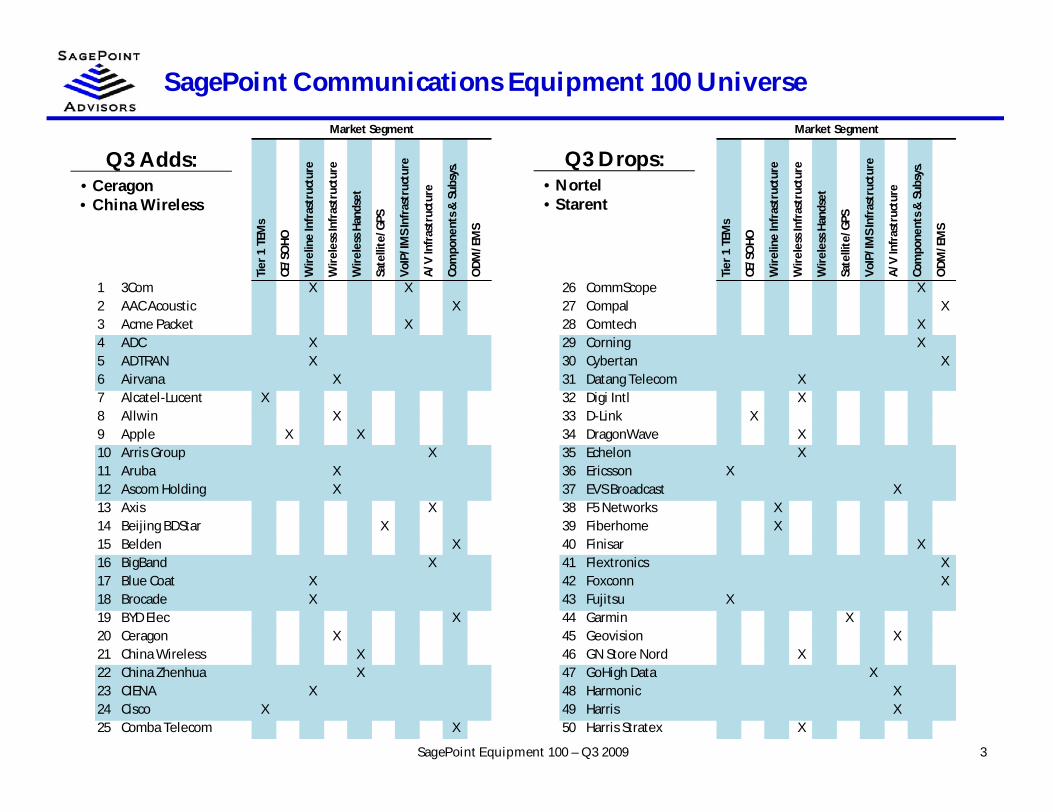
SagePoint Communications Equipment 100 Universe
SagePoint Equipment 100 – Q3 2009 3
Market Segment Market Segment
1 3Com X X 26 CommScope X2 AAC Acoustic X 27 Compal X3 Acme Packet X 28 Comtech X4 ADC X 29 Corning X5 ADTRAN X 30 Cybertan X6 Airvana X 31 Datang Telecom X7 Alcatel-Lucent X 32 Digi Intl X8 Allwin X 33 D-Link X9 Apple X X 34 DragonWave X10 Arris Group X 35 Echelon X11 Aruba X 36 Ericsson X12 Ascom Holding X 37 EVS Broadcast X13 Axis X 38 F5 Networks X14 Beijing BDStar X 39 Fiberhome X15 Belden X 40 Finisar X16 BigBand X 41 Flextronics X17 Blue Coat X 42 Foxconn X18 Brocade X 43 Fujitsu X19 BYD Elec X 44 Garmin X20 Ceragon X 45 Geovision X21 China Wireless X 46 GN Store Nord X22 China Zhenhua X 47 GoHigh Data X23 CIENA X 48 Harmonic X24 Cisco X 49 Harris X25 Comba Telecom X 50 Harris Stratex X
Com
pone
nts
& S
ubsy
s.
OD
M/E
MS
Wir
elin
e In
fras
truc
ture
Wir
eles
s In
fras
truc
ture
Wir
eles
s H
ands
et
Sate
llite
/GPS
VoI
P/IM
S In
fras
truc
ture
A/V
Infr
astr
uctu
re
VoI
P/IM
S In
fras
truc
ture
A/V
Infr
astr
uctu
re
Com
pone
nts
& S
ubsy
s.
OD
M/E
MS
Tier
1 T
EMs
CE/S
OH
O
Tier
1 T
EMs
CE/S
OH
O
Wir
elin
e In
fras
truc
ture
Wir
eles
s In
fras
truc
ture
Wir
eles
s H
ands
et
Sate
llite
/GPS
Q3 Adds:• Ceragon• China Wireless
Q3 Drops:• Nortel• Starent

SagePoint Communications Equipment 100 Universe - Continued
SagePoint Equipment 100 – Q3 2009 4
Market Segment Market Segment
51 Infinera X 76 RIM X52 Jiangsu Yongding X 77 Riverbed X53 Jiangsu Zhongtian X 78 RuggedCom X54 Juniper X 79 Sandvine X55 JVC KENWOOD X 80 Screen Service X56 LG X X 81 SeaChange X57 Lite-On X 82 Sharp X58 Loral X 83 ShoreTel X59 MiTAC X 84 Sonus Networks X60 Motorola X 85 Sony X61 NEC X 86 Sunwave X62 Net Insight X 87 Sycamore X63 Netgear X 88 Tandberg X64 Ningbo Bird X 89 TCS X65 Nokia X X 90 Tekelec X X66 Pace X 91 Tellabs X67 Palm X 92 Thomson X68 Panasonic X 93 TiVo X69 Philips Elec X 94 TKH Group X70 Pioneer X 95 TomTom X71 Plantronics X 96 Trimble X72 Polycom X 97 ViaSat X73 Powerwave X 98 Vtech X74 Qisda X 99 Wuhan X75 Quanta X 100 ZTE X
VoI
P/IM
S In
fras
truc
ture
A/V
Infr
astr
uctu
re
Com
pone
nts
& S
ubsy
s.
OD
M/E
MS
Tier
1 T
EMs
CE/S
OH
O
Wir
elin
e In
fras
truc
ture
Wir
eles
s In
fras
truc
ture
Wir
eles
s H
ands
et
Sate
llite
/GPS
Wir
eles
s H
ands
et
Sate
llite
/GPS
VoI
P/IM
S In
fras
truc
ture
A/V
Infr
astr
uctu
re
Com
pone
nts
& S
ubsy
s.
OD
M/E
MS
Tier
1 T
EMs
CE/S
OH
O
Wir
elin
e In
fras
truc
ture
Wir
eles
s In
fras
truc
ture

SagePoint’s Viewpoint - Key Takeaways
5SagePoint Equipment 100 – Q3 2009
• Stock price recovery continues in the communications equipment segment− SagePoint Equipment 100 companies posted a median gain of 27% since the beginning of Q3− ODM/EMS segment posted the largest median gain, up over 60% since beginning of Q3
• Companies continue to deliver on reset revenue expectations while cutting costs aggressively− 78% of the Equipment 100 met or beat Q3 revenue targets while 81% met or beat EPS targets− 45% of companies beat revenue targets by 2-10% while 50% beat EPS targets by over 20%
• Revenue contraction continues, though the worst is clearly behind us− Median revenue contraction was just 5% following a 12% drop in Q2− Moderate revenue growth is expected to return with median growth of 12% over the next twelve
months− The Wireless Infrastructure & Handset segments are leading the return to revenue growth with 27% and
34% growth expected over the next twelve months, respectively
• EPS contraction continued despite strong cost cutting but strong EPS growth is expected− Equipment 100 posted a median profit reduction of 15% in Q3’09 versus Q3’08− Tier 1 TEMs, CE/SOHO, A/V Infrastructure and Components & Subsystems all posted EPS contraction
of more than 30% primarily due to revenue contraction− EPS growth is expected to return with a median growth rate of 35% over the next twelve months as
moderate revenue growth returns and aggressive cost cutting pays off

SagePoint’s Viewpoint - Key Takeaways Continued
6SagePoint Equipment 100 – Q3 2009
• Equipment 100 operating models are being repaired through cost cutting− Q3 median gross margin of 35.5% is nearing the historical range of 36-37%− R&D spending has been cut to match revenue declines and now stands at a median of 11% of sales, at
the high end of the historical range− Median SG&A as a % of revenues was 19.7% in Q3, matching the three year low following deep
spending cuts− Q3 median net margin of 5.8% returned to the historical range of 5-7% with all segments in the black,
however, Tier 1 TEMs, CE/SOHO and ODM/EMS all generate net margins of only 2-3%
• Valuation multiples have doubled from late ‘08 lows but generally remain below 2007 peaks− Median LTM revenue multiple of 1.5x remains nearly 30% below the 2007 peak− Median LTM EBITDA multiple of 12.3x remains more than 15% below the 2007 peak− Median P/E of 24.1x is nearing a three year high, nearly double its low of 12.5x in Q3’08− Wireless Infrastructure is trading at premium revenue and P/E multiples on better growth prospects
• M&A activity rebounded in Q3 and SagePoint expects continued momentum in 2010− Notable deals included Cisco’s $3.4B acquisition of Tandberg, Avaya’s $900M acquisition of Nortel’s
Enterprise Solutions assets and Ericsson’s $1.1B acquisition of Nortel’s CDMA & LTE assets− OEM consolidation trend will continue in an effort to rebuild scale to drive margins− Balance sheet strength remains strong and several active buyers have cash war chests− R&D spending cuts will drive more buy-vs-build decisions as buyers look to fill product gaps− Many buyers may look externally for growth as organic growth remains slow for many vendors
SagePoint Equipment 100 Index Performance
7SagePoint Equipment 100 – Q3 2009
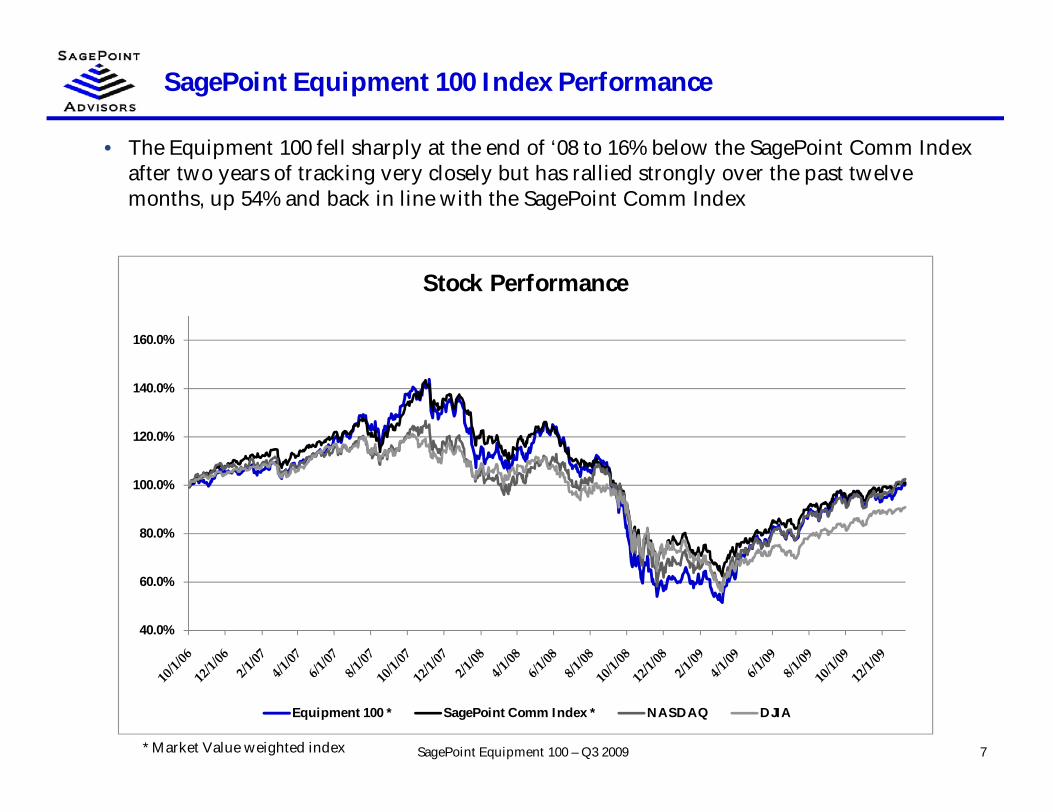
• The Equipment 100 fell sharply at the end of ‘08 to 16% below the SagePoint Comm Indexafter two years of tracking very closely but has rallied strongly over the past twelvemonths, up 54% and back in line with the SagePoint Comm Index
* Market Value weighted index
40.0%
60.0%
80.0%
100.0%
120.0%
140.0%
160.0%
Stock Performance
Equipment 100 * SagePoint Comm Index * NASDAQ DJIA

Stock Performance Since Beginning of Q3
• The Equipment 100 continued to its strong recovery with a median gain of 27% since 6/30• ODM/EMS, Components & Subsystems and Wireless Infrastructure have outperformed while
Wireline Infrastructure, Wireless Handset and A/V Infrastructure underperformed• Big winners included China Wireless, DragonWave, Finisar, Comba & AAC Acoustic
− China Wireless, Comba and DragonWave all delivered triple digit EPS growth in Q3− DragonWave’s Nasdaq listing has helped provide increased investor interest, driving valuation
• Sycamore, JVC, NEC, BigBand & ShoreTel all declined 25-35%
8
Source: SagePoint Advisors & Capital IQ Source: SagePoint Advisors & Capital IQ
SagePoint Equipment 100 – Q3 2009
26.9
18.722.3
8.3
39.3
9.9
31.5 33.1
10.5
44.9
61.4
0%
10%
20%
30%
40%
50%
60%
70%
Since 6/30/09
Stock Performance - Since 6/30/09
Equip Top 100 Tier 1 TEMsCE/SOHO Wireline InfrastructureWireless Infrastructure Wireless HandsetSatellite/GPS VoIP / IMS InfrastructureA/V Infrastructure Components & SubsystemsODM/EMS
257.8 247.6
138.8124.9 121.2
26.9
(27.1) (30.8) (32.9) (33.8) (33.9)(50)%
0%
50%
100%
150%
200%
250%
300%
Best/Worst Performers - Since 6/30/09

Q3 Performance Versus Analyst Estimates – Revenue
9SagePoint Equipment 100 – Q3 2009
Source: SagePoint Advisors & Capital IQ Source: SagePoint Advisors & Capital IQ
• The vast majority (78%) of the Equipment 100 met or beat revenue estimates with 20% missingslightly
− Palm was the only big surprise, beating by almost 25% with Garmin, Netgear, DragonWave andPlantronics beating by 7-11%
− Airvana had the biggest miss as a large portion of revenue was pushed out due to timing issues aroundEricsson’s acquisition of Nortel’s CDMA business but triple digit revenue growth is expected
− Sycamore, TiVo, Harris Stratex and Digi all came in 7-9% below expectations
2%2%
45%
29%
20%2%
Revenue Estimate
Beat 20%+ Beat 10-20% Beat 2-10% Hit +/-2%
Miss 2-10% Miss 10-20% Miss 20%+
24.7
10.6 9.7 8.3 7.60.7
(6.9) (7.6) (7.6) (8.1)
(40.6)(50)%
(40)%
(30)%
(20)%
(10)%
0%
10%
20%
30%
Biggest Revenue Estimate Beats/Misses
Q3 Performance Versus Analyst Estimates – EPS
10SagePoint Equipment 100 – Q3 2009
Source: SagePoint Advisors & Capital IQ Source: SagePoint Advisors & Capital IQNote: Excludes companies projected to have a net margin between -1% and 1%
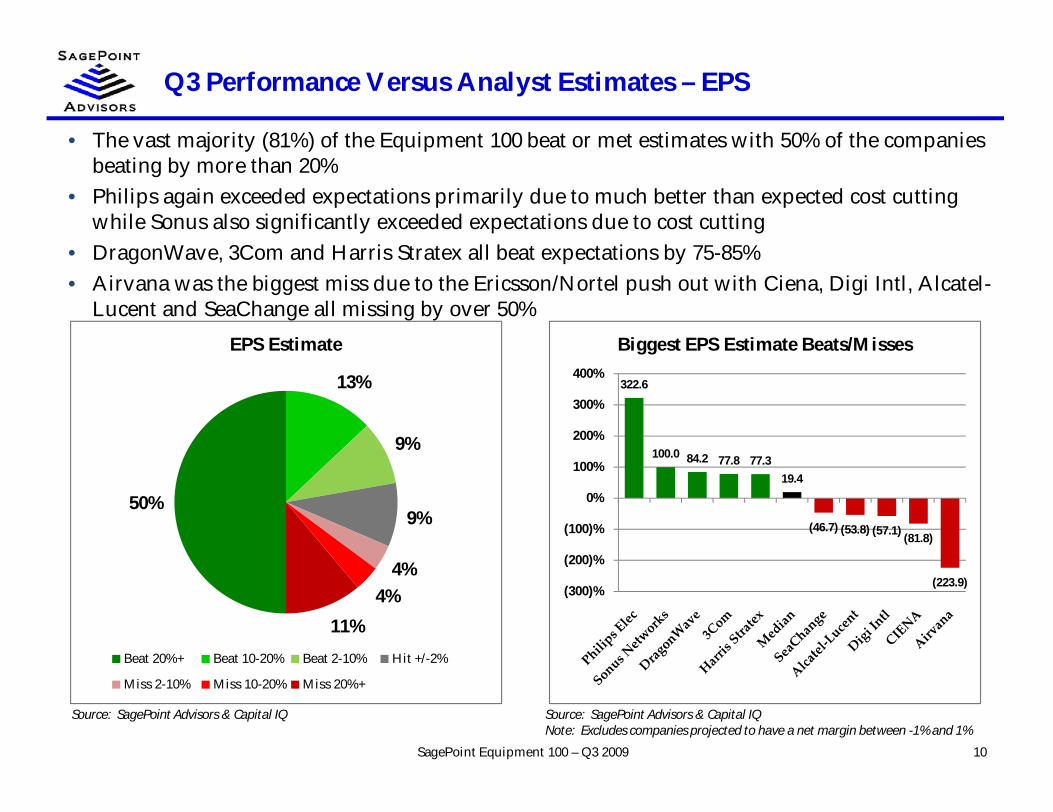
• The vast majority (81%) of the Equipment 100 beat or met estimates with 50% of the companiesbeating by more than 20%
• Philips again exceeded expectations primarily due to much better than expected cost cuttingwhile Sonus also significantly exceeded expectations due to cost cutting
• DragonWave, 3Com and Harris Stratex all beat expectations by 75-85%• Airvana was the biggest miss due to the Ericsson/Nortel push out with Ciena, Digi Intl, Alcatel-
Lucent and SeaChange all missing by over 50%
50%
13%
9%
9%
4%4%
11%
EPS Estimate
Beat 20%+ Beat 10-20% Beat 2-10% Hit +/-2%
Miss 2-10% Miss 10-20% Miss 20%+
322.6
100.0 84.2 77.8 77.319.4
(46.7) (53.8) (57.1) (81.8)
(223.9)(300)%
(200)%
(100)%
0%
100%
200%
300%
400%
Biggest EPS Estimate Beats/Misses

Operating Metrics – Revenue Growth
11SagePoint Equipment 100 – Q3 2009
Source: SagePoint Advisors & Capital IQ Source: SagePoint Advisors & Capital IQ
• Median revenue contraction continued at 5% in Q3 but seems to be reversing following sixquarters of falling growth
• GoHigh posted record VoIP shipments while Clearwire buildout benefitted DragonWave− Sunwave, Jiangsu Yongdign and Allwin all posted very strong growth as well
• Palm, Airvana, BigBand, ADC and EVS Broadcast revenues contracted 45-80%− Arivana’s decrease was due to the Ericsson/Nortel acquisition and Palm’s revenue decline was
partially due to a change to subscription accounting for the Pre
19.522.1 21.7
26.028.5
21.7
16.5
7.8
(1.1)
(9.7)(11.9)
(5.0)
(15)%
(10)%
(5)%
0%
5%
10%
15%
20%
25%
30%
35%
MRQ / PYQ Revenue Growth374.5
224.0
154.5
80.1 69.1
(5.0)(45.3) (47.8) (54.0) (66.9) (81.5)
(200)%
(100)%
0%
100%
200%
300%
400%
High/Low Revenue Growth
Operating Metrics – Revenue Growth by Segment
12SagePoint Equipment 100 – Q3 2009
Source: SagePoint Advisors & Capital IQ Source: SagePoint Advisors & Capital IQ
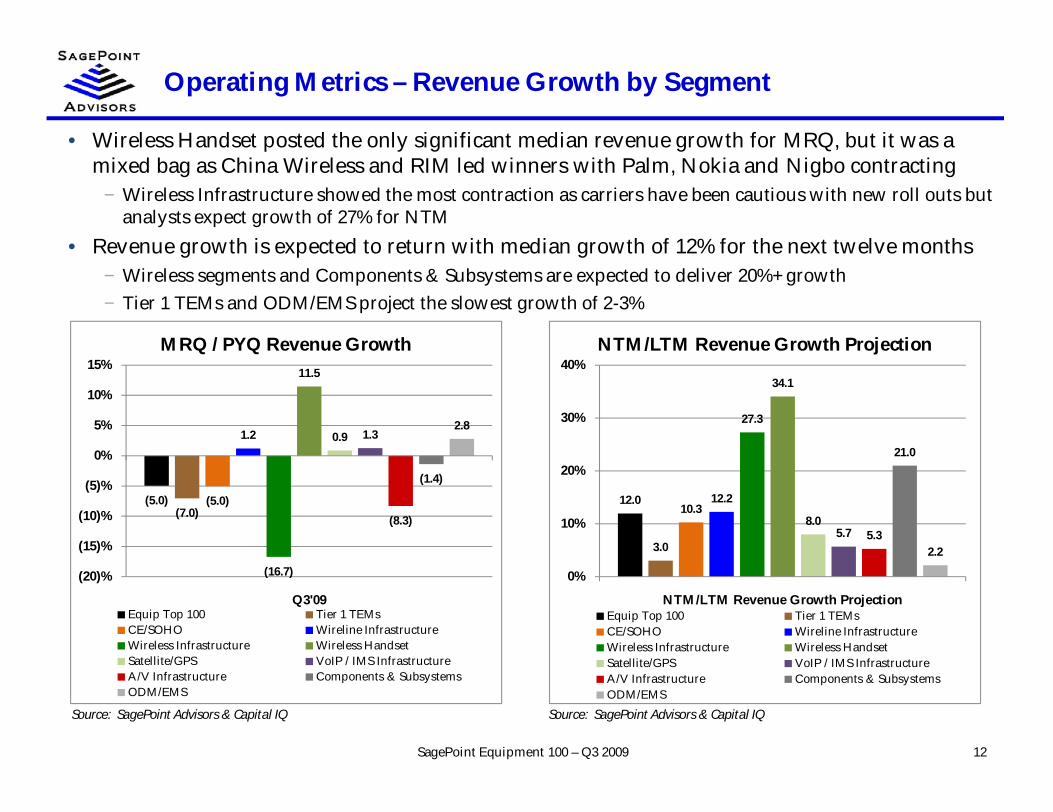
• Wireless Handset posted the only significant median revenue growth for MRQ, but it was amixed bag as China Wireless and RIM led winners with Palm, Nokia and Nigbo contracting
− Wireless Infrastructure showed the most contraction as carriers have been cautious with new roll outs butanalysts expect growth of 27% for NTM
• Revenue growth is expected to return with median growth of 12% for the next twelve months− Wireless segments and Components & Subsystems are expected to deliver 20%+ growth− Tier 1 TEMs and ODM/EMS project the slowest growth of 2-3%
(5.0)(7.0)
(5.0)
1.2
(16.7)
11.5
0.9 1.3
(8.3)
(1.4)
2.8
(20)%
(15)%
(10)%
(5)%
0%
5%
10%
15%
Q3'09
MRQ / PYQ Revenue Growth
Equip Top 100 Tier 1 TEMsCE/SOHO Wireline InfrastructureWireless Infrastructure Wireless HandsetSatellite/GPS VoIP / IMS InfrastructureA/V Infrastructure Components & SubsystemsODM/EMS
12.0
3.0
10.312.2
27.3
34.1
8.05.7 5.3
21.0
2.2
0%
10%
20%
30%
40%
NTM/LTM Revenue Growth Projection
NTM/LTM Revenue Growth Projection
Equip Top 100 Tier 1 TEMsCE/SOHO Wireline InfrastructureWireless Infrastructure Wireless HandsetSatellite/GPS VoIP / IMS InfrastructureA/V Infrastructure Components & SubsystemsODM/EMS
Operating Metrics – EPS Growth
13SagePoint Equipment 100 – Q3 2009
Source: SagePoint Advisors & Capital IQNote: Excludes companies with a net margin between -1% and 1% in the PYQ
Source: SagePoint Advisors & Capital IQNote: Excludes companies with a net margin between -1% and 1% in the PYQ
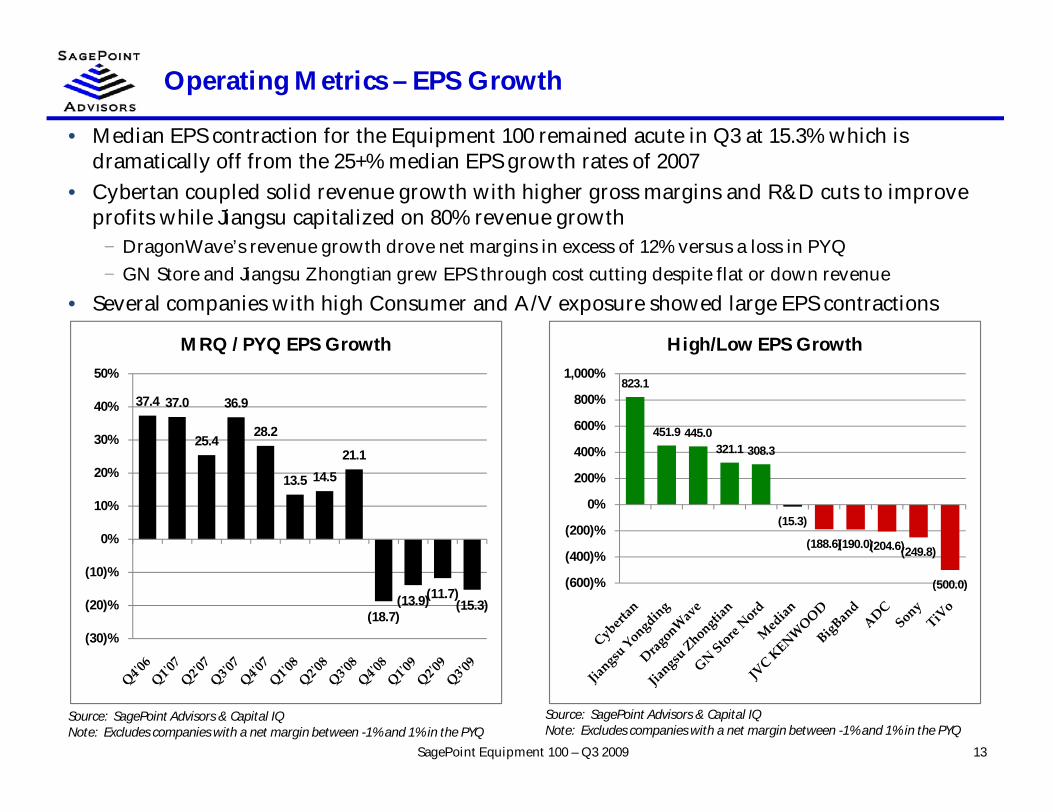
• Median EPS contraction for the Equipment 100 remained acute in Q3 at 15.3% which isdramatically off from the 25+% median EPS growth rates of 2007
• Cybertan coupled solid revenue growth with higher gross margins and R&D cuts to improveprofits while Jiangsu capitalized on 80% revenue growth
− DragonWave’s revenue growth drove net margins in excess of 12% versus a loss in PYQ− GN Store and Jiangsu Zhongtian grew EPS through cost cutting despite flat or down revenue
• Several companies with high Consumer and A/V exposure showed large EPS contractions
37.4 37.0
25.4
36.9
28.2
13.5 14.521.1
(18.7)(13.9)(11.7)
(15.3)
(30)%
(20)%
(10)%
0%
10%
20%
30%
40%
50%
MRQ / PYQ EPS Growth
823.1
451.9 445.0321.1 308.3
(15.3)
(188.6)(190.0)(204.6)(249.8)
(500.0)(600)%
(400)%
(200)%
0%
200%
400%
600%
800%
1,000%
High/Low EPS Growth
Operating Metrics – EPS Growth by Segment
14SagePoint Equipment 100 – Q3 2009
Source: SagePoint Advisors & Capital IQNote: Excludes companies with a net margin between -1% and 1% in the PYQ
Source: SagePoint Advisors & Capital IQNote: Excludes companies with a net margin between -1% and 1% in the PYQ
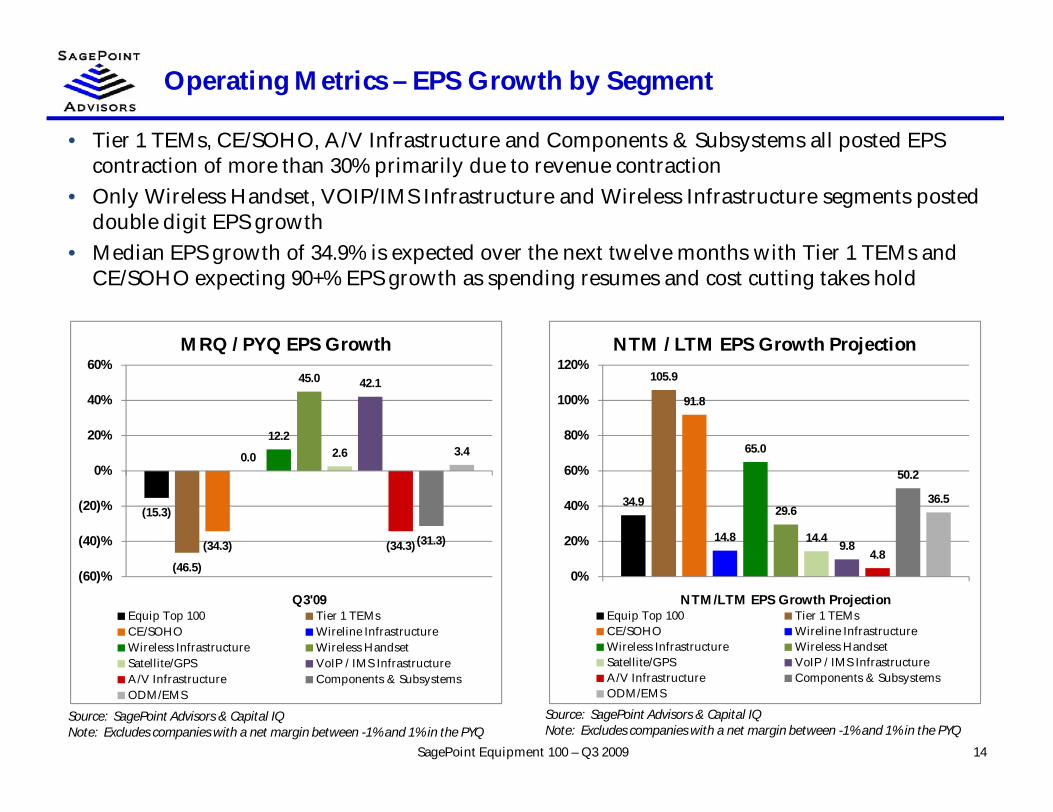
• Tier 1 TEMs, CE/SOHO, A/V Infrastructure and Components & Subsystems all posted EPScontraction of more than 30% primarily due to revenue contraction
• Only Wireless Handset, VOIP/IMS Infrastructure and Wireless Infrastructure segments posteddouble digit EPS growth
• Median EPS growth of 34.9% is expected over the next twelve months with Tier 1 TEMs andCE/SOHO expecting 90+% EPS growth as spending resumes and cost cutting takes hold
(15.3)
(46.5)
(34.3)
0.0
12.2
45.0
2.6
42.1
(34.3) (31.3)
3.4
(60)%
(40)%
(20)%
0%
20%
40%
60%
Q3'09
MRQ / PYQ EPS Growth
Equip Top 100 Tier 1 TEMsCE/SOHO Wireline InfrastructureWireless Infrastructure Wireless HandsetSatellite/GPS VoIP / IMS InfrastructureA/V Infrastructure Components & SubsystemsODM/EMS
34.9
105.9
91.8
14.8
65.0
29.6
14.49.8
4.8
50.2
36.5
0%
20%
40%
60%
80%
100%
120%
NTM/LTM EPS Growth Projection
NTM / LTM EPS Growth Projection
Equip Top 100 Tier 1 TEMsCE/SOHO Wireline InfrastructureWireless Infrastructure Wireless HandsetSatellite/GPS VoIP / IMS InfrastructureA/V Infrastructure Components & SubsystemsODM/EMS
Operating Metrics – Gross Margins
15SagePoint Equipment 100 – Q3 2009
Source: SagePoint Advisors & Capital IQ Source: SagePoint Advisors & Capital IQ
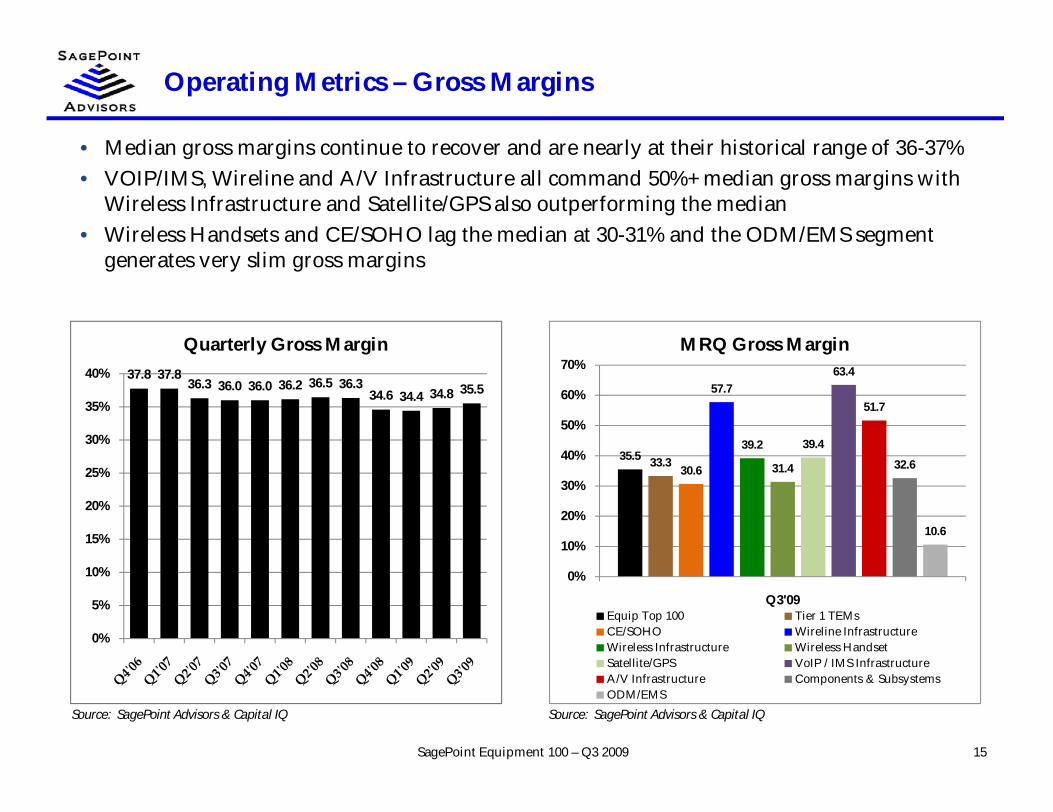
• Median gross margins continue to recover and are nearly at their historical range of 36-37%• VOIP/IMS, Wireline and A/V Infrastructure all command 50%+ median gross margins with
Wireless Infrastructure and Satellite/GPS also outperforming the median• Wireless Handsets and CE/SOHO lag the median at 30-31% and the ODM/EMS segment
generates very slim gross margins
37.8 37.836.3 36.0 36.0 36.2 36.5 36.3
34.6 34.4 34.8 35.5
0%
5%
10%
15%
20%
25%
30%
35%
40%
Quarterly Gross Margin
35.5 33.330.6
57.7
39.2
31.4
39.4
63.4
51.7
32.6
10.6
0%
10%
20%
30%
40%
50%
60%
70%
Q3'09
MRQ Gross Margin
Equip Top 100 Tier 1 TEMsCE/SOHO Wireline InfrastructureWireless Infrastructure Wireless HandsetSatellite/GPS VoIP / IMS InfrastructureA/V Infrastructure Components & SubsystemsODM/EMS
Operating Metrics – R&D as a % of Revenues
16SagePoint Equipment 100 – Q3 2009
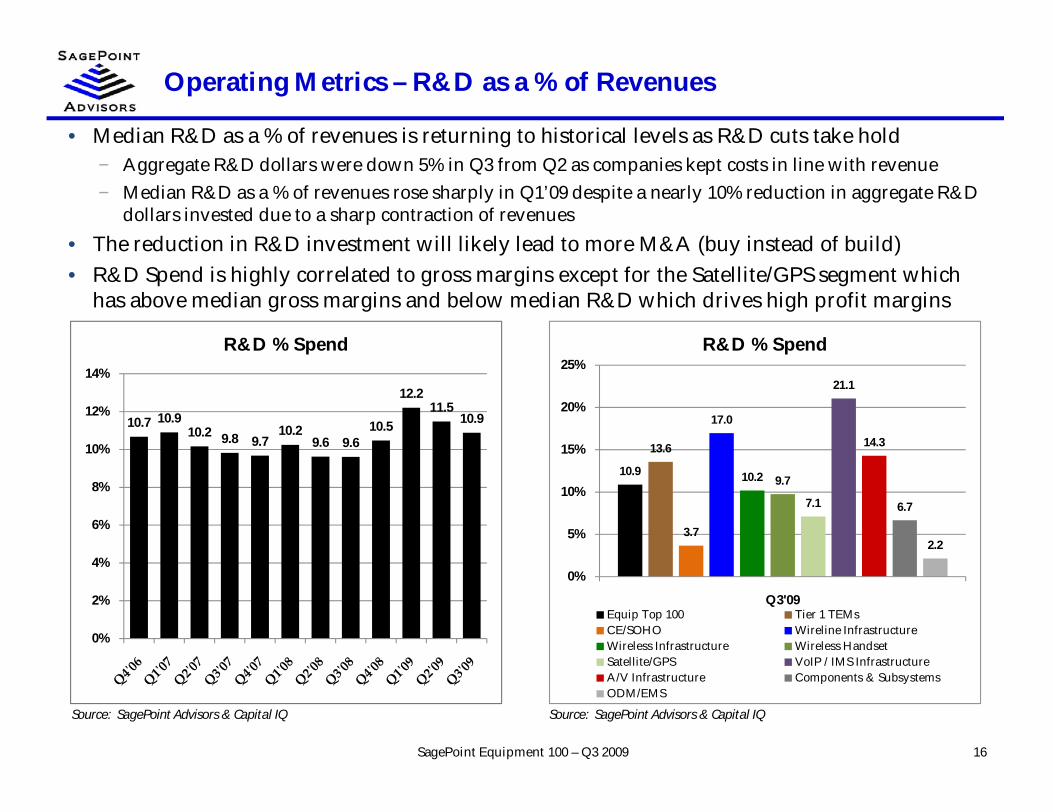
Source: SagePoint Advisors & Capital IQ Source: SagePoint Advisors & Capital IQ
• Median R&D as a % of revenues is returning to historical levels as R&D cuts take hold− Aggregate R&D dollars were down 5% in Q3 from Q2 as companies kept costs in line with revenue− Median R&D as a % of revenues rose sharply in Q1’09 despite a nearly 10% reduction in aggregate R&D
dollars invested due to a sharp contraction of revenues• The reduction in R&D investment will likely lead to more M&A (buy instead of build)• R&D Spend is highly correlated to gross margins except for the Satellite/GPS segment which
has above median gross margins and below median R&D which drives high profit margins
10.7 10.910.2 9.8 9.7
10.29.6 9.6
10.5
12.211.5
10.9
0%
2%
4%
6%
8%
10%
12%
14%
R&D % Spend
10.9
13.6
3.7
17.0
10.2 9.7
7.1
21.1
14.3
6.7
2.2
0%
5%
10%
15%
20%
25%
Q3'09
R&D % Spend
Equip Top 100 Tier 1 TEMsCE/SOHO Wireline InfrastructureWireless Infrastructure Wireless HandsetSatellite/GPS VoIP / IMS InfrastructureA/V Infrastructure Components & SubsystemsODM/EMS
Operating Metrics – SG&A as a % of Revenues
17SagePoint Equipment 100 – Q3 2009
Source: SagePoint Advisors & Capital IQ Source: SagePoint Advisors & Capital IQ
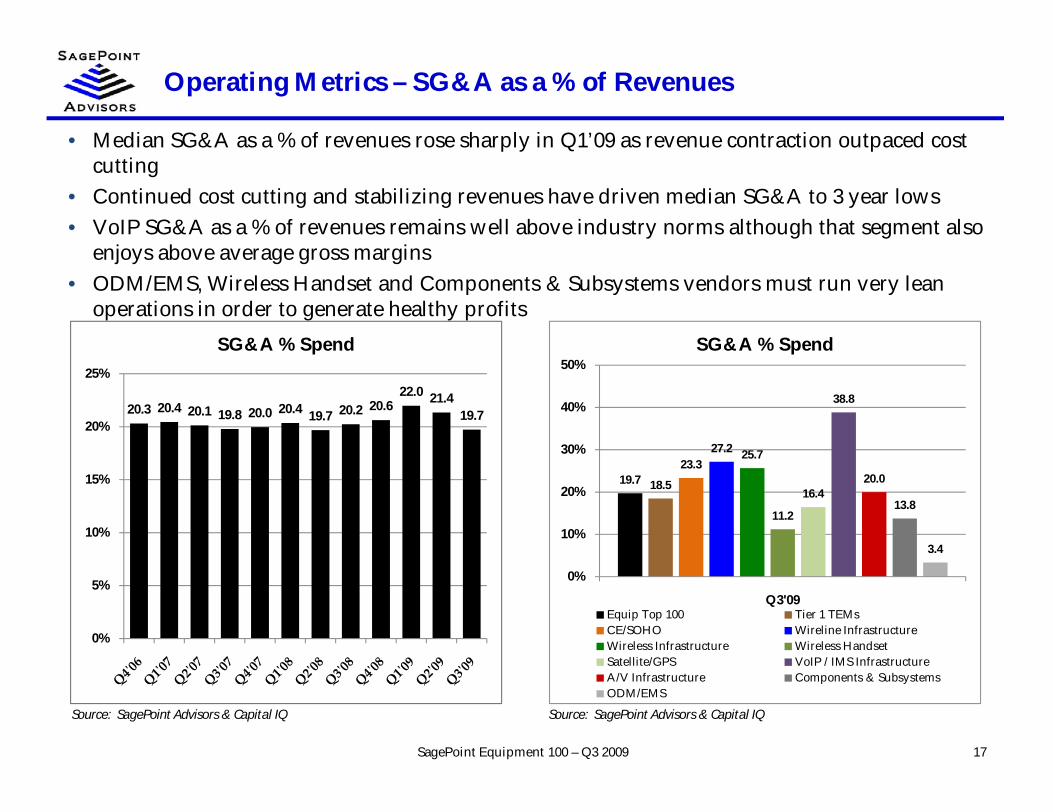
• Median SG&A as a % of revenues rose sharply in Q1’09 as revenue contraction outpaced costcutting
• Continued cost cutting and stabilizing revenues have driven median SG&A to 3 year lows• VoIP SG&A as a % of revenues remains well above industry norms although that segment also
enjoys above average gross margins• ODM/EMS, Wireless Handset and Components & Subsystems vendors must run very lean
operations in order to generate healthy profits
20.3 20.4 20.1 19.8 20.0 20.4 19.7 20.2 20.622.0 21.4
19.7
0%
5%
10%
15%
20%
25%
SG&A % Spend
19.7 18.5
23.327.2 25.7
11.2
16.4
38.8
20.0
13.8
3.4
0%
10%
20%
30%
40%
50%
Q3'09
SG&A % Spend
Equip Top 100 Tier 1 TEMsCE/SOHO Wireline InfrastructureWireless Infrastructure Wireless HandsetSatellite/GPS VoIP / IMS InfrastructureA/V Infrastructure Components & SubsystemsODM/EMS

Operating Metrics – EBITDA Margins
18SagePoint Equipment 100 – Q3 2009
Source: SagePoint Advisors & Capital IQ Source: SagePoint Advisors & Capital IQ
• Median EBITDA margins return to their historical range of 10-11% as most companies havebeen able to bring expenses in line with lower, stabilizing revenue bases
• EBITDA margins could reach three year highs if companies continue to maintain costs asrevenues return
• A/V Infrastructure, Satellite/GPS, Components & Subsystems and Wireline Infrastructure havefaired the best at maintaining margins while Wireless Infrastructure and ODM/EMS generateEBITDA margins of less than 5%
10.3 10.09.3
10.910.5 10.1
10.69.7
10.8
7.58.4
10.1
0%
2%
4%
6%
8%
10%
12%
Quarterly EBITDA Margin
10.1
7.6 8.3
12.3
3.7
6.6
14.8
6.3
18.6
14.7
4.3
0%
5%
10%
15%
20%
Q3'09
MRQ EBITDA Margin
Equip Top 100 Tier 1 TEMsCE/SOHO Wireline InfrastructureWireless Infrastructure Wireless HandsetSatellite/GPS VoIP / IMS InfrastructureA/V Infrastructure Components & SubsystemsODM/EMS
Operating Metrics – Net Margins
19SagePoint Equipment 100 – Q3 2009
Source: SagePoint Advisors & Capital IQ Source: SagePoint Advisors & Capital IQ
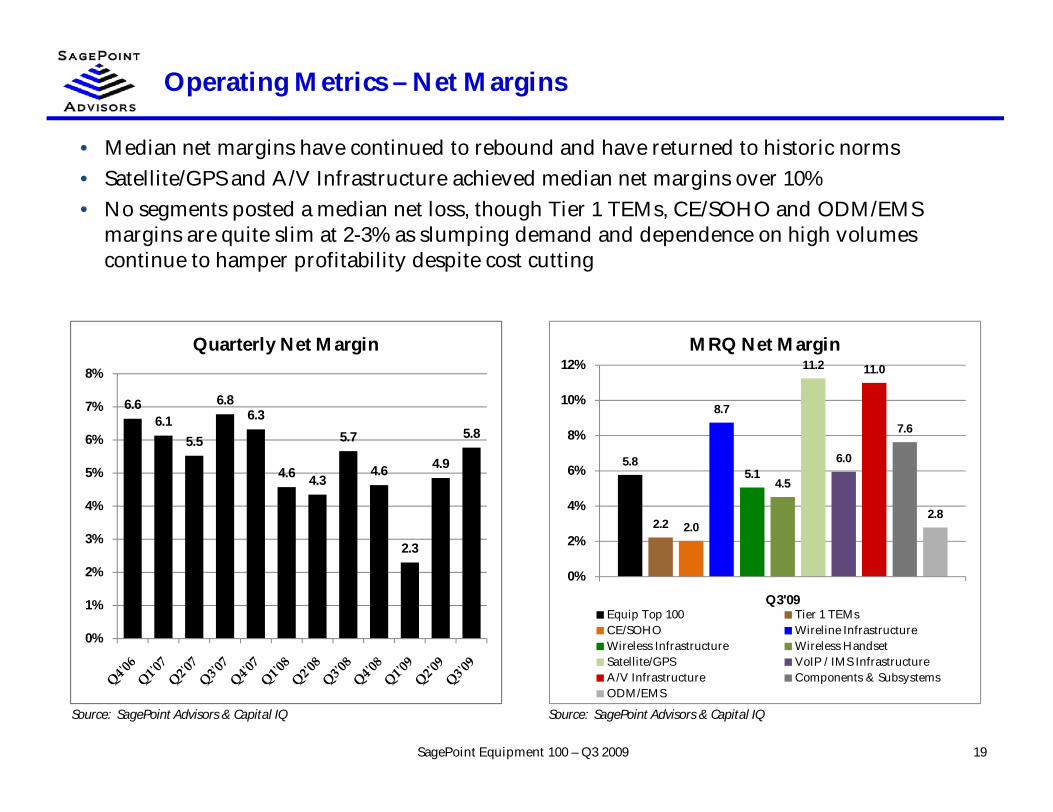
• Median net margins have continued to rebound and have returned to historic norms• Satellite/GPS and A/V Infrastructure achieved median net margins over 10%• No segments posted a median net loss, though Tier 1 TEMs, CE/SOHO and ODM/EMS
margins are quite slim at 2-3% as slumping demand and dependence on high volumescontinue to hamper profitability despite cost cutting
6.66.1
5.5
6.86.3
4.6 4.3
5.7
4.6
2.3
4.9
5.8
0%
1%
2%
3%
4%
5%
6%
7%
8%
Quarterly Net Margin
5.8
2.2 2.0
8.7
5.14.5
11.2
6.0
11.0
7.6
2.8
0%
2%
4%
6%
8%
10%
12%
Q3'09
MRQ Net Margin
Equip Top 100 Tier 1 TEMsCE/SOHO Wireline InfrastructureWireless Infrastructure Wireless HandsetSatellite/GPS VoIP / IMS InfrastructureA/V Infrastructure Components & SubsystemsODM/EMS

Valuation Metrics – LTM Revenue Multiples
20SagePoint Equipment 100 – Q3 2009
Source: SagePoint Advisors & Capital IQ Source: SagePoint Advisors & Capital IQ
• Median revenue multiples have risen for the fourth straight quarter but remain nearly 30%below 2007 highs
− Signals of recovery have led several players (e.g., Cisco, Dell, Xerox) to take advantage of bargainprices with substantial acquisitions
• Investors are betting on rapid growth at Allwin while Beijing BDStar, EVS Broadcast, NetInsight and Wuhan are expected to deliver 25%+ revenue growth and ~20%+ net margins
• 14 of the Equipment 100 still trade at less than 0.5x revenues
1.6 1.71.9
2.1
1.8
1.31.2
1.0
0.7 0.8
1.1
1.4 1.5
0.0x
0.5x
1.0x
1.5x
2.0x
2.5x
LTM Enterprise Value / Revenue
Equip Top 100
12.4
10.6
8.9
7.4 7.1
1.50.4 0.3 0.3 0.3 0.2
0.0x
2.0x
4.0x
6.0x
8.0x
10.0x
12.0x
14.0x
High/Low LTM EV/Rev Multiples

Valuation Metrics – Revenue Multiples By Segment
21SagePoint Equipment 100 – Q3 2009
Source: SagePoint Advisors & Capital IQ Source: SagePoint Advisors & Capital IQ
• Wireless Infrastructure and Wireless Handset trade at premium median LTM multiples, gettingcredit for 25%+ revenue growth expectations
• Tier 1 TEMs, CE/SOHO and ODM/EMS trade at less than 1x LTM revenues on weaker growthoutlook
• NTM revenue multiples are generally slightly smaller than LTM as 8-12% revenue growth isexpected for most segments of the Equipment 100
1.5
0.7 0.7
2.1
3.4
2.9
1.8 1.7 1.81.5
0.4
0.0x
1.0x
2.0x
3.0x
4.0x
Current
LTM Enterprise Value / Revenue
Equip Top 100 Tier 1 TEMsCE/SOHO Wireline InfrastructureWireless Infrastructure Wireless HandsetSatellite/GPS VoIP / IMS InfrastructureA/V Infrastructure Components & SubsystemsODM/EMS
1.4
0.70.5
1.9
1.6
1.2
1.61.7
1.5
1.2
0.4
0.0x
0.5x
1.0x
1.5x
2.0x
2.5x
Current
NTM Enterprise Value / Revenue
Equip Top 100 Tier 1 TEMsCE/SOHO Wireline InfrastructureWireless Infrastructure Wireless HandsetSatellite/GPS VoIP / IMS InfrastructureA/V Infrastructure Components & SubsystemsODM/EMS
Valuation Metrics – LTM EBITDA Multiples
22SagePoint Equipment 100 – Q3 2009
Source: SagePoint Advisors & Capital IQNote: Excludes companies with an LTM EBITDA margin below 7.5%
Source: SagePoint Advisors & Capital IQNote: Excludes companies with an LTM EBITDA margin below 7.5%
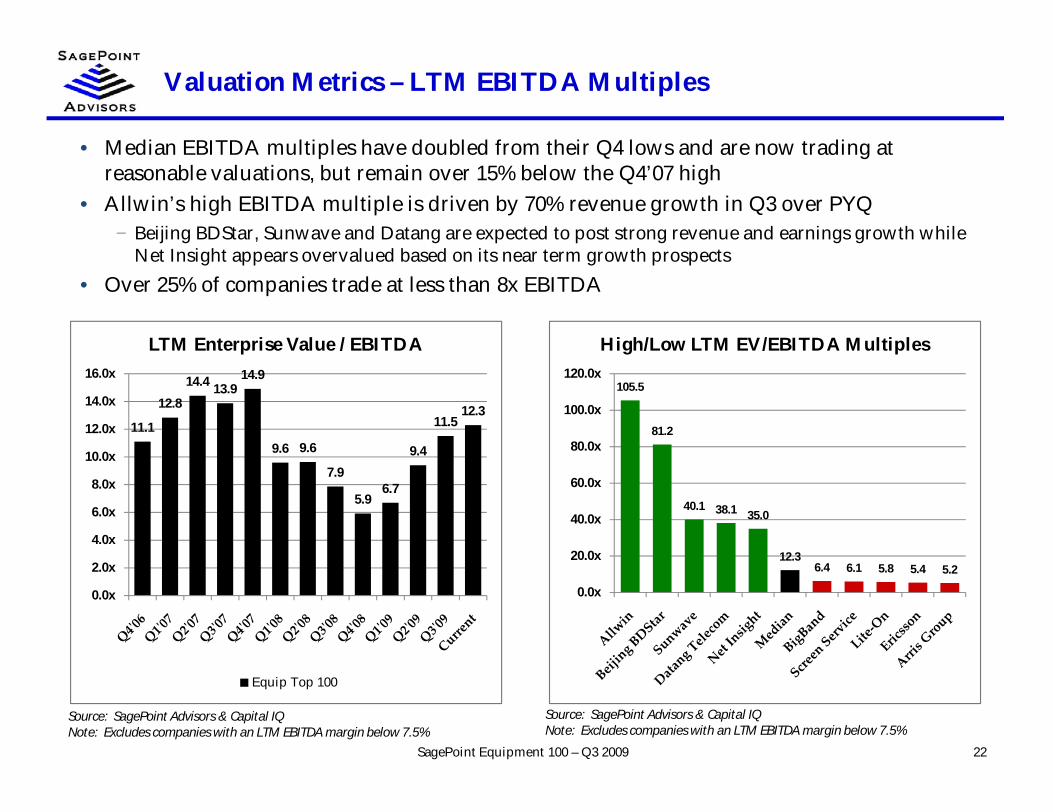
• Median EBITDA multiples have doubled from their Q4 lows and are now trading atreasonable valuations, but remain over 15% below the Q4’07 high
• Allwin’s high EBITDA multiple is driven by 70% revenue growth in Q3 over PYQ− Beijing BDStar, Sunwave and Datang are expected to post strong revenue and earnings growth while
Net Insight appears overvalued based on its near term growth prospects• Over 25% of companies trade at less than 8x EBITDA
11.1
12.814.4 13.9
14.9
9.6 9.6
7.9
5.96.7
9.4
11.512.3
0.0x
2.0x
4.0x
6.0x
8.0x
10.0x
12.0x
14.0x
16.0x
LTM Enterprise Value / EBITDA
Equip Top 100
105.5
81.2
40.1 38.1 35.0
12.36.4 6.1 5.8 5.4 5.2
0.0x
20.0x
40.0x
60.0x
80.0x
100.0x
120.0x
High/Low LTM EV/EBITDA Multiples

Valuation Metrics – EBITDA Multiples By Segment
23SagePoint Equipment 100 – Q3 2009
Source: SagePoint Advisors & Capital IQNote: Excludes companies with a projected NTM EBITDA margin below 7.5%
Source: SagePoint Advisors & Capital IQNote: Excludes companies with an LTM EBITDA margin below 7.5%
• Most Equipment segments trade at median NTM EBITDA multiples of 8-10x− Wireline Infrastructure is the exception at a median of 11.9x
• Several of the median LTM EBITDA multiples appear high because equipment vendors arejust returning to healthy profit margins and have relatively weak LTM EBITDA
12.3
6.6
10.713.1
27.5
10.412.8
17.1
10.3
17.7
5.8
0.0x
5.0x
10.0x
15.0x
20.0x
25.0x
30.0x
Current
LTM Enterprise Value / EBITDA
Equip Top 100 Tier 1 TEMsCE/SOHO Wireline InfrastructureWireless Infrastructure Wireless HandsetSatellite/GPS VoIP / IMS InfrastructureA/V Infrastructure Components & SubsystemsODM/EMS
9.58.4 8.6
11.9
9.4 9.2 9.2 9.68.9
10.6
9.3
0.0x
2.0x
4.0x
6.0x
8.0x
10.0x
12.0x
14.0x
Current
NTM Enterprise Value / EBITDA
Equip Top 100 Tier 1 TEMsCE/SOHO Wireline InfrastructureWireless Infrastructure Wireless HandsetSatellite/GPS VoIP / IMS InfrastructureA/V Infrastructure Components & SubsystemsODM/EMS
Valuation Metrics – LTM P/E Multiples
24SagePoint Equipment 100 – Q3 2009
Source: SagePoint Advisors & Capital IQNote: Excludes companies with an LTM net margin below 2.5%
Source: SagePoint Advisors & Capital IQNote: Excludes companies with an LTM net margin below 2.5%
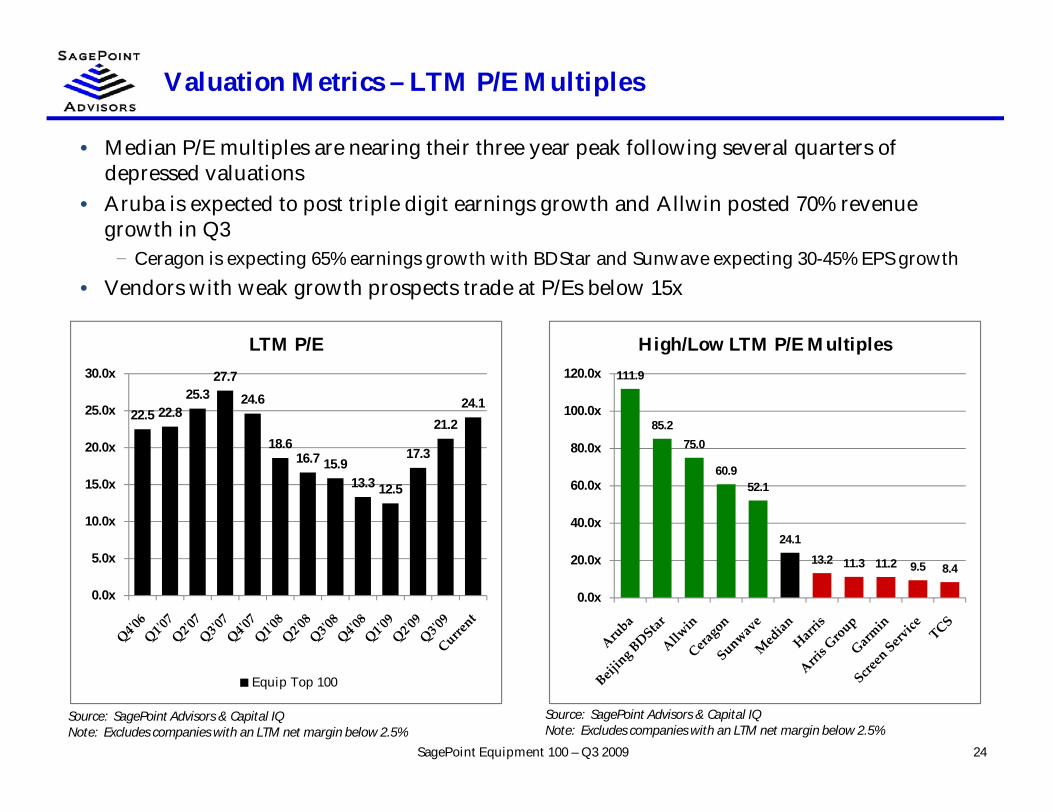
• Median P/E multiples are nearing their three year peak following several quarters ofdepressed valuations
• Aruba is expected to post triple digit earnings growth and Allwin posted 70% revenuegrowth in Q3
− Ceragon is expecting 65% earnings growth with BDStar and Sunwave expecting 30-45% EPS growth• Vendors with weak growth prospects trade at P/Es below 15x
22.5 22.825.3
27.7
24.6
18.616.7 15.9
13.3 12.5
17.3
21.224.1
0.0x
5.0x
10.0x
15.0x
20.0x
25.0x
30.0x
LTM P/E
Equip Top 100
111.9
85.275.0
60.952.1
24.1
13.2 11.3 11.2 9.5 8.4
0.0x
20.0x
40.0x
60.0x
80.0x
100.0x
120.0x
High/Low LTM P/E Multiples

Valuation Metrics – P/E Multiples By Segment
25SagePoint Equipment 100 – Q3 2009
Source: SagePoint Advisors & Capital IQNote: Excludes companies with a projected NTM net margin below 2.5%
Source: SagePoint Advisors & Capital IQNote: Excludes companies with an LTM net margin below 2.5%
• Wireless Infrastructure trades at a strong premium to other segments− Median NTM revenue growth of 26% and EPS growth of 65% merit this premium
• VoIP/IMS Infrastructure appear to trade at premium NTM P/E multiples, however, severalvendors are expecting significant earnings contraction NTM which skews the data
• Wireless Handset lags on both an LTM and NTM basis for median P/E multiple as Appleappears to be the only vendor that investors are willing to value at a high P/E multiple
24.1 26.424.0 24.8
51.0
17.419.7 17.7 19.8
24.3 22.2
0.0x
10.0x
20.0x
30.0x
40.0x
50.0x
60.0x
Current
LTM P/E
Equip Top 100 Tier 1 TEMsCE/SOHO Wireline InfrastructureWireless Infrastructure Wireless HandsetSatellite/GPS VoIP / IMS InfrastructureA/V Infrastructure Components & SubsystemsODM/EMS
18.617.1
22.124.4
31.7
14.4
18.6
28.0
20.9
17.014.4
0.0x
5.0x
10.0x
15.0x
20.0x
25.0x
30.0x
35.0x
Current
NTM P/E
Equip Top 100 Tier 1 TEMsCE/SOHO Wireline InfrastructureWireless Infrastructure Wireless HandsetSatellite/GPS VoIP / IMS InfrastructureA/V Infrastructure Components & SubsystemsODM/EMS

Balance Sheet Strength – Net Cash Position
26SagePoint Equipment 100 – Q3 2009
Source: SagePoint Advisors & Capital IQ Source: SagePoint Advisors & Capital IQ
• Median net cash position relative to market cap continues to decline as market rallies haveoutpaced the improving net cash positions of equipment companies
• Several Equipment players have significant cash reserves to draw upon for M&A as we sawin late Q3 and Q4, particularly from historically acquisitive Cisco
• The Asian conglomerates are highly leveraged and may have more difficulty financinglarge acquisitions given that debt markets remain challenging
7.5
9.1
7.16.5
7.9
10.8
9.1 9.0
11.4 11.6
10.1
8.6 8.3
0%
2%
4%
6%
8%
10%
12%
14%
Net Cash / Market Value
25,06824,796
5,8903,083 2,068
79
(2,316)(4,932)(5,162)(5,223)
(8,434)
$(15,000)
$(10,000)
$(5,000)
$0
$5,000
$10,000
$15,000
$20,000
$25,000
$30,000
High/Low Net Cash

Financial Metrics
27SagePoint Equipment 100 – Q3 2009
($ in millions, except per share data)Sto ck P rice M arket Enterprise % C hange Ent. Value/ R ev. Ent . Value/ EB IT D A P rice/ EP S Est imate Surprise N et C ash / N et D ebt / SG&A / R &D /
C o mpany N ame 1/ 8/ 10 C ap Value C ash D ebt 6/ 30/ 09 LT M N T M LT M N T M LT M N T M R evenue EP S M kt C ap EB IT D A R evenue R evenue
Equipment Top 100Equipment 100 M ean 7,940 7,663 1,863 1,586 34.0% 2.3 x 1.8 x 17.2 x 11.0 x 28.7 x 22.3 x 1.7 % 42.0 % (7.6)% (0.7) x 25.3 % 22.5 %Equipment 100 M edian 1,157 1,144 235 58 26.9% 1.5 x 1.4 x 12.1 x 9.5 x 24.1 x 18.6 x 3.0 % 19.4 % 8.3 % (0.9) x 19.9 % 10.6 %
Wireline Infrastructure3Com Corporation 7.61 3,014 2,422 704 112 60.9% 2.0 x 1.9 x 16.4 x NA 17.7 x 28.0 x 7.5 % 77.8 % 19.6 % (4.0) x 35.4 % 12.9 %ADC Telecommunications Inc. 6.73 650 779 536 664 (15.5)% 0.7 x 0.7 x 8.6 x 6.1 x NM 21.2 x NA NA (19.7)% 1.4 x 24.6 % 5.8 %ADTRAN Inc. 23.33 1,466 1,317 197 48 8.7% 2.7 x 2.5 x 11.5 x 9.8 x 19.9 x 18.6 x 3.1 % 6.6 % 10.2 % (1.3) x 20.8 % 17.1 %Blue Coat Systems Inc. 29.33 1,190 1,125 142 77 77.3% 2.4 x 2.2 x 28.3 x 12.9 x 31.9 x 20.1 x 0.4 % 12.0 % 5.4 % (1.6) x 47.1 % 16.2 %Brocade Communications Systems, Inc. 7.75 3,414 4,160 339 1,085 (1.1)% 2.1 x 1.8 x 12.4 x 8.0 x 14.6 x 13.0 x (0.0)% 15.4 % (21.8)% 2.2 x 24.1 % 18.3 %CIENA Corp. 11.93 1,098 847 1,049 798 15.3% 1.3 x 1.0 x NM NM NM NM 5.1 % (81.8)% 22.8 % NA 27.1 % 28.2 %F5 Netw orks, Inc. 52.96 4,198 3,828 370 0 53.0% 5.6 x 5.0 x 22.7 x 17.3 x 31.5 x 26.8 x 3.0 % 20.8 % 8.8 % (2.2) x 42.7 % 14.0 %Fiberhome Telecommunication Technologies Co., Ltd.3.94 1,741 1,841 175 275 64.2% 2.7 x 2.2 x NM 20.7 x 46.0 x 32.1 x NA NA (5.7)% 2.0 x 15.6 % NAInfinera Corp. 9.27 895 626 269 0 1.5% 2.0 x 1.8 x NM NM NM NM 3.6 % 75.4 % 30.0 % NA 27.3 % 28.3 %Juniper Netw orks, Inc. 26.25 13,793 11,725 2,068 0 11.2% 3.6 x 3.2 x 17.6 x 11.9 x 28.8 x 25.2 x 3.0 % 11.1 % 15.0 % (3.1) x 26.4 % 22.5 %Riverbed Technology, Inc. 23.65 1,637 1,340 297 0 2.0% 3.6 x 3.1 x 37.9 x 14.1 x 36.4 x 31.6 x 5.2 % 24.2 % 18.1 % (8.4) x 52.4 % 17.0 %RuggedCom Inc. 19.36 235 196 38 0 (17.1)% 3.0 x 2.4 x 12.2 x 12.8 x 24.8 x 25.1 x (2.8)% (40.1)% 16.3 % (2.4) x 31.6 % 9.4 %Sandvine Corporation 1.51 205 124 81 0 31.7% 1.9 x 1.6 x NM NM NM NM 8.4 % (6.7)% 39.6 % NA 52.8 % 36.8 %Sycamore Netw orks Inc. 20.68 587 (57) 644 0 (33.9)% NM NM NM NM NM NM (8.1)% 0.0 % 109.6 % NA 32.6 % 55.5 %Tekelec 15.67 1,055 702 353 0 (6.9)% 1.5 x 1.6 x 6.7 x 5.6 x 15.2 x 15.9 x 6.1 % 35.0 % 33.5 % (3.4) x 26.4 % 21.1 %Tellabs Inc. 6.18 2,387 1,132 1,494 239 7.9% 0.7 x 0.7 x 6.5 x 6.9 x 23.8 x 23.7 x (1.2)% 0.0 % 52.6 % (7.3) x 16.7 % 16.9 %
M ean 2,348 2,007 547 206 16.2% 2.4 x 2.1 x 16.4 x 11.5 x 26.4 x 23.4 x 2.4 % 10.7 % 20.9 % (2.3) x 31.5 % 21.3 %M edian 1,328 1,129 346 24 8.3% 2.1 x 1.9 x 12.4 x 11.9 x 24.8 x 24.4 x 3.0 % 11.5 % 17.2 % (2.3) x 27.2 % 17.1 %
($ in millions, except per share data)R evenue EB IT D A EP S M R Q/ P YQ Gro wth N T M / LT M Gro wth LQ M argin
C o mpany N ame M R Q LT M N T M M R Q LT M N T M M R Q LT M N T M R evenue EB IT D A EP S R evenue EB IT D A EP S Gro ss EB IT D A N et
Equipment Top 100Equipment 100 M ean 1,857 7,501 8,417 221 664 998 0.15 (0.20) 0.85 11.8 % 24.9 % 17.5 % 18.9 % 51.5 % 73.8 % 39.3 % (0.1)% (0.3)%Equipment 100 M edian 171 661 869 19 66 131 0.04 0.10 0.29 (2.1)% 5.5 % (15.3)% 9.0 % 36.0 % 34.9 % 37.2 % 10.3 % 5.7 %
Wireline Infrastructure3Com Corporation 322 1,232.4 1,257.6 44 147.6 NA 0.08 0.43 0.27 (9.1)% 14.3 % (59.5)% 2.0 % NA (36.7)% 60.1 % 13.8 % 10.0 %ADC Telecommunications Inc. 184 1,114.1 1,117.5 25 90.7 128.3 (0.20) (4.69) 0.32 (47.8)% 38.1 % (204.6)% 0.3 % 41.5 % 106.8 % 33.9 % 13.4 % (10.4)%ADTRAN Inc. 124 484.2 522.0 29 114.3 134.4 0.34 1.17 1.26 10.5 % 19.9 % (2.8)% 7.8 % 17.5 % 7.4 % 59.0 % 23.2 % 17.4 %Blue Coat Systems Inc. 120 459.6 515.2 17 39.8 87.0 0.29 0.92 1.46 1.2 % 45.8 % 7.4 % 12.1 % 118.8 % 58.3 % 73.3 % 13.8 % 10.0 %Brocade Communications Systems, Inc. 522 1,952.9 2,261.3 84 336.4 518.8 0.15 0.53 0.60 30.9 % (24.0)% (25.0)% 15.8 % 54.2 % 12.8 % 51.9 % 16.2 % 14.1 %CIENA Corp. 176 652.6 811.5 (13) (59.0) 45.5 (0.12) (0.51) (0.12) (1.9)% NM (20.0)% 24.3 % 177.0 % 76.9 % 44.0 % (7.1)% (2.6)%F5 Netw orks, Inc. 191 678.7 768.0 50 168.3 220.9 0.50 1.68 1.98 15.5 % 47.6 % 105.0 % 13.2 % 31.3 % 17.7 % 79.5 % 26.0 % 21.0 %Fiberhome Telecommunication Technologies Co., Ltd. 197 669.7 825.6 18 49.0 88.8 0.02 0.09 0.12 63.1 % 109.4 % 97.7 % 23.3 % 81.4 % 43.2 % 23.6 % 9.0 % 4.4 %Infinera Corp. 83 318.3 357.6 (12) (57.5) (52.8) (0.03) (0.50) (0.21) (30.8)% (170.6)% NM 12.4 % 8.2 % 58.4 % 36.5 % (14.1)% (3.4)%Juniper Netw orks, Inc. 824 3,298.0 3,621.2 170 666.6 981.3 0.23 0.91 1.04 (13.0)% (29.4)% (28.1)% 9.8 % 47.2 % 14.6 % 65.2 % 20.6 % 15.0 %Riverbed Technology, Inc. 102 373.5 435.1 11 35.3 95.0 0.19 0.65 0.75 17.9 % NM 26.7 % 16.5 % 169.1 % 15.1 % 76.1 % 10.4 % 13.4 %RuggedCom Inc. 17 66.0 83.6 3 16.2 15.3 0.10 0.78 0.77 16.4 % (29.6)% (61.5)% 26.6 % (5.0)% (1.2)% 59.1 % 18.0 % 7.5 %Sandvine Corporation 18 65.0 76.5 (3) (10.7) (5.8) (0.03) (0.11) (0.08) 20.6 % NM 32.8 % 17.6 % 46.0 % 21.2 % 72.8 % (17.2)% (22.0)%Sycamore Netw orks Inc. 16 67.6 62.5 (4) (29.7) (18.9) (0.10) (0.60) (0.55) 1.3 % 59.3 % 0.0 % (7.5)% 36.4 % 8.3 % 50.4 % (24.6)% (18.2)%Tekelec 115 465.7 451.8 28 104.4 126.3 0.27 1.03 0.99 8.4 % 36.2 % 42.1 % (3.0)% 20.9 % (4.1)% 67.7 % 24.5 % 16.0 %Tellabs Inc. 389 1,544.7 1,521.6 44 172.9 164.0 0.06 0.26 0.26 (8.2)% 21.7 % 50.0 % (1.5)% (5.1)% 0.4 % 41.7 % 11.3 % 6.1 %
M ean 213 840 918 31 112 169 0.11 0.13 0.55 4.7 % 10.7 % (2.7)% 10.6 % 56.0 % 24.9 % 55.9 % 8.6 % 4.9 %M edian 150 568 645 21 70 95 0.09 0.48 0.46 4.8 % 21.7 % 0.0 % 12.2 % 41.5 % 14.8 % 59.1 % 13.6 % 8.7 %

Financial Metrics
28SagePoint Equipment 100 – Q3 2009
($ in millions, except per share data)Sto ck P rice M arket Enterprise % C hange Ent. Value/ R ev. Ent . Value/ EB IT D A P rice/ EP S Est imate Surprise N et C ash / N et D ebt / SG&A / R &D /
C o mpany N ame 1/ 8/ 10 C ap Value C ash D ebt 6/ 30/ 09 LT M N T M LT M N T M LT M N T M R evenue EP S M kt C ap EB IT D A R evenue R evenue
T ier 1 T EM sAlcatel-Lucent 3.75 8,483 8,514 7,720 7,750 49.8% 0.4 x 0.4 x NM 5.0 x NM NM (5.4)% (53.8)% (0.4)% 0.0 x 18.2 % 16.5 %Cisco Systems, Inc. 24.66 141,859 116,791 35,365 10,297 32.2% 3.4 x 3.0 x 13.4 x 9.3 x 19.1 x 17.1 x 3.1 % 16.5 % 17.7 % (2.9) x 27.0 % 13.6 %Fujitsu Ltd. 6.57 13,572 18,504 4,778 9,710 20.3% 0.4 x 0.3 x NM NM NM NM NA NA (36.3)% 1.5 x 24.9 % NALM Ericsson Telephone Co. 9.76 31,142 25,252 11,157 5,267 (0.0)% 0.9 x 0.9 x 5.2 x 6.7 x 33.6 x 13.0 x (8.6)% NA 18.9 % (1.2) x NA NAMotorola Inc. 7.76 17,933 14,850 7,115 4,032 17.0% 0.6 x 0.6 x NM 7.7 x NM 26.9 x (1.6)% 233.3 % 17.2 % (2.7) x 14.7 % 14.1 %NEC Corp. 2.64 6,757 15,191 2,978 11,412 (32.9)% 0.4 x 0.4 x NM NM NM NM NA NA (124.8)% 6.7 x 22.1 % 8.0 %Nokia Corp. 13.26 49,188 47,972 11,542 10,325 (9.4)% 0.8 x 0.8 x 8.0 x 9.2 x 13.9 x 14.4 x (2.5)% 27.8 % 2.5 % (0.2) x 10.9 % 12.8 %ZTE Corp. 6.35 11,637 13,952 1,214 3,530 54.5% 1.7 x 1.3 x NM 16.5 x 39.3 x 26.8 x NA NA (19.9)% 4.3 x 18.7 % 9.3 %
M ean 35,071 32,628 10,234 7,790 16.4% 1.1 x 1.0 x 8.8 x 9.1 x 26.5 x 19.7 x (3.0)% 56.0 % (15.6)% 0.7 x 19.5 % 12.4 %M edian 15,752 16,848 7,417 8,730 18.7% 0.7 x 0.7 x 8.0 x 8.4 x 26.4 x 17.1 x (2.5)% 22.2 % 1.1 % (0.1) x 18.7 % 13.2 %
C E/ SOH OApple Inc. 211.98 191,916 167,120 24,796 0 48.8% 4.1 x 3.7 x 16.7 x 15.6 x 33.8 x 27.0 x 30.3 % 54.9 % 12.9 % (2.5) x 8.2 % 2.5 %D-Link Corp. 1.06 685 586 136 37 48.1% 0.6 x 0.5 x NM NM NM 18.6 x NA NA 14.4 % NA 26.3 % 2.3 %JVC KENWOOD Holdings, Inc. 0.47 458 1,287 496 1,324 (33.8)% 0.2 x 0.3 x NM NM NM NM NA NA (180.9)% 14.7 x 35.3 % NAKoninklijke Philips Electronics NV 30.16 29,325 28,951 6,560 6,186 63.9% 0.9 x 0.8 x 9.7 x 8.6 x NM 25.6 x 3.3 % 322.6 % 1.3 % (0.1) x 23.3 % 6.4 %LG Electronics Inc. 98.29 14,143 24,675 4,775 15,307 7.0% 0.5 x 0.5 x 4.0 x 3.2 x NA 7.2 x NA NA (74.5)% 1.7 x NA NANetgear Inc. 22.44 777 542 235 0 55.7% 0.9 x 0.8 x NM 9.7 x NM 26.5 x 9.7 % 550.0 % 30.2 % (6.4) x 20.0 % 4.3 %Panasonic Corporation 14.78 30,595 31,308 16,668 17,381 9.3% 0.4 x 0.4 x NM NM NM NM (2.0)% 152.1 % (2.3)% 0.3 x 25.1 % NAPioneer Corp. 3.32 680 1,966 729 2,015 11.3% 0.4 x 0.4 x NM NM NM NM NA NA (189.2)% NA 24.9 % NASharp Corporation 12.73 14,008 19,170 3,798 8,960 22.3% 0.7 x 0.6 x NM 5.1 x NM NM NA NA (36.9)% 2.7 x 14.7 % 1.6 %Sony Corporation 30.25 30,358 35,581 13,253 18,476 15.4% 0.5 x 0.5 x NM NM NM NM (3.9)% 28.0 % (17.2)% 4.3 x 22.3 % NAVtech Holdings Ltd. 9.58 2,366 2,139 230 3 40.4% 1.5 x 1.4 x 10.0 x 8.4 x 14.2 x 11.3 x NA NA 9.6 % (1.1) x 17.1 % 3.7 %
M ean 28,665 28,484 6,516 6,335 26.2% 1.0 x 0.9 x 10.1 x 8.4 x 24.0 x 19.4 x 7.5 % 221.5 % (39.3)% 1.5 x 21.7 % 3.5 %M edian 14,008 19,170 3,798 2,015 22.3% 0.6 x 0.5 x 9.9 x 8.5 x 24.0 x 22.1 x 3.3 % 152.1 % (2.3)% 0.3 x 22.8 % 3.1 %
($ in millions, except per share data)R evenue EB IT D A EP S M R Q/ P YQ Gro wth N T M / LT M Gro wth LQ M argin
C o mpany N ame M R Q LT M N T M M R Q LT M N T M M R Q LT M N T M R evenue EB IT D A EP S R evenue EB IT D A EP S Gro ss EB IT D A N et
T ier 1 T EM sAlcatel-Lucent 5,392 23,607.5 22,317.9 167 728.2 1,710.1 (0.09) (0.21) 0.04 (5.8)% (49.8)% NM (5.5)% NM 120.8 % 33.4 % 3.1 % (3.7)%Cisco Systems, Inc. 9,021 34,807.0 38,649.5 2,553 8,733.0 12,618.0 0.36 1.29 1.44 (12.7)% (11.3)% (14.3)% 11.0 % 44.5 % 11.6 % 65.3 % 28.3 % 23.4 %Fujitsu Ltd. 12,767 49,464.4 53,283.9 933 3,334.0 3,942.4 0.37 (0.37) 0.44 6.0 % (6.6)% NM 7.7 % 18.2 % 217.3 % 26.5 % 7.3 % 6.3 %LM Ericsson Telephone Co. 8,152 28,876.3 29,623.1 1,481 4,871.9 3,756.2 0.04 0.29 0.75 (4.6)% 6.0 % (71.7)% 2.6 % (22.9)% 158.0 % 100.0 % 18.2 % 3.1 %Motorola Inc. 5,453 23,457.0 23,197.6 433 1,141.0 1,926.8 0.02 (0.08) 0.29 (27.1)% NM (60.0)% (1.1)% NM NM 33.2 % 7.9 % 0.9 %NEC Corp. 9,782 41,816.1 39,748.9 454 1,260.8 2,236.2 (0.05) (1.78) 0.10 (8.0)% NM NM (4.9)% NM 105.9 % 30.4 % 4.6 % (1.1)%Nokia Corp. 14,345 60,916.9 58,257.8 1,709 6,024.7 5,237.2 0.25 0.96 0.92 (16.7)% (45.9)% (46.5)% (4.4)% (13.1)% (3.8)% 31.4 % 11.9 % 6.4 %ZTE Corp. 2,216 8,317.2 10,353.4 131 541.4 846.7 0.03 0.16 0.24 43.2 % 22.3 % 59.1 % 24.5 % 56.4 % 47.1 % 34.5 % 5.9 % 2.7 %
M ean 8,391 33,908 34,429 983 3,329 4,034 0.12 0.03 0.53 (3.2)% (14.2)% (26.7)% 3.7 % 16.6 % 93.8 % 44.3 % 10.9 % 4.8 %M edian 8,587 31,842 34,136 693 2,297 2,996 0.04 0.04 0.36 (6.9)% (8.9)% (46.5)% 0.7 % 18.2 % 105.9 % 33.3 % 7.6 % 2.9 %
C E/ SOH OApple Inc. 15,683 40,340.0 45,000.9 4,934 10,001.0 10,742.0 1.82 6.28 7.84 32.0 % 50.9 % 45.0 % 11.6 % 7.4 % 24.8 % 40.9 % 31.5 % 10.7 %D-Link Corp. 260 922.4 1,073.6 8 (4.0) 43.7 0.01 0.01 0.06 (3.1)% (53.4)% (42.6)% 16.4 % NM NM 30.9 % 3.0 % 3.1 %JVC KENWOOD Holdings, Inc. 1,172 6,548.7 4,642.1 0 56.5 191.8 (0.16) (0.87) (0.14) NM (99.7)% (188.6)% (29.1)% NM 83.4 % 30.4 % 0.0 % (12.9)%Koninklijke Philips Electronics NV 10,409 33,234.0 34,275.9 1,410 2,985.3 3,360.9 0.27 (1.49) 1.18 (2.3)% 21.0 % NM 3.1 % 12.6 % 179.1 % 37.3 % 13.5 % 2.4 %LG Electronics Inc. NA 50,099.3 54,275.0 NA 6,122.0 7,743.5 NA 0.00 13.74 NA NA NM 8.3 % 26.5 % NM NA NA NANetgear Inc. 171 629.1 714.0 17 36.6 56.0 0.26 0.07 0.85 (4.6)% (5.3)% 62.5 % 13.5 % 52.8 % NM 32.6 % 10.1 % 5.3 %Panasonic Corporation 19,423 75,497.0 80,845.7 1,279 2,062.5 4,890.1 0.03 (2.72) 0.01 (6.1)% (36.4)% (86.9)% 7.1 % NM 100.2 % 27.9 % 6.6 % 0.4 %Pioneer Corp. 1,207 4,862.5 4,888.9 (39) (221.0) 350.1 (2.00) (6.35) (1.36) (22.9)% NM (25.9)% 0.5 % NM 78.6 % 11.4 % (3.2)% (34.0)%Sharp Corporation 7,716 28,762.0 30,886.5 988 1,914.0 3,784.6 0.07 (1.63) 0.27 0.4 % 14.8 % NM 7.4 % 97.7 % 116.7 % 21.9 % 12.8 % 1.1 %Sony Corporation 18,566 77,560.3 77,875.0 945 1,222.6 4,782.2 (0.29) (2.23) 0.09 (5.0)% (16.1)% (249.8)% 0.4 % NM 104.1 % 21.7 % 5.1 % (1.6)%Vtech Holdings Ltd. 369 1,407.7 1,530.0 59 213.8 254.0 0.19 0.67 0.85 (5.2)% 30.6 % 32.2 % 8.7 % 18.8 % 26.2 % 34.5 % 16.0 % 12.4 %
M ean 7,498 29,078 30,546 960 2,217 3,291 0.02 (0.75) 2.12 (1.9)% (10.4)% (56.8)% 4.4 % 36.0 % 89.1 % 28.9 % 9.5 % (1.3)%M edian 4,461 28,762 30,886 502 1,223 3,361 0.05 (0.87) 0.27 (4.6)% (5.3)% (34.3)% 7.4 % 22.6 % 91.8 % 30.6 % 8.3 % 1.7 %

Financial Metrics
29SagePoint Equipment 100 – Q3 2009
($ in millions, except per share data)Sto ck P rice M arket Enterprise % C hange Ent. Value/ R ev. Ent . Value/ EB IT D A P rice/ EP S Est imate Surprise N et C ash / N et D ebt / SG&A / R &D /
C o mpany N ame 1/ 8/ 10 C ap Value C ash D ebt 6/ 30/ 09 LT M N T M LT M N T M LT M N T M R evenue EP S M kt C ap EB IT D A R evenue R evenue
Wireless InfrastructureAirvana, Inc. 7.57 476 300 176 0 19.6% 3.7 x 1.6 x NM 6.1 x NM 11.8 x (40.6)% (223.9)% 37.0 % NA 281.8 % 676.6 %Allw in Telecommunication Co., Ltd. 2.74 293 267 26 0 50.5% 10.6 x NA 111.2 x NA 75.0 x NA NA NA 8.9 % (10.8) x 16.3 % NAAruba Netw orks, Inc. 11.19 989 854 136 0 28.0% 4.2 x 3.3 x NM 24.7 x 111.9 x 43.4 x 2.5 % 11.1 % 13.7 % NA 55.3 % 20.5 %Ascom Holding AG 10.47 364 244 121 0 (16.9)% 0.5 x 0.4 x 6.1 x 3.9 x 13.3 x 11.4 x NA NA 33.2 % (3.0) x 28.1 % 7.8 %Ceragon Netw orks Ltd. 12.17 442 358 84 0 83.6% 1.9 x 1.7 x NM NM 60.9 x 36.9 x 0.6 % 42.9 % 19.0 % (13.8) x 19.7 % 10.6 %Datang Telecom Technology Co., Ltd. 3.04 1,334 1,588 73 327 106.4% 3.4 x 2.6 x 39.0 x NA NM 84.7 x NA NA (19.0)% 6.2 x 16.9 % NADigi International Inc. 9.47 234 157 77 0 (2.9)% 0.9 x 0.9 x 9.6 x 5.9 x 49.8 x 33.2 x 5.0 % (57.1)% 32.7 % (4.7) x 29.5 % 15.1 %DragonWave Inc. 13.48 487 389 98 0 247.6% 3.5 x 2.0 x 25.8 x 11.0 x NM 15.0 x 14.3 % 84.2 % 20.2 % (6.5) x 12.0 % 8.0 %Echelon Corporation 11.81 484 433 76 26 39.3% 4.3 x 3.1 x NM NM NM NM 3.3 % 18.0 % 10.5 % NA 38.0 % 37.4 %GN Store Nord A/S 5.69 1,158 1,381 35 258 42.5% 1.4 x 1.5 x NM 12.7 x NM 30.2 x NA NA (19.3)% 4.0 x 42.2 % 8.8 %Harris Stratex Netw orks, Inc. 7.47 440 328 133 21 15.3% 0.5 x 0.6 x NM NM 22.6 x NM (7.6)% 77.3 % 25.5 % (12.2) x 25.7 % 8.9 %Plantronics, Inc. 26.21 1,288 971 317 0 38.6% 1.4 x 1.6 x 13.9 x 7.8 x 30.8 x 16.3 x 4.8 % 25.8 % 24.6 % (4.5) x 22.6 % 8.9 %Sunw ave Communications Co.,Ltd. 4.28 574 589 45 60 84.0% 5.9 x 4.3 x 37.9 x 28.7 x 52.1 x 40.1 x NA NA (2.6)% 1.0 x 19.0 % NA
M ean 659 605 107 53 56.6% 3.3 x 2.0 x 34.8 x 12.6 x 52.1 x 32.3 x (2.2)% (2.7)% 14.2 % (4.4) x 46.7 % 80.3 %M edian 484 389 84 0 39.3% 3.4 x 1.6 x 25.8 x 9.4 x 51.0 x 31.7 x 2.9 % 21.9 % 19.0 % (4.6) x 25.7 % 9.7 %
($ in millions, except per share data)R evenue EB IT D A EP S M R Q/ P YQ Gro wth N T M / LT M Gro wth LQ M argin
C o mpany N ame M R Q LT M N T M M R Q LT M N T M M R Q LT M N T M R evenue EB IT D A EP S R evenue EB IT D A EP S Gro ss EB IT D A N et
Wireless InfrastructureAirvana, Inc. 3 80.1 192.2 (25) (27.5) 49.4 (0.27) (0.25) 0.64 (66.9)% (37.9)% (42.1)% 139.8 % 279.6 % 356.0 % (6.4)% (924.5)% (617.5)%Allw in Telecommunication Co., Ltd. 6 25.2 NA 0 2.4 NA 0.00 0.04 NA 69.1 % NA 301.8 % NA NA NA 14.6 % 0.2 % 8.5 %Aruba Netw orks, Inc. 58 204.4 255.7 (2) (10.5) 34.6 0.04 0.10 0.26 9.8 % 50.0 % 100.0 % 25.1 % 431.1 % 158.0 % 67.7 % (3.8)% 6.1 %Ascom Holding AG 108 455.7 580.8 4 40.0 62.3 0.16 0.79 0.92 (11.3)% (49.8)% (19.6)% 27.5 % 55.8 % 16.5 % 39.2 % 3.3 % 5.1 %Ceragon Netw orks Ltd. 45 187.6 209.3 2 6.1 12.9 0.05 0.20 0.33 (23.0)% (59.5)% (54.5)% 11.6 % NM 65.0 % 31.8 % 3.4 % 4.0 %Datang Telecom Technology Co., Ltd. 103 461.9 602.5 7 40.7 NA 0.01 0.02 0.04 33.5 % (46.4)% 18.4 % 30.4 % NA 90.9 % 21.9 % 7.2 % 3.5 %Digi International Inc. 43 167.5 181.1 4 16.3 26.6 0.03 0.19 0.29 3.9 % 38.3 % (78.3)% 8.1 % 63.0 % 50.0 % 53.1 % 10.3 % 1.7 %DragonWave Inc. 53 112.0 198.0 12 15.1 35.2 0.19 0.05 0.90 514.1 % 875.3 % 445.0 % 76.7 % 134.0 % 1,611.3 % 42.9 % 23.7 % 12.3 %Echelon Corporation 24 101.3 139.5 (6) (26.8) (15.5) (0.20) (0.84) (0.55) (19.7)% (36.7)% (53.8)% 37.7 % 42.2 % 34.0 % 43.5 % (25.1)% (34.4)%GN Store Nord A/S 218 975.5 929.7 15 55.8 108.3 0.11 0.02 0.19 (16.7)% NM 308.3 % (4.7)% 94.2 % NM 54.0 % 6.8 % 10.0 %Harris Stratex Netw orks, Inc. 120 604.1 543.5 4 9.2 30.3 (0.01) 0.33 0.16 (38.7)% (78.0)% (105.3)% (10.0)% NM (50.3)% 33.2 % 3.7 % (0.5)%Plantronics, Inc. 166 670.7 616.1 33 70.0 123.7 0.40 0.85 1.61 (9.2)% NM 12.2 % (8.1)% 76.6 % 88.9 % 48.4 % 19.8 % 12.0 %Sunw ave Communications Co.,Ltd. 29 100.1 136.6 5 15.6 20.5 0.02 0.08 0.11 154.5 % 216.3 % 32.0 % 36.4 % 31.9 % 29.9 % 34.6 % 16.5 % 7.5 %
M ean 75 319 382 4 16 44 0.04 0.12 0.41 46.1 % 87.2 % 66.5 % 30.9 % 134.3 % 222.8 % 36.8 % (66.0)% (44.8)%M edian 53 188 233 4 15 35 0.03 0.08 0.27 (9.2)% (37.3)% 12.2 % 26.3 % 76.6 % 65.0 % 39.2 % 3.7 % 5.1 %

Financial Metrics
30SagePoint Equipment 100 – Q3 2009
($ in millions, except per share data)Sto ck P rice M arket Enterprise % C hange Ent. Value/ R ev. Ent . Value/ EB IT D A P rice/ EP S Est imate Surprise N et C ash / N et D ebt / SG&A / R &D /
C o mpany N ame 1/ 8/ 10 C ap Value C ash D ebt 6/ 30/ 09 LT M N T M LT M N T M LT M N T M R evenue EP S M kt C ap EB IT D A R evenue R evenue
Wireless H andsetApple Inc. 211.98 191,916 167,120 24,796 0 48.8% 4.1 x 3.7 x 16.7 x 15.6 x 33.8 x 27.0 x 30.3 % 54.9 % 12.9 % (2.5) x 8.2 % 2.5 %China Wireless Technologies Ltd. 0.23 475 510 21 56 257.8% 3.1 x 1.5 x NM 10.3 x NM 17.8 x NA NA (7.2)% 9.6 x 31.6 % NAChina Zhenhua (Group) Science & Technology, Ltd.2.06 736 751 74 89 87.3% 2.3 x NA NM NA NM NA NA NA (2.0)% 0.8 x 11.2 % NALG Electronics Inc. 98.29 14,143 24,675 4,775 15,307 7.0% 0.5 x 0.5 x 4.0 x 3.2 x NA 7.2 x NA NA (74.5)% 1.7 x NA NANingbo Bird Co., Ltd 0.71 542 488 87 33 12.7% 2.9 x NA NM NA NM NA NA NA 10.0 % NA 9.2 % NANokia Corp. 13.26 49,188 47,972 11,542 10,325 (9.4)% 0.8 x 0.8 x 8.0 x 9.2 x 13.9 x 14.4 x (2.5)% 27.8 % 2.5 % (0.2) x 10.9 % 12.8 %Palm, Inc. 12.43 2,083 1,885 590 392 (25.0)% 5.8 x 0.9 x NM NM NM NM 13.1 % 60.2 % 9.5 % NA 112.6 % 64.8 %Research In Motion Ltd. 65.22 36,319 34,692 1,628 0 (8.3)% 2.4 x 2.0 x 9.5 x 7.9 x 17.4 x 13.0 x 3.9 % 3.3 % 4.5 % (0.4) x 11.9 % 6.2 %
M ean 36,925 34,762 5,439 3,275 46.4% 2.8 x 1.6 x 9.5 x 9.2 x 21.7 x 15.9 x 11.2 % 36.5 % (5.5)% 1.5 x 27.9 % 21.6 %M edian 8,113 13,280 1,109 72 9.9% 2.7 x 1.2 x 8.7 x 9.2 x 17.4 x 14.4 x 8.5 % 41.4 % 3.5 % 0.3 x 11.2 % 9.5 %
Satellite / GP SBeijing BDStar Navigation Co., Ltd. 5.75 523 503 25 4 31.8% 11.6 x 9.1 x 56.0 x 34.1 x 85.2 x 52.3 x NA NA 3.9 % (2.3) x 17.7 % NAGarmin Ltd. 33.79 6,781 5,751 1,029 0 41.9% 2.0 x 2.0 x 7.0 x 7.5 x 11.2 x 12.6 x 10.6 % 47.2 % 15.2 % (1.3) x 15.0 % 7.1 %Loral Space & Communications, Inc. 34.76 1,038 864 173 0 35.0% 0.9 x 1.0 x NM NA NM 15.5 x NA NA 16.7 % (3.5) x 9.0 % NATeleCommunication Systems Inc. 9.35 478 427 79 29 31.5% 1.5 x 1.1 x 10.7 x 6.3 x 8.4 x 24.1 x 2.9 % 42.9 % 10.6 % (1.3) x 15.7 % 7.1 %TomTom NV 10.13 2,246 3,062 646 1,463 (15.7)% 1.4 x 1.5 x 7.3 x 7.2 x NM 12.7 x NA NA (36.3)% 2.0 x 19.4 % 8.6 %Trimble Navigation Limited 25.69 3,092 3,026 222 156 30.9% 2.7 x 2.5 x 18.5 x 12.8 x 23.8 x 20.8 x (0.9)% (2.0)% 2.1 % (0.4) x 26.0 % 12.3 %ViaSat Inc. 31.98 1,157 1,157 84 84 24.7% 1.8 x 1.6 x 14.8 x 10.9 x 19.7 x 18.6 x (2.0)% 3.4 % (0.0)% 0.0 x 16.4 % 4.2 %
M ean 2,188 2,113 323 248 25.7% 3.1 x 2.7 x 19.1 x 13.1 x 29.7 x 22.4 x 2.7 % 22.9 % 1.7 % (1.0) x 17.1 % 7.9 %M edian 1,157 1,157 173 29 31.5% 1.8 x 1.6 x 12.7 x 9.2 x 19.7 x 18.6 x 1.0 % 23.1 % 3.9 % (1.3) x 16.4 % 7.1 %
($ in millions, except per share data)R evenue EB IT D A EP S M R Q/ P YQ Gro wth N T M / LT M Gro wth LQ M argin
C o mpany N ame M R Q LT M N T M M R Q LT M N T M M R Q LT M N T M R evenue EB IT D A EP S R evenue EB IT D A EP S Gro ss EB IT D A N et
Wireless H andsetApple Inc. 15,683 40,340.0 45,000.9 4,934 10,001.0 10,742.0 1.82 6.28 7.84 32.0 % 50.9 % 45.0 % 11.6 % 7.4 % 24.8 % 40.9 % 31.5 % 10.7 %China Wireless Technologies Ltd. 46 165.4 330.8 3 3.6 49.4 0.00 0.00 0.01 63.2 % 181.0 % 165.4 % 100.1 % NM NM 35.5 % 5.8 % 4.5 %China Zhenhua (Group) Science & Technology, Ltd. 98 320.0 NA 6 18.7 NA 0.01 0.01 NA 11.5 % (12.8)% 0.3 % NA NA NM 14.6 % 6.6 % 2.0 %LG Electronics Inc. NA 50,099.3 54,275.0 NA 6,122.0 7,743.5 NA 0.00 13.74 NA NA NM 8.3 % 26.5 % NM NA NA NANingbo Bird Co., Ltd 62 166.4 NA 1 (29.8) NA (0.00) (0.03) NA (11.2)% NM 92.9 % NA NA NA 7.3 % 0.9 % (0.4)%Nokia Corp. 14,345 60,916.9 58,257.8 1,709 6,024.7 5,237.2 0.25 0.96 0.92 (16.7)% (45.9)% (46.5)% (4.4)% (13.1)% (3.8)% 31.4 % 11.9 % 6.4 %Palm, Inc. 78 323.5 2,177.2 (126) (379.7) (49.4) (0.10) (2.09) (0.35) (59.2)% (103.8)% 74.1 % 573.0 % 87.0 % 83.1 % 7.0 % (160.7)% (20.4)%Research In Motion Ltd. 3,924 14,336.7 17,689.1 1,050 3,669.2 4,417.5 1.03 3.74 5.03 41.1 % 44.5 % 19.5 % 23.4 % 20.4 % 34.5 % 42.7 % 26.7 % 15.0 %
M ean 4,891 20,834 29,622 1,082 3,179 4,690 0.43 1.11 4.53 8.6 % 19.0 % 50.1 % 118.7 % 25.6 % 34.7 % 25.6 % (11.1)% 2.5 %M edian 98 7,330 31,345 6 1,844 4,827 0.01 0.00 2.97 11.5 % 15.9 % 45.0 % 17.5 % 20.4 % 29.6 % 31.4 % 6.6 % 4.5 %
Satellite / GP SBeijing BDStar Navigation Co., Ltd. 14 43.2 55.4 4 9.0 14.7 0.01 0.07 0.11 23.3 % 211.9 % (36.2)% 28.1 % 64.2 % 62.9 % 46.5 % 27.3 % 23.8 %Garmin Ltd. 781 2,935.3 2,854.9 261 820.1 764.3 1.02 3.03 2.69 (10.2)% 7.7 % 17.2 % (2.7)% (6.8)% (11.4)% 52.4 % 33.3 % 26.3 %Loral Space & Communications, Inc. 249 963.5 843.2 25 49.1 NA 3.61 (24.34) 2.24 17.3 % NM 244.6 % (12.5)% NA 109.2 % 14.9 % 10.1 % 43.5 %TeleCommunication Systems Inc. 72 288.5 399.8 12 39.9 67.7 0.10 1.11 0.39 26.7 % 168.0 % 66.7 % 38.6 % 69.5 % (65.0)% 39.4 % 16.6 % 7.4 %TomTom NV 534 2,156.0 2,041.5 140 417.4 425.1 0.21 (11.21) 0.80 (11.5)% (14.7)% (68.2)% (5.3)% 1.8 % 107.1 % 52.4 % 26.2 % 8.4 %Trimble Navigation Limited 270 1,116.8 1,206.1 40 163.3 236.0 0.25 1.08 1.24 (17.8)% (43.7)% (37.5)% 8.0 % 44.5 % 14.4 % 49.2 % 14.8 % 11.4 %ViaSat Inc. 161 635.0 738.6 21 78.4 106.4 0.40 1.62 1.72 0.9 % 34.9 % 2.6 % 16.3 % 35.6 % 6.0 % 30.5 % 13.0 % 8.2 %
M ean 297 1,163 1,163 72 225 269 0.80 (4.09) 1.31 4.1 % 60.7 % 27.0 % 10.1 % 34.8 % 31.9 % 40.8 % 20.2 % 18.4 %M edian 249 963 843 25 78 171 0.25 1.08 1.24 0.9 % 21.3 % 2.6 % 8.0 % 40.1 % 14.4 % 46.5 % 16.6 % 11.4 %

Financial Metrics
31SagePoint Equipment 100 – Q3 2009
($ in millions, except per share data)Sto ck P rice M arket Enterprise % C hange Ent. Value/ R ev. Ent . Value/ EB IT D A P rice/ EP S Est imate Surprise N et C ash / N et D ebt / SG&A / R &D /
C o mpany N ame 1/ 8/ 10 C ap Value C ash D ebt 6/ 30/ 09 LT M N T M LT M N T M LT M N T M R evenue EP S M kt C ap EB IT D A R evenue R evenue
Vo IP / IM S Infrastructure3Com Corporation 7.61 3,014 2,422 704 112 60.9% 2.0 x 1.9 x 16.4 x NA 17.7 x 28.0 x 7.5 % 77.8 % 19.6 % (4.0) x 35.4 % 12.9 %Acme Packet, Inc. 11.16 650 491 159 0 10.3% 3.8 x 3.0 x 22.5 x 13.6 x 34.9 x 28.2 x 7.4 % 28.6 % 24.4 % (7.3) x 46.7 % 20.0 %GoHigh Data Netw orks Technology Co., Ltd. 1.90 634 667 37 70 88.5% 3.1 x 2.4 x NM NA NM NM NA NA (5.3)% 5.6 x 8.1 % NAShoreTel, Inc. 5.83 259 148 111 0 (27.1)% 1.1 x 1.0 x NM NM NM NM 2.1 % 100.0 % 43.0 % NA 49.4 % 21.3 %Sonus Netw orks, Inc. 2.51 689 351 338 0 55.9% 1.4 x 1.5 x NM NM NM NM 3.0 % 100.0 % 49.0 % NA 41.1 % 25.2 %Tekelec 15.67 1,055 702 353 0 (6.9)% 1.5 x 1.6 x 6.7 x 5.6 x 15.2 x 15.9 x 6.1 % 35.0 % 33.5 % (3.4) x 26.4 % 21.1 %
M ean 1,050 797 284 30 30.3% 2.1 x 1.9 x 15.2 x 9.6 x 22.6 x 24.0 x 5.2 % 68.3 % 27.4 % (2.3) x 34.5 % 20.1 %M edian 669 579 248 0 33.1% 1.7 x 1.7 x 16.4 x 9.6 x 17.7 x 28.0 x 6.1 % 77.8 % 29.0 % (3.7) x 38.3 % 21.1 %
A / V InfrastructureArris Group Inc. 10.70 1,341 988 562 209 (12.1)% 0.9 x 0.9 x 5.2 x 5.0 x 11.3 x 11.2 x 0.7 % 2.5 % 26.3 % (1.8) x 13.2 % 11.2 %Axis AB 12.41 861 827 34 0 17.3% 2.7 x 2.4 x 22.9 x 15.6 x 36.6 x 21.8 x NA NA 3.9 % (0.9) x 20.0 % 13.2 %BigBand Netw orks, Inc. 3.58 238 76 162 0 (30.8)% 0.5 x 0.5 x 6.4 x NA 14.9 x 42.6 x 7.0 % 31.8 % 68.0 % (13.5) x 47.8 % 52.7 %EVS Broadcast Equipment NV 68.66 931 867 67 3 36.3% 8.5 x 6.4 x 18.0 x 10.7 x 37.5 x 18.6 x NA NA 6.9 % (1.3) x 19.1 % 15.7 %Geovision, Inc. 4.27 205 182 32 9 (6.1)% 4.6 x NA 12.0 x NA 18.1 x NA NA NA 11.1 % (1.5) x 16.7 % 12.7 %Harmonic Inc. 6.51 626 373 253 0 10.5% 1.1 x 1.1 x NM 11.3 x 20.3 x 30.0 x (2.3)% (16.7)% 40.4 % (12.0) x 23.1 % 18.9 %Harris Corp. 48.69 6,413 7,380 236 1,203 71.7% 1.5 x 1.4 x 7.7 x 7.2 x 13.2 x 12.1 x (5.8)% 42.9 % (15.1)% 1.0 x 17.4 % NANet Insight AB 0.67 263 241 22 0 10.6% 6.7 x 6.2 x 40.0 x 40.7 x 34.5 x 46.1 x NA NA 8.5 % (3.7) x 43.1 % 15.4 %Pace plc 3.31 993 912 81 0 1.2% 0.5 x 0.5 x NM 5.2 x NM 10.1 x NA NA 8.1 % (0.9) x 4.9 % 5.9 %Polycom, Inc. 24.92 2,103 1,707 396 0 22.9% 1.8 x 1.7 x 11.3 x 10.0 x 19.3 x 20.3 x 2.8 % (1.6)% 18.8 % (2.6) x 34.7 % 11.9 %Screen Service Broadcasting Technologies S.p.A. 0.97 134 159 1 26 (8.4)% 2.1 x 2.6 x 5.9 x 6.4 x 9.5 x 9.7 x NA NA (19.1)% 0.9 x 18.3 % NASeaChange International Inc. 6.61 205 163 42 0 (17.7)% 0.8 x 0.7 x 9.4 x 7.8 x 29.8 x 26.7 x 3.4 % (46.7)% 20.6 % (2.4) x 23.7 % 25.1 %Tandberg ASA 29.33 3,285 3,039 246 0 74.6% 3.5 x 3.1 x 14.9 x 11.4 x 27.2 x 21.5 x NA NA 7.5 % (1.2) x 38.1 % NAThomson S.A. 1.53 404 3,645 716 3,957 75.4% 0.5 x 0.7 x 4.4 x 4.9 x NM NM NA NA (802.9)% 3.9 x 10.7 % 4.3 %TiVo Inc. 10.75 1,182 936 245 0 2.6% 4.1 x 4.6 x NM NM NM NM (7.6)% 0.0 % 20.7 % NA 31.8 % 27.0 %
M ean 1,279 1,433 206 360 16.5% 2.7 x 2.3 x 13.2 x 11.3 x 22.7 x 22.6 x (0.3)% 1.7 % (39.7)% (2.6) x 24.2 % 17.8 %M edian 861 867 162 0 10.5% 1.8 x 1.5 x 10.3 x 8.9 x 19.8 x 20.9 x 0.7 % 0.0 % 8.5 % (1.4) x 20.0 % 14.3 %
($ in millions, except per share data)R evenue EB IT D A EP S M R Q/ P YQ Gro wth N T M / LT M Gro wth LQ M argin
C o mpany N ame M R Q LT M N T M M R Q LT M N T M M R Q LT M N T M R evenue EB IT D A EP S R evenue EB IT D A EP S Gro ss EB IT D A N et
Vo IP / IM S Infrastructure3Com Corporation 322 1,232.4 1,257.6 44 147.6 NA 0.08 0.43 0.27 (9.1)% 14.3 % (59.5)% 2.0 % NA (36.7)% 60.1 % 13.8 % 10.0 %Acme Packet, Inc. 36 130.8 161.9 7 21.8 36.2 0.09 0.32 0.40 27.8 % 64.3 % 80.0 % 23.8 % 65.8 % 23.8 % 80.9 % 18.8 % 15.6 %GoHigh Data Netw orks Technology Co., Ltd. 79 213.8 283.8 3 6.0 NA 0.00 0.01 0.01 374.5 % 174.7 % NM 32.7 % NM NM 11.5 % 3.6 % 1.0 %ShoreTel, Inc. 34 132.7 148.6 (2) (7.4) (9.9) 0.00 0.02 (0.20) (5.9)% NM (100.0)% 12.0 % (34.9)% NM 64.1 % (4.7)% 0.0 %Sonus Netw orks, Inc. 56 248.3 234.5 1 (14.9) 16.1 0.00 (0.02) 0.00 (9.7)% 103.5 % 100.0 % (5.6)% 208.2 % 105.0 % 62.8 % 0.9 % 0.0 %Tekelec 115 465.7 451.8 28 104.4 126.3 0.27 1.03 0.99 8.4 % 36.2 % 42.1 % (3.0)% 20.9 % (4.1)% 67.7 % 24.5 % 16.0 %
M ean 107 404 423 14 43 42 0.07 0.30 0.25 64.3 % 78.6 % 12.5 % 10.3 % 65.0 % 22.0 % 57.9 % 9.5 % 7.1 %M edian 68 231 259 5 14 26 0.04 0.17 0.14 1.3 % 64.3 % 42.1 % 7.0 % 43.4 % 9.8 % 63.4 % 8.7 % 5.5 %
A / V InfrastructureArris Group Inc. 276 1,100.2 1,134.8 54 191.4 198.0 0.25 0.95 0.95 (7.3)% 5.1 % 4.2 % 3.1 % 3.4 % 0.4 % 41.9 % 19.5 % 11.8 %Axis AB 81 306.5 339.1 19 36.1 53.2 0.14 0.34 0.57 4.1 % (23.3)% (30.0)% 10.6 % 47.5 % 68.2 % 52.3 % 23.3 % 11.6 %BigBand Netw orks, Inc. 22 159.2 149.8 (9) 12.0 NA (0.09) 0.24 0.08 (54.0)% (270.0)% (190.0)% (5.9)% NA (65.0)% 50.0 % (40.9)% (26.9)%EVS Broadcast Equipment NV 29 102.0 136.6 14 48.3 81.0 0.60 1.83 3.69 (45.3)% (59.3)% (64.3)% 33.9 % 67.7 % 102.0 % 82.5 % 49.9 % 28.7 %Geovision, Inc. 10 39.9 NA 3 15.2 NA 0.06 0.24 NA (24.0)% (33.6)% (46.0)% NA NA NA 65.0 % 36.2 % 31.1 %Harmonic Inc. 84 329.8 340.1 5 21.1 33.0 0.05 0.32 0.22 (8.3)% (64.2)% (70.6)% 3.1 % 56.7 % (32.2)% 43.0 % 6.2 % 5.8 %Harris Corp. 1,203 5,035.4 5,290.9 224 959.5 1,021.0 1.08 3.69 4.03 2.6 % (4.2)% 0.0 % 5.1 % 6.4 % 9.2 % 32.5 % 18.6 % 9.1 %Net Insight AB 8 35.9 39.0 2 6.0 5.9 0.00 0.02 0.01 (13.5)% (16.4)% (37.5)% 8.6 % (1.7)% (25.2)% 76.7 % 18.8 % 10.1 %Pace plc 433 1,712.8 1,881.6 30 93.7 176.7 0.06 0.13 0.33 88.5 % 122.7 % 98.9 % 9.9 % 88.5 % 152.6 % 17.2 % 7.0 % 4.1 %Polycom, Inc. 243 962.2 1,033.5 37 151.1 170.6 0.31 1.29 1.23 (11.9)% (6.2)% (16.2)% 7.4 % 12.9 % (4.8)% 56.9 % 15.2 % 11.0 %Screen Service Broadcasting Technologies S.p.A. 23 76.4 61.0 9 27.1 25.0 0.04 0.10 0.10 58.9 % 105.4 % 110.2 % (20.2)% (7.8)% (2.4)% 59.4 % 39.7 % 21.7 %SeaChange International Inc. 53 202.6 221.0 4 17.4 21.0 0.03 0.22 0.25 2.9 % (49.8)% (70.9)% 9.0 % 20.8 % 11.7 % 51.7 % 6.9 % 0.6 %Tandberg ASA 235 858.1 975.8 55 204.5 267.5 0.23 1.08 1.36 11.6 % 10.7 % (34.3)% 13.7 % 30.8 % 26.5 % 65.6 % 23.4 % 11.0 %Thomson S.A. 1,262 6,737.2 5,253.0 135 831.3 747.8 0.01 (6.84) (0.19) (12.6)% 21.1 % 105.0 % (22.0)% (10.0)% 97.2 % 20.0 % 10.7 % 0.2 %TiVo Inc. 57 228.3 204.7 (5) (10.8) 9.0 (0.06) (0.17) (0.30) (11.8)% NM (500.0)% (10.4)% NM (75.3)% 46.6 % (8.3)% (11.4)%
M ean 268 1,192 1,219 39 174 216 0.18 0.23 0.88 (1.3)% (18.7)% (49.4)% 3.3 % 26.3 % 18.8 % 50.8 % 15.1 % 7.9 %M edian 81 306 340 14 36 81 0.06 0.24 0.29 (8.3)% (11.3)% (34.3)% 6.2 % 16.9 % 4.8 % 51.7 % 18.6 % 10.1 %

Financial Metrics
32SagePoint Equipment 100 – Q3 2009
($ in millions, except per share data)Sto ck P rice M arket Enterprise % C hange Ent. Value/ R ev. Ent . Value/ EB IT D A P rice/ EP S Est imate Surprise N et C ash / N et D ebt / SG&A / R &D /
C o mpany N ame 1/ 8/ 10 C ap Value C ash D ebt 6/ 30/ 09 LT M N T M LT M N T M LT M N T M R evenue EP S M kt C ap EB IT D A R evenue R evenue
C o mpo nents & SubsystemsAAC Acoustic Technologies Holdings Inc. 1.76 2,163 1,994 197 28 121.2% 7.0 x 4.6 x 20.1 x 12.6 x 31.6 x 17.3 x NA NA 7.8 % (1.7) x 6.5 % 6.7 %Belden, Inc. 25.07 1,170 1,448 312 590 50.1% 1.0 x 1.0 x 9.6 x 7.8 x 24.3 x 18.4 x 4.1 % 17.4 % (23.8)% 1.9 x 20.1 % 4.0 %BYD Electronic International Company Ltd 0.89 2,005 1,841 164 0 44.9% 1.4 x 1.2 x 10.1 x 8.7 x 24.3 x 16.2 x NA NA 8.2 % (0.9) x 4.6 % 4.1 %Comba Telecom Systems Holdings Ltd. 1.14 1,217 1,178 81 42 124.9% 2.6 x 1.8 x 17.5 x 10.6 x 24.1 x 15.2 x NA NA 3.3 % (0.6) x 21.4 % 4.3 %CommScope, Inc. 27.49 2,578 3,583 593 1,598 4.7% 1.1 x 1.1 x 7.3 x 6.2 x 14.0 x 11.7 x (4.4)% 9.3 % (39.0)% 2.0 x 13.8 % 3.5 %Comtech Telecommunications Corp. 37.00 1,045 745 500 200 16.1% 1.4 x 0.9 x 9.5 x 4.7 x 29.4 x 15.1 x 6.6 % 37.0 % 28.7 % (3.8) x 16.2 % 8.5 %Corning Inc. 19.89 30,951 30,092 2,930 2,071 23.8% 6.1 x 5.1 x 26.1 x 16.0 x 18.4 x 12.0 x 3.7 % 22.6 % 2.8 % (0.7) x 15.9 % 9.5 %Finisar Corp. 10.89 706 777 81 152 138.8% 1.4 x 1.2 x NM 9.8 x NM 17.0 x 4.9 % (6.8)% (10.1)% 3.1 x 10.5 % 14.8 %Jiangsu Yongding Co., Ltd. 1.60 434 636 70 272 52.7% 2.4 x NA 20.1 x NA 34.5 x NA NA NA (46.5)% 6.4 x 12.6 % NAJiangsu Zhongtian Technologies Co. Ltd. 3.55 1,139 1,227 78 166 30.1% 2.5 x 1.9 x 17.4 x 13.8 x 25.7 x 22.1 x NA NA (7.7)% 1.2 x 13.1 % NAPow erw ave Technologies Inc. 1.39 184 420 45 281 (13.7)% 0.7 x 0.7 x NM NM NA NM (0.9)% 350.0 % (128.3)% 21.0 x 13.8 % 10.5 %TKH Group NV 20.61 763 965 13 216 48.5% 0.8 x 0.9 x NM 10.7 x 23.5 x 19.2 x NA NA (26.5)% 2.3 x 23.2 % NAWuhan Fingu Electronic Technology Co., Ltd. 3.18 1,766 1,593 189 15 34.6% 7.1 x 5.6 x 24.3 x 18.2 x 31.4 x 25.1 x NA NA 9.8 % (2.6) x 3.0 % NA
M ean 3,548 3,577 404 433 52.1% 2.7 x 2.2 x 16.2 x 10.8 x 25.6 x 17.2 x 2.3 % 71.6 % (17.0)% 2.1 x 13.4 % 7.3 %M edian 1,170 1,227 164 200 44.9% 1.4 x 1.2 x 17.5 x 10.6 x 24.3 x 17.0 x 3.9 % 20.0 % (7.7)% 1.2 x 13.8 % 6.7 %
OD M / EM SCompal Electronics Inc. 1.43 5,594 5,273 1,335 1,014 77.0% 0.3 x 0.2 x NM NM NM 10.7 x NA NA 5.7 % (0.4) x 1.6 % 1.3 %Cybertan Technology Inc. 1.49 491 345 147 0 22.1% 1.0 x NA NM NA 21.8 x NA NA NA 29.9 % (6.2) x 3.7 % 2.3 %Flextronics International Ltd. 7.26 5,897 6,483 1,966 2,553 74.9% 0.3 x 0.3 x NM NM NM NM 0.7 % (14.0)% (9.9)% 0.8 x 3.0 % NAFoxconn Technology Company Limited 3.77 3,660 3,669 507 516 54.0% 0.8 x 0.7 x NM 9.0 x 22.8 x 16.5 x NA NA (0.2)% 0.0 x 1.9 % 0.8 %Lite-On Technology Corp. 1.49 3,285 3,174 1,498 1,388 72.4% 0.6 x 1.0 x 5.7 x 9.5 x 22.6 x 14.4 x NA NA 3.4 % (0.2) x 8.2 % 2.2 %MiTAC International Corp. 0.50 771 661 224 114 25.7% 0.3 x NA NM NA NM NA NA NA 14.3 % NA 11.0 % 4.1 %Qisda Corporation 0.63 1,208 2,298 355 1,444 68.7% 0.5 x 0.5 x NM NM NM NM NA NA (90.2)% 7.8 x 7.0 % 2.3 %Quanta Computer, Inc. 2.15 8,100 7,354 2,910 2,163 34.3% 0.3 x 0.2 x NM NM 13.9 x NM NA NA 9.2 % (0.9) x 1.7 % 1.1 %
M ean 3,626 3,657 1,118 1,149 53.6% 0.5 x 0.5 x 5.7 x 9.3 x 20.2 x 13.9 x 0.7 % (14.0)% (4.7)% 0.1 x 4.8 % 2.0 %M edian 3,472 3,422 921 1,201 61.4% 0.4 x 0.4 x 5.7 x 9.3 x 22.2 x 14.4 x 0.7 % (14.0)% 4.5 % (0.2) x 3.4 % 2.2 %
($ in millions, except per share data)R evenue EB IT D A EP S M R Q/ P YQ Gro wth N T M / LT M Gro wth LQ M argin
C o mpany N ame M R Q LT M N T M M R Q LT M N T M M R Q LT M N T M R evenue EB IT D A EP S R evenue EB IT D A EP S Gro ss EB IT D A N et
C o mpo nents & SubsystemsAAC Acoustic Technologies Holdings Inc. 100 285.3 435.1 38 99.4 158.2 0.02 0.06 0.10 5.1 % 38.2 % 9.6 % 52.5 % 59.1 % 82.7 % 46.5 % 37.9 % 29.3 %Belden, Inc. 355 1,444.8 1,478.0 38 150.1 186.2 0.27 1.03 1.37 (31.8)% (40.8)% (65.4)% 2.3 % 24.0 % 32.6 % 31.9 % 10.6 % 3.5 %BYD Electronic International Company Ltd 278 1,276.3 1,555.2 31 182.2 212.5 0.01 0.04 0.06 4.9 % (21.0)% (46.3)% 21.9 % 16.7 % 50.2 % 13.9 % 11.2 % 6.0 %Comba Telecom Systems Holdings Ltd. 114 446.2 642.3 20 67.2 110.7 0.01 0.05 0.07 112.8 % 228.3 % 214.3 % 44.0 % 64.8 % 58.1 % 41.3 % 17.2 % 13.1 %CommScope, Inc. 750 3,138.2 3,180.5 143 491.4 580.6 0.61 1.97 2.36 (29.4)% (23.6)% (47.9)% 1.3 % 18.2 % 19.7 % 32.6 % 19.1 % 8.6 %Comtech Telecommunications Corp. 134 528.3 868.6 20 78.4 158.2 0.30 1.26 2.46 (30.3)% (63.5)% (62.5)% 64.4 % 101.7 % 94.8 % 37.2 % 14.7 % 5.3 %Corning Inc. 1,532 4,947.0 5,937.3 456 1,151.0 1,880.0 0.39 1.08 1.65 41.3 % 178.0 % (19.9)% 20.0 % 63.3 % 53.1 % 42.4 % 29.8 % 43.2 %Finisar Corp. 146 552.2 630.1 11 22.8 79.3 0.11 0.11 0.64 (1.4)% 26.8 % (31.3)% 14.1 % NM 480.9 % 28.1 % 7.9 % 0.0 %Jiangsu Yongding Co., Ltd. 61 268.1 NA 6 31.7 NA 0.01 0.05 NA 80.1 % 242.1 % 451.9 % NA NA NA 20.1 % 10.1 % 6.6 %Jiangsu Zhongtian Technologies Co. Ltd. 107 491.2 639.7 17 70.3 88.6 0.04 0.14 0.16 2.6 % 105.7 % 321.1 % 30.2 % 25.9 % 16.3 % 27.4 % 15.9 % 11.1 %Pow erw ave Technologies Inc. 139 605.2 587.4 9 11.2 36.3 0.01 0.00 0.08 (41.6)% (49.4)% (87.5)% (2.9)% NM NM 26.7 % 6.2 % 1.0 %TKH Group NV 253 1,197.7 1,069.1 15 88.2 90.1 (0.05) 0.88 1.07 (31.8)% (62.0)% (109.5)% (10.7)% 2.0 % 22.7 % 40.2 % 6.1 % (0.8)%Wuhan Fingu Electronic Technology Co., Ltd. 59 223.6 284.1 20 65.6 87.7 0.03 0.10 0.13 0.7 % 14.6 % 47.7 % 27.0 % 33.8 % 25.0 % 32.7 % 33.3 % 25.1 %
M ean 310 1,185 1,442 63 193 306 0.14 0.52 0.85 6.3 % 44.1 % 44.2 % 22.0 % 40.9 % 85.1 % 32.4 % 16.9 % 11.7 %M edian 139 552 755 20 78 134 0.03 0.11 0.40 0.7 % 14.6 % (31.3)% 20.9 % 29.9 % 50.2 % 32.6 % 14.7 % 6.6 %
OD M / EM SCompal Electronics Inc. 5,820 17,514.6 21,176.3 230 769.5 698.8 0.04 0.10 0.13 43.6 % NM 31.5 % 20.9 % NM 35.3 % 6.2 % 4.0 % 2.7 %Cybertan Technology Inc. 88 360.4 NA 7 23.6 NA 0.03 0.07 NA 16.3 % NM 823.1 % NA NA NA 13.1 % 7.9 % 12.0 %Flextronics International Ltd. 5,832 25,350.3 24,712.2 227 702.3 1,160.1 0.08 0.55 0.60 (34.2)% NM (43.6)% (2.5)% NM 8.5 % 5.3 % 3.9 % 1.8 %Foxconn Technology Company Limited 1,078 4,886.2 5,011.0 102 347.5 406.0 0.06 0.17 0.23 (13.6)% (8.6)% (18.4)% 2.6 % 16.8 % 37.7 % 9.8 % 9.4 % 5.7 %Lite-On Technology Corp. 1,606 5,373.6 3,239.3 185 556.3 333.0 0.03 0.07 0.10 (20.6)% 44.2 % 23.4 % (39.7)% (40.1)% 56.6 % 17.4 % 11.5 % 4.8 %MiTAC International Corp. 498 1,919.3 NA 1 (32.1) NA 0.01 (0.03) NA 1.5 % NM (16.6)% NA NM NA 14.5 % 0.2 % 2.7 %Qisda Corporation 1,270 4,975.1 4,815.7 59 139.0 194.0 0.01 (0.08) 0.04 6.4 % NM 138.6 % (3.2)% NM 144.9 % 11.4 % 4.7 % 2.1 %Quanta Computer, Inc. 6,602 23,577.1 29,581.3 242 851.6 1,005.0 0.05 0.16 0.20 4.1 % NM (16.6)% 25.5 % NM 27.9 % 5.9 % 3.7 % 2.9 %
M ean 2,849 10,495 14,756 132 420 633 0.04 0.12 0.22 0.4 % 17.8 % 115.2 % 0.6 % (11.7)% 51.8 % 10.5 % 5.7 % 4.3 %M edian 1,438 5,174 13,094 144 452 552 0.04 0.08 0.17 2.8 % 17.8 % 3.4 % 0.0 % (11.7)% 36.5 % 10.6 % 4.3 % 2.8 %

Introduction to SagePoint Advisors
SagePoint Equipment 100 – Q3 2009
Introduction to SagePoint Advisors
34
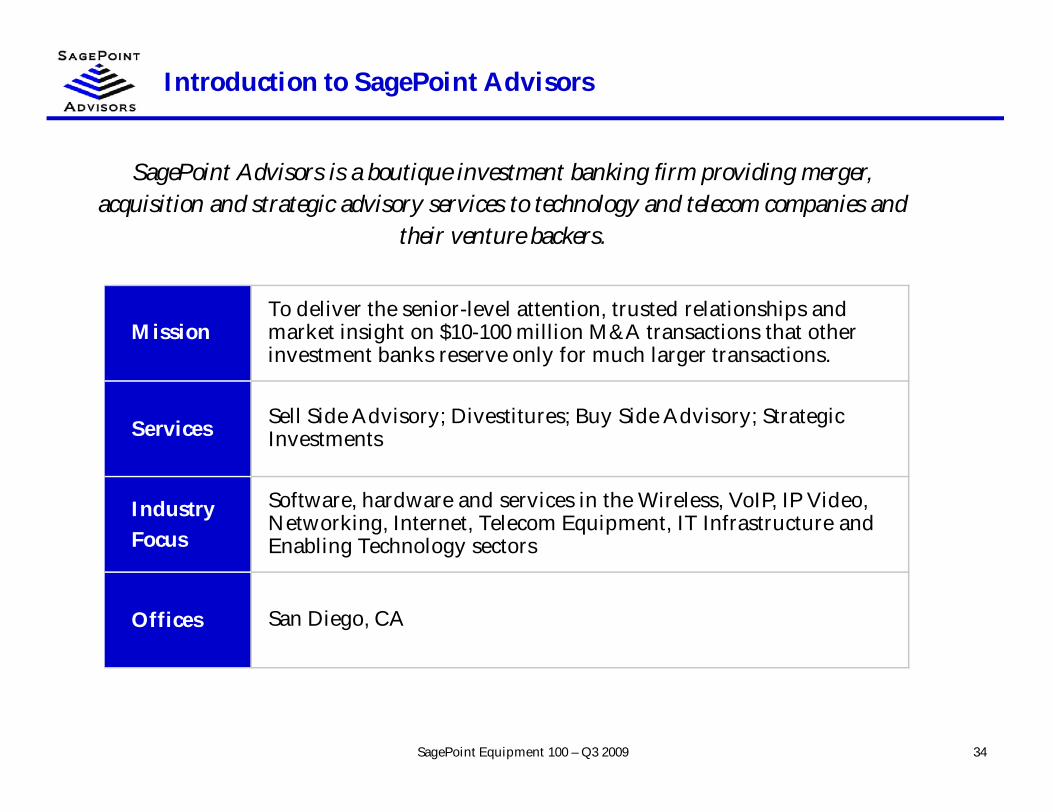
SagePoint Advisors is a boutique investment banking firm providing merger,acquisition and strategic advisory services to technology and telecom companies and
their venture backers.
SagePoint Equipment 100 – Q3 2009
MissionTo deliver the senior-level attention, trusted relationships andmarket insight on $10-100 million M&A transactions that otherinvestment banks reserve only for much larger transactions.
Services Sell Side Advisory; Divestitures; Buy Side Advisory; StrategicInvestments
IndustryFocus
Software, hardware and services in the Wireless, VoIP, IP Video,Networking, Internet, Telecom Equipment, IT Infrastructure andEnabling Technology sectors
Offices San Diego, CA

SagePoint Advisors Team
35
David P. Michaels - Founder & Managing DirectorPrior to founding SagePoint Advisors in 2008, David Michaels was a Co-Founder, Partner and Managing Director atMontgomery & Co., a leading investment bank focused on serving emerging-growth technology companies and their venturebackers. Mr. Michaels co-founded Montgomery’s investment banking business in 1996 as the lead banker and played aninstrumental role in building the business to over $50 million in revenues and 80 employees. Mr. Michaels launchedMontgomery’s San Diego office in 2003 and established Montgomery as the dominant brand in the region. Mr. Michaels alsoran the firm’s Communications and Digital Media Technology practice areas for several years prior to his departure. Duringhis 14 year tenure at Montgomery, Mr. Michaels advised CEOs and Boards on more than 75 corporate strategy, M&A and fundraising engagements.
Mr. Michaels has intimate knowledge of the strategic landscape, market dynamics and technology underpinnings of severalhigh technology market segments including wireless infrastructure, software and services, voice, video and datainfrastructure, software and services, storage infrastructure and software, networking equipment, Internet software andservices and semiconductors. Prior to co-founding Montgomery’s investment banking business, Mr. Michaels managedstrategic consulting assignments for the firm including market entry analysis, acquisition search studies and strategic portfolioassessments.
Prior to joining the Montgomery in 1994, Mr. Michaels held various investment banking positions including a position withinBankers Trust Corporate Finance Department, where he helped execute merger and acquisition assignments such as salemandates and valuation analyses. Prior to that, Mr. Michaels worked as a structural engineer at General Dynamics, where heassisted on the Advanced Tactical Fighter program. Mr. Michaels received an M.B.A. with an emphasis in marketing andentrepreneurship from the Anderson School of Management at UCLA and holds a B.S. in Mechanical Engineering from theUniversity of Michigan.
Teak Murphy - Senior AssociatePrior to joining SagePoint, Teak worked as a Senior Associate with Enterprise Partners Venture Capital, the largest SouthernCalifornia based VC firm, where he evaluated investment opportunities and worked closely with senior management andboard members to successfully grow portfolio companies. Prior to Enterprise Partners, Teak worked as an Associate intechnology investment banking at Montgomery & Co. where he spent three years working closely with SagePoint's founderDavid Michaels on buy-side and sell-side M&A transactions. Prior to Montgomery, Teak worked at Cowen & Co. advisingtechnology companies on M&A and IPO transactions.
Teak's experience working on fund raising, mergers and acquisitions, and initial public offerings as both an advisor andinvestor provides unique insight into the needs of venture-backed companies. Teak graduated from the University of SouthernCalifornia with honors, receiving a B.S. in Business Administration and Finance .
SagePoint Equipment 100 – Q3 2009

Primary Industry Focus – Communications & Networking
36SagePoint Equipment 100 – Q3 2009
Value Chain Wireless VoIP Video Data
Services
Mobile messaging,content, search,
LBS, socialnetworking,gaming, etc.
VoIP serviceproviders, voicesearch, website
voice enablement,etc.
Cable & DBS,Internet video,
conferencing, videodelivery networks,
etc.
Internet access, webhosting, co-location,
SaaS deliverynetworks, etc.
SoftwareMobile and fixed
wireless applicationand infrastructure
software , etc.
VoIP softphoneclient and serversoftware, FMCsoftware, etc.
Video encoding,transcoding,
editing, sharing andplayer software, etc.
Networking &Internet client and
server software, etc.
EquipmentHandsets and
modules, fixed andmobile wirelessequipment, etc.
VoIP handsets,gateways, IP-PBXs,
SBCs, mediaservers, etc.
Cable & IPTVequipment, video
conferencing, VOD,DVRs, STBs, etc.
WAN, LAN andoptical data
networking andtelecom equipment,
etc.
Semiconductors3G/4G, WiMax,
WLAN, & WPANRF & BB ICs, etc.
VoIP DSPs andASICs
Videoencode/decode,processing and
transport ICs, etc.
WAN, LAN, I/Ostorage and security
networking ICs

Transaction Experience of SagePoint Team
37
has beenacquired by
August 2006
has beenacquired by
October 2005
has beenacquired by
August 2003
October 2008
has sold certainassets to
UndisclosedHandset OEM
2008
BuysideAdvisory
November 2008
has been acquired by
UndisclosedBuyer
Senior ConvertibleDebentures
$5,000,000
Financial Advisor andPlacement Agent
July 2006
has agreed to the saleof their NAS
Software IntellectualProperty to
$50,000,000
May 2005
has been acquired by
September 2007
$34,875,000
has been acquired by
January 2007
August 2009
has been acquired by
Private Investment inPublic Equity
$14,400,000
Co-Agent
January 2006 2005
Strategic Investor
has sold a minoritystake to
SagePoint Equipment 100 – Q3 2009
has been acquired by
April 2008
has sold its assets to
October 2007
$10,000,000
Initial Public Offering$82,500,000
June 2007
Co-manage
Initial Public Offering$167,440,000
September 2006
Co-manager
has been acquired by
August 2006
has sold its SRAMassets to
January 2006
has been acquired by
August 2004
has been acquired by
April 2004
$122,500,000
has been acquired by
March 2004
has been acquired by
February 2003
has been acquired by
April 2002
Private Placement
July 2001
Placement Agent
$9,900,000Private Placement
May 2000
Placement Agent
$11,000,000
has merged with
March 2000
$157,000,000
has been acquired by
December 2003
Transaction Experience by Market Segment
38SagePoint Equipment 100 – Q3 2009
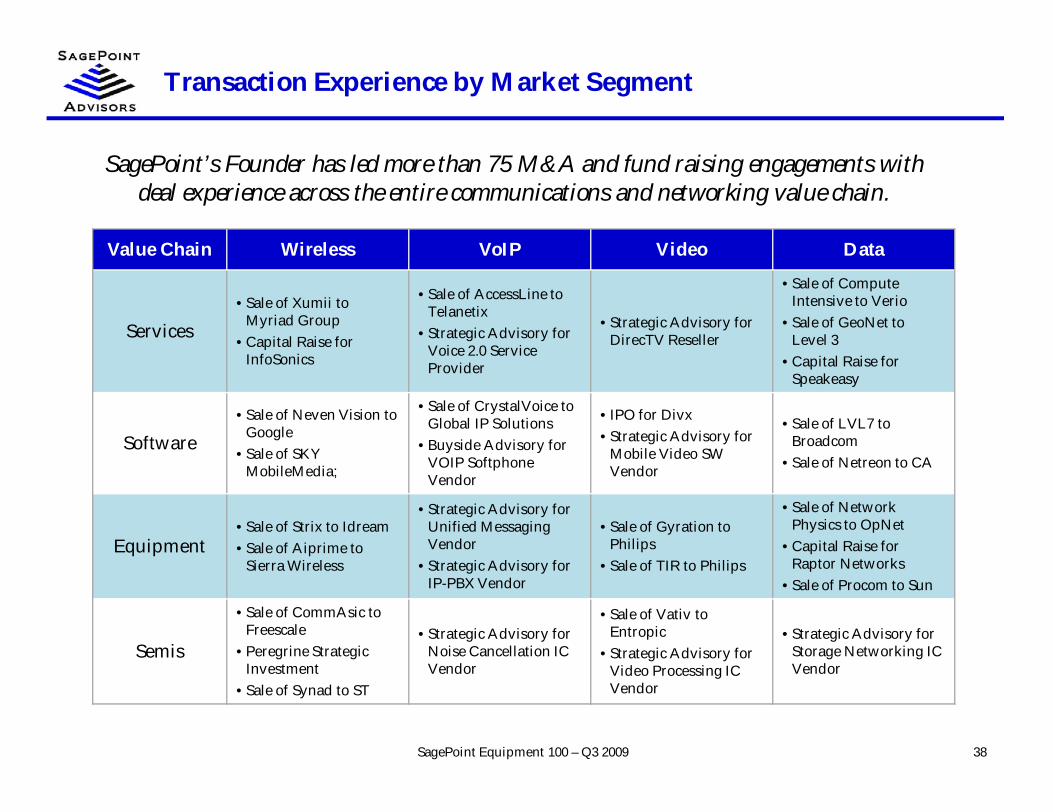
SagePoint’s Founder has led more than 75 M&A and fund raising engagements withdeal experience across the entire communications and networking value chain.
Value Chain Wireless VoIP Video Data
Services• Sale of Xumii to
Myriad Group• Capital Raise for
InfoSonics
• Sale of AccessLine toTelanetix
• Strategic Advisory forVoice 2.0 ServiceProvider
• Strategic Advisory forDirecTV Reseller
• Sale of ComputeIntensive to Verio
• Sale of GeoNet toLevel 3
• Capital Raise forSpeakeasy
Software• Sale of Neven Vision to
Google• Sale of SKY
MobileMedia;
• Sale of CrystalVoice toGlobal IP Solutions
• Buyside Advisory forVOIP SoftphoneVendor
• IPO for Divx• Strategic Advisory for
Mobile Video SWVendor
• Sale of LVL7 toBroadcom
• Sale of Netreon to CA
Equipment• Sale of Strix to Idream• Sale of Aiprime to
Sierra Wireless
• Strategic Advisory forUnified MessagingVendor
• Strategic Advisory forIP-PBX Vendor
• Sale of Gyration toPhilips
• Sale of TIR to Philips
• Sale of NetworkPhysics to OpNet
• Capital Raise forRaptor Networks
• Sale of Procom to Sun
Semis
• Sale of CommAsic toFreescale
• Peregrine StrategicInvestment
• Sale of Synad to ST
• Strategic Advisory forNoise Cancellation ICVendor
• Sale of Vativ toEntropic
• Strategic Advisory forVideo Processing ICVendor
• Strategic Advisory forStorage Networking ICVendor

Representative Buyer Relationships
39
Internet / Media Service Providers CommunicationsEquipment
CommunicationsSemiconductors
CommunicationsSoftware / SaaS
SagePoint Equipment 100 – Q3 2009
Why Work With SagePoint?
40SagePoint Equipment 100 – Q3 2009
• SagePoint delivers the senior-level attention, trusted relationships and market insight on$10-100M transactions that larger investment banks reserve only for much largertransactions
• SagePoint’s domain knowledge is world-class across the entire communications andnetworking value chain
• SagePoint has developed trusted relationships with the most active strategic buyers acrossthe communications value chain
• SagePoint has the M&A expertise that comes only from decades of experience focusing onstrategic transactions
• SagePoint’s unwavering integrity and commitment to intellectual honesty ensures that wetell our clients what they need to hear to make sound business decisions
• At SagePoint, we offer sage advice that points our clients in the right direction to ensure anoptimal outcome