Embed Size (px)
Citation preview
SAGINAW BAY COASTAL INITIATIVE
Potential Public Health Risks Associated with Pathogens in Detritus Material (“Muck”) in Saginaw Bay
BY The Saginaw Bay Science Committee Pathogen Work Group

i
ii
Keywords Pathogen, algal blooms, public health
Table of Contents Chapters
I. Preface …………………………………………………………………. ..1 II. Members of the Science Committee Pathogen Work Group
and Other Technical Assistance ……………………………………….. ..2 III. Executive Summary ……………………………………………………...3
PART . Public Health Risk
IV. The Problem of Detritus on the Shores of Saginaw Bay ……………… ..8 V. E. coli and Indicators of Water Quality Problems ……………………….9 VI. Muck and Fecal Indicators …………………………………………….. 14 VII. Relative Risks Associated with Exposure to Contaminated Sand,
Muck and Water ……………………………………………………….. 16
PART II. Background on Saginaw Bay VIII. Description of Saginaw Bay Watershed and Beaches ………………… 18 IX. Sources of Enteric Indicators and Potential Pathogens
in Saginaw Bay ………………………………………………………... 22
PART III. The Future Approaches and Recommendations X. Monitoring Approaches ……………………………………………….. 30 XI. Recommendations …………………………………………………….. 32
Appendix 1
References …………………………………………………………………………34 Appendix 2
Resources ………………………………………………………………… ………. 36 Appendix 3
MDEQ Permitting Requirements for Debris (a.k.a. Algae/Muck) Removal …….. 37 Appendix 4
Animal Production in the Saginaw Bay Coastal Area …………………… ………. 38
iii
List of Tables Table 1. Committee members Table 2. Other technical assistance Table 3. Water quality standards/criteria for recreational waters (USEPA -1986, MDEQ- 2007)Table 4. Microbial fecal indicators in the “muck” samples Table 5. Saginaw Bay watershed land use and population statistics Table 6. Public beaches along the Saginaw Bay by county Table 7. Communities in the Saginaw Bay watershed with SSOs Table 8. Communities in the Saginaw Bay watershed with CSOs Table 9. Number of monitored beaches and closures in Michigan and along Saginaw Bay Table 10. Beaches in Saginaw Bay with exceedances of the Michigan Water Quality Standard Table 11. Reportable waterborne diseases for Saginaw Bay and Michigan
List of Boxes Box 1. Description of Pathogenic E. coli
List of Figures Figure 1. The extent of the muck at Bay City State Park Figure 2. Transport of nutrients (phosphorus) and fecal contamination Figure 3. A photo of microscopic benthic organisms found in the muck in September, 2006 Figure 4. An aerial photograph of the Saginaw Bay Figure 5. The Saginaw Bay watershed boundary Figure 6. Saginaw Bay watershed land use map Figure 7. Transport of nutrients (phosphorus) and fecal contamination Figure 8. Rate comparison: Reported cases, 2002-2006 Figure 9. Rate comparison: Reported cases, 2006
iv
Glossary Algae: Microscopic photosynthetic organisms that are usually aquatic and lack true stems, roots
and leaves. Algal blooms: An accumulation of algal cells of high enough concentration to be visible to the naked eye. Bathymetry: The science of measuring the depths of the oceans, seas and other bodies of water and mapping the corresponding topography of those depths. Benthic macroinvertebrate: Animals without backbones, larger than ½ millimeter (the size of a pencil dot) and live in the sediment on the lake bottom. Cladophora: A branching, green filamentous alga found naturally along the coastline of most of the Great Lakes. Cyanobacteria: Aquatic and photosynthetic bacteria, can have unicellular, filamentous or
colonial morphology, mostly planktonic, also known as blue-green algae. Diatoms: Delicate unicellular organisms that have a yellow-brown chloroplast that enables them to photosynthesize. Escherichia coli (E. coli): One of the main species of bacteria living in the lower intestines of mammals, known as gut flora. When located in the large intestine it actually assists with waste processing, vitamin K production and food absorption. Embayment: An indentation of a shoreline larger than a cove but smaller than a gulf - bay. Enteric Bacteria: A large group of rod shaped, gram negative bacteria. Epiphyte: An organism that grows upon or attached to a living plant. Epidemiology: The study of the distribution and causes of disease in populations. Eutrophication: A process where water bodies receive excess nutrients that stimulate excessive plant growth. Geometric mean: The geometric mean of a collection of positive data is defined as the
nth root of the product of all the members of the data set, where n is the number of members. This is a number which is different from the “average” because it uses multiplication rather than addition to summarize data values. It conveys the number that most of the values fall into (central tendency).
Gram-positive bacteria: A large group of rod-shaped bacteria that retains the crystal violet stain when treated by Gram's method. Indicator Organism: Microbes whose presence in water signals the presence of
fecal matter and potentially pathogens (e.g. E. coli, Fecal coliforms). Mesotrophic: A term applied to clear water lakes and ponds with beds of submerged aquatic plants and medium levels of nutrients. Morphology: Physical description of an object (e.g. organism or lake). Microcystis: A type of blue-green algae. Muck: Decaying detrital material that may be composed of algae, sediment and organic matter. Parasite: An organism that lives in a close relationship with another organism, its host and causes it harm. Pathogenic: Bacteria that cause disease. Plankton: Group of tiny plants (called phytoplankton) and tiny animals (zooplankton). Protozoans: Single-celled eukaryotes (organisms whose cells have nuclei). Repository: A central place. Single sample mean: Three individual samples collected from different points along a beach.
A geometric mean is calculated and used to determine compliance with water quality standards (as defined by the Michigan Department of Environmental Quality).
Zooplankton: Microscopic aquatic invertebrates that eat other plankton.
v
List of Acronyms
ACOE: Army Corps of Engineers CFU: Colony Forming Unit CSO: Combined Sewer Overflows GLWQA: Great Lakes Water Quality Agreement MDCH: Michigan Department of Community Health MDEQ: Michigan Department of Environmental Quality MDNR: Michigan Department of Natural Resources MPN: Most probable Number NOAA: National Oceanic and Atmospheric Administration NPDES: National Pollutant Discharge Elimination System PFU: Plaque Forming Unit QAPP: Quality assurance project plan SSO: Sanitary Sewer Overflows TMDL: Total Maximum Daily Load USDA: United States Department of Agriculture USEPA: United States Environmental Protection Agency WQS: Water Quality Standard WWTP: Waste Water Treatment Plant
1
I. Preface Recently, excessive algal growth, detritus or “muck” has covered the shoreline in parts of the Great Lakes, with a perceived increase in duration and spatial distribution compared to past years. The subsequent degradation of the aesthetic value of the beaches has resulted in great concern among the public, especially local homeowners. In addition, there are potential health risks due to the potential for these algal mats (primarily comprised of the benthic algae, Cladophora) to retain and/or promote the growth of pathogens. In preliminary testing, the presence of a potential fecal signature in the material indicates a cause for concern and the need for appropriate management strategies. To address this issue, Steven E. Chester, Director, Michigan Department of Environmental Quality (MDEQ), organized a science committee as part of the Saginaw Bay Coastal Initiative to address potential human health risks associated with the accumulation of the algal material on the shores of Saginaw Bay. Director Chester asked the science committee to address issues and needs regarding Escherichia coli (E. coli) and pathogen risks and specifically address citizen concerns on the presence of E. coli in detritus material in the Saginaw Bay area.
Director Chester asked Dr. Joan Rose, Professor and Homer Nowlin Endowed Chair, Department of Fisheries and Wildlife, Michigan State University to chair the science committee. In addition, Ms. Christine Alexander, Water Bureau, MDEQ, was asked to assist in the coordination of the science committee activities and to provide appropriate MDEQ input. Director Chester specifically asked the science committee to evaluate the potential public health risks associated with potential pathogens that may be present in the detritus and to provide the MDEQ with associated information and recommendations. To accomplish this, the committee agreed to:
• Identify what key pathogens might be present in the detritus based on the indicator organisms present
• Evaluate the levels of fecal indicator organisms and the potential for pathogens to be present in the detritus at concentrations that may present significant risk to the public health
• Determine, if possible, the level of risk associated with any pathogens present in the detritus at the concentrations found
• Recommend the appropriate advice to the public regarding contact with the detritus, and the basis for the advice
• Advise the MDEQ on the need for identification of the sources of fecal indicators and pathogens based on the potential risk and, if appropriate, identify possible sources of pathogens present
• Advise the MDEQ on the appropriate methods for sampling the detritus and the appropriate standards for protection of the public health from potential exposure to the detritus
• Respond to questions from the public dealing specifically with E. coli
The committee consisted of scientists and public health experts and was to address the problem through the development of a report to the MDEQ and through direct guidance to the public through addressing specific questions or concerns.

2
II. Members of the Science Committee Pathogen Work Group and Other Technical Assistance
Table 1. Committee members Name Affiliation
Joan Rose (Committee Chair) Michigan State University
Christine Alexander Michigan Department of Environmental Quality Water Bureau
Tim Bolen Michigan Department of Community Health Region 3 Midland County
Juli Dyble NOAA’s Center of Excellence for Great Lakes and Human Health
Sonia Joseph NOAA’s Center of Excellence for Great Lakes and Human Health
Dale Lipar Huron County Health Department
Joel Strasz Bay County Health Department
Gretchen Tenbusch Huron and Tuscola County Health Departments
Dave Wade Michigan Department of Community Health
Tim Wade Environmental Protection Agency Office of Research and Development
Table 2. Other technical assistance Name Affiliation
Jim Bredin Michigan Department of Environmental Quality
Brenda Brennan Michigan Department of Community Health
Shannon Briggs Michigan Department of Environmental Quality
Ernie Krieger Fifth District Commissioner, Bay County
Lekha Kumar Michigan State University
Joe McBride Resident of Saginaw Bay Area
Rachel McNinch Michigan State University
3
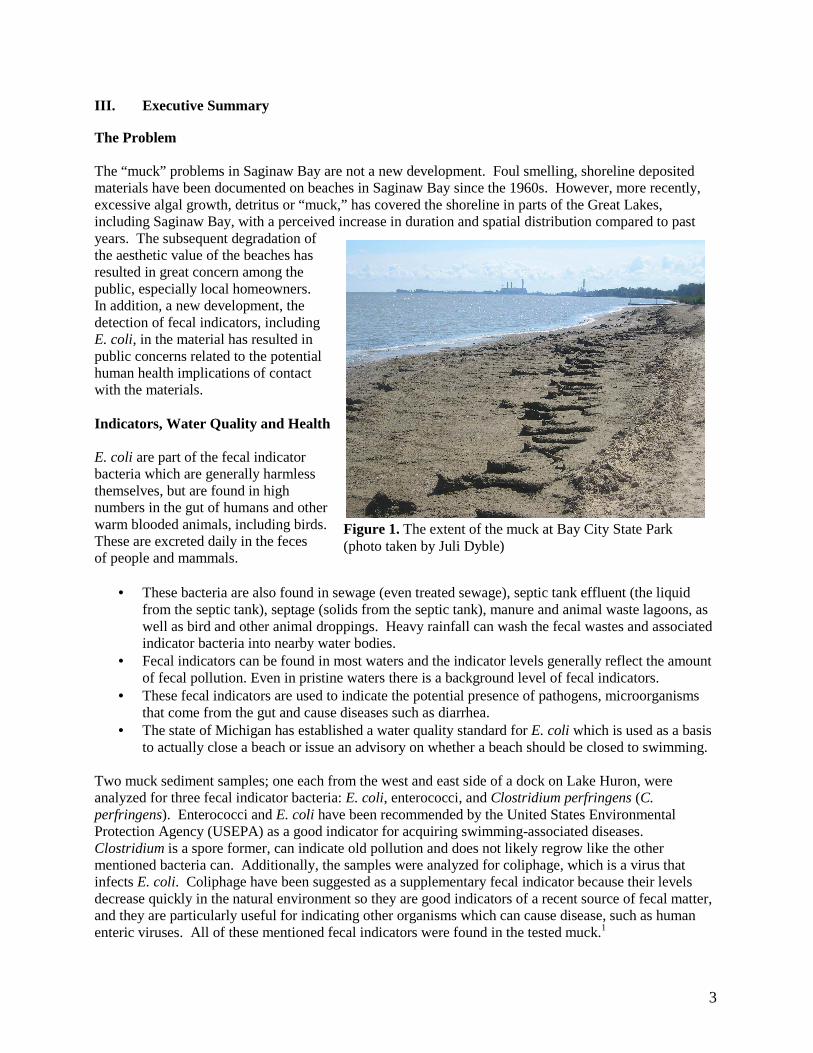
Figure 1. The extent of the muck at Bay City State Park (photo taken by Juli Dyble)
III. Executive Summary The Problem The “muck” problems in Saginaw Bay are not a new development. Foul smelling, shoreline deposited materials have been documented on beaches in Saginaw Bay since the 1960s. However, more recently, excessive algal growth, detritus or “muck,” has covered the shoreline in parts of the Great Lakes, including Saginaw Bay, with a perceived increase in duration and spatial distribution compared to past years. The subsequent degradation of the aesthetic value of the beaches has resulted in great concern among the public, especially local homeowners. In addition, a new development, the detection of fecal indicators, including E. coli, in the material has resulted in public concerns related to the potential human health implications of contact with the materials. Indicators, Water Quality and Health E. coli are part of the fecal indicator bacteria which are generally harmless themselves, but are found in high numbers in the gut of humans and other warm blooded animals, including birds. These are excreted daily in the feces of people and mammals.
• These bacteria are also found in sewage (even treated sewage), septic tank effluent (the liquid from the septic tank), septage (solids from the septic tank), manure and animal waste lagoons, as well as bird and other animal droppings. Heavy rainfall can wash the fecal wastes and associated indicator bacteria into nearby water bodies.
• Fecal indicators can be found in most waters and the indicator levels generally reflect the amount of fecal pollution. Even in pristine waters there is a background level of fecal indicators.
• These fecal indicators are used to indicate the potential presence of pathogens, microorganisms that come from the gut and cause diseases such as diarrhea.
• The state of Michigan has established a water quality standard for E. coli which is used as a basis to actually close a beach or issue an advisory on whether a beach should be closed to swimming.
Two muck sediment samples; one each from the west and east side of a dock on Lake Huron, were analyzed for three fecal indicator bacteria: E. coli, enterococci, and Clostridium perfringens (C. perfringens). Enterococci and E. coli have been recommended by the United States Environmental Protection Agency (USEPA) as a good indicator for acquiring swimming-associated diseases. Clostridium is a spore former, can indicate old pollution and does not likely regrow like the other mentioned bacteria can. Additionally, the samples were analyzed for coliphage, which is a virus that infects E. coli. Coliphage have been suggested as a supplementary fecal indicator because their levels decrease quickly in the natural environment so they are good indicators of a recent source of fecal matter, and they are particularly useful for indicating other organisms which can cause disease, such as human enteric viruses. All of these mentioned fecal indicators were found in the tested muck.1
4
Surface Agriculture Animal operations CSOs SSOs Wildlife
Ground Septic systems
Inputs
rainfall
LakesRivers
Sediments
wind dredging
Muck
algal blooms
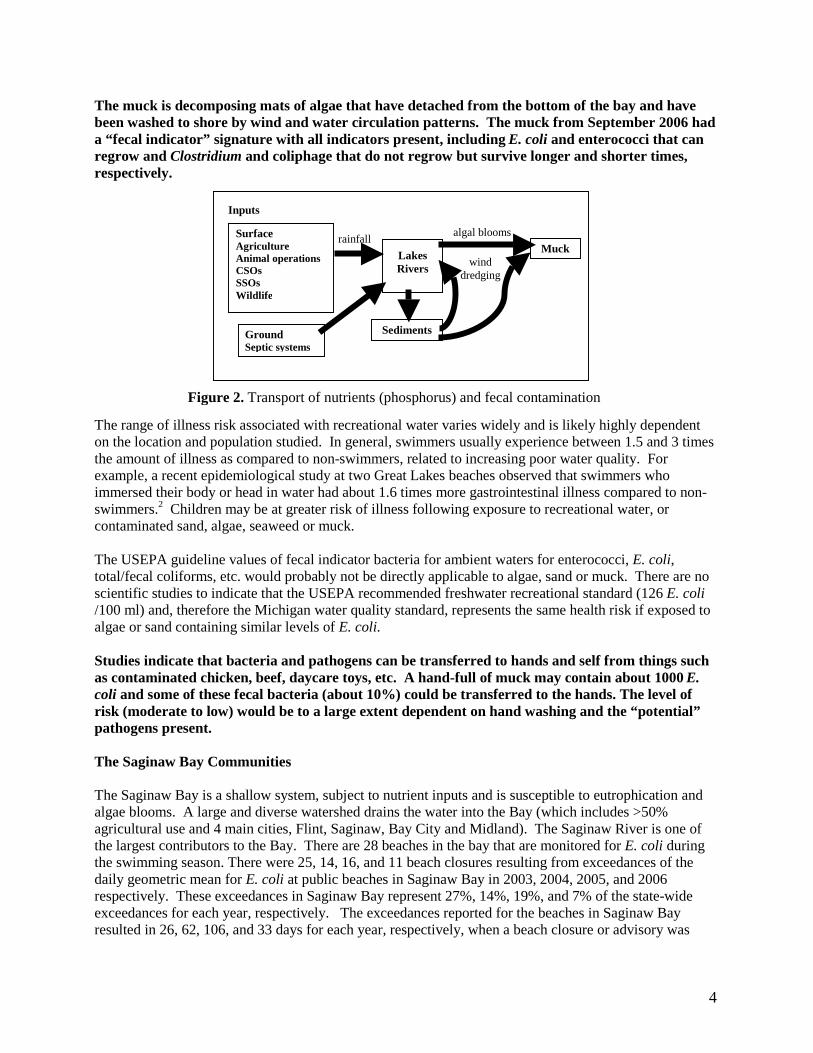
The muck is decomposing mats of algae that have detached from the bottom of the bay and have been washed to shore by wind and water circulation patterns. The muck from September 2006 had a “fecal indicator” signature with all indicators present, including E. coli and enterococci that can regrow and Clostridium and coliphage that do not regrow but survive longer and shorter times, respectively.
The range of illness risk associated with recreational water varies widely and is likely highly dependent on the location and population studied. In general, swimmers usually experience between 1.5 and 3 times the amount of illness as compared to non-swimmers, related to increasing poor water quality. For example, a recent epidemiological study at two Great Lakes beaches observed that swimmers who immersed their body or head in water had about 1.6 times more gastrointestinal illness compared to non-swimmers.2 Children may be at greater risk of illness following exposure to recreational water, or contaminated sand, algae, seaweed or muck. The USEPA guideline values of fecal indicator bacteria for ambient waters for enterococci, E. coli,total/fecal coliforms, etc. would probably not be directly applicable to algae, sand or muck. There are no scientific studies to indicate that the USEPA recommended freshwater recreational standard (126 E. coli /100 ml) and, therefore the Michigan water quality standard, represents the same health risk if exposed to algae or sand containing similar levels of E. coli.
Studies indicate that bacteria and pathogens can be transferred to hands and self from things such as contaminated chicken, beef, daycare toys, etc. A hand-full of muck may contain about 1000 E. coli and some of these fecal bacteria (about 10%) could be transferred to the hands. The level of risk (moderate to low) would be to a large extent dependent on hand washing and the “potential” pathogens present. The Saginaw Bay Communities The Saginaw Bay is a shallow system, subject to nutrient inputs and is susceptible to eutrophication and algae blooms. A large and diverse watershed drains the water into the Bay (which includes >50% agricultural use and 4 main cities, Flint, Saginaw, Bay City and Midland). The Saginaw River is one of the largest contributors to the Bay. There are 28 beaches in the bay that are monitored for E. coli during the swimming season. There were 25, 14, 16, and 11 beach closures resulting from exceedances of the daily geometric mean for E. coli at public beaches in Saginaw Bay in 2003, 2004, 2005, and 2006 respectively. These exceedances in Saginaw Bay represent 27%, 14%, 19%, and 7% of the state-wide exceedances for each year, respectively. The exceedances reported for the beaches in Saginaw Bay resulted in 26, 62, 106, and 33 days for each year, respectively, when a beach closure or advisory was
Figure 2. Transport of nutrients (phosphorus) and fecal contamination
5
issued. These beach closure days for Saginaw Bay represent 19%, 11%, 22%, and 4% of the state-wide beach closure days for each year, respectively. The Michigan Department of Community Health (MDCH) and local county health departments surrounding Saginaw Bay (e.g. Arenac, Bay, Huron and Tuscola) do monitor the disease in their communities. Any person, doctor or laboratory can report an illness. Often it is not clear how the person got the illness or came in contact with the pathogen, but some of these could be from the water. There are multiple ways people get sick, and under-reporting is still a problem (more disease out there then what is reported). Hand-washing is still very important to help prevent the spread of all fecal-associated diseases. Disease that are noted in these counties include Campylobacter, Salmonella ,Shigella, pathogenic E. coli,parasites (Cryptosporidium and Giardia) and human viruses (hepatitis A virus). The following potential fecal sources may contribute indicators and pathogens; from animals and humans (Campylobacter, Salmonella, pathogenic E. coli and parasites such as Cryptosporidium and Giardia) and human wastes (Shigella, and viruses). Agriculture Domestic animal operations Wildlife Pets, birds and wildlife (e.g. deer and waterfowl) Dredging Activities Re-suspension of fecal indicator organisms in sediments during dredging operations can elevate indicator organism concentrations. Human Treated and untreated discharges of sewage originating from combined sewer overflow (CSO), sanitary sewer overflow (SSO), wastewater treatment plants, septic tanks (functioning and failing) and the application of septage/biosolids to land are all possible sources of fecal contamination to Saginaw Bay Monitoring Our Water and Health A special program was developed to assist the public to report on any water related diseases. The WaterWatch website and instructions will be made public through various newspapers, TV, radio outlets and health department outreach. The website will remain active May 2nd through October 1st, 2007. The intent of WaterWatch is to increase public health surveillance for waterborne diseases, both sporadic cases and potential outbreak situations. The MDCH and MDEQ will work together to coordinate illness data and environmental data, The MDCH and local health departments hope to detect potential health risks in the Saginaw Bay area and implement an appropriate public health intervention. It is expected that water testing at public beaches will continue. The Michigan water quality standards will continue to provide the basis for when a beach is closed or a swimming advisory issued. No standard exists for “muck” but in the future, in order to address the need for such a standard, more sampling for characterization is needed. The Center for Water Sciences at Michigan State University, along with other science experts and stakeholders in the state are developing methods, databases and survey tools for alternative indicators, source tracking microbes and for “true” pathogens. These will be available so that groups can better monitor the environmental conditions and determine potential health risk. These tools and approaches will help citizens and communities, community leaders and state
6
officials address critical questions for example, regarding public health action, long-term investment in wastewater and animal waste treatment needs. Recommendations
Many healthy beaches and healthy swimming campaigns have a set of guidelines for citizens to follow in attempts to better the quality of their beaches.3 Such guidelines include:
• Keeping the beach clean of trash • Use of toilet facilities • Use of appropriate areas for diaper changing • Staying out of the water if ill • Cleaning up food debris • Washing hands with soap and water • Using appropriate tap or bottled water for drinking purposes
As the MDEQ now allows hand removal of debris (dead vegetation) manually without a permit, contact with the material may represent a public health risk. This risk can be minimized and by doing so may also present opportunities to decrease any public health risk associated with inadvertent exposure to children and others.
The recommendations below have been developed by the Saginaw Bay Science Committee regarding action that could be taken to assist in addressing any potential health risks associated with contact with the muck. These recommendations are not listed in any specific order as the Science Committee believes that each of these recommendations is equally important. A comprehensive environmental sampling plan, given the appropriate financial resources, should be developed to better characterize sources, potential health risks and management strategies. There are very limited data on the fecal signature of the muck itself. While the beach water quality continues to be monitored for E. coli according to the requirements of the State, this information does not always address the source of the contamination or define the risk under unique exposure scenarios. This includes exposure to the muck itself or the sand, or shallow waters.
• Sampling should include the muck to better characterize the fecal signatures. • Routine indicators and alternative indicators as well as pathogens should be included in
specialized studies to address health risks. • A study using source tracking techniques should be developed over a variety of time steps and
geographical locations to improve an understanding of inputs. • More sampling of the water at different depths should be included to better address children’s
exposure. • An improved understanding of nutrient inputs (including phosphorus) and other sources of
ecological stressors and their role in formation of the muck should be further investigated to improve management decisions.
Broad communication and public outreach should be developed to adequately educate citizens on methods to reduce the exposure to the muck in the absence of well-defined risks.
Personal exposure to the muck is primarily through contact with hands or feet if one walks through the debris toward the water. The public health risk is through transfer of the “potential microbes” to the
7
mouth or nose or through cuts in the skin. Good hygiene and mechanical approaches of muck removal can be used to prevent exposure and the transfer of any material from the hands or feet to the mouth or nose.
• Hands and feet as well as legs should be washed off after coming in contact with the muck. Hand washing with soap and water is preferred. In the absence of soap and water, alcohol gels and wipes have been shown to kill bacteria and viruses that could cause disease (e.g. E. coli and cold virus etc). Hand washing and or use of these disinfectants should used before drinking or eating anything.
• Young children should be supervised and washed off if they come in contact with the muck, particularly their hands and should not be allowed to place the muck in their mouth.
• Those individuals with cuts should avoid the muck but if contact is unavoidable the areas should be cleaned thoroughly with an antibacterial agent (e.g. Neosporin).
• If pets are exposed to the muck, they should be washed off. • Gloves and shoes should be worn if one has to come in contact with the debris and should be
thoroughly washed afterwards as this will help kill bacteria and viruses. • Public should observe and comply with public health orders including advisories and closures.
The public should be encouraged to report any illness to the local health department that they believe might be tied to exposure to the beach, muck or Bay water.
The local health department is responsible for community and environmental health and is developing a WaterWatch program with the assistance of the MDCH. Health professionals take all illnesses in the community seriously and it is their job to assist the public. The health department is trained to help to understand how disease is spread and will provide guidance on preventing disease transmission from the muck or through recreational waters.
• A WaterWatch program has been developed to capture self-reported illnesses thought to be
associated with muck, sand, or recreational waters. The public should actively participate and report any illness associated with exposure to the beach or waterway. Taking advantage of this program will assist public health officials in monitoring illness in the Saginaw Bay Watershed.
• Physicians and laboratories are required by Michigan law to report specified communicable diseases to the county health department.
Following the State requirements associated with removal of the dead debris and muck, good hygiene approaches should be used. Based on very limited sampling information, this muck could carry some public health risk associated with exposure (similar to playing in contaminated sand). While it is not known whether this risk is very low or moderate, good practices can be implemented that will reduce this risk.
• Gloves should be used when removing the debris/muck. • Shovels and rakes should be thoroughly washed off after use with soap and water. • Shoes, legs, hands, etc. should be washed with soap and water (or wiped with an alcohol
gel) to reduce bacteria and possible viruses. • The debris and/or muck should be disposed of through composting or via a landfill.
8
PART I PUBLIC HEALTH RISK
IV. The Problem of Detritus on the Shores of Saginaw Bay The “muck” problems in Saginaw Bay are not a new development. Foul smelling, shoreline deposited materials have been documented on beaches in Saginaw Bay since the 1960s. In a Michigan Department of Natural Resources (MDNR) memorandum dated August 31, 1961, beach deposit samples in the Bay City Park/Linwood area were reported to consist of the bodies of minute, free-swimming animals and rotting plant material including Cladophora.4 More recent MDNR and MDEQ reports (1978 and 1992) indicate similar findings.5,6 The 1978 MDNR report indicated that similar deposits were found at Harbor Beach (Huron County) and Au Gres (Arenac County).5 The detection of fecal indicators, including E. coli, in the material, has raised concerns regarding the potential public health risks associated with exposure to this material. In the past five to ten years, excessive Cladophora growth has re-emerged in numerous areas of the Great Lakes and its deposition and decomposition on the beaches has resulted in widespread concern about how to manage this “muck”. While muck has been present on beaches for decades, a new development has been the testing for and detection of fecal indicators, including E. coli, in this material. As a result, public concern related to potential human health implications, degraded aesthetic conditions, and decreasing lakefront property values because of the buildup of decomposing Cladophora and other materials on beaches has increased. From a historic perspective, the recent resurgence of Cladophora in the Great Lakes, including Saginaw Bay, is puzzling. Much of the public has become aware of the problem through observation or the media, but has been poorly informed of the nature of the problem.7
Within the Great Lakes, nuisance conditions have been reported in Wisconsin at many sites ranging from northeastern Green Bay and the tip of Door County to the most southeastern county of Kenosha. In 2004, the results of a Wisconsin monitoring survey indicated that Cladophora growth was abundant along Wisconsin’s entire Lake Michigan shoreline.8 Cladophora stranding extend to Lake Michigan shores in Illinois, Indiana and Michigan and also to portions of Lakes Huron, Erie and Ontario. Only Lake Superior appears to be spared. Nuisance growths of Cladophora in the Great Lakes are not an isolated problem due solely to localized conditions. In Wisconsin the amount of Cladophora biomass that washes ashore varies between years and locations. Mats of stranded algae may be feet thick in some areas – often in embayments where calmer waters allow the algal biomass to collect (e.g. Hika Bay, Cleveland, Wisconsin). In other areas, accumulations are minor or non-existent or the decaying algae may remain submerged, offshore or confined to the swash zone. The location, frequency and severity of algae accumulations are likely dictated by a combination of factors including offshore production, prevailing winds, water currents, storms and nearshore morphology.7
In 2003 surveys were conducted along the southeastern shores of Lake Huron by the Ontario Ministry of the Environment to document water quality conditions in the area. The study identified shoreline and littoral areas of the lake with incidents of heavy growth of benthic algae and shoreline fouling by algae. Localized problems in the Goderich, Ontario, Canada area appear to date back to the 1980s.9
9
V. E. coli and Indicators of Water Quality Problems To evaluate the microbial safety of most public beaches, water samples are regularly tested for the presence of fecal indicator bacteria. Fecal indicator bacteria are bacteria that are generally harmless themselves, but are found in high numbers in the gut of humans and other warm blooded animals, including birds. These are excreted daily in the feces of people and mammals.
• These bacteria are also found in sewage (even treated sewage), septic tank effluent (the liquid from the septic tank), septage (solids from the septic tank) manure and animal waste lagoons as well as bird and other animal droppings. Heavy rainfall can wash the fecal wastes and associated indicator bacteria into nearby water bodies.
• Fecal indicators can be found in most waters and the indicator levels generally reflect the amount of fecal pollution. Even in pristine waters there is a background level of fecal indicators.
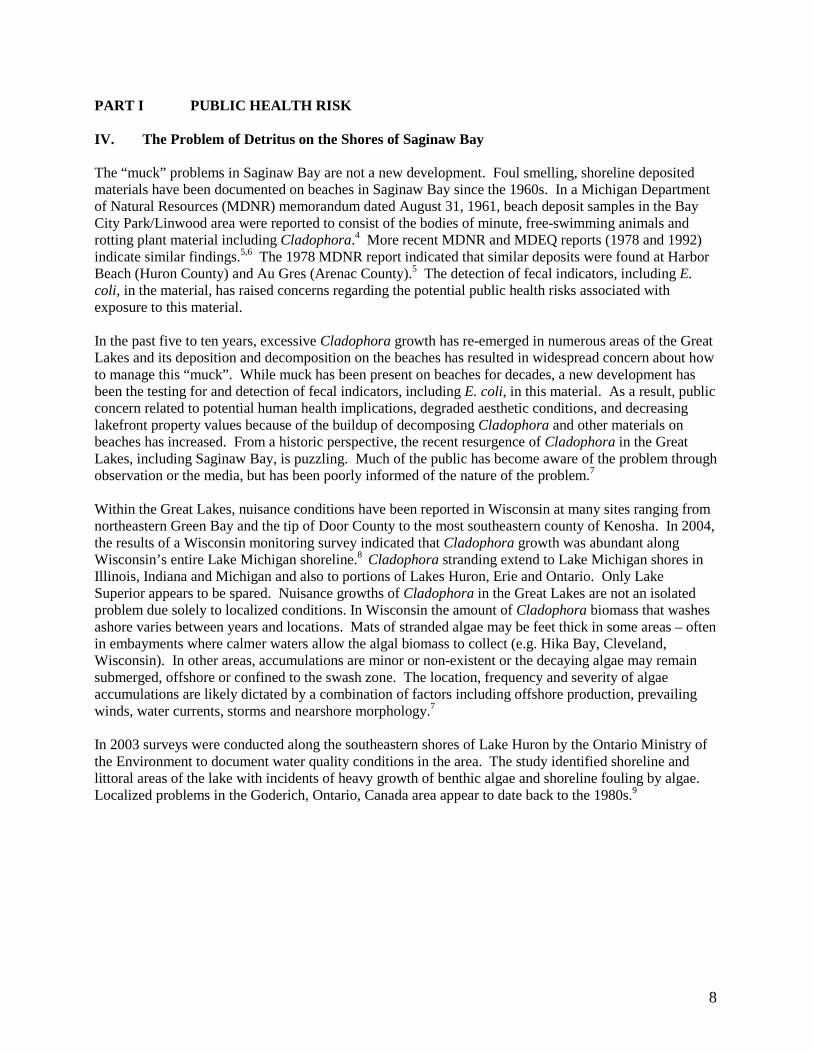
The presence and level of these fecal bacteria may indicate the presence of other, more harmful pathogenic microorganisms, which could cause disease in humans. Pathogens in water are known as “waterborne” and can include bacteria (e.g. Campylobacter, Salmonella and Shigella), parasites (e.g. Cryptosporidium or Giardia) and viruses (e.g. Norovirus). These pathogens cause disease in humans after ingestion and the larger the volume of ingestion, the greater the numbers of pathogens, the greater the risk. Disease can also be spread by exposure to contaminated sprays, skin contact and contamination of hands (which can spread the pathogens to food or directly to the mouth and nose). Examples of fecal indicator bacteria historically used for monitoring of recreational waters include the coliform group (total and fecal), E. coli and enterococci. Currently, the State of Michigan uses an E. coli standard based on that suggested and approved by the USEPA (Table 3). The USEPA suggests that both E. coli and enterococci could be used though. These standards are measured as colony forming units (CFU) that represent the number of bacteria cells that can grow to colonies (a group of cells visible to the eye) in the laboratory. Table 3 shows the Michigan Water Quality Standards (WQS) and the 1986 USEPA Ambient Water Quality Criteria for Bacteria.
10
Table 3. Water quality standards/criteria for recreational waters (USEPA -1986, MDEQ- 2007)10 INDICATOR CONTACT MDEQ
(cfu/100 ml) USEPA
(cfu/100 ml) E. coli
Total Body Contact recreation (May 1- Oct.31)
�130 based on the geometric mean of all individual samples taken during 5 sampling events representatively spread over a
30-day period
�126
�300 based on the geometric mean of 3 or
more samples taken during the same sampling event
�235-576#
Partial body contact recreation (year round)
�1,000 as a daily geometric mean
none
Fecal coliform �200* based on the geometric mean of all of 5 or more samples taken over
a 30- day period
none
�400* based on the geometric mean of all of 3
or more samples taken during any period of
discharge not to exceed 7 days
none
Enterococci No standard �33 as a 30-day geometric mean
No standard �61 as a daily geometric
mean
*applies to regulated discharges containing treated or untreated human sewage. #varies depending on expected degree of body contact recreation Common fecal indicator bacteria (total coliform, fecal coliform, E. coli and enterococci bacteria) are used to establish acceptable quality of drinking water, wastewater and recreational waters. They each have advantages and disadvantages in their application. Other fecal indicators have also been used for water quality determinations to overcome some of the deficiencies of using a single indicator. These alternative fecal indicators include coliphage and Clostridium. They are found in animal and human waste but generally at lower numbers than the more common indicators.
• Coliphage: a fecal indicator but are viruses that infect E. coli bacteria, found in feces in animals and humans and the advantage is that they do not regrow in the environment unlike the bacteria, used for groundwater (goal 0/1liter in groundwater) and survive only a short time in water and may indicate more recent fecal pollution
• Clostridium perfringes: fecal bacteria (are not coliforms) that produce a spore and survive for a long time in the environment, do not like oxygen and do not regrow in the environment, can represent old fecal contamination and is used as an indicator for beaches in Hawaii11
11
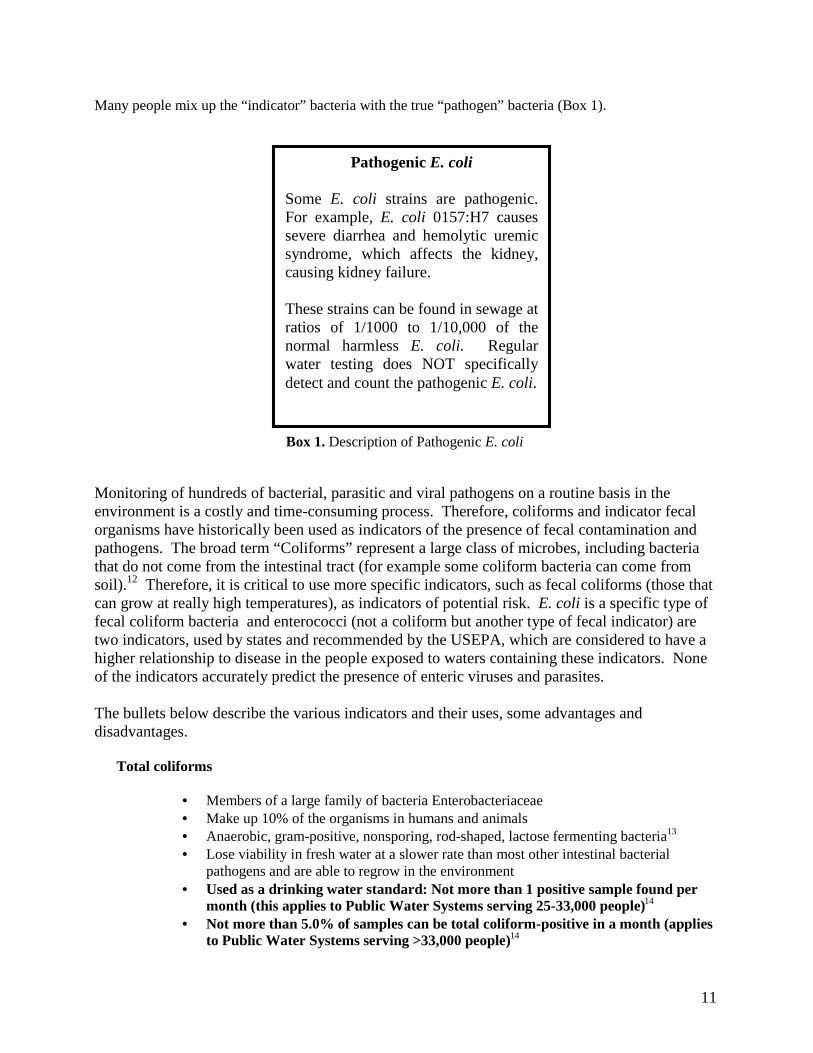
Many people mix up the “indicator” bacteria with the true “pathogen” bacteria (Box 1).
Box 1. Description of Pathogenic E. coli
Monitoring of hundreds of bacterial, parasitic and viral pathogens on a routine basis in the environment is a costly and time-consuming process. Therefore, coliforms and indicator fecal organisms have historically been used as indicators of the presence of fecal contamination and pathogens. The broad term “Coliforms” represent a large class of microbes, including bacteria that do not come from the intestinal tract (for example some coliform bacteria can come from soil).12 Therefore, it is critical to use more specific indicators, such as fecal coliforms (those that can grow at really high temperatures), as indicators of potential risk. E. coli is a specific type of fecal coliform bacteria and enterococci (not a coliform but another type of fecal indicator) are two indicators, used by states and recommended by the USEPA, which are considered to have a higher relationship to disease in the people exposed to waters containing these indicators. None of the indicators accurately predict the presence of enteric viruses and parasites. The bullets below describe the various indicators and their uses, some advantages and disadvantages.
Total coliforms
• Members of a large family of bacteria Enterobacteriaceae • Make up 10% of the organisms in humans and animals • Anaerobic, gram-positive, nonsporing, rod-shaped, lactose fermenting bacteria13 • Lose viability in fresh water at a slower rate than most other intestinal bacterial
pathogens and are able to regrow in the environment • Used as a drinking water standard: Not more than 1 positive sample found per
month (this applies to Public Water Systems serving 25-33,000 people)14 • Not more than 5.0% of samples can be total coliform-positive in a month (applies
to Public Water Systems serving >33,000 people)14
Pathogenic E. coli
Some E. coli strains are pathogenic. For example, E. coli 0157:H7 causes severe diarrhea and hemolytic uremic syndrome, which affects the kidney, causing kidney failure. These strains can be found in sewage at ratios of 1/1000 to 1/10,000 of the normal harmless E. coli. Regular water testing does NOT specifically detect and count the pathogenic E. coli.
12
• Usually detected in waters impacted by soil, animal feces or sewage • Not directly related to human health risk
Fecal Coliforms
• A special group of coliform bacteria, able to grow at 44.5ºC (112ºF) • Includes E. coli & Klebsiella • Strong indication of recent sewage or animal waste contamination • Drinking water standards 0 cfu/100ml15 • Sewage treatment plant National Pollutant Discharge Elimination System
(NPDES) standard is <200 cfu/100ml (geometric mean of all of 5 or more samples taken over a 30-day period), < 400cfu/100ml (geometric mean of all of 3 or more samples taken during any period of discharge, not to exceed 7 days)16
• Give a more specific indication of fecal contamination • Not well related to disease in studies of swimmers • Presence does not relate to presence of true pathogens parasites or viruses
E. coli
• A special member of the Fecal coliforms, and only few of the strains are pathogens13 • Drinking water standards 0 cfu/100ml (must be boiled before consumption if
present) 15 • Ambient standards for Michigan surface water between May 1st and October 31st,
<130cfu/100ml (30-day geometric mean), < 300cfu/100ml (daily geometric mean)10
• A high relationship with gastroenteritis (e.g. diarrhea) associated with recreating in fresh water but less so with gastroenteritis in marine waters17,18
• Some source tracking methods have been developed for E. Coli12 • Likely grows in the soil and sediment (shown to be very common in tropical locations)
Enterococci
• Found in the feces, a gram positive, non-spore forming from the taxonomic group of the bacteria streptococci
• Many strains are not harmful but presence is used as an indication of the possible presence of fecal contamination and true pathogens
• Drinking water standards 0 cfu/100ml15 • USEPA Recreational criteria suggested by the USEPA for fresh water
<33cfu/100ml (geometric mean) and <61cfu/100ml based on a single sample19 • Recreational criteria suggested by USEPA for marine water <35cfu/100ml
(geometric mean) and 104cfu/100ml for a single sample at a designated beach area19
• A high relationship with gastroenteritis (e.g. diarrhea) associated with swimming in fresh and marine water much better than fecal coliforms12
• Die at slower rate than fecal coliforms, thus greater persistence providing indications of fecal pollution12
• Can probably regrow in the environment (soils and sediments)
13
History of Indicators
Cabelli (a scientist that worked on recreational water quality for USEPA) described a water quality indicator as follows:
A health effects water quality indicator…is some microbial, chemical, or physical parameter which indexes the potential risk of infectious disease coincident with man’s use of the aquatic environment as a source of water, recreation, or food. In the final analysis, the best indicator---there is no ideal---is the one whose densities correlate best with health hazards associated with a given (preferably several) type of pollution.20
Cabelli further described two approaches to evaluating water quality indicators. The traditional approach was to compare the numbers in the water (densities) of the indicators to illness or symptom rates of the people using the water. A second approach was to compare indicator densities with pathogen densities to obtain correlations. (This second approach has not been shown to be successful, thus direct pathogen monitoring has been undertaken in some cases.)20
Some of the first official guidelines or standards were for total coliform bacteria at a value of 1000 CFU/100 ml of water and a fecal coliform limit of 200 CFU/100 ml. In the 1970s, the USEPA undertook a series of epidemiology studies (study of disease in the people using the beaches) to evaluate different water quality indicators. These studies were specifically designed to address beaches that were directly impacted by discharges from wastewater treatment plants. People at the beach were enrolled, and after a week, were asked about any illnesses they had experienced since their visit to the beach. Water samples were also collected and tested for the presence of indicator bacteria. The marine beach studies found that the enterococci group was best related (correlated) to gastrointestinal illnesses among bathers.21 In other words, more people reported illness on days when there were high levels of enterococci bacteria in the water compared to days when there were low levels of enterococci bacteria. E. coli was also positively correlated with gastrointestinal illness, but to a lesser extent than enterococci. Fecal coliform densities were not correlated with gastrointestinal illness. The marine studies were followed by a series of freshwater studies.18,22 These studies took place at Keystone Lake, Oklahoma and on Lake Erie at Erie, Pennsylvania and found both enterococci and E. coli were correlated with gastrointestinal illness. The 1986 USEPA guidelines recommended using E. coli or enterococci for freshwater and enterococci in marine water.19 The recommended guideline values for primary (full body) contact were based on “acceptable” risks of excess gastrointestinal illness of 8 excess cases for every 1000 swimmers in fresh waters and 19 excess cases of gastrointestinal illness for every 1000 swimmers in marine waters. The acceptable risks and guideline values were derived so that the estimated risks of illness associated with the prior fecal coliform standard of 200 cfu/100ml would not be exceeded. Since the completion of the USEPA studies, numerous studies with similar design have been conducted over the world. Generally these studies have supported the results of the USEPA studies: that increasing concentrations of fecal contamination are associated with increasing levels of illness, usually gastrointestinal illness. Three independent and systematic reviews of the literature have also supported these findings. None of these studies, however, examined relationships between contact with algae, muck or sand and illness.23,24,25
14
VI. Muck and Fecal Indicators
The muck can be comprised of a mix of algal species. The basic structure of the muck is generally dominated by the benthic (meaning that which is found in the sediment) filamentous green macroalgae Cladophora, which grows attached to hard substrates on the bottom of Saginaw Bay. Also included in the muck can be epiphytic (attaching) diatoms that colonize the blades of Cladophora and planktonic (freely in the water) microalgae such as the cyanobacteria Microcystis, the diatom Fragellaria and the green algae Spirogyra, which are all often abundant in the water column during the summer months. This dense biomass can also become a repository for other organisms that get washed up along the shore. Environmental stressors that contribute to the growth and proliferation of Cladophora include nutrients and invasive species. Cladophora is a common indicator of eutrophication, or nutrient over-enrichment, and growth has been strongly linked to phosphorus, which can originate from point and non-point sources in Saginaw Bay (Section IX). Excessive growth of Cladophora was common in the 1950s to 1970s throughout the Great Lakes and reducing the biomass of this nuisance algae was one factor driving the Great Lakes Water Quality Agreements (GLWQA) (of 1972 and 1978) which resulted in a restriction in phosphorus concentrations in municipal wastewater discharge and detergents. A decline in Cladophora did result in the 1980s, only to re-emerge after the introduction of dreissenid mussels to the system in the early 1990s. Dreissenids (zebra and quagga mussels) increased water clarity through filter feeding, allowing increased light penetration to the bottom and therefore increased the depth in which benthic algae like Cladophora can grow. At shallow depths (<3m), Cladophora biomass and growth is limited by factors other than light (such as phosphorus), but at deeper depths small variations in light have large effects on biomass of standing stock.26 Low lake levels may also contribute to increased light penetration to the bottom. Cladophora also requires a hard substrate on which to attach to the bottom. Mussel beds provide additional substrate for Cladophora to grow, especially in soft substrates that might not be otherwise support benthic algal growth. Temperatures of 10-25°C (50-77°F) support the growth of Cladophora, restricting the growing season to the late spring and summer months. Once temperatures rise above 25°C (77°F), Cladophora begin to die-off. In the process, it detaches from the benthic substrates, often resulting in large mats floating at the surface. Depending on the wind direction and water circulation patterns, these algal mats can be washed up on the shorelines. Subsequent decomposition of this algal biomass results in the muck that is prevalent on some sections of shoreline in Saginaw Bay. Due to concerns by local residents regarding potential human health risks associated with the accumulation of muck on the shoreline, samples were collected for the assessment of microorganisms associated with fecal contamination. Samples were collected at the west and east sides of a dock in Lake Huron, Port Austin, Huron County, Michigan, and were delivered to the Water Quality and Health Laboratory at Michigan State University on September 6, 2006. The samples underwent 1) microscopic analysis and 2) microbial analysis. 1. Microscopic analysis Samples were supplied directly to Dr. Orlando Sarnelle, Department of Fisheries and Wildlife, Michigan State University. The samples appeared to be the consistency of mud, with decomposed plants or green algae. Microscopic analysis showed that benthic (bottom-dwelling) diatoms were the most abundant organisms and also present were filamentous green algae and a few filamentous cyanobacteria (fairly rare) (Figure 3). A diverse assemblage of non-planktonic protozoans was also present.
15
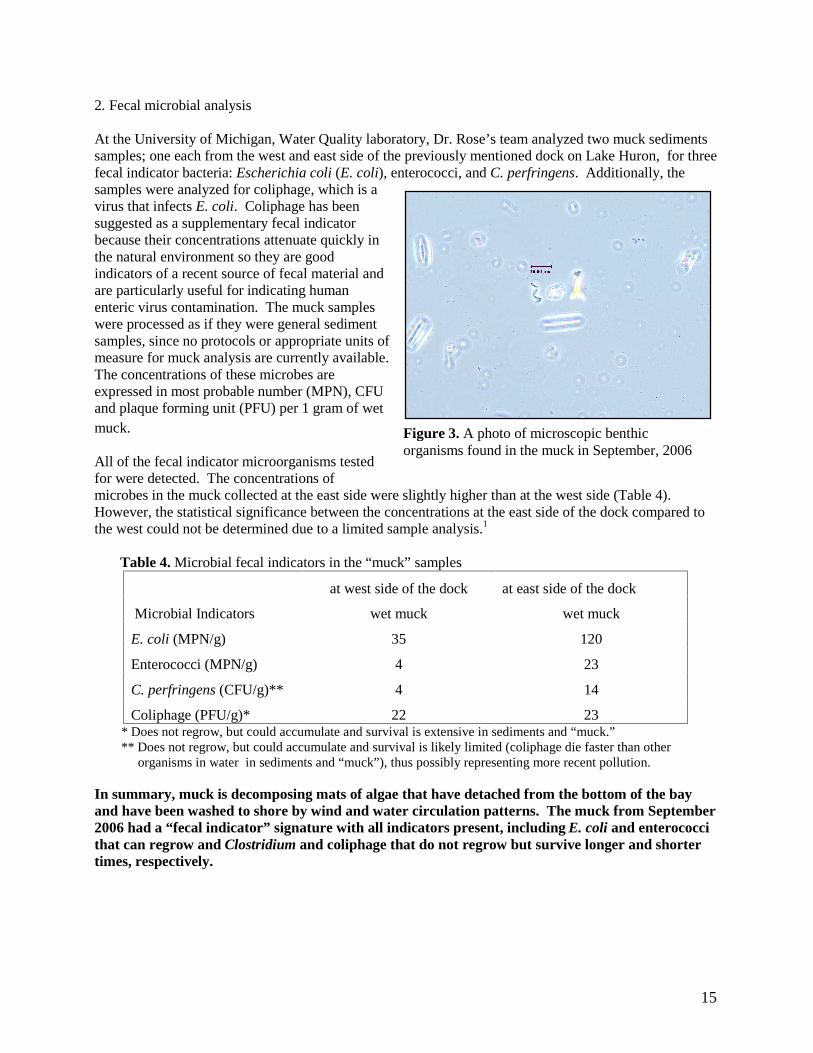
Figure 3. A photo of microscopic benthic organisms found in the muck in September, 2006
2. Fecal microbial analysis
At the University of Michigan, Water Quality laboratory, Dr. Rose’s team analyzed two muck sediments samples; one each from the west and east side of the previously mentioned dock on Lake Huron, for three fecal indicator bacteria: Escherichia coli (E. coli), enterococci, and C. perfringens. Additionally, the samples were analyzed for coliphage, which is a virus that infects E. coli. Coliphage has been suggested as a supplementary fecal indicator because their concentrations attenuate quickly in the natural environment so they are good indicators of a recent source of fecal material and are particularly useful for indicating human enteric virus contamination. The muck samples were processed as if they were general sediment samples, since no protocols or appropriate units of measure for muck analysis are currently available. The concentrations of these microbes are expressed in most probable number (MPN), CFU and plaque forming unit (PFU) per 1 gram of wet muck. All of the fecal indicator microorganisms tested for were detected. The concentrations of microbes in the muck collected at the east side were slightly higher than at the west side (Table 4). However, the statistical significance between the concentrations at the east side of the dock compared to the west could not be determined due to a limited sample analysis.1
Table 4. Microbial fecal indicators in the “muck” samples
at west side of the dock at east side of the dock
Microbial Indicators wet muck wet muck
E. coli (MPN/g) 35 120
Enterococci (MPN/g) 4 23
C. perfringens (CFU/g)** 4 14
Coliphage (PFU/g)* 22 23 * Does not regrow, but could accumulate and survival is extensive in sediments and “muck.”
** Does not regrow, but could accumulate and survival is likely limited (coliphage die faster than other organisms in water in sediments and “muck”), thus possibly representing more recent pollution. In summary, muck is decomposing mats of algae that have detached from the bottom of the bay and have been washed to shore by wind and water circulation patterns. The muck from September 2006 had a “fecal indicator” signature with all indicators present, including E. coli and enterococci that can regrow and Clostridium and coliphage that do not regrow but survive longer and shorter times, respectively.
16
VII. Relative Risks Associated with Exposure to Contaminated Sand, Muck and Water There have been no published studies directly measuring the risk of illness associated with exposure to contaminated muck, sand, algae or seaweed. Numerous studies have studied the risk of illness associated with exposure to recreational waters affected by sewage discharges. As described above, these studies have generally observed the following: 1) An increased risk of one or more types of illness associated with water contact and 2) An association between gastrointestinal illness and increased levels of fecal contamination as measured by fecal indicator bacteria. Non enteric illnesses, such as rash, respiratory illness, earaches, and eye irritations are often reported more frequently among swimmers compared to non-swimmers, but are less frequently associated with fecal indicator bacteria levels. Such illnesses could be due to a non-infectious exposure (e.g. irritation), or infectious exposures which are not associated with fecal pathogens (e.g. swimmer’s itch). The range of illness risk associated with recreational water varies widely and is likely highly dependent on the location and population studied. In general, swimmers usually experience between 1.5 and 3 times the amount of illness as compared to non-swimmers. For example, a recent epidemiological study at two Great Lakes beaches observed that swimmers who immersed their body or head in water had about 1.6 times more gastrointestinal illness compared to non-swimmers.2
Children may be at greater risk of illness following exposure to recreational water, or contaminated sand, algae, seaweed or muck. While this has not been formally demonstrated, Wade (2003) observed that studies of exposure to recreational water that included children tended to report higher risks of illness compared to those studies that did not study children.23 Children may be at a higher risk of illness because they may be more likely to swallow water during swimming and also may be more likely to put contaminated sand, algae or muck in their mouth. They also may not be as likely to wash their hands prior to eating food after they have come in contact with contaminated water, sand, algae or muck. Differences in immune system susceptibility and response may also make children more susceptible to infection and/or illness after such contact. Children are also probably more likely to play with or in sand, algae and muck. In recent epidemiological studies conducted at four Great Lakes beaches, approximately 4% of children age 10 and under, reported playing with algae, compared to 1% of those over 20 years old.27 Children were also much more likely to dig in the sand (83%) or have their body buried in the sand (27%) compared to other age groups (44% of those 35 and over reported digging in the sand and 11% reported having their body buried in sand). The types of illnesses which could be associated with contact with contaminated sand and muck are probably similar to those that can be contacted from contaminated recreational waters (gastrointestinal, rash, earaches, respiratory and eye irritations). Most of these illnesses tend to be mild and self-limiting, but in some cases can impact on daily activities resulting in loss of time from work or school, or visits to the doctor could be experienced. Studies have found E. coli and enterococci in the sand at concentrations of about 1 to 6000 CFU per 100 grams of sand, but it is unknown whether these concentrations cause illness. In a Lake Michigan study, these bacteria have also been reported on algae.28
It seems likely that the risk associated with contact with muck and/or algae will depend on the specific nature of the contaminants, both pathogenic and non-pathogenic at a particular site and the concentration of the pathogens. Furthermore, the guideline values of fecal indicator bacteria for ambient waters for enterococci, E. coli, total/fecal coliforms, etc. would probably not be directly applicable to algae, sand, and muck. In other words there is no evidence to indicate that the suggested USEPA recommended freshwater recreational water standard (126 E. coli /100 ml), and therefore the Michigan water quality standard, represents the same health risk in a sample of algae or sand as it does in ambient waters.
17
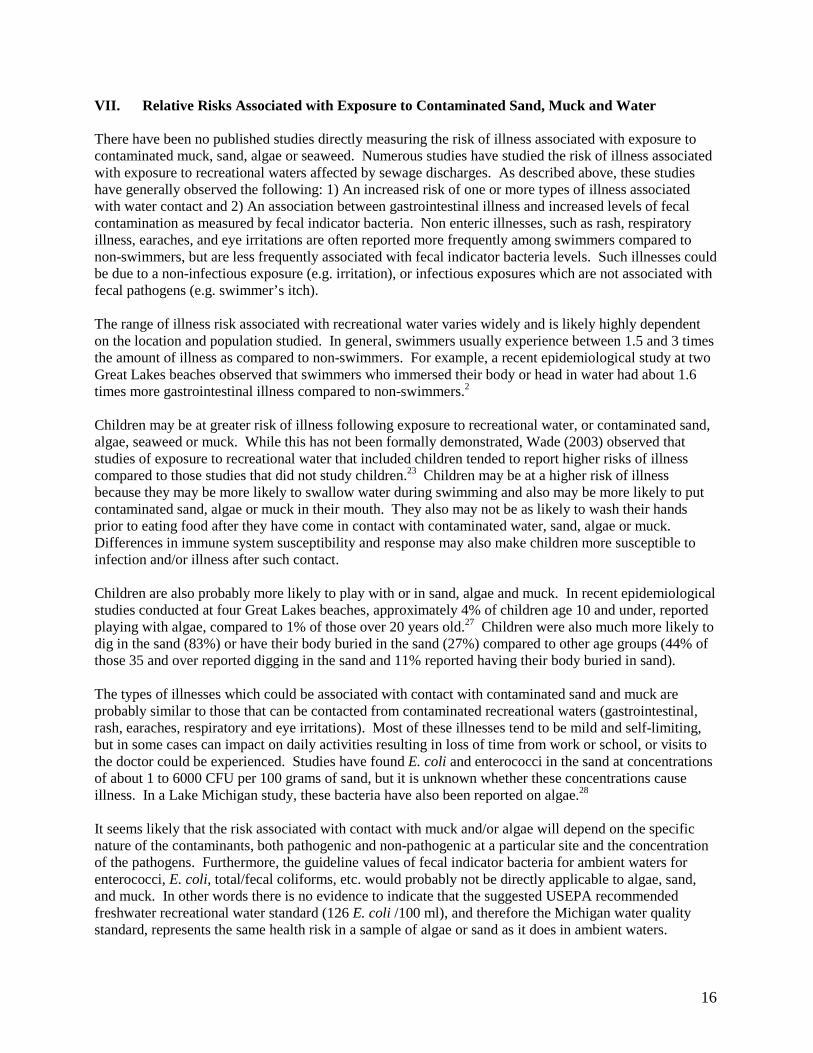
Figure 4. An aerial photograph of the Saginaw Bay
Studies indicate that bacteria and pathogens can be transferred to hands and self from things such as contaminated chicken, beef, daycare toys, etc. A hand-full of muck may contain about 1000 E. coli and some of these fecal bacteria (about 10%) could be transferred to the hands. The level of risk (moderate to low) would be to a large extent dependent on hand washing and the “potential” pathogens present.
18
PART II. BACKGROUND ON SAGINAW BAY VIII. Description of Saginaw Bay Watershed and Beaches
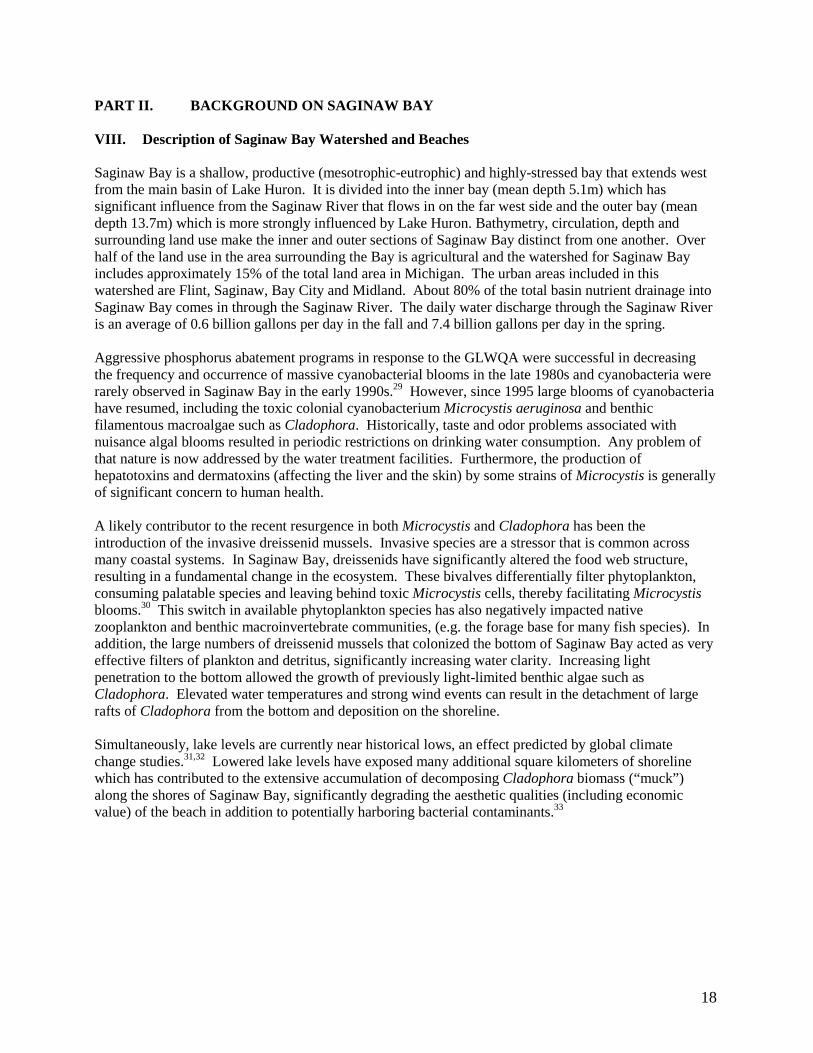
Saginaw Bay is a shallow, productive (mesotrophic-eutrophic) and highly-stressed bay that extends west from the main basin of Lake Huron. It is divided into the inner bay (mean depth 5.1m) which has significant influence from the Saginaw River that flows in on the far west side and the outer bay (mean depth 13.7m) which is more strongly influenced by Lake Huron. Bathymetry, circulation, depth and surrounding land use make the inner and outer sections of Saginaw Bay distinct from one another. Over half of the land use in the area surrounding the Bay is agricultural and the watershed for Saginaw Bay includes approximately 15% of the total land area in Michigan. The urban areas included in this watershed are Flint, Saginaw, Bay City and Midland. About 80% of the total basin nutrient drainage into Saginaw Bay comes in through the Saginaw River. The daily water discharge through the Saginaw River is an average of 0.6 billion gallons per day in the fall and 7.4 billion gallons per day in the spring. Aggressive phosphorus abatement programs in response to the GLWQA were successful in decreasing the frequency and occurrence of massive cyanobacterial blooms in the late 1980s and cyanobacteria were rarely observed in Saginaw Bay in the early 1990s.29 However, since 1995 large blooms of cyanobacteria have resumed, including the toxic colonial cyanobacterium Microcystis aeruginosa and benthic filamentous macroalgae such as Cladophora. Historically, taste and odor problems associated with nuisance algal blooms resulted in periodic restrictions on drinking water consumption. Any problem of that nature is now addressed by the water treatment facilities. Furthermore, the production of hepatotoxins and dermatoxins (affecting the liver and the skin) by some strains of Microcystis is generally of significant concern to human health.
A likely contributor to the recent resurgence in both Microcystis and Cladophora has been the introduction of the invasive dreissenid mussels. Invasive species are a stressor that is common across many coastal systems. In Saginaw Bay, dreissenids have significantly altered the food web structure, resulting in a fundamental change in the ecosystem. These bivalves differentially filter phytoplankton, consuming palatable species and leaving behind toxic Microcystis cells, thereby facilitating Microcystis blooms.30 This switch in available phytoplankton species has also negatively impacted native zooplankton and benthic macroinvertebrate communities, (e.g. the forage base for many fish species). In addition, the large numbers of dreissenid mussels that colonized the bottom of Saginaw Bay acted as very effective filters of plankton and detritus, significantly increasing water clarity. Increasing light penetration to the bottom allowed the growth of previously light-limited benthic algae such as Cladophora. Elevated water temperatures and strong wind events can result in the detachment of large rafts of Cladophora from the bottom and deposition on the shoreline.
Simultaneously, lake levels are currently near historical lows, an effect predicted by global climate change studies.31,32 Lowered lake levels have exposed many additional square kilometers of shoreline which has contributed to the extensive accumulation of decomposing Cladophora biomass (“muck”) along the shores of Saginaw Bay, significantly degrading the aesthetic qualities (including economic value) of the beach in addition to potentially harboring bacterial contaminants.33
19
Thus, the ecology of Saginaw Bay is now fundamentally different and the current behavior of the system is dominated by stressors that have changed since original phosphorus abatement plans were developed.
Figure 5. The Saginaw Bay watershed boundary

20
Figure 6. Saginaw Bay watershed land use map
Table 5. Saginaw Bay watershed land use and population statistics Population About 500,000 people Counties in Watershed Includes a part of 22 counties Counties in the Bay 5 including Iosco, Arenac, Bay, Tuscola and
Huron Primary Urban and Industrial Centers Flint, Saginaw, Bay City and Midland. Land Uses Agriculture, manufacturing, tourism, outdoor
recreations, and a vast variety of wildlife Agriculture 6,195 square miles (56%) Barren 514 square miles (0.0%) Forested 1,757,125 square miles (24.8%) Rangeland 628,753 square miles (8.9%) Urban and Built-up 433,898 square miles (6.1%) Water 64,736 square miles (0.9%) Wetlands 235,345 square miles (3.3%) Number of Septic Tanks Unknown
21
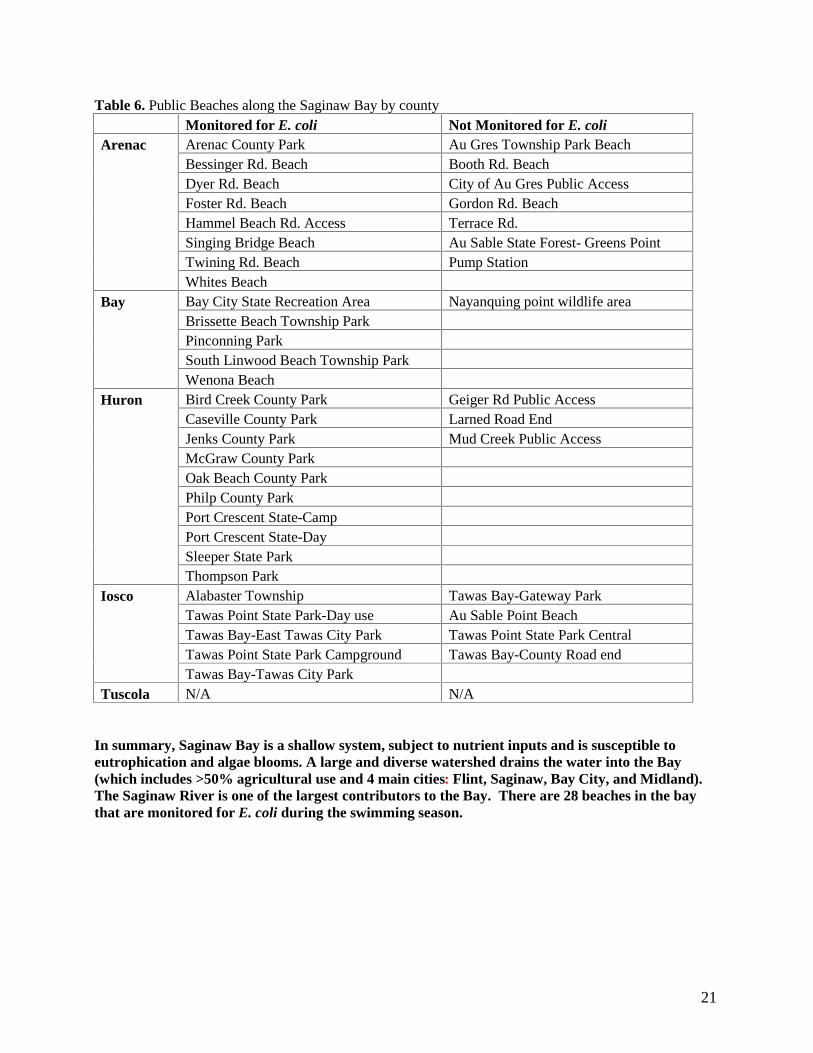
Table 6. Public Beaches along the Saginaw Bay by county
Monitored for E. coli Not Monitored for E. coli Arenac Arenac County Park Au Gres Township Park Beach
Bessinger Rd. Beach Booth Rd. Beach Dyer Rd. Beach City of Au Gres Public Access Foster Rd. Beach Gordon Rd. Beach Hammel Beach Rd. Access Terrace Rd. Singing Bridge Beach Au Sable State Forest- Greens Point Twining Rd. Beach Pump Station Whites Beach
Bay Bay City State Recreation Area Nayanquing point wildlife area Brissette Beach Township Park Pinconning Park South Linwood Beach Township Park Wenona Beach
Huron Bird Creek County Park Geiger Rd Public Access Caseville County Park Larned Road End Jenks County Park Mud Creek Public Access McGraw County Park Oak Beach County Park Philp County Park Port Crescent State-Camp Port Crescent State-Day Sleeper State Park Thompson Park
Iosco Alabaster Township Tawas Bay-Gateway Park Tawas Point State Park-Day use Au Sable Point Beach Tawas Bay-East Tawas City Park Tawas Point State Park Central Tawas Point State Park Campground Tawas Bay-County Road end Tawas Bay-Tawas City Park
Tuscola N/A N/A
In summary, Saginaw Bay is a shallow system, subject to nutrient inputs and is susceptible to eutrophication and algae blooms. A large and diverse watershed drains the water into the Bay (which includes >50% agricultural use and 4 main cities: Flint, Saginaw, Bay City, and Midland). The Saginaw River is one of the largest contributors to the Bay. There are 28 beaches in the bay that are monitored for E. coli during the swimming season.
22
IX. Sources of Enteric Indicators and Potential Pathogens in Saginaw Bay Fecal indicators in Saginaw Bay can originate from a wide variety of sources. The appearance, concentration and stability of the fecal indicators in water can be complex. Specific sources of fecal indicators will be discussed in greater detail in subsequent sections but generic sources include CSOs, SSOs, storm water, failing and functioning on-site septic systems, agriculture, dredging and wildlife. The number of fecal indicators present may be dependent on any or all of the following factors:
• Type of waste treatment (e.g. adequate disinfection at the sewage treatment plant or a primary treatment during an overflow event).
• Age of the waste (e.g. stored manure allows for indicator die-off ) • Soil type (e.g. different soil types remove bacteria at different rates in drain fields) • Rainfall (saturated ground and rainfall and snowmelt will move the indicators and pathogens
from land to water). In the water environment the fecal indicators and pathogens can be very stable lasting for months and can accumulate or even regrow in the sediments or sand. This situation can make the job of detecting recent fecal contamination very difficult. To compound this issue, indicator organisms are used to predict the presence of harmful pathogens, not determine sources of contamination. When a water sample is collected, the source of the fecal indicators or pathogens can not be identified with the routine tests. In order to determine the source of fecal contamination, special fecal source tracking methods are needed. Source tracking methods help to identify the origin of some of the fecal indicators (e.g. humans vs. animals) but may not be able to clarify the exact input (e.g. septic tank vs. CSO pipes). These analyses are more expensive than the routine tests and, unless part of a comprehensive sampling plan, provide minimal information.34
The potential fecal sources include: Agriculture Domestic animal operations (e.g. cows, pigs) and the application of manure to land in the watershed can contribute fecal indicator organisms to tributaries which ultimately make their way to Saginaw Bay. Pathogens that can be found in animal waste include bacteria (Campylobacter, Salmonella, pathogenic E. coli) and parasites (Cryptosporidium and Giardia). Estimates from the United States Department of Agriculture (USDA) indicate a significant increase in both the number of cattle/calves (19%) and milk cows (45%) in the Saginaw Bay coastal area (Appendix 4). Wildlife Pets, birds and wildlife (e.g. deer and waterfowl) can also contribute to fecal indicator organisms. Pathogens that can be found in animal waste include are bacteria (Campylobacter, Salmonella, pathogenic E. coli) and parasites (Cryptosporidium and Giardia). Dredging Activities Re-suspension of fecal indicator organisms during dredging operations can elevate indicator organism concentrations. This activity is initiated by the United States Army Corps of Engineers (ACOE), municipalities and individuals for a variety of reasons. Because the source of indicator organisms can
23
vary greatly, pathogens present can be any or all of those listed above. In addition, distinguishing a recent contamination event from a re-suspension event is very difficult. Human Treated and untreated discharges of sewage originating from Waste Water Treatment Plants (WWTPs), CSOs, SSOs, storm water, septic tanks (functioning and failing) and the application of septage to land are all possible sources of fecal contamination to Saginaw Bay. These wastes can contribute human viruses (enteroviruses, noroviruses), parasites (Cryptosporidium and Giardia) and bacteria (Campylobacter, Salmonella, pathogenic E. coli, and human specific bacteria Shigella).
Many fecal sources are directly related to human activity in the watershed. Many people are concerned about the amount of raw and/or partially treated sewage being discharged to Saginaw Bay or its tributaries. CSOs and SSOs occur because of problems with infrastructure used to convey sanitary sewer and storm water. A combined system is designed to collect snowmelt, rainwater runoff, domestic sewage and industrial wastewater in the same pipe for treatment at a WWTP. During periods of heavy rain or snowmelt, wastewater in the pipe exceeds the capacity of the sewer system or the WWTP. In order to relieve the extra flow in the pipes discharge to a stream is necessary. CSOs are legal.
A sanitary sewer overflow is a discharge from a separate sewer system (e.g. the pipe only carries sanitary waste). Sewage is generally released onto the ground, streets and/or streams. These types of discharges (SSOs) are illegal and require immediate correction.
The municipalities in the Saginaw Bay Watershed with CSOs have opted to construct retention basins to provide primary treatment (e.g. settling and disinfection) prior to discharging to surface waters. Currently, there are no uncontrolled CSOs in the watershed – all CSOs receive primary treatment and therefore should not be a concern as much as other potential sources.
24
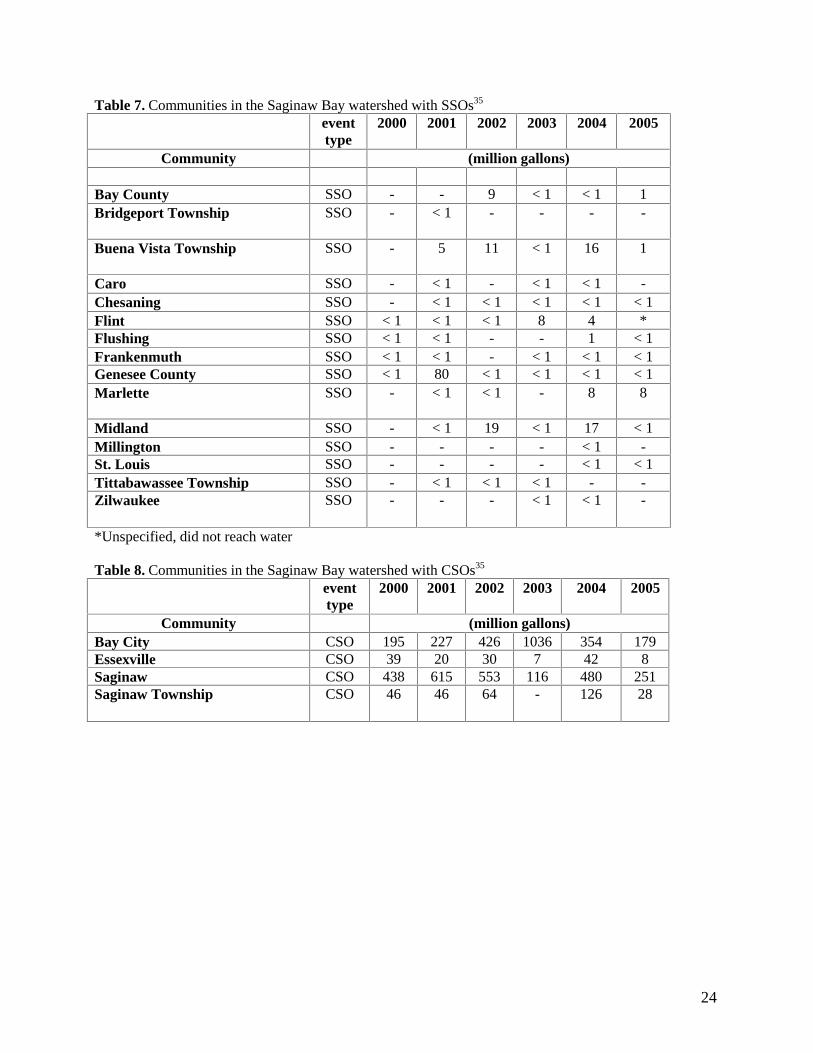
Table 7. Communities in the Saginaw Bay watershed with SSOs35 event type
2000 2001 2002 2003 2004 2005
Community (million gallons)
Bay County SSO - - 9 < 1 < 1 1 Bridgeport Township SSO - < 1 - - - -
Buena Vista Township SSO - 5 11 < 1 16 1
Caro SSO - < 1 - < 1 < 1 - Chesaning SSO - < 1 < 1 < 1 < 1 < 1 Flint SSO < 1 < 1 < 1 8 4 * Flushing SSO < 1 < 1 - - 1 < 1 Frankenmuth SSO < 1 < 1 - < 1 < 1 < 1 Genesee County SSO < 1 80 < 1 < 1 < 1 < 1 Marlette SSO - < 1 < 1 - 8 8
Midland SSO - < 1 19 < 1 17 < 1 Millington SSO - - - - < 1 - St. Louis SSO - - - - < 1 < 1 Tittabawassee Township SSO - < 1 < 1 < 1 - - Zilwaukee SSO - - - < 1 < 1 -
*Unspecified, did not reach water Table 8. Communities in the Saginaw Bay watershed with CSOs35
event type
2000 2001 2002 2003 2004 2005
Community (million gallons) Bay City CSO 195 227 426 1036 354 179 Essexville CSO 39 20 30 7 42 8 Saginaw CSO 438 615 553 116 480 251 Saginaw Township CSO 46 46 64 - 126 28
25
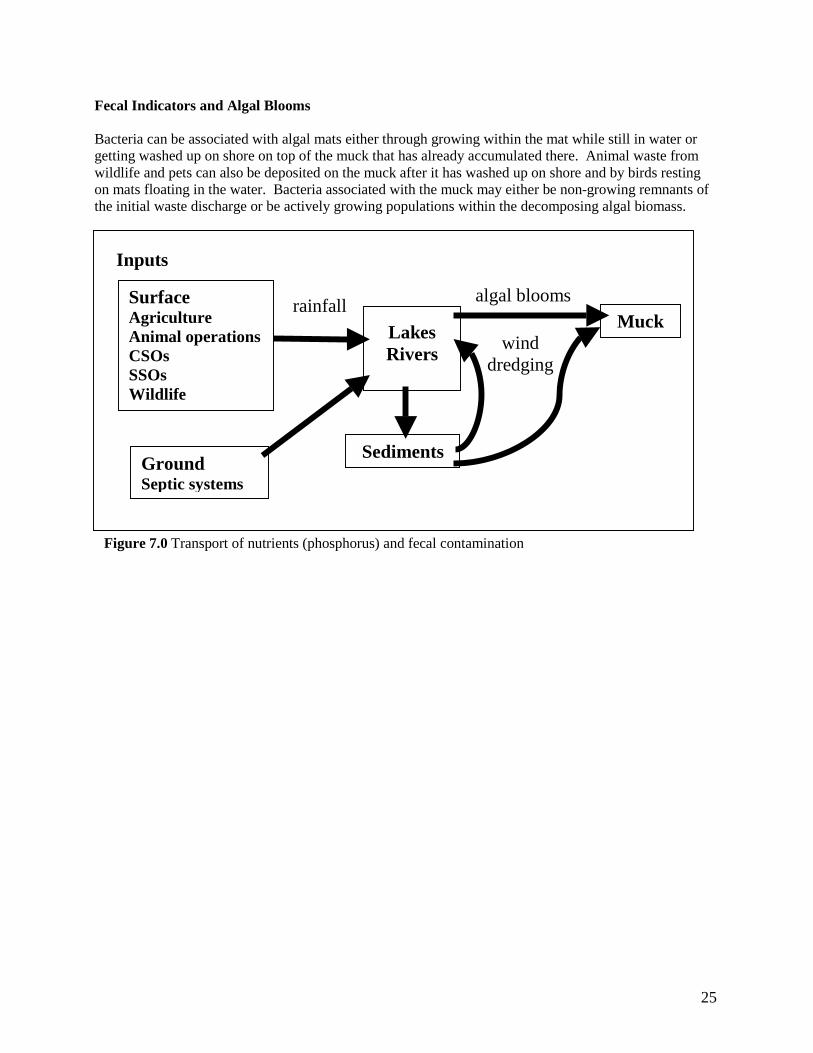
Fecal Indicators and Algal Blooms Bacteria can be associated with algal mats either through growing within the mat while still in water or getting washed up on shore on top of the muck that has already accumulated there. Animal waste from wildlife and pets can also be deposited on the muck after it has washed up on shore and by birds resting on mats floating in the water. Bacteria associated with the muck may either be non-growing remnants of the initial waste discharge or be actively growing populations within the decomposing algal biomass.
Surface Agriculture Animal operationsCSOs SSOs Wildlife
Ground Septic systems
Inputs
rainfall
LakesRivers
Sediments
wind dredging
Muckalgal blooms
Figure 7.0 Transport of nutrients (phosphorus) and fecal contamination
26
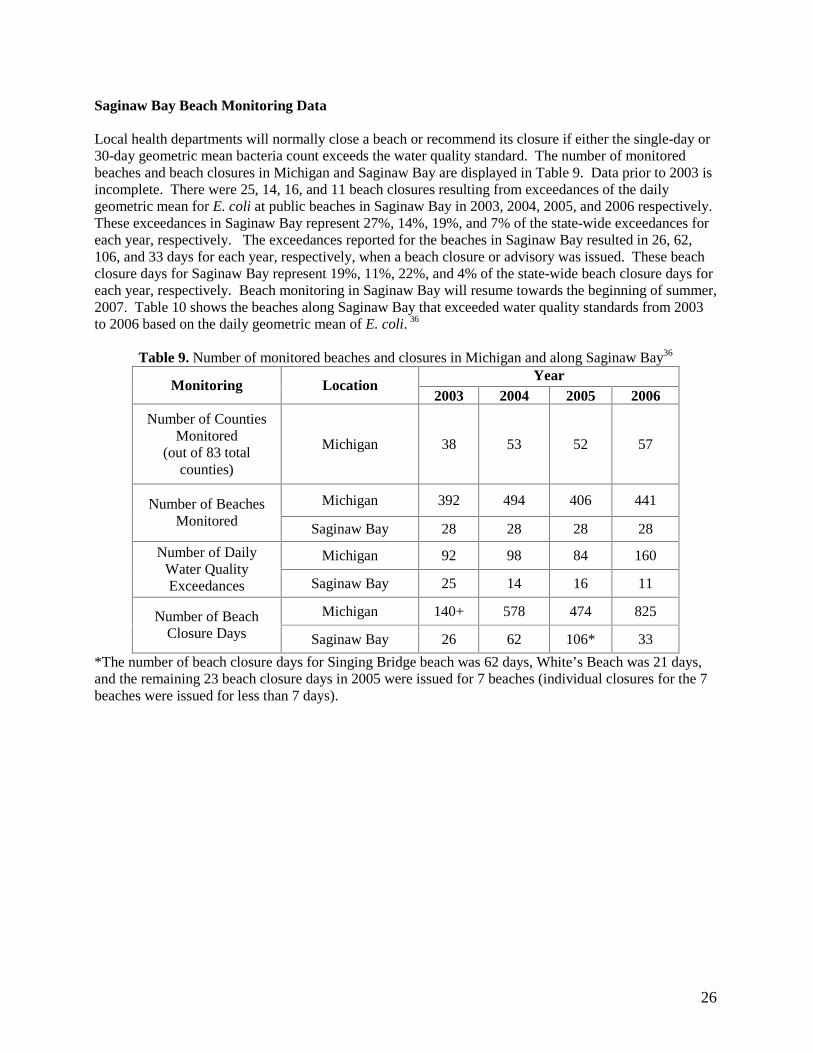
Saginaw Bay Beach Monitoring Data Local health departments will normally close a beach or recommend its closure if either the single-day or 30-day geometric mean bacteria count exceeds the water quality standard. The number of monitored beaches and beach closures in Michigan and Saginaw Bay are displayed in Table 9. Data prior to 2003 is incomplete. There were 25, 14, 16, and 11 beach closures resulting from exceedances of the daily geometric mean for E. coli at public beaches in Saginaw Bay in 2003, 2004, 2005, and 2006 respectively. These exceedances in Saginaw Bay represent 27%, 14%, 19%, and 7% of the state-wide exceedances for each year, respectively. The exceedances reported for the beaches in Saginaw Bay resulted in 26, 62, 106, and 33 days for each year, respectively, when a beach closure or advisory was issued. These beach closure days for Saginaw Bay represent 19%, 11%, 22%, and 4% of the state-wide beach closure days for each year, respectively. Beach monitoring in Saginaw Bay will resume towards the beginning of summer, 2007. Table 10 shows the beaches along Saginaw Bay that exceeded water quality standards from 2003 to 2006 based on the daily geometric mean of E. coli. 36
Table 9. Number of monitored beaches and closures in Michigan and along Saginaw Bay36 Year
Monitoring Location 2003 2004 2005 2006
Number of Counties Monitored
(out of 83 total counties)
Michigan 38 53 52 57
Michigan 392 494 406 441 Number of Beaches Monitored Saginaw Bay 28 28 28 28
Michigan 92 98 84 160 Number of Daily Water Quality Exceedances Saginaw Bay 25 14 16 11
Michigan 140+ 578 474 825 Number of Beach Closure Days Saginaw Bay 26 62 106* 33
*The number of beach closure days for Singing Bridge beach was 62 days, White’s Beach was 21 days, and the remaining 23 beach closure days in 2005 were issued for 7 beaches (individual closures for the 7 beaches were issued for less than 7 days).
27
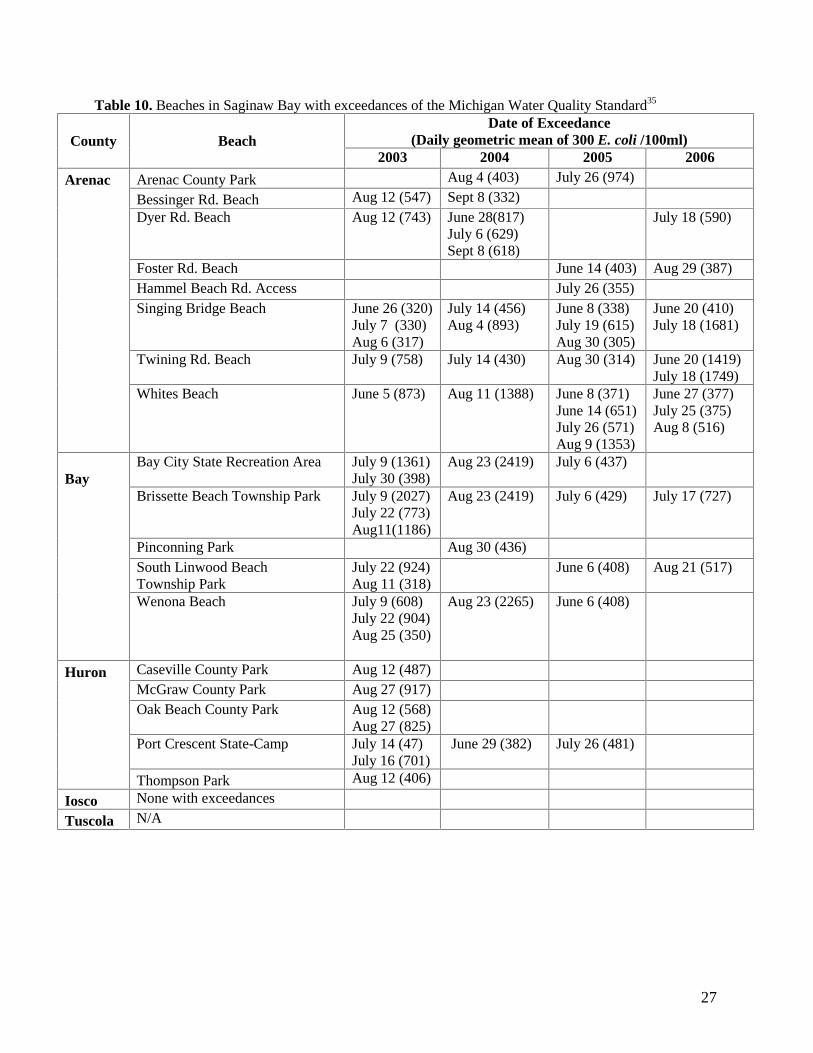
Table 10. Beaches in Saginaw Bay with exceedances of the Michigan Water Quality Standard35 Date of Exceedance
(Daily geometric mean of 300 E. coli /100ml) County Beach 2003 2004 2005 2006
Arenac Arenac County Park Aug 4 (403) July 26 (974)
Bessinger Rd. Beach Aug 12 (547) Sept 8 (332) Dyer Rd. Beach Aug 12 (743) June 28(817)
July 6 (629) Sept 8 (618)
July 18 (590)
Foster Rd. Beach June 14 (403) Aug 29 (387) Hammel Beach Rd. Access July 26 (355) Singing Bridge Beach June 26 (320)
July 7 (330) Aug 6 (317)
July 14 (456) Aug 4 (893)
June 8 (338) July 19 (615) Aug 30 (305)
June 20 (410) July 18 (1681)
Twining Rd. Beach July 9 (758) July 14 (430) Aug 30 (314) June 20 (1419) July 18 (1749)
Whites Beach June 5 (873) Aug 11 (1388) June 8 (371) June 14 (651) July 26 (571) Aug 9 (1353)
June 27 (377) July 25 (375) Aug 8 (516)
Bay Bay City State Recreation Area July 9 (1361)
July 30 (398) Aug 23 (2419) July 6 (437)
Brissette Beach Township Park July 9 (2027) July 22 (773) Aug11(1186)
Aug 23 (2419) July 6 (429) July 17 (727)
Pinconning Park Aug 30 (436) South Linwood Beach Township Park
July 22 (924) Aug 11 (318)
June 6 (408) Aug 21 (517)
Wenona Beach July 9 (608) July 22 (904) Aug 25 (350)
Aug 23 (2265) June 6 (408)
Huron Caseville County Park Aug 12 (487) McGraw County Park Aug 27 (917) Oak Beach County Park Aug 12 (568)
Aug 27 (825)
Port Crescent State-Camp July 14 (47) July 16 (701)
June 29 (382) July 26 (481)
Thompson Park Aug 12 (406)
Iosco None with exceedances
Tuscola N/A
28
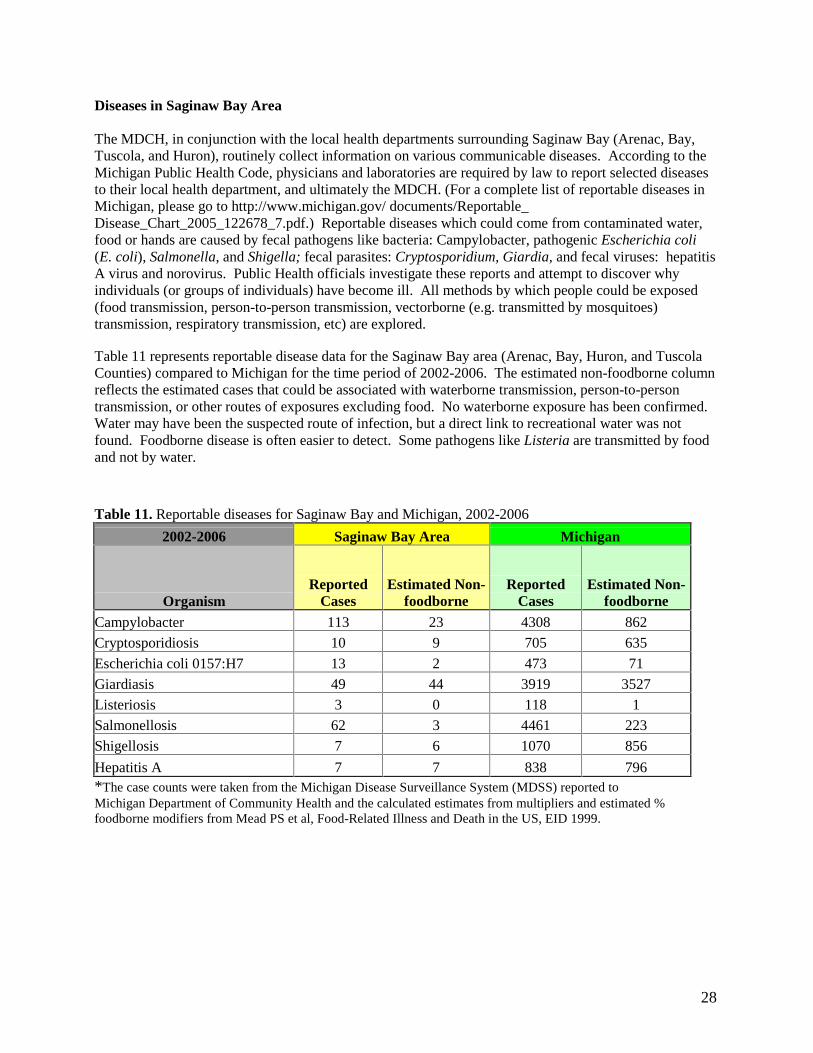
Diseases in Saginaw Bay Area The MDCH, in conjunction with the local health departments surrounding Saginaw Bay (Arenac, Bay, Tuscola, and Huron), routinely collect information on various communicable diseases. According to the Michigan Public Health Code, physicians and laboratories are required by law to report selected diseases to their local health department, and ultimately the MDCH. (For a complete list of reportable diseases in Michigan, please go to http://www.michigan.gov/ documents/Reportable_ Disease_Chart_2005_122678_7.pdf.) Reportable diseases which could come from contaminated water, food or hands are caused by fecal pathogens like bacteria: Campylobacter, pathogenic Escherichia coli (E. coli), Salmonella, and Shigella; fecal parasites: Cryptosporidium, Giardia, and fecal viruses: hepatitis A virus and norovirus. Public Health officials investigate these reports and attempt to discover why individuals (or groups of individuals) have become ill. All methods by which people could be exposed (food transmission, person-to-person transmission, vectorborne (e.g. transmitted by mosquitoes) transmission, respiratory transmission, etc) are explored. Table 11 represents reportable disease data for the Saginaw Bay area (Arenac, Bay, Huron, and Tuscola Counties) compared to Michigan for the time period of 2002-2006. The estimated non-foodborne column reflects the estimated cases that could be associated with waterborne transmission, person-to-person transmission, or other routes of exposures excluding food. No waterborne exposure has been confirmed. Water may have been the suspected route of infection, but a direct link to recreational water was not found. Foodborne disease is often easier to detect. Some pathogens like Listeria are transmitted by food and not by water.
Table 11. Reportable diseases for Saginaw Bay and Michigan, 2002-2006
2002-2006 Saginaw Bay Area Michigan
Organism Reported
Cases Estimated Non-
foodborne Reported
Cases Estimated Non-
foodborne Campylobacter 113 23 4308 862
Cryptosporidiosis 10 9 705 635
Escherichia coli 0157:H7 13 2 473 71
Giardiasis 49 44 3919 3527
Listeriosis 3 0 118 1
Salmonellosis 62 3 4461 223
Shigellosis 7 6 1070 856
Hepatitis A 7 7 838 796 *The case counts were taken from the Michigan Disease Surveillance System (MDSS) reported to Michigan Department of Community Health and the calculated estimates from multipliers and estimated % foodborne modifiers from Mead PS et al, Food-Related Illness and Death in the US, EID 1999.
29
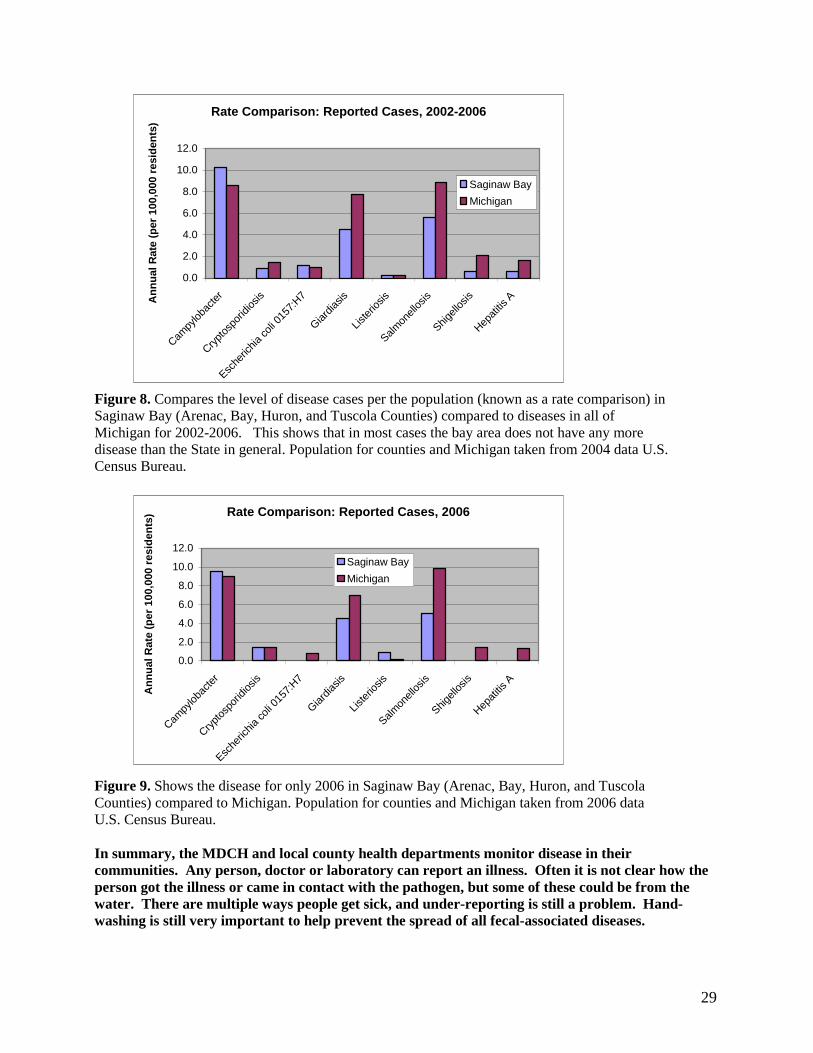
Figure 8. Compares the level of disease cases per the population (known as a rate comparison) in Saginaw Bay (Arenac, Bay, Huron, and Tuscola Counties) compared to diseases in all of Michigan for 2002-2006. This shows that in most cases the bay area does not have any more disease than the State in general. Population for counties and Michigan taken from 2004 data U.S. Census Bureau.
Figure 9. Shows the disease for only 2006 in Saginaw Bay (Arenac, Bay, Huron, and Tuscola Counties) compared to Michigan. Population for counties and Michigan taken from 2006 data U.S. Census Bureau. In summary, the MDCH and local county health departments monitor disease in their communities. Any person, doctor or laboratory can report an illness. Often it is not clear how the person got the illness or came in contact with the pathogen, but some of these could be from the water. There are multiple ways people get sick, and under-reporting is still a problem. Hand-washing is still very important to help prevent the spread of all fecal-associated diseases.
Rate Comparison: Reported Cases, 2002-2006
0.0
2.0
4.0
6.0
8.0
10.0
12.0
Campy
lobac
ter
Crypt
ospo
ridios
is
Esche
richia
coli 0
157:
H7
Giardia
sis
Liste
riosis
Salmon
ellos
is
Shigell
osis
Hepat
itisAA
nn
ual
Rat
e(p
er10
0,00
0re
sid
ents
)
Saginaw Bay
Michigan
Rate Comparison: Reported Cases, 2006
0.0
2.0
4.0
6.0
8.0
10.0
12.0
Campy
lobac
ter
Crypt
ospo
ridios
is
Esche
richia
coli 0
157:
H7
Giardia
sis
Liste
riosis
Salmon
ellos
is
Shigell
osis
Hepat
itisA
An
nu
alR
ate
(per
100,
000
resi
den
ts)
Saginaw Bay
Michigan
30
PART III THE FUTURE APPROACHES AND RECOMMENDATIONS X. Monitoring Approaches Human Health No epidemiological study related to swimming has been undertaken in Saginaw Bay. The Epidemiological studies done elsewhere in the state are very expensive and generally the people and the water are sampled in a way that would not be practical to exactly replicate for routine monitoring purposes. Epidemiological studies related to swimming have been used by the USEPA to develop water quality standards for beach monitoring programs. In the first series of USEPA studies at least 3 or 4 samples were collected on each study day at “chest high depth”, between 11:00 AM and 5:00 PM.21 In the more recent series of epidemiological studies up to 18 samples are collected each day at two depths and three locations on the beach.2,37 These samples are used to generally characterize the overall quality of water to which beach-goers are exposed. As an example, the water quality standards used in beach monitoring programs are based on epidemiological data from the first study where scientists found the best way to judge whether people were likely to get sick was by measuring the water quality from areas that were 3 to 6 feet in depth. The studies evaluated E. coli results from different water depths and E. coli results from 3 to 6 feet of water correlated to illness rates reported from beach visitors (including children in shallow water). It may be possible for scientists to evaluate data from epidemiological studies and characterize the individual factors (water depth, location, time of day, number of swimmers) that may have an effect on the health risk. However, there are limitations to implementing such detailed, health-based information from individual epidemiological studies into general monitoring practices. For instance, other water depths have been tested in epidemiological studies and a relationship of decreasing E. coli levels was observed as samples were collected from shallow water to deeper water. Another relationship that was observed was that E. coli levels varied considerably in shallow water (ankle deep water). These observations demonstrated that there was a greater chance of reporting inaccurate results (false positive and false negative results) from samples collected in shallow water. The greater variability of E. coli levels in shallow water makes it difficult to get reliable E. coli results. Water samples from areas that are 3 to 6 feet deep may not be perfect but they have been shown to be less variable than samples from ankle deep areas. This is one of the reasons why samples from the 3 to 6 foot water depth have been correlated to health risks. Scientists are continuing to study factors that affect E. coli levels, especially in ankle deep water near the shoreline. Naturally occurring E. coli present in the sand and sediments in ankle deep areas may be resuspended in the water column by wave action and contribute to the variability of E. coli levels in these shallow areas. Vegetation and other debris that washes on shore may also contribute to the variability of E. coli levels in shallow areas.
As mentioned previously, the County Health Departments do monitor the diseases in the community but the rare case of waterborne disease may go unreported. To help address the unknown health risks the Saginaw Bay Science Committee together with the MDCH developed a human health survey to help document possible illnesses associated with recreational water exposures (including exposure to sand and muck). The survey, named WaterWatch, is similar to existing marine surveys and will feature online web availability 24 hours/day with the ability to accommodate hundreds of visitors simultaneously. The survey will be available to those residents in the Saginaw Bay Watershed and will focus on water exposures occurring within the watershed. Residents will be able to self-report illnesses believed to be
31
associated with exposure to waterborne contaminants. Reports can be from those residents not ill enough to seek medical attention or confirmed cases with an associated water exposure. The survey asks questions pertaining to illness onset, symptoms experienced, duration of illness, exposure location, duration of exposure, type of exposure (recreational or drinking water), shore winds, odors present, debris present, etc. MDCH epidemiologists will be monitoring the data daily, analyzing the data for trends over time and comparing those to beach water quality data provided by the MDEQ. MDCH and the local health departments together will determine and implement the appropriate public health intervention should the data indicate action. The WaterWatch website and instructions will be made public through various newspapers, TV, radio outlets and health department outreach. The website will be active May 2nd through October 1st, 2007. The intent of WaterWatch is to increase public health surveillance for waterborne diseases, both sporadic cases and potential outbreak situations. MDCH and MDEQ will work together to coordinate illness data and environmental data in hopes of detecting potential health risks in the Saginaw Bay area and implementing appropriate public health interventions. Monitoring the Water The MDEQ distributes state and federal funds to assist local health departments to monitor 32 public beaches on Saginaw Bay. The MDEQ also monitors for E. coli in impaired water bodies in order to write Total Maximum Daily Loads (TMDLs). Public beaches are sampled by local health departments with funds provided by the MDEQ. Samples are collected from depths of approximately 3 to 6 feet deep since Michigan’s water quality standards for total body contact are based on epidemiological studies (as mentioned above) conducted by the USEPA. The epi-study showed that water samples collected from the 3 to 6 foot depth of water best correlated to the illness reports of swimmers. Swimmers in the study included children that played in the shallow water (one foot depth). This means that a test result of a water sample collected from a beach in an area of 3 to 6 feet deep can be used to determine if shallower areas as well as the entire beach area is safe for swimming. E. coli tests from water depths of 3 to 6 feet deep correlated to illness rates reported from beach goers (including children in shallow water). Other water depths were tested but did not correlate to illness reports. In Michigan samples are collected in approximately 3 feet of water which is consistent with the Quality Assurance Project Plan (QAPP) that is approved by the MDEQ. Current water quality standards can not be used to evaluate "muck" samples. The MDEQ laboratory has the capacity to test water but not organic matter or solids. Further comprehensive studies are needed to develop standards for not only shallower depths of water but for the "muck" as well. The Center for Water Sciences at Michigan State University, along with other science experts and stakeholders in the state are developing methods, databases and survey tools for alternative indicators, source tracking microbes and for “true” pathogens. These will be available so that groups can better monitor environmental conditions and determine potential health risk. These tools and approaches will help citizens and communities, community leaders and state officials address critical questions (e.g. regarding public health action and need for various long-term investments in wastewater and animal waste treatments).
32
XI. Recommendations
Many healthy beaches and healthy swimming campaigns have a set of guidelines for citizens to follow in attempts to better the quality of their beaches.3 Such guidelines include:
• Keeping the beach clean of trash • Use of toilet facilities • Use of appropriate areas for diaper changing • Staying out of the water if ill • Cleaning up food debris • Washing hands with soap and water • Using appropriate tap or bottled water for drinking purposes
As the MDEQ now allows hand removal of debris (dead vegetation) manually without a permit, contact with the material may represent a public health risk. This risk can be minimized and by doing so may also present opportunities to decrease any public health risk associated with inadvertent exposure to children and others.
The recommendations below have been developed by the Saginaw Bay Science Committee regarding action that could be taken to assist in addressing any potential health risks associated with contact with the muck. These recommendations are not listed in any specific order as the Science Committee believes that each of these recommendations is equally important. A comprehensive environmental sampling plan, given the appropriate financial resources, should be developed to better characterize sources, potential health risks and management strategies. There are very limited data on the fecal signature of the muck itself. While the beach water quality continues to be monitored for E. coli according to the requirements of the State, this information does not always address the source of the contamination or define the risk under unique exposure scenarios. This includes exposure to the muck itself or the sand, or shallow waters.
• Sampling should include the muck to better characterize the fecal signatures. • Routine indicators and alternative indicators as well as pathogens should be included in
specialized studies to address health risks. • A study using source tracking techniques should be developed over a variety of time steps and
geographical locations to improve an understanding of inputs. • More sampling of the water at different depths should be included to better address children’s
exposure. • An improved understanding of nutrient inputs (including phosphorus) and other sources of
ecological stressors and their role in formation of the muck should be further investigated to improve management decisions.
Broad communication and public outreach should be developed to adequately educate citizens on methods to reduce the exposure to the muck in the absence of well-defined risks.
Personal exposure to the muck is primarily through contact with hands or feet if one walks through the debris toward the water. The public health risk is through transfer of the “potential microbes” to the mouth or nose or through cuts in the skin. Good hygiene and manual approaches of muck removal can be used to prevent exposure and the transfer of any material from the hands or feet to the mouth or nose.
33
• Hands and feet as well as legs should be washed off after coming in contact with the muck.
Hand washing with soap and water is preferred. In the absence of soap and water, alcohol gels and wipes have been shown to kill bacteria and viruses that could cause disease (e.g. E. coli and cold virus etc). Hand washing and or use of these disinfectants should used before drinking or eating anything.
• Young children should be supervised and washed off if they come in contact with the muck, particularly their hands and should not be allowed to place the muck in their mouth.
• Those individuals with cuts should avoid the muck but if contact is unavoidable the areas should be cleaned thoroughly with an antibacterial agent (e.g. Neosporin).
• If pets are exposed to the muck, they should be washed off. • Gloves and shoes should be worn if one has to come in contact with the debris and should be
thoroughly washed afterwards as this will help kill bacteria and viruses. • Public should observe and comply with public health orders including advisories and closures.
The public should be encouraged to report any illness to the local health department that they believe might be tied to exposure to the beach, muck or Bay water.
The local health department is responsible for community and environmental health and is developing a WaterWatch program with the assistance of the MDCH. Health professionals take all illnesses in the community seriously and it is their job to assist the public. The health department is trained to help to understand how disease is spread and will provide guidance on preventing disease transmission from the muck or through recreational waters.
• A WaterWatch program has been developed to capture self-reported illnesses thought to be
associated with muck, sand, or recreational waters. The public should actively participate and report any illness associated with exposure to the beach or waterway. Taking advantage of this program will assist public health officials in monitoring illness in the Saginaw Bay Watershed.
• Physicians and laboratories are required by Michigan law to report specified communicable diseases to the county health department, including waterborne diseases caused by bacteria, viruses and parasites found in fecal material.
Following the State requirements associated with removal of the dead debris and muck, good hygiene approaches should be used. Based on very limited sampling information, this muck could carry some public health risk associated with exposure (similar to playing in contaminated sand). While it is not known whether this risk is very low or moderate, good practices can be implemented that will reduce this risk.
• Gloves should be used when removing the debris/muck. • Shovels and rakes should be thoroughly washed off after use with soap and water. • Shoes, legs, hands, etc. should be washed with soap and water (or wiped with an alcohol
gel) to reduce bacteria and possible viruses. • The debris and/or muck should be disposed of through composting or via a landfill.
34
Appendix 1 References 1 Shibata, T. and Rose, J.B. 2006. Preliminary Water Quality Testing Of Lake Huron Shoreline Muck Samples. Microbiological Water and Health Laboratory, Department of Fisheries and Wildlife, Michigan State University, 13 Natural Resources, East Lansing, MI 48824. October 19, 2006. 2 Wade, T., R. Calderon, E. Sams, M. Beach, K. Brenner, A.Williams and A. Dufour. 2006. Rapidly measured
indicators of recreational water quality are predictive of swimming-associated gastrointestinal illness. Environmental Health Perspectives. 114(1): 24-28.
3 CDC. 2007. Center for Disease Control website. Obtained April 2007 from http://www.cdc.gov 4 MDNR. 1961. Michigan Department of Natural Resources. Memorandum dated August 31, 1961. 5 MDNR. 1978. Michigan Department of Natural Resources. 1978 Report. 6 MDEQ. 1992. Michigan Department of Environmental Quality. 1992 Report. 7 Harris, V. 2004. Cladophora confounds coastal communities – public perceptions and management dilemmas.
Presented at the workshop Cladophora Research and Management in the Great Lakes, Great Lakes WATER Institute, University of Wisconsin-Milwaukee, December 8, 2004.
8 Greb, S., P. Garrison and S. Pfeiffer. 2004. Cladophora and Water Quality of Lake Michigan: A Systematic Survey of Wisconsin Nearshore Areas. Presented at the workshop Cladophora Research and Management in the Great Lakes, Great Lakes WATER Institute, University of Wisconsin-Milwaukee, December 8, 2004.
9 Howell, T. 2003. Occurrence of Nuisance Benthic Algae on the Southeastern Shores of Lake Huron. Technical Memo, Water Monitoring Section, Ontario Ministry of the Environment, June, 2004.
10 MDEQ. 2007. Part 4 rules, WQS, promulgated under Part 31, Water Resources Protection, of the Natural Resources and Environmental Protection Act, 1994 PA 451, as amended. Obtained April 2007 from http://www.michigan.gov/deq
11 Bisson J. and V.J. Cabelli. 1979 Membrane filter enumeration method for Clostridium perfringens. Applied and Environmental Microbiology. 37(1):55-66.
12 WHO. 1999. Health-Based Monitoring of Recreational Water: The Feasibility of a New Approach (The ‘Annapolis Protocol’). (WHO/SDE/WSH/99.1). World Health Organization – Sustainable Development and Healthy Environments.
13 Prescott, L., J. Harley and D. Klein. 1999. Microbiology, Fourth Edition. WCB/McGraw-Hill. 14 USEPA. 2001. Total Coliform Rule: A quick reference guide. (EPA 816-F-01-035). USEPA. Office of Water. 15 USEPA. 2007. United States Environmental Protection Agency website. Obtained April 2007 from
http://www.epa.gov/safewater/contaminants/index.html#primary 16 USEPA. 2003.Bacterial Water Quality Standards for Recreational Waters (Freshwater and Marine Waters). (EPA-
823-R-03-008). EPA. Office of Water. Washington, D.C. 17 Cabelli, V. 1983. Health Effects Criteria for Marine Recreational Waters. (EPA-600/ 1-80-031). USEPA. Office
of Research and Development. Washington, D.C. 18 Dufour, A. 1984. Health Effects Criteria for Fresh Recreational Waters. (EPA-600/1-84-004). USEPA. Cincinnati,
Ohio, Office of Research and Development. Washington, D.C. 19 USEPA. 1986. Ambient water quality criteria for bacteria. (EPA-440/5-84/002). USEPA, Cincinnati, Ohio, Office
of Water Regulations and Standards. Criteria and Standards:18. 20 Cabelli, V. 1976. Indicators of recreational water quality. Indicators/Health Hazards Associated with Water. A.
Hoadley and B. Dutka. Philadelphia, ASTM:222. 21 Cabelli. 1982. Swimming-associated gastroenteritis and water quality. American Journal of Epidemiology 115(4):606-616. 22 USDOI. 2003. Ohio District’s Microbiology Program.. U.S. Department of the Interior, U.S. Geological Survey.
http://oh.water.usgs.gov/microbiol.html 23 Wade T., N. Pai, J. Eisenberg and J. Colford. 2003. Do US EPA water quality guidelines prevent gastrointestinal
symptoms? A systematic review and meta analysis. Environmental Health Perspectives 111(8): 1102-1109.
24 Pruss. 1998. Review of epidemiological studies on health effects from exposure to recreational water. International Journal of Epidemiology, 27(1):1-9.
25 Zmirou, D., L. Pena, M. Ledrans and A. Letertre. 2003. Risks associated with the microbiological quality of bodies of fresh and marine water used for recreational purposes: summary estimates based on published epidemiological studies. Archive of Environmental Health. 58(11):703-711.
35
26 Higgins, S., R. Hecky, S. Guildford and R. Smith. 2003. Current Controls on the Production and Distribution of Cladophora in the Eastern Basin of Lake Erie Global Threats to Large Lakes: Managing in an Environment of Instability and Unpredictability , p. 130.
27 Heaney, C., T. Wade, E. Calderon, K. Brenner, M. Beach and A. Dufour. 2006. Exposure to sand during beach recreation and risk of illness: Results from the National Epidemiological and Environmental Assessment of Recreational (NEEAR) Water Study (Poster presentation). National Beaches Conference, Niagara Falls, New York, October 11-13.
28 Whitman, R., M. Nevers and M. Byappanahalli. 2006. Examination of the watershed-wide distribution of Escherichia coli along southern Lake Michigan: an integrated approach. Applied and Environmental Microbiology 72(11): 7301-7310. 29 BrittainS., J. Wang, and L. Babcock-Jackson et al. 2000. Isolation and characterization of microcystins, cyclic
heptapeptide hepatotoxins from a Lake Erie strain of Microcystis aeruginosa. J Great Lakes Res 26: 241–49.
30 Vanderploeg, H., J. Liebig, W. Carmichael, M. Agy, T. Johengen, G. Fahnenstiel and T. Nalepa. 2001. Zebra mussel (Dreissena polymorpha) selective filtration promoted toxic Microcystis blooms in Saginaw Bay (Lake Huron) and Lake Erie. Canadian Journal of Fisheries and Aquatic Sciences 58: 1208-1221. 31 Croley. 1990. Laurentian Great Lakes double CO2 Climate change hydrological impacts. Climate Change.
17:27-48. 32 Magnuson, J., R. Assel, C. Bouser, P. Dillon, J. Eaton, H. Evans, E. Fee, R. Hall, L. Mortsch, D. Schindler, F.
Quinn and K. Webster. 1997. Potential effects of climate change on aquatic systems: Laurentian Great Lakes and Precambrian Shield region. Hydrological Processes, 11, 825-872.
33 MEC. 2006. Michigan Environment Council. Obtained April 2007 from http://www.mecprotects.org/index.html 34 CWS. 2007. Michigan State University Center for Water Sciences. Obtained April 2007 from http://cws.msu.edu 35 MDEQ. 2007. Michigan Department of Environmental Quality website. Obtained April 2007 from http://www.michigan.gov/deq 36 MDEQ. 2007. Michigan Department of Environmental Quality Water Bureau, January 2007, Staff Report Michigan Beach Monitoring Year 2005 Annual Report, Obtained April, 2007 from www.michigan.gov/documents/deq/wb-beach-2005annualreport_189953_7.pdf 37 Haugland, R., S. Siefring, L. Wymer, K. Brenner and M. Beach. 2005. Comparisons of Enterococcus measurements in freshwater at two recreational beaches by quantitative polymerase chain reaction and
membrane filter culture analysis. Water Resources. 39(4):559-568.
36
Appendix 2 Resources
Algae http://www.cyanonet.org/index.php Bathymetry channelislands.noaa.gov/edu/pdf/chartlesson.pdf Benthic macroinvertebrate www.dnr.state.md.us/streams/pubs/freshwater.html
Cover Page http://veimages.gsfc.nasa.gov/3224/GreatLakes.A2002135.1615.250m.jpg Diatoms www.indiana.edu/~diatom/diatom.html Eutrophication
toxics.usgs.gov/definitions/eutrophication.html Gram-positive bacteria medic.med.uth.tmc.edu/path/00001444.htm - 4k Microcystis www.dnr.state.md.us/Bay/hab/microcystis2.html Michigan State University Center for Water Sciences http://cws.msu.edu Plankton www.chesapeakebay.net/info/plankton.cfm Protozoans www.encyclopedia.com/SearchResults.aspx?Q=protozoan Possible Recreational Waterborne Diseases in Saginaw Bay http://www.michigan.gov/documents/Reportable_Disease_Chart_2005_122678_7.pdf
United States Department of Agriculture www.usda.gov
Waterborne bacteria http://www.cdc.gov/health/water.htm
37
Appendix 3 MDEQ Permitting Requirements for Debris (a.k.a. Algae/Muck) Removal As defined in the wetland statute, debris means animal or fish carcasses, zebra mussel shells, dead vegetation, trash, and discarded materials of human-made origin. The removal of debris in areas that contain vegetation or below the water’s edge:
• Mechanical debris removal activities in areas that contain vegetation or below the water’s edge (e.g. in the water) require that an individual public noticed permit be obtained from the MDEQ.
• Hand removal of dead vegetation or any other debris does not require a permit.
The removal of debris in areas free of vegetation and above the water’s edge:
• Until November 1, 2007, the removal of debris in areas free of vegetation and above the waters edge, as part of shoreline grooming activities, does not require a permit from the MDEQ. Specifically, activities not requiring a permit include grooming of soil, which means raking or dragging, pushing, or pulling metal teeth through the top 4 inches of soil without disturbance to plant roots for the purpose of removing debris. To qualify for this permit exemption, the landowner must conduct all activities above the water’s edge, the activity must be in a non-vegetated area, and the removal or excavation of sand is not allowed. In addition, all collected debris must be properly disposed of in an upland (non-wetland) location. To minimize disturbance of the shoreline, it is recommended that the same access path be used for all removal activities.
• After November 1, 2007, the removal of Debris in areas free of vegetation and above the waters
edge, as part of shoreline grooming activities, will require authorization under a general permit from the MDEQ. The landowner will need to fill out an “application for shoreline management activities” and submit the application with their proposed removal plan to the MDEQ. The authorization can be valid for up to 5 years. General permit categories allow for an efficient and timely review of projects without public notice. The MDEQ recommends landowners plan ahead and allow for 60-90 days for MDEQ processing and permit issuance. Landowners should submit their applications for shoreline grooming activities during the months of October-April to allow the MDEQ to process all applications in a timely fashion.
• Hand removal of dead vegetation or any other debris does not require a permit.
A permit from the Army Corp of Engineers is also required for most Debris removal activities.
• Except in “Designated Environmental Areas” or in areas that contain threatened and endangered species where an individual public noticed permit from the MDEQ is required.
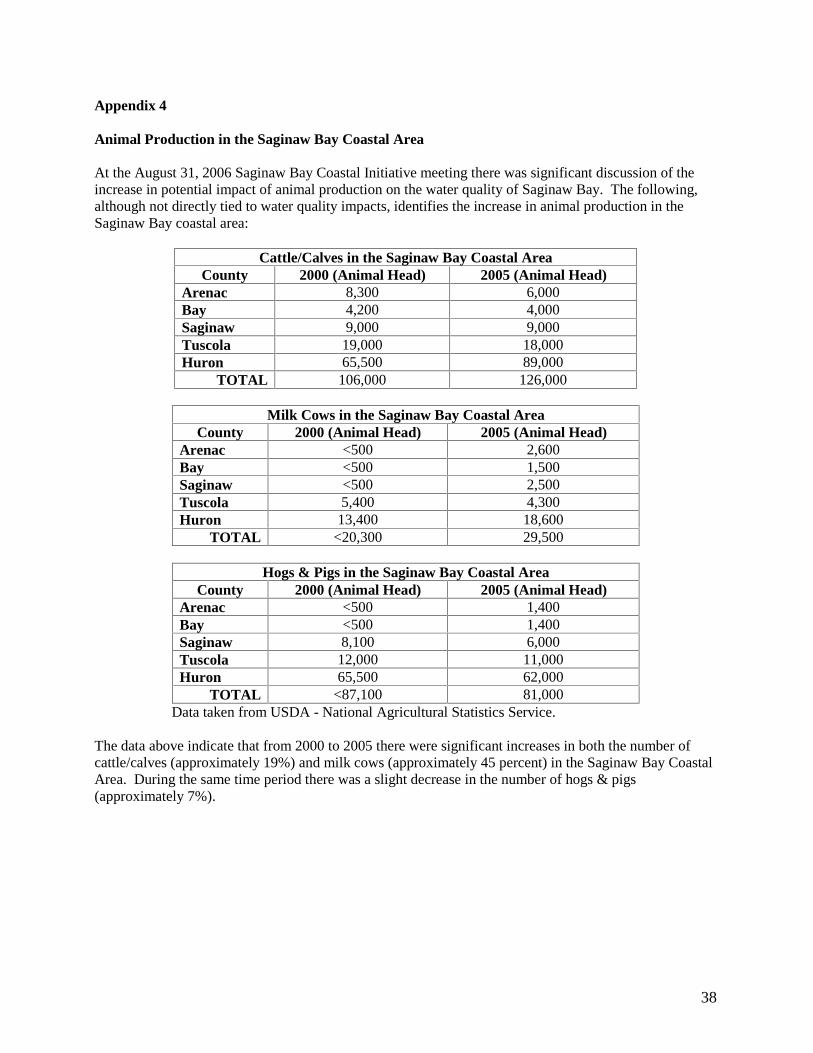
38
Appendix 4
Animal Production in the Saginaw Bay Coastal Area At the August 31, 2006 Saginaw Bay Coastal Initiative meeting there was significant discussion of the increase in potential impact of animal production on the water quality of Saginaw Bay. The following, although not directly tied to water quality impacts, identifies the increase in animal production in the Saginaw Bay coastal area:
Cattle/Calves in the Saginaw Bay Coastal Area County 2000 (Animal Head) 2005 (Animal Head)
Arenac 8,300 6,000 Bay 4,200 4,000 Saginaw 9,000 9,000 Tuscola 19,000 18,000 Huron 65,500 89,000
TOTAL 106,000 126,000
Milk Cows in the Saginaw Bay Coastal Area County 2000 (Animal Head) 2005 (Animal Head)
Arenac <500 2,600 Bay <500 1,500 Saginaw <500 2,500 Tuscola 5,400 4,300 Huron 13,400 18,600
TOTAL <20,300 29,500
Hogs & Pigs in the Saginaw Bay Coastal Area County 2000 (Animal Head) 2005 (Animal Head)
Arenac <500 1,400 Bay <500 1,400 Saginaw 8,100 6,000 Tuscola 12,000 11,000 Huron 65,500 62,000
TOTAL <87,100 81,000 Data taken from USDA - National Agricultural Statistics Service.
The data above indicate that from 2000 to 2005 there were significant increases in both the number of cattle/calves (approximately 19%) and milk cows (approximately 45 percent) in the Saginaw Bay Coastal Area. During the same time period there was a slight decrease in the number of hogs & pigs (approximately 7%).