Embed Size (px)
Citation preview

EN EN
COMMISSION OF THE EUROPEAN COMMUNITIES
Brussels, 20.04.2007 SEC(2007) 533
COMMISSION STAFF WORKING DOCUMENT
The potato sector in the European Union
EN 2 EN
TABLE OF CONTENTS
INDEX OF FIGURES.........................................................................................................4
INDEX OF TABLES ..........................................................................................................7
ACRONYMS ......................................................................................................................8
EXECUTIVE SUMMARY AND CONCLUSIONS ..........................................................9
MAIN ELEMENTS OF THE PRODUCTION PROCESS AND THEIR ECONOMIC CONSEQUENCES..9 GEOGRAPHICAL SCOPE OF POTATO MARKETS IN THE EU..................................................9 ORGANISATION OF THE POTATO CHAIN IN THE EU .........................................................10 PRODUCTION ..................................................................................................................12 HUMAN CONSUMPTION...................................................................................................13 TRADE............................................................................................................................14 PRICES AND RISK ............................................................................................................15 CONCLUSIONS: CHALLENGES AND FUTURE ACTION........................................................17
1. INTRODUCTION ....................................................................................................20
1.1. Objective .............................................................................................................20
1.2. Basic definitions..................................................................................................20
1.3. Main characteristics of the cultivation of potatoes .............................................22
1.4. Structure of the report .........................................................................................23
2. PRODUCTION........................................................................................................24
2.1. World Production................................................................................................25
2.2. Potato production in the European Union...........................................................26
2.2.1. EU-15 ..................................................................................................................27
2.2.2. New Member States ............................................................................................29
2.3. Early potatoes......................................................................................................31
2.4. Seed potatoes.......................................................................................................32
2.5. Evolution of farm structures ...............................................................................34
2.6. Final remarks.......................................................................................................36
3. MAIN DETERMINANTS IN THE DEMAND FOR POTATOES.......................................37
3.1. Overall trends in the EU......................................................................................38
3.2. Animal feed.........................................................................................................38
3.3. Starch potatoes ....................................................................................................39
3.4. Potatoes for human consumption........................................................................41
3.4.1. Aggregate patterns ..............................................................................................41
3.4.2. Typologies of potato products.............................................................................45
3.4.3. Potato products in the NMS................................................................................46
3.5. Evolution of potatoes' demand and market prospects.........................................46
EN 3 EN
4. TRADE..................................................................................................................48
4.1. Seed potatoes.......................................................................................................49
4.2. Early potatoes......................................................................................................52
4.3. Main crop potatoes..............................................................................................56
4.4. Processed products..............................................................................................59
4.5. The impact of enlargement .................................................................................63
4.6. Conclusions.........................................................................................................66
5. MARKET SITUATION, PRICES AND CONTRACTUAL RELATIONS............................68
5.1. Long run trend of prices series............................................................................68
5.2. Segmentation, national boundaries and prices....................................................73
5.3. Farmers and the upstream sector.........................................................................77
5.4. Fluctuations of potato prices ...............................................................................78
5.5. Contractual relations with downstream operators...............................................78
5.6. Futures and options .............................................................................................80
5.7. Concluding remarks ............................................................................................81
6. EU POLICIES AND THE POTATO SECTOR IN THE EU .............................................82
6.1. EU Phytosanitary measures and commercial standards......................................82
6.1.1. Directive on harmful organisms (Directive 2000/29/EC)...................................83
6.1.2. Marketing of seed potatoes (Council Directive 2002/56/EC).............................85
6.1.3. Community variety property rights (Council Regulation 2100/94)....................85
6.1.4. Food law: traceability..........................................................................................82
6.1.5. Commercial standards.........................................................................................86
6.2. Tariffs and quotas................................................................................................87
6.3. Promotion............................................................................................................89
6.4. Quality policy......................................................................................................90
6.5. The EC biofuels and biomass action plans .........................................................90
6.6. CAP direct payments ..........................................................................................92
6.7. Summary .............................................................................................................96
APPENDIX A ...................................................................................................................97
APPENDIX B: Starch Potatoes as a Component of Total Potato Production ................112
APPENDIX C: Indicators on the Variations of Areas, Yields and Production ..............113
APPENDIX D: Potato Balance Sheet in the Eurostat Accounts.....................................115
APPENDIX E: Monthly Potato Prices vs Monthly prices of other Crops......................116

EN 4 EN
INDEX OF FIGURES Figure 2-1: Main world producers in 2005 (metric tons)..................................................25
Figure 2-2: Production of potatoes in the EU: comparison between the evolution in the EU-5 zone, the Mediterranean basin and the New Member States (1 000 tons) [1990–2005]...................................................................................................................................28
Figure 2-3: Evolution of arable land, usable agricultural area and potato area in the EU-15 (1992/94 = 100) [original data in ha; 1988–2005] ....................................................28
Figure 2-4: Annual variation (%) of potato yields in Poland and in the EU-5 area (from 1997 to 2005) .........................................................................................................................31
Figure 2-5: Early potatoes production in the main producing Member States (1 000 tons) [1990–2005] ..............................................................................................................32
Figure 2-6: Weight of potato surfaces in total area of holdings producing potatoes in the EU's Member States (2003) ...............................................................................................36
Figure 3-1: Evolution of the components of world potato demand (1000 metric tons) [1961–2003] .........................................................................................................................37
Figure 3-2: Potatoes destined to animal feed in the EU (1 000 t) [average 2001/03].......39
Figure 3-3: Importance (%) of animal feed as destination of domestic uses of potatoes (average 2001/03)......................................................................................................39
Figure 3-4: Potatoes for the production of starch in the EU (1 000 t) [average 2001/03] 40
Figure 3-5: Importance (%) of potatoes for starch in domestic uses of potatoes (average 2001/03)......................................................................................................40
Figure 3-6: Gross human consumption of potatoes in the EU's Member States (1 000 t) [average 2001/03]......................................................................................................41
Figure 3-7: Gross human consumption in total domestic uses of potatoes (%) by Member State (average 2001/03)......................................................................................................42
Figure 3-8: Gross human consumption of potatoes for food processing and total gross human consumption of potatoes for a group of EU-15 countries (1 000 t) [1994–2002].....42
Figure 3-9: Consumption of processed potatoes (in raw material equivalent) in total human consumption of potatoes in selected EU countries [1990/92 – 1995/97 – 2001/03].43
Figure 3-10: Per capita human consumption per capita by MS (kg per head) [average 2001/03]...................................................................................................................................44
Figure 4-1: Intra-EU trade and EU exports of seed potatoes (tons) [1990–2005] ............50
Figure 4-2: EU trade of seed potatoes: shares of the main suppliers (1990–2004) ..........50

EN 5 EN
Figure 4-3: Main recipients of seed potatoes traded in the EU (% on total shipments) [2000–2004] ..............................................................................................................51
Figure 4-4: Monthly trade1 of early potatoes in the European Union (tons) [January 2001 – October 2005]............................................................................................................52
Figure 4-5: EU trade in early potatoes and in main crop potatoes (tons) [1990–2004]....53
Figure 4-6: Monthly trade of early potatoes in the EU: intra-EU trade and imports from third countries (tons) [January 2001 – December 2005] ...................................................55
Figure 4-7: Early potatoes shipped in the EU from the Mediterranean area (tons) [1990–2005]...................................................................................................................................55
Figure 4-8: Intra-EU monthly expeditions of early potatoes from the main suppliers (tons) [January 2001 – December 2005] .............................................................................56
Figure 4-9: EU trade in main crop potatoes (tons) [1990–2005] ......................................57
Figure 4-10: Weight (%) of EU-5 in volumes of main crop potatoes traded in the EU-5 Member States [1990/91 – 2003/04].........................................................................58
Figure 4-11: Main destination of EU-15 exports of main crop potatoes (%, original data in tons) [2002/03] ......................................................................................................59
Figure 4-12: Importance (%) of the main types of processed potato products in EU-15 trade of processed potato products (original data in €) (1994/96 – 2003/05).........................60
Figure 4-13: Exports of frozen potatoes (metric tons) [1978–2003] ................................62
Figure 4-14: Index of exports in frozen potatoes (1990=100; original data in metric tons) [1990–2003] ..............................................................................................................62
Figure 4-15: Main destinations of EU-15 exports of processed potato products (%; original data in €) [2002/03]...........................................................................................................63
Figure 4-16: Seed potatoes: intra EU-15 trade, exports to third countries and shipments to the new Member States (1990=100; original data in tons) [1990–2004] .......................64
Figure 4-17: Trade in early potatoes between EU-15 and the new Member States (tons) [1990–2004] ..............................................................................................................64
Figure 4-18: Trade in main crop potatoes between EU-15 and the new Member states (1990=100; original data in tons) [1990–2004] ........................................................65
Figure 4-19: Trade in processed potato products: Intra-EU-15 trade, exports to third countries and shipments to the new Member States (1990=100; original data in €) [1990–2004]...................................................................................................................................66
Figure 5-1: EU-15 production of ware and seed potatoes (1 000 tons) [1985–2005].......69
Figure 5-2: Selling prices of main crop potatoes in the EU-5 countries (ECU-€/100 kg; nominal terms) [1971–2005] ...................................................................................................70
EN 6 EN
Figure 5-3: Comparison between annual average producer prices of potatoes in Spain, Portugal, Italy and EU-5 (ECU-€/100 kg in nominal terms) [1971–2005]...............71
Figure 5-4: Comparison between annual average producer prices of main crop potatoes in Poland, Latvia, Lithuania and EU-5 (ECU/100 kg and €/100 kg in nominal terms) [1990–2005] ..............................................................................................................72
Figure 5-5: Monthly producer prices in France (€/100 kg) [2000–2005] .........................74
Figure 5-6: Monthly producer prices in Germany (€/100 kg) [2000–2005] .....................75
Figure 5-7: Monthly producer prices of main crop potatoes in Germany, France, Spain, UK and Belgium (€/100 kg) [2000–2005]..............................................................................75
Figure 5-8: Unit trade value of early potatoes and main crop potatoes (current values; 1990=100) [1990–2004]............................................................................................77
Figure A-1 a.n: Distribution of potato areas by holdings' size (classes of agricultural area) [1990–2003] ............................................................................................................106
Figure B-1: Comparison between the rate of variation of potato production with and without potatoes for starch (from 2001/04 to 2005).............................................................112
Figure C-1: Coefficient of variation of yields and areas for selected crops in the EU-15 (1990–2004) .......................................................................................................................113
Figure E-1 a-e: Monthly selling prices of potatoes and other crops in selected Member States (€/100 kg) ................................................................................................................116
EN 7 EN
INDEX OF TABLES Table 2-1: Importance of potato production in the countries of the EU ...........................30
Table 2-2: Area under seed potatoes in the EU (hectares) [1999–2004] ..........................34
Table 2-3: Number of holdings producing potatoes in the EU's Member states (1990–2003)...................................................................................................................................35
Table 3-1: Production of processed potato products in the EU (tons) [1999–2003].........45
Table 4-1: Main components in the EU-25's trade of potato products (average 2003/05)48
Table 4-2: Early potatoes traded in the EU by country of departure in 1990/91 and 2004/05 (tons) .........................................................................................................................54
Table 4-3: Intra EU-15 trade in main crop potatoes (tons) [1995/96 – 2003/04] .............57
Table 4-4: Intra EU-15 trade and origin of EU-15 exports of processed potato products (€1 000) [2003/05] ....................................................................................................61
Table 6-1: Third country duties on potato products..........................................................88
Table 6-2: Horticultural and potato area grown in the countries that will adopt the regionalisation option (average 2000/02; thousand ha) ............................................93
Table A-1: World production of potatoes (metric tons) [1990–2005] ..............................98
Table A-2: World area under potatoes (hectares) [1990–2005]........................................99
Table A-3: World potato yields (100 kg/ha) [1990–2005] .............................................100
Table A-4: Production of ware and seed potatoes in the Member States of the EU (1 000 tons) .............................................................................................................101
Table A-5: Area cultivated under potatoes in the Member States of the EU (1000 ha) .102
Table A-6: Potato yields in the Member States of the EU (100 kg/ha) ..........................103
Table A-7: Production of early potatoes in the Member States of the EU (1 000 tons) .104
Table A-8: Hectares of specialised potato farms (2/3 of Standard Gross Margin obtained by the cultivation of potatoes) in the EU [1993–2003]......................................................105
EN 8 EN
Acronyms
BPC British Potato Council
BWVEL Bundesministerium fur Verbraucherschutz, Ernahrung und Landwirtschaft (German Ministry of Agriculture)
CAP common agricultural policy
CCAE Confederación de Cooperativas Agrarias de España
CMO common market organisation
OAI Output of the agricultural industry
EC European Commission
EU European Union
FAO Food Agricultural Organisation
FVP Fruits, vegetables and potatoes
MS Member States
NMS new Member States
SFP single farm payment
UAA usable agricultural area
UEITP Union européenne des industries de transformation de la pomme de terre
WTO World Trade Organisation
ZMP Zentrale Markt- und Preisberichtstelle für Erzeugnisse der Land-, Forst- und Ernährungswirtschaft.
EN 9 EN
EXECUTIVE SUMMARY AND CONCLUSIONS
Main elements of the production process and their economic consequences
1. The potato is commonly considered a cool season crop. It is suited to at high temperatures when water is supplied in uniform quantities and can grow well on a wide variety of soils. Planting time varies considerably from region to region depending not only on local climatic conditions but also on intended market use. This entails that potato production can be obtained in many different areas and, indeed, explains why potatoes are grown in all the EU countries.
2. Water management and/or rainfall are probably the most important factors determining yield and quality of potatoes. Water scarcity may determine shifts in the localisation of potato plantings in the future.
3. Potatoes should be grown in a crop rotation that will enhance the soil fertility, maintain a loose friable soil condition and reduce weeds. From a technical and, importantly, from an economic standpoint potatoes should be seen not as a single crop alternative but rather as an element within a multiple-crop rotational plan.
4. A consequence of such a situation is that potato production is becoming increasingly concentrated in big holdings that are not specialised in potatoes. In fact, big farms are in a privileged position to apply rotational systems and, at the same time, satisfy demand requirements. Wholesalers and processors are more receptive to producers who can provide an adequate, regular and disease free supply.
5. Potato harvesting can be almost fully mechanised. Normally, the harvester digs up and loads the potatoes on trucks for transport to a shed where the tubers are washed, graded, and sized for bulk marketing or packed in bags. With the increased consumption of processed potatoes and a re-organisation of fresh market sales, more efficient storage conditions have become a key factor. In Europe, especially in North-Western Europe, a very large percentage of the potato crop is stored both for processing and for fresh sales. Progresses in storage techniques have made it possible to prolong the main crop potatoes' season.
Geographical scope of potato markets in the EU
6. Table potatoes can bear relatively long carriage so that transport costs are not sufficient to completely prevent buyers from all parts of the EU from competing with one another for the same supplies. This widens the geographical scope of the potato market and generally confers to it a European dimension.
7. Table potatoes from Northern Europe are sold on the EU’s Mediterranean markets and vice versa. The business of processed potato products and that of seed potatoes have a world dimension.
8. The sub-market of potatoes destined to the processing industry has a narrower dimension. Potatoes for processing have a lower unit value and the incidence of transport costs is higher. Processing firms are situated close to the plantings areas in order to minimise transport. In North-Western Europe, where the production of potato-based products is concentrated, locally produced potatoes are put into large storages that are clustered near

EN 10 EN
processing plants where better control of storage conditions and season long accessibility to the stored crop are ensured.
Organisation of the potato chain in the EU
9. Today’s agrifood markets are increasingly characterised by linked vertical chains in which agriculture, manufacturing and retailers influence each other, with an increasing focus on adding value, streamlining distribution and anticipating customers demand. In the EU potato markets, some basins of potato production have responded positively to this very dynamic economic environment.
10. In particular, the EU-5 zone comprising UK, the Netherlands, Belgium, Germany and Northern France can be considered as the most efficient and integrated area in the EU’s potato business. Here, yields are remarkably above the EU-25 average, the importance of EU-5 in total EU-25 potato production is continuously increasing (56% in 2005) and local traders now shape if not control commercial relations all over the EU. Not only price series in the EU-5 countries are soundly correlated but they also have a strong impact on the overall tendencies recorded at EU level.
Figure a: Selling prices of main crop potatoes in the EU-5 zone (€/100 kg) [1971–2005]
0
5
10
15
20
25
30
1971
1972
1973
1974
1975
1976
1977
1978
1979
1980
1981
1982
1983
1984
1985
1986
1987
1988
1989
1990
1991
1992
1993
1994
1995
1996
1997
1998
1999
2000
2001
2002
2003
2004
2005
€/10
0 kg
Belgium Germany France Netherlands UKSource: Eurostat
11. The current trend towards the concentration of production in the EU-5 area where processors are located and growing conditions seem more favourable is expected to consolidate in the next years. In the EU-5 area, there is a vital process of circular causation, where the competitiveness of the agricultural activity reinforces the position of manufacturers and vice versa.
12. At the level of market organisation, in the EU-5 area operators can benefit from information on key variables such as prices and production covering the whole EU-5 area. Published price lists and frequent meetings also play an important role in favour of continuous adjustments in prices.
EN 11 EN
13. In the EU-5 zone, processors and packers more and more provide seeds to farmers. If this practice limits the control of farmers on the purchase of seed varieties as well as planting schedules, it brings about a higher coherence in the plans of operators, reduces risks for farmers themselves and improves the efficiency of the whole chain. Indeed, the potato chain in the EU-5 is an example that shows that an increasing co-ordination can strengthen competitiveness and bring about advantages to all the operators, including farmers.
14. Another important factor shaping the potato business in the EU-5 zone is the creation of certain varieties that respond to specific needs (i.e. offer superior flavour and other attributes). Higher levels of specificity of a variety encourage tighter co-ordination in the form of contractual relations or even vertical integration. Contracts tend to cover a higher share in those areas where producers focus on varieties that would have low salvage value outside the relationship with well identified processors or packers.
15. If a given variety is suitable for fresh consumption, for processing and for exports, farmers have a higher degree of freedom in terms of market outlets and will show a higher propensity to take risks on the free-buy market. For example, in Belgium, where the most popular variety (Bintje) can have multiple destinations, the share of contracted material is relatively low.
16. Southern Europe is losing ground as a basin of potato production and is a very important recipient of products originating in North-West Europe. Yields are below the EU-15 average, costs of production are consequently high, surfaces and production are continuously declining. Local producers use mainly Dutch seeds and consumers eat more and more French table potatoes. Prices of main crop potatoes in the Mediterranean area (Italy, Spain, Portugal, Malta, Greece and Cyprus) are heavily affected by the trends observed in the EU-5 area.
17. In Spain, Italy and other Member States in Southern Europe, few distributors hold the representation right on the main varieties and detain the control of seed business within the national boundaries. They import seeds from the main breeding companies (mainly from the Netherlands) and sell them to local producers. Very often, these traders are also packers and cumulate a relevant buying and selling power.
18. In Southern Europe potatoes play a minor role as a factor of farmers’ aggregation. For example, the very few Spanish organisations dealing with potatoes have other crops as their main activity. Despite some exceptions, the residual interest placed on potatoes results in a general lack of farmers’ control on basic operations such as storage while strategic choices on the production process (for example, seeds selection) are not well co-ordinated. Traders focus mainly on earlies and have little interest in investing in high capacity storage facilities. The food manufacturing activity is not as developed as in North-Western Europe and the only export activity remains limited to early potatoes'.
19. The disruption of the planned economy system and the successive structural change in Central and Eastern Europe’s agriculture has strongly affected the potato industry. Production and plantings are consistently falling, while yields are low and, in some cases, highly variable.
20. In the new Member States (NMS), there are still many smallholdings and subsistence farms – especially in Poland and in the Baltic countries – with scarce connections with markets. For example, it has been estimated that in recent years 90% of Latvian potatoes have been produced in subsistence holdings. Such a product is affected by
EN 12 EN
significant quality problems and by the lack of modern storage equipment. As far as processing raw material is concerned, the limited processing capacities in some of the NMS constrain the development of local manufacturing firms.
21. The small scale of production, fragmentation, poor quality of tubers, difficulties in the collection of homogeneous batches create marketing problems. Some Eastern varieties find little acceptance among West European consumers while Western packers hesitate to purchase potatoes from some regions of the NMS for the fear of quarantine diseases.
22. Although the re-organisation of the potato industry is still not completed, the route towards a modern system of market economic relationships is bringing about some developments in the NMS. A large number of small family businesses are abandoning potato growing, plantings are continuously declining, prices become more and more in line with market fundamentals and investments are starting to flow into the potato sector.
Production
23. In the average of the period 2003/05, the EU-25 production of ware and seed potatoes was about 52.3 million tons, of which 70% originate in the EU-15. From 1990/92 till the period 2003/05, ware and seed potatoes production has decreased at an annual rate of –2.9% in the EU-25 and by –0.9% in the EU-15; therefore, the decline has been higher in the new Member States, –5.9% per year.
24. In Western Europe, total production is affected by the changes undergone in the demand for potatoes for food consumption. The demand for processed potato products is counterbalancing the fall in the demand for table potatoes, but does not grow enough to provide a stimulus for increasing the production of potatoes.
25. Another important factor is the reduced utilisation of potatoes for animal feed. Nowadays, cereals and other inputs replace potatoes for this purpose. Potatoes are more labour-intensive and, as a result, also more expensive than cereals for feeding animals. The utilisation of potatoes for animal feed is still popular in Eastern Europe, particularly in Poland, but the reduction in cattle stock and the increasing competition of other inputs are substantially lessening the demand for potatoes for animal feed there too.
26. Poland is still the most important producer of potatoes covering one fifth of the entire EU-25 production. However, the long term trend of decline of the Polish production is proceeding strongly. In 2005 the Polish production was 9.6 million tons against 29.6 million tons in 1990/92.
27. Production of potatoes is declining in the Mediterranean region of the EU. Potato production in Spain was 5.2 million tons in 1990/92, dropping to 2.6 million tons in 2003/05, equivalent to a yearly fall of –4.6% over the two periods. In 1990/92 Spanish production was bigger than the levels recorded for France or Belgium, while in 2003/05 the position was reversed. In Italy, production has consistently decreased too, 1.7 million tons in 2003/05 with a yearly decline of –2 % since the period 1990/92. In Portugal and Greece, production has annually decreased respectively by –4.5% and –1.1%.
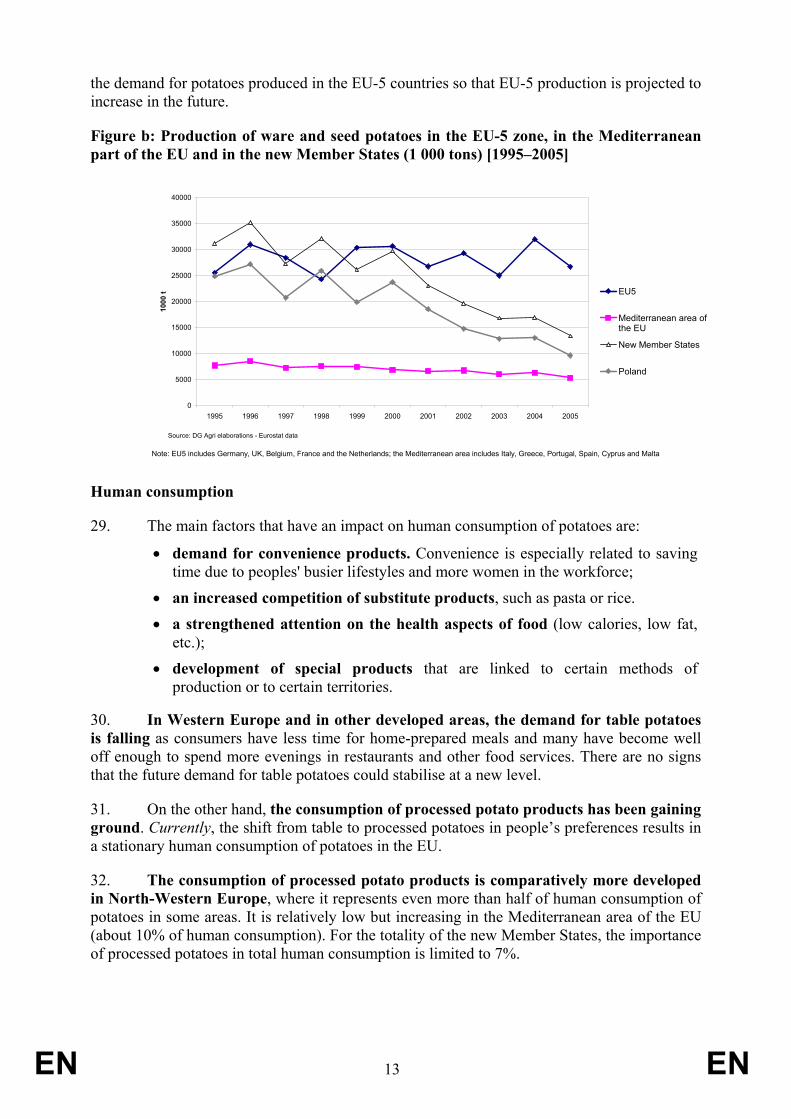
28. On the other hand, EU-5 production is on a stationary trend (around 33 000 thousand tons). Therefore, its importance in total EU-25 production increases (about 56%). It is likely that further cutbacks in plantings in Southern and Eastern Europe could strengthen
EN 13 EN
the demand for potatoes produced in the EU-5 countries so that EU-5 production is projected to increase in the future.
Figure b: Production of ware and seed potatoes in the EU-5 zone, in the Mediterranean part of the EU and in the new Member States (1 000 tons) [1995–2005]
0
5000
10000
15000
20000
25000
30000
35000
40000
1995 1996 1997 1998 1999 2000 2001 2002 2003 2004 2005
1000
t EU5
Mediterranean area ofthe EU
New Member States
Poland
Note: EU5 includes Germany, UK, Belgium, France and the Netherlands; the Mediterranean area includes Italy, Greece, Portugal, Spain, Cyprus and Malta
Source: DG Agri elaborations - Eurostat data
Human consumption
29. The main factors that have an impact on human consumption of potatoes are:
• demand for convenience products. Convenience is especially related to saving time due to peoples' busier lifestyles and more women in the workforce;
• an increased competition of substitute products, such as pasta or rice. • a strengthened attention on the health aspects of food (low calories, low fat,
etc.); • development of special products that are linked to certain methods of
production or to certain territories.
30. In Western Europe and in other developed areas, the demand for table potatoes is falling as consumers have less time for home-prepared meals and many have become well off enough to spend more evenings in restaurants and other food services. There are no signs that the future demand for table potatoes could stabilise at a new level.
31. On the other hand, the consumption of processed potato products has been gaining ground. Currently, the shift from table to processed potatoes in people’s preferences results in a stationary human consumption of potatoes in the EU.
32. The consumption of processed potato products is comparatively more developed in North-Western Europe, where it represents even more than half of human consumption of potatoes in some areas. It is relatively low but increasing in the Mediterranean area of the EU (about 10% of human consumption). For the totality of the new Member States, the importance of processed potatoes in total human consumption is limited to 7%.

EN 14 EN
33. In the last decade, the consumption of processed potato products has grown mainly because of the corresponding increase in fries' demand. The fries' market remains predominant but there are worries caused by the mounting health concerns of consumers.
Trade
34. The EU’s potato industry is very competitive and is continuously gaining shares within the EU as well as in the most dynamic marketplaces worldwide. On a world scale, EU firms are especially competitive in the segments of seed potatoes, where few Dutch companies are global leaders, and processed products. World demand for seed potatoes and processed products is increasing, especially in Asia.
35. Intra and extra-EU trade in seed, fresh and processed potatoes expanded significantly over the last decades. This trade expansion is mainly the result of an increasing specialisation of potato production in the EU-5 area.
36. Business in early potatoes from the Mediterranean Member States (Italy, Spain, Portugal, Greece, Cyprus and Malta) area is becoming increasingly problematic. Given that storage techniques now offer the possibility to commercialise main crop potatoes in the first part of the calendar year, earlies from Italy and Spain can still find a market in Europe as long as the price differential with main crop potatoes commercialised from March to June is not too high. Furthermore, they have to compete with potatoes originating in Egypt and Israel.
Figure c: Early potatoes shipped to the EU from the Mediterranean basin (tons) [1990–2004]
0
50000
100000
150000
200000
250000
300000
350000
400000
450000
500000
1990 1991 1992 1993 1994 1995 1996 1997 1998 1999 2000 2001 2002 2003 2004
tons
EU's Mediterranean area Non-EU's Mediterranean area Cyprus
Source: EUROSTAT
37. France is specialised in table potatoes and is the most important provider. French shipments are dominated by Southern Europe as main area of destination because consumers still prefer firm-cooking varieties there. About 65% of all French potato shipments go to Spain, Portugal, Greece and Italy.

EN 15 EN
38. Dutch and Belgian firms are leaders on the market of processed potato products. Trade in varieties that are used for processing purposes is mainly circumscribed to the EU-5 area where the main manufacturing companies are located.
39. Trade between the EU-15 countries and the new Member States has been increasing exponentially under the effects of the enlargement process. At the same time, fears of large volumes of cheap potatoes flooding into the EU-15 from the new Member States are so far unfounded. However, traffic is flourishing between bordering regions and some food multinationals are setting up processing plants in some NMS.
40. Transport costs have followed an upward trend over the last years, with a peak of + 30% from 2004 to 2005. This strong increase could produce a more fragmented production of potatoes. This could also affect trade in seed potatoes. The main breeders could further limit their business to genes and know how, leaving multiplication to others. Practically, they could bring samples of their “genes” abroad and provide licences to local operators which could take care of multiplication and commercialisation of seeds.
41. Phytosanitary regulations are of extreme importance for operators as they normally prevail on all the types of legal acts that concern trade. At present, without prejudice of a derogation, it is forbidden for phytosanitary reasons to import ware potatoes from all third countries except Switzerland, Algeria, Egypt, Israel, Libya, Morocco, Syria, Tunisia and Turkey, and other than European third countries which are either recognised as being free from Clavibacter michiganensis ssp. sepedonicus (Directive 2000/29/EC, Annex III), or in which provisions recognised as equivalent to the Community provisions on combating Clavibacter michiganensis ssp. sepedonicus have been complied with. Within this group of countries, Israel and Egypt are the main suppliers of early potatoes to the EU.
Prices and risk
42. After the big fall recorded in 1994, the potato production in the EU-15 fluctuated around 37 million tons but the market situation has not been perceived by farmers as encouraging. In parallel to a fluctuating but substantially stationary production, real producer prices have gradually moved downwards.
43. Some explanatory elements can be identified as causes of the relative low price:
° Yields improve and cause a decrease in the costs of production, especially in the EU-5 MS. Farmers can then sell their potatoes at lower prices;
° The high levels of competitiveness of the EU-5 farmers exert a downward pressure on prices not only within the EU-5 MS, but in the rest of the EU too;
° The demand for table potatoes is continuously falling and is gradually causing a reduction of producer prices for the product that is used mainly for fresh consumption;
° The progressive shift in demand from table potatoes to varieties destined to the manufacturing industry. Potatoes for processing have a lower value and their increased utilisation pushes downward the aggregate unit price of potatoes.
Two additional factors having an impact on the potato prices can be identified:
° Data collected on spot markets concern varieties that can be used for multiple purposes. These varieties are valued less than varieties that are
EN 16 EN
conceived for a specific use and that are normally contracted. However, prices on the spot market remain useful to illustrate price trends;
° Downstream operators have more possibilities to influence prices than farmers. In fact, packers and processors delay purchases when spot prices are very high or vice versa. The application of a counterbalancing strategy is more difficult for farmers as they are numerous and free-riding behaviours amongst them are more likely to happen.
44. In Southern Europe, prices of main crop potatoes tend to be higher than those recorded in the EU-5 area mainly because yields are lower and costs of production rise over the EU-5 levels. The price gap helps to explain why table potatoes from France have partly traded off domestic production in the EU's Mediterranean area.
45. Some NMS such as Hungary, the Czech Republic and Slovakia have prices that do not diverge significantly from the EU-5 average levels. In other NMS, such as Poland and the Baltic countries, there is a general increase in prices of main crop potatoes. As a consequence, prices tend to equalise EU-5 average levels and, in some cases, to overtake them. Alongside the narrowing of the price differential, quality gaps explain why table potatoes from Germany, Austria and other EU-15 countries have entered into these markets.
46. Prices of early potatoes tend to weaken in relation to the price of main crop potatoes. This is mainly brought about by the falling consumption of table varieties, increasing opportunities for packers to pick up the remaining batches of the main crop product during the earlies' season, and increasing competition from Israel and Egypt.
47. There is no common market organisation for potatoes. The absence of any type of stabilisation measures, the inelasticity of demand and the high variability of yields has produced substantial fluctuations of potato prices in the EU. Efficient storage operations can only partly offset the impact of these variables on price fluctuations.
48. However, potatoes have already become eligible for CAP decoupled payments:
• in the new Member States where a Single Area Payment Scheme1 applies; • as well as in those Member States2 of the EU-15 that decided to use the new Single
Farm Payment under the regionalisation option (Chapter 5, Section 1 of Regulation (EC) No 1782/2003). The regionalisation option allows applying a specific derogation to the prohibition on cultivating fruits and vegetables, other than permanent crops, and table potatoes3.
1 The Single Area Payment Scheme (SAPS) involves payment of a uniform amount per hectare of
agricultural land. The level of the payment per hectare shall be calculated by dividing the national financial envelope by the utilised agricultural area. As is the case with the single farm payment, farmers in the New Member States that apply the SAPS system have no obligation to produce, but they must keep the land in good agricultural and environmental condition.
2 Up to now, Denmark, Finland, Germany, Luxembourg, Sweden, England and Northern Ireland have opted for the regionalisation model. Overall, the potato area notified by these MS is about 390 000 hectares corresponding to almost 32% of EU-15 and 17% of EU-25 potato area.
3 In Article 60(1) of Regulation (EC) No 1782/2003, it is stated that “Where a Member State makes use of the option provided for in Article 59, farmers may, by way of derogation from Article 51 and in accordance with the provisions of this Article, also use the parcels declared according to Article 44(3) for the production of products referred to in Article 1(2) of Regulation (EC) No 2200/96, in Article 1(2) of Regulation (EC) No 2201/96 and potatoes other than those intended for the manufacture of potato starch for which aid is granted under Article 93 of this Regulation, except permanent crops.”
EN 17 EN
Within the other MS that are applying the Single Farm Payment in its standard form, farmers can have access to the single payment scheme if they do not use their agricultural land to produce permanent crops, other fruit and vegetables, and table potatoes4.
49. Prices variations do not convert automatically into income fluctuations of the same magnitude. However, price risk is a relevant element in potato business so that farmers and their counterparts in the potato chain have developed various tools that help reduce risks.
50. Contractual relations are the most popular price-fixing model in the potato sector. Normally, a maximum yield is established on which a given price is guaranteed. Once contracted prices and tonnages are fixed, the allocation of pay offs between farmers and their customers will depend on weather conditions and bargaining power. If the weather is unexpectedly favourable, then processors and traders can make additional purchases at prices below the contract level on the free-buy market. Annual or multi-annual contracts stipulated between potato producers and their customers normally include the possibilities of revising the unit price each month or sometimes even weekly.
51. In the EU, potato operators can deal with price risks by using financial derivatives, such as futures and options on futures. These types of contracts offer the possibility to lock-in a certain price ahead of time and are currently traded at the Commodity exchange in Hannover. In Amsterdam, trade in potato futures and options was rather limited if compared with trade in other commodities and it has been suspended since June 2006. Hannover is therefore the only market for potato futures as Dutch contracts for 2007 will be posted there. Very rarely individual potato producers have sufficient size and appropriate skills to make a profitable use of such modern risk management tools.
Conclusions: challenges and future action
52. As long as consumers require much higher dietary, hygienic and health standards and processors need low cost material that fits changing consumers’ requirements, there is room for the development and the introduction of new varieties offering better quality, higher yield and better resistance to diseases. Therefore, the evolution of demand in table potatoes and the rise in world demand for processed potato products will provide an excellent opportunity for expanding the business of the EU breeders of seed potatoes.
53. However, business in seed potatoes will be strengthened if basic principles of Intellectual Property Rights will apply fully, especially in some of the most important emerging countries.
54. The rising demand for potato products in Central and Eastern Europe, in Asia and South America will be met by imported products as well as by the production units that will be set up in these areas. EU potato processors are very competitive worldwide and could take
4 In Article 51 of Regulation (EC) No 1782/2003 it is stated that: “Farmers may use the parcels declared
according to Article 44(3) for any agricultural activity except for permanent crops and except for the production of the products referred to in Article 1(2) of Council Regulation (EC) No 2200/96 of 28 October 1996 on the common organisation of the market in fruit and vegetables, in Article 1(2) of Council Regulation (EC) No 2201/96 of 28 October 1996 on the common organisation of the markets in processed fruit and vegetable products and potatoes other than those intended for the manufacture of potato starch for which aid is granted under Article 93 of this Regulation”
EN 18 EN
advantage of the growing consumption of processed products. Product promotion and new product development are on the priority list of the main firms.
55. Manufacturers are trying to respond to the rising concerns on the effects of French fries on health by introducing "new French fries" (e.g. potatoes fried in special oils, microwavable, etc), but are also going to develop new lines of convenience products. In the EU and in other affluent marketplaces, business in refrigerated products with individual characteristics (linked to specific production methods, composition or origin) is projected to rise fast in the next years.
56. The rising presence on EU markets of products based on well-identified local recipes could open new opportunities for operators in regions which are currently not very dynamic in their role of suppliers of potatoes and potato products. However, the revitalisation of the systems of production in these areas involves a coordinated network of relationships at local level and brave marketing strategies.
57. It is often questioned whether the decline in table potatoes' consumption could be stopped and how this could be done. There is no evidence that table potatoes are harmful for health and a clear distinction should be made between some potato products and table potatoes. It is widely recognised that some classes of French fries have high calories and high fat contents, but that evidence should not automatically be considered as valid for table potatoes (as well as for some "new" French fries). An active approach could be based firstly on facts – that is scientific studies for measuring the impact of (different varieties of) table potatoes on human health – and then on updated marketing strategies.
58. In order to inform and offer guarantees to consumers about the quality of the product, potato producers in Europe could apply for the PDO/PGI. There are some classes of potatoes that are now registered as PDO/PGI.
59. If the evolution of trade patterns shows that the EU new Member States provide promising outlets with strong possibilities of expanding the EU potato industry, it is also evident that there is today little competition coming from NMS, on the EU-15 potato markets. Given that prices in the new Member States tend to reach average EU-15 levels, Central and Eastern European operators of potatoes cannot count on a significant price differential for strengthening their competitiveness. Rather, they need to improve the overall efficiency of the production and commercialisation process in order to establish more substantial and bi-directional trade links with the EU-15.
60. In Southern Europe, there is still room for potato farmers to strengthen connections with their commercial counterparts and to improve their horizontal links. The domestic markets in these countries are relevant and still offer business perspectives.
61. In some NMS, the use of certified seeds could be further promoted as this enables farmers to exert a better control on their volumes of production, facilitates the collection of homogeneous batches and allows them to design a more accurate sales schedule. A close monitoring should then accompany all the phases of crop development in order to achieve a better quality and safe commercial margins.
62. In the NMS but also in the EU's Mediterranean area, packers and processors could invest more in storage logistics and other equipment in order to increase the scale of their activity and market finished production units ready to hit the shelves of big retailers.

EN 19 EN
63. Information on prices, storage, plantings, production, varieties and other variables reported by specialised agencies has an important role to play. It could be used to enhance the collective knowledge on how the market works and what it wants. Sound information ensures market transparency and efficiency and is vital for farmers as they are relatively small compared to the larger organisations with which they trade. If in Western Europe, existing databases could be further improved, in the NMS there is a strong need to set up efficient information systems that could assist farmers in their decision-making; Public action could be directed at facilitating the flow of reliable information and improving the understanding of the potato markets in the EU.
64. If an individual farmer cannot individually take up modern risk management strategies, more farmers may pool their efforts and develop joint strategies on commercialisation and risk management. Working together would then allow reducing the unit transaction costs and would make the use of some financial instruments more attractive.
65. As was remarked upon in the Commission’s Communication on risk and crisis management in agriculture (COM(2005) 74, p. 6): “the causes of the rather weak development and use of market based risk management tools (insurance, futures market, contract farming) could be addressed by training measures within rural development programmes”.
66. Potato producers, especially in Western Europe, are often subject to the respect of different private quality assurance schemes. These schemes can cover issues such as food safety, environment protection, animal welfare and occupational health. As there are many quality assurance parameters and different schemes, an improved harmonisation will facilitate trade, improve cost-effectiveness and install higher consumer confidence.
EN 20 EN
1. INTRODUCTION
1.1. Objective
Potatoes are one of the few agricultural products for which there is no common market organisation. In 1992 and 1995 the Commission put forward proposals for a common market organisation, but no agreement was reached in the Council.
However, potatoes have become eligible for CAP decoupled payments in the new Member States where a Single Area Payment Scheme5 applies as well as in those Member States that will implement the new Single Farm Payment under the regionalisation option (Chapter 5, Section 1 of Regulation (CE) No 1782/2003).
As a consequence of the enlargement to ten new Member States on 1st may 2004, the EU’s production of potatoes has increased by 40% in comparison to EU-15 levels, while the EU's potato area has jumped by 77%.
These changes bring about the necessity to follow up more closely the evolution of potato markets in the EU.
In the core of the EU’s potato economy (Northern France, Belgium, Netherlands, North-West Germany and UK), contractual relationships evolved on the basis of more direct and efficient linkages between the various operators of the chain. In many zones situated in the new Member States, holdings have instead a small size and the circulation of information within the sector is very fragmented.
Potato operators and policy makers need to have sounder information in order to monitor and better interpret market trends. As agricultural holders are relatively small and can control only a limited flow of information, the European Commission intends to improve market transparency with the establishment of a working group where not only farmers but also other operators of the chain are represented and where the main elements and determinants of the potato markets are discussed.
This report is aimed to be a step towards a better understanding of the economic relations shaping the potato business and will provide further material for the statistical documents6 that will be periodically released by DG Agri on the potato markets.
1.2. Basic definitions
Potatoes markets are becoming increasingly segmented as new varieties are created to satisfy particular needs of the chain. However, as starting point some broad categories of potatoes can be identified: early potatoes, main crop potatoes, seed potatoes and starch potatoes.
5 The Single Area Payment Scheme (SAPS) involves payment of a uniform amount per hectare of
agricultural land. The level of the per hectare payment shall be calculated by dividing the national financial envelope by the utilised agricultural area. As is the case with the single farm payment, farmers in the New Member States that apply the SAPS system have no obligation to produce, but they must keep the land in good agricultural and environmental condition.
6 http://ec.europa.eu/comm/agriculture/consultations/adco/fruitveg/index_en.htm.
EN 21 EN
Potatoes for human consumption, that is early and main crop potatoes, can be used as table potatoes, when they are supplied fresh to the consumer, or as raw material for the food processing industry.
The UNECE defines "early potatoes" as potatoes harvested before they are completely mature, marketed immediately after their harvesting and whose skin can be easily removed without peeling7.
Early potatoes from the EU's and non EU's Mediterranean area (Spain, Italy, Cyprus, Greece, Malta, Portugal, Morocco, Israel and Egypt) are harvested and then commercialised in the first semester of the calendar year while the season of earlies obtained in the Continental and Northern part of Europe starts in late May-June and has its pick in July-August. In Southern Europe, the process is characterised by relatively low yields and high costs and, by consequence, the utilisation of early potatoes from the Mediterranean area is not very attractive to the processing industries.
The harvest of main crop potatoes starts later (normally in September) and production costs are lower. The technical progresses in storage operations have allowed a prolongation of the main crop potatoes’ season till May-June. As a consequence, there is an overlap of the season of main crop potatoes with that of early potatoes from the Mediterranean area.
The food industry can require potatoes for different types of products:
• pre-cooked products (mostly French fries), • de-hydrated products (i.e. potato flours, potato flakes or potato granules), • snacks, • other products (gnocchi, salads, ready prepared meals, etc.).
Seed potatoes are propagation material intended for re-production8. Once planted, they grow into new crops of potato varieties for human consumption or for starch.
Special varieties of potatoes are used for the production of starch. Starch potatoes represent the only sector of the “potato family” in which the CAP intervenes. In practice, a premium is paid to starch producing undertakings provided that they have made a cultivation contract with a potato producer and paid to potato producer a fixed minimum price for all the potatoes necessary to produce starch up to a quota limit (Council Regulation (CE) No 1782/2003, Article 94).
In this report, we will not deal with the evolution of the potato starch sector in the EU. The links between starch potato and the other parts of the potato industry are very weak because starch potatoes are only grown on contract for the starch industry and are not suitable for direct consumption. Therefore, they are not in direct competition with other varieties of potato.
7 See http://www.unece.org/trade/agr/standard/potatoes/pot_e/30potear.pdf. 8 For the UNECE definition of seed potatoes, see
http://www.unece.org/trade/agr/standard/potatoes/pot_e/S-1.pdf.

EN 22 EN
1.3. Main characteristics of the cultivation of potatoes
Potato is commonly considered a cool season crop. It is suited to at high temperatures when water is supplied in uniform quantities and can grow well on a wide variety of soils. Planting time varies considerably from region to region depending not only on local climatic conditions but also on intended market use. This entails that potato production can be obtained in many different areas and, indeed, explains why potatoes are grown in all the EU countries.
Water management and/or rainfall are probably the most important factors determining yield and quality of potatoes. Water scarcity may determine shifts in the localisation of potato area in the future. In some areas, potatoes use relatively large amounts of fertilisers and pesticides.
Potatoes should be grown in a crop rotation that will enhance the soil fertility, maintain a loose friable soil condition and reduce weeds. From a technical and, importantly, from an economic standpoint potato should be seen not as a single crop alternative but rather as an element within a multiple-crop rotational plan.
Potato harvesting can be almost fully mechanised. Normally, the harvester digs and loads the potatoes on trucks for transport to a shed where tubers are washed, graded, and sized for bulk marketing or packed in bags or boxes. With the increased consumption of processed potatoes and a re-organisation of fresh market sales determined by the impetuous growth of big retailers, more efficient storage conditions have become a key factor. In Europe, especially in North-West Europe, a very large percentage of the potato crop is stored both for processing and for fresh use.
Following the expansion of the processing industry, particularly in Belgium and the Netherlands, locally produced potatoes are put into large storages that are clustered near processing plants where better control of storage conditions can be maintained and season long accessibility to the stored crop are ensured.
The above mentioned characteristics of the potato production bring about a series of consequences:
– perishability and European trade: potatoes are produced and demanded in all the regions of Europe. As table potatoes can bear long carriage, the geographical scope of table potatoes markets has a European dimension. Nowadays, potatoes from Northern Europe compete directly with locally produced potatoes in the Southern Member States and vice versa;
– perishability and price risk: potatoes can be stored for some months and then marketed at the “right” moment. Thus, potatoes’ operators could normally be less exposed to price-risk than their colleagues engaged in the production of perishable crops such as, for instance, peaches but more exposed than the producers of cereals;
– variation in surfaces: differently from farmers cultivating permanent crops that incur in elevated fixed costs, potato holders can promptly respond to technical, market and policy signals by changing their production mix. The area under potatoes can vary significantly from one year to another.

EN 23 EN
1.4. Structure of the report
This report will be structured in five sections. The first four sections will deal more directly with the economy of the potato sector. The quantitative trends of the main variables that affect the markets' evolution and equilibrium will be presented in the sections treating production (§ 2), demand (§ 3) and trade (§ 4). The understanding of the path followed by these variables will ease the "reading" of price series that will be carried out in § 5. In this section, we will also deal with the strategies put in place by operators to limit their exposure to risk. The last part (§ 6) will concern the main EU policies that have or could have an impact on the sector.
Section 2 will provide an extensive presentation of the EU potato production. We will treat separately the segments of main crop potatoes, early potatoes and seed potatoes. We will also identify the variation in production levels and the resulting vectors of specialisation in the EU. Changes undergone in the structure (sizes, typology of production) of potato farms in the EU will also be presented. The analysis will be carried out at an aggregate level and at Member State level.
Section 3 will be mainly devoted to analysing the demand, mainly that for table potatoes and that for processed products. The main facts will also be interpreted in the light of evolving social habits and new dietary requirements that have a big impact on the evolution of demand. A minor part of the total supply is also required for animal feed and starch potatoes. Figures will be provided on the evolution of these components at EU and Member States level.
Section 4 is about trade. The analysis of trade flows is another fundamental component affecting the dynamics of EU markets and it will shed light on the competitiveness of the EU potato industry on the world markets. The analysis will be carried out on the main segments of the potato sector: seed potatoes, early potatoes, main crop potatoes and processed potato products.
Section 5 will deal mainly with price series. In order not to use only "average" prices, statistics provided by professionals on specific varieties or on homogeneous groups of varieties will be used. We will try to identify the factors lying behind the levels and evolution of price series. The analysis will concern data registered in the main producing Member States. Another important part of section 5 will concern the relations in the potato chain as a way of minimising the risk exposure of the various parts involved in the transactions.
The last section will provide a broad overview of the main EU policies having an impact on the potato business in the EU. The first in order of importance is the EU phytosanitary policy but other fields of intervention will be equally considered: the CAP quality policy, the CAP promotion policy, the EU commercial policy and the new CAP direct payments.
At the end of each section, a paragraph will illustrate the main findings but also the main challenges that operators have to face.
The main sources that will be used are EUROSTAT (production, food use, trade and prices), FAO (data on production, trade and food use at world level). Statistics provided by professionals and by specialised agencies such as ZMP on prices of well identified potato varieties will also be used to reinforce the analysis of price series in § 5.

EN 24 EN
There are some national measures that could have an impact on the potato markets, such as insurance schemes, measures to facilitate forms of vertical co-ordination and so on. Such national measures will not be directly addressed in this report. Nonetheless, the issue is relevant and could be addressed in the future within the working group on potatoes set up by the European Commission.
2. PRODUCTION
In Western Europe and in other developed areas, total potato supply has been constant over the last decade. The partial substitution in people’s own consumption of table potatoes with cereals and vegetables is partly offset by the increasing consumption of processed potato products. Vice versa, in other countries where potatoes were almost inexistent in people’s diet, potatoes supply is following an upward trend. In many areas of Africa, South America and particularly in Asia, technological improvements and rotational necessities on the production side, united with increasing incomes and new possibilities to diversify and integrate traditional food habits, are stimulating domestic supply to grow.
We observe a reduced utilisation of potatoes for animal feed. Potatoes are more labour-intensive and, consequently, also more expensive than cereals and other inputs for feeding animals.
A significant impact on the evolution of EU-25 potato supply is being exerted by the big changes in Central and Eastern Europe. In the NMS, potato production is being subject to an overall structural change and its fall is very significant.
This section aims at describing the main trends that have been shaping the supply of potatoes in the last decade. The starting point will be the analysis of world production in order to highlight the relative position of the main players and the place of the EU (§ 2.1). A detailed exam of the situation in the EU will then be carried out in the successive paragraphs. In § 2.2 we will furnish a factual presentation of the EU production, by pointing out also the changes undergone in the localisation of production since the first nineties. The aggregate "potato production" is the sum of starch potatoes, early potatoes, main crop potatoes and seed potatoes. Over the exposition, we do not consider starch potatoes in the aggregate production of ware and seed potatoes. Production of early potatoes and seed potatoes will be analysed respectively in § 2.3 and § 2.4. The structure of potato holdings will be scrutinised in § 2.5 and will be put in correlation with the production process of potatoes as well as with the necessities of the downstream customers. As conclusive step, we will synthesise the main findings of this section (§ 2.6).
FAO statistics on the EU production used in § 2.1 could diverge from Eurostat figures used in the successive paragraphs. In particular, FAO data referred to the first years of the nineties present lower values of potato production and surfaces for those Countries of Central and Eastern Europe that have joined the European Union on 1 May 2004.

EN 25 EN
2.1. World Production
World potatoes production has been increasing by + 1.4% per year, from 266.3 million tons in the period 1990/92 to 323 million tons in 2003/05 (table A-1)9. Behind this overall rise, there is a constant growth recorded for developing countries10 (+ 4.5% on annual basis), particularly in China (yearly increase of + 5.8%), that is now the first world producer with a share of 23%, and India, (yearly rise of + 3.5%) that covers now 7.8% of world potato production (graph 2-1). Production is instead declining in many important developed areas, such as in the EU-25, that records an annual fall of –1,6% from 1990/92 to 2003/05 (–0.6% for the EU-15), and in other countries of Eastern Europe like Ukraine (–0.4%) and Russia (–0.3%). US and Canada have been recording a positive trend with an annual increase respectively of + 0.5% and + 3.4%. As result, developed countries' production declined at an annual path of –0.5% from 1990/92 to 2003/05 but still detained about 53% of world production in 2005. EU-25’s share in world supply was 18.5% in 2005.
Figure 2-1: Main world producers in 2005 (metric tons)
0
10000000
20000000
30000000
40000000
50000000
60000000
70000000
80000000
Chi
na
Rus
sia
Ind
ia
Ukr
aine
USA
Ger
man
y
Pol
and
Bel
arus
Net
herla
nds
Fra
nce
Ukr
aine
Can
ada
Ira
n
Tur
key
Rom
ania
Ban
glad
esh
Per
u
Bra
zil
Jap
an
Bel
gium
Col
ombi
a
Spa
in
Egy
pt
Kaz
akhs
tan
Nor
th K
orea
Pak
ista
n
Arg
entin
a
Sou
th A
frica
Ita
ly
Alg
eria
Met
ric T
ons
Source: DG Agri elaborations; FAO data
Potato world area was 18.6 million hectares in 2005, almost equally distributed between developing and developed countries (table A-2). From 1990/92 to 2003/05, world area has increased annually by + 0.4%, although there has been a decrease in the developed countries (–1.3%) and an increase in the developing ones (+ 2.8%). Area has declined more in EU-25, –3.4% on annual basis (–2.2% in EU-15), in Japan (–1.8%), in US (–1.1%) as well as in Russia and Ukraine (–0.5%). Canada is the only important producer, within the group of developed countries, with a rising potato area
9 Tables A.1, A.2, A.3 are in the statistical appendix (p. 97). 10 The distinction between developed and developing countries is the one utilised by FAO in its statistical
accounts. According to such a classification, India and China belong to the group of developing countries and, by consequence, have in many cases a big impact on the evolution of the aggregate "developing countries".
EN 26 EN
(+ 2.6%). Surfaces are instead growing in China, + 3.2% per year, India, + 2.6%, Bangladesh, + 5.6%, as well as in Africa, + 3.8%. China is the first potato country in terms of area, with a share of 23.6% in total world area, next come Russia, 16.8%, EU-25, 10.9%, Ukraine, 8.1%, and US, 2.4%.
The average potato yield at world level was 17.2 t/ha in 2005, the average level for the developed countries was about 18.6 t/ha while it was 16 t/ha for the developing countries. World yields averagely increased by + 1% per year from 1990/92 to 2003/05, with a rise of + 0.9% for the developed countries and + 1.6% for the developing ones (table A-3).
Therefore, the jump of developing countries production is not only due to different patterns in terms of surfaces, but also to yields' increases. Again, this is particularly evident for China, + 2.5% per year from 1990/92 (16.7 t/ha in 2005), India, + 0.9% (17.9 t/ha), Bangladesh, + 2.6% (14.4 t/ha). However, the average values recorded for the group of developed countries are strongly affected by the relatively low increases recorded for Russia, + 0.2% per year from 1990/92 to 2003/05, with a yield of 11.6 t/ha in 2005, and Ukraine, + 0.2% (12.7 t/ha). US and EU-25 are improving annually their potato yields respectively by + 1.5% (43.5 t/ha) and + 1.9% (29.3 t/ha). The corresponding increases for EU-15 is equal to + 1.6% (about 37.3 t/ha in 2004).
2.2. Potato production in the European Union
The geographical distribution of potato production within the European Union is characterised by five main aspects:
The Mediterranean part of the EU is relatively more specialised in early potatoes that are commercialised in the first semester of the calendar year;
Earlies cultivated in Northern, Eastern and Central European countries are brought on the market between late May and August. However, these countries are relatively stronger in the marketing of main crop potatoes;
Given continuous improvements in storage facilities, the season of main crop potatoes has been prolonged and clashes with the marketing season of early potatoes from the Mediterranean area;
Trend towards the concentration of potato supply in five Member States: Germany, the Netherlands, France, UK, Belgium (hereinafter EU-5). Poland has been for a long time the first potato producer in the EU but its production is strongly declining, while EU-5 countries are strengthening their position on the EU markets;
The new Member States’ potato production underwent a drastic process of structural change following the disruption of the former planned socialist system. The path towards a modern system of market economic relationships is bringing about some developments but the re-organisation of the sector is still not completed. We will analyse separately the situation in the EU-15 (§. 2.2.1) from that of the new Member States (§ 2.2.2)

EN 27 EN
2.2.1. EU-15
From 1990/92 to 2003/05, production of ware and seed potatoes11 decreased at an annual rate of – 2.9% in the EU-25 and by – 0.9% in the EU-15: therefore, the decline was higher in the new Member States, –5.9% (table A-4)12. In the average of the period 2003/05, EU-25 production of ware and seed potatoes was 52.3 million tons, of which 70% originated in the EU-15.
Poland is still the most important producer of ware and seed potatoes covering one fifth of the entire EU-25 production. However, the long term trend of decline of the Polish production is proceeding strongly. In 2005 the Polish production was 9.6 million tons going down from 29.6 million tons in 1990/92 (table A-4). Germany is the second producer of potatoes in the EU with about 8.5 million tons, equivalent to 17.5% of the EU-25 production. The German production has been slightly falling since the beginning of the nineties at an annual rate of –0.6%. The other main producing countries are the Netherlands, 4.35 million tons in 2005 (9% of the EU-25 production), France, 5.3 million tons (11%), UK, 5.8 million tons (12%) and Belgium, 2.8 million tons (5.8%).
In all the Member States, potato production has been decreasing over the last decade, except in Belgium, in the Netherlands and France. Belgian production has been increasing at a yearly rate of + 2% from 1990/92 to 2003/05, the Dutch production by + 0.1% and the French one by + 1.3%. In the EU-5, only UK has seen its ware and seed potatoes' production declining more than the EU-15 average, –1% per year from 1990/92 to 2003/05 (against –0.9% per year for EU-15).
The Mediterranean Member States are losing importance. Spanish production of ware and seed potatoes was 5.2 million tons in 1990/92, dropping at 2.6 million tons in 2003/05, equivalent to a yearly fall of –4.6% over the two periods. In 1990/92 the Spanish production was bigger than the French and Belgian ones, while in 2003/05 the position was reversed. In Italy, production has consistently decreased too, 1.7 million tons in 2003/05 with a yearly decline of –2 % from the period 1990/92. In Portugal and Greece, production annually decreased respectively by –4.5% and –1.1%. Graph 2-2 shows that EU-5 production is stationary, while the harvest in the Mediterranean area and especially in the new Member States is strongly falling.
11 This aggregate excludes potatoes for starch production. 12 Tables A-4, A-5 and A-6 are in the Appendix (p. 100).

EN 28 EN
Figure 2-2: Production of potatoes in the EU: comparison between the evolution in the EU-5 zone, the Mediterranean basin and the new Member States (1 000 tons) [1990 – 2005]
0
5000
10000
15000
20000
25000
30000
35000
40000
1995 1996 1997 1998 1999 2000 2001 2002 2003 2004 2005
1000
t EU5
Mediterranean area of theEUNew Member States
Poland
Note: EU5 includes Germany, UK, Belgium, France and the Netherlands; the Mediterranean area includes Italy, Greece, Portugal, Spain, Cyprus and Malta
Source: DG Agri elaborations - Eurostat data
Area cultivated under potatoes13 in the EU-25 reached almost 2 million hectares in 2005, of which 59% are concentrated in the EU-15 zone (table A-5). Between 1990/92 and 2003/05, the annual area decreases have been –4.4% for the entire EU-25, –2.5% for the EU-15 and –6.2 % for the NMS.
Evidence shows a certain regularity in the decline of potato area in the EU-15 since 1988 (graph 2-3). The 1992 CAP reform has not caused major breaks as potato plantings continued to decline more than total arable land in the EU-15 even after its implementation.
Figure 2-3: Evolution of arable land, usable agricultural area and potato area in the EU-15 (1992/94 = 100) [original data in ha; 1988–2005]
60
70
80
90
100
110
120
130
1988
1989
1990
1991
1992
1993
1994
1995
1996
1997
1998
1999
2000
2001
2002
2003
2004
2005
Usable AgriculturalAreaArable area
Potato area
Source: DG Agri calculations; Eurostat data
Pre-1992 CAP reform
Post-1992 CAP reform
13 In this case, area under starch potatoes is included.
EN 29 EN
From 1990/92 to 2003/05, the annual reduction of surfaces in the EU-5, but Germany, has been lower than the EU average decline. In Belgium it is recorded even an annual increase of + 0.7% over the two periods. Again, there is a considerable fall of surfaces in Spain, –6.8% per year, Portugal, –6.4%, and Italy, –3.3%.
The EU-5 zone concentrated 56% of the entire EU-25 production in 2005 (a share of 77% in EU-15 production), but only 40% of the EU-25 potato area (67% in terms of EU-15 potato area). In 2005 surfaces under potatoes in Spain and Italy represent respectively 4.8% and 3.5% of the EU-25 area, more than the Belgian one (3.3%), despite the fact that production in these two countries is lower than in Belgium.
Yields are higher in the EU-15 and, within it, in the EU-5 plus Denmark and Ireland, while the remaining countries have yields that are lower than the EU-15 average. In 2003/05, the average potato yield in the EU-25 was 28.6 t/ha, resulting from a yearly increase of 2.1% since 1990/92 (table A-6). In the EU-15, the level was 36.8 t/ha with an annual increase of 1.9% over the two periods. In the NMS, the average yield was 18 t/ha in 2003/05 and the annual increase from 1990/92 was 0.7%. Therefore, yields in the EU-15 are almost twice those recorded in the NMS.
Relatively low levels are recorded in Finland, (25.7 t/ha in 2005), Italy (25.1 t/ha), Greece, (24 t/ha) and Spain (27.5 t/ha). Portuguese yields (about 16 t/ha in 2004) are even lower than those recorded in Central and Eastern Europe. Yields improvements in Italy, + 1.2%, and in Spain, + 2.3%, have not prevented a consistent decline of production.
2.2.2. New Member States
Following the 2004 enlargement, the EU production of potatoes has increased by 40% in comparison to EU-15 levels, while potato area has jumped by 77%. These numbers just represent the current picture and the situation is evolving as a consequence of the restructuring process that is taking place in the NMS.
At national level, potatoes play a very important role especially in Poland and in the Baltic countries (table 2-1). In Poland the value (at basic prices)14 of potato production represents 3.8% of the total output of the agricultural industry (OAI)15, whilst potato area covers 3.7% of the usable agricultural area (UAA). In Estonia, potatoes cover 6.2% of OAI and 2.1% of UAA, in Lithuania the percentages are 4.2% in terms of OAI and 2.3% in terms of UAA, in Latvia, it corresponds to 6.7% of OAI and 2.6% of UAA. High shares are recorded also in Cyprus, 4% of OAI and 4.1% of UAA, and Malta, 5.4% of OAI and 9.3% of UAA. In the EU-15, the importance of potato production is relatively higher in Belgium (3.6% in terms of OAI and 4.7% in terms of UAA), in the Netherlands (3.4% of OAI and 8.1% of UAA, and in UK (3.4% of OAI and 0.9% of UAA).
14 Output at basic prices is the sum of output at producer prices plus subsidies on products. Potato are not
subsidised and there is coincidence between the potato-output at producer prices and potato-output at basic prices.
15 The output of the agricultural industry results from two kinds of activity: (i) agricultural activities (main or secondary) performed by agricultural units; (ii) non-agricultural secondary activities of agricultural units (for more details, see http://europa.eu.int/estatref/info/sdds/en/cosa/eaa_eaf_rev1_1.pdf).

EN 30 EN
Table 2-1: Importance of potato production in the countries of the EU
Value of potato production (mio
€) - 2005
Share of potato production in
agricultural output - 2005
Area under potatoes -
2005
Share of potato area in Usable
Agricultural Area - 2005
Direct labour force (AWU) employed in holdings producing
potatoes - 2003
Shares of Direct labour force
employed in potatoes cultivation in the EU -
2003EU25 6277,6 2,0% 1972,3 1,2% 1410840 16,9EU15 5302,1 1,9% 1166,7 0,9% 799840 15,3Belgium 244,7 3,6% 65,0 4,7% 17880 24,7Czech Republic 84,2 2,4% 36,0 1,0%Denmark 135,8 1,8% 40,0 1,5% 4680 7,7Germany 863,4 2,2% 276,9 1,6% 132590 21,5Estonia 31,6 6,2% 14,0 2,1%* 20430 54,5Greece 155,9 1,3% 35,5 0,9% 50770 8,6Spain 541,7 1,3% 94,7 0,4% 156980 15,7France 997,9 1,6% 158,0 0,5%* 49620 5,6Ireland 90,0 1,6% 12,0 0,3% 6200 3,9Italy 517,9 1,3% 69,9 0,5% 53650 3,6Cyprus 22,7 4,0% 5,5 4,1%*Latvia 50,0 6,7% 45,1 2,6% 125260 88,9Lithuania 63,1 4,2% 64,8 2,3% 199280 89,7Luxembourg 3,2 1,3% 0,6 0,5% 670 16,9Hungary 65,6 1,1% 25,4 0,4% 67060 12,8Malta 6,7 5,4% 1,0 9,3% 2720 60,4Netherlands 718,2 3,4% 155,8 8,1% 23630 12,7Austria 48,2 0,9% 22,2 0,7% 34310 18,9Poland 607,8 3,8% 588,2 3,7%Portugal 76,4 1,1% 39,4 1,1% 230300 43,9Slovenia 14,1 1,3% 6,3 1,2% 64200 67,3Slovakia 29,9 1,7% 19,4 1,0% 41750 35,2Finland 96,8 2,4% 28,9 1,3% 31590 32,4Sweden 107,6 2,6% 30,5 1,0% 8970 12,7UK 704,6 3,4% 137,4 0,9% 32310 9,2Bulgaria 62,8 1,9% 24,0Croatia : :Romania : 285,9 2,0%Turkey : 150,5
* 2004 for France, Ireland and Estonia; 2003 for Cyprus and UKSource: DG AGRI elaborations - Eurostata data
In 2005, the NMS’ ware and seed potato production was 13.3 million tons, of which 73% coming from Poland (table A-4). Potato production in Poland underwent an annual reduction of –6.3%. In Estonia (209 800 t in 2005), Slovenia (144 700 t) and Czech Republic (865 100 tons), the fall was equal or even more severe. In Lithuania, production declined relatively less, that is –2.4%, with a level of 778 800 tons in 2005. The fall was –3.3% per year in Latvia (630 400 tons in 2005), –4.1% in Hungary, (657 300 tons), –4.7% in Slovakia (301 200 tons).
Poland captures 30% of total potato areas in the EU-25, equivalent to 588 200 hectares (the level was 1.77 million hectares in 1990/92). There are not very important differences in yields' levels between the NMS, although some countries record levels above the NMS average yield (17.7 t/ha in 2005), such as the Czech Republic, Hungary and Slovenia. The Polish yield reflects the NMS average (table A-5 and A-6).
The reduction of surfaces has been sustained in all the NMS, explaining a light improvement of yields over the last decade.
If there is a large gap in yields' levels between EU-5 and the NMS, there is also a difference in yields' fluctuations which are more significant in Poland and less

EN 31 EN
floating in the EU-5. In graph 2-4, these aspects are illustrated by the annual percentage variation of yields. However, in recent years Polish yields appear to be less fluctuating than a decade ago.
Figure 2-4: Annual variation (%) of potato yields in Poland and in the EU-5 area (from 1997 to 2005)
-30
-20
-10
0
10
20
3019
97-9
8
1998
-99
1999
-00
2000
-01
2001
-02
2002
-03
2003
-04
2004
-05
EU5
Poland
Source: Eurostat data, DG Agri elaborations
In the Baltic MS and in Poland, production is still very small-scale, carried out by peasants that have a scarce market orientation. In recent years, 90% of Latvian potatoes have been produced in such subsistence holdings. Such a product is affected by significant quality problems and by the lack of modern storage equipment. A large number of these small family businesses are abandoning potato growing, or indeed farming altogether16.
If there is a consistent loss of many small farmers and plantings have been on a continuous decline, there are also signs that area reduction could increase production intensity and stabilise potato production at a large scale with higher and less floating yields.
2.3. Early potatoes
Harvest and commercialisation of early potatoes are dominated by the Southern product in the first months of the year, particularly in the period from March to mid-June. After this period, early potatoes from Northern and Central Europe countries are placed on the markets.
Main crop potatoes' trade has been decisively increasing during the season of the Mediterranean earlies. Storage possibilities permit an extension of the main crop campaign and increase competition. This is one of the key factors contributing to explain why the EU’s Mediterranean production of early potatoes is
16 European Potato Markets, N. 1454, 2005, p. 6

EN 32 EN
characterised by an accentuated downward trend over the last decade (graph 2-5).
Information on early potatoes is incomplete as we do not have enough statistics on Cyprus, Portugal, Poland and some other new Member States.
Figure 2-5: Early potatoes production in the main producing Member States (1 000 tons) [1990–2005]
200
300
400
500
600
700
800
900
1990/92 1997 1998 1999 2000 2001 2002 2003 2004 2005 2006 (prov.)
1000
tons
Belgium
Germany
Spain
France
Italy
Source: Eurostat
Since the beginning of the nineties, production has been increasing in Greece, Austria and Belgium, while France, Italy and, to a bigger extent, Spain, Germany and UK are recording falling levels of early potatoes production (table A-7).
In 2005, Spain was still the main producer Member State of early potatoes in the EU's Mediterranean area, with a harvest equal to 469 000 tons, followed by Italy with 460 000 tons. Within the rest of Europe, Germany is the main producer with 476 900 tons in 2005. France, Austria and Belgium produce also significant quantities (table A-7).
Since 1990/92, the annual fall of the aggregate “ware and seed potatoes”17 harvest in Spain and Italy has been more significant than the fall of earlies' production. In Italy, the annual rate of early production decrease is low, –0.3% per year from 1990/92 to 2003/05, while in Spain is –3.2%. Therefore, these two countries remain relatively more specialised in the production of early potatoes.
As for the NMS, Cyprus is a traditional exporter of earlies in the first part of the season. According to Cypriot sources, production is about 120 000 tons.
2.4. Seed potatoes
The main feature of the seed stage in the EU’s potato chain is the strong and increasing concentration operated by few firms, mainly situated in the Netherlands.
17 See footnote 11. However, the production of starch potatoes is almost inexistent in Spain and is not
present in Italy.

EN 33 EN
These companies make important investments for developing new varieties and commercialise their seeds everywhere with the support of local traders. Seed growers are more specialised than their colleagues that produce food potatoes.
Seed potatoes' area in the Netherlands was almost 39 500 hectares in 2004, rising by + 0.7% per year from 1999. In Germany surfaces destined to seeds reached 18 570 ha (–1.3% per year from 1999 to 2004), in France 15 000 ha (+ 0.5%), and in UK 14 000 ha (–4.7%). From the beginning of the nineties, seed potatoes' area has increased only in the Netherlands and in France (table 2-2). More than one third of the EU-25 seed potatoes area is concentrated in the Netherlands.
The reduction of hectares under seed potatoes is strong in the NMS, particularly in Latvia, –9.3% (284 ha in 2004), Slovakia, –8.5% (1 250 ha), Hungary, –6.9% (1 100 ha), and Poland, –3.7% (6 200 ha).
In Poland and in some other NMS, the process of certification of utilised seeds is not as developed as in Western Europe and its improvement is a necessary step to overcome some constraints that still limit the commercialisation of NMS’ potatoes on the EU-15 markets. There are signs of positive changes, especially in the Czech Republic where good quality varieties, with dynamic market prospects, are being produced and commercialised.
Although there are still important varieties that can be used for both processing and fresh consumption, such as Bintje, the prevailing trend is towards an increasing segmentation.
New varieties are created to respond to specific needs. Manufacturing firms continuously demand new varieties to launch innovating products from which they can gain a certain selling power and to adapt their merchandise to evolving consumers’ requirements.
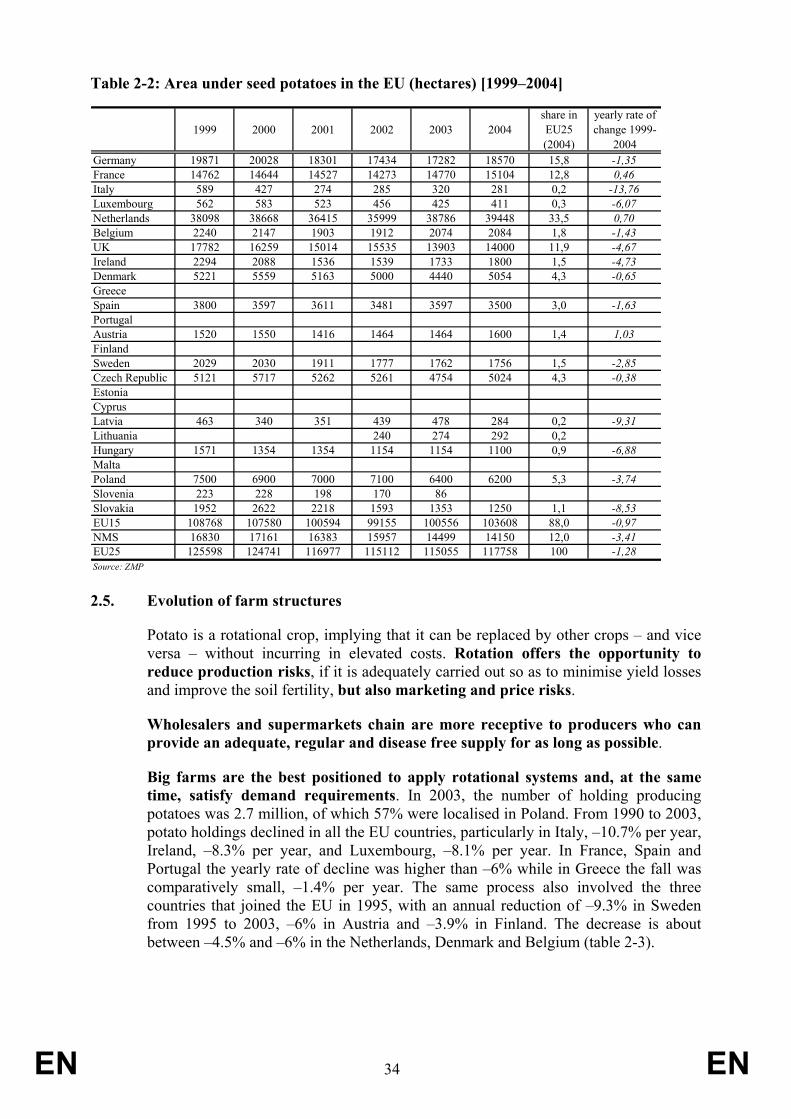
EN 34 EN
Table 2-2: Area under seed potatoes in the EU (hectares) [1999–2004]
1999 2000 2001 2002 2003 2004share in EU25 (2004)
yearly rate of change 1999-
2004Germany 19871 20028 18301 17434 17282 18570 15,8 -1,35France 14762 14644 14527 14273 14770 15104 12,8 0,46Italy 589 427 274 285 320 281 0,2 -13,76Luxembourg 562 583 523 456 425 411 0,3 -6,07Netherlands 38098 38668 36415 35999 38786 39448 33,5 0,70Belgium 2240 2147 1903 1912 2074 2084 1,8 -1,43UK 17782 16259 15014 15535 13903 14000 11,9 -4,67Ireland 2294 2088 1536 1539 1733 1800 1,5 -4,73Denmark 5221 5559 5163 5000 4440 5054 4,3 -0,65GreeceSpain 3800 3597 3611 3481 3597 3500 3,0 -1,63PortugalAustria 1520 1550 1416 1464 1464 1600 1,4 1,03FinlandSweden 2029 2030 1911 1777 1762 1756 1,5 -2,85Czech Republic 5121 5717 5262 5261 4754 5024 4,3 -0,38EstoniaCyprusLatvia 463 340 351 439 478 284 0,2 -9,31Lithuania 240 274 292 0,2Hungary 1571 1354 1354 1154 1154 1100 0,9 -6,88MaltaPoland 7500 6900 7000 7100 6400 6200 5,3 -3,74Slovenia 223 228 198 170 86Slovakia 1952 2622 2218 1593 1353 1250 1,1 -8,53EU15 108768 107580 100594 99155 100556 103608 88,0 -0,97NMS 16830 17161 16383 15957 14499 14150 12,0 -3,41EU25 125598 124741 116977 115112 115055 117758 100 -1,28Source: ZMP
2.5. Evolution of farm structures
Potato is a rotational crop, implying that it can be replaced by other crops – and vice versa – without incurring in elevated costs. Rotation offers the opportunity to reduce production risks, if it is adequately carried out so as to minimise yield losses and improve the soil fertility, but also marketing and price risks.
Wholesalers and supermarkets chain are more receptive to producers who can provide an adequate, regular and disease free supply for as long as possible.
Big farms are the best positioned to apply rotational systems and, at the same time, satisfy demand requirements. In 2003, the number of holding producing potatoes was 2.7 million, of which 57% were localised in Poland. From 1990 to 2003, potato holdings declined in all the EU countries, particularly in Italy, –10.7% per year, Ireland, –8.3% per year, and Luxembourg, –8.1% per year. In France, Spain and Portugal the yearly rate of decline was higher than –6% while in Greece the fall was comparatively small, –1.4% per year. The same process also involved the three countries that joined the EU in 1995, with an annual reduction of –9.3% in Sweden from 1995 to 2003, –6% in Austria and –3.9% in Finland. The decrease is about between –4.5% and –6% in the Netherlands, Denmark and Belgium (table 2-3).

EN 35 EN
Graphs A-1 a-n18 illustrate the distribution of potato surfaces by holdings according to classes of agricultural area. They show that there is a general tendency towards the concentration of the potato cultivation in larger holdings. In the Southern MS, small holdings still capture a remarkable part of potato areas although the strengthening of medium-big farms is observable there too.
Table 2-3: Number of holdings producing potatoes in the EU Member states (1990–2003)
1990 1993 1995 1997 2000 2003
Annual rate of vriation from 1990
to 2003
Annual rate of variation from 1995
to 2003
Belgium 24500 18980 18020 16190 14980 12500 -5,04 -4,47Czech Republic 17280Denmark 5260 4780 4270 3500 3290 2660 -5,11 -5,74Germany 96170 71570Estonia 24960Greece 53630 68680 49740 56150 49710 44710 -1,39 -1,32Spain 303100 219570 204920 190940 162350 125360 -6,57 -5,96France 77270 51170 46230 38510 30500 32760 -6,39 -4,21Ireland 12390 13870 13190 9400 4920 4010 -8,31 -13,83Italy 221890 138590 135030 101080 122150 50430 -10,77 -11,58Cyprus 3760Latvia 115090 113620Lithuania 261770Luxembourg 1140 740 660 600 510 380 -8,10 -6,67Hungary 208570 99450Malta 5160Netherlands 21780 17820 16970 15840 11950 -4,51 -4,87Austria 40430 35910 32080 24620 -6,01Poland 1555200Portugal 319510 259870 234060 194580 165360 127460 -6,83 -7,32Slovenia 58360 51860Slovakia 27800 28950Finland 30950 32450 29420 22560 -3,88Sweden 14280 12390 9120 6590 -9,21UK 27560 21560 19930 17920 14450 12660 -5,81 -5,51Source: Eurostat (Farm Structure Survey); DG Agri elaborations
Very few specialised potato farms exist: only ten per cent of the EU potato area is concentrated within holdings that get at least two thirds19 of their Gross Margin from the cultivation of potatoes.
The incidence of specialised potato holdings is relatively more important in Finland, where 53% of potato area is captured by farms specialised in potatoes, Malta (40%), Italy and Ireland (about 35%) and Greece (25%). In all the other MS, the weight in terms of surfaces of specialised potato farms is not above 20%, with the lowest values recorded in the NMS (table A-8).
The importance of potato cultivation in the total area of holdings that produce potatoes is not generally higher than 10%, with few exceptions: Italy, 11%, Belgium, 13%, Denmark, 15%, Cyprus, 19%, Malta, 20% and the Netherlands, 27% (graph 2-6). In France, UK, Germany and Poland the weight of potatoes in potato-holdings’ area is about 8-9%.
18 P. 105 - Appendix A 19 This is a conventional threshold for considering a farm specialised in a given product.
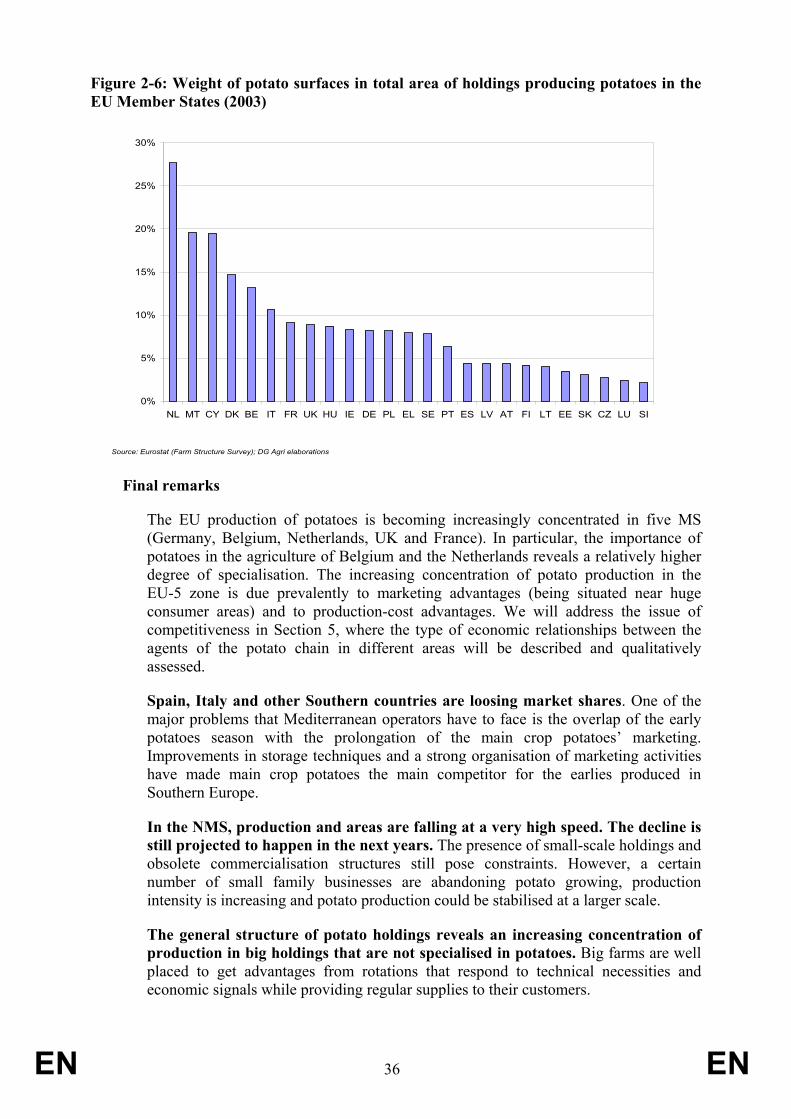
EN 36 EN
Figure 2-6: Weight of potato surfaces in total area of holdings producing potatoes in the EU Member States (2003)
0%
5%
10%
15%
20%
25%
30%
NL MT CY DK BE IT FR UK HU IE DE PL EL SE PT ES LV AT FI LT EE SK CZ LU SI
Source: Eurostat (Farm Structure Survey); DG Agri elaborations
Final remarks
The EU production of potatoes is becoming increasingly concentrated in five MS (Germany, Belgium, Netherlands, UK and France). In particular, the importance of potatoes in the agriculture of Belgium and the Netherlands reveals a relatively higher degree of specialisation. The increasing concentration of potato production in the EU-5 zone is due prevalently to marketing advantages (being situated near huge consumer areas) and to production-cost advantages. We will address the issue of competitiveness in Section 5, where the type of economic relationships between the agents of the potato chain in different areas will be described and qualitatively assessed.
Spain, Italy and other Southern countries are loosing market shares. One of the major problems that Mediterranean operators have to face is the overlap of the early potatoes season with the prolongation of the main crop potatoes’ marketing. Improvements in storage techniques and a strong organisation of marketing activities have made main crop potatoes the main competitor for the earlies produced in Southern Europe.
In the NMS, production and areas are falling at a very high speed. The decline is still projected to happen in the next years. The presence of small-scale holdings and obsolete commercialisation structures still pose constraints. However, a certain number of small family businesses are abandoning potato growing, production intensity is increasing and potato production could be stabilised at a larger scale.
The general structure of potato holdings reveals an increasing concentration of production in big holdings that are not specialised in potatoes. Big farms are well placed to get advantages from rotations that respond to technical necessities and economic signals while providing regular supplies to their customers.

EN 37 EN
3. MAIN DETERMINANTS IN THE DEMAND FOR POTATOES
World demand for potatoes is undergoing important changes, both in terms of localisation and composition. The overall trend is characterised by an increasing demand (graph 2-1), led mainly by a surge of human consumption in the most dynamic markets of Asia and, to a lesser extent, South America.
Global demand for frozen potatoes and other processed potato products has robustly augmented in Northern America and Northern-Continental Europe and is developing further in the emerging economies.
In the affluent societies the consumption of table potatoes is falling as consumers have less time for home-prepared meals and many have become well off enough to spend more evenings in restaurants and other food services.
The demand for potatoes for animal feed is much weaker than some decades ago. Its overall pattern is characterised by a continuous fall, particularly in Europe. Seed potatoes' demand is slightly diminishing in Europe and US, but is increasing in other important areas.
Globally, the wastes related to potatoes' production and the utilisation of potatoes for non-food purposes are more or less stable (graph 3-1).
Figure 3-1: Evolution of the components of world potato demand (1 000 metric tons) [1961–2003]
0
50000
100000
150000
200000
250000
1961
1962
1963
1964
1965
1966
1967
1968
1969
1970
1971
1972
1973
1974
1975
1976
1977
1978
1979
1980
1981
1982
1983
1984
1985
1986
1987
1988
1989
1990
1991
1992
1993
1994
1995
1996
1997
1998
1999
2000
2001
2002
2003
1000
tons
Feed
Seed
Waste
Food
Other Uses
Source: FAO
A snapshot on the usages of potatoes in the EU will be provided in § 3.1. The successive paragraphs will be devoted to the scrutiny of the main components that shape the aggregate demand for potatoes in the EU. As starting point, we will present potatoes for animal feed, whose importance has strongly diminished over the last decade (§ 3.2), then a brief paragraph will illustrate the importance of starch potatoes in total domestic uses (§ 3.3). The core of this section will however be devoted to the

EN 38 EN
determinants of potatoes' human consumption (§ 3.4), while the concluding paragraph will present the main factors that are destined to have an impact on the consumers preferences and, consequently, on firms' strategies in the next years.
3.1. Overall trends in the EU
In the EU-25, total domestic uses20 were about 72 million tons on average in the three years 2001, 2002 and 2003. Human consumption of potatoes (for table use and for food processing) represented 53.3% of total domestic uses, while the weights of animal feed and starch were respectively 16% and 12%. The remaining potatoes were distributed between seeds, 8.5%, losses, about 8.2%, and industrial uses for non-food purposes, less than 2%.
In the EU-15, total domestic uses amounted to 45.9 million tons in 2001/03. The weight of human consumption was higher than in the EU-25 with a share of almost 65%. Potatoes used as seeds captured 6% of EU-15 domestic uses, starch counted for 16,7%, while potatoes destined for animal feed and for other no-food industries were respectively 4.2% and 1.9% of total domestic uses. Losses attained a percentage of about 6%.
The consumption of processed potato products is comparatively more developed in North-Western Europe, where it represents even more than half of human consumption of potatoes in some areas. It is relatively low but increasing in the Mediterranean area of the EU (about 10% of human consumption). For the totality of the new Member States, the importance of processed potatoes in total human consumption is limited to 7% but is moving up there too.
3.2. Animal feed
The decline of potatoes for animal feed has contributed to the general decline of EU-25’s potato production over the last decade. An increasingly specialised feed industry has given strong incentives to use alternatives such as cereals and other inputs. The 1992 CAP reform has also played role since it reduced market price support for cereals.
From 1990/92 to 2001/03, potatoes utilised for animal feed have declined annually by about 10% in Germany, 15% in Spain, 26% in Ireland, 20% in Italy and 3% in UK.
In 2001/03, total use of potatoes destined to animal feed was about 11.4 million tons in the EU-25 and 1.9 million tons in the EU-15. In Poland, the level was much higher than the one recorded for the whole EU-15, reaching 8.5 million tons (graph 3-2). As percentage of total domestic uses, potatoes for animal feed are particularly important in Poland, where this kind of use covers 44% of potatoes' utilisations, followed by Estonia 34%, Lithuania, 33.5% and Latvia, 24% (graph 3-3).
Nowadays, the ongoing restructuring process is causing a strong reduction of this use in the NMS due to the fall of cattle stock and the increasing competition of other inputs21.
20 As for methodology see Appendix D 21 Potato Markets, N. 1451, 2005, p. 19
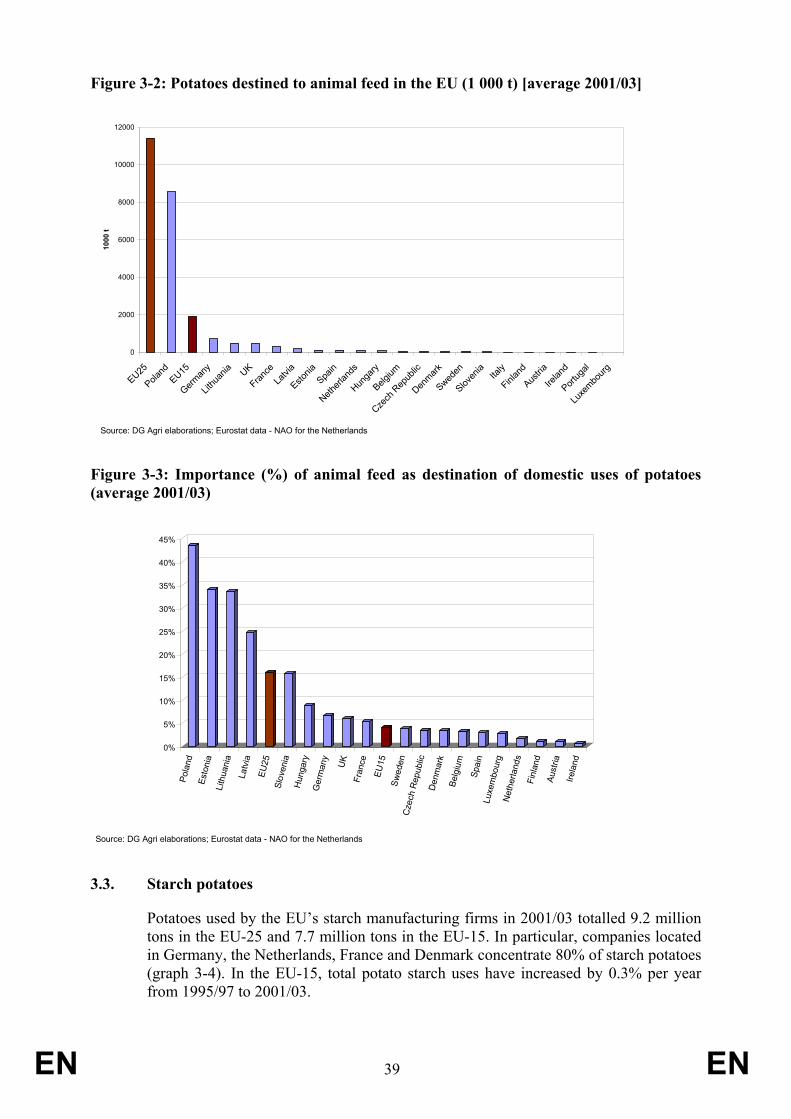
EN 39 EN
Figure 3-2: Potatoes destined to animal feed in the EU (1 000 t) [average 2001/03]
0
2000
4000
6000
8000
10000
12000
EU25
Poland
EU15
German
y
Lithu
ania UK
France
Latvi
a
Estonia
Spain
Netherl
ands
Hunga
ry
Belgium
Czech
Rep
ublic
Denmark
Sweden
Sloven
iaIta
ly
Finlan
d
Austria
Irelan
d
Portug
al
Luxe
mbourg
1000
t
Source: DG Agri elaborations; Eurostat data - NAO for the Netherlands
Figure 3-3: Importance (%) of animal feed as destination of domestic uses of potatoes (average 2001/03)
0%
5%
10%
15%
20%
25%
30%
35%
40%
45%
Pola
ndEs
toni
aLi
thua
nia
Latv
ia
EU25
Slov
enia
Hun
gary
Ger
man
y
UK
Fran
ce
EU15
Swed
enC
zech
Rep
ublic
Den
mar
kBe
lgiu
m
Spai
nLu
xem
bour
gN
ethe
rland
sFi
nlan
dAu
stria
Irela
nd
Source: DG Agri elaborations; Eurostat data - NAO for the Netherlands
3.3. Starch potatoes
Potatoes used by the EU’s starch manufacturing firms in 2001/03 totalled 9.2 million tons in the EU-25 and 7.7 million tons in the EU-15. In particular, companies located in Germany, the Netherlands, France and Denmark concentrate 80% of starch potatoes (graph 3-4). In the EU-15, total potato starch uses have increased by 0.3% per year from 1995/97 to 2001/03.

EN 40 EN
At Member State level, potatoes for starch are more important in Denmark, where they cover up to 60% of total domestic uses of potatoes, in the Netherlands, where the share is 39%, in Germany, 28%, in Sweden 22% and France, 19%. The starch industry in the NMS is relatively less important: first comes the Czech Republic, with an incidence in total domestic uses of 10%, while in Poland the weight is 4% (graph 3-5).
Figure 3-4: Potatoes for the production of starch in the EU (1 000 t) [average 2001/03]
0
1000
2000
3000
4000
5000
6000
7000
8000
9000
10000
EU25EU15
German
y
Netherl
ands
France
Denmark
Poland
Sweden
Czech
Rep
ublic
Finlan
d
Austria
Latvi
a
Lithu
ania
1000
t
Source: DG Agri elaborations - Eurostat data
Figure 3-5: Importance (%) of potatoes for starch in domestic uses of potatoes (average 2001/03)
0
0,1
0,2
0,3
0,4
0,5
0,6
Den
mar
k
Net
herla
nds
Ger
man
y
Sw
eden
Fran
ce
EU15
EU25
Cze
ch R
epub
lic
Finl
and
Aust
ria
Pol
and
Latv
ia
Slov
akia
Lith
uani
a
Source: DG Agri elaborations; Eurostat data

EN 41 EN
3.4. Potatoes for human consumption
Human consumption is the most important element in the aggregate demand for potatoes. Within the set "potatoes for human consumption", potatoes for food manufacturing tend to gain weight while the demand for table potatoes is declining. The main factors that have an impact on human consumption of potatoes are:
Demand for convenience products. Convenience is especially related to saving time due to peoples' busier lifestyles and more women in the workforce.
An increased competition of substitute products, such as pasta or rice. A strengthened attention on the health aspects of food (low calories, low fat,
etc.). Development of special products that are linked to certain methods of
production or to certain territories;
The first factor is the key force behind the increase of consumption in processed potato products and the relative decline of table potatoes. The market of special products, often tied to local recipes, is projected to grow rapidly in the next years and could offer an opportunity for the potato industry.
3.4.1. Aggregate patterns
In the average of the period 2001/03, total human consumption of potatoes was about 38 million tons in the EU-25 and 29.8 million tons in the EU-15 (graph 3-6).
Figure 3-6: Gross human consumption of potatoes in the EU's Member States (1 000 t) [average 2001/03]
0
5000
10000
15000
20000
25000
30000
35000
40000
EU25EU15 UK
German
y
Poland
Spain
France
Netherl
ands Ita
ly
Belgium
Czech
Rep
ublic
Greece
Portug
al
Sweden
Hunga
ry
Irelan
d
Austria
Denmark
Lithu
ania
Finlan
d
Slovak
iaLa
tvia
Estonia
Sloven
iaMalt
a
Luxe
mbourg
1000
t
Source: DG Agri elaborations; Eurostat adata - NAO data for the Netherlands
Note: Gross human consumption includes consumption of both table potatoes and potatoes for food manufacturing
In terms of percentage of total domestic uses, potatoes for human consumption are especially important in Spain, Italy, Portugal and Greece where the share is about 90%, and also in UK, 85%, Slovakia, 83%, and Hungary, 78% (graph 3-7).

EN 42 EN
Figure 3-7: Gross human consumption in total domestic uses of potatoes (%) by Member State (average 2001/03)
0%
10%
20%
30%
40%
50%
60%
70%
80%
90%
100%
Mal
taG
reec
eIta
lyPo
rtuga
lSp
ain
Luxe
mbo
urg
UK
Slov
akia
Hun
gary
Belg
ium
Cze
ch R
epub
licSl
oven
iaIre
land
EU15
Swed
enAu
stria
EU12
5G
erm
any
Finl
and
Fran
ceN
ethe
rland
sLa
tvia
Esto
nia
Den
mar
kLi
thua
nia
Pola
nd
Source: DG Agri elaborations; Eurostat data - NAO data for the Netherlands
Note: Gross human consumption includes both table and potatoes for food manufacturing
In the North-Continental part of EU-15, from 1994 to 2002 overall human consumption of potatoes remained rather stable at more than 20 million tons, but its composition had been changing as consumption of processed potatoes tends to equalise and is probably destined to overcome the consumption of table potatoes (graph 3-8).
Figure 3-8: Gross human consumption of potatoes for food processing and total gross human consumption of potatoes for a group of EU-15 countries1 (1 000 t) [1994–2002]
0
5000
10000
15000
20000
25000
1994 1995 1996 1997 1998 1999 2000 2001 2002
1000
t
Total gross human consumption of potatoes
Gross human consumption of processed potatoes (in raw material equivalent)1 Values of all EU15 countries have been summed, with the exceptions of Italy, Portugal and Spain
Source: DG Agri elaborations - Eurostat data

EN 43 EN
The importance of potatoes for food making within the set of “total human consumption of potatoes” is rising in the EU-5 area, in Ireland, Finland, Sweden, Austria and Ireland but not in Greece and Finland. The highest values are recorded in the EU-5 and Ireland where it overcomes 40% of total human consumption (graph 3-9). In the NMS the importance of potatoes for food processing in total human consumption of potatoes is generally not higher than 10%, except in Slovenia (18% in 2001/03).
Figure 3-9: Consumption of processed potatoes (in raw material equivalent) in total human consumption of potatoes in selected EU countries [1990/92 – 1995/97 – 2001/03]
0%
10%
20%
30%
40%
50%
60%
Ger
man
y
Gre
ece
Fran
ce
Irela
nd
Latv
ia
Hun
gary
Net
herla
nds
Aust
ria
Finl
and
Swed
en UK
1990/92
1995/97
2001/03
Source: DG Agri elaborations; Eurostat data
A for Spain, Italy and Portugal, national sources indicate that the ratio of table potatoes' consumption to total potatoes consumption is about 0.9. Consumers in the Mediterranean MS of the EU are strong purchasers of table potatoes but the importance of processed potato products is rising there too.
In 2001/03, the average level of per capita consumption was 80.3 kg/head in the EU-25, higher than in EU-15 (73.2 kg/head). The highest levels are recorded in the Baltic countries, in Poland, Malta, in UK and Ireland. In all these MS, per capita human consumption of potatoes surpasses 100 kg/head, while the lowest levels are registered in Italy, 43 kg/head, France, 47 kg/head, Austria, 56 kg/head (graph 3-10).
In the NMS, there is a differentiation between the Baltic region plus Poland where levels are the highest ones in the EU-25 and Czech Republic, Slovenia, Hungary and Slovenia. In the latter group of countries, per capita human consumption varies between 69 kg/head in Slovakia and 76 kg/head in the Czech Republic.
The distribution of per capita consumption in the EU-15 does not allow to identify geographical patterns. For example, the similarity of climatic conditions in Southern Europe does not entail alike levels of consumption per capita. In Spain, Portugal and Greece, we observe numbers that are above 80 kg/head while in Italy the indicator goes down to 43 kg/head. This illustrates the limitations of climate as a factor explaining consumers’ behaviour. Rather, food habits and traditions seems to play a determinant role.

EN 44 EN
Figure 3-10: Per capita human consumption per capita by MS (kg per head) [average 2001/03]
0
20
40
60
80
100
120
140
Latvi
a
Poland
Irelan
d
Lithu
ania
Estonia UK
Malta
Portug
al
Netherl
ands
Luxe
mbourg
Belgium Spa
in
Greece
Sweden
Finlan
d
Czech
Rep
ublic
Hunga
ry
Sloven
ia
Slovak
ia
German
y
Denmark
Austria
France Ita
ly
kg/h
ead
Source: DG Agri elaborations - Eurostata data
Data on EU-15 permit to look at the evolution of per capita human consumption in recent years. If the yearly rate of variation for the whole EU-15 over the periods 1995/97 and 2001/03 is –0.4%22, there are also contrasting trends amongst Member States. In the Netherlands, in Italy, UK, Sweden and Finland the indicator is moving up, while in Spain there is a slight increase after the drastic fall registered from the beginning of nineties till mid-nineties. In all the other MS, per capita human consumption is decreasing. Between 1995/97 and 2001/03, in Portugal the annual decline reaches –4.8%, in France –2.1%, in Ireland –1.8%, in Greece –1.6% and in Germany –1%. In Austria, Denmark and Belgium the decline is lower than –1% per year.
Data provided by the German Minister of Agriculture (BWVEL) show that consumption of table potatoes in Germany diminished to 32.5 kg per inhabitant in 2003/04 from 32.9 kg/pers of the previous commercial year. The trend is reversed for processed products: the consumption was 34.3 kg/head in 2003/04 against 34.1 kg/head during 2002/03. Similar trends are recorded in Spain, where, according to official national statistics, per capita consumption of table potatoes declined by 12.7% from 1998 to 2002.
A gradual shift is also taking place in the consumption habits of the Polish population, as consumption of table potatoes is declining while more frozen fries and chips are being purchased. Total annual per capita consumption in Poland23 fell by 7 kg between 1995/96 and 2004/05, from 135 kg to 128 kg. Over the same period fresh consumption showed a 13% decline from 132 kg to 115 kg. Polish consumers were
22 If we consider a longer period, the fall of human consumption of potatoes is more evident. For example,
in Germany fresh consumption has fallen from 101.3 kg/head for the 1966 crop year to 32.5 kg/head for the 2003 crop (European Potato Market, January 2005, N. 114, p. 117).
23 Statistics reported in Potato Markets Weekly (N. 1470, p. 9)

EN 45 EN
eating 13 kg of frozen fries per person in 2004/05, i.e. 3 kg more than ten years earlier.
3.4.2. Typologies of potato products
Our analysis will be integrated with figures on processed potato products provided by UEITP24. In decreasing order of importance, the manufacturing companies are located in the Netherlands, Belgium, UK, Germany and France. Not negligible quantities are also processed in Italy and Sweden.
Pre-cooked products are the most relevant item within the group of processed potato products, representing over 70% of potato-based products. Next come snacks, 8%, and dehydrated products, 7.5% (table 3-1). The Netherlands and Belgium are relatively more specialised in pre-cooked products, with a quantity of about 2 million tons or 60% of the entire UEITP production of pre-cooked products. On dehydrated products, Germany is the main producing country with about 207 000 tons, concentrating 57% of the UEITP production. UK is instead prevailing for snacks, producing slightly less than 167 000 tons or 43% of the UEITP production in this sector. France has a constant share of about 10–12% in all the above mentioned sectors.
The potato processing sector in the EU is becoming increasingly concentrated in the Netherlands, Belgium and some areas of Germany, while in France the processing industry has not improved as strongly as the sector of table potatoes. Italy and Sweden have some important industrial poles in snacks production.
Table 3-1: Production of processed potato products in the EU (tons) [1999–2003]
1999 2000 2001 2002 2003 1999 2000 2001 2002 2003Netherlands 1327300 1507700 1521800 1517000 1696800 Netherlands 33700 36600 37000UK 831059 853137 787001 817400 UK 171000 166500 166000 167750Germany 700262 786493 892276 760768 797749 Germany 83431 89368 100463 94234 89993France 503471 501704 580274 522079 525965 France 42138 39233 42378 34820 29813Belgium 685539 790541 846224 922738 958445 BelgiumItaly 74020 73160 75000 90564 Italy 40200 35200 35800 40000Sweden 55500 60000 58000 60000 Sweden 13500 18000 18000 18000
1999 2000 2001 2002 2003 1999 2000 2001 2002 2003Netherlands 1189500 1359300 1382000 1326300 1357200 Netherlands 18300 16800 7500UK 634737 666315 598421 605263 UK 26000Germany 308083 381421 389260 331573 361101 Germany 173014 183009 173575 138808 129019France 332135 329946 400366 353859 361822 France 67279 72124 78192 88550 90709Belgium 442450 532492 585423 676258 701956 Belgium 243089 258049 260801 246480 253480Italy 38000 50200 ItalySweden Sweden 42200 42000 40000 42000
1999 2000 2001 2002 2003 1999 2000 2001 2002 2003Netherlands 85800 95000 95300 Netherlands 2729000 3064000 3092000 309100 3369400UK 25322 20322 22580 18387 UK 1994000 2046000 2058000 1961000Germany 135734 132699 139642 196153 217636 Germany 2142591 2299034 2382095 2567236 2740355France 61919 60401 59338 44850 43621 France 1159786 1185349 1212633 1138107 1132175Belgium Belgium 1214726 1454219 1589555 1673065 1831015Italy 120 260 1200 364 Italy 204560 201050 216000 250600Sweden Sweden 190000 200000
Austria 28464 27321Source: UEITP
Dehydrated products Raw materials used in the production of processed potato-products
Total Snacks
Pre-cooked products Other products
24 UEITP (Union Européenne des Industries de Transformation de la Pomme de Terre) is the most
important association of potato processors in the EU. UEITP data include the main EU's producing countries of processed potatoes and, as result, are very representative of the situation in the manufacturing sector.

EN 46 EN
3.4.3. Potato products in the NMS
Consumption of processed potato products is strongly increasing in the NMS. We will see in § 4.5 that expeditions of frozen potatoes and other potato products from the EU-15 to the NMS moved up from €1.2 million to €38 million in 2004, that corresponds to a thirty-fold increase. Besides, in recent years some multinational firms have started to set up manufacturing plants in Eastern Europe.
However, this is not the beginning of a delocalisation process from the traditional potato-manufacturing areas. The NMS potato industry faces a severe challenge as farmers have to match their production methods with industry requirements that growingly rely on strict phytosanitary and quality controls. In many NMS, a big part of potato production is not marketed as it is used for the own family consumption (i.e. three fifths of human potato consumption in Poland is still not commercialised), and the efficiency is not as developed as it is in the EU-15.
Therefore, considerable investment is required before NMS will be able to have a significant impact on the market for processed product.
3.5. Evolution of potatoes' demand and market prospects
A main concern of the EU's potato operators is to prevent further falls in table potatoes' consumption. A very alarming projection was carried out by the German Agency ZMP25, according to which German table potato consumption could disappear by 2020. In the Netherlands, price reductions practiced by some big retailers have caused a further shift from small to big retailers but have not stimulated new purchases of table potatoes. In other terms, the Dutch consumer has not increased consumption of table potatoes although gradually turned towards the low-cost supplier.
Similar trends occurred in other countries. In Germany, Belgium and France, promotional campaign carried out by big retailers were effective to expand their market shares but have not been enough to prevent the aggregate fall of table potatoes' consumption.
It is often questioned whether the decline of table potatoes could be stopped and how this could be done. There is no evidence that table potatoes are harmful for health and a clear distinction should be made between some potato products and table potatoes. It is widely recognised that some classes of frozen potatoes have high calories and high fat contents, but that evidence should not automatically be considered as valid for table potatoes (as well as for some "new" French fries). An active approach could be based firstly on facts, based on studies for measuring the impact of (different varieties of) table potatoes on human health, and then on updated marketing strategies.
In the last decade, the consumption of processed potato products has grown mainly because of the corresponding increase in fries' demand. The fries' market remains predominant but there are worries caused by the mounting health concerns of consumers.
25 Zentrale Markt- und Preisberichtstelle

EN 47 EN
Manufacturers are responding by innovating the production process for fries (e.g. potatoes fried in special oils, microwavable, etc) as well as by introducing new lines of convenience-products. In particular, business in refrigerated products with individual characteristics (recipes based linked to specific production methods, composition or origin) is projected to rise fast in the next years.
Potato products that maintain the characteristics of the fresh product have also been launched but it is too early to get a detailed assessment of consumers' response. As the shelf life of these products is very short, final manufacturers should be located very near to the retailers' centres and should enhance their links with other potential customers such as restaurants and catering chains.
Overall, the introduction of products with individual characteristics (i.e. traditional recipes) could open new opportunities for operators in regions which are currently not very dynamic as suppliers of potatoes and potato products. However, the revitalisation of the systems of production in these areas involves a well-coordinated network of relationships at local level and brave marketing strategies.

EN 48 EN
4. TRADE
EU-25 trade in potato products (not including starch and sweet potatoes) was worth about €2.76 billion in the period 2003/05. The transactions between EU operators covered almost 78% of total EU trade, exports to third countries captured 15% while the remaining 7% was generated by EU imports (table 4-1). The EU exported products corresponding to a value of €410.5 million and is a net exporter with a surplus of €215.7 million.
The EU is a net exporter for all the potato products but early potatoes. In value terms, earlies from third countries provide 89% of total EU imports in potato products (table 4-1). Egyptian, Israeli and Moroccan early potatoes activate a large volume of traffic in the EU.
On the other side, seed potatoes and processed potato products feed a remarkable flow of exports to third countries. Exports play a very important role particularly for the EU seed potato industry as 45% of the contracts take place outside the EU. Exports of processed potato products amounted to €204.5 million, while EU-25 exports of seed potatoes are valued €121.6 million. Main crop potatoes of EU origin purchased in third countries were valued €73.4 million in 2003/05, with a 18% share in total EU exports of potato products.
Third countries are less important for main crop potatoes and for processed potato products. In these two sectors, the incidence of intra-EU trade in total trade is about 85–90% (table 4-1).
Table 4-1: Main components in the EU-25's trade of potato products (average 2003/05)
1.000 €shares in total EU
trade1.000 €
shares in total EU imports
1.000 €shares in total EU exports
1.000 €shares in
total intra-EU trade
Seed potatoes 266921 9,6 477 0,2 121614 29,6 144830 6,7Early potatoes 307232 11,1 174289 89,5 10987 2,7 121956 5,6Main crop potatoes 609853 22,0 6661 3,4 73439 17,9 529754 24,5Frozen potatoes 829771 30,0 3642 1,9 117743 28,7 708386 32,8Sliced potatoes (suitable for chips) 208004 7,5 4087 2,1 32651 8,0 171266 7,9Other processed potatos 545690 19,7 5662 2,9 54140 13,2 485889 22,5Processed potatoes 1583464 57,2 13391 6,9 204534 49,8 1365540 63,2Total 2767471 100 194818 100 410574 100 2162079 100Source: EUROSTAT (COMEXT) - DG Agri elaborations
Intra EU tradeEU imports EU exportsTotal EU trade
The evolution of trade patterns is affected by a set of variables. The most important ones are:
period of production: countries that are situated in the Mediterranean area can commercialise their early potato production during the first semester of the calendar year, while earlies from Northern-Continental Europe are placed on the markets since late May/Mid June. This normally rears flows from South to North Europe in the first part of the year and North-South afterwards;
costs of production and improvements in storage techniques: as already emphasised in § 2, continuous progresses in storage techniques create the conditions for an overlap in the commercial year of early and main crop potatoes. Main crop potatoes from France have increasingly penetrated in the Southern part of the EU even during the earlies' season;

EN 49 EN
transport costs: the impact of transport costs' increases could be important for some segments of the potato industry. For example, it could induce seed breeders to opt for taking over foreign plants and distributing patent rights rather than trading seeds abroad.
consumer preferences: as we have seen in § 3.4, consumers in Southern Europe prefer table potatoes, while in North-Western Europe processed potato products are more important. These differences contribute to shape the direction of intra-EU trade;
phytosanitary measures: as it will be reported in § 6.1, it is forbidden to import potatoes from a number of countries. Other nations are also imposing bans to exports of EU potatoes.
In the coming paragraphs, we will provide an analytical description of how EU trade evolved in the last decade. We will start dealing with seed potatoes (§ 4.1), then early potatoes (§ 4.2), main crop potatoes (§ 4.3) and processed potato products (§ 4.4).
We will use COMEXT data on EU trade. This data will be often disaggregated in three main components: intra-EU trade, EU imports and EU exports. As there is a break in certain trade statistics due to the entry of ten new Member States on May 2004, we will examine in § 4.5 the changes undergone in trade between EU-15 and the block of NMS. We will also use FAO data when global tendencies are under scrutiny. In the last paragraph (§ 4.6), we will succinctly present the main findings of this section.
4.1. Seed potatoes
EU-15's total trade of seed potatoes amounted to about 822 000 tons in the average of the period 2004/05, of which 45% are originated by exports and 55% by intra EU-15 trade. Imports are very low, about 2 200 tons in 2004/05, and are falling by –13% per year. EU-15 exports are more fluctuating than intra-EU trade. The main destination markets are situated in North Africa, in primis Egypt and Algeria that absorb 35–40% of EU exports. Turkey represents a very interesting market for EU seed companies. Expeditions to this country are currently not high, about 10 000 tons, but are rapidly increasing (+ 58% per year)26. Intra-EU-15 trade moved up by + 1.5% since 1990 (graph 4-1).
The growth in intra-EU trade is mainly a consequence of an increasing concentration of the EU seed companies in the Netherlands. Some Dutch firms, such as Agrico27 and HZPC, are world leaders. These companies have consolidated their position in the EU and search for dynamic markets in third countries. In 2002/04, Netherlands shipped about 660 000 tons to other countries (EU plus non-EU countries) and is the main provider of seed potatoes with a market share fluctuating between 65% and 70% in the total of intra-EU trade plus EU exports (graph 4-2). Germany shipped 43 800 tons to other countries in 2002/04, corresponding to a share of 4.4% in total EU trade (exports plus expeditions to other MS). UK ranks second in the table of EU exporters with a share of 9.1% in 2002/04 (90 420 tons), France’s share is 8.6%
26 For detailed statistics on EU's trade of seed potatoes, see
http://ec.europa.eu/agriculture/consultations/adco/fruitveg/index_en.htm 27 During the 2003/04 marketing year, Agrico traded 371.000 tons of seeds, valued € 120 million (European
Potato Markets, N. 114, 26).

EN 50 EN
(86 000 tons). Next come Belg/Lux, 5.9% (59 250 tons), and Denmark 4.1% (40 960 tons). The cumulated share of the remaining MS is 1.3% (graph 4-2).
Figure 4-1: Intra-EU trade and EU exports of seed potatoes (tons) [1990–2005]
300000
350000
400000
450000
500000
550000
600000
1990 1991 1992 1993 1994 1995 1996 1997 1998 1999 2000 2001 2002 2003 2004 2005
tons
EU-15 exports
Intra EU-15
Source: EUROSTAT (COMEXT)
Figure 4-2: EU trade of seed potatoes: shares of the main suppliers (1990–2004)
0%
10%
20%
30%
40%
50%
60%
70%
80%
90%
100%
1990 1991 1992 1993 1994 1995 1996 1997 1998 1999 2000 2001 2002 2003 2004
Other EU countries
Denmark
Fr Germany
Belg.-Luxbg
Utd. Kingdom
France
Netherlands
Note: shares have been calculated on the sum of shipments to other Member States of the EU plus exports to third countriesSource: EUROSTAT (COMEXT) data - DG Agri elaborations
The EU-5 absorbs 48% of intra-EU expeditions. However, Italy and Spain are the main purchasers of EU seed potatoes (graph 4-3), with a share respectively of 18% and 13.4%. In Italy Agrico, Hzpl and Europlant commercialise 80% of seed potatoes marketed within the country. In Spain, imported seeds cover about 70% of the domestic market. Portugal and Greece are also important recipients of seed potatoes collecting respectively 8% and 4.6% of total intra-EU expeditions (graph 4-3).
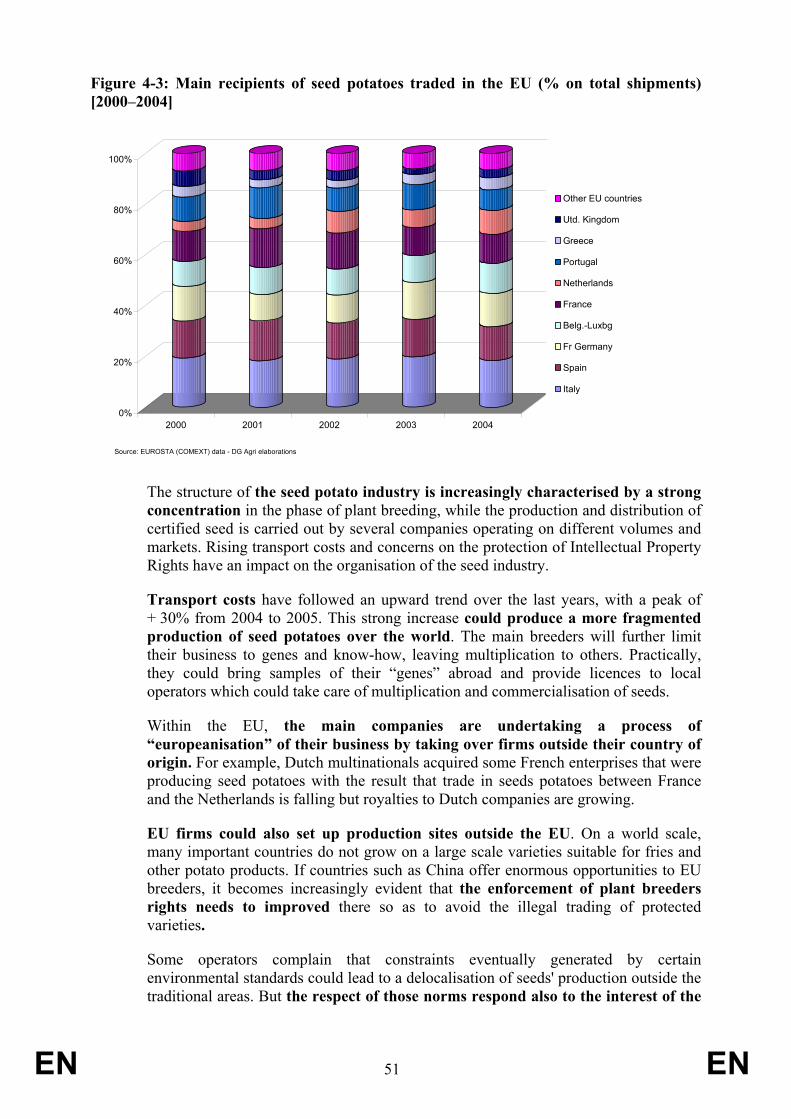
EN 51 EN
Figure 4-3: Main recipients of seed potatoes traded in the EU (% on total shipments) [2000–2004]
0%
20%
40%
60%
80%
100%
2000 2001 2002 2003 2004
Other EU countries
Utd. Kingdom
Greece
Portugal
Netherlands
France
Belg.-Luxbg
Fr Germany
Spain
Italy
Source: EUROSTA (COMEXT) data - DG Agri elaborations
The structure of the seed potato industry is increasingly characterised by a strong concentration in the phase of plant breeding, while the production and distribution of certified seed is carried out by several companies operating on different volumes and markets. Rising transport costs and concerns on the protection of Intellectual Property Rights have an impact on the organisation of the seed industry.
Transport costs have followed an upward trend over the last years, with a peak of + 30% from 2004 to 2005. This strong increase could produce a more fragmented production of seed potatoes over the world. The main breeders will further limit their business to genes and know-how, leaving multiplication to others. Practically, they could bring samples of their “genes” abroad and provide licences to local operators which could take care of multiplication and commercialisation of seeds.
Within the EU, the main companies are undertaking a process of “europeanisation” of their business by taking over firms outside their country of origin. For example, Dutch multinationals acquired some French enterprises that were producing seed potatoes with the result that trade in seeds potatoes between France and the Netherlands is falling but royalties to Dutch companies are growing.
EU firms could also set up production sites outside the EU. On a world scale, many important countries do not grow on a large scale varieties suitable for fries and other potato products. If countries such as China offer enormous opportunities to EU breeders, it becomes increasingly evident that the enforcement of plant breeders rights needs to improved there so as to avoid the illegal trading of protected varieties.
Some operators complain that constraints eventually generated by certain environmental standards could lead to a delocalisation of seeds' production outside the traditional areas. But the respect of those norms respond also to the interest of the

EN 52 EN
seeds' industry as a too intensive production could provoke a deterioration of its business in the medium term.
Trade of GMO potatoes is not projected to rise. GMO producers did not plan to commercialise GMO potatoes in the EU as they are worried about consumers’ reactions. In other important markets, such as Mexico, GMO potatoes are not allowed. GMO companies have also doubts on the opportunity of commercialising GMO potatoes only in the US market.
4.2. Early potatoes
Total EU trade (intra-EU trade plus EU imports plus EU exports) in early potatoes amounted to 950 000 tons in 2004/05 and has fluctuated around this level since 1990/91. The marketing season for imported earlies starts in January and usually peaks between March and June (graph 4-4). During this time span, early potatoes from the Mediterranean area, both within and outside the EU, can be commercialised when stored old crop becomes scarcer and more perishable. EU-15 exports of early potatoes reach about 30 000 tons and their importance is low in total trade of earlies.
Figure 4-4: Monthly trade1 of early potatoes in the European Union (tons) [January 2001 – October 2005]
0
50000
100000
150000
200000
250000
300000
Jan.
200
1
Mar
. 200
1
May
. 200
1
Jul.
2001
Sep
. 200
1
Nov
. 200
1
Jan.
200
2
Mar
. 200
2
May
. 200
2
Jul.
2002
Sep
. 200
2
Nov
. 200
2
Jan.
200
3
Mar
. 200
3
May
. 200
3
Jul.
2003
Sep
. 200
3
Nov
. 200
3
Jan.
200
4
Mar
. 200
4
May
. 200
4
Jul.
2004
Sep
. 200
4
Nov
. 200
4
Jan.
200
5
Mar
. 200
5
May
. 200
5
Jul.
2005
Sep
. 200
5
tons
Source: Eurostat (COMEXT)
1 Early potatoes traded within the EU result from the sum of intra-EU trade plus EU imports
While commerce in earlies was stationary, trade in main crop potatoes grew by 3.6% per year or by + 58% from 1990 to 2004 (graph 4 5). As result, EU trade in main crop potatoes is now 4.7 times as big as the EU trade in early potatoes. The expansion of the main crop potatoes’ campaign in the period where earlies are normally commercialised is posing a serious constraint for early potatoes operators. As earlies are normally more costly, consumers prefer to save money and buy the less expensive products causing a restriction of marketing margins in the earlies' business.
Together with the overlapping commercialisation calendar, there are other factors that need to be considered: i) the reduction of earlies' expeditions from Italy, which was

EN 53 EN
the first EU supplier of earlies at the beginning of the nineties; ii) trade statistics in main crop potatoes do not cover only potatoes for table use but include potatoes destined to be processed. As we have seen in § 3.3, the demand for potatoes for food processing has been increasing over the last decade.
Figure 4-5: EU trade in early potatoes and in main crop potatoes (tons) [1990–2004]
0
1000000
2000000
3000000
4000000
5000000
6000000
1990 1991 1992 1993 1994 1995 1996 1997 1998 1999 2000 2001 2002 2003 2004
tons
Main croppotatoes
Early potatoes
Source: EUROSTAT (COMEXT)
Note: EU trade is the sum of intra-EU transactions, EU exports and EU imports
In 2004/05, total early potatoes shipped in the EU from third countries amounted to 527 181 tons. Imports have been growing by + 1.6% per year from 1990/91 and come almost entirely from three countries: Egypt, Israel and Morocco. The first two countries have increased their shipments to the EU, especially Israel, while Moroccan exports declined (table 4-2).
Till 2003 Egyptian exports were still higher than the Israeli ones but in 2004 the position reversed. This change was mainly due to a better quality of the Israeli product that more easily matches the consumers' demand in the EU, but it is also a consequence of phytosanitary problems found on the Egyptian product.
Egypt suspended its exports to the EU on 9 April 2004, following the discovery of a widespread brown rot disease, and then re-opened on 6 December 2004 to allow imports only from areas which are guaranteed disease free.
In 2005, the phytosanitary situation of Egyptian early potatoes remained crytical as new cases have been discovered. However, no global suspension was decided that year as well as in 2006 and in 2007.
Intra-EU trade of earlies totalled almost 423 000 tons in 2004/05, covering around 45% of total shipments in the EU, while the remaining part, that is 55%, originated in third countries. From 1990/91 to 2004/05, intra-EU trade fell by about –1.7% per year. According to COMEXT data, France is the first EU supplier with a 20% share in total shipments but, as we will show below, there are strong doubts on such a statistic. In the EU, Italy ranks second with 6.2%, Spain third with 5.6%

EN 54 EN
Italian shipments underwent a drastic reduction of –10.8% per year, from 285 763 tons in 1990/91 to 57 926 tons in 2004/05. The reduction registered for Spain is lower, about –1.8% per year, from 61 775 tons in 1990/91 to 47 988 tons in 2004/05. As result, the EU Mediterranean zone feeds 12% of early potatoes traded in the EU, while its importance was about 40% in 1990/91. The most remarkable increase is recorded for Germany whose expeditions arose from 3 965 tons in 1990/91 to 17 442 tons in 2004/05, equivalent to an average annual increase of 11.2% (table 4-2).
Table 4-2: Early potatoes traded in the EU by country of departure in 1990/91 and 2004/05 (tons)
1990/91 2004/05Annual rate of
change (1990/91 - 2004/05)
Italy 285763,2 57925,7 -10,8Spain 61775,1 47988,0 -1,8Portugal 5335,9 4666,7 -1,0Greece 25032,2 525,8 -24,1EU mediterranean area 377906,4 111106,0 -8,4Belgium 44910,0 25661,7 -3,9France 63103,5 192621,9 8,3Germany 3965,4 17442,2 11,2Netherlands 34636,3 34933,5 0,1UK 14316,0 16098,9 0,8EU-5 160931,2 286758,0 4,2Cyprus 140101,3 29716,4 -10,5Egypt 129503,2 220911,2 3,9Morocco 92029,5 46574,3 -4,7Israel 33827,4 221955,2 14,4Non-EU mediterranean area 269913,7 494773,8 4,4EU-15 imports 422998,1 527180,9 1,6Source: DG Agri elaborations - COMEXT
Imports from the non-EU Mediterranean basin peak in March while intra-EU consignments have their highest in April-May (graph 4-6). In the second part of the first semester, there is often an intense competition between EU and non-EU early potatoes.
EU-15 imports from the non-EU Mediterranean area were about 269 914 tons in 1990/91, moving up at more than 494 774 tons in 2004/05 (annual growth of + 4.4%). Cypriot dispatches fell drastically from 140 101 tons in 1990/91 to less than 29 716 tons in 2004/05 (–10.5% per year).
The Mediterranean MS, including Cyprus, are losing ground on the EU markets. In the first nineties, their trade was higher than third countries exports, while now the situation is completely reversed (graph 4-7).

EN 55 EN
Figure 4-6: Monthly trade of early potatoes in the EU: intra-EU trade and imports from third countries (tons) [January 2001 – December 2005]
0
50000
100000
150000
200000
250000
Jan.
200
1
Apr
. 200
1
Jul.
2001
Oct
. 200
1
Jan.
200
2
Apr
. 200
2
Jul.
2002
Oct
. 200
2
Jan.
200
3
Apr
. 200
3
Jul.
2003
Oct
. 200
3
Jan.
200
4
Apr
. 200
4
Jul.
2004
Oct
. 200
4
Jan.
200
5
Apr
. 200
5
Jul.
2005
Oct
. 200
5
tons Intra-EU trade
EU imports
Source: EUROSTAT (COMEXT)
Figure 4-7: Early potatoes shipped in the EU from the Mediterranean area (tons) [1990–2005]
0
50000
100000
150000
200000
250000
300000
350000
400000
450000
500000
550000
1990 1991 1992 1993 1994 1995 1996 1997 1998 1999 2000 2001 2002 2003 2004 2005
Cyprus
Non-EUMediterranean
EU Mediterranean
Source: Eurostat - COMEXT
Looking at intra-EU COMEXT data on earlies, the calendar of French trade in early potatoes seems to mirror the calendar of non-EU's Mediterranean product on the EU markets (graph 4-8). This result leaves room for some doubts if we consider that French earlies are normally harvested from May. It could be that:
(a) earlies, shipped from Israel and Egypt to France, are dispatched to other MS and then counted in intra-EU trade as expeditions from France;

EN 56 EN
(b) French authorities make a wrong use of codes for earlies (07019050) and main crop potatoes (07019090).
Figure 4-8: Intra-EU monthly expeditions of early potatoes from the main suppliers (tons) [January 2001 – December 2005]
0
5000
10000
15000
20000
25000
30000
35000
40000
45000
50000
Jan.
200
1
Apr
. 200
1
Jul.
2001
Oct
. 200
1
Jan.
200
2
Apr
. 200
2
Jul.
2002
Oct
. 200
2
Jan.
200
3
Apr
. 200
3
Jul.
2003
Oct
. 200
3
Jan.
200
4
Apr
. 200
4
Jul.
2004
Oct
. 200
4
Jan.
200
5
Apr
. 200
5
Jul.
2005
Oct
. 200
5
tons France
Italy
Spain
Source: EUROSTAT (COMEXT)
4.3. Main crop potatoes
In 2004/05, total EU trade of main crop potatoes amounted to about 4.6 million tons, of which 87% coming from intra-EU transactions (4 million tons), 11% from exports to third countries (523 300 tons) while EU imports captured only 1% (59 322 tons). The growth of EU trade in main crop potatoes was + 3.1% on yearly basis from 1990/91 to 2004/05 and was mainly driven by the corresponding increase of intra-EU trade, + 3.14% (graph 4-9). EU exports grew by + 2.9% per year and imports from third countries increased annually by + 3.3% from 1990/91 to 2004/05, but remain at a very low level.
It is affirmed that the volumes traded with third countries would be small as a consequence of the transport costs' impacts for a low-value product such as potatoes. However, other factors play a key role, especially shared trade rules, such as commercial standards and phytosanitary measures.
It is a fact that the functioning of the single market is bringing about strong support to the development of potato trade in the EU. The European potato markets are well integrated and the 2004's enlargement is strengthening such a process.
Instead, world trade of main crop potatoes is currently limited by the application of different national regulation. For example, in the EU it is forbidden to import main crop potatoes from other important producing third countries (see § 6.1) and many third countries do not allow any import from the EU.
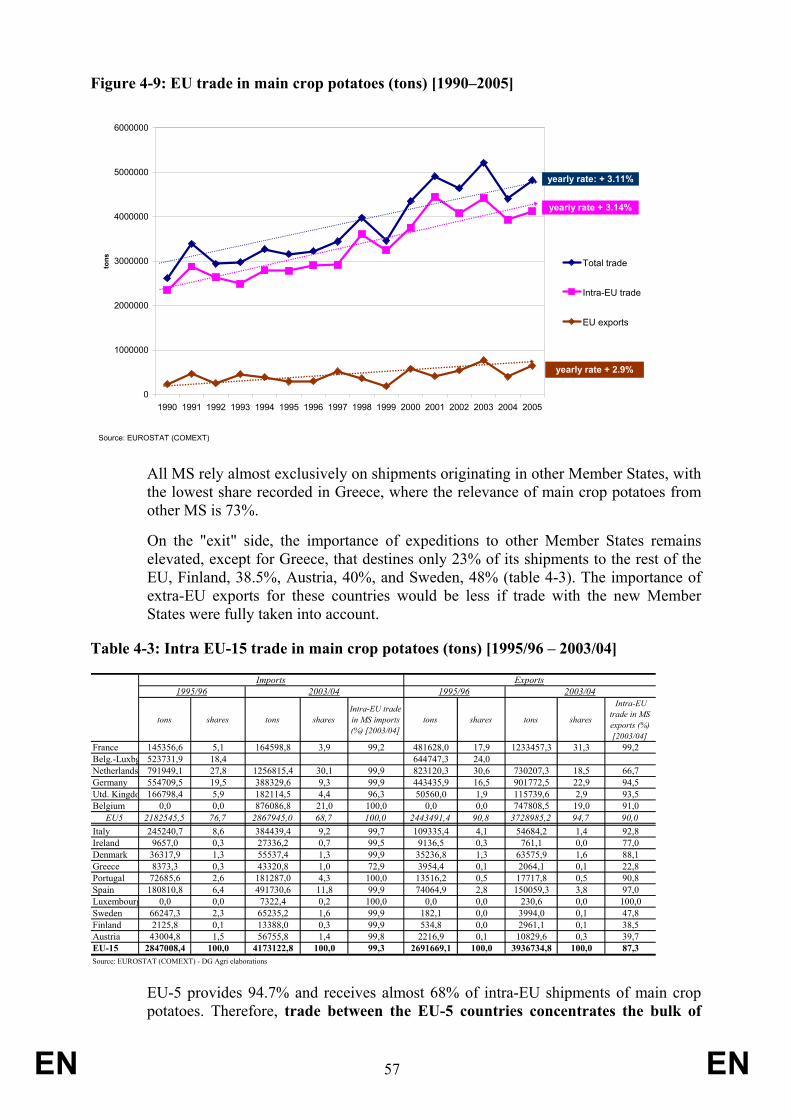
EN 57 EN
Figure 4-9: EU trade in main crop potatoes (tons) [1990–2005]
0
1000000
2000000
3000000
4000000
5000000
6000000
1990 1991 1992 1993 1994 1995 1996 1997 1998 1999 2000 2001 2002 2003 2004 2005
tons Total trade
Intra-EU trade
EU exports
Source: EUROSTAT (COMEXT)
yearly rate: + 3.11%
yearly rate + 3.14%
yearly rate + 2.9%
All MS rely almost exclusively on shipments originating in other Member States, with the lowest share recorded in Greece, where the relevance of main crop potatoes from other MS is 73%.
On the "exit" side, the importance of expeditions to other Member States remains elevated, except for Greece, that destines only 23% of its shipments to the rest of the EU, Finland, 38.5%, Austria, 40%, and Sweden, 48% (table 4-3). The importance of extra-EU exports for these countries would be less if trade with the new Member States were fully taken into account.
Table 4-3: Intra EU-15 trade in main crop potatoes (tons) [1995/96 – 2003/04]
tons shares tons shares Intra-EU trade in MS imports (%) [2003/04]
tons shares tons shares
Intra-EU trade in MS exports (%) [2003/04]
France 145356,6 5,1 164598,8 3,9 99,2 481628,0 17,9 1233457,3 31,3 99,2Belg.-Luxbg 523731,9 18,4 644747,3 24,0Netherlands 791949,1 27,8 1256815,4 30,1 99,9 823120,3 30,6 730207,3 18,5 66,7Germany 554709,5 19,5 388329,6 9,3 99,9 443435,9 16,5 901772,5 22,9 94,5Utd. Kingdo 166798,4 5,9 182114,5 4,4 96,3 50560,0 1,9 115739,6 2,9 93,5Belgium 0,0 0,0 876086,8 21,0 100,0 0,0 0,0 747808,5 19,0 91,0
EU5 2182545,5 76,7 2867945,0 68,7 100,0 2443491,4 90,8 3728985,2 94,7 90,0Italy 245240,7 8,6 384439,4 9,2 99,7 109335,4 4,1 54684,2 1,4 92,8Ireland 9657,0 0,3 27336,2 0,7 99,5 9136,5 0,3 761,1 0,0 77,0Denmark 36317,9 1,3 55537,4 1,3 99,9 35236,8 1,3 63575,9 1,6 88,1Greece 8373,3 0,3 43320,8 1,0 72,9 3954,4 0,1 2064,1 0,1 22,8Portugal 72685,6 2,6 181287,0 4,3 100,0 13516,2 0,5 17717,8 0,5 90,8Spain 180810,8 6,4 491730,6 11,8 99,9 74064,9 2,8 150059,3 3,8 97,0Luxembourg 0,0 0,0 7322,4 0,2 100,0 0,0 0,0 230,6 0,0 100,0Sweden 66247,3 2,3 65235,2 1,6 99,9 182,1 0,0 3994,0 0,1 47,8Finland 2125,8 0,1 13388,0 0,3 99,9 534,8 0,0 2961,1 0,1 38,5Austria 43004,8 1,5 56755,8 1,4 99,8 2216,9 0,1 10829,6 0,3 39,7EU-15 2847008,4 100,0 4173122,8 100,0 99,3 2691669,1 100,0 3936734,8 100,0 87,3Source: EUROSTAT (COMEXT) - DG Agri elaborations
Imports Exports1995/96 2003/04 1995/96 2003/04
EU-5 provides 94.7% and receives almost 68% of intra-EU shipments of main crop potatoes. Therefore, trade between the EU-5 countries concentrates the bulk of
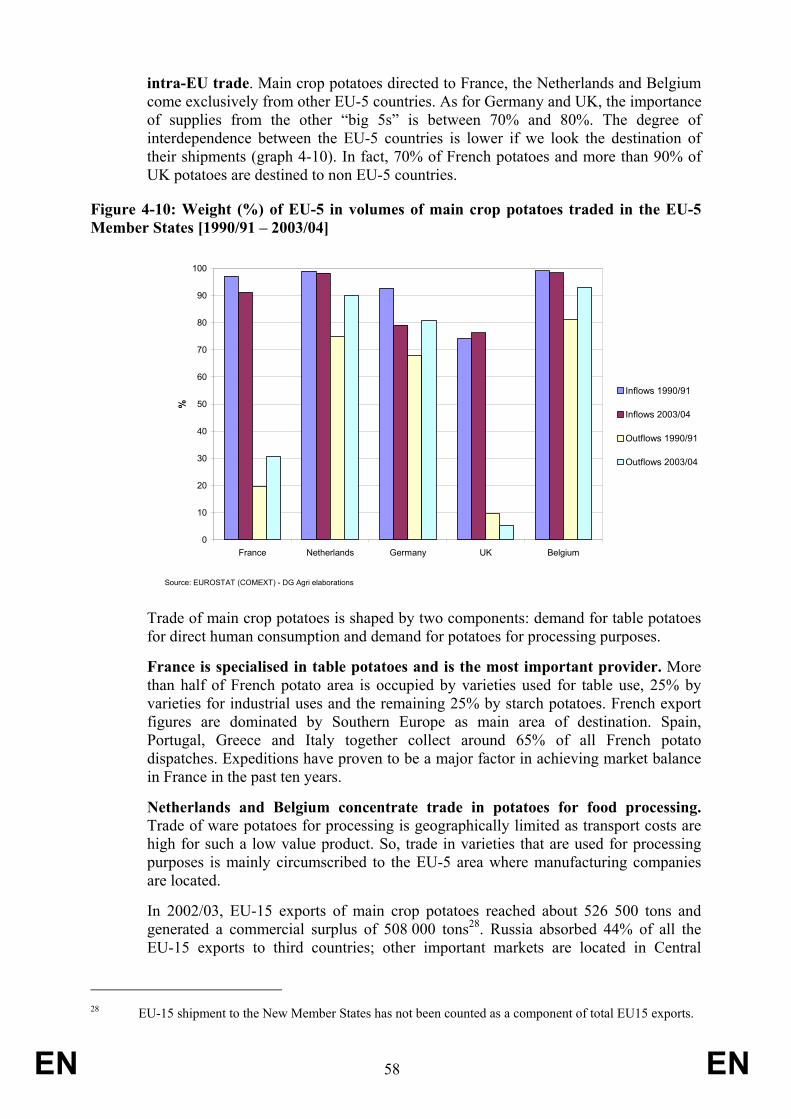
EN 58 EN
intra-EU trade. Main crop potatoes directed to France, the Netherlands and Belgium come exclusively from other EU-5 countries. As for Germany and UK, the importance of supplies from the other “big 5s” is between 70% and 80%. The degree of interdependence between the EU-5 countries is lower if we look the destination of their shipments (graph 4-10). In fact, 70% of French potatoes and more than 90% of UK potatoes are destined to non EU-5 countries.
Figure 4-10: Weight (%) of EU-5 in volumes of main crop potatoes traded in the EU-5 Member States [1990/91 – 2003/04]
0
10
20
30
40
50
60
70
80
90
100
France Netherlands Germany UK Belgium
%
Inflows 1990/91
Inflows 2003/04
Outflows 1990/91
Outflows 2003/04
Source: EUROSTAT (COMEXT) - DG Agri elaborations
Trade of main crop potatoes is shaped by two components: demand for table potatoes for direct human consumption and demand for potatoes for processing purposes.
France is specialised in table potatoes and is the most important provider. More than half of French potato area is occupied by varieties used for table use, 25% by varieties for industrial uses and the remaining 25% by starch potatoes. French export figures are dominated by Southern Europe as main area of destination. Spain, Portugal, Greece and Italy together collect around 65% of all French potato dispatches. Expeditions have proven to be a major factor in achieving market balance in France in the past ten years.
Netherlands and Belgium concentrate trade in potatoes for food processing. Trade of ware potatoes for processing is geographically limited as transport costs are high for such a low value product. So, trade in varieties that are used for processing purposes is mainly circumscribed to the EU-5 area where manufacturing companies are located.
In 2002/03, EU-15 exports of main crop potatoes reached about 526 500 tons and generated a commercial surplus of 508 000 tons28. Russia absorbed 44% of all the EU-15 exports to third countries; other important markets are located in Central
28 EU-15 shipment to the New Member States has not been counted as a component of total EU15 exports.
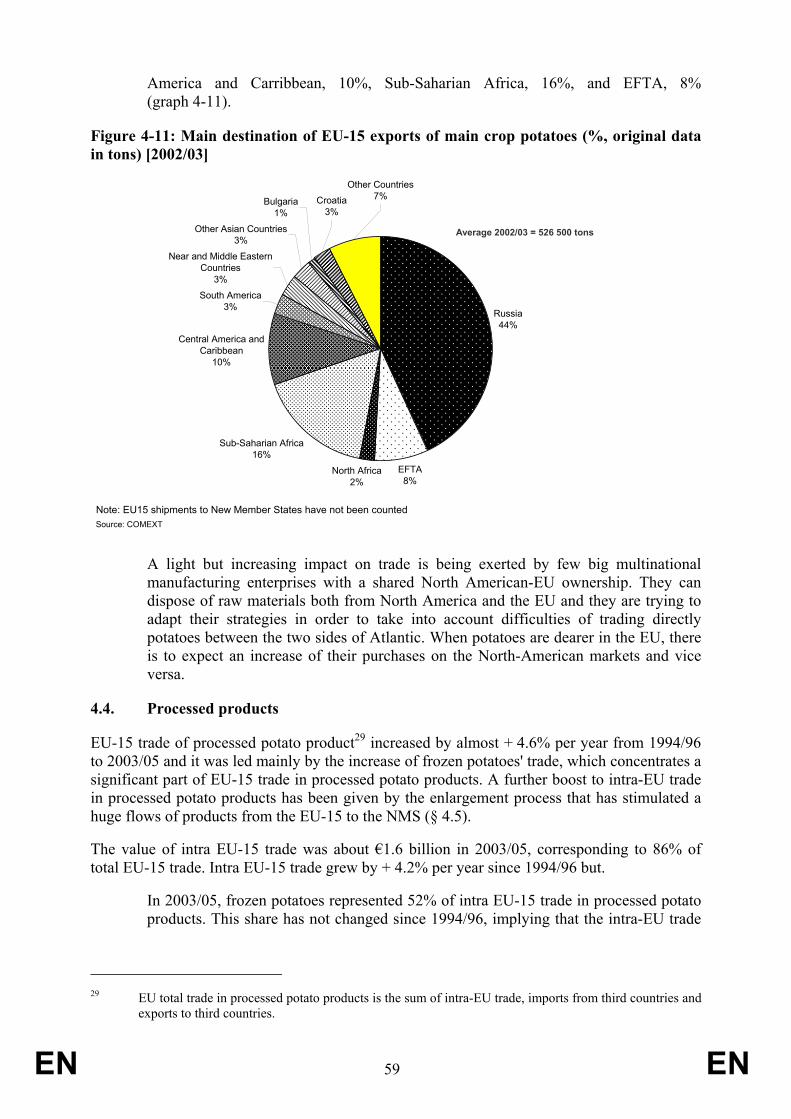
EN 59 EN
America and Carribbean, 10%, Sub-Saharian Africa, 16%, and EFTA, 8% (graph 4-11).
Figure 4-11: Main destination of EU-15 exports of main crop potatoes (%, original data in tons) [2002/03]
Russia44%
EFTA8%
North Africa2%
Sub-Saharian Africa16%
Central America and Caribbean
10%
South America3%
Near and Middle Eastern Countries
3%
Other Asian Countries3%
Bulgaria1%
Croatia3%
Other Countries7%
Note: EU15 shipments to New Member States have not been countedSource: COMEXT
Average 2002/03 = 526 500 tons
A light but increasing impact on trade is being exerted by few big multinational manufacturing enterprises with a shared North American-EU ownership. They can dispose of raw materials both from North America and the EU and they are trying to adapt their strategies in order to take into account difficulties of trading directly potatoes between the two sides of Atlantic. When potatoes are dearer in the EU, there is to expect an increase of their purchases on the North-American markets and vice versa.
4.4. Processed products
EU-15 trade of processed potato product29 increased by almost + 4.6% per year from 1994/96 to 2003/05 and it was led mainly by the increase of frozen potatoes' trade, which concentrates a significant part of EU-15 trade in processed potato products. A further boost to intra-EU trade in processed potato products has been given by the enlargement process that has stimulated a huge flows of products from the EU-15 to the NMS (§ 4.5).
The value of intra EU-15 trade was about €1.6 billion in 2003/05, corresponding to 86% of total EU-15 trade. Intra EU-15 trade grew by + 4.2% per year since 1994/96 but.
In 2003/05, frozen potatoes represented 52% of intra EU-15 trade in processed potato products. This share has not changed since 1994/96, implying that the intra-EU trade
29 EU total trade in processed potato products is the sum of intra-EU trade, imports from third countries and
exports to third countries.

EN 60 EN
increase for frozen potatoes has been equal to the increase registered for the other potato products.
On the other hand, EU-15 exports of frozen potatoes rose by + 13% per year from 1994/96 to 2003/05, whilst exports of snacks and other potato products increased respectively by + 4% and + 7% per year. This explains why the share of frozen potatoes in total EU-15 exports of processed potato products has increased from 50% to 66%. Such a growth was mainly driven by expeditions to the NMS (§ 4.5).
Snacks captured almost 14% of EU-15 exports of processed potato products in 2003/05 while the remaining 20% concerned other processed potato products (graph 4-12).
EU-15 imports have been generally decreasing except for snacks. In 1994/96, snacks imports were valued €2.6 million, while in 2003/05 they were worth about €7.9 million. As result, the share of snacks in EU-15 imports of processed potato products moved up from 7% in 1994/96 to 41% in 2003/05.
Figure 4-12: Importance (%) of the main types of processed potato products in EU-15 trade of processed potato products (original data in €) (1994/96 – 2003/05)
0%
10%
20%
30%
40%
50%
60%
70%
1994/96 2003/05 1994/96 2003/05 1994/96 2003/05
Intra EU-15 trade EU-15 exports Eu-15 imports
Frozen potatoes
Other products
Chips, snacks
Source: DG Agri elaborations, COMEXT data
Currently, intra-EU trade of processed potato products develops as a radius centred on the Benelux area. In value terms, the Netherlands and Belgium expedited respectively 44% and 30% of the totality of processed potato products traded in the EU in 2003/05. The remaining EU-5 countries have registered relevant progresses as departure point of the expeditions destined to other MS. In 2003/05, France counted 8.8% of total expeditions, Germany 8.1% and UK 4.4%. Positive developments have been recorded for other MS but the current level of their expeditions remains low. Only Italy and Portugal have reduced the volume of their expeditions (table 4-4).
EU-15 exports show also a predominance of Netherlands, 42.5%, Belgium, about 21%, as origins of total EU-15 exports of processed potato products.

EN 61 EN
The main recipients of EU processed potato products are UK, which absorbed 22.7% of intra EU-15 trade in 2003/05, France, 19.6%, and Germany, 12%. Since their entry into the EU in 1995, Sweden, Finland and Austria have been increasing their importance as intra-EU destination of processed potato products. Other countries where it has been recorded a consistent increase are Portugal, Greece, Ireland, Spain, Portugal and UK (table 4-4).
Table 4-4: Intra EU-15 trade and origin of EU-15 exports of processed potato products (€1 000) [2003/05]
2003/05 Annual rate of change
Share in EU-15 2003/05 Annual rate
of changeShare in EU-
15 2003/05 Annual rate of change
Share in EU-15
EU-15 1780096,5 5,0% 100,0% 1780096,5 5,0% 100,0% 234575,2 10,5% 100,0%France 348120,1 5,7% 19,6% 157166,9 10,7% 8,8% 11705,9 2,6% 5,0%Netherlands 137903,9 2,6% 7,7% 780484,1 2,0% 43,8% 99691,3 13,2% 42,5%Fr Germany 213785,6 0,8% 12,0% 143545,1 8,7% 8,1% 32812,8 7,5% 14,0%Italy 143763,2 3,8% 8,1% 3637,7 -8,5% 0,2% 4586,2 5,1% 2,0%Utd. Kingdo 403281,3 7,1% 22,7% 78026,6 10,1% 4,4% 19150,2 9,7% 8,2%Ireland 95094,6 7,8% 5,3% 14091,9 12,2% 0,8% 33,2 -25,8% 0,0%Denmark 34883,1 2,1% 2,0% 32669,8 12,8% 1,8% 3657,3 3,7% 1,6%Greece 49558,2 7,9% 2,8% 123,6 0,7% 0,0% 4831,2 24,6% 2,1%Portugal 39060,9 9,8% 2,2% 9557,5 -0,1% 0,5% 1422,5 24,8% 0,6%Spain 134996,7 8,2% 7,6% 15175,7 11,2% 0,9% 4474,6 -3,1% 1,9%Belgium 55918,5 -2,3% 3,1% 519423,9 10,9% 29,2% 42473,4 20,9% 18,1%Luxembourg 8436,0 1,0% 0,5% 413,3 16,7% 0,0% 5,2 6,0% 0,0%Sweden 62816,5 12,2% 3,5% 10978,3 15,8% 0,6% 1001,8 -7,7% 0,4%Finland 17679,2 11,5% 1,0% 1060,7 21,1% 0,1% 1304,6 -2,2% 0,6%Austria 23059,5 9,0% 1,3% 13741,5 60,4% 0,8% 7425,0 33,8% 3,2%
% as destination of intra EU-15 trade % as expediting MS in intra EU-15 trade % as origin of total EU-15 exports
The evolution of EU trade reflects a change in consumption patterns that led to a demand surge for frozen potato products. According to FAO data, world trade in frozen potatoes rose from 53 700 tons in 1978 to 3.9 million tons in 2003 (graph 4-13). EU, US and Canada control almost 94% of world trade in frozen potatoes. EU companies are key players with a 60% share in total world exports, but Canadian companies are exerting a very strong competition. Canada’s exports soared by ten times from 1990 to 2003 while the factor of multiplication for the EU is three (graph 4-14).

EN 62 EN
Figure 4-13: Exports of frozen potatoes (metric tons) [1978–2003]
0
500000
1000000
1500000
2000000
2500000
3000000
3500000
4000000
4500000
1978
1979
1980
1981
1982
1983
1984
1985
1986
1987
1988
1989
1990
1991
1992
1993
1994
1995
1996
1997
1998
1999
2000
2001
2002
2003
World trade EU15 US Canada
Met
ric T
ons
Source: FAO
1
21,4%
18.9%
12.4%
Yearly variation rates (1978-2003)
18,7%
Figure 4-14: Index of exports in frozen potatoes (1990=100; original data in metric tons) [1990–2003]
0
200
400
600
800
1000
1200
1990 1991 1992 1993 1994 1995 1996 1997 1998 1999 2000 2001 2002 2003
World trade
EU15
US
Canada
Source: FAO data
In the period 2002/03, the main area of destination of EU-15 processed potato products exports was Near and Middle Eastern countries, that accounted for 29% of EU-15 exports (excluding the NMS), while an aggregate including all the other Asian countries captured 10% of EU-15 exports. South America's weight was 12%; Central America/Carribbean and Sub-Saharian Africa absorbed each 9%. Russia came next with a share of 8%. EFTA, North Africa, Croatia and North America imported each around 3% (graph 4-15).
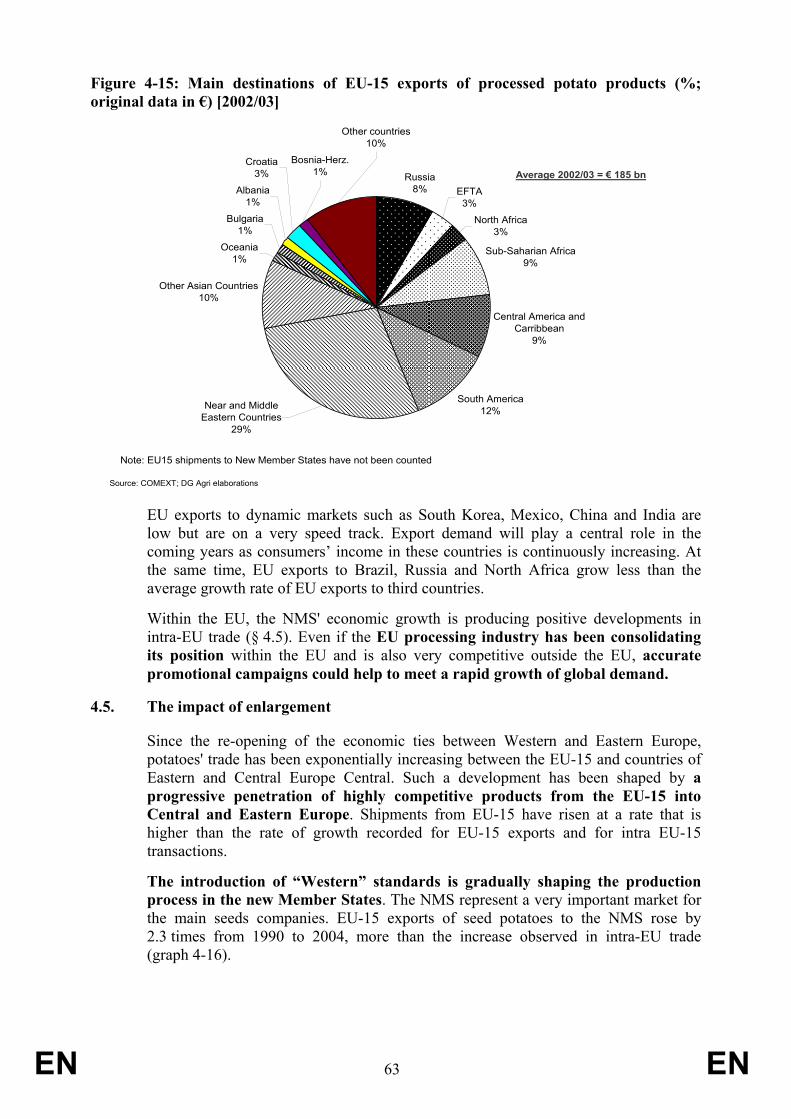
EN 63 EN
Figure 4-15: Main destinations of EU-15 exports of processed potato products (%; original data in €) [2002/03]
Russia8% EFTA
3%
North Africa3%
Sub-Saharian Africa9%
Central America and Carribbean
9%
South America12%
Other Asian Countries10%
Oceania 1%
Bulgaria1%
Albania1%
Croatia3%
Bosnia-Herz.1%
Near and Middle Eastern Countries
29%
Other countries10%
Average 2002/03 = € 185 bn
Note: EU15 shipments to New Member States have not been counted
Source: COMEXT; DG Agri elaborations
EU exports to dynamic markets such as South Korea, Mexico, China and India are low but are on a very speed track. Export demand will play a central role in the coming years as consumers’ income in these countries is continuously increasing. At the same time, EU exports to Brazil, Russia and North Africa grow less than the average growth rate of EU exports to third countries.
Within the EU, the NMS' economic growth is producing positive developments in intra-EU trade (§ 4.5). Even if the EU processing industry has been consolidating its position within the EU and is also very competitive outside the EU, accurate promotional campaigns could help to meet a rapid growth of global demand.
4.5. The impact of enlargement
Since the re-opening of the economic ties between Western and Eastern Europe, potatoes' trade has been exponentially increasing between the EU-15 and countries of Eastern and Central Europe Central. Such a development has been shaped by a progressive penetration of highly competitive products from the EU-15 into Central and Eastern Europe. Shipments from EU-15 have risen at a rate that is higher than the rate of growth recorded for EU-15 exports and for intra EU-15 transactions.
The introduction of “Western” standards is gradually shaping the production process in the new Member States. The NMS represent a very important market for the main seeds companies. EU-15 exports of seed potatoes to the NMS rose by 2.3 times from 1990 to 2004, more than the increase observed in intra-EU trade (graph 4-16).

EN 64 EN
Figure 4-16: Seed potatoes: intra EU-15 trade, exports to third countries and shipments to the new Member States (1990=100; original data in tons) [1990–2004]
50
100
150
200
250
1990 1991 1992 1993 1994 1995 1996 1997 1998 1999 2000 2001 2002 2003 2004
EU15 shipments toNew Member States
Total EU15 exportsto third countries
Intra-EU15 trade
Source: EUROSTAT (COMEXT) - DG Agri elaborations
Trade statistics in main crop and early potatoes show also an increase, remarkable especially for main crop potatoes, of EU-15 shipments to the NMS and a relative decline of volumes from the NMS to EU-15 (graphs 4-17 and 4-18).
Changes in early potatoes’ trade are a consequence of reduced purchases from Cyprus, while NMS' import of earlies from EU-15 rose up to 2002.
Figure 4-17: Trade in early potatoes between EU-15 and the new Member States (tons) [1990–2004]
0
20000
40000
60000
80000
100000
120000
140000
160000
180000
200000
1990 1991 1992 1993 1994 1995 1996 1997 1998 1999 2000 2001 2002 2003 2004
tons EU-15 exports
EU-15 imports
Source: EUROSTAT (COMEXT)
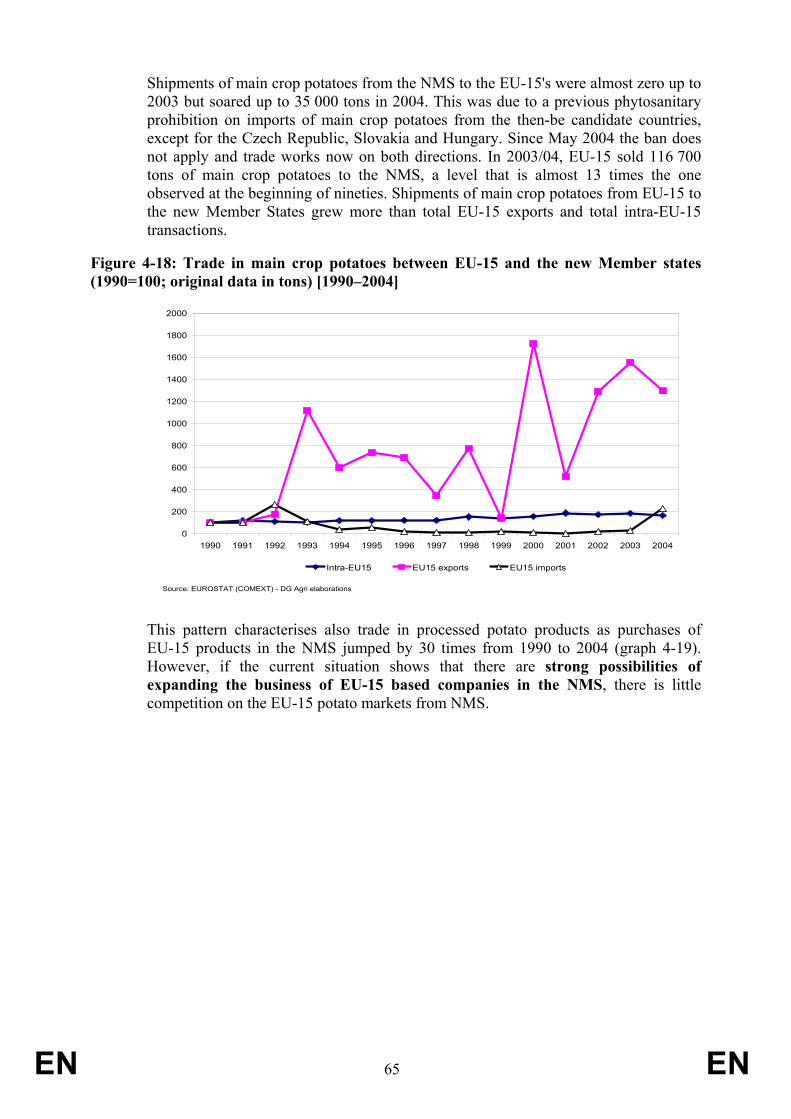
EN 65 EN
Shipments of main crop potatoes from the NMS to the EU-15's were almost zero up to 2003 but soared up to 35 000 tons in 2004. This was due to a previous phytosanitary prohibition on imports of main crop potatoes from the then-be candidate countries, except for the Czech Republic, Slovakia and Hungary. Since May 2004 the ban does not apply and trade works now on both directions. In 2003/04, EU-15 sold 116 700 tons of main crop potatoes to the NMS, a level that is almost 13 times the one observed at the beginning of nineties. Shipments of main crop potatoes from EU-15 to the new Member States grew more than total EU-15 exports and total intra-EU-15 transactions.
Figure 4-18: Trade in main crop potatoes between EU-15 and the new Member states (1990=100; original data in tons) [1990–2004]
0
200
400
600
800
1000
1200
1400
1600
1800
2000
1990 1991 1992 1993 1994 1995 1996 1997 1998 1999 2000 2001 2002 2003 2004
Intra-EU15 EU15 exports EU15 imports
Source: EUROSTAT (COMEXT) - DG Agri elaborations
This pattern characterises also trade in processed potato products as purchases of EU-15 products in the NMS jumped by 30 times from 1990 to 2004 (graph 4-19). However, if the current situation shows that there are strong possibilities of expanding the business of EU-15 based companies in the NMS, there is little competition on the EU-15 potato markets from NMS.

EN 66 EN
Figure 4-19: Trade in processed potato products: Intra-EU-15 trade, exports to third countries and shipments to the new Member States (1990=100; original data in €) [1990–2004]
0
500
1000
1500
2000
2500
3000
3500
1990 1991 1992 1993 1994 1995 1996 1997 1998 1999 2000 2001 2002 2003 2004
Shipments to New Member states Exports to third countries Intra-EU trade
Source: EUROSTAT (COMEXT) - DG Agri elaborations
Some constraints have to be removed in the NMS. The small scale of production, fragmentation and related problems make the collection of homogeneous batches difficult. Some Eastern varieties find little acceptance among West European operators while Western processors hesitate to purchase potatoes from some NMS regions for the fear of quarantine diseases. Furthermore, the lower processing capacities in some of the NMS limit the development of local manufacturing firms30.
If the potato sector in the NMS, particularly in Poland and in the Baltic countries, has to be further modernised, positive prospects are offered by the growing dimension of their internal markets. Within this context, investment flows from foreign processing firms can stimulate a better organisation of the chain in the NMS. For example, in Poland modern manufacturing plants have already been set up by some multinational companies that want to occupy a leading position in such a growing market.
4.6. Conclusions
EU's trade in potato products expanded significantly over the last decade. This trade expansion is mainly the result of an increasing specialisation of the EU's potato economy in five MS: Belgium, the Netherlands, France, Germany and UK. This macro-region is actually the core of the EU's potato economy.
This process of concentration in few countries where processors are located and growing conditions are more favourable is expected to consolidate in the coming years.
30 European Potato Markets, N. 112, p. 2.

EN 67 EN
The Mediterranean MS find it difficult to compete with Northern MS as suppliers of potatoes for processing. Processing firms trying to set up manufacturing plants in Southern Europe could encounter constraints caused by the high cost of raw materials.
The early potatoes' market is also becoming increasingly problematic. Earlies from the Mediterranean MS can still find a market in Europe as long as the price differential with main crop varieties commercialised from March to June is not too high. Furthermore, EU earlies have to compete with products originated in Egypt, Israeli and Morocco that are increasing their market shares.
The expected rise in world demand for processed potato products will furnish opportunities not only to processors but also to breeders of seed potatoes. As long as processors and packers require low cost material that fits changing consumers’ requirements, there is pressure for the development and introduction of new varieties offering better quality, higher yield and better resistance to diseases.
Calibrated promotional campaigns could further develop business segments of processed potato products (not only French fries or snacks, but also gnocchi, potato salad, etc) in the most dynamic world markets.
Business in seed potatoes will be strengthened especially if basic principles of Intellectual Property Rights will fully apply in countries such as China and India.
Our analysis on the impact of enlargement proves that fears of large volumes of cheap potatoes flooding into the EU-15 from the new Member States are so far unfounded. On the contrary, shipments from EU-15 to the NMS have strongly increased since the first nineties. Potato production in the NMS is being restructured in order to meet requirements from packers and processors. Further investments, including foreign direct investments, can speed up the modernisation of the potato chain, particularly in Poland and in the Baltic countries.

EN 68 EN
5. MARKET SITUATION, PRICES AND CONTRACTUAL RELATIONS
EU-5 potato markets are very inter-dependent and what happens in this economically integrated area strongly impacts prices in the rest of the EU.
Since mid-nineties, real producer prices are following a downward trajectory31. Some analysts underline that this trend could be related to the fall in demand so that progressive adjustments in supply are necessary to attain market equilibrium, whilst others argue that decreasing costs should be the main explanatory variable. In this section, price series will be presented and the relationships between prices in different zones of the EU will be analysed. Besides, we will examine the contractual relations that shape the potato chain.
As relevant fluctuations of potato yields and surfaces have repercussions on courses, price uncertainty is one of the main issues in the potato sector (§ 5. 4) and players put in place contracts to limit their exposure to risk. Contracts cover now a huge part of potatoes- traded in the EU. This is also a consequence of the growing segmentation. In fact, varieties that serve for specific purposes (i.e. particular types of French fries) are normally commercialised through contracts, while varieties that can have multiple destinations can be more easily traded on the open market.
If contracts tend to capture the lion’s share in terms of commercialised quantities, prices recorded on the spot markets still play a relevant role on the decisions of all the players in the chain. For example, a processor can push for re-negotiating contracted prices with farmers if free-buy potatoes are sold at low prices and the contracted tonnages were fixed at a too high level.
In this section, we will use Eurostat statistics (§ 5.1) on producer prices as well as data provided by national agencies. Eurostat series represent price averages of different varieties traded in a given country. In order to complement our analysis with data collected on homogeneous bundles of varieties, we have asked and obtained the support of national experts and specialised agencies that operate since a long time as data suppliers in the potato sector.
We will firstly examine the general tendencies of the EU potato sector with the support of statistics and quantitative elaborations on price series (§ 5.1). The nature of contractual relations between potato producers and their counterparts will be then analysed(§ 5.2, § 5.3, § 5.5), and potato futures will be addressed as a possible instrument for dealing with price uncertainty (§ 5.6). Final conclusions on the most relevant topics will be presented in the closing paragraph (§ 5.7).
5.1. Long run trend of prices series
The ware and seed potato harvest in the EU-15 declined from 55 million tons in 1985 to 33.5 million tons in 1994, equivalent to a yearly decline of –5.3%, while it fluctuated around 37 million tons since 1995 (graph 5-1). However, the market
31 Not only real but also nominal producer prices of cereals are also decreasing in the EU as well as on the
world markets. Prices of cereals have been strongly affected by the 1992 CAP reform that caused a significant reduction of price support (replaced by direct payments). Furthermore, the cereals market has a worldwide dimension while the potato market is more circumscribed within the EU.

EN 69 EN
situation in the last years has not been perceived by farmers as encouraging. Despite a fluctuating but not increasing production, prices in real terms have slowly stepped down. The consumption of table potatoes is decreasing while the demand for potatoes for processing remains robust but does not grow enough to boost a growth in prices.
Figure 5-1: EU-15 production of ware and seed potatoes (1 000 tons) [1985–2005]
30000
35000
40000
45000
50000
55000
60000
1985 1986 1987 1988 1989 1990 1991 1992 1993 1994 1995 1996 1997 1998 1999 2000 2001 2002 2003 2004 2005
1000
t
Source: DG Agri elaborations - Eurostat data. Eurostata data have been combined with FAO data on Germany in the years 1985, 1986,
annual rate of change 1985-1994 = -5.3% annual rate of change 1994-2005 = +0,4%
Eurostat's time series of producer prices32 of main crop potatoes33 in the EU-5 are displayed in graph 5-2. In UK, prices are higher than in the other EU-5 MS and the gap seems to become deeper since 1997. It seems that prices have been characterised by cycles of 7-8 years: 1978–1985 and 1985–1993. These cycles started with a low of about €4–6/100 kg, prices then tended to rise for about six years picking in 1983/84 and in 1990/91 and finally returned at €4–6/100 kg within the last two years of the cycle.
More recently, the path of potato prices has become less regular. Since the peak recorded in 1995, prices go up and down but it is not possible to confirm anymore the existence of a cycle of 7-8 years in potato prices (low-peak-low).
From 1999 to 2005, real producer prices of main crop potatoes have fallen in the EU-5 area. Annual average nominal producer prices fluctuated between €11/100 kg and €5/100 kg (except in UK). These levels have been recorded in the eighties too, implying that current producer prices are lower in real terms.
32 As it is stated in the Handbook for EU Agricultural Price Indices: "Price Statistics uses the market price
concept (called producer price concept in the context of agricultural account). The market price is defined as the price received by the producer without the deduction of taxes or levies (except deductible VAT) and without the inclusion of subsidies". In other words, agricultural prices are producer prices which are defined as the sum of the costs of goods and services used in the productive process plus the remuneration of the production factors necessary for the production of the product, including any taxes or levies (taxes on products and other taxes on production, except deductible VAT) and without the addition of subsidies. FurtheR details can be found in the "Manual on the economic accounts for Agriculture and Forestry EAA/EAF 97 (Rev. 1.1).
33 Selling potato prices are referred only to potatoes sold from the producer to the trade for sale fresh to the consumer, excluding potatoes for processing and potatoes sold directly from the producer to the consumer. Prices are recorded at ex-farm gate level.

EN 70 EN
Figure 5-2: Selling prices of main crop potatoes in the EU-5 countries (ECU-€/100 kg; nominal terms) [1971–2005]
0
5
10
15
20
25
30
1971
1972
1973
1974
1975
1976
1977
1978
1979
1980
1981
1982
1983
1984
1985
1986
1987
1988
1989
1990
1991
1992
1993
1994
1995
1996
1997
1998
1999
2000
2001
2002
2003
2004
2005
€/10
0 kg
Belgium Germany France Netherlands UKSource: Eurostat
Price cycles in the EU-5 countries are soundly correlated and have a strong impact on the overall tendencies recorded at EU level. The high correlation derives primarily from the fact that production is located in bordering regions, downstream operators are also located in these areas, they are in close communication with each other and with farmers.
In EU-5, packers and processors can count on huge supplies from contiguous zones without encountering significant restraint due to expensive transport costs. Apart from location, another necessary condition that favours the integration of EU-5 potato markets is brought about by the market organisation. Traders and especially processors normally control not irrelevant market shares and thus have privileged access to information on prices along the whole EU-5 area. Published price lists and frequent meetings play also a role for continuous price adjustments, resulting in the tendency to have equality in prices for the same varieties in the MS of the EU-5 zone.
In Southern Europe, prices of main crop potatoes tend to be higher than those recorded in the EU-5 area mainly because yields are lower and costs of production rise over the EU-5 levels (graph 5-3). The price gap is a factor that helps to explain why table potatoes from France have traded off domestic production in important basins of consumption such as the ones situated in the EU's Mediterranean area.
However, the comparison of average prices (based on Eurostat's statistics) between the Mediterranean and EU-5 should be interpreted with caution for the variety mix within the two areas is different, especially at the beginning of the calendar year. In the next paragraph, we will use national sources that allow us to compare homogenous sets of varieties. In this case, the price differential remains but the correlation between the prices recorded in the two areas becomes more significant than the one illustrated

EN 71 EN
in graph 5-3. This is also a consequence of the impact of the imported product on the value of domestic-produced potatoes.
Figure 5-3: Comparison between annual average producer prices of potatoes in Spain, Portugal, Italy and EU-5 (ECU-€/100 kg in nominal terms) [1971–2005]
0
5
10
15
20
25
30
3519
71
1972
1973
1974
1975
1976
1977
1978
1979
1980
1981
1982
1983
1984
1985
1986
1987
1988
1989
1990
1991
1992
1993
1994
1995
1996
1997
1998
1999
2000
2001
2002
2003
2004
2005
€/10
0 kg Spain
Italy
Portugal
Average EU-5
Source: Eurostat
Note: EU-5 average prices have been calculated as the unweighted average of potato prices in the Netherlands, UK, France, Belgium and Germany
Prices of main crop potatoes in Sweden and Denmark are very similar and are generally higher than the levels recorded in UK. In recent years, the gap between the average prices recorded in Sweden and Denmark and those recorded in the EU-5 seems to be widened. Finnish average prices are even higher than those registered in Sweden although they have constantly declined since late eighties. The average level of main crop potato prices in Austria is now in line with the EU-5 average levels.
In the new Member States, Hungary, Czech Republic and Slovakia present prices that do not diverge significantly from the EU-5 average levels. In Poland and the Baltic countries, the potato sector is being restructured but is currently affected by a declining production, carried out mainly in small subsistence lots, having little margin of technological improvements and producing a low-quality product.
The indications that come out from Eurostat's data are confirmed by private sources and illustrate a tendency towards a general increase in prices of main crop potatoes in Poland and in the Baltic countries (graph 5-4). As a consequence, prices tend to equalise EU-5 average levels and, in some cases, to overtake them. Alongside the narrowing (or even elimination) of the price differential, quality gaps explain why table potatoes from Germany, Austria and other EU-15 countries have entered into these markets.

EN 72 EN
Figure 5-4: Comparison between annual average producer prices of main crop potatoes in Poland, Latvia, Lithuania and EU-5 (ECU/100 kg and €/100 kg in nominal terms) [1990–2005]
0
2
4
6
8
10
12
14
16
18
2019
90
1991
1992
1993
1994
1995
1996
1997
1998
1999
2000
2001
2002
2003
2004
2005
€/10
0kg Latvia
Lithuania
Poland
Average EU-5
Source: Eurostat
Note: EU-5 average prices have been calculated as the unweighted average of potato prices in the Netherlands, UK, France, Belgium and Germany
Potato farmers complain that producer prices are low and declining. Our analysis allows us to identify some important explanatory elements of the fall in real producer prices:
o Yields improve and cause a decrease in costs of production, especially in the EU-5 zone. Farmers can then sell their potatoes at lower prices.
o The high level of competitiveness of EU-5 farmers exerts a downward pressure on prices not only within the EU-5 area, but in the rest of the EU too.
o The demand for table potatoes is continuously falling and is gradually causing a reduction of producer prices for the product that is used mainly for fresh consumption;
o The progressive shift in demand from table potatoes to varieties destined to the manufacturing industry: potatoes for processing have a lower value and their increased utilisation pushes downward the aggregate unit price of potatoes.
Two additional factors having an impact on the potato prices can be identified:
o Data collected on spot markets concern varieties that can be used for multiple purposes. These varieties are valued less than varieties that are conceived for a specific use and that are normally contracted. However, prices on the spot market remain useful to illustrate price trends;
o Downstream operators have more possibilities to influence prices than farmers. In fact, packers and processors delay purchases when spot prices are very high or vice versa. The application of a counterbalancing strategy is more difficult for farmers as they are numerous and free-riding behaviours amongst them are more likely to happen.

EN 73 EN
Farmers in EU-5 have also got consistent advantages from the development of local firms in the downstream sector for this contributed to keep production localised in specific regions. In EU-5, there is a vital process of circular causation, where the competitiveness of the agricultural part reinforces the position of manufacturers and vice versa.
Some experts forecast that further cutbacks in plantings in Southern and Eastern Europe should strengthen demand for potatoes produced in the EU-5 countries so that EU-5 prices can be expected to improve in the future. Others speculate instead but less convincingly that if prices in Western Europe will increase there can be a corresponding rise in demand for cheap Polish potatoes.
5.2. Segmentation, national boundaries and prices
Potatoes can be used for several destinations that are directly linked to the segmentation of consumers’ preferences. Markets offer various combinations.
Certain varieties can be created and then used for specific purposes, such as some classes of varieties used for French fries or some varieties that are almost exclusively destined to fresh consumption.
High specificity of a variety could bring about problems for farmers as the variety itself can have low salvage value outside the relationship with a given customer. This explains why higher levels of specificity encourage tighter co-ordination under the form of contractual relations or even vertical integration. On the opposite, a low degree of specialisation of a variety increases the convenience of trading on the free-buy market. The classical example is the variety Bintje that can be used either for processing or as table potato. It is not by chance that most data available on potato prices refer to Bintje as they can be collected in the free market.
If a unit of a variety such as Bintje can be used both for processing and for fresh use, then farm prices of both markets tend to level (see also § 5.5)34. In graph 5-5 we illustrate the monthly producer prices recorded in France for Bintje destined to transformation and the wholesaler prices of a bundle of “standard” (not high specific) firm-cooking varieties, where Bintje has the highest weight. The two series are correlated, the difference in price levels seems mainly due to the different stages at which prices are collected.
34 When packers and processors have alike expectations on prices and if these expectations are fully
reflected in the contracts signed between them and farmers, then the functioning of the free-buy market (for varieties such as Bintjes) tends to equalise the marginal value (of Bintje) for processing and (Bintje) for the fresh market. Furthermore, there is also a tendency to level the unit value of (Bintje) potatoes under contract with the marginal value of (Bintje) potatoes purchased (sold) in the free-buy market. Processors normally increase their demand on the free-buy market when spot prices are relatively low and withdraw from the free-buy market when prices are higher. This rational behaviour causes corrections on free-prices and tends to level unit values. Total unit value for a processor (farmer) results from the unit value of purchases (sell) under contracts and the unit value of purchases (sell) in the free-buy market. In absence of any constraint, a rational processor (farmer) will buy (sell) in the free-buy market until when the value of an additional unit equals the unit value of his/her contracts.
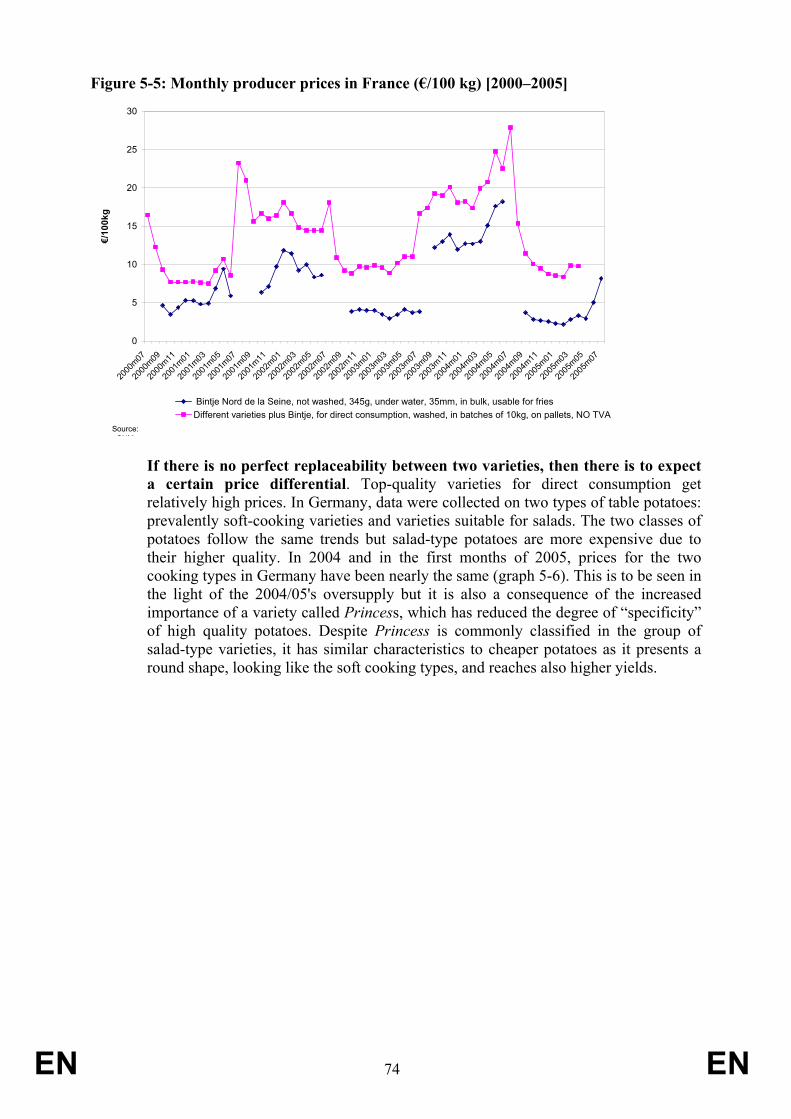
EN 74 EN
Figure 5-5: Monthly producer prices in France (€/100 kg) [2000–2005]
0
5
10
15
20
25
30
2000
m07
2000
m09
2000
m11
2001
m01
2001
m03
2001
m05
2001
m07
2001
m09
2001
m11
2002
m01
2002
m03
2002
m05
2002
m07
2002
m09
2002
m11
2003
m01
2003
m03
2003
m05
2003
m07
2003
m09
2003
m11
2004
m01
2004
m03
2004
m05
2004
m07
2004
m09
2004
m11
2005
m01
2005
m03
2005
m05
2005
m07
€/10
0kg
Bintje Nord de la Seine, not washed, 345g, under water, 35mm, in bulk, usable for friesDifferent varieties plus Bintje, for direct consumption, washed, in batches of 10kg, on pallets, NO TVA
Source: SNM
If there is no perfect replaceability between two varieties, then there is to expect a certain price differential. Top-quality varieties for direct consumption get relatively high prices. In Germany, data were collected on two types of table potatoes: prevalently soft-cooking varieties and varieties suitable for salads. The two classes of potatoes follow the same trends but salad-type potatoes are more expensive due to their higher quality. In 2004 and in the first months of 2005, prices for the two cooking types in Germany have been nearly the same (graph 5-6). This is to be seen in the light of the 2004/05's oversupply but it is also a consequence of the increased importance of a variety called Princess, which has reduced the degree of “specificity” of high quality potatoes. Despite Princess is commonly classified in the group of salad-type varieties, it has similar characteristics to cheaper potatoes as it presents a round shape, looking like the soft cooking types, and reaches also higher yields.
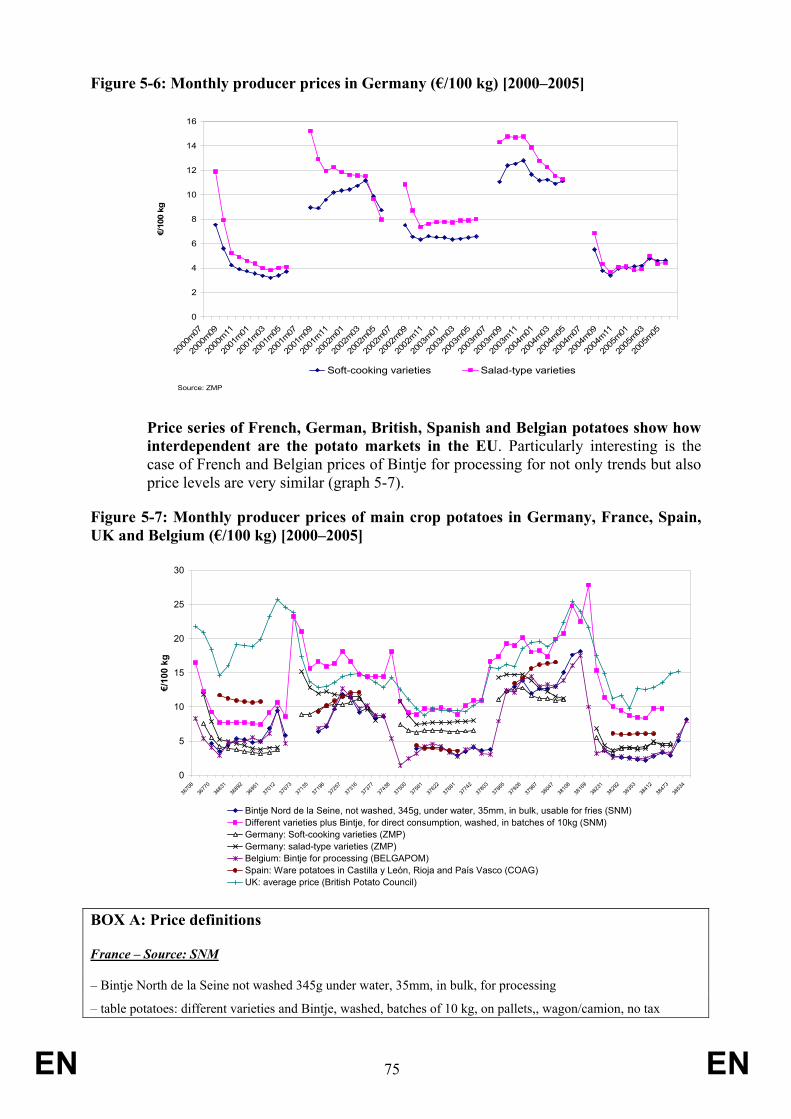
EN 75 EN
Figure 5-6: Monthly producer prices in Germany (€/100 kg) [2000–2005]
0
2
4
6
8
10
12
14
16
2000
m07
2000
m09
2000
m11
2001
m01
2001
m03
2001
m05
2001
m07
2001
m09
2001
m11
2002
m01
2002
m03
2002
m05
2002
m07
2002
m09
2002
m11
2003
m01
2003
m03
2003
m05
2003
m07
2003
m09
2003
m11
2004
m01
2004
m03
2004
m05
2004
m07
2004
m09
2004
m11
2005
m01
2005
m03
2005
m05
€/10
0 kg
Soft-cooking varieties Salad-type varieties
Source: ZMP
Price series of French, German, British, Spanish and Belgian potatoes show how interdependent are the potato markets in the EU. Particularly interesting is the case of French and Belgian prices of Bintje for processing for not only trends but also price levels are very similar (graph 5-7).
Figure 5-7: Monthly producer prices of main crop potatoes in Germany, France, Spain, UK and Belgium (€/100 kg) [2000–2005]
0
5
10
15
20
25
30
3670
836
770
3683
136
892
3695
137
012
3707
337
135
3719
637
257
3731
637
377
3743
837
500
3756
137
622
3768
137
742
3780
337
865
3792
637
987
3804
738
108
3816
938
231
3829
238
353
3841
238
473
3853
4
€/10
0 kg
Bintje Nord de la Seine, not washed, 345g, under water, 35mm, in bulk, usable for fries (SNM)Different varieties plus Bintje, for direct consumption, washed, in batches of 10kg (SNM)Germany: Soft-cooking varieties (ZMP)Germany: salad-type varieties (ZMP)Belgium: Bintje for processing (BELGAPOM)Spain: Ware potatoes in Castilla y León, Rioja and País Vasco (COAG)UK: average price (British Potato Council)
BOX A: Price definitions
France – Source: SNM
– Bintje North de la Seine not washed 345g under water, 35mm, in bulk, for processing
– table potatoes: different varieties and Bintje, washed, batches of 10 kg, on pallets,, wagon/camion, no tax
EN 76 EN
Belgium – Source : Belgapom
The Belgapom quotation refers to Bintje, 35 mm+, for processing, minimum 360 g/5 kg PSE, 60% 50 mm+, ex-farm gate. The Belgapom quotation is estimated by a commission of two representatives of the processing industries, on representative of exporters and a representative of traders operating within the country.
Germany – Source : ZMP
Producers price of table potatoes, average for Germany, bulk, firm cooking and soft cooking varieties
UK – Source : British Potato Council
Entries for the overall GB average price apply only to direct from (ex) farm purchases, from low value peeling to premium priced packing and salads, both free buy and contract. The cost of bags is excluded. The GB free buy weekly average price (open market) average price is also calculated. All entries on survey forms under the contract heading direct from growers are deducted from the overall price. This includes contracts (agreements reached before 1 July in each crop year) for processing, packing and niche markets.
Spain – Soure: COAG
Potato weighted average prices from the main producing regions of main crop potatoes in Spain (Castilla Leon, Rioja, Pais Vasco), ex farm gate, in bulk and not classified in "big bags". These data just cover the period October–March period.
Relative prices of early potatoes tend to decrease. As emphasised in other parts of this report, in a context characterised by a falling consumption of table potatoes and by increasing opportunities for packers to pick up the remaining batches of main crop product, if the asking prices for the early crop are far above those of main crop potatoes then problems arise. The start of the 2005 season was exceptional but also emblematic as the continuing availability of the 2004 main crop potatoes from cold stores and large early imports caused very low prices. Big retailers offered main crop potatoes at very low prices with promotions like “take 2 pay 1”35. In 2004, the unit trade value36 of early potatoes was twice the unit trade value of main crop potatoes, while it was 2.5 bigger in 1990. As shown in graph 5-8, there is a consolidated tendency towards the fall of the relative price of early potatoes in relation to the price of main crop potatoes.
35 Fruit and Vegetable Markets, N.175, 2005, page, 12 36 Unit trade values are the ratio of the value of total trade to the quantity of total trade. Total trade is the
sum of intra-EU transactions plus EU imports plus EU exports.
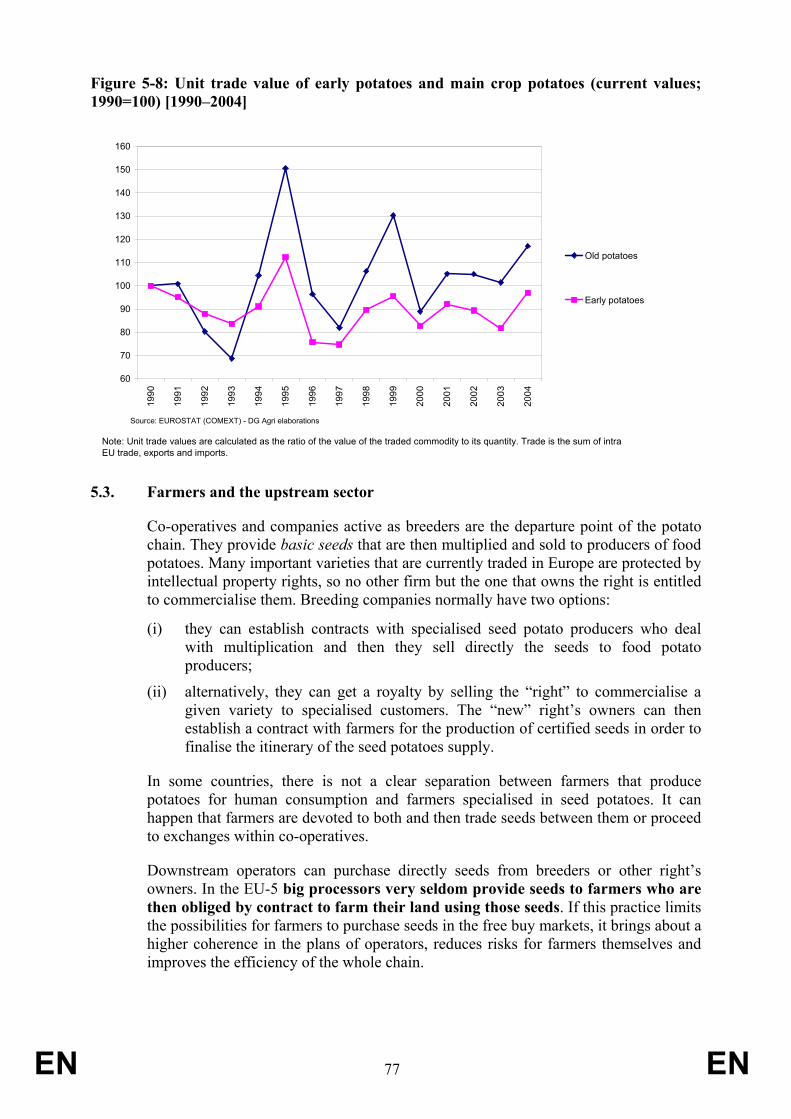
EN 77 EN
Figure 5-8: Unit trade value of early potatoes and main crop potatoes (current values; 1990=100) [1990–2004]
60
70
80
90
100
110
120
130
140
150
16019
90
1991
1992
1993
1994
1995
1996
1997
1998
1999
2000
2001
2002
2003
2004
Old potatoes
Early potatoes
Source: EUROSTAT (COMEXT) - DG Agri elaborations
Note: Unit trade values are calculated as the ratio of the value of the traded commodity to its quantity. Trade is the sum of intra EU trade, exports and imports.
5.3. Farmers and the upstream sector
Co-operatives and companies active as breeders are the departure point of the potato chain. They provide basic seeds that are then multiplied and sold to producers of food potatoes. Many important varieties that are currently traded in Europe are protected by intellectual property rights, so no other firm but the one that owns the right is entitled to commercialise them. Breeding companies normally have two options:
(i) they can establish contracts with specialised seed potato producers who deal with multiplication and then they sell directly the seeds to food potato producers;
(ii) alternatively, they can get a royalty by selling the “right” to commercialise a given variety to specialised customers. The “new” right’s owners can then establish a contract with farmers for the production of certified seeds in order to finalise the itinerary of the seed potatoes supply.
In some countries, there is not a clear separation between farmers that produce potatoes for human consumption and farmers specialised in seed potatoes. It can happen that farmers are devoted to both and then trade seeds between them or proceed to exchanges within co-operatives.
Downstream operators can purchase directly seeds from breeders or other right’s owners. In the EU-5 big processors very seldom provide seeds to farmers who are then obliged by contract to farm their land using those seeds. If this practice limits the possibilities for farmers to purchase seeds in the free buy markets, it brings about a higher coherence in the plans of operators, reduces risks for farmers themselves and improves the efficiency of the whole chain.

EN 78 EN
In Italy, Spain and other countries, few distributors hold the representation right on the main varieties and control the seed potatoes' business within national boundaries. They import seeds from the main breeding companies (mainly Dutch) and sell them to local producers. Very often, these distributors play also a role as packers and cumulate a relevant buying and selling power.
If seed potatoes' prices may be sometimes perceived as “expensive” by producers of food potatoes, farmers generally benefit from varieties that reduce their production-risk while seeds companies aim at capturing adequate compensation for their investments in R&D. Spatial differences in prices of seed potatoes are partly due to the existence of different organisations and structures. A better organisation of producers does not automatically entail lower prices for seeds because well-organised producers may prefer certified and quality seed and can opt to spend more for their raw material.
5.4. Fluctuations of potato prices
The potato market has not been subject to any CAP interventions, either under the form of price support or coupled direct subsidies. The absence of any type of stabilisation measures, the inelasticity of demand and the high variability of yields produce substantial fluctuations of potato prices in the EU. Efficient storage operations can only partly offset the impact of these variables on prices’ fluctuations.
In Appendix E37, monthly price series of potatoes, cereal and sugar are compared in Belgium, Spain, UK, Germany, France and the Netherlands. It is evident that potato prices exhibit the most significant variations in all the countries.
Prices variations do not convert automatically in income fluctuations of the same entity as low prices are normally associated with high production and vice versa. However, the price risk is a relevant element in potato business so that farmers and their counterparts in the potato chain have developed various tools that help reduce risks. The next two paragraphs are devoted to these issues.
5.5. Contractual relations with downstream operators
Forecasts on prices are directly correlated to expected changes in production and quality. Weather forecasts and harvested area are the main underlying factors; for example, prices are expected to go up if it is observed a certain cutback in plantings and yields are expected to be no more than average.
Uncertainties may be generated mainly by unexpected weather events and by certain fluctuations in aggregate market demand.
To limit their exposure to risks, both farmers and their downstream customers (packers and food processors) have developed forward contracts38, which are the most popular price-fixing model in the potato sector.
37 Appendix E illustrates graphically potato prices in comparison to prices of other crops (see p. 115). 38 A forward contract is an agreement between two parties calling for delivery of, and payment for, a
specific quality and quantity of a commodity at a specified future date (Harwood J., Heifner R., Coble K., Perry J. and Somwaru A., 1999, Managing Risk in Farming, Agricultural Economic Report N. 774, USDA, March 1999)

EN 79 EN
It is very common to establish a maximum yield on which a given price is guaranteed. Once contracted prices and tonnages are fixed, the allocation of pay offs between farmers and their customers will depend on weather conditions and bargaining power. If weather results unexpectedly favourable, processors and traders can make additional purchases at prices below the contract’s level on the free-buy market. If the opposite holds true they will fill the remaining part of their requirements on the free market at prices that are higher than those applying on the contracted tonnages.
Annual or multi-annual contracts often do not exclude the possibilities of revising prices each month or sometimes even weekly. A fluctuation band can be created with a premium to trigger in seasons characterised by high prices and high-quality products and vice versa.
High-quality varieties for the fresh market are increasingly traded through contracts. Farmers engaged in the cultivation of varieties characterised by high quality and relatively low yields are less willing to take risks on the free-buy market. In France, about 70% of fresh potatoes are grown on contracts. Furthermore, packers tend to gain additional control over decisions such as planting schedules and seed varieties that would be made solely by the grower in absence of a contract.
Producers of varieties specifically targeted for some processing usages work closely with their customers and normally grow their potatoes on contract too. If a given variety is suitable for fresh consumption, for processing and for exports, farmers will have a higher degree of freedom in terms of market outlets and will show a higher propensity to take risks on the free-buy market. In Belgium the share of contracted material is relatively low for the most common variety, Bintjie39, can have multiple destinations. In the Netherlands, where many producers concentrate their business on special varieties, contracts cover a much higher share of the market.
The relationship between packagers/traders and big retailers can also be characterised by a framework contract that normally covers one year with periodical negotiations that follow the latest trends on prices and harvest. Uncertainties on potato production affect also the relationship between big retailers and their customers. In fact, when prices on the free-buy market are low, big retailers may push for reducing prices of processed products as well as of table varieties. Given the pressure exerted by big retailers, it is clear that processors/traders need a certain degree of flexibility in the contractual relationship with their agricultural counterparts.
Processors and packers could exert a certain buying power on the agricultural sector. Farmers are normally much more numerous and depend heavily on the business set with the few customers existing in their territory. While a single farmer can be easily replaced, packers and processors are irreplaceable for farmers. Breeders are also very concentrated vis-à-vis farmers.
In order to improve the position of farmers within the potato chain, a better organisation of potato producers is advisable in the EU-5 area and is crucial in other areas so as to further rationalise the agricultural part of the potato chain, avoid conflicts and facilitate cooperation with packers and processors, and also improve the business environment for farmers.
39 Bintje captures 70% of the potato area in Belgium.

EN 80 EN
In Southern Europe potatoes play a minor role as a factor of farmers’ aggregation. For example, the very few Spanish organisations dealing with potatoes have other crops, such as citrus fruit, as their principal activity40. Despite some exception, the residual interest placed on potatoes results in a general lack of farmers’ control on basic operations such as storage and first processing while strategic choices on the production process (for example, seeds selection) are not co-ordinated. Big traders focus mainly on earlies and have little interest in investing in high capacity storage facilities.
In Poland and in the Baltic countries, potato farmers are even more fragmented and the entire potato chain could be better organised. The small scale of production, fragmentation, poor quality of tubers, difficulties in the collection of homogeneous batches create problems during the phase of commercialisation. Investments in storage and processing facilities together with a strengthened supply of tools and occasions where operators can exchange information are necessary steps to increase efficiency of the potato chain in these countries.
5.6. Futures and options
Potato operators can deal with price risks by using financial derivatives, such as futures and options on futures. These types of contracts offer the possibility to lock-in a certain price ahead of time and are currently traded at the Commodity exchanges in Hannover. In Amsterdam, trade in potato futures and options was rather limited if compared with trade in other commodities and it was suspended in June 2006.
A potato future41 is a standardised, transferable, exchange-traded contract that requires delivery of specific varieties of potatoes, at a specified price, on a specified future date. Options may be traded on potato futures: a put is the option to sell a futures contract, and a call is the option to buy a futures contract. Clearly, an option entails the right, but not the obligation to buy or sell. Put contracts provide the buyer with protection against declines in price will call contracts provide the buyer with protection against future increases.
Very rarely individual potato producers have sufficient size to make a profitable use of futures and options. However, they could pool their efforts and develop joint strategies on commercialisation and risk management. Working together would then allow to reduce the unit transaction costs and would make the use of these financial instrument more attractive.
As remarked in the Commission’s Communication on risk and crisis management in agriculture (COM(2005) 74, p. 6): “the causes of the rather weak development and use of market based risk management tools (insurance, futures market, contract
40 Confederación de Cooperativas Agrarias de España (CCAE), 2004, Caracterización del Mercado y de la
Comercialización de la Patata en las Cooperativas Agrarias, study prepared for the Confederación Española de Cooperativas Agrarias de España (CCAE), Madrid.
41 If production and marketing contracts generally imply the physical delivery of goods at maturity, on futures markets this is the exception. This occurs because the major motive in trading futures is to hold a temporary position and then trade for money, and not to physically deliver or acquire a commodity (Harwood J., Heifner R., Coble K., Perry J. and Somwaru A., 1999, Managing Risk in Farming. Concepts, Research, and Analysis, USDA, Economic Report N.774USDA, p. 29).

EN 81 EN
farming) could be addressed by training measures within rural development programmes”.
5.7. Concluding remarks
EU potato markets are currently affected by the fall in demand for table potatoes. At the same time, yields continuously improve and create room for further competitiveness gains. Both factors have an impact on the fall of real prices observed in Europe.
Prices recorded in EU-5 are strongly inter-related and heavily affect the level and evolution of prices not only in the Mediterranean MS, which are the main importers of table potatoes, but more and more also in the NMS.
Our analysis of the potato chain reveals that operators put into practice matched choices in all the phases of production, from seeds planting to retailing operations. Big supermarkets, packers and manufacturing companies necessitate tighter coordination in order to limit uncertainties due to fluctuations in potato production and purchasing behaviour.
The potato industry in EU-5 countries shows that an increasing co-ordination strengthens competitiveness and brings about advantages to all the operators, including farmers. EU-5 potato producers have consolidated their market position thanks also to the developments in the downstream sectors and have gained large market shares in intra-EU trade.
However, there is still room for potato farmers to strengthen connections with their commercial counterparts and to improve their horizontal links. Some basic issues may be addressed to achieve a better market performance:
Selection of seeds: particularly in Poland and in the Baltic countries, a more widespread use of certified seeds would provide higher quality, free from disease and homogeneous batches;
Storage facilities: in some countries of the EU, wastage is a severe problem and storage techniques could be improved to warrant continuity of supply;
Information on prices, storage, variety plantings and other variables reported by specialised agencies ensures market transparency and is vital for farmers as they are relatively small compared to the larger organisations with which they trade. If in EU-5 existent databases could be further improved, in the NMS there is a strong need to set up efficient informational systems that could assist farmers and the other operators of the chain;
Modern risk management strategies may result very onerous if carried out only by few farmers. In order to overcome this problem, potato farmers could co-operate to harmonise their marketing decisions and minimise the unit costs linked to the use of risk management tools, such as futures and options.

EN 82 EN
6. EU POLICIES AND THE POTATO SECTOR IN THE EU
This chapter illustrates the EU policies having an impact on the European potato economy.
The most relevant one is contained in the set of phytosanitary regulations and Directives put in place in order to limit risks for public health and guarantee an ordered carrying out of business transactions within the EU (§ 6.1). The application of phytosanitary regulations is currently banning imports of main crop potatoes from the main producing countries. The situation is different for early potatoes, where imports are allowed from the main Mediterranean third countries.
Tariffs and quotas applied to imports of all the types of potato products (except starch) will be described in § 6.2. The EU import measures on processed potato products do not have a very limiting impact on imports because the EU firms are very competitive and provide the bulk of the products traded within the EU.
The EU set up also a CAP promotion policy and a CAP quality policy (PDO/PGI) to stimulate business and guarantee better information. These interventions will be illustrated in § 6.3 (promotion policy) and § 6.4 (quality policy).
The potential effects of the EC's biofuels and biomass action plan for potato operators will be presented in § 6.5, while in § 6.6 will be examined the implementation of the 2003 CAP reform in relation to its potential effect on the aggregate supply of potatoes in the EU.
The final paragraph (§ 6.7) will provide a summary of the main findings of this chapter.
6.1. EU phytosanitary measures and commercial standards
The EU’s food safety policy is the field of EU public intervention that most affects the trade of potatoes.
The main objective of EU plant health legislation is to protect the safety of food derived from plants and to secure the health and quality status of crops in all Member States. It also regulates the trade of plants and plant products within the EU as well as imports from the rest of the world in accordance with international plant health standards and obligations
The EU supervises the sale and use of plant protection products, or pesticides and sets standards to monitor and control pesticide residues. It implements preventative measures to guard against the introduction and spread of organisms harmful to plants or plant products within the EU.
It also ensures quality conditions for the sale of seeds and propagating material within the EU. Finally, the EU legislation also covers the intellectual property rights granted to plant varieties, as well as the conservation and use of genetic resources.
Normally, the EU Institutions intervene mainly through Directives but the use of Regulations is becoming more frequent. The EC has also set up the general legal framework for issues such as traceability and labelling, although specific provisions may be implemented on a product-by-product basis.

EN 83 EN
An important field of public interventions may also consist in commercial standards. These are normally divided into two subsets:
(i) standards on colours, tolerance for some impurities and minimum conditions to be satisfied (e.g. brix, size, in some cases conditions on virus infections and other diseases), content of some material. This subset of norms is still called in the UN/ECE terminology as “quality standards”;
(ii) products-specific norms on traceability, packaging, labelling,
We will deal with the main EU's measures in the field of the plant health legislation in the next three sub-paragraphs. Then in § 6.1.4 the recent entry into force of the so-called food law on traceability will be presented, while the general situation of commercial standards will be illustrated in § 6.1.5.
6.1.1. Directive on harmful organisms (Directive 2000/29/EC)
Phytosanitary regulations are of extreme importance for operators as they normally prevail on all the types of legal acts that concern trade. Phytosanitary measures on potatoes are laid down in the Community plant health Regime established by Council Directive 2000/29/EC. Its aim is to prevent the introduction into the community and spread within the EC of organisms harmful to plants and plant products.
The general principles of Directive 2000/29/EC are based upon provisions laid down in the International Plant Protection Convention (IPPC), in particular the International Standards on Phytosanitary Measures adopted by the relevant Standard setting body of the IPPC and those laid down in the Agreement on the Application of Sanitary and Phytosanitary Measures (WTO/SPS). Phytosanitary import measures have therefore to be in line with the above principles. At the conclusion of the Uruguay Round of Multilateral Trade Negotiations, the Agreement on the Application of Sanitary and Phytosanitary Measures stipulated that any such measure which conform to international standards, guidelines or recommendations shall be deemed to be necessary to protect human, animal or plant life or health. For plant health it was agreed that it refers to those standards, guidelines or recommendations which are developed under the auspices of the Secretariat of the IPPC.
The plant health regime governs imports as well as the trade within the Community of plants and plant products such as potatoes: particularly for seed potatoes technical phytosanitary provisions have to be met and control checks are to be carried out, such as visual inspections at the place of production at the most appropriate time, i.e. during the growing season and immediately after harvest. In some cases these checks are carried out prior to dispatch.
If the results of the checks are satisfactory, Community products will be given an agreed mark – called Plant Passport – in order to ensure free movement throughout the Community.
Plants or plant products coming from third countries must also be subjected to checks in the country of origin or the consignor country. If these checks are satisfactory, i.e. meeting the phytosanitary requirements of the importing country, a phytosanitary certificate is issued by the National Plant Protection Organisation of the exporting country and will accompany the plants or plant products. The model of this certificate and the procedure for issuing is given in the IPPC text and its relevant standards. On

EN 84 EN
arrival at the Community borders, checks (documentary, identity and phytosanitary) are carried out to verify that the plants or plant products are complying with the Community phytosanitary regulations.
If there is evidence that some plants or plant products imported from third countries comply with the Community plant health provisions, then the phytosanitary certificate will be replaced by a plant passport ensuring free movement in the same way as Community products. Such process is not applicable for imports of ware potatoes, although compliance with EU phytosanitary requirements is normally enough to ensure free circulation within the EU territory.
In practice, in the absence of a derogation, it is forbidden for phytosanitary reasons to import seed potatoes from all third countries except Switzerland. Such a derogation has been granted to seed potatoes originating in certain regions of Canada.
Trade of ware potatoes is normally only allowed with the EU’s Mediterranean partners (Algeria, Egypt, Israel, Libya, Morocco, Syria, Tunisia and Turkey), Switzerland and other than European third countries which are either recognised as being free from a disease called Potato ring rot caused by Clavibacter michiganensis ssp. Sepedonicus, or in which provisions recognised as equivalent to the Community provisions on combatting this disease have been complied with. Imports from other areas may be permitted under specific conditions laid down in a derogation.
It should be noted that potatoes originating in Egypt can be imported only via a strict control system laid down in Community emergency measures because of the risk of the introduction of another devastating disease, called “brown rot”, caused by Pseudomonas solanacearum.
Recently, a legislative proposal has been presented to Council aiming at revising and updating Council Directive 69/465/EEC on the control of potato cyst nematodes. The new provisions will be in line with other Directives on the control of harmful organisms of potatoes. A new element that is proposed deals with control measures before the planting of certain plants grown in rotation with potatoes. Harmonised testing for the presence of potato cyst nematodes through samples taken in fields before planting certain plants intended for the production of plants for planting is also a new aspect that is proposed. The future implementation of this proposal will further improve the phytosanitary standards of the EU potato production. Producers that are currently maintaining the land in optimal agricultural conditions, with regular rotations, should not incur substantial additional costs caused by the compliance with the new Directive.
Finally, it is worthwhile to mention that there is a growing need to harmonise phytosanitary export regimes among EU countries. An improved cooperation, if not united positions, between Member States on this front would permit more effective negotiations on phytosanitary matters.

EN 85 EN
6.1.2. Marketing of seed potatoes (Council Directive 2002/56/EC)
Marketing, including the production with a view to marketing, of seeds (and vegetatively propagated material) within the European Union has been subject to Council directives since the sixties.
The EU legislation provides for common standards for seed certification across the EU Member States, and ensures, in general, the free movement of certified seed. However, it should be noted that there is an important derogation to the principle of EU free marketing; Commission Decision 2004/3/EC concerning the five new Member States, in respect of marketing of seed potatoes in all or part of the territory, permits more stringent measures against certain diseases. Seed potatoes must belong to varieties listed in the Common catalogue of varieties of agricultural species, the common catalogue being based on the catalogues of the Member States (Council Directive 2002/53/EC).
Council Directive 2002/56/EC applies specifically to the marketing of seed potatoes and it aims to ensure the quality of Community seed potatoes by means of a uniform certification scheme for the Community. Marketing remains limited to what is certified and is subject to the respect of certain criteria notably regarding genetic, plant health (e.g. black leg, scab and viruses) and quality (size of tubers).
To verify compliance with the requirements and conditions of Directive 2002/56/EC, tests and trials made by the National Certification Authorities are carried out on the fields, on the harvested material and on the progeny. If the outcome of the official examinations is positive official labels are released for each package or container.
Council Directive 2002/56/EC, its implementing measures and its numerous amendments take into account the experiences gained within the Economic Commission for Europe of the United Nations (UN-ECE) with reference to management of the UN-ECE Standards for Seed Potatoes.
6.1.3. Community variety property rights (Council Regulation (EC) No 2100/94)
The system of Community variety property rights, established with Council Regulation 2100/94, permits to overcome a fragmented framework that obliged the national holder of a right to apply in other Member States where he/she wanted to commercialise his/her variety. Today, one application at EU level is enough and protection will be accepted across the whole EU territory42. The system is administered by the Community Plant Variety Office that ensures industrial property protection for eligible new varieties. This Office co-ordinates and controls the work of National Examination Offices.
There is a difference between protection and commercialisation. Some varieties may be certified and, therefore, commercialised without being protected. On the other hand, protection without certification hinders marketing possibilities.
There is a specific derogation to the general principles of the Community property rights. It concerns the so-called “farm saved seeds” system.
42 National variety property rights still exist in parallel with the Community variety property rights system.
Some breeders still do prefer to protect some of their new varieties in one or some Member States only.
EN 86 EN
Farm saved seed implies that farmers are authorised to use for propagating purposes in the field, on their own holding the product of the harvest which they have obtained by planting, on their own holding, propagating material of a variety which is covered by a Community plant variety right. In the framework of the upcoming Directive on potato cyst nematodes, it is proposed to continue the current exemption whereby official investigations will not be required before the planting of seed potatoes intended for the production of farm saved seed.
Small farmers using farm saved seeds shall not be required to pay any remuneration to the holder. Small potato farmers are considered as such when they do not grow potatoes on an area bigger than the area which would be needed to produce 185 tonnes of potatoes per harvest43.
Within the group of new MS, only Lithuania asked a general derogation to the general principles of the plant property rights scheme. As result, in that country, not only small, but also big farmers will be exempted from paying a royalty for a transitional period of seven years since their accession to the EU on 1 may 2004.
The EU has joined the International Union for the Protection of new Varieties of Plants (UPOV), an intergovernmental organisation with headquarters in Geneva, which provides the international legal framework for the application of plant breeders’ rights. Joining UPOV will ease the possibility that EU varieties can circulate in another UPOV-country but do not grant free circulation as it happens within the EU. Certification and protection procedures are controlled and implemented by each State
6.1.4. Food law: traceability
Regulation (EC) 178/2002 of the EP and of the Council is applicable since 1 January 2005 and contains general provisions for traceability which cover all food and feed, all food and feed business operators, without prejudice to existing legislation on specific sectors such as beef, fish, GMOs, etc. Unless specific provisions for further traceability exist, the requirement for traceability is limited to ensuring that businesses are at least able to identify the immediate supplier of the product in question and the immediate subsequent recipient, with the exemption of retailers to final consumers. Importers are similarly affected as they will be required to identify from whom the product was exported in the country of origin.
Many potato businesses, particularly packers and some producers' co-operatives, have put in place a traceability system before the deadline of 1 January 2005.
6.1.5. Commercial standards
The provisions on commercial standards can be of competence of:
• the Commission, as it is the case for some sectors regulated by a CMO, such as fruit and vegetables;
• Member States, that are obliged to notify their norms to the Commission;
43 According to the Council Regulations 2100/94 and Commission Regulation (EC) No 1768/95, in the case
of potatoes, small farmers are to be considered those who irrespective of the area on which they grow plants other than potatoes, do not grow potatoes on an area bigger than the area which would be needed to produce 185 tonnes of potatoes per harvest.

EN 87 EN
• United Nations, whose standards are often used by governments, producers, importers and exporters as well as other international organisations;
• finally, private operators can also establish a system of commercial norms.
As the potato sector is not covered by any CMO at EU level, international standards play a role in affecting intra-EU exchanges and also international trade. If EU's operators circumvent UN/ECE standards in their trade with third country agents or vice versa, complaints may arise that could generate a WTO panel.
In the EU, potato operators have also realised a framework for commercial standards that are in line with the UN/ECE standards. RUCIP rules regulate the intra-European trade in potatoes by setting up simple procedures for expert assessment and arbitration. The RUCIP system is subsidiary to specific contract conditions agreed by the two parties and includes an expertise and arbitration system. Its rules are mainly used in contracts signed between traders, but do not currently apply to the transactions involving producers. Europatat, the representative body of wholesalers/packers and Copa-Cogeca have set up a working group in order to studying the possibility to extend RUCIP rules to the contracts between producers and traders.
Potato producers are more and more subject to the respect of private quality assurance schemes created by the private sector. These schemes can cover issues such as food safety, environment protection, animal welfare and occupational health. As there are many quality assurance parameters and different schemes, an improved harmonisation will facilitate trade, generate cost-effectiveness and install higher consumer confidence (Freshfel, October 2005)44.
6.2. Tariffs and quotas
As we have seen in section 4, the EU trade balance is largely positive for all the main segments of the potato sectors but early potatoes. The segments of seed potatoes and processed potato products are characterised by a high competitiveness and the EU firms are leaders on the world markets.
As for main crop potatoes, we have seen in § 6.1.1 that imports from many important third countries are prohibited for phytosanitary reasons. The only segment in the table potatoes' sector that is directly exposed to the competition from third countries is that of early potatoes.
In general, Egypt, Israel, Morocco and some other EUROMED's countries benefit from some preferential margin in terms of tariff quotas and/or lower or zero (third countries) duties.
Besides, the application of the scheme of generalised tariff preferences (Council Regulation (EC) No 2501/2001) consists in a flat reduction of 3.5 percentage points of the most favoured nation (MFN) duty rate. This reduction is applied to imports from Egypt.
44 Freshfel, 2005, Freshfel called Europe for Harmonisation of Quality Assurance Schemes Within the
Fresh Produce Sector, Brussels, 21 October 2005

EN 88 EN
Third country duty for seed potatoes is set at 4.5%, while for main crop potatoes the level is 11.5% (table 6-1).
The third country duty for frozen potatoes (0710 10 00) and cooked frozen potatoes (2004 10 10) is 14.4%. In the case of processed frozen potatoes (0710 10), Egypt and Morocco are exempted from import duties if their exports do not overcome some quantitative limits. In 2005, the tariff quotas were set at 2000 tons for Egypt and 10 600 tons for Morocco. Morocco does not fill its quota.
Imports of processed potatoes in the form of flour, meal or flakes are currently subject to relatively low third country duties (7.6% for heading 2004 10 91 and 8.8% for heading 2005 20 10), plus specific duties that can vary depending from the content of sugar and flour contained in the product (table 6-1).
Table 6-1: Third country duties on potato products
Heading Product Third country duty (MFN)
07011000 Seed potatoes 4.5 %
07019050 Early potatoes
9.6 % from 1 January to 15 May (plus a
MFN tariff quota) - 13.4% from 16 May to
30 june07019090 Old potatoes 11.5 %
07101000 Potatoes, uncooked or cooked by steaming or by boiling in water, frozen 14.4 %
20052010 Potatoes in the form of flour, meal or flakes (exl. frozen)8.8 % + additonal
duties on sugar and flour contents
20052020 Potatoes in thin slices, cooked in fat or oil, for human consumption, not frozen 14.1 %
20052080Potatoes, prepared or preserved otherwide than by vinegar or acetic aid, not frozen (excluding in the form of flour, meal or flakes)
14.1 %
20041010 Cooked potatoes, frozen 14.4 %
20041091 Frozen potatoes, prepared or preserved in the form of flour, meal or flakes
7.6 % + additional duties on sugar and
flour contents
20041099Frozen potatoes, prepared or preserved otherwise than by viengar or acetic aid (excl. Cooked only in the form of flour, meal or flakes)
17.6 %
Imports of early potatoes originate mainly in Egypt, Israel, and, to an increasingly lesser extent, Morocco. As said, these countries benefit from preferential entry conditions by virtue of bilateral agreements. In the 2006 season, the preferential margins have been granted by the following conditions:
• Morocco: from 1/12 to 30/04, tariff reduction of 100% within a quota of 127 200 t, reduction of 40% of the out-of-quota (MFN duty) tariff (Commission Regulation (EC) No 37/2004);
EN 89 EN
• Egypt: from 1/01 to 31/03, reduction of 100% within a quota of 250 000 tons; reduction of the out-of-quota duty of 60%. From 01/04 to 30/06, exemption within a quota of 1 750 tons (Commission Regulation (EC) No 53/2004);
• Israel: from 01/01 to 30/06 reduction of 100% within a quota of 327 tons (Commission Regulation (EC) No 241/2005).
The tariff quotas of Morocco and Egypt have not been filled in 2006.
6.3. Promotion
Potato operators could profit from the EU actions on promotion aimed at positioning EU’s agriculture and agri-food industry to seize new market opportunities.
The EU policy for informational and promotional actions in agriculture have been established through Council regulation (EC) No 2826/2000 of 19 December 2000, covering actions on the internal market, and Council Regulation (EC) No 2702/1999 of 14 December 1999, that concerns actions implemented in third countries45.
Concretely, the European Community part-finances public relations, promotional or publicity actions, in particular, those that highlight the advantages of EU products, especially in terms of quality, hygiene, food safety, nutrition, labelling, animal welfare or environmental-friendliness of their production. Also covered are, participation at events and fairs, information campaigns on the EU system of protected designations of origin, protected geographical indications and traditional speciality guaranteed, information on EU quality and labelling systems and on organic farming.
The EU co-finances these measures by to an amount not exceeding 50%, the remainder being paid by the professional/inter-branch organisations that proposed them and by the Member States concerned. The EU can also finance certain specific measures (information on EU quality and labelling systems, campaigns on organic farming, high-level visits) at 100%.
The annual envelope foreseen for promotion programmes on the internal market and in third countries was approximately €50 million. In 2006, appropriations made available to the promotion-budget amounted to €42 million. Since 2002, over one third of this budget has been absorbed by actions for fruit and vegetables, under which potatoes are grouped.
Currently, specific projects targeting the potato sector are i) a three-year project for the promotion of early potatoes in Russia carried out by Italpatate with a total EU contribution of €615 811, ii) a one-year project in the Internal Market proposed by UNAPA, in association with the Italian “Associazione Nazionale Importatori Esportatori Ortofrutticoli e Agrumari” to which the EU destines almost €250 000, iii) a three year programme managed by INTERFEL and CNIPT46, for which the EU finances €1.04 mln.
45 Detailed rules for applying the promotion and information measures on the internal market and in third
countries are laid down respectively by Commission Regulation EC No 1071/2005 of 1 July 2005 and by Commission Regulation No 1346/2005 of 16 August.
46 Interprofessionnelle des Fruits et Légumes & Comité National Interprofessionnel de la Pomme de Terre.

EN 90 EN
The total amount of money spent in promoting the usage of EU’s potatoes is larger than what is provided by the EU. In those Member States where the chain is better organised, promotional activities are strong and effective. Various actions are carried out by non-departmental public bodies such as CNIPT in France, by the British Potato Council and by other organisations in Europe to advertise and promote potatoes at home and in export markets. Organising such campaigns for perishable fruits and vegetables is more difficult. Very often promotions for fruits and vegetables are set up just one week before the commercialisation, once figures on harvest and quality are certain.
More, these bodies fund research and development, transfer technology, collect and disseminate market information, try to improve the understanding of the business environment for potatoes by involving also the retail and food service supply chains. In other words, they aim at ensuring a common approach in order to achieve synergies from producers to commercial operators.
6.4. Quality policy
In 1992, the European Union created systems known as PDO (Protected Designation of Origin), PGI (Protected Geographical Indication) and TSG (Traditional Speciality Guaranteed) to promote and protect food products.
Acquiring the PDO/PGI and TSG registration does primarily produce a better definition of a product's specificity and enhances market opportunities. This is linked to the behaviour of European consumers which has been undergoing gradual change. Consumers now require not only much higher dietary, hygienic and health standards in the products they buy, but also look for certification and reassurance of products’ origins and production methods. ‘Quality’ has become the watchword. This heightened consumer awareness is reflected in the demand for products with individual characteristics, due to specific production methods, composition or origin.
The PDO/PGI and TSG systems provide a sort of protection as a given product can find itself in competition with products which pass themselves off as the genuine article and take the same or similar name. This unfair competition not only discourages producers but also misleads consumers.
Today, there are some classes of potatoes that are registered as PDO/PGI: "Patata Kato Nevrokopiu" (PGI - Greece), "Pomme de terre de Merville" (PGI - France), "Pomme de terre de l'Île de Ré" (PDO - France), Opperdoezer Ronde (PDO - Netherlands), Lapin Puikula (PDO - Finland), Jersey Royal potatoes (PDO - UK).
Other groups of potato producers in Europe would like to benefit from PDO/PGI in order to help consumers by giving them information concerning the specific character of the products and further differentiate the product itself from alternative low-quality stuff.
6.5. The EC biofuels and biomass action plans
The Commission adopted in December 2005 a detailed action plan designed to increase the use of energy from forestry, agriculture and waste materials. This plan aims to reduce Europe’s dependence on imported energy, cut greenhouse gas emissions, protect jobs in rural areas and extend the EU’s technological leadership in
EN 91 EN
these sectors. The measures in favour of transport biofuels, in particular, are a practical response to reach a relative independence from energy imports as well as environmental (Kyoto Protocol) and rural development objectives.
Amongst different biofuel pathways available, producing bioethanol from agriculture-derived feedstock appears to be the most feasible, ready-to-market option. Ethanol fermented from renewable sources for fuel or fuel additives are known as bio-ethanol. Additionally, the ethanol from biomass-based waste materials is considered as bio-ethanol.
Feedstock suitable for use in ethanol production via fermentation can be classified roughly into three groups: those containing predominantly sugars (sugar beets, sugar cane, sweet sorghum, ripe fruits), starches (grains, potatoes, Jerusalem artichokes), or cellulose (stover, grasses, wood).
The first and most efficient world producer of bioethanol is Brazil, where it is mainly obtained via fermented cane sugar, the second one is the US, where fermentation is mainly based on corn. In the EU, bioethanol is currently produced from wheat, maize, barley and sugar beet. A limited quantity of residual ethanol is also derived from wine production, requiring high level of subsidies to be competitive. The potential of other biomass feedstocks such as straw and wood will be exploited too, but technology is less advanced than for traditional agricultural products. Thus, a significant contribution of new raw material is not expected before 2020.
The number of studies on the cost of ethanol production from different feedstocks has remarkably grown in the last years. It is generally pointed out that, under the available set of technologies, potatoes do not offer the best opportunities. Production from sugar beets has a certain advantage when compared to production from cereals, while potatoes are the most expensive traits. However, the sugar beet’s advantage decreases with increasing capacity of the processing unit. Moreover, taking into account possible opportunities to sell by-products to the animal feed industry, changes the relative competitiveness in favour of cereals. About 40 % of cereals volume used for ethanol production could be marketed as feedstuff. Corn gluten feed pellets form US ethanol production are imported into the EU. Usable quantities of sugar beet by-products are less than from cereals.
A study covering the feedstock potentials of wheat and potatoes in UK (S. Millar, M. Mason, S. Bell, 2005, Comparative Costs and Returns from Biofuels in Small-scale Heat and Power and Heat-only Systems, DARD, p. 122)47 shows that an advantage of using cereals is their high dry matter content (around 85%), lower costs of transport and long term storage (important for continuity of supply)48.
47 This study is part of a wider research whose results (and the consultation document resulting from it) can
be found at www.dardni.gov.uk/consultations (the 8th consultation listed -'Recommendations to DARD for a Renewable Energy Policy').
48 In the cited study on UK (p. 122), it is shown that one tonne of wheat produces around 670 kg fermentable sugar while one tonne of potatoes yields around 180 kg fermentable sugar due to the low dry matter content of potatoes. Wheat is capable of producing 2.6-3.2 t ethanol/ha and it is estimated that ethanol could be produced from wheat at a price of 29 p/litre. No such comparable costs are available for potatoes (Turley and Ceddia, (2003)). The rates of ethanol production per unit area of crop are very similar for wheat and potato crops, which makes potatoes an expensive source of ethanol.

EN 92 EN
To sum up, if sugar and wheat appears to have a big potential for ethanol production, potatoes, the other major starch-bearing crop, incur greater costs in comparison and, under current technological conditions, is therefore unlikely to succeed.
The interest on biofuels can have an indirect impact on potato markets. A rising number of farmers have declared their willingness to convert plantings of arable crops into unities for producing biofuels. Such a passage could imply diminishing or stagnating plantings of potatoes and, as such, could have an impact on the EU markets of table and processed potatoes.
6.6. CAP direct payments
The 2003 CAP reform has completely changed the way the EU supports its farm sector with the introduction of the Single Farm Payment (SFP). From 2005 the vast majority of subsidies is not conditional anymore on production of any specific product and is paid independently from the volume of production. The "single farm payments" will be linked to the respect of environmental, food safety and animal welfare standards.
Member States can decide to apply the SFP in its standard form, according to which farmers can have access to the single payment scheme if they do not use their agricultural land to produce permanent crops, other fruit and vegetables, and potatoes49.
Alternatively, MS could implement the SFP by using the regionalisation option (Article 59 of Regulation (CE) No 1782/2003). Under the regionalised model, MS will apply a specific derogation (hereinafter Fruit, Vegetables and Potatoes or FVP derogation) to the prohibition on cultivating fruits and vegetables, other than permanent crops, and ware potatoes50 in order to avoid that in case of regionalisation this does not lead to a disruption of the production whilst minimising any effect on distortion of competition.
Up to now, Denmark, Finland, Germany, Luxembourg, Sweden, England and Northern Ireland have opted for the regionalisation model; in UK, authorities of Wales and Scotland have chosen the standard SFP model. The modalities of regionalisation may change from one MS to another.
To claim the SFP on every hectare of FVP requires an ‘authorisation’ to do so. There is a FVP national limit on which SFP claims can be made and this is based on the total
49 In Article 51 of Regulation (EC) No 1782/2003 it is stated that: “Farmers may use the parcels declared
according to Article 44(3) for any agricultural activity except for permanent crops and except for the production of the products referred to in Article 1(2) of Council Regulation (EC) No 2200/96 of 28 October 1996 on the common organisation of the market in fruit and vegetables, in Article 1(2) of Council Regulation (EC) No 2201/96 of 28 October 1996 on the common organisation of the markets in processed fruit and vegetable products and potatoes other than those intended for the manufacture of potato starch for which aid is granted under Article 93 of this Regulation”.
50 In Article 60(1) of Regulation (EC) No 1782/2003, it is stated that “Where a Member State makes use of the option provided for in Article 59, farmers may, by way of derogation from Article 51 and in accordance with the provisions of this Article, also use the parcels declared according to Article 44(3) for the production of products referred to in Article 1(2) of Regulation (EC) No 2200/96, in Article 1(2) of Regulation (EC) No 2201/96 and potatoes other than those intended for the manufacture of potato starch for which aid is granted under Article 93 of this Regulation, except permanent crops.”

EN 93 EN
area grown within a region during the average of the years 2000, 2001 and 2002. MS involved in the regionalisation schemes have notified the Commission the FVP area during the reference period 2000/2002 in order to fix the ceiling for "payment entitlements with F&V authorisations" (tables 6-2).
Overall, the potato area notified by these MS is about 390 000 hectares corresponding to almost 32% of EU-15 and 17% of EU-25 potato area. This surface is eligible for the regionalised form of the SFP payment, while producers of other countries that have opted for the “historic” model cannot activate the Single Payment on the land area used to produce potatoes.
Table 6-2: Horticultural and potato area grown in the countries that will adopt the regionalisation option (average 2000/02; thousand ha)
2000 2001 2002 AveragePotatoes 126800 126000 119300 124000Vegetables 107400 108900 113100 109800Small Fruit 6500 6700 6600 6600Glasshouse andplastic coveredstructures 900 800 800 800Total 241600 242400 239800 241200Of which areallocated
To Region MoorlandSDA (hectares)*Total - - - 10To Region UplandSDA (hectares) * 190Total - - - 190
Table 6.2a: Fruits, Vegetables and Potatoes' area notified byEngland
10
The Census does not distinguish between production in the three English regions which have been defined for the purpose of the Single Payment Scheme, but production of the relevant products in the two regions which form part of the Severely Disadvantaged Area is very limited. The United Kingdom proposes therefore to allocate 10 ha of authorisations to the Moorland SDA region and 190 ha to the upland SDA region, leaving 241,000 ha of allocations to be allocated to the non-SDA English region.
Source: June Agricultural & Horticultural CensusJanuary Surveys of Vegetables and Flowers
2000 2001 2002 AveragePotatoes 6.772 6.662 6.708 6.714
Vegetables 1.498 1.507 1.507 1.504Small Fruit 63 30 29 41
Glasshouse and plastic covered
structures44 43 50 46
Total 8.377 8.242 8.294 8.304
Table 6.2b: FVP area notified by Northern Ireland
Source: N. Ireland Agricultural Census

EN 94 EN
2000 2001 2002 AverageArticle 60 (2) of 1782/03 - Fruit and vegetables incl. other potatoes than starch potatoes
34.753 33.892 32.577 33.740
Source: not mentioned
Table 6.2 c: FVP area notified by Denmark
Region 1 Region 2 Region 3 Region 4 Region 5 Total national
Peas 3.601 2.819 2.304 185 0 8.909Table
Potatoes 3.180 4.084 9.787 3.001 3.102 23.154
Fruit & Vegetables 2.275 1.481 4.766 898 823 10.243
Totals 9.056 8.384 16.857 4.084 3.925 42.306
Peas 3.605 2.725 2.369 164 0 8.863Table
Potatoes 3.338 4.195 9.921 3.107 3.231 23.792
Fruit & Vegetables 2.275 1.481 4.766 898 823 10.243
Totals 9.218 8.401 17.056 4.169 4.054 42.898
Peas 3.744 2.629 2.024 129 0 8.526Table
Potatoes 3.149 4.159 9.698 3.190 3.433 23.629
Fruit & Vegetables 2.275 1.481 4.766 898 823 10.243
Totals 9.168 8.269 16.488 4.217 4.256 42.398
Regional averages 9.193 8.375 17.448 4.155 4.059 43.230
2000
Table 6.2d: FVP area notified by Sweden
2002
2001
Program (area and environmental aid programs) as well as on information gathered through surveys.
2000/02
Source: Information based on official statistics and from applications for the SAM
Table potatoes
Potato Plants
Fruits&Veg. -Open air
Fruits&Veg. - Under Glass Totals
2000 272,07 514,36 11,64 0,31 798,382001 225,97 458,68 14,15 0,38 699,182002 217,31 381,8 15,67 0,86 615,64
Average 238,45 451,61 13,82 0,52 704,4
Since this information is also used for social security calculations, farmers not receiving any aid are also included.
Table 6.2e: FVP area notified by Luxembourg
Source: Based on declarations of surfaces in the context of IACS.

EN 95 EN
Fruit & Vegetables1 Bushberries2 All
potatoes3Starch
Potatoes4 Totals5
Yr 1994BadenWürttemberg 10.045 775 7.522 20 18.322Bayern 14.187 141 52.328 16.204 50.451Brandenburg&Berlin 6.058 119 12.554 5.821 12.910Hessen 7.146 121 4.933 0 12.200Mecklenburg-Vorpommern 1.961 211 15.881 4.158 13.895
Niedersachsen&Bremen 15.814 951 124.575 64.994 76.347
Nordrhein-Westfalen 19.620 162 30.985 0 50.767Rheinland-Pfalz 10.336 82 9.315 0 19.733Saarland 166 1 202 0 369Sachsen 4.887 159 8.376 832 12.590Sachsen-Anhalt 4.450 29 14.573 4.158 14.893Schleswig-Holstein & Hamburg 8.465 107 5.882 0 14.453
Thüringen 1.822 35 3.062 0 4.919Totals Germany 104.956 2.893 290.186 96.187 301.848 ha
4 Estimation based on data from the Regions as well as from the potato starch industry5 Totals are calculated by adding up all categories and reducing the starch potatoes
Table 6.2f: FVP area notified by Germany
1 Official statistics of area usage (2000 – 2002)2 Result of a horticulture survey in 1994 (most recent)3 Official statistics of area usage (2000 – 2002)
The reshuffling brought about by the general shift towards payments that are completely decoupled from planting decisions together with the application of regionalisation in some areas may affect farmers’ preferences on what to produce. In order to monitor the effects of the 2003 CAP reform, Council Regulation (EC) No 1782/2003 provides for several reports to be made by the Commission regarding the actual impact of the reforms on agricultural markets and structures. The Commission is carefully monitoring the development of agricultural markets and structures and will propose in due time any adjustment of the rules that would be needed to avoid any identified risk of disturbances.
In particular, by at the latest 2007, the Commission will have to submit a report to the Council, accompanied, if necessary, by appropriate proposals, on the possible consequences, in terms of market and structural developments, of the implementation by Member States of the regionalised option (Reg (EC) No 1782/2003, art. 60, § 8).
It is to note that the hectares cultivated under potato that could benefit from a CAP subsidy could be more than the 390 000 hectares mentioned above. Since 2004, the new Member States have the option of granting direct payments during a limited period in the form of a de-coupled area payment applied to the whole agricultural area. All types of agricultural land (defined as utilised agricultural area) would be eligible for the payment. There would be no obligation to produce. However, land should be maintained in a manner compatible with the protection of the environment.
On November 2005, EU's agriculture ministers reached political agreement on a wide-ranging reform of the Common Market Organisation for sugar, based on the proposal
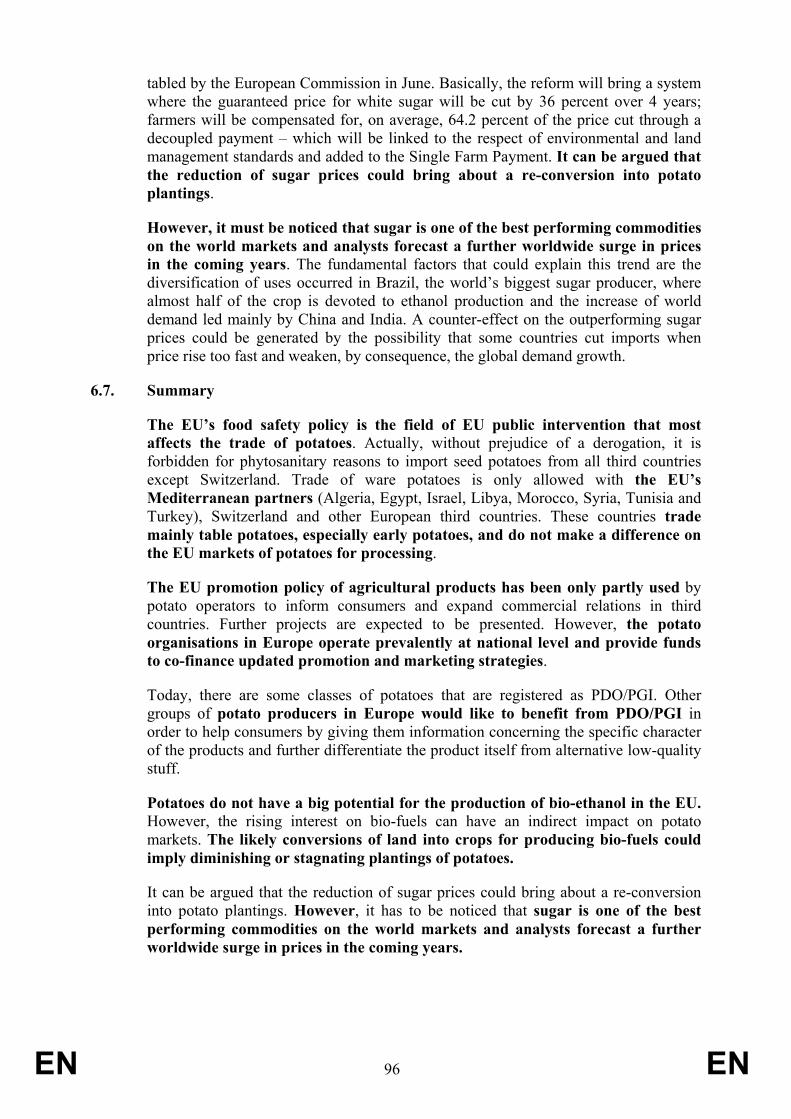
EN 96 EN
tabled by the European Commission in June. Basically, the reform will bring a system where the guaranteed price for white sugar will be cut by 36 percent over 4 years; farmers will be compensated for, on average, 64.2 percent of the price cut through a decoupled payment – which will be linked to the respect of environmental and land management standards and added to the Single Farm Payment. It can be argued that the reduction of sugar prices could bring about a re-conversion into potato plantings.
However, it must be noticed that sugar is one of the best performing commodities on the world markets and analysts forecast a further worldwide surge in prices in the coming years. The fundamental factors that could explain this trend are the diversification of uses occurred in Brazil, the world’s biggest sugar producer, where almost half of the crop is devoted to ethanol production and the increase of world demand led mainly by China and India. A counter-effect on the outperforming sugar prices could be generated by the possibility that some countries cut imports when price rise too fast and weaken, by consequence, the global demand growth.
6.7. Summary
The EU’s food safety policy is the field of EU public intervention that most affects the trade of potatoes. Actually, without prejudice of a derogation, it is forbidden for phytosanitary reasons to import seed potatoes from all third countries except Switzerland. Trade of ware potatoes is only allowed with the EU’s Mediterranean partners (Algeria, Egypt, Israel, Libya, Morocco, Syria, Tunisia and Turkey), Switzerland and other European third countries. These countries trade mainly table potatoes, especially early potatoes, and do not make a difference on the EU markets of potatoes for processing.
The EU promotion policy of agricultural products has been only partly used by potato operators to inform consumers and expand commercial relations in third countries. Further projects are expected to be presented. However, the potato organisations in Europe operate prevalently at national level and provide funds to co-finance updated promotion and marketing strategies.
Today, there are some classes of potatoes that are registered as PDO/PGI. Other groups of potato producers in Europe would like to benefit from PDO/PGI in order to help consumers by giving them information concerning the specific character of the products and further differentiate the product itself from alternative low-quality stuff.
Potatoes do not have a big potential for the production of bio-ethanol in the EU. However, the rising interest on bio-fuels can have an indirect impact on potato markets. The likely conversions of land into crops for producing bio-fuels could imply diminishing or stagnating plantings of potatoes.
It can be argued that the reduction of sugar prices could bring about a re-conversion into potato plantings. However, it has to be noticed that sugar is one of the best performing commodities on the world markets and analysts forecast a further worldwide surge in prices in the coming years.

EN 97 EN
APPENDIX A
This is the statistical annex to Section 2.
It contains data by country and at EU level on production, surfaces and yields.

EN 98 EN
Table A-1: World production of potatoes (metric tons) [1990–2005]
1990/92 1997 1998 1999 2000 2001 2002 2003 2004 2005Rate of
variation from 2001/04 to 2005
annual variation rate (from 1990-92 to 2003-05)
Shares in world production (2005)
World 266286791 302574711 300356210 300625317 328642541 312269078 321684520 318287450 328865936 321974152 0,5 1,4 100,0Developed Countries 185003069 180354817 174583246 172601640 188707329 174814287 171707442 170438814 178170905 170003544 -2,2 -0,5 52,8European Union (25) 78633295 73071524 73491649 72468875 80000253 69829987 68046210 60499598 67426116 59605504 -10,3 -1,6 18,5 European Union (15) 48818445 48626329 43689513 49259640 49661006 45781570 47331079 42283089 47387551 -0,6 Developing Countries 81283722 122219894 125772964 128023677 139935212 137454791 149977078 147848636 150695031 151970608 3,7 4,5 47,2 Africa 7701731 9463879 10614534 11694296 12420625 13856201 12319699 13128015 13738833 15393900 16,1 4,4 4,8 Africa South of Sahara 2465335 3453969 4386362 5615858 6278334 7644204 5705414 5777480 6439105 7169840 12,2 7,1 2,2North Africa 5236396 6009910 6228172 6078438 6142291 6211997 6614285 7350535 7299728 8224060 19,7 2,7 2,6 Least Developed Countries 4656413 6098755 6662734 8428908 9694076 11099137 9302585 9990408 11179852 11912080 14,6 6,4 3,7 Near East 10559094 12588863 13302356 14093463 13446179 13030356 14094772 13482927 12999010 13686402 2,1 1,7 4,3 Argentina 1658859 3011328 3412395 2700000 2438029 2504702 2132504 2150000 2150000 2021020 -9,5 1,7 0,6 Bangladesh 1227268 1507860 1553180 2762000 2933000 3216000 2994000 3386000 3908000 3908000 15,8 8,3 1,2 Brazil 2310943 2670490 2784181 2904950 2561320 2848620 3126410 3047000 2883420 2950990 -0,9 1,8 0,9 Bulgaria 498860 463247 478347 566359 397532 600371 627273 630000 600000 580000 -5,6 1,4 0,2 Canada 3147058 4171000 4329000 4268000 4567330 4220430 4696610 5324330 5000000 4850000 0,8 3,4 1,5 China 33432833 57259986 64618163 56141097 66325167 64596119 75268331 72066264 75048000 73776500 2,8 5,8 22,9 Colombia 2372583 2716997 2547213 2775230 2882940 2873870 2834820 2872284 2959380 2623194 -9,1 1,2 0,8 Egypt 1680838 1802761 1984013 1808890 1769910 1903134 1985317 2039351 1950000 2500000 26,9 1,8 0,8 India 15454767 24215900 17648100 23610700 24713200 22488400 24450000 25000000 25000000 25000000 3,2 3,5 7,8 Iran 2611993 3284106 3430407 3433109 3658035 3485814 3756000 3550000 3600000 4200000 16,7 2,7 1,3 Japan 3551667 3395000 3073000 2963000 2898000 2959000 3074000 2320000 2500000 2900000 6,9 -2,3 0,9 Kazakhstan 2569700 1472190 1262850 1694700 1692600 2184800 2268800 2308300 2300000 2300000 1,5 -0,8 0,7 Peru 1203540 2398060 2589338 3066240 3273820 2681825 3297997 3151355 2346457 3200000 11,5 6,5 1,0 Romania 2553346 3206058 3319150 3957100 3469800 3997057 4077633 3947177 4047351 3985000 -0,8 3,2 1,2 Russia 38329660 37039712 31418370 31343850 33979460 34965160 32870840 36746512 37000000 36400000 2,8 -0,3 11,3 Turkey 4500000 5100000 5250000 6000000 5370000 5000000 5200000 5300000 4800000 4170000 -17,8 0,4 1,3 Ukraine 20276816 16700800 15405000 12723000 19838100 17344000 16619500 18453000 19450000 19300000 7,4 -0,4 6,0 United States of America 18825339 21116000 21580600 21691500 23297460 19862270 20856270 20766100 20419280 19111030 -6,7 0,5 5,9Source: FAO data - DG Agri elaborations

EN 99 EN
Table A-2: World area under potatoes (hectares) [1990–2005]
1990/92 1997 1998 1999 2000 2001 2002 2003 2004 2005Rate of
variation from 2001/04 to
2005
annual variation rate (from 1990-92
to 2003-05)
Shares in world
production (2005)
World 17812136 18694665 18794475 19620491 20027821 19615899 19061657 18941999 19132110 18652381 -2,8 0,4 100,0 Developed Countries 11394464 10670870 10439478 10458992 10480856 10191494 9671902 9550689 9595380 9149201 -6,2 -1,3 49,1European Union (25) 3621061 3058165 2949040 2980771 2948557 2799935 2382997 2292388 2366050 2031393 -17,4 -3,4 10,9 European Union (15) 1724565 1394866 1313224 1403828 1346191 1294421 1289971 1246590 1267409 -2,2 Developing Countries 6417671 8023795 8354997 9161499 9546965 9424405 9389755 9391310 9536730 9503180 0,7 2,8 50,9 Africa 726116 842131 884466 1002012 1108263 1174123 1105919 1141779 1153165 1355195 18,5 3,8 7,3 Africa South of Sahara 379068 53099 583205 715534 816233 879817 802739 812764 82281 1012195 57,1 3,8 5,4North Africa 347048 789032 301261 286478 292030 294306 303180 329015 1070884 343000 -31,3 3,7 1,8 Least Developed Countries 555425 695697 733832 879073 986397 1042687 920333 944105 979739 1165464 19,9 4,5 6,2 Near East 540958 596736 603402 613081 594439 595084 613820 605497 613320 617921 1,8 0,9 3,3 Argentina 81906 112153 116169 113000 92000 88000 83000 85000 85000 70000 -17,9 -0,2 0,4 Bangladesh 122741 133971 136277 244837 243219 248988 237600 245242 270730 270730 8,0 5,6 1,5 Brazil 164379 174830 177972 176481 150475 153974 161124 147428 138364 135520 -9,8 -1,1 0,7 Bulgaria 43874 44314 50866 52211 52820 48448 51886 52000 52000 52000 1,8 1,2 0,3 Canada 120743 152100 156376 156619 159240 166650 170900 180490 170000 165000 -4,1 2,6 0,9 China 2902277 3824914 4064030 4420703 4725366 4720527 4669167 4528764 4601850 4401500 -4,9 3,2 23,6 Colombia 153110 166765 164759 171713 170719 172439 163841 164088 167919 152936 -8,5 0,4 0,8 Egypt 81784 82561 88849 77663 75018 79716 85000 85000 85000 100000 19,5 0,7 0,5 India 968633 1249000 1206000 1320500 1340000 1221900 1250000 1370000 1400000 1400000 6,8 2,6 7,5 Iran 152396 157811 162700 164032 168862 174562 166000 180000 185000 195000 10,6 1,5 1,0 Japan 113000 103000 99900 97700 94600 93000 92000 85000 90000 88000 -2,2 -1,8 0,5 Kazakhstan 242600 175260 164000 156300 159100 164000 162500 166500 166000 165000 0,2 -2,7 0,9 Peru 154801 248546 268847 272405 284671 234242 270893 258017 260000 265000 3,6 3,8 1,4 Romania 247730 255000 258700 272986 282700 276700 283200 281868 280000 285000 1,6 0,9 1,5 Russia 3389400 3325120 3235600 3226700 3229060 3216200 3198110 3171990 3150000 3140000 -1,4 -0,5 16,8 Turkey 137825 211000 203000 220000 205000 200000 198000 200000 200000 160000 -19,8 2,2 0,9 Ukraine 1705287 1577400 1513200 1551100 1629000 1604000 1592000 1587000 1600000 1514000 -5,1 -0,6 8,1 United States of America 547700 544000 561600 539210 545520 494610 514080 505300 472720 438810 -11,7 -1,1 2,4Source: FAO data - DG Agri elaborations
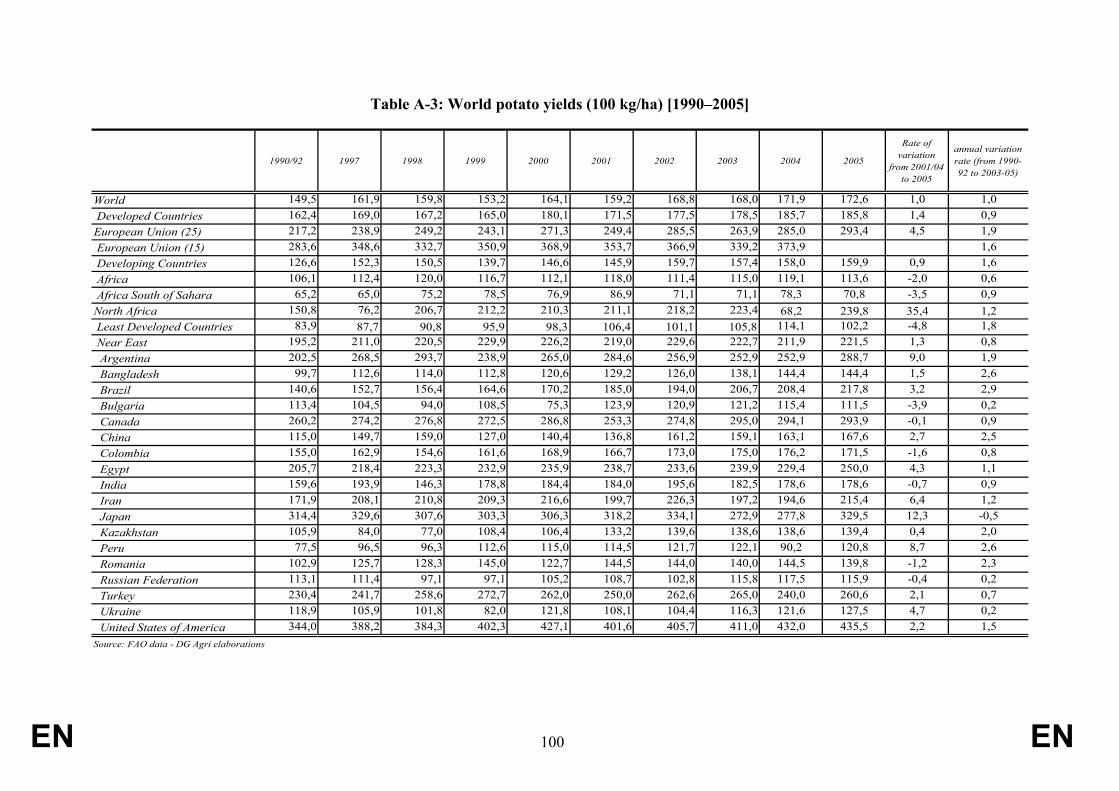
EN 100 EN
Table A-3: World potato yields (100 kg/ha) [1990–2005]
1990/92 1997 1998 1999 2000 2001 2002 2003 2004 2005
Rate of variation
from 2001/04 to 2005
annual variation rate (from 1990-92 to 2003-05)
World 149,5 161,9 159,8 153,2 164,1 159,2 168,8 168,0 171,9 172,6 1,0 1,0 Developed Countries 162,4 169,0 167,2 165,0 180,1 171,5 177,5 178,5 185,7 185,8 1,4 0,9European Union (25) 217,2 238,9 249,2 243,1 271,3 249,4 285,5 263,9 285,0 293,4 4,5 1,9 European Union (15) 283,6 348,6 332,7 350,9 368,9 353,7 366,9 339,2 373,9 1,6 Developing Countries 126,6 152,3 150,5 139,7 146,6 145,9 159,7 157,4 158,0 159,9 0,9 1,6 Africa 106,1 112,4 120,0 116,7 112,1 118,0 111,4 115,0 119,1 113,6 -2,0 0,6 Africa South of Sahara 65,2 65,0 75,2 78,5 76,9 86,9 71,1 71,1 78,3 70,8 -3,5 0,9North Africa 150,8 76,2 206,7 212,2 210,3 211,1 218,2 223,4 68,2 239,8 35,4 1,2 Least Developed Countries 83,9 87,7 90,8 95,9 98,3 106,4 101,1 105,8 114,1 102,2 -4,8 1,8 Near East 195,2 211,0 220,5 229,9 226,2 219,0 229,6 222,7 211,9 221,5 1,3 0,8 Argentina 202,5 268,5 293,7 238,9 265,0 284,6 256,9 252,9 252,9 288,7 9,0 1,9 Bangladesh 99,7 112,6 114,0 112,8 120,6 129,2 126,0 138,1 144,4 144,4 1,5 2,6 Brazil 140,6 152,7 156,4 164,6 170,2 185,0 194,0 206,7 208,4 217,8 3,2 2,9 Bulgaria 113,4 104,5 94,0 108,5 75,3 123,9 120,9 121,2 115,4 111,5 -3,9 0,2 Canada 260,2 274,2 276,8 272,5 286,8 253,3 274,8 295,0 294,1 293,9 -0,1 0,9 China 115,0 149,7 159,0 127,0 140,4 136,8 161,2 159,1 163,1 167,6 2,7 2,5 Colombia 155,0 162,9 154,6 161,6 168,9 166,7 173,0 175,0 176,2 171,5 -1,6 0,8 Egypt 205,7 218,4 223,3 232,9 235,9 238,7 233,6 239,9 229,4 250,0 4,3 1,1 India 159,6 193,9 146,3 178,8 184,4 184,0 195,6 182,5 178,6 178,6 -0,7 0,9 Iran 171,9 208,1 210,8 209,3 216,6 199,7 226,3 197,2 194,6 215,4 6,4 1,2 Japan 314,4 329,6 307,6 303,3 306,3 318,2 334,1 272,9 277,8 329,5 12,3 -0,5 Kazakhstan 105,9 84,0 77,0 108,4 106,4 133,2 139,6 138,6 138,6 139,4 0,4 2,0 Peru 77,5 96,5 96,3 112,6 115,0 114,5 121,7 122,1 90,2 120,8 8,7 2,6 Romania 102,9 125,7 128,3 145,0 122,7 144,5 144,0 140,0 144,5 139,8 -1,2 2,3 Russian Federation 113,1 111,4 97,1 97,1 105,2 108,7 102,8 115,8 117,5 115,9 -0,4 0,2 Turkey 230,4 241,7 258,6 272,7 262,0 250,0 262,6 265,0 240,0 260,6 2,1 0,7 Ukraine 118,9 105,9 101,8 82,0 121,8 108,1 104,4 116,3 121,6 127,5 4,7 0,2 United States of America 344,0 388,2 384,3 402,3 427,1 401,6 405,7 411,0 432,0 435,5 2,2 1,5Source: FAO data - DG Agri elaborations

EN 101 EN
Table A-4: Production of ware and seed potatoes in the Member States of the EU (1 000 tons)
1990/92 1994/95 2000 2001 2002 2003 2004 2005 2006 (prov.)
Rate of variation
from 2001/04 to
2005
annual rate of variation from
1990-92 to 2003-05
annual rate of variation from
1994-95 to 2004-05
Shares in EU25
production (2005)
EU 25 78824,1 65042,7 70251,8 59097,4 58514,2 50219,4 58297,2 48348,0 -14,5% -2,9% -1,1% 100,0%EU 15 41785,7 35101,8 40513,8 36068,0 38845,7 33347,2 41397,6 34951,1 -6,6% -0,9% 0,6% 72,3%New Member States 37038,3 29940,9 29738,0 23029,4 19668,5 16872,2 16899,5 13396,9 -29,9% -5,9% -4,5% 27,7%Belgium 2158,7 1889,4 2921,9 2564,3 2909,0 2522,1 3229,6 2780,8 -0,9% 2,0% 1,8% 5,8%Czech Republic 1922,5 1280,6 1396,0 979,5 769,8 507,5 762,6 865,1 480,8 14,6% -6,9% -2,0% 1,8%Denmark 632,6 575,2 843,3 716,9 716,7 653,0 907,5 732,3 -2,2% 1,4% 1,5% 1,5%Germany 9514,5 7223,4 10214,6 8279,7 8257,2 7007,1 10758,6 8483,4 -1,1% -0,6% 1,7% 17,5%Estonia 626,4 550,2 470,7 342,1 210,5 244,0 165,6 209,8 264,0 -12,8% -7,6% -6,5% 0,4%Greece 1001,0 0,0 880,0 870,0 875,0 850,0 864,0 849,9 -1,7% -1,1% -0,2% 1,8%Spain 5205,8 3886,7 3078,0 2991,4 3077,9 2664,6 2772,8 2603,0 -9,5% -4,6% -1,2% 5,4%France 4562,0 4197,3 5083,3 4678,9 5870,7 5193,9 5990,8 5300,7 -2,4% 1,3% 2,1% 11,0%Ireland 604,7 630,0 454,8 477,6 518,6 488,2 552,2 500,0 -1,8% -1,2% 1,1% 1,0%Italy 2309,9 2058,0 2067,5 1971,3 1855,3 1610,4 1821,5 1753,5 -3,4% -2,0% -1,1% 3,6%Cyprus 187,0 184,5 117,0 121,0 148,5 130,0 99,3 132,5 6,3% -3,1% -0,5% 0,3%Latvia 1042,5 954,3 727,1 584,3 750,4 720,0 600,4 630,4 417,0 -5,0% -3,3% 0,6% 1,3%Lithuania 1386,9 1345,0 1786,6 1037,4 1529,3 1293,5 886,4 778,7 408,8 -34,4% -2,4% -2,4% 1,6%Luxembourg 23,8 21,6 27,9 22,8 20,1 18,3 22,2 19,3 19,3 -7,3% -1,2% -1,0% 0,0%Hungary 1219,0 1022,5 863,5 908,4 752,2 582,3 783,7 657,3 564,2 -13,1% -4,1% -2,5% 1,4%Malta 27,4 26,0 29,7 25,3 27,6 23,3 28,6 25,0 -4,6% -0,5% 0,6% 0,1%Netherlands 4746,8 4597,4 5864,7 4590,6 5335,8 4386,7 5699,7 4350,3 -13,0% 0,1% 1,0% 9,0%Austria 745,9 631,1 492,5 464,9 470,5 360,2 543,5 559,2 369,0 21,6% -3,0% 1,9% 1,2%Poland 29579,5 23974,4 23742,4 18563,9 14833,9 12875,5 13019,7 9652,3 -34,9% -6,3% -5,3% 20,0%Portugal 1444,3 1381,5 742,6 694,1 781,3 735,8 769,8 518,7 -4,5% 1,2% 0,0%Slovenia 345,2 183,2 186,2 148,3 166,0 107,6 171,5 144,7 176,0 -2,4% -6,2% 0,7% 0,3%Slovakia 701,9 420,3 418,8 319,3 480,3 388,4 381,9 301,2 346,0 -23,3% -4,7% 0,8% 0,6%Finland 693,9 712,3 545,3 465,8 534,6 348,8 428,6 529,6 442,5 19,2% -3,3% 0,3% 1,1%Sweden 966,0 824,9 712,6 630,8 656,3 589,7 720,4 660,6 1,7% -2,7% 1,0% 1,4%United Kingdom 6905,0 6473,0 6585,0 6649,1 6966,5 5918,2 6316,5 5815,4 -10,0% -1,0% -1,0% 12,0%Bulgaria 499,0 573,0 367,5 577,4 592,3 410,2 534,2 340,5 -35,6% -1,1% -3,0% 0,7%Croatia 583,0 627,5 553,7 670,2 736,2 375,1 -3,1%Romania 2553,3 2983,3 3469,8 3997,0 4077,6 3947,2 4230,2 3713,4 3508,0 -8,6% 3,2% -0,1% 7,7%Turkey 5370,0 5000,0 5200,0 5300,0 4800,0 4090,0 -19,4% -1,3% 8,5%Source: Eurostat - DG Agri elaborations

EN 102 EN
Table A-5: Area cultivated under potatoes in the Member States of the EU (1000 ha)
1990/92 1994/95 1999 2000 2001 2002 2003 2004 2005 2006 (prov.)
Rate of variation
from 2002/05 to 2006
annual rate of variation from
1990-92 to 2003-05
annual rate of variation from
1994-95 to 2004-05
Shares in EU25 area (2005)
EU 25 3983,3 3495,6 3011,4 2918,9 2695,9 2329,7 2226,3 2182,7 1972,1 : -4,4% -5,1% 100,0%EU 15 1713,6 1453,0 1367,6 1316,6 1192,9 1244,4 1197,9 1230,8 1166,4 : -2,5% -1,9% 59,1%New Member States 2269,7 2042,6 1643,9 1602,3 1502,9 1085,3 1028,4 952,0 805,6 : -6,2% -8,1% 40,9%Belgium 57,5 53,7 66,6 65,8 62,2 61,7 59,3 66,7 65,0 66,8 5,8 0,7% 2,1% 3,3%Czech Republic 111,7 77,5 71,5 69,2 54,1 38,3 36,0 36,0 36,0 30,0 -18,0 -7,8% -7,4% 1,8%Denmark 45,6 40,4 38,0 40,0 38,2 36,9 36,1 41,0 40,0 : -1,1% 0,0% 2,0%Germany 417,0 304,3 308,5 304,4 282,1 284,1 287,3 295,3 276,9 272,1 -4,8 -2,6% -0,6% 14,0%Estonia 48,0 38,4 31,1 30,9 22,1 16,0 17,0 16,0 14,0 12,1 -23,2 -7,7% -9,0% 0,7%Greece 49,0 49,3 47,5 36,0 35,7 36,1 35,6 36,0 35,5 36,0 0,6 -2,2% -3,2% 1,8%Spain 264,9 203,4 136,1 118,8 54,2 110,1 101,1 102,1 94,7 88,0 -13,7 -6,8% -7,0% 4,8%France 162,8 159,4 157,7 162,6 161,6 162,3 157,5 159,8 158,0 : -0,2% 0,0% 8,0%Ireland 22,3 21,9 17,5 13,5 14,3 15,4 14,2 13,3 12,0 : -3,7% -5,3% 0,6%Italy 114,9 87,9 86,8 83,2 79,6 77,0 74,0 72,4 69,9 67,3 -8,2 -3,3% -2,1% 3,5%Cyprus 8,8 8,7 6,8 6,5 5,7 5,7 5,6 4,4 5,5 : -3,7% -5,4% 0,3%Latvia 86,5 77,9 50,1 51,3 55,1 53,6 54,6 48,9 45,1 43,0 -14,9 -3,9% -4,9% 2,3%Lithuania 110,7 120,5 121,1 109,3 102,5 99,2 84,4 70,1 64,8 51,1 -35,8 -2,9% -5,6% 3,3%Luxembourg 0,9 0,8 0,8 0,8 0,7 0,7 0,6 0,6 0,6 0,6 -4,2 -2,4% -2,4% 0,0%Hungary 48,0 57,0 56,4 46,7 36,3 34,0 31,3 31,0 25,4 22,0 -27,7 -3,5% -6,8% 1,3%Malta 2,4 2,2 2,0 1,8 1,5 1,5 1,2 1,1 1,0 1,0 -20,1 -5,4% -7,4% 0,0%Netherlands 180,7 175,1 179,8 180,2 163,9 165,2 158,6 163,9 155,8 161,0 0,1 -0,9% -0,9% 7,9%Austria 32,7 28,4 23,2 23,7 23,1 22,5 21,1 21,9 22,2 21,9 -0,1 -2,9% -2,5% 1,1%Poland 1775,1 1609,8 1267,8 1250,6 1194,2 803,4 765,8 713,3 588,2 702,8 -2,1 -6,5% -8,7% 29,8%Portugal 113,8 90,4 62,3 57,3 49,8 52,6 48,1 47,9 39,1 39,1 -16,6 -6,4% -7,0% 2,0%Slovenia 25,0 10,1 9,8 9,0 7,8 7,1 6,8 6,8 6,3 5,9 -13,6 -9,0% -4,2% 0,3%Slovakia 53,6 40,6 27,2 27,0 23,6 26,5 25,6 24,4 19,4 18,0 -24,9 -5,8% -6,0% 1,0%Finland 35,9 36,3 32,3 32,3 30,0 29,6 28,7 29,3 28,9 28,0 -3,9 -1,5% -2,2% 1,5%Sweden 37,3 34,0 32,8 32,9 32,2 31,7 30,5 31,7 30,5 28,0 -10,0 -1,3% -0,9% 1,5%United Kingdom 178,3 167,7 177,6 165,0 165,3 158,5 145,3 148,7 137,4 -1,5% -1,6% 7,0%Bulgaria 44,0 51,7 52,2 52,8 48,4 51,9 29,8 30,7 24,0 : -3,1% -6,2% 1,2%Croatia 72,0 66,0 66,0 65,2 65,6 64,6 63,1 : : : -0,9%Romania 0,0 246,5 273,7 282,7 276,6 283,2 282,0 265,7 285,9 274,6 -1,6 1,1% 14,5%Turkey : 220,0 205,0 200,0 197,7 195,0 179,0 150,5 : 7,6%Source: Eurostat - DG Agri elaborations

EN 103 EN
Table A-6: Potato yields in the Member States of the EU (100 kg/ha)
1990/92 2000 2001 2002 2003 2004 2005 2006 (prov.)
Rate of variation
from 2001/04 to 2005
annual rate of variation from
1990-92 to 2003-05
annual rate of variation from
1994-95 to 2004-05
EU 25 214,5 262,8 255,0 286,5 264,7 302,8 292,6 : 5,5% 2,1% 4,1%EU 15 283,4 365,0 374,7 371,4 342,2 390,5 372,2 : 0,7% 1,9% 3,0%New Member States 162,9 148,2 160,0 189,0 174,5 189,4 177,5 -0,4% 0,7% 4,7%Belgium 373,3 443,8 412,6 471,5 425,3 484,0 428,1 : -4,5% 1,3% 2,7%Czech Republic 172,1 213,3 208,8 235,1 189,7 239,6 281,4 211,6 28,9% 2,3% 4,7%Denmark 347,1 411,3 403,8 402,3 391,6 397,6 394,0 : -1,2% 0,9% 1,3%Germany 285,5 433,4 407,8 391,2 345,2 441,8 419,8 : 5,9% 2,5% 3,0%Estonia 131,3 152,7 155,2 131,8 143,8 103,6 149,9 218,2 12,2% 0,1% -1,2%Greece 205,0 244,4 243,7 242,4 238,8 240,0 239,4 : -0,7% 1,1%Spain 197,6 259,2 552,6 279,5 263,6 271,6 275,0 : -19,6% 2,3% 3,6%France 340,8 395,6 374,4 423,8 403,6 454,2 420,6 : 1,6% 1,6% 2,3%Ireland 272,3 336,0 335,0 337,0 345,0 413,9 416,7 : 16,5% 2,6% 3,7%Italy 202,0 248,6 247,6 241,0 217,7 251,5 250,8 : 4,7% 1,2% 0,7%Cyprus 214,0 180,0 211,7 259,8 232,1 223,5 240,5 : 3,7% 0,6% 1,1%Latvia 120,6 145,6 111,7 143,4 135,3 128,5 145,9 102,1 12,5% 0,9% 1,2%Lithuania 125,7 163,9 102,9 154,4 155,0 129,3 121,3 80,0 -10,5% 0,5% 1,2%Luxembourg 270,8 336,0 310,2 299,2 294,2 350,3 317,9 317,9 1,4% 1,2% 2,1%Hungary 255,2 184,7 250,5 221,2 185,9 253,2 259,0 256,4 13,7% -0,7% 3,6%Malta 116,0 166,6 168,7 184,0 193,3 259,6 263,2 : 30,7% 5,3% 8,3%Netherlands 398,7 451,0 427,9 445,8 407,8 456,8 435,0 : 0,1% 0,6% 0,8%Austria 236,6 292,6 300,4 303,8 265,3 316,1 344,0 280,3 16,1% 1,9% 3,5%Poland 166,2 193,8 162,3 193,2 179,3 196,3 176,3 : -3,5% 0,7% 2,2%Portugal 127,5 129,5 139,4 148,5 152,9 160,7 132,6 1,5% 0,5%Slovenia 129,6 208,0 190,5 233,3 157,5 251,0 229,5 300,8 10,3% 3,6% 2,9%Slovakia 130,8 155,2 137,1 183,1 153,0 156,5 155,1 192,2 -1,5% 1,2% 4,2%Finland 206,7 243,1 244,3 263,5 215,1 211,4 257,0 243,2 10,0% 0,7% 1,1%Sweden 326,3 297,9 286,9 287,9 280,6 309,2 311,1 : 6,8% -0,6% -0,1%United Kingdom 386,9 : 402,1 439,6 407,4 424,7 423,3 : 1,2% 0,6%Bulgaria 113,1 75,3 123,9 120,9 151,3 186,8 156,4 : 7,3% 2,7% 4,5%Croatia 80,8 84,9 102,1 113,9 59,4 : : : -2,2%Romania 122,7 144,5 144,0 139,9 159,2 129,9 127,7 -11,6% 1,8%Turkey : 262,0 250,0 263,0 271,8 268,2 271,8 : 6,0%Source: Eurostat - DG Agri elaborations

EN 104 EN
Table A-7: Production of early potatoes in the Member States of the EU (1 000 tons)
1990/92 1997 1998 1999 2000 2001 2002 2003 2004 2005 2006 (prov.)
Rate of variation
from 2001/04 to 2005
annual variation rate (from 1990-92 to 2003-
05)
Belgium 214,8 403,0 370,3 527,0 448,4 391,7 502,2 425,5 513,2 396,7 -13,4% 5,3%Czech Republic 178,1 271,2 288,9 297,6 226,4 187,2 157,1 113,8 128,5 42,4 : -71,1% -4,4%Denmark : : : : : :Germany 704,7 540,6 477,1 560,7 558,8 468,4 485,6 453,1 513,9 476,9 -0,7% -2,7%Estonia : : : 45,7 : :Greece 325,0 332,0 342,0 343,0 336,0 350,0 400,0 : : : :Spain 816,1 554,9 517,4 748,4 596,3 512,5 553,2 471,7 610,1 469,0 434,5 -12,6% -3,2%France 467,5 496,6 472,2 490,1 461,4 420,0 453,0 387,2 378,4 367,0 -10,4% -1,5%Ireland : : 60,0 55,0 39,0 40,0 : : : :Italy 465,7 459,6 630,6 428,7 556,6 570,7 399,4 394,4 480,5 460,0 -0,3% -0,3%Cyprus : : : : : :Latvia : : 6,4 4,4 7,1 : 31,5%Lithuania : : 0,0 125,6 48,7 53,0 44,8 : -21,2%Luxembourg : : : 0,7 0,0 0,0Hungary : : 47,0 45,8 45,6 : -1,7%Malta 20,8 30,4 30,4 0,0 0,0 0,0 : : : :Netherlands : : : : : :Austria 280,7 428,8 411,3 340,7 305,8 331,4 343,2 268,4 327,4 340,7 281,5 7,3% 0,8%Poland : : : : : :Portugal : : 76,5 60,0 55,0 60,0 : : : :Slovenia : 19,0 18,8 18,1 14,4 15,1 7,5 11,5 11,1 : -8,2%Slovakia 64,4 59,5 71,2 70,0 45,5 23,0 31,4 27,2 41,0 24,0 : -21,7% -5,1%Finland : : : : : :Sweden : : 44,0 50,0 : : : :United Kingdom 402,3 386,0 336,0 341,0 290,0 167,0 229,0 : 256,6 189,1 : -13,1% -4,1%Bulgaria 41,0 0,0 0,0 0,0 0,0 0,0 0,0 : : : :Croatia : : : 159,8 206,5 231,6 88,1 : : :Romania 287,6 355,1 366,3 438,9 337,7 405,3 381,0 378,9 412,1 447,7 : 13,5% 2,6%Turkey : : : : : : : : : :Source: Eurostat - DG Agri elaborations

EN 105 EN
Table A-8: Hectares of specialised potato farms (2/3 of standard gross margin obtained by the cultivation of potatoes) in the EU [1993–2003]
hectares% in total
potato area hectares% in total potato area hectares
% in total potato area hectares
% in total potato area hectares
% in total potato area hectares
% in total potato area
Belgium 1344450 49210 47040 95,6 1340 2,7 830 1,7 1394400 59300 56320 95,0 2050 3,5 930 1,6Czech Rep. : : : 3631550 35950Denmark 2739120 46510 41920 90,1 3740 8,0 850 1,8 2658210 36050 30980 85,9 4660 12,9 410 1,1Germany 17022080 310680 : 16981750 287310 263790 91,8 17920 6,2 5610 2,0Estonia : : : 795640 12550 10860 86,5 980 7,8 710 5,7Greece 3538690 21470 16410 76,4 3560 16,6 1510 7,0 3583190 20080 15020 74,8 3430 17,1 1620 8,1Spain 24713710 86430 75250 87,1 8120 9,4 3060 3,5 25175260 61230 54090 88,3 3680 6,0 3460 5,7France 28107150 148450 142550 96,0 5450 3,7 450 0,3 27667720 154780 150840 97,5 2400 1,6 1540 1,0Ireland 4277610 16900 12040 71,2 3360 19,9 1500 8,9 4371710 14210 9250 65,1 4140 29,1 820 5,8Italy 14736050 57750 46850 81,1 6390 11,1 4510 7,8 13115810 33710 20980 62,2 4350 12,9 8370 24,8Latvia : : : 1489350 51950 45970 88,5 4180 8,0 1800 3,5Lithuania : : : 2490960 84440 81510 96,5 2380 2,8 550 0,7Luxembourg 127210 830 800 96,4 0 0,0 0 0,0 128160 620 590 95,2 0 0,0 0 0,0Hungary : : : 4352370 20960 17120 81,7 2580 12,3 1260 6,0Malta : : : 10790 1210 720 59,5 190 15,7 300 24,8Netherlands 2014760 175920 131450 74,7 27750 15,8 16710 9,5 2007250 158640 140190 88,4 15520 9,8 2930 1,8Austria : : : 3388230 23490 23270 99,1 110 0,5 100 0,4Poland 12761400 787860 745560 94,6 25400 3,2 16900 2,1Portugal 3949860 77940 74370 95,4 2870 3,7 700 0,9 3863090 44600 42090 94,4 1700 3,8 810 1,8Slovenia : : : 486470 6830 6660 97,5 130 1,9 40 0,6Slovakia : : : 2137500 15680 12900 82,3 1890 12,1 880 5,6Finland : : : 2244700 28690 13490 47,0 8420 29,3 6790 23,7Sweden : : : 3126910 30970 25980 83,9 3800 12,3 1190 3,8UK 16382740 165900 156630 94,4 7050 4,2 2230 1,3 16105810 145120 130220 89,7 11970 8,2 2920 2,0Total 101931360 847320 745310 88,0 69630 8,2 32380 3,8 153968230 2116230 1898400 89,7 121880 5,8 59940 2,8Source: Eurostat (Eurofarm)
1993 2003
Agricultural area (ha)
Holdings with potatoes (D/10)
Agricultural area (ha) 2/3-<90% of the holdings'
SGM >=90% of the holdings' SGM
Holdings with potatoes (D/10)
Holdings with potatoes (hectares)
Standard Gross Margin of potatoes
Holdings with potatoes
(hectares)
Standard Gross Margin of potatoes
<2/3 of the holdings' SGM 2/3-<90% of the holdings' SGM >=90% of the holdings' SGM <2/3 of the holdings' SGM

EN 106 EN
Figure A-1 a.n: Distribution of potato areas by holdings' size (classes of agricultural area) [1990–2003]
0%
20%
40%
60%
80%
100%
1990 1993 1995 1997 2000 2003
Figure A.1a: Denmark
> 100 ha50<ha<10030<ha<5020<ha<3010<ha<205<ha<102<ha<5<2ha
Source: Eurostat (Farm Structure Survey); DG Agri elaborations
0%
20%
40%
60%
80%
100%
1990 1993 1995 1997 2000 2003
Figure A.1b: Greece
> 100ha50<ha<10030<ha<5020<ha<3010<ha<205<ha<102<ha<5<2ha
Source: Eurostat (Farm Structure Survey); DG Agri elaborations
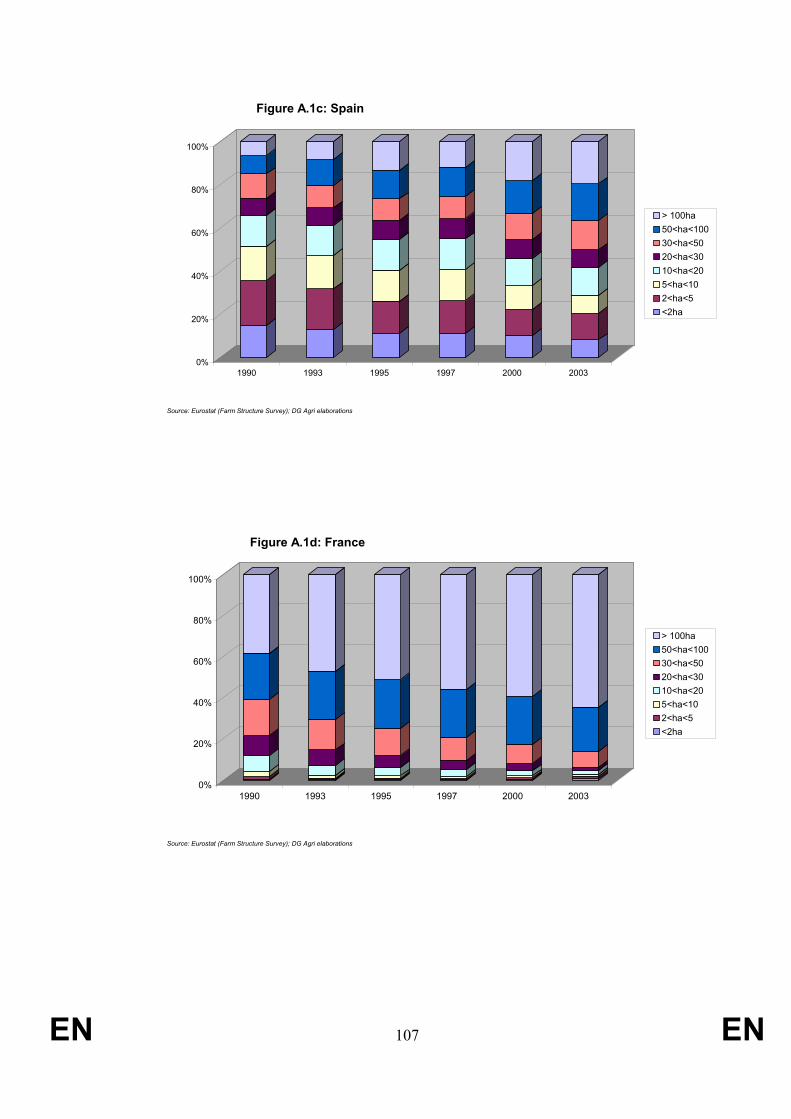
EN 107 EN
0%
20%
40%
60%
80%
100%
1990 1993 1995 1997 2000 2003
Figure A.1c: Spain
> 100ha50<ha<10030<ha<5020<ha<3010<ha<205<ha<102<ha<5<2ha
Source: Eurostat (Farm Structure Survey); DG Agri elaborations
0%
20%
40%
60%
80%
100%
1990 1993 1995 1997 2000 2003
Figure A.1d: France
> 100ha50<ha<10030<ha<5020<ha<3010<ha<205<ha<102<ha<5<2ha
Source: Eurostat (Farm Structure Survey); DG Agri elaborations

EN 108 EN
0%
10%
20%
30%
40%
50%
60%
70%
80%
90%
100%
1990 1993 1995 1997 2000 2003
Figue A.1e: Ireland
> 100ha50<ha<10030<ha<5020<ha<3010<ha<205<ha<102<ha<5<2ha
Source: Eurostat (Farm Structure Survey); DG Agri elaborations
0%
10%
20%
30%
40%
50%
60%
70%
80%
90%
100%
1990 1993 1995 1997 2000 2003
Figure A.1f: Italy
> 100ha50<ha<10030<ha<5020<ha<3010<ha<205<ha<102<ha<5<2ha
Source: Eurostat (Farm Structure Survey); DG Agri elaborations

EN 109 EN
0%
10%
20%
30%
40%
50%
60%
70%
80%
90%
100%
1990 1995 1997 2000 2003
Figure A.1g: Netherlands
> 100ha50<ha<10030<ha<5020<ha<3010<ha<205<ha<102<ha<5<2ha
Source: Eurostat (Farm Structure Survey); DG Agri elaborations
0%
10%
20%
30%
40%
50%
60%
70%
80%
90%
100%
1995 1997 2000 2003
Figure A.1h: Austria
> 100ha50<ha<10030<ha<5020<ha<3010<ha<205<ha<102<ha<5<2ha
Source: Eurostat (Farm Structure Survey); DG Agri elaborations

EN 110 EN
0%
10%
20%
30%
40%
50%
60%
70%
80%
90%
100%
1990 1993 1995 1997 2000 2003
Figure A.1i: Portugal
> 100ha50<ha<10030<ha<5020<ha<3010<ha<205<ha<102<ha<5<2ha
Source: Eurostat (Farm Structure Survey); DG Agri elaborations
0%
10%
20%
30%
40%
50%
60%
70%
80%
90%
100%
1995 1997 2000 2003
Figure A.1l: Finland
> 100ha50<ha<10030<ha<5020<ha<3010<ha<205<ha<102<ha<5<2ha
Source: Eurostat (Farm Structure Survey); DG Agri elaborations

EN 111 EN
0%
10%
20%
30%
40%
50%
60%
70%
80%
90%
100%
1995 1997 2000 2003
Figure A.1m: Sweden
> 100ha50<ha<10030<ha<5020<ha<3010<ha<205<ha<102<ha<5<2ha
Source: Eurostat (Farm Structure Survey); DG Agri elaborations
0%
20%
40%
60%
80%
100%
1990 1993 1995 1997 2000 2003
Figure A.1n: UK
> 100 ha50<ha<10030<ha<5020<ha<3010<ha<205<ha<102<ha<5<2ha
Source: Eurostat (Farm Structure Survey); DG Agri elaborations

EN 112 EN
APPENDIX B: STARCH POTATOES AS A COMPONENT OF TOTAL POTATO PRODUCTION
Figures presented in table A-4 are based on an aggregate that includes starch potatoes as a component of total potato production. The EU’s starch regime covers eight Member States of EU-15 (Denmark, Germany, France, Netherlands, Austria, Finland, Spain and Sweden). Although Spain is included, starch production is negligible there.
Statistically, starch potatoes are an element of stabilisation of “total potato production” and their subtraction from total production reveals that, if we consider only ware and seed potatoes, the absolute rate of variation in production between two consecutive years results generally bigger. In fact, the fall of ware and seed potato production in 2005 has been very significant attaining rates that range from –9% in Sweden to –26% in Germany, while in Finland the rise in production is higher if we do not count starch potatoes (graph B-1). The statistical effect that potatoes for starch have on total potato production remains but it is less important when variations on longer periods are considered. The importance of starch in total national uses of potatoes was treated in § 3.3.
Figure B-1: Comparison between the rate of variation of potato production with and without potatoes for starch (from 2001/04 to 2005)
-30
-25
-20
-15
-10
-5
0
5
10
15
20
25
Rate of variation of ware and seed potatoes (no starch included) Rate of variation of ware, seed and starch potatoes
DK
GERFR
NETH
AUFINL
SWE
Source: New Cronos data - DG Agri elaborations

EN 113 EN
APPENDIX C: INDICATORS ON THE VARIATIONS OF AREAS, YIELDS AND PRODUCTION
In order to calculate the variations of potatoes yields and areas in relation to other cultivations, we have used the coefficient of variation, that is a statistical measure of the deviation of a variable from its mean.
It is calculated as follows: ySDCV /= where CV is the coefficient of variation, SD is the Standard deviation and y is the mean value. The coefficient of variation has no units. The coefficient of variation is particularly recommended when comparing dispersion of two or more time-series characterised by different sizes (both in terms of levels and in terms of unit of measure). When calculating the coefficient of variation of surfaces of selected crops in the EU (graph C-1), we can note that potato is the product with the highest degree of areas’ variability.
Figure C-1: Coefficient of variation of yields and areas for selected crops in the EU-15 (1990–2004)
0,07
0,13
0,08
0,07
0,07
0,12
0,06
0,08
0,06
0,04
0,13
0,09
0,06
0,07
0,16
0,08
0,05
0,03
Common wheat
Rye
Barley
Oats
Maize
Potatoes
Sugar beet
Tomatoes
Citrus Fruit
areayields
Source: DG Agri elaborations - Eurostat data
This result could be partly affected by the absence of any form of public intervention on potatoes, while in other sectors direct aids and price support may have acted as a “stabilisation” force. Partly related to this, it can also be the case that in some countries potatoes play a residual role within the economic decisions of farmers.
In terms of yields, potatoes have the second highest degree of variability (graph C-1), the main reason being that potatoes’ sensitivity to pedo-climatic conditions is more significant than that of many other arable crops. However, if we look at the variability of harvested production, it results that the coefficient of variation is higher for rye, 0.18, then peaches, 0.16, apples, 0.13, maize, 0.12 and, at the fourth place, potatoes with 0.11 (graph C-2).

EN 114 EN
As it is to expect, the variation coefficient of surfaces is lower in the case of perennial crops, although production risks seems generally higher for these crops as illustrated by production variations higher than those registered for arable crops.
Figure C-2: Coefficient of variation of production for selected crops in the EU-15 (1990–2004)
0,09
0,18
0,08
0,10
0,12
0,11
0,06
0,09
0,08
0,13
0,09
0,16
Common wheat
Rye
Barley
Oats
Maize
Potatoes
Sugar beet
Tomatoes
Citrus Fruit
Apples
Pears
Peaches
Source: DG Agri elaborations - Eurostat data

EN 115 EN
APPENDIX D: POTATO BALANCE SHEET IN THE EUROSTAT ACCOUNTS
Domestic use can be calculated in two ways:
1) Domestic use =
Production
+ Imports
– Exports
– Change in stocks (> 0 or <0)
2) Domestic use =
Seeds or eggs for hatching
+ Losses
+ Animal feed
+ Industrial uses
+ Processing
+ Human consumption.
Domestic use includes all the possible uses of potatoes in the reference area during the reference period (other than stocks).
Seeds: This involves the quantities of seed potatoes used for the plantation of the following production cycle.
Losses: This involves losses on holdings (damaged or rotten tubers, losses from sorting, etc.) and losses in marketing (during storage, transport, processing and packing, including losses from desiccation). Any denaturing is included in this entry.
Animal feed: This involves the quantities of potatoes (basic or processed products) provided to both direct animal feed and the feedstuff industry. This entry does not include the by-products of processing (for example, pulps) used in animal feed.
Industrial uses: This involves the quantities used by industry to produce products intended neither for human consumption nor animal feed (for example, potatoes for producing industrial starch and alcohol). By convention and in accordance with the rules of agricultural accounts, beers and liqueurs are considered as industrial products.
Processing: This involves the quantities of potatoes (tubers) intended for the production of potato flour. These quantities are found in the entry ‘Processed basic product’ of the bases for production of the balance of potato flour. The trade and stocks of potato flour are not included in the balance ‘potatoes’ but in the balance ‘potato flour’.
Human consumption: This involves the quantities of potatoes processed or in their natural state, coming under human consumption, both direct (the producers' own consumption) and indirect (domestic or ex-household foodstuff). The losses and variations of stocks at the level of retail trade, collectives and consumers are included in this entry. The quantities already entered in the entry ‘processing’ are excluded from this entry.

EN 116 EN
APPENDIX E: MONTHLY POTATO PRICES VS MONTHLY PRICES OF OTHER CROPS
Figure E-1 a-e: Monthly selling prices of potatoes and other crops in selected Member States (€/100 kg)
Graph E.1a: Belgium (1999-2003)
0
5
10
15
20
25
30
1999
m01
1999
m03
1999
m05
1999
m07
1999
m09
1999
m11
2000
m01
2000
m03
2000
m05
2000
m07
2000
m09
2000
m11
2001
m01
2001
m03
2001
m05
2001
m07
2001
m09
2001
m11
2002
m01
2002
m03
2002
m05
2002
m07
2002
m09
2002
m11
2003
m01
2003
m03
2003
m05
2003
m07
2003
m09
2003
m11
€/10
0kg
Soft wheat
Barley
Main croppotatoes
Source: Eurostat -New Cronos
Graph E.1b: Germany (1999-2004)
0
5
10
15
20
25
1999
m01
1999
m03
1999
m05
1999
m07
1999
m09
1999
m11
2000
m01
2000
m03
2000
m05
2000
m07
2000
m09
2000
m11
2001
m01
2001
m03
2001
m05
2001
m07
2001
m09
2001
m11
2002
m01
2002
m03
2002
m05
2002
m07
2002
m09
2002
m11
2003
m01
2003
m03
2003
m05
2003
m07
2003
m09
2003
m11
2004
m01
2004
m03
2004
m05
2004
m07
2004
m09
2004
m11
€/1
00kg
Soft wheat
Barley
Main croppotatoes
Source: Eurostat -New Cronos

EN 117 EN
Graph E.1c: France (1999-2004)
0
5
10
15
20
25
30
35
40
45
1999
m01
1999
m03
1999
m05
1999
m07
1999
m09
1999
m11
2000
m01
2000
m03
2000
m05
2000
m07
2000
m09
2000
m11
2001
m01
2001
m03
2001
m05
2001
m07
2001
m09
2001
m11
2002
m01
2002
m03
2002
m05
2002
m07
2002
m09
2002
m11
2003
m01
2003
m03
2003
m05
2003
m07
2003
m09
2003
m11
€/10
0kg
Soft wheat
Rye
Oats
Maize
Main crop potatoes
Sugar beet: standardquality
Source: Eurostat -New Cronos
Graph E.1d: Netherlands (1999-2004)
0
5
10
15
20
25
30
35
1999
m01
1999
m03
1999
m05
1999
m07
1999
m09
1999
m11
2000
m01
2000
m03
2000
m05
2000
m07
2000
m09
2000
m11
2001
m01
2001
m03
2001
m05
2001
m07
2001
m09
2001
m11
2002
m01
2002
m03
2002
m05
2002
m07
2002
m09
2002
m11
2003
m01
2003
m03
2003
m05
2003
m07
2003
m09
2003
m11
2004
m01
2004
m03
2004
m05
€/10
0kg
Soft wheat
Barley
Maize
Main croppotatoes
Source: Eurostat -New Cronos

EN 118 EN
Graph E.1e: UK (1999-2004)
0
5
10
15
20
25
30
35
1999
m01
1999
m03
1999
m05
1999
m07
1999
m09
1999
m11
2000
m01
2000
m03
2000
m05
2000
m07
2000
m09
2000
m11
2001
m01
2001
m03
2001
m05
2001
m07
2001
m09
2001
m11
2002
m01
2002
m03
2002
m05
2002
m07
2002
m09
2002
m11
2003
m01
2003
m03
2003
m05
2003
m07
2003
m09
2003
m11
2004
m01
2004
m03
2004
m05
2004
m07
2004
m09
2004
m11
€/10
0kg
Soft wheat
Barley
Main croppotatoes
Source: Eurostat -New Cronos