Embed Size (px)
Citation preview

Sainsbury’s Bank plcPillar 3 Disclosures for the year ended 29 February 2016
COMPANY NUMBER: 3279730
1 Overview 11.1 Background 11.2 Disclosure policy 11.3 Scope of application 11.4 Frequency 11.5 Medium and location for publication 11.6 Verification 11.7 Non-material, proprietary or confidential information 1
2 Risk management objectives and policies 2
2.1 Risk management approach 22.2 Board selection criteria 42.3 Board diversity 42.4 Number of directorships held by members of the Board 42.5 Adequacy of risk management arrangements 42.6 Risk statement 42.7 Risk model 42.8 Risk exposures 5
3 Capital resources 73.1 Total capital resources 73.2 Movement in CET 1 capital 73.3 Share capital 73.4 Own funds balance sheet reconciliation 73.5 Main features of capital instruments 7
4 Compliance with CRD IV and the overall Pillar 2 rule 7
4.1 Assessment of the adequacy of internal capital 74.2 Minimum capital requirement 8
5 Credit risk and Dilution risk 85.1 Impairment losses on loans and advances 85.2 Maximum exposure to credit risk 85.3 Risk concentrations 95.4 Geographical and counterparty sectors 95.5 Capital buffers 95.6 Residual Maturity by Exposure Class 105.7 Exposure by credit quality steps 105.8 Credit risk mitigation 115.9 Credit quality impairment and past due analysed
by class of financial asset 11
6 Securitisation and covered bonds 14
7 Leverage 14
8 Asset encumbrance 15
9 Non trading book exposure in equity 15
10 Remuneration 1610.1 Remuneration Committee 1610.2 Link between pay and performance 1610.3 Quantitative disclosures 17
Annex I – Board risk management declaration 18
Annex II – Risk statement 18
Annex III – Balance sheet reconciliation 18
Annex IV – Capital instruments’ main features 19
Annex V – Transitional own funds disclosure 21
Annex VI – Leverage ratio 25
Annex VII – Disclosure on asset encumbrance 27
Annex VIII – Disclosure in relation to the requirement for a countercyclical capital buffer 28
Contents

Sainsbury’s Bank plc Pillar 3 Disclosures for the year ended 29 February 2016 1
Sainsbury’s Bank Pillar 3 Disclosures
1. Overview1.1 BackgroundThe Basel II Capital Requirements Directive (Basel II) introduced consistent capital adequacy standards and an associated supervisory framework in the European Union.
In June 2013, the European Commission published the final version of Directive 2013/36/EU referred to as the Capital Requirements Directive (CRD) and EU Regulation No 575/2013, the Capital Requirements Regulation (CRR), which together make up CRD IV. CRD IV reflects the Basel III proposals for capital and liquidity reform, plus additional rules for non-compliance with prudential rules, corporate governance and remuneration. The regulations were implemented on 1 January 2014.
The Regulation element became law in member states directly, replacing existing sections of the rulebooks (GENPRU and BIPRU in the UK) with significant changes to regulations. The regulations include changes to the definition of capital, new definitions for the calculation of counterparty credit risk and leverage ratios, additional capital buffers and development of a global liquidity standard.
The Basel framework consists of three ‘pillars’. Pillar 1 of the standards sets out the minimum capital requirements firms are required to meet for credit, market and operational risk. Under Pillar 2, firms and supervisors have to take a view on whether a firm should hold additional capital against risks not covered in Pillar 1.
The aim of Pillar 3 is to encourage market discipline by developing a set of disclosure requirements which will allow market participants to assess key pieces of information on a firm’s capital, risk exposures, risk assessment processes and remuneration approach.
This document represents the Pillar 3 Disclosure by Sainsbury’s Bank plc (‘the Bank’).
1.2 Disclosure policy The information has been prepared purely for the purposes of: explaining the basis on which the Bank has prepared and disclosed certain capital requirements; providing information about the management of risks relating to those requirements; and presenting remuneration information as required by CRD IV and the Prudential Regulation Authority (PRA) prudential sourcebook. This report has not been prepared for any other purpose. It therefore does not constitute any form of financial statement of the Bank nor does it constitute any form of contemporary or forward looking record or opinion of the Bank.
The Bank is committed to ensuring that its remuneration practices are appropriate. Compliance with the Financial Conduct Authority (FCA) Remuneration Code and CRD IV will fall within the responsibilities of the Remuneration Committee.
1.3 Scope of applicationThese Disclosures are presented in respect of the year to 29 February 2016 under CRD IV, on a ‘transitional basis’. The Bank changed its accounting reference date in the prior period from 31 December to 28 February to align with the J Sainsbury plc group of companies. Consequently the comparative figures presented within these Disclosures cover the 14 month period from 1 January 2014 to 28 February 2015.
These disclosures are based on the Bank’s ownership as at 29 February 2016. J Sainsbury plc acquired 100% of the Bank’s share capital on 31 January 2014. Prior to the acquisition, the Bank was a joint venture between J Sainsbury plc and Bank of Scotland plc. Bank of Scotland plc is a subsidiary of the Lloyds Banking Group plc. J Sainsbury plc and Bank of Scotland plc are incorporated and domiciled in England and Scotland respectively. Sainsbury’s Bank plc is incorporated and domiciled in England.
Since 1 February 2014, the Bank has been a wholly-owned subsidiary of J Sainsbury plc and is included in the consolidated financial statements of J Sainsbury plc which are publicly available. Consequently, the Bank has taken advantage of the exemption from preparing consolidated financial statements under the terms of section 400 of the Companies Act 2006.
Subsidiaries are entities, including special purpose entities (SPEs), over which the Bank has the power to govern the financial and operating policies. The results of subsidiaries are included in the income statement of the ultimate parent J Sainsbury plc. On 18 February 2015, the Bank entered a secured funding transaction which involved the legal transfer of certain personal loan balances into an SPE, Lochside Asset Purchaser No. 1 plc. This subsidiary is not included in the prudential consolidation.
The basis of preparation of accounting information under International Financial Reporting Standards and for regulatory purposes is the same. These disclosures include balance sheet reconciliation information as required in point (a) of Article 437(1) of the CRR.
As the Bank has adopted the standardised approach to the calculation of the credit and operational risk capital requirements, no Internal Ratings Based or Advanced Measurement Approach disclosures are included.
1.4 FrequencyThe Bank’s Pillar 3 Disclosures will be published on an annual basis in a reporting cycle aligned with the publication of the Bank’s Annual Report and Financial Statements.
This frequency will be reviewed if there is a material change in the approaches used for the calculation of capital, characteristics of the business or regulatory requirements.
1.5 Medium and location for publicationThe Pillar 3 Disclosures and Annual Report and Financial Statements will be published on the J Sainsbury plc corporate website: www.j-sainsbury.co.uk/investor-centre.
1.6 VerificationThese Disclosures have been reviewed and recommended by the Bank’s Audit Committee. The Disclosures are not subject to audit. However certain information has been extracted from the Annual Report and Financial Statements of the Bank, the Financial Statements having been subject to independent external audit.
1.7 Non-material, proprietary or confidential informationThe Bank does not seek any exemption from disclosure on the basis of materiality or on the basis of proprietary or confidential information.

Sainsbury’s Bank plc Pillar 3 Disclosures for the year ended 29 February 20162
Sainsbury’s Bank Pillar 3 Disclosures
2. Risk management objectives and policies2.1 Risk management approachThe Bank aims to manage all risks that arise from its activities. Through its normal operations the principal risks to the Bank are retail credit risk, wholesale credit risk, liquidity & funding risk, market risk, capital adequacy risk, operational risk, operational capability risk and compliance & conduct risk. Alongside these, the Bank is currently exposed to additional operational risks associated with its transition to a new stand-alone operating model following the transfer to full ownership by J Sainsbury plc in 2014.
The Bank has established an Enterprise Wide Risk Management Framework (EWRMF) to manage risks across its operations. The EWRMF comprises the governance, risk appetite, policies, controls, processes and systems that the Bank utilises to manage risk.
2.1.1 Changes to governance from March 2016Following the introduction of the Individual Accountability Regime from March 2016, the Bank has made some changes to its governance structure to ensure that it is reflective of individual accountability going forward. As these changes were implemented after year end, the section below entitled ‘Governance structure during the financial year ended 29 February 2016’ sets out how the governance framework operated during the 2015/16 financial year.
The diagram below shows the current governance structure.
*Committee name was changed in March 2016 as described below**Created as a result of governance changes from March 2016 onwards***Disbanded as a result of governance changes from March 2016
Audit Committee
Board Risk Committee
Remuneration Committee
Nominations Committee
Transition Committee
CEO
Executive Committee
Executive Risk Committee**
Transition Steering
Committee
Product Governance
& Pricing Committee
Customer Conduct Committee**
Regulatory Compliance
Committee**
Operational Risk Committee**
Retail Credit Risk Committee
Non Financial Risk Committee***
Asset & Liability Committee
Supply Chain Oversight
Committee*
Finance Committee**
Investment & Strategy
Committee*
Board

Sainsbury’s Bank plc Pillar 3 Disclosures for the year ended 29 February 2016 3
Sainsbury’s Bank Pillar 3 Disclosures
The Bank retains all of its Board level governance committees that were in place during 2015/16. The collective governance level of the Bank has been restructured and each committee will now be the responsibility of the appropriate Senior Manager under FCA and PRA rules (Senior Manager Regime). We have introduced a new Executive Risk Committee, which is responsible for the monitoring and oversight of the risk profile of the Bank at an aggregate level, having regard to the risk appetite of the Bank. The governance of the Bank is described in the Bank’s Responsibility Map submitted to the regulator in March 2016 and is the responsibility of the Chief Executive Officer (CEO).
The following committees which existed throughout the year to 29 February 2016 are now held as part of the remit of individual members of the Executive Committee in line with their Statement of Responsibilities under the Senior Managers Regime:
— Chief Operations Officer – Transition Steering Committee — Chief Trading Officer – Product & Pricing Committee (renamed Product Governance & Pricing Committee)
— Chief Risk Officer – Retail Credit Risk Committee — Chief Financial Officer – Asset & Liability Committee, Change & Investment Committee (renamed Investment & Strategy Committee), the Outsourcing Oversight Committee (renamed the Supply Chain Oversight Committee)
The following new committees were effective from March 2016 onwards and are held part of the remit of individual members of the Executive Committee in line with their Statement of Responsibilities under the Individual Accountability Regime:
— Chief Trading Officer – Customer Conduct Committee — Chief Risk Officer – Operational Risk Committee and Regulatory Compliance Committee
— Chief Financial Officer – Finance Committee
The Non-Financial Risk Committee was disbanded as part of the changes to the governance structure, however its responsibilities have been taken over by other committees.
2.1.2 Governance structure during the financial year ended 29 February 2016During the financial year ended 29 February 2016, the governance framework in place at the Bank segregated vertically into three levels:a) Board level governanceb) Collective management level governancec) Executive level governance
A) Board level governanceThe Board level governance holds overall accountability for the outcomes achieved, decisions made and steering the Bank, subject to specific reserved matters which require the consent of J Sainsbury plc. The Board then subsequently delegates the appropriate responsibility, authority and accountability to the CEO to deliver the Bank’s strategy through the appropriate governance committees and Executive Management Team.
– The BoardThe Board is the key governance body and is responsible for the overall strategy, performance of the business and management of risk. It has delegated responsibility for the day-to-day running of the business to the CEO and the Executive Management Team through apportionment of responsibility and delegated authorities.
The Board meets at least nine times a year. It is comprised of key Executive members from the Bank, and Non-Executive Directors from J Sainsbury plc as well as Independent Non-Executive Directors. The chairman is an independent non-executive Director. A number of Board functions are delegated to five key sub-committees – the Audit Committee, Transition Committee, Nominations Committee, Remuneration Committee, and Board Risk Committee.
– Audit CommitteeThe Audit Committee’s key responsibility is to advise the Board on the Bank’s financial statements both interim and final, including systems and controls and related policy issues together with relationships with external auditors. The Committee is also responsible for reviewing and approving the internal audit plan and budget, and for ensuring that the function is adequately resourced.
– Transition CommitteeThe Transition Committee oversees delivery of the New Bank Programme and the transition to new banking platforms, systems and processes following the transfer of full ownership to J Sainsbury plc in 2014.
– Nominations CommitteeThe Nominations Committee is responsible for reviewing the structure, size and composition of the Board. The Committee is also responsible for succession planning of the Board and the Executive management team and for ensuring a formal, rigorous and transparent process for recommending Board appointments to the Bank’s shareholders.
– Remuneration Committee The role of the Remuneration Committee (RemCo) is to determine and agree with the Board the broad policy for remuneration and for compliance with the Remuneration Code (the Code) to the extent that the provisions apply to the Bank. RemCo is responsible for recommending, monitoring and noting the level and structure of remuneration for senior management (categorised as ‘Code Staff’ for the purposes of the Code) and senior risk management and compliance colleagues.
RemCo continually reviews and assesses the impact of remuneration policies on the risk profile of the Bank and employee behaviour. RemCo has oversight over appointment and severance terms for relevant employees (including payments of guaranteed remuneration for appointees and retention terms).
– Board Risk Committee The Board Risk Committee (BRC) monitors, provides oversight over existing risks and is forward-looking to anticipate future risks. It is responsible for reviewing and reporting its conclusions to the Board on the Bank’s risk appetite and the Bank’s risk management framework. It meets no less than four times a year.
B) Collective management level governanceThe collective management level governance is established to ensure appropriate checks, balances and transparency on executive decision making. Responsibilities include general operational management delivery of the agreed business plan in line with agreed risk appetite, approval of new business plans or strategic changes prior to submission to the Board. The CEO’s oversight and governance of the Bank is supported and affected through a number of management committees.
– Product and Pricing CommitteeThe Product and Pricing Committee (PPC) oversees and manages the Bank’s product portfolio, including management of tactical decisions regarding pricing and product terms and conditions, and product/channel alignment. It also makes those decisions in relation to products and pricing that are necessary to ensure that the Bank operates within relevant and defined risk appetite.
– Transition Steering Committee The Transition Steering Committee is responsible for ensuring that there is effective governance and oversight of the New Bank Programme, focusing on delivering on time, within budget, and to prescribed quality standards.
– Non-Financial Risk Committee The Non-Financial Risk Committee (NFRC) is in place to ensure the effective management of operational risk and compliance & conduct risk, including areas such as fraud, information security and business continuity. It makes those decisions necessary to ensure that the Bank operates within its defined risk appetite, including the delivery of fair outcomes for customers.
Sainsbury’s Bank Pillar 3 Disclosures
Sainsbury’s Bank plc Pillar 3 Disclosures for the year ended 29 February 20164
– Retail Credit Risk CommitteeThe Retail Credit Risk Committee (RCRC) is responsible for monitoring the performance of the retail lending book and the credit card portfolio, ensuring there is an effective credit risk management framework and making those decisions needed to ensure that the Bank is operating within its risk appetite. This Committee receives regular reports about the performance of all retail credit portfolios. This includes the credit cards and loans application process as well as collections and recoveries performance.
– Asset and Liability CommitteeThe Asset and Liability Committee (ALCO) is responsible for ensuring the balance sheet of the Bank is managed effectively and within risk appetite with its main areas of responsibility being market risk, wholesale credit risk, liquidity & funding risk and capital adequacy.
– Change and Investment CommitteeThe Change and Investment Committee (CIC) is responsible for the management of the Bank’s BAU change portfolio ensuring appropriate prioritisation of projects, tracking of progress versus plan and risk management of the portfolio.
– Outsourcing Oversight CommitteeThe Outsourcing Oversight Committee (OOC) is responsible for ensuring that the outsourcing component of operational and conduct risk is managed in line with the approved risk appetite and a consistent approach is taken to managing supplier relationships across the Bank, including the performance and delivery of critical third party supply arrangements including the delivery of fair outcomes for customers.
C) Executive level governanceThe CEO has established the Executive Committee (ExCo) to assist in his delegated responsibilities from the Board as described above. The ExCo is responsible for the day-to-day running and leadership of the Bank including the development of business strategy and business plans for Board approval.
2.2 Board selection criteriaThe Bank takes succession at Board and senior management level very seriously. Recruitment into the Board combines an assessment of both technical, leadership capability and competency skills to ensure the optimum blend of individual and aggregate capability having regard to the Bank’s long term strategic plan. Board recruitment is subject to the approval of the Nominations Committee, the Board and the relevant regulatory bodies (PRA/FCA).
2.3 Board diversityThe Bank is committed to promoting a diverse and inclusive workplace at all levels, reflective of the communities in which it does business, and our diversity and inclusion vision aligns with that of our parent J Sainsbury plc whose aim is to be ‘the most inclusive retailer’. We will achieve this aspiration by recruiting, retaining and developing diverse and talented people and creating an inclusive environment where everyone can be the best they can be and where diverse views are listened to. The Nominations Committee is responsible for ensuring there is an appropriate balance of skills and experience across the Board.
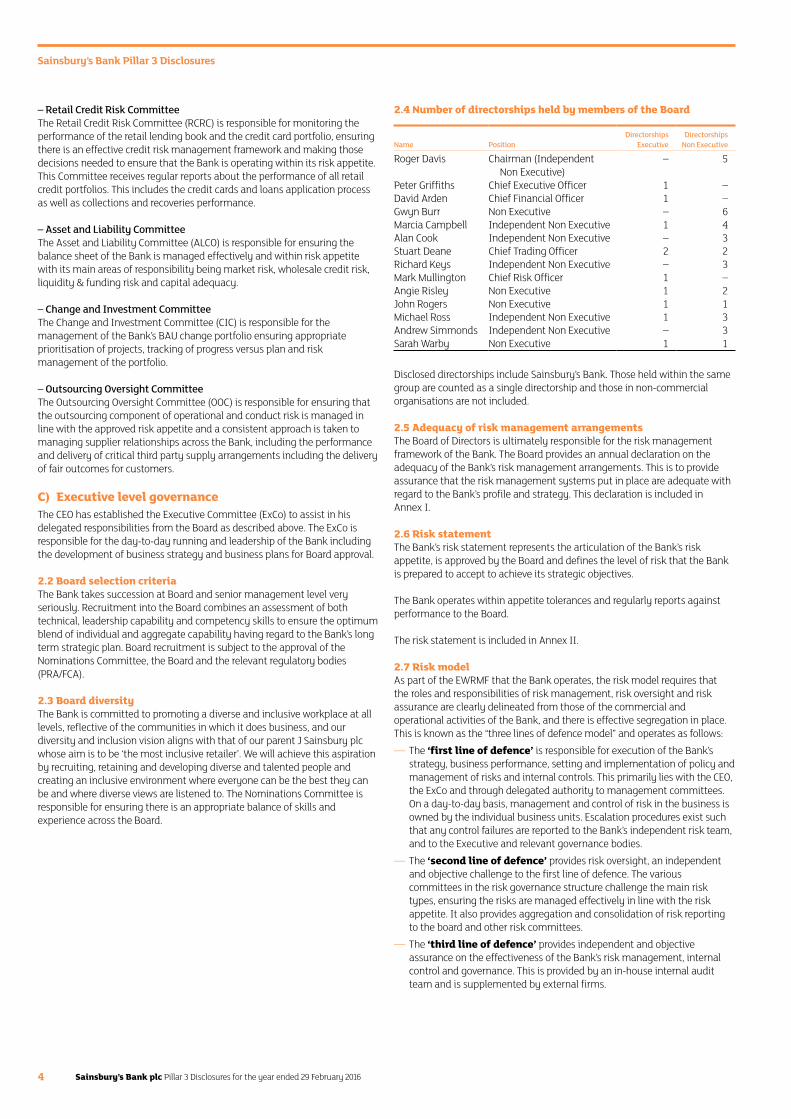
2.4 Number of directorships held by members of the Board
Name PositionDirectorships
ExecutiveDirectorships
Non Executive
Roger Davis Chairman (Independent Non Executive)
– 5
Peter Griffiths Chief Executive Officer 1 –David Arden Chief Financial Officer 1 –Gwyn Burr Non Executive – 6Marcia Campbell Independent Non Executive 1 4Alan Cook Independent Non Executive – 3Stuart Deane Chief Trading Officer 2 2Richard Keys Independent Non Executive – 3Mark Mullington Chief Risk Officer 1 –Angie Risley Non Executive 1 2John Rogers Non Executive 1 1Michael Ross Independent Non Executive 1 3Andrew Simmonds Independent Non Executive – 3Sarah Warby Non Executive 1 1
Disclosed directorships include Sainsbury’s Bank. Those held within the same group are counted as a single directorship and those in non-commercial organisations are not included.
2.5 Adequacy of risk management arrangementsThe Board of Directors is ultimately responsible for the risk management framework of the Bank. The Board provides an annual declaration on the adequacy of the Bank’s risk management arrangements. This is to provide assurance that the risk management systems put in place are adequate with regard to the Bank’s profile and strategy. This declaration is included in Annex I.
2.6 Risk statementThe Bank’s risk statement represents the articulation of the Bank’s risk appetite, is approved by the Board and defines the level of risk that the Bank is prepared to accept to achieve its strategic objectives.
The Bank operates within appetite tolerances and regularly reports against performance to the Board.
The risk statement is included in Annex II.
2.7 Risk modelAs part of the EWRMF that the Bank operates, the risk model requires that the roles and responsibilities of risk management, risk oversight and risk assurance are clearly delineated from those of the commercial and operational activities of the Bank, and there is effective segregation in place. This is known as the “three lines of defence model” and operates as follows:
— The ‘first line of defence’ is responsible for execution of the Bank’s strategy, business performance, setting and implementation of policy and management of risks and internal controls. This primarily lies with the CEO, the ExCo and through delegated authority to management committees. On a day-to-day basis, management and control of risk in the business is owned by the individual business units. Escalation procedures exist such that any control failures are reported to the Bank’s independent risk team, and to the Executive and relevant governance bodies.
— The ‘second line of defence’ provides risk oversight, an independent and objective challenge to the first line of defence. The various committees in the risk governance structure challenge the main risk types, ensuring the risks are managed effectively in line with the risk appetite. It also provides aggregation and consolidation of risk reporting to the board and other risk committees.
— The ‘third line of defence’ provides independent and objective assurance on the effectiveness of the Bank’s risk management, internal control and governance. This is provided by an in-house internal audit team and is supplemented by external firms.
Sainsbury’s Bank Pillar 3 Disclosures
Sainsbury’s Bank plc Pillar 3 Disclosures for the year ended 29 February 2016 5
2.8 Risk exposuresThe principal risks to the Bank are retail credit risk, wholesale credit risk, liquidity & funding risk, market risk, capital adequacy risk, operational risk, operational capability risk and compliance & conduct risk. The principal risks and uncertainties are described in more detail below together with examples of relevant controls and mitigating factors. It should be noted that the risk assessment and mapping employed by the Bank goes beyond this assessment and captures less material risks that may still impact the business and require monitoring for future changes in materiality. In addition, the Bank continues to monitor uncertainties, such as new regulations impacting the Bank’s credit card interchange fees and the EU referendum, to assess whether they give rise to material new risks to the business.
As noted above, the Bank is managing through a transitional period following the transfer to full ownership by J Sainsbury plc in 2014. During this period, the Bank is exposed to additional operational risks associated with the transition which could have an impact on people, processes, regulatory compliance and technical infrastructure. Oversight of these transitional risks is being maintained through the Bank’s existing risk oversight framework.
2.8.1 Retail credit riskThe Bank manages three credit portfolios. The unsecured personal loans and credit card portfolios are active books. The mortgage book, which represents a very small percentage of the Bank’s assets, is closed to new business and therefore running down. The Bank conducts the majority of its activities in the ‘prime’ segment of the market (customers with clean credit histories who are not over-indebted).
The Bank’s risk appetite for retail credit risk defines: — the target market for its lending; and — tolerance levels for the quality of loans and credit card stock and new business.
The Bank monitors external economic indicators to identify changes to the external environment. Appropriate management actions are detailed which would be considered in response to the change in the level of economic stress.
The risk of customer defaults on loans and credit cards is managed through automated decision systems using scorecards and policy rules developed by the Bank.
Application scorecards for loans and credit cards, and account management scorecards for credit cards, are developed using data from the Bank’s own credit portfolios supplemented by data from the credit bureaux. The effectiveness of the scorecards and policy rules is regularly monitored, and re-calibration undertaken where necessary. In addition, behavioural scoring is used to assess the conduct of customers’ accounts on an on-going basis, for example granting extensions to limits. Where subjective assessments are undertaken, these are subject to strict controls and monitoring with manual underwriting being undertaken by specialist teams in operational areas.
Comprehensive management information on the economy, portfolio limits, quality of new business, stock performance, bad debts trends and collections and recoveries performance is presented to the Retail Credit Risk Committee.
Within the EWRMF, the Retail Credit Risk policy is classified as a key risk policy and is approved by the Board. The Bank ensures that standards are in place to ensure that it is a responsible lender and manages customers in financial difficulties appropriately. There are appropriate frameworks, toolkits, processes and procedures in place to ensure adherence to policies and standards. Internal Audit and Risk Assurance teams carry out regular reviews of all elements of the framework.
2.8.2 Wholesale credit riskThe Bank invests its liquidity resources as governed by the wholesale credit risk appetite statement and relevant Treasury policies and standards. Approved investments include deposits with the Bank of England’s reserve account, unsecured cash deposits, repurchase agreements (reverse), UK Government securities (Gilts or Treasury bills), debt securities issued by multilateral development banks and government guaranteed agencies, covered bonds, certificates of deposits and money market funds.
Although these investments are for the purposes of liquidity risk management, they are exposed to the risk of loss arising from a counterparty being unable to meet their financial obligations to the Bank when they are expected to fall due. To mitigate this risk, all investment activity is governed by dealing mandates, with approval of counterparties limits, asset classes and instruments by ALCO and subject to BRC/Board oversight.
In order to mitigate concentrations of credit risk, the Bank’s Treasury investment standard includes appropriate limits to ensure a diversified credit risk exposure. Identified concentrations of credit risk are controlled and managed according to counterparty, asset class and their respective credit qualities. Consideration is also given to geographical region and the strength of the relevant sovereign credit rating.
Regular monitoring is undertaken by the Bank’s Treasury department with updates provided to senior management and ALCO members. These updates also make reference to daily early warning indicators which have been established to ensure emerging wholesale or market risk is identified in a timely manner.
For the effective management of risks, any changes to potential counterparties, their limits or their ratings are recommended by Treasury and subsequently approved by ALCO and BRC/Board. Derivatives are subject to the same credit risk control procedures as are applied to other wholesale market instruments and the credit risk arising from mark to market derivative valuations is mitigated by daily margin calls, posting cash collateral to cover exposures.
2.8.3 Liquidity & funding riskLiquidity risk is the risk that the Bank cannot maintain or generate sufficient cash resources to meet its payment obligations as they are expected to fall due, or can only do so at extreme cost. The Bank seeks to maintain a liquidity and funding profile to ensure that it can meet its financial obligations under stressed market conditions.
The Bank has completed an Internal Liquidity Adequacy Assessment Process (ILAAP) which allows the Bank to demonstrate that it understands the liquidity risks it is running and has appropriate controls in place to mitigate them. The ILAAP is also used to scale the limits that are applied to liquidity and funding and these are informed by a number of stress scenarios that assess the survival period of the Bank.
In meeting internal limits as well as PRA requirements, the Bank maintains a stock of high quality liquid assets that can be readily sold, or repo’d, to meet the Bank’s obligations to depositors and other creditors. The portfolio of assets is managed on a daily basis and within the framework as outlined in the ILAAP and by the PRA.
In addition to this, the Bank prepares both long term and short term forecasts to assess liquidity requirements, taking into account factors such as ATM cash management, investment maturities and customer deposit patterns and balances. These reports support liquidity management and are reviewed daily by management along with early warning indicators. Early warning indicators include market stress indicators such as 3 month LIBOR and the yield spread on UK bonds and also firm specific indicators such as unexpected levels of withdrawals on the Bank’s retail deposits.
The following are reported to ALCO on a monthly basis: — asset encumbrance ratios; and — risk indicators for wholesale funding concentrations by type (total/secured/unsecured), maturity, sector, geography, and counterparty.
Sainsbury’s Bank Pillar 3 Disclosures
Sainsbury’s Bank plc Pillar 3 Disclosures for the year ended 29 February 20166
The Bank’s Liquidity Coverage Ratio (LCR) and Net Stable Funding Ratio (NSFR) are regularly monitored and forecast alongside other cash flow and liquidity ratios. Actual and forward looking forecasts for these ratios are reported to the Treasurer and Treasury Risk weekly and also to ALCO, BRC and the Board.
2.8.4 Market risk The main source of market risk is Interest Rate Risk in the Banking Book (IRRBB) which arises from the provision of financial products to the Bank’s retail customer base as well as from wholesale exposures. The possibility of differences in rate resets for assets and liabilities arising from their potentially different re-pricing and maturity characteristics as well as the impact of using different indices when resetting contracted financial obligations (basis risk), creates interest rate exposures requiring management.
Oversight of interest rate risk is the responsibility of ALCO. The Bank’s Market Risk Policy is reviewed annually and approved by ALCO and the BRC. The Bank does not take any market risk for speculative purposes and does not operate a trading book.
The Policy sets the framework and standards under which the Bank will measure, monitor and manage interest rate risk. Interest rate risk limits aligned with the policy are defined on an aggregate portfolio basis across differing maturity periods.
Interest rate risk exposure is managed through hedging of the fixed rate elements of the Bank’s retail lending. Where possible, the Bank takes advantage of natural hedging opportunities between fixed rate assets and liabilities with similar re-pricing characteristics. Interest risk exposure (based on net re-pricing gap) is managed within limits set by the BRC using interest rate swaps. Residual exposures are monitored by ALCO and the BRC according to risk appetite.
During the year, the Bank continued to transact hedging swaps with the objective of managing interest rate risk arising predominantly from the personal loan portfolio. These pay fixed, receive LIBOR rate interest swap contracts are designed to hedge the re-pricing risk on segments of the personal loan portfolio which earn fixed rate income and hence reduce net interest earnings volatility.
The Bank also transacted a series of receive fixed, pay LIBOR swaps for the purpose of stabilising earnings arising from the Bank’s net non-interest sensitive liabilities which include the Bank’s reserves.
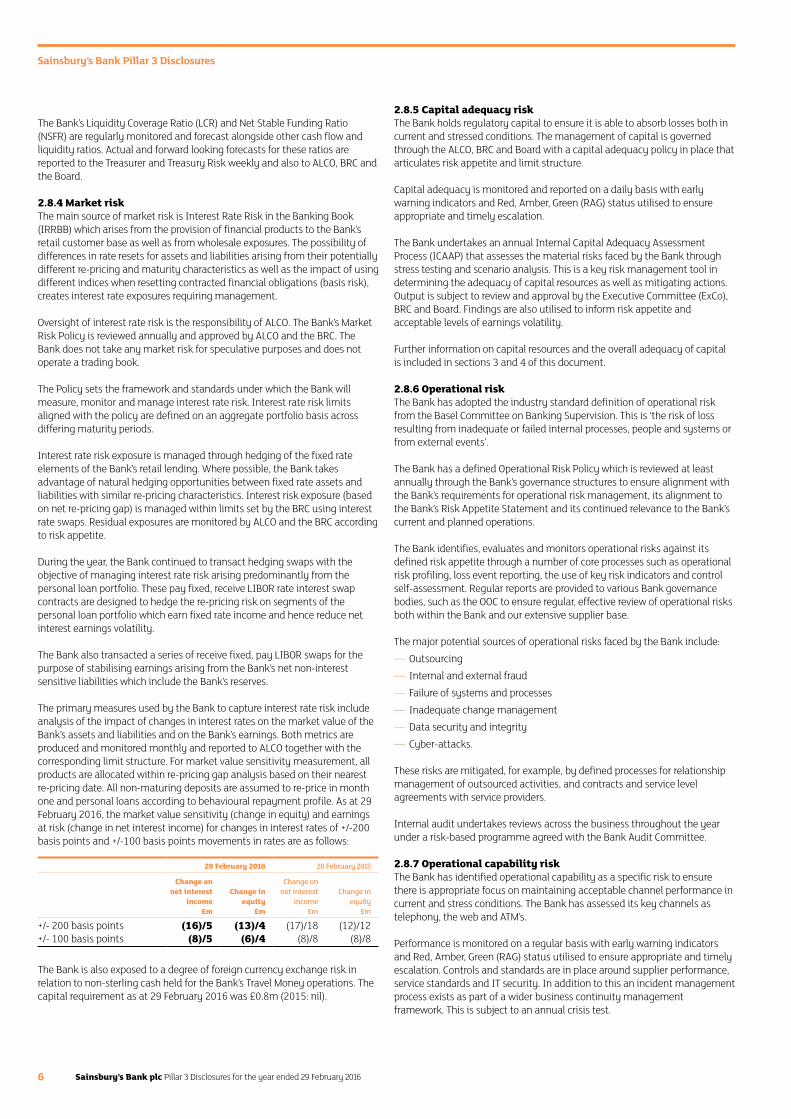
The primary measures used by the Bank to capture interest rate risk include analysis of the impact of changes in interest rates on the market value of the Bank’s assets and liabilities and on the Bank’s earnings. Both metrics are produced and monitored monthly and reported to ALCO together with the corresponding limit structure. For market value sensitivity measurement, all products are allocated within re-pricing gap analysis based on their nearest re-pricing date. All non-maturing deposits are assumed to re-price in month one and personal loans according to behavioural repayment profile. As at 29 February 2016, the market value sensitivity (change in equity) and earnings at risk (change in net interest income) for changes in interest rates of +/-200 basis points and +/-100 basis points movements in rates are as follows:
29 February 2016 28 February 2015
Change on net interest
incomeChange in
equity
Change on net interest
incomeChange in
equity£m £m £m £m
+/- 200 basis points (16)/5 (13)/4 (17)/18 (12)/12+/- 100 basis points (8)/5 (6)/4 (8)/8 (8)/8
The Bank is also exposed to a degree of foreign currency exchange risk in relation to non-sterling cash held for the Bank’s Travel Money operations. The capital requirement as at 29 February 2016 was £0.8m (2015: nil).
2.8.5 Capital adequacy riskThe Bank holds regulatory capital to ensure it is able to absorb losses both in current and stressed conditions. The management of capital is governed through the ALCO, BRC and Board with a capital adequacy policy in place that articulates risk appetite and limit structure.
Capital adequacy is monitored and reported on a daily basis with early warning indicators and Red, Amber, Green (RAG) status utilised to ensure appropriate and timely escalation.
The Bank undertakes an annual Internal Capital Adequacy Assessment Process (ICAAP) that assesses the material risks faced by the Bank through stress testing and scenario analysis. This is a key risk management tool in determining the adequacy of capital resources as well as mitigating actions. Output is subject to review and approval by the Executive Committee (ExCo), BRC and Board. Findings are also utilised to inform risk appetite and acceptable levels of earnings volatility.
Further information on capital resources and the overall adequacy of capital is included in sections 3 and 4 of this document.
2.8.6 Operational riskThe Bank has adopted the industry standard definition of operational risk from the Basel Committee on Banking Supervision. This is ‘the risk of loss resulting from inadequate or failed internal processes, people and systems or from external events’.
The Bank has a defined Operational Risk Policy which is reviewed at least annually through the Bank’s governance structures to ensure alignment with the Bank’s requirements for operational risk management, its alignment to the Bank’s Risk Appetite Statement and its continued relevance to the Bank’s current and planned operations.
The Bank identifies, evaluates and monitors operational risks against its defined risk appetite through a number of core processes such as operational risk profiling, loss event reporting, the use of key risk indicators and control self-assessment. Regular reports are provided to various Bank governance bodies, such as the OOC to ensure regular, effective review of operational risks both within the Bank and our extensive supplier base.
The major potential sources of operational risks faced by the Bank include: — Outsourcing — Internal and external fraud — Failure of systems and processes — Inadequate change management — Data security and integrity — Cyber-attacks.
These risks are mitigated, for example, by defined processes for relationship management of outsourced activities, and contracts and service level agreements with service providers.
Internal audit undertakes reviews across the business throughout the year under a risk-based programme agreed with the Bank Audit Committee.
2.8.7 Operational capability riskThe Bank has identified operational capability as a specific risk to ensure there is appropriate focus on maintaining acceptable channel performance in current and stress conditions. The Bank has assessed its key channels as telephony, the web and ATM’s.
Performance is monitored on a regular basis with early warning indicators and Red, Amber, Green (RAG) status utilised to ensure appropriate and timely escalation. Controls and standards are in place around supplier performance, service standards and IT security. In addition to this an incident management process exists as part of a wider business continuity management framework. This is subject to an annual crisis test.
Sainsbury’s Bank Pillar 3 Disclosures
Sainsbury’s Bank plc Pillar 3 Disclosures for the year ended 29 February 2016 7
2.8.8 Compliance & conduct riskCompliance and conduct risk is the risk of the consequences from the Bank failing to meet the requirements of legislation and regulatory requirements as defined by any relevant regulatory bodies. This can encompass legal and compliance risk, prudential risk and conduct with customers.
The Bank’s aim is to meet all legal and regulatory requirements and minimise any reputational impact by maintaining an effective control framework. Compliance and conduct advice and guidance is provided to the business structured predominately through a prescribed policy framework, implemented by the business and supported by effective second line monitoring and assurance.
Conduct risk is the risk that our actions or decisions could result in unfair outcomes causing loss or detriment for our customers. Keeping the trust of our customers is very important to the Bank. The Bank therefore has a low risk appetite to conduct risk and is committed to managing the business in a way that ensures it mitigates the risk of customer detriment.
As the Bank is predominantly an outsourced business, this also applies to our third party suppliers.
Management of our compliance and conduct risk is regularly reported through the Bank’s governance arrangements.
3. Capital resourcesThe Bank is required to hold own funds (capital resources) in accordance with the CRR, which sets out the quantity and quality of own funds necessary to meet requirements (Pillar 1). The PRA sets and monitors capital requirements for the Bank (Pillar 2). In implementing current capital requirements the PRA requires the Bank to maintain a prescribed level of capital with reference to risk weighted assets and the perceived risk management framework.
At 29 February 2016 and throughout the period, the Bank complied with the capital requirements that were in force as set out by the PRA.
The Bank manages its capital structure and makes adjustments to it in light of changes in economic conditions and the risk characteristics of its activities.
The Bank’s Regulatory capital is analysed into Tier 1 capital and Tier 2 capital. Tier 1 capital consists entirely of Common Equity Tier 1 (CET 1) capital, representing ordinary share capital and reserves with regulatory deductions. The Bank has no Tier 2 capital.
The table below shows the breakdown of total available capital for the Bank.
The transitional own funds disclosure is shown in Annex V.
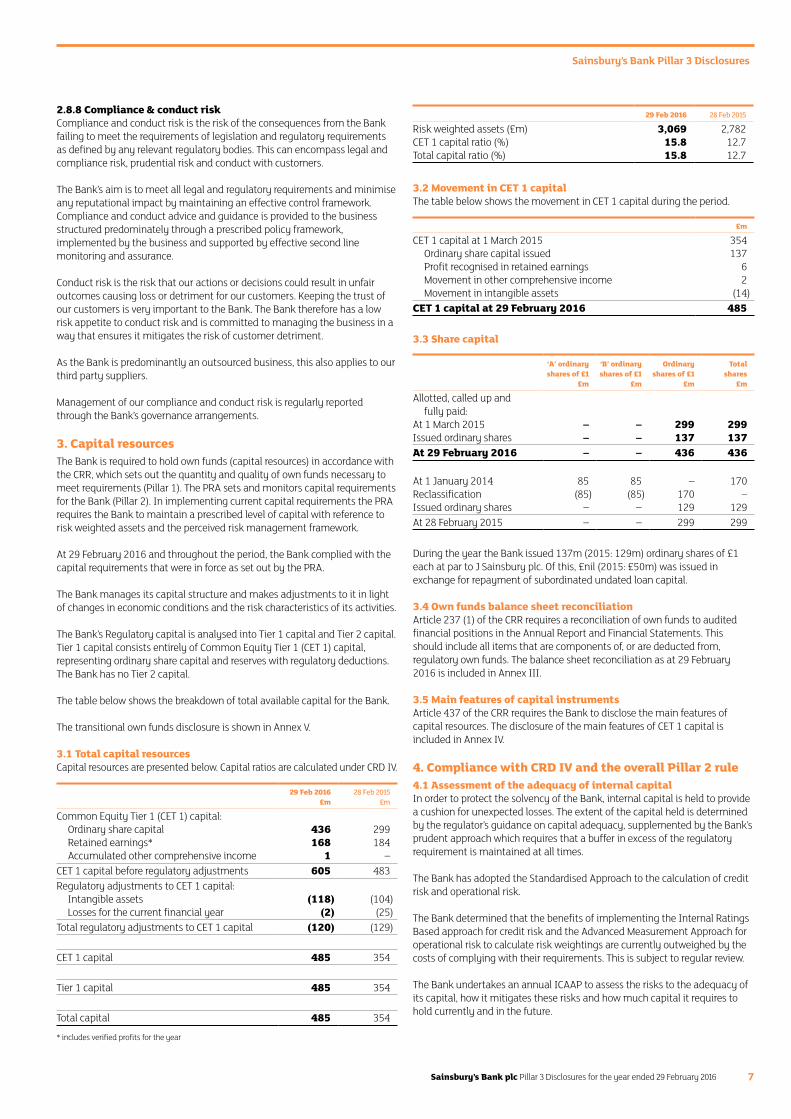
3.1 Total capital resourcesCapital resources are presented below. Capital ratios are calculated under CRD IV.
29 Feb 2016 28 Feb 2015 £m £m
Common Equity Tier 1 (CET 1) capital:Ordinary share capital 436 299Retained earnings* 168 184Accumulated other comprehensive income 1 –
CET 1 capital before regulatory adjustments 605 483Regulatory adjustments to CET 1 capital:
Intangible assets (118) (104)Losses for the current financial year (2) (25)
Total regulatory adjustments to CET 1 capital (120) (129)
CET 1 capital 485 354
Tier 1 capital 485 354
Total capital 485 354
* includes verified profits for the year
29 Feb 2016 28 Feb 2015
Risk weighted assets (£m) 3,069 2,782CET 1 capital ratio (%) 15.8 12.7Total capital ratio (%) 15.8 12.7
3.2 Movement in CET 1 capitalThe table below shows the movement in CET 1 capital during the period.
£m
CET 1 capital at 1 March 2015 354Ordinary share capital issued 137Profit recognised in retained earnings 6Movement in other comprehensive income 2Movement in intangible assets (14)
CET 1 capital at 29 February 2016 485
3.3 Share capital
‘A’ ordinaryshares of £1
‘B’ ordinaryshares of £1
Ordinary shares of £1
Totalshares
£m £m £m £m
Allotted, called up and fully paid:
At 1 March 2015 – – 299 299Issued ordinary shares – – 137 137At 29 February 2016 – – 436 436
At 1 January 2014 85 85 – 170Reclassification (85) (85) 170 –Issued ordinary shares – – 129 129At 28 February 2015 – – 299 299
During the year the Bank issued 137m (2015: 129m) ordinary shares of £1 each at par to J Sainsbury plc. Of this, £nil (2015: £50m) was issued in exchange for repayment of subordinated undated loan capital.
3.4 Own funds balance sheet reconciliationArticle 237 (1) of the CRR requires a reconciliation of own funds to audited financial positions in the Annual Report and Financial Statements. This should include all items that are components of, or are deducted from, regulatory own funds. The balance sheet reconciliation as at 29 February 2016 is included in Annex III.
3.5 Main features of capital instruments Article 437 of the CRR requires the Bank to disclose the main features of capital resources. The disclosure of the main features of CET 1 capital is included in Annex IV.
4. Compliance with CRD IV and the overall Pillar 2 rule4.1 Assessment of the adequacy of internal capital In order to protect the solvency of the Bank, internal capital is held to provide a cushion for unexpected losses. The extent of the capital held is determined by the regulator’s guidance on capital adequacy, supplemented by the Bank’s prudent approach which requires that a buffer in excess of the regulatory requirement is maintained at all times.
The Bank has adopted the Standardised Approach to the calculation of credit risk and operational risk.
The Bank determined that the benefits of implementing the Internal Ratings Based approach for credit risk and the Advanced Measurement Approach for operational risk to calculate risk weightings are currently outweighed by the costs of complying with their requirements. This is subject to regular review.
The Bank undertakes an annual ICAAP to assess the risks to the adequacy of its capital, how it mitigates these risks and how much capital it requires to hold currently and in the future.
Sainsbury’s Bank Pillar 3 Disclosures
Sainsbury’s Bank plc Pillar 3 Disclosures for the year ended 29 February 20168
Capital adequacy is reviewed by the Board, and ALCO, and is reported to the PRA on a quarterly basis. The Bank holds capital well in excess of the capital requirement calculated in the ICAAP.
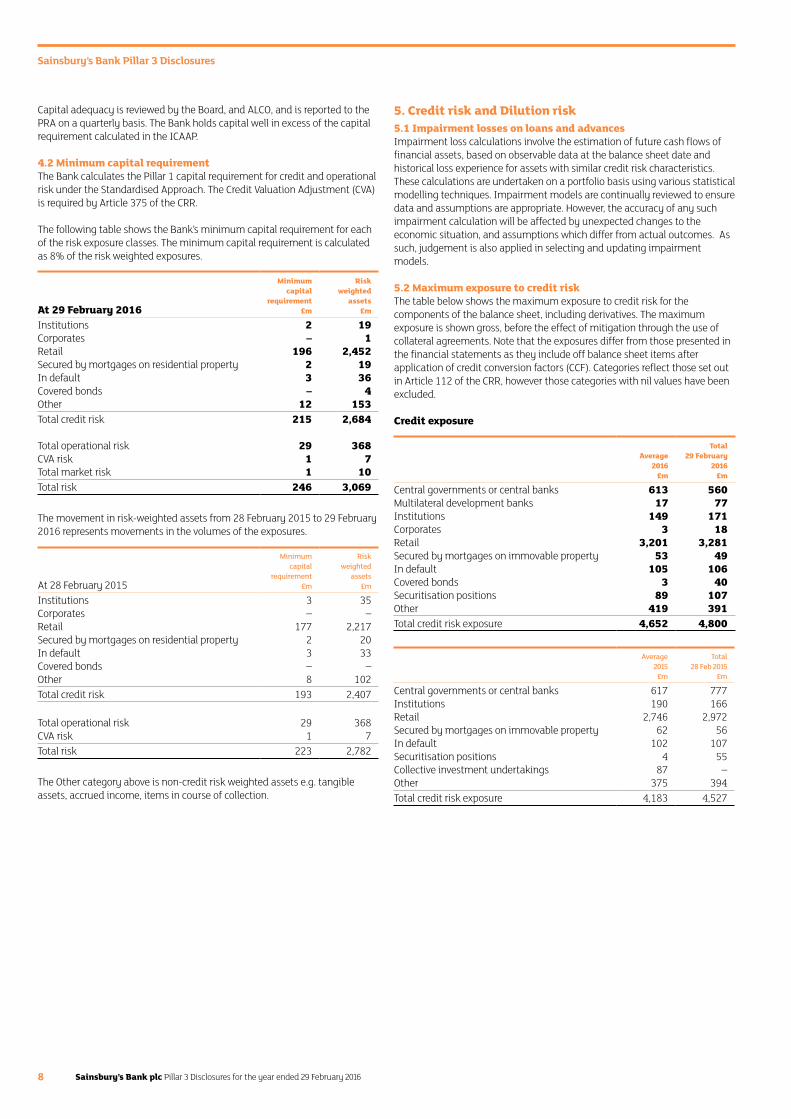
4.2 Minimum capital requirementThe Bank calculates the Pillar 1 capital requirement for credit and operational risk under the Standardised Approach. The Credit Valuation Adjustment (CVA) is required by Article 375 of the CRR.
The following table shows the Bank’s minimum capital requirement for each of the risk exposure classes. The minimum capital requirement is calculated as 8% of the risk weighted exposures.
At 29 February 2016
Minimum capital
requirement£m
Risk weighted
assets£m
Institutions 2 19Corporates – 1Retail 196 2,452Secured by mortgages on residential property 2 19In defaultCovered bonds
3–
364
Other 12 153Total credit risk 215 2,684
Total operational risk 29 368CVA risk 1 7Total market risk 1 10Total risk 246 3,069
The movement in risk-weighted assets from 28 February 2015 to 29 February 2016 represents movements in the volumes of the exposures.
At 28 February 2015
Minimum capital
requirement£m
Riskweighted
assets£m
Institutions 3 35Corporates – –Retail 177 2,217Secured by mortgages on residential property 2 20In default 3 33Covered bonds – –Other 8 102Total credit risk 193 2,407
Total operational risk 29 368CVA risk 1 7Total risk 223 2,782
The Other category above is non-credit risk weighted assets e.g. tangible assets, accrued income, items in course of collection.
5. Credit risk and Dilution risk5.1 Impairment losses on loans and advances Impairment loss calculations involve the estimation of future cash flows of financial assets, based on observable data at the balance sheet date and historical loss experience for assets with similar credit risk characteristics. These calculations are undertaken on a portfolio basis using various statistical modelling techniques. Impairment models are continually reviewed to ensure data and assumptions are appropriate. However, the accuracy of any such impairment calculation will be affected by unexpected changes to the economic situation, and assumptions which differ from actual outcomes. As such, judgement is also applied in selecting and updating impairment models.
5.2 Maximum exposure to credit risk The table below shows the maximum exposure to credit risk for the components of the balance sheet, including derivatives. The maximum exposure is shown gross, before the effect of mitigation through the use of collateral agreements. Note that the exposures differ from those presented in the financial statements as they include off balance sheet items after application of credit conversion factors (CCF). Categories reflect those set out in Article 112 of the CRR, however those categories with nil values have been excluded.
Credit exposure
Average2016
Total29 February
2016£m £m
Central governments or central banks 613 560Multilateral development banks 17 77Institutions 149 171Corporates 3 18Retail 3,201 3,281Secured by mortgages on immovable property 53 49In default 105 106Covered bonds 3 40Securitisation positions 89 107Other 419 391Total credit risk exposure 4,652 4,800
Average2015
Total28 Feb 2015
£m £m
Central governments or central banks 617 777Institutions 190 166Retail 2,746 2,972Secured by mortgages on immovable property 62 56In default 102 107Securitisation positions 4 55Collective investment undertakings 87 –Other 375 394Total credit risk exposure 4,183 4,527
Sainsbury’s Bank Pillar 3 Disclosures
Sainsbury’s Bank plc Pillar 3 Disclosures for the year ended 29 February 2016 9
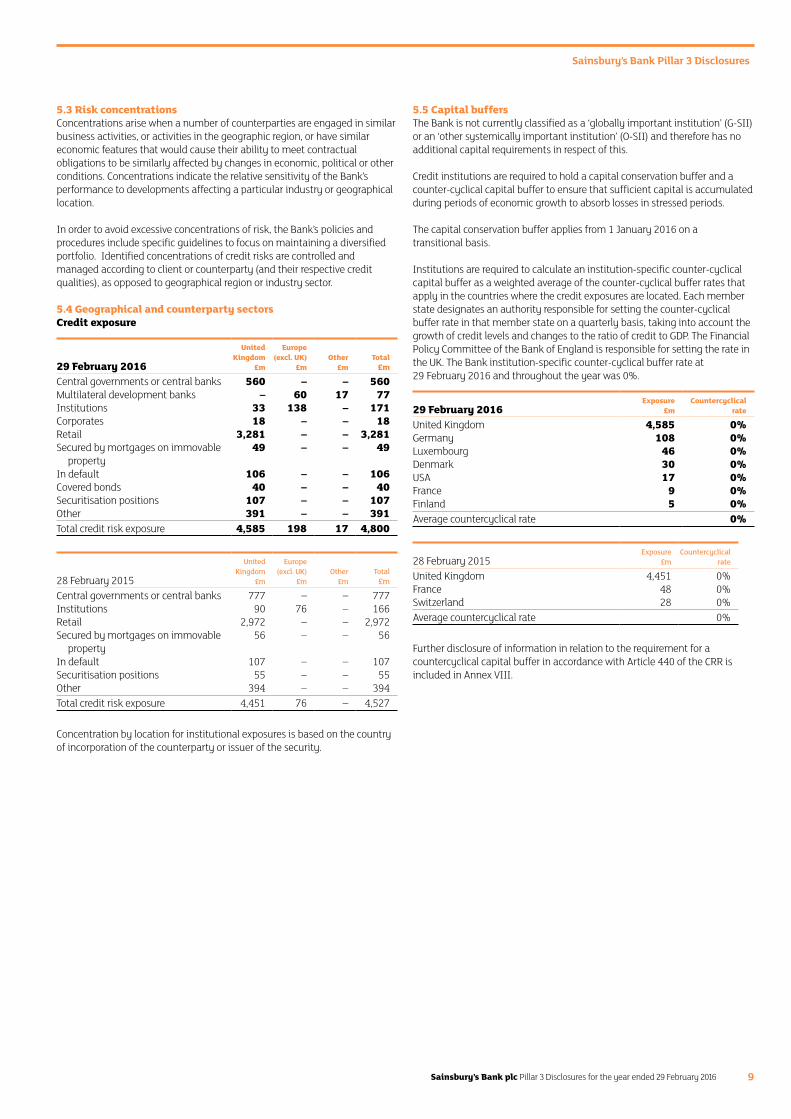
5.3 Risk concentrations Concentrations arise when a number of counterparties are engaged in similar business activities, or activities in the geographic region, or have similar economic features that would cause their ability to meet contractual obligations to be similarly affected by changes in economic, political or other conditions. Concentrations indicate the relative sensitivity of the Bank’s performance to developments affecting a particular industry or geographical location.
In order to avoid excessive concentrations of risk, the Bank’s policies and procedures include specific guidelines to focus on maintaining a diversified portfolio. Identified concentrations of credit risks are controlled and managed according to client or counterparty (and their respective credit qualities), as opposed to geographical region or industry sector.
5.4 Geographical and counterparty sectorsCredit exposure
29 February 2016
United Kingdom
£m
Europe (excl. UK)
£mOther
£mTotal
£m
Central governments or central banks 560 – – 560Multilateral development banks – 60 17 77Institutions 33 138 – 171Corporates 18 – – 18Retail 3,281 – – 3,281Secured by mortgages on immovable
property49 – – 49
In default 106 – – 106Covered bonds 40 – – 40Securitisation positions 107 – – 107Other 391 – – 391Total credit risk exposure 4,585 198 17 4,800
28 February 2015
United Kingdom
£m
Europe (excl. UK)
£mOther
£mTotal
£m
Central governments or central banks 777 – – 777Institutions 90 76 – 166Retail 2,972 – – 2,972Secured by mortgages on immovable
property56 – – 56
In default 107 – – 107Securitisation positions 55 – – 55Other 394 – – 394Total credit risk exposure 4,451 76 – 4,527
Concentration by location for institutional exposures is based on the country of incorporation of the counterparty or issuer of the security.
5.5 Capital buffersThe Bank is not currently classified as a ‘globally important institution’ (G-SII) or an ‘other systemically important institution’ (O-SII) and therefore has no additional capital requirements in respect of this.
Credit institutions are required to hold a capital conservation buffer and a counter-cyclical capital buffer to ensure that sufficient capital is accumulated during periods of economic growth to absorb losses in stressed periods.
The capital conservation buffer applies from 1 January 2016 on a transitional basis.
Institutions are required to calculate an institution-specific counter-cyclical capital buffer as a weighted average of the counter-cyclical buffer rates that apply in the countries where the credit exposures are located. Each member state designates an authority responsible for setting the counter-cyclical buffer rate in that member state on a quarterly basis, taking into account the growth of credit levels and changes to the ratio of credit to GDP. The Financial Policy Committee of the Bank of England is responsible for setting the rate in the UK. The Bank institution-specific counter-cyclical buffer rate at 29 February 2016 and throughout the year was 0%.
29 February 2016Exposure
£mCountercyclical
rate
United Kingdom 4,585 0%Germany 108 0%Luxembourg 46 0%Denmark 30 0%USA 17 0%France 9 0%Finland 5 0%Average countercyclical rate 0%
28 February 2015Exposure
£mCountercyclical
rate
United Kingdom 4,451 0%France 48 0%Switzerland 28 0%Average countercyclical rate 0%
Further disclosure of information in relation to the requirement for a countercyclical capital buffer in accordance with Article 440 of the CRR is included in Annex VIII.
Sainsbury’s Bank Pillar 3 Disclosures
Sainsbury’s Bank plc Pillar 3 Disclosures for the year ended 29 February 201610
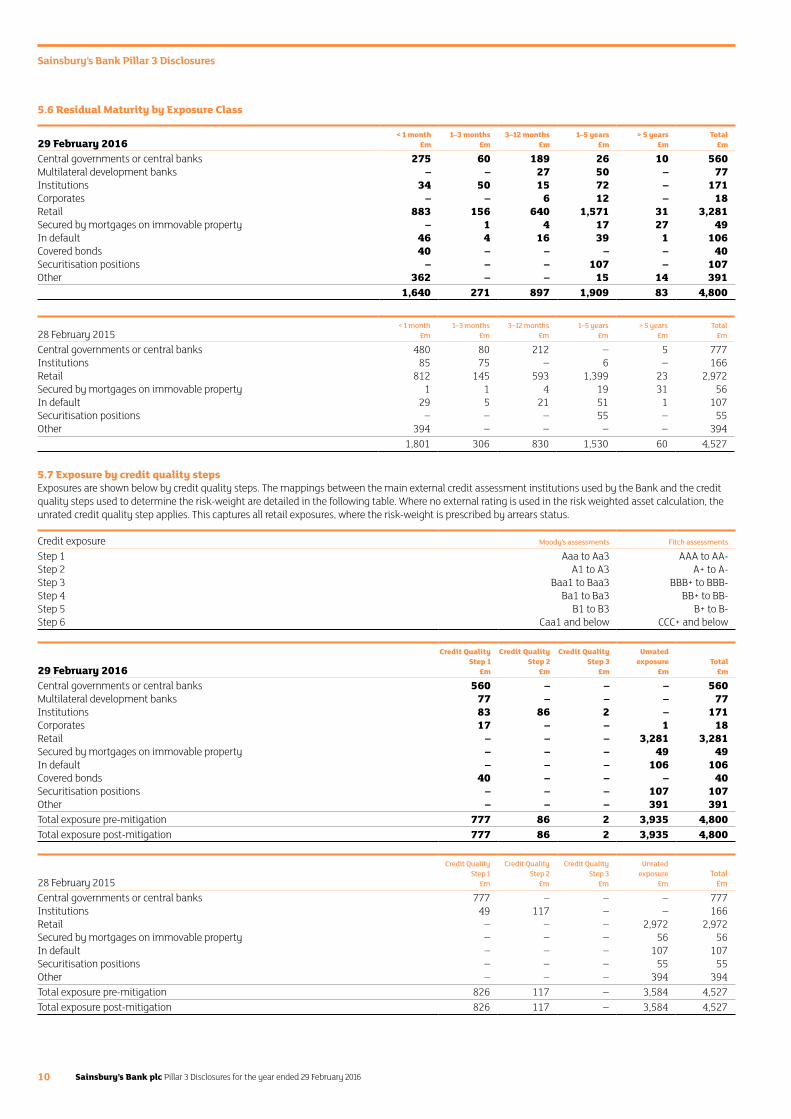
5.6 Residual Maturity by Exposure Class
29 February 2016< 1 month
£m1–3 months
£m3–12 months
£m1–5 years
£m> 5 years
£mTotal
£m
Central governments or central banks 275 60 189 26 10 560Multilateral development banks – – 27 50 – 77Institutions 34 50 15 72 – 171Corporates – – 6 12 – 18Retail 883 156 640 1,571 31 3,281Secured by mortgages on immovable property – 1 4 17 27 49In default 46 4 16 39 1 106Covered bonds 40 – – – – 40Securitisation positions – – – 107 – 107Other 362 – – 15 14 391
1,640 271 897 1,909 83 4,800
28 February 2015< 1 month
£m1–3 months
£m3–12 months
£m1–5 years
£m> 5 years
£mTotal
£m
Central governments or central banks 480 80 212 – 5 777Institutions 85 75 – 6 – 166Retail 812 145 593 1,399 23 2,972Secured by mortgages on immovable property 1 1 4 19 31 56In default 29 5 21 51 1 107Securitisation positions – – – 55 – 55Other 394 – – – – 394
1,801 306 830 1,530 60 4,527
5.7 Exposure by credit quality stepsExposures are shown below by credit quality steps. The mappings between the main external credit assessment institutions used by the Bank and the credit quality steps used to determine the risk-weight are detailed in the following table. Where no external rating is used in the risk weighted asset calculation, the unrated credit quality step applies. This captures all retail exposures, where the risk-weight is prescribed by arrears status.
Credit exposure Moody’s assessments Fitch assessments
Step 1 Aaa to Aa3 AAA to AA-Step 2 A1 to A3 A+ to A-Step 3 Baa1 to Baa3 BBB+ to BBB-Step 4 Ba1 to Ba3 BB+ to BB-Step 5 B1 to B3 B+ to B-Step 6 Caa1 and below CCC+ and below
29 February 2016
Credit Quality Step 1
£m
Credit Quality Step 2
£m
Credit Quality Step 3
£m
Unrated exposure
£mTotal
£m
Central governments or central banks 560 – – – 560Multilateral development banks 77 – – – 77Institutions 83 86 2 – 171Corporates 17 – – 1 18Retail – – – 3,281 3,281Secured by mortgages on immovable property – – – 49 49In default – – – 106 106Covered bonds 40 – – – 40Securitisation positions – – – 107 107Other – – – 391 391Total exposure pre-mitigation 777 86 2 3,935 4,800Total exposure post-mitigation 777 86 2 3,935 4,800
28 February 2015
Credit Quality Step 1
£m
Credit Quality Step 2
£m
Credit Quality Step 3
£m
Unrated exposure
£mTotal
£m
Central governments or central banks 777 – – – 777Institutions 49 117 – – 166Retail – – – 2,972 2,972Secured by mortgages on immovable property – – – 56 56In default – – – 107 107Securitisation positions – – – 55 55Other – – – 394 394Total exposure pre-mitigation 826 117 – 3,584 4,527Total exposure post-mitigation 826 117 – 3,584 4,527
Sainsbury’s Bank Pillar 3 Disclosures
Sainsbury’s Bank plc Pillar 3 Disclosures for the year ended 29 February 2016 11
5.8 Credit risk mitigation5.8.1 RetailMortgages held over residential properties represent the only collateral held by the Bank for retail exposures. The fair value of collateral held for impaired loans and loans past due but not impaired at 29 February 2016 was £5m (28 February 2015: £7m). The fair value of collateral held against possession cases was £nil (28 February 2015: £nil).
Where the arrears status of a customer deteriorates and there is a failure to respond to correspondence or an acceptable repayment proposal, including notice of default, the customer balance will fall into ‘recoveries’. Recoveries will take steps to recover the debt, using their expertise to determine the optimum recovery strategy.
5.8.2 WholesaleThe maximum credit exposure to any client or counterparty as of 29 February 2016 was £509m to the Bank of England (28 February 2015: £719m) before taking into account collateral or other credit enhancements of £nil (28 February 2015: £nil).
In addition to repo and reverse repo transactions, the Bank manages collateral to mitigate derivatives credit risk exposures and in respect of its secured funding activities. Derivatives collateral is managed daily and adjusted to reflect derivatives market value fluctuations in line with International Swaps and Derivatives Association (ISDA) Credit Support Annexes (CSAs) between the Bank and its counterparties. Secured wholesale funding is obtained under the Bank of England’s Funding for Lending Scheme (FLS) and from a bilateral personal loans securitisation facility. Both of these facilities are secured using the Bank’s personal loans. These loans continue to be managed and serviced by the Bank, with measures such as asset quality and valuation reported regularly to relevant counterparties. The Bank has prepositioned similar loan collateral with the Bank of England to provide access to the Bank of England’s Discount Window Facility (DWF), which forms part of the Bank’s operational liquidity pool (OLP). The OLP is defined as the level of liquidity sufficient to ensure the survival of the Bank for at least 3 months under the worst case internal liquidity stress scenario. The OLP consists of high quality liquid assets (as defined by the EU Delegated Act on Liquidity), certificates of deposit and available DWF funding. The Bank utilises netting agreements with certain counterparties in respect of derivative transactions. The Bank does not transact credit derivatives.
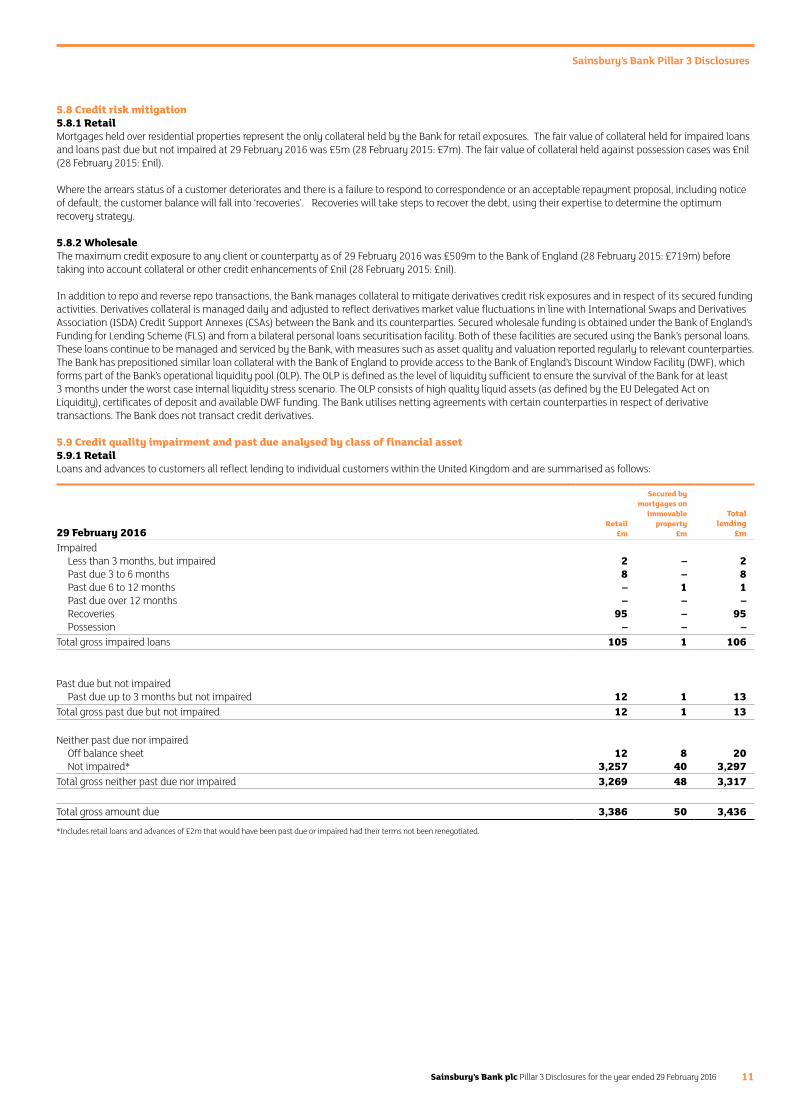
5.9 Credit quality impairment and past due analysed by class of financial asset5.9.1 RetailLoans and advances to customers all reflect lending to individual customers within the United Kingdom and are summarised as follows:
29 February 2016Retail
£m
Secured by mortgages on
immovable property
£m
Total lending
£m
ImpairedLess than 3 months, but impaired 2 – 2Past due 3 to 6 months 8 – 8Past due 6 to 12 months – 1 1Past due over 12 months – – –Recoveries 95 – 95Possession – – –
Total gross impaired loans 105 1 106
Past due but not impairedPast due up to 3 months but not impaired 12 1 13
Total gross past due but not impaired 12 1 13
Neither past due nor impairedOff balance sheet 12 8 20Not impaired* 3,257 40 3,297
Total gross neither past due nor impaired 3,269 48 3,317
Total gross amount due 3,386 50 3,436
*Includes retail loans and advances of £2m that would have been past due or impaired had their terms not been renegotiated.
Sainsbury’s Bank Pillar 3 Disclosures
Sainsbury’s Bank plc Pillar 3 Disclosures for the year ended 29 February 201612
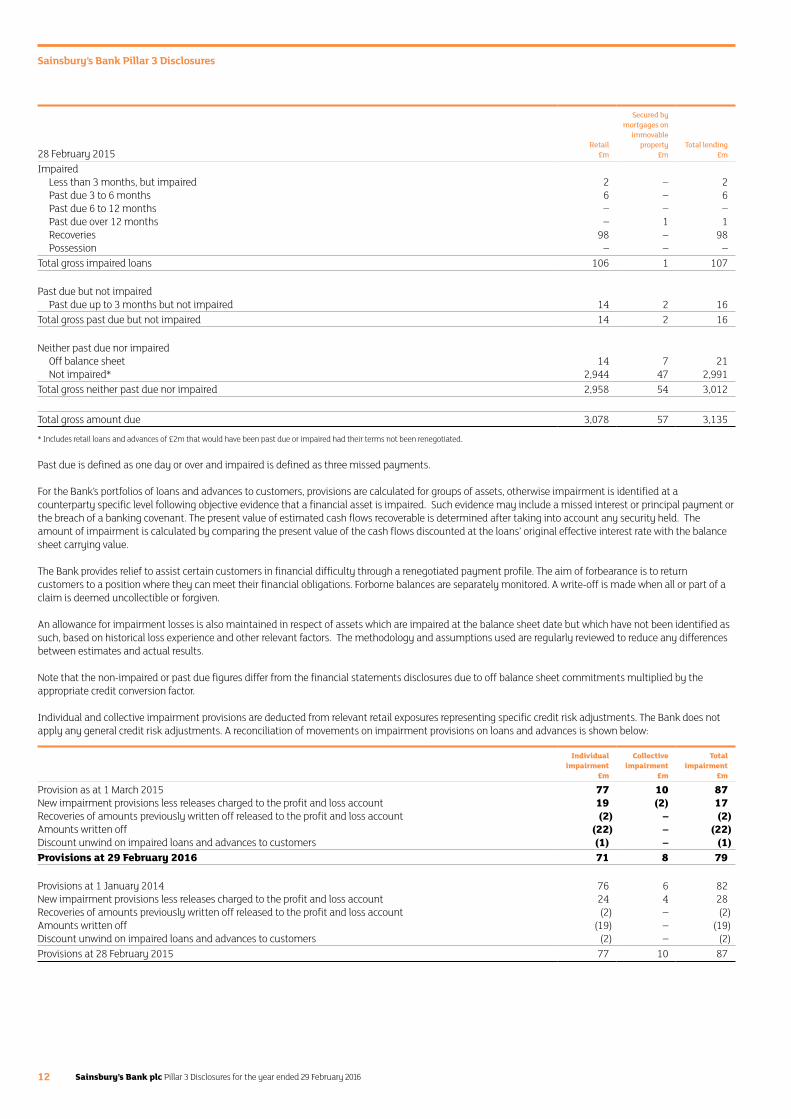
28 February 2015Retail
£m
Secured by mortgages on
immovable property
£mTotal lending
£m
ImpairedLess than 3 months, but impaired 2 – 2Past due 3 to 6 months 6 – 6Past due 6 to 12 months – – –Past due over 12 months – 1 1Recoveries 98 – 98Possession – – –
Total gross impaired loans 106 1 107
Past due but not impairedPast due up to 3 months but not impaired 14 2 16
Total gross past due but not impaired 14 2 16
Neither past due nor impairedOff balance sheet 14 7 21Not impaired* 2,944 47 2,991
Total gross neither past due nor impaired 2,958 54 3,012
Total gross amount due 3,078 57 3,135
* Includes retail loans and advances of £2m that would have been past due or impaired had their terms not been renegotiated.
Past due is defined as one day or over and impaired is defined as three missed payments.
For the Bank’s portfolios of loans and advances to customers, provisions are calculated for groups of assets, otherwise impairment is identified at a counterparty specific level following objective evidence that a financial asset is impaired. Such evidence may include a missed interest or principal payment or the breach of a banking covenant. The present value of estimated cash flows recoverable is determined after taking into account any security held. The amount of impairment is calculated by comparing the present value of the cash flows discounted at the loans’ original effective interest rate with the balance sheet carrying value.
The Bank provides relief to assist certain customers in financial difficulty through a renegotiated payment profile. The aim of forbearance is to return customers to a position where they can meet their financial obligations. Forborne balances are separately monitored. A write-off is made when all or part of a claim is deemed uncollectible or forgiven.
An allowance for impairment losses is also maintained in respect of assets which are impaired at the balance sheet date but which have not been identified as such, based on historical loss experience and other relevant factors. The methodology and assumptions used are regularly reviewed to reduce any differences between estimates and actual results.
Note that the non-impaired or past due figures differ from the financial statements disclosures due to off balance sheet commitments multiplied by the appropriate credit conversion factor.
Individual and collective impairment provisions are deducted from relevant retail exposures representing specific credit risk adjustments. The Bank does not apply any general credit risk adjustments. A reconciliation of movements on impairment provisions on loans and advances is shown below:
Individual impairment
£m
Collective impairment
£m
Totalimpairment
£m
Provision as at 1 March 2015 77 10 87New impairment provisions less releases charged to the profit and loss account 19 (2) 17Recoveries of amounts previously written off released to the profit and loss account (2) – (2)Amounts written off (22) – (22)Discount unwind on impaired loans and advances to customers (1) – (1)Provisions at 29 February 2016 71 8 79
Provisions at 1 January 2014 76 6 82New impairment provisions less releases charged to the profit and loss account 24 4 28Recoveries of amounts previously written off released to the profit and loss account (2) – (2)Amounts written off (19) – (19)Discount unwind on impaired loans and advances to customers (2) – (2)Provisions at 28 February 2015 77 10 87
Sainsbury’s Bank Pillar 3 Disclosures
Sainsbury’s Bank plc Pillar 3 Disclosures for the year ended 29 February 2016 13
5.9.2 WholesaleThe total gross amount of individually impaired loans and advances to banks as at 29 February 2016 was £nil (28 February 2015: £nil). The fair value of collateral held for loans and advances to banks was £nil (28 February 2015: £nil). Collateral takes the form of security over UK Government securities (Gilts or Treasury bills) and cash.
The total gross amount of individually impaired debt securities, cash and balances with central banks, UK Government securities (Gilts and Treasury bills) and other eligible investment securities as at 29 February 2016 was £nil (2015: £nil). No collateral is held regarding these assets. Investment securities classified as available for sale are continually reviewed at the specific investment level for impairment. Impairment is recognised when there is objective evidence that a specific financial asset is impaired. Objective evidence of impairment might include a significant or prolonged decline in market value below the original cost of a financial asset and, in the case of debt securities, non-receipt of due interest or principal repayment, a breach of covenant within the security’s terms and conditions or a measurable decrease in the estimated future cash flows since their initial recognition.
The disappearance of active markets, declines in market value and ratings downgrades do not in themselves constitute objective evidence of impairment and, unless a default has occurred on a debt security, the determination of whether or not objective evidence of impairment is present at the balance sheet date requires the exercise of management judgement.
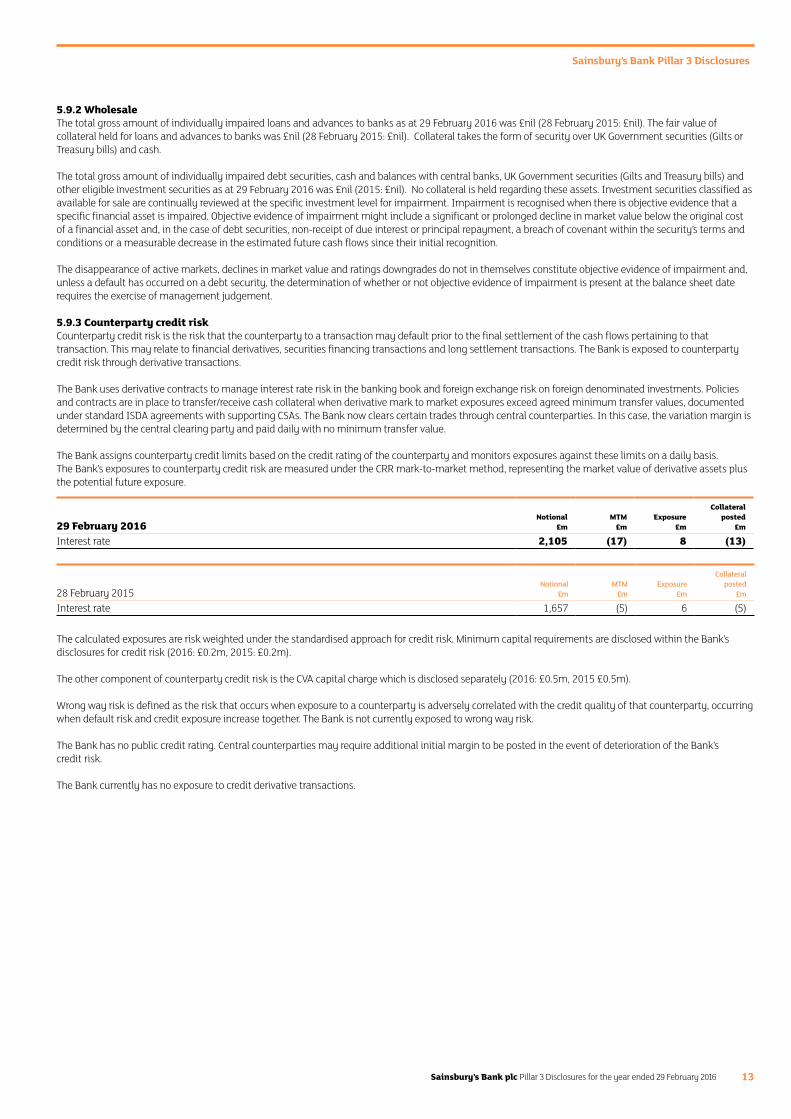
5.9.3 Counterparty credit riskCounterparty credit risk is the risk that the counterparty to a transaction may default prior to the final settlement of the cash flows pertaining to that transaction. This may relate to financial derivatives, securities financing transactions and long settlement transactions. The Bank is exposed to counterparty credit risk through derivative transactions.
The Bank uses derivative contracts to manage interest rate risk in the banking book and foreign exchange risk on foreign denominated investments. Policies and contracts are in place to transfer/receive cash collateral when derivative mark to market exposures exceed agreed minimum transfer values, documented under standard ISDA agreements with supporting CSAs. The Bank now clears certain trades through central counterparties. In this case, the variation margin is determined by the central clearing party and paid daily with no minimum transfer value.
The Bank assigns counterparty credit limits based on the credit rating of the counterparty and monitors exposures against these limits on a daily basis. The Bank’s exposures to counterparty credit risk are measured under the CRR mark-to-market method, representing the market value of derivative assets plus the potential future exposure.
29 February 2016Notional
£mMTM
£mExposure
£m
Collateral posted
£m
Interest rate 2,105 (17) 8 (13)
28 February 2015Notional
£mMTM
£mExposure
£m
Collateral posted
£m
Interest rate 1,657 (5) 6 (5)
The calculated exposures are risk weighted under the standardised approach for credit risk. Minimum capital requirements are disclosed within the Bank’s disclosures for credit risk (2016: £0.2m, 2015: £0.2m).
The other component of counterparty credit risk is the CVA capital charge which is disclosed separately (2016: £0.5m, 2015 £0.5m).
Wrong way risk is defined as the risk that occurs when exposure to a counterparty is adversely correlated with the credit quality of that counterparty, occurring when default risk and credit exposure increase together. The Bank is not currently exposed to wrong way risk.
The Bank has no public credit rating. Central counterparties may require additional initial margin to be posted in the event of deterioration of the Bank’s credit risk.
The Bank currently has no exposure to credit derivative transactions.
Sainsbury’s Bank Pillar 3 Disclosures
Sainsbury’s Bank plc Pillar 3 Disclosures for the year ended 29 February 201614
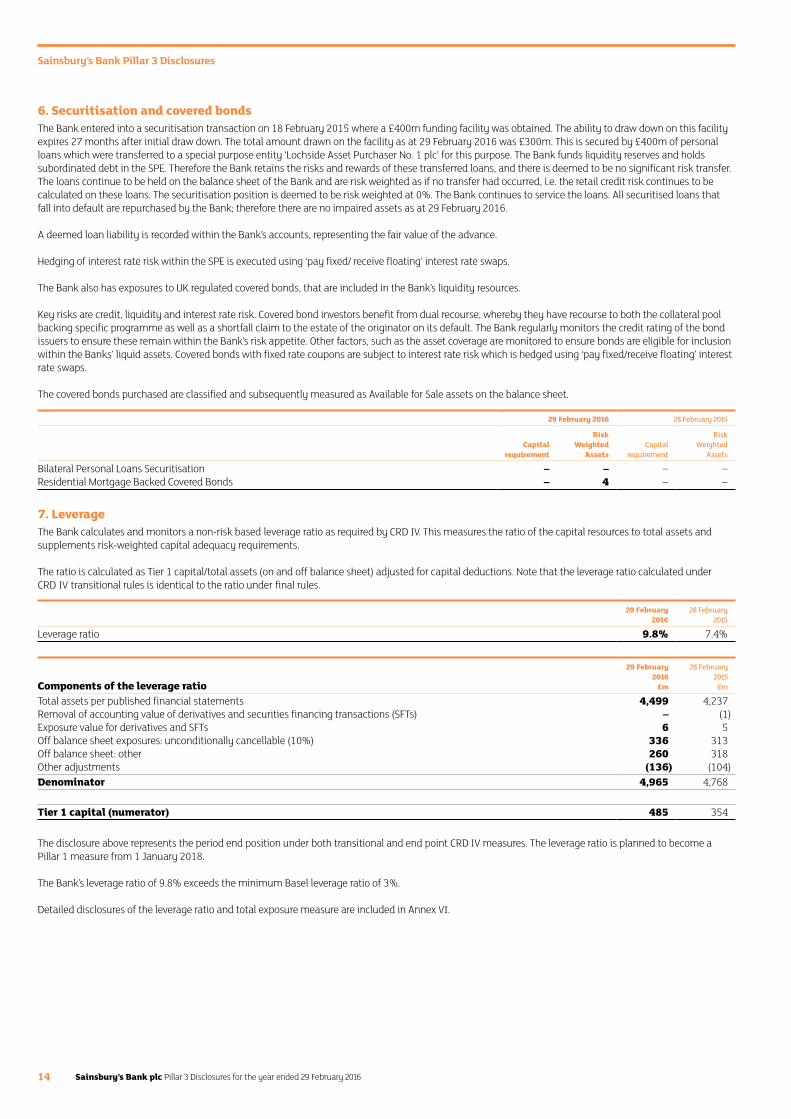
6. Securitisation and covered bondsThe Bank entered into a securitisation transaction on 18 February 2015 where a £400m funding facility was obtained. The ability to draw down on this facility expires 27 months after initial draw down. The total amount drawn on the facility as at 29 February 2016 was £300m. This is secured by £400m of personal loans which were transferred to a special purpose entity ‘Lochside Asset Purchaser No. 1 plc’ for this purpose. The Bank funds liquidity reserves and holds subordinated debt in the SPE. Therefore the Bank retains the risks and rewards of these transferred loans, and there is deemed to be no significant risk transfer. The loans continue to be held on the balance sheet of the Bank and are risk weighted as if no transfer had occurred, i.e. the retail credit risk continues to be calculated on these loans. The securitisation position is deemed to be risk weighted at 0%. The Bank continues to service the loans. All securitised loans that fall into default are repurchased by the Bank; therefore there are no impaired assets as at 29 February 2016.
A deemed loan liability is recorded within the Bank’s accounts, representing the fair value of the advance.
Hedging of interest rate risk within the SPE is executed using ‘pay fixed/ receive floating’ interest rate swaps.
The Bank also has exposures to UK regulated covered bonds, that are included in the Bank’s liquidity resources.
Key risks are credit, liquidity and interest rate risk. Covered bond investors benefit from dual recourse, whereby they have recourse to both the collateral pool backing specific programme as well as a shortfall claim to the estate of the originator on its default. The Bank regularly monitors the credit rating of the bond issuers to ensure these remain within the Bank’s risk appetite. Other factors, such as the asset coverage are monitored to ensure bonds are eligible for inclusion within the Banks’ liquid assets. Covered bonds with fixed rate coupons are subject to interest rate risk which is hedged using ‘pay fixed/receive floating’ interest rate swaps.
The covered bonds purchased are classified and subsequently measured as Available for Sale assets on the balance sheet.
29 February 2016 28 February 2015
Capital
requirement
Risk Weighted
AssetsCapital
requirement
Risk Weighted
Assets
Bilateral Personal Loans Securitisation – – – –Residential Mortgage Backed Covered Bonds – 4 – –
7. LeverageThe Bank calculates and monitors a non-risk based leverage ratio as required by CRD IV. This measures the ratio of the capital resources to total assets and supplements risk-weighted capital adequacy requirements. The ratio is calculated as Tier 1 capital/total assets (on and off balance sheet) adjusted for capital deductions. Note that the leverage ratio calculated under CRD IV transitional rules is identical to the ratio under final rules.
29 February 2016
28 February 2015
Leverage ratio 9.8% 7.4%
Components of the leverage ratio
29 February 2016
£m
28 February 2015
£m
Total assets per published financial statements 4,499 4,237Removal of accounting value of derivatives and securities financing transactions (SFTs) – (1)Exposure value for derivatives and SFTs 6 5Off balance sheet exposures: unconditionally cancellable (10%) 336 313Off balance sheet: other 260 318Other adjustments (136) (104)Denominator 4,965 4,768
Tier 1 capital (numerator) 485 354
The disclosure above represents the period end position under both transitional and end point CRD IV measures. The leverage ratio is planned to become a Pillar 1 measure from 1 January 2018.
The Bank’s leverage ratio of 9.8% exceeds the minimum Basel leverage ratio of 3%.
Detailed disclosures of the leverage ratio and total exposure measure are included in Annex VI.
Sainsbury’s Bank Pillar 3 Disclosures
Sainsbury’s Bank plc Pillar 3 Disclosures for the year ended 29 February 2016 15
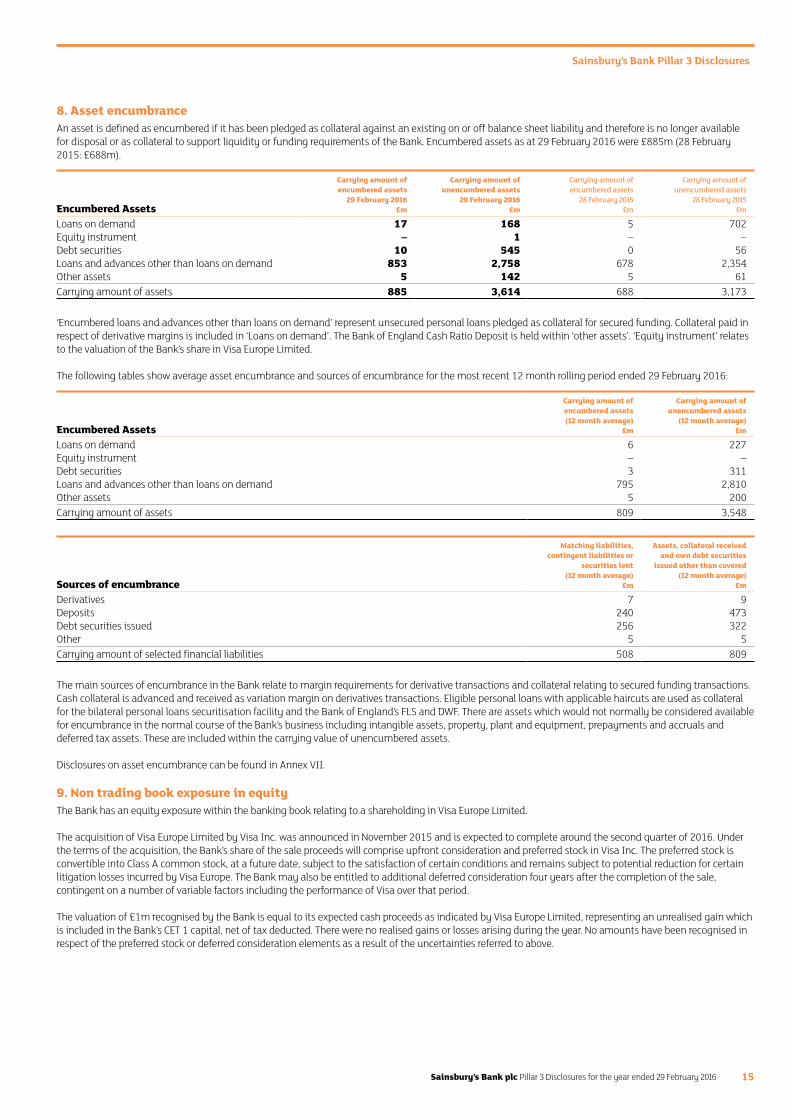
8. Asset encumbranceAn asset is defined as encumbered if it has been pledged as collateral against an existing on or off balance sheet liability and therefore is no longer available for disposal or as collateral to support liquidity or funding requirements of the Bank. Encumbered assets as at 29 February 2016 were £885m (28 February 2015: £688m).
Encumbered Assets
Carrying amount of encumbered assets
29 February 2016£m
Carrying amount of unencumbered assets
29 February 2016£m
Carrying amount of encumbered assets
28 February 2015£m
Carrying amount of unencumbered assets
28 February 2015£m
Loans on demand 17 168 5 702Equity instrument – 1 – –Debt securities 10 545 0 56Loans and advances other than loans on demand 853 2,758 678 2,354Other assets 5 142 5 61Carrying amount of assets 885 3,614 688 3,173
‘Encumbered loans and advances other than loans on demand’ represent unsecured personal loans pledged as collateral for secured funding. Collateral paid in respect of derivative margins is included in ‘Loans on demand’. The Bank of England Cash Ratio Deposit is held within ‘other assets’. ‘Equity instrument’ relates to the valuation of the Bank’s share in Visa Europe Limited.
The following tables show average asset encumbrance and sources of encumbrance for the most recent 12 month rolling period ended 29 February 2016:
Encumbered Assets
Carrying amount of encumbered assets (12 month average)
£m
Carrying amount of unencumbered assets
(12 month average)£m
Loans on demand 6 227Equity instrument – –Debt securities 3 311Loans and advances other than loans on demand 795 2,810Other assets 5 200Carrying amount of assets 809 3,548
Sources of encumbrance
Matching liabilities, contingent liabilities or
securities lent (12 month average)
£m
Assets, collateral received and own debt securities
issued other than covered (12 month average)
£m
Derivatives 7 9Deposits 240 473Debt securities issued 256 322Other 5 5Carrying amount of selected financial liabilities 508 809
The main sources of encumbrance in the Bank relate to margin requirements for derivative transactions and collateral relating to secured funding transactions. Cash collateral is advanced and received as variation margin on derivatives transactions. Eligible personal loans with applicable haircuts are used as collateral for the bilateral personal loans securitisation facility and the Bank of England’s FLS and DWF. There are assets which would not normally be considered available for encumbrance in the normal course of the Bank’s business including intangible assets, property, plant and equipment, prepayments and accruals and deferred tax assets. These are included within the carrying value of unencumbered assets.
Disclosures on asset encumbrance can be found in Annex VII.
9. Non trading book exposure in equityThe Bank has an equity exposure within the banking book relating to a shareholding in Visa Europe Limited.
The acquisition of Visa Europe Limited by Visa Inc. was announced in November 2015 and is expected to complete around the second quarter of 2016. Under the terms of the acquisition, the Bank’s share of the sale proceeds will comprise upfront consideration and preferred stock in Visa Inc. The preferred stock is convertible into Class A common stock, at a future date, subject to the satisfaction of certain conditions and remains subject to potential reduction for certain litigation losses incurred by Visa Europe. The Bank may also be entitled to additional deferred consideration four years after the completion of the sale, contingent on a number of variable factors including the performance of Visa over that period.
The valuation of £1m recognised by the Bank is equal to its expected cash proceeds as indicated by Visa Europe Limited, representing an unrealised gain which is included in the Bank’s CET 1 capital, net of tax deducted. There were no realised gains or losses arising during the year. No amounts have been recognised in respect of the preferred stock or deferred consideration elements as a result of the uncertainties referred to above.

Sainsbury’s Bank Pillar 3 Disclosures
Sainsbury’s Bank plc Pillar 3 Disclosures for the year ended 29 February 201616
10. Remuneration10.1 Remuneration CommitteeThe role of RemCo is to determine and agree the broad policy for remuneration and for compliance with the FCA Remuneration Code (‘the Code’) to the extent that the provisions apply to the Bank. RemCo is responsible for monitoring and noting the level and structure of remuneration for senior management (categorised as Code Staff/Material Risk Takers for the purposes of the Code) and senior risk management and compliance staff.
RemCo continually reviews and assesses the impact of remuneration policies on the risk profile of the Bank and colleague behaviour. RemCo has oversight over appointment and severance terms for relevant colleagues (including payments of guaranteed remuneration for appointees and retention terms). The Board is responsible for the appointment of members to RemCo and for the revocation of any such appointments.
RemCo comprises no less than three members at any time, two of which are Independent Non-Executive Board Directors and the other an Executive from the Bank’s parent undertaking (J Sainsbury’s plc). The Committee is constituted in a way that enables it to exercise independent judgment, and members do not perform any executive function within the Bank. The quorum is two Committee members, one of whom is the Chairman. All members of RemCo are advised of the business to be transacted at any meeting even if they are unable to be present.
The Chairman of RemCo is the Senior Independent Non-Executive Director. The CEO and Bank Colleague and Communications Director are invited to attend, except when issues regarding their own remuneration are discussed. Remuneration advisors provide independent opinion as requested by the Chairman.
RemCo reviews the general principles underpinning the Remuneration Policy on an annual basis. An independent review of the Policy was undertaken by PricewaterhouseCoopers LLP this year and the Policy was found to be compliant.
Remuneration decisions take into account the implications for risk and risk management of the Bank through: — the requirement for all bonus schemes to be reviewed by the Bank’s Risk Function; and — the competent and experienced nature of all individuals who are a member of or who attend RemCo, which enables them to exercise independent judgments regarding the remuneration decisions presented by management.
The long-term interests of all stakeholders are taken into account through the process of debating, tabling and agreeing remuneration decisions through RemCo.
RemCo has the ability to apply discretion to adjust awards that may arise through the Bank’s bonus plan or other incentive arrangements. The Remuneration Policy of the Bank supports the firm’s business strategy, which is based on providing shoppers with a compelling reason to purchase financial services from the Bank, but doing so in a way which considers and manages the financial impact of its business decisions.
The Bank prepares a Remuneration Policy Statement, as required by SYSC 19A, which sets out the principles for pay, incentives and recognition within the Bank, taking into account its business strategy, objectives, risk tolerance and long-term interests. The key objective is to ensure that the Bank strikes an appropriate balance between risk and reward, consistent with its risk appetite.
10.2 Link between pay and performance10.2.1 Assessment of performanceThe Bank aims to base colleague reward and remuneration on both the Bank’s performance and individual performance, while at the same time being sufficiently competitive to ensure that it attracts and retains the people it depends upon for success.
The Bank operates an annual bonus that is based on financial and non-financial targets, including customer-related objectives, which are aligned to the long-term strategic objectives of the organisation. Overall, through aligning reward to the Bank’s Strategic Objectives, its aim is to recognise performance against targets including how well colleagues manage risk and therefore the long-term health of the business.
Pay increases and personal bonus awards are influenced by the individual’s level of performance. Performance is a balance of achieving a balanced scorecard range of personal objectives, as well as demonstrating the organisational ‘ways of working’ which reflect the Bank’s culture. Consideration is given to how objectives have been met, and bonus awards will be reduced if the Bank’s leadership behaviours and values have not been observed. In addition all colleagues have a duty to avoid operational losses by following the correct policies and procedures and improving risk prevention through appropriate control self-assessments. The targets included within each colleague’s balanced scorecard measures are benchmarked against last year’s performance. The Bank’s bonus schemes do not include a guaranteed minimum figure and are also capped at a maximum level.
The Bank has geared its remuneration structures so that a higher proportion of the reward package is “at risk” commensurate with the seniority of the individual, but this is balanced to ensure that individuals are not incentivised inappropriately.
The Bank has not made any guaranteed bonus payments to date. However, a small number of retention awards have been made in previous financial years, to certain senior colleagues in order to retain them during the Bank’s transition. The awards are deferred, subject to individual performance and were overseen by RemCo. The awards are allowed for within the Code and are therefore considered compliant.
10.2.2 Long-term incentivesThe Bank rewards certain staff with long-term incentive plans. These plans have been and continue to be operated on the Bank’s behalf by J Sainsbury plc. There are a number of performance hurdles, which need to be met both at an organisational level (employer and parent) and individual level for these awards to be made. If any Code Staff/Material Risk Takers at the Bank participate in such schemes, any long term incentive awards they receive will comply with the Code and any changes to the arrangements will be agreed with J Sainsbury plc through RemCo.
RemCo will review any future long term incentive requirements proposed for the Bank to ensure that targets are aligned with the long-term performance of the organisation.
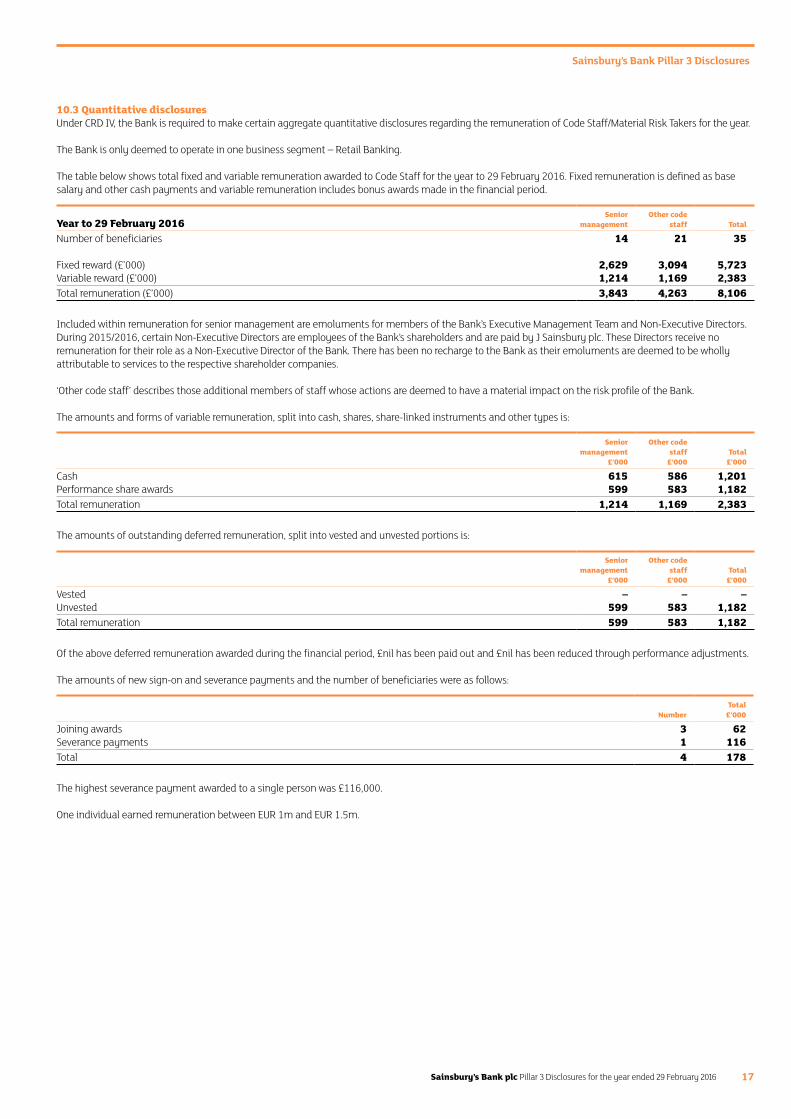
Sainsbury’s Bank Pillar 3 Disclosures
Sainsbury’s Bank plc Pillar 3 Disclosures for the year ended 29 February 2016 17
10.3 Quantitative disclosuresUnder CRD IV, the Bank is required to make certain aggregate quantitative disclosures regarding the remuneration of Code Staff/Material Risk Takers for the year.
The Bank is only deemed to operate in one business segment – Retail Banking.
The table below shows total fixed and variable remuneration awarded to Code Staff for the year to 29 February 2016. Fixed remuneration is defined as base salary and other cash payments and variable remuneration includes bonus awards made in the financial period.
Year to 29 February 2016Senior
managementOther code
staff Total
Number of beneficiaries 14 21 35
Fixed reward (£’000) 2,629 3,094 5,723Variable reward (£’000) 1,214 1,169 2,383Total remuneration (£’000) 3,843 4,263 8,106
Included within remuneration for senior management are emoluments for members of the Bank’s Executive Management Team and Non-Executive Directors. During 2015/2016, certain Non-Executive Directors are employees of the Bank’s shareholders and are paid by J Sainsbury plc. These Directors receive no remuneration for their role as a Non-Executive Director of the Bank. There has been no recharge to the Bank as their emoluments are deemed to be wholly attributable to services to the respective shareholder companies.
‘Other code staff’ describes those additional members of staff whose actions are deemed to have a material impact on the risk profile of the Bank.
The amounts and forms of variable remuneration, split into cash, shares, share-linked instruments and other types is:
Senior management
£’000
Other code staff
£’000Total
£’000
Cash 615 586 1,201Performance share awards 599 583 1,182Total remuneration 1,214 1,169 2,383
The amounts of outstanding deferred remuneration, split into vested and unvested portions is:
Senior management
£’000
Other code staff
£’000Total
£’000
Vested – – –Unvested 599 583 1,182Total remuneration 599 583 1,182
Of the above deferred remuneration awarded during the financial period, £nil has been paid out and £nil has been reduced through performance adjustments.
The amounts of new sign-on and severance payments and the number of beneficiaries were as follows:
NumberTotal
£’000
Joining awards 3 62Severance payments 1 116Total 4 178
The highest severance payment awarded to a single person was £116,000.
One individual earned remuneration between EUR 1m and EUR 1.5m.
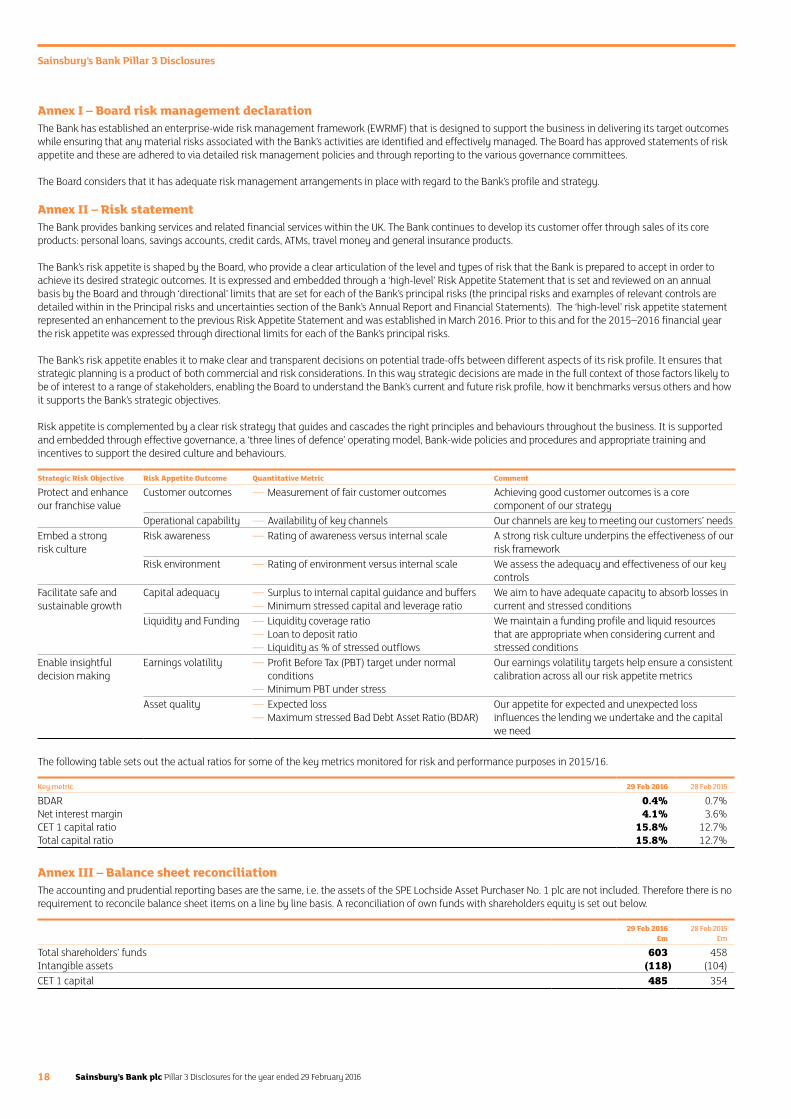
Sainsbury’s Bank Pillar 3 Disclosures
Sainsbury’s Bank plc Pillar 3 Disclosures for the year ended 29 February 201618
Annex I – Board risk management declarationThe Bank has established an enterprise-wide risk management framework (EWRMF) that is designed to support the business in delivering its target outcomes while ensuring that any material risks associated with the Bank’s activities are identified and effectively managed. The Board has approved statements of risk appetite and these are adhered to via detailed risk management policies and through reporting to the various governance committees.
The Board considers that it has adequate risk management arrangements in place with regard to the Bank’s profile and strategy.
Annex II – Risk statementThe Bank provides banking services and related financial services within the UK. The Bank continues to develop its customer offer through sales of its core products: personal loans, savings accounts, credit cards, ATMs, travel money and general insurance products.
The Bank’s risk appetite is shaped by the Board, who provide a clear articulation of the level and types of risk that the Bank is prepared to accept in order to achieve its desired strategic outcomes. It is expressed and embedded through a ‘high-level’ Risk Appetite Statement that is set and reviewed on an annual basis by the Board and through ‘directional’ limits that are set for each of the Bank’s principal risks (the principal risks and examples of relevant controls are detailed within in the Principal risks and uncertainties section of the Bank’s Annual Report and Financial Statements). The ‘high-level’ risk appetite statement represented an enhancement to the previous Risk Appetite Statement and was established in March 2016. Prior to this and for the 2015–2016 financial year the risk appetite was expressed through directional limits for each of the Bank’s principal risks.
The Bank’s risk appetite enables it to make clear and transparent decisions on potential trade-offs between different aspects of its risk profile. It ensures that strategic planning is a product of both commercial and risk considerations. In this way strategic decisions are made in the full context of those factors likely to be of interest to a range of stakeholders, enabling the Board to understand the Bank’s current and future risk profile, how it benchmarks versus others and how it supports the Bank’s strategic objectives.
Risk appetite is complemented by a clear risk strategy that guides and cascades the right principles and behaviours throughout the business. It is supported and embedded through effective governance, a ‘three lines of defence’ operating model, Bank-wide policies and procedures and appropriate training and incentives to support the desired culture and behaviours.
Strategic Risk Objective Risk Appetite Outcome Quantitative Metric Comment
Protect and enhance our franchise value
Customer outcomes — Measurement of fair customer outcomes Achieving good customer outcomes is a core component of our strategy
Operational capability — Availability of key channels Our channels are key to meeting our customers’ needs Embed a strong risk culture
Risk awareness — Rating of awareness versus internal scale A strong risk culture underpins the effectiveness of our risk framework
Risk environment — Rating of environment versus internal scale We assess the adequacy and effectiveness of our key controls
Facilitate safe and sustainable growth
Capital adequacy — Surplus to internal capital guidance and buffers — Minimum stressed capital and leverage ratio
We aim to have adequate capacity to absorb losses in current and stressed conditions
Liquidity and Funding — Liquidity coverage ratio — Loan to deposit ratio — Liquidity as % of stressed outflows
We maintain a funding profile and liquid resources that are appropriate when considering current and stressed conditions
Enable insightful decision making
Earnings volatility — Profit Before Tax (PBT) target under normal conditions
— Minimum PBT under stress
Our earnings volatility targets help ensure a consistent calibration across all our risk appetite metrics
Asset quality — Expected loss — Maximum stressed Bad Debt Asset Ratio (BDAR)
Our appetite for expected and unexpected loss influences the lending we undertake and the capital we need
The following table sets out the actual ratios for some of the key metrics monitored for risk and performance purposes in 2015/16.
Key metric 29 Feb 2016 28 Feb 2015
BDAR 0.4% 0.7%Net interest margin 4.1% 3.6%CET 1 capital ratio 15.8% 12.7%Total capital ratio 15.8% 12.7%
Annex III – Balance sheet reconciliation The accounting and prudential reporting bases are the same, i.e. the assets of the SPE Lochside Asset Purchaser No. 1 plc are not included. Therefore there is no requirement to reconcile balance sheet items on a line by line basis. A reconciliation of own funds with shareholders equity is set out below.
29 Feb 2016 28 Feb 2015£m £m
Total shareholders’ funds 603 458Intangible assets (118) (104)CET 1 capital 485 354
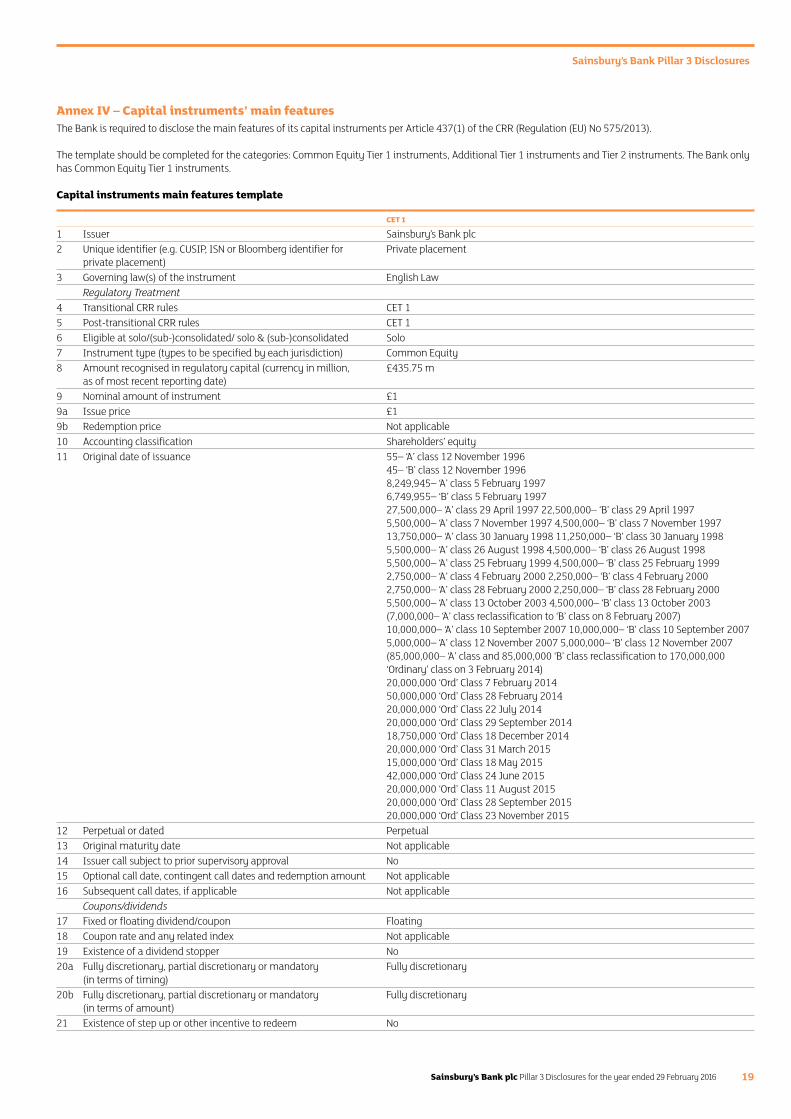
Sainsbury’s Bank Pillar 3 Disclosures
Sainsbury’s Bank plc Pillar 3 Disclosures for the year ended 29 February 2016 19
Annex IV – Capital instruments’ main featuresThe Bank is required to disclose the main features of its capital instruments per Article 437(1) of the CRR (Regulation (EU) No 575/2013).
The template should be completed for the categories: Common Equity Tier 1 instruments, Additional Tier 1 instruments and Tier 2 instruments. The Bank only has Common Equity Tier 1 instruments.
Capital instruments main features template
CET 1
1 Issuer Sainsbury’s Bank plc2 Unique identifier (e.g. CUSIP, ISN or Bloomberg identifier for
private placement)Private placement
3 Governing law(s) of the instrument English LawRegulatory Treatment
4 Transitional CRR rules CET 15 Post-transitional CRR rules CET 16 Eligible at solo/(sub-)consolidated/ solo & (sub-)consolidated Solo7 Instrument type (types to be specified by each jurisdiction) Common Equity8 Amount recognised in regulatory capital (currency in million,
as of most recent reporting date)£435.75 m
9 Nominal amount of instrument £19a Issue price £19b Redemption price Not applicable10 Accounting classification Shareholders’ equity11 Original date of issuance 55– ‘A’ class 12 November 1996
45– ‘B’ class 12 November 19968,249,945– ‘A’ class 5 February 19976,749,955– ‘B’ class 5 February 199727,500,000– ‘A’ class 29 April 1997 22,500,000– ‘B’ class 29 April 19975,500,000– ‘A’ class 7 November 1997 4,500,000– ‘B’ class 7 November 199713,750,000– ‘A’ class 30 January 1998 11,250,000– ‘B’ class 30 January 19985,500,000– ‘A’ class 26 August 1998 4,500,000– ‘B’ class 26 August 19985,500,000– ‘A’ class 25 February 1999 4,500,000– ‘B’ class 25 February 19992,750,000– ‘A’ class 4 February 2000 2,250,000– ‘B’ class 4 February 20002,750,000– ‘A’ class 28 February 2000 2,250,000– ‘B’ class 28 February 20005,500,000– ‘A’ class 13 October 2003 4,500,000– ‘B’ class 13 October 2003(7,000,000– ‘A’ class reclassification to ‘B’ class on 8 February 2007)10,000,000– ‘A’ class 10 September 2007 10,000,000– ‘B’ class 10 September 20075,000,000– ‘A’ class 12 November 2007 5,000,000– ‘B’ class 12 November 2007(85,000,000– ‘A’ class and 85,000,000 ‘B’ class reclassification to 170,000,000 ‘Ordinary’ class on 3 February 2014)20,000,000 ‘Ord’ Class 7 February 201450,000,000 ‘Ord’ Class 28 February 201420,000,000 ‘Ord’ Class 22 July 201420,000,000 ‘Ord’ Class 29 September 201418,750,000 ‘Ord’ Class 18 December 201420,000,000 ‘Ord’ Class 31 March 201515,000,000 ‘Ord’ Class 18 May 201542,000,000 ‘Ord’ Class 24 June 201520,000,000 ‘Ord’ Class 11 August 201520,000,000 ‘Ord’ Class 28 September 201520,000,000 ‘Ord’ Class 23 November 2015
12 Perpetual or dated Perpetual13 Original maturity date Not applicable14 Issuer call subject to prior supervisory approval No15 Optional call date, contingent call dates and redemption amount Not applicable16 Subsequent call dates, if applicable Not applicable
Coupons/dividends17 Fixed or floating dividend/coupon Floating18 Coupon rate and any related index Not applicable19 Existence of a dividend stopper No20a Fully discretionary, partial discretionary or mandatory
(in terms of timing)Fully discretionary
20b Fully discretionary, partial discretionary or mandatory (in terms of amount)
Fully discretionary
21 Existence of step up or other incentive to redeem No
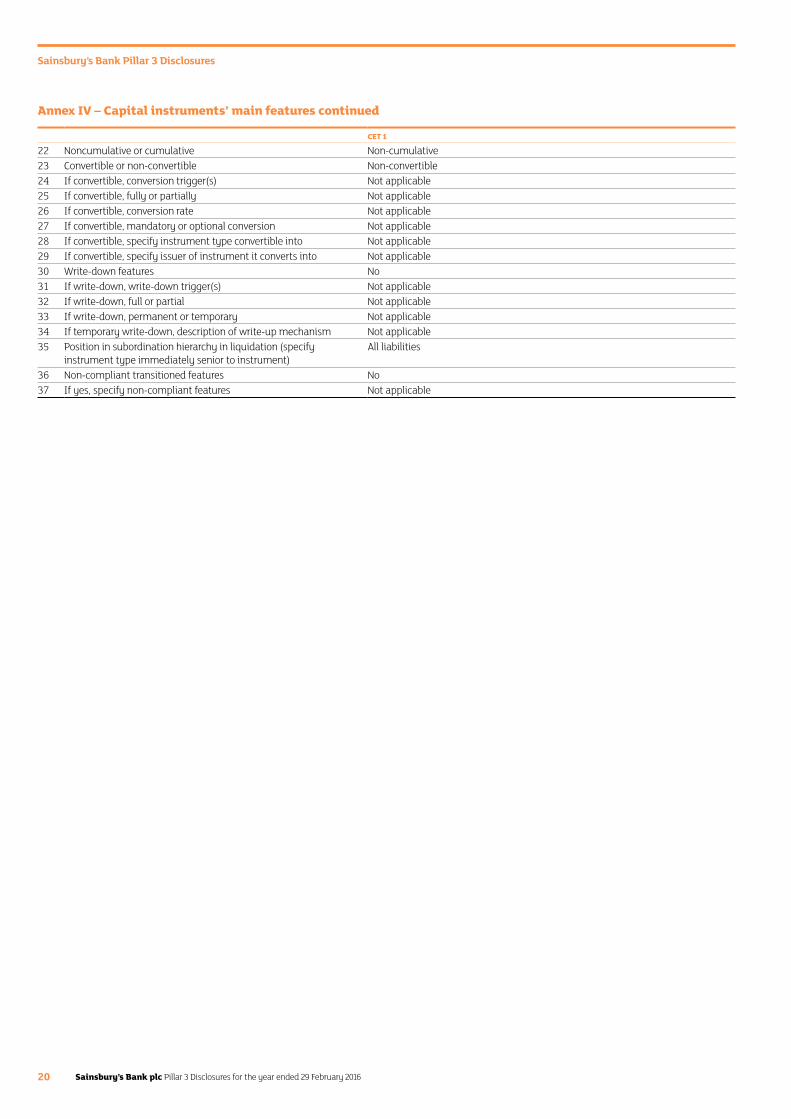
Sainsbury’s Bank Pillar 3 Disclosures
Sainsbury’s Bank plc Pillar 3 Disclosures for the year ended 29 February 201620
CET 1
22 Noncumulative or cumulative Non-cumulative23 Convertible or non-convertible Non-convertible24 If convertible, conversion trigger(s) Not applicable25 If convertible, fully or partially Not applicable26 If convertible, conversion rate Not applicable27 If convertible, mandatory or optional conversion Not applicable28 If convertible, specify instrument type convertible into Not applicable29 If convertible, specify issuer of instrument it converts into Not applicable30 Write-down features No31 If write-down, write-down trigger(s) Not applicable32 If write-down, full or partial Not applicable33 If write-down, permanent or temporary Not applicable34 If temporary write-down, description of write-up mechanism Not applicable35 Position in subordination hierarchy in liquidation (specify
instrument type immediately senior to instrument)All liabilities
36 Non-compliant transitioned features No37 If yes, specify non-compliant features Not applicable
Annex IV – Capital instruments’ main features continued
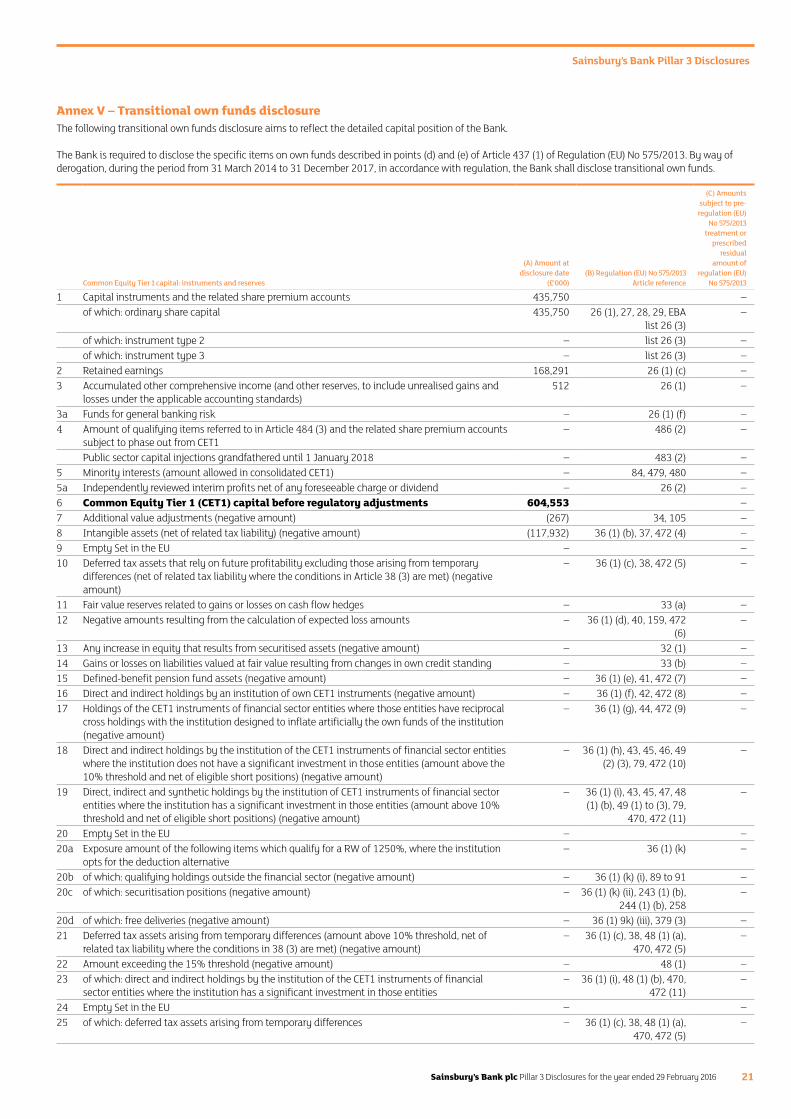
Sainsbury’s Bank Pillar 3 Disclosures
Sainsbury’s Bank plc Pillar 3 Disclosures for the year ended 29 February 2016 21
Annex V – Transitional own funds disclosureThe following transitional own funds disclosure aims to reflect the detailed capital position of the Bank.
The Bank is required to disclose the specific items on own funds described in points (d) and (e) of Article 437 (1) of Regulation (EU) No 575/2013. By way of derogation, during the period from 31 March 2014 to 31 December 2017, in accordance with regulation, the Bank shall disclose transitional own funds.
Common Equity Tier 1 capital: instruments and reserves
(A) Amount at disclosure date
(£’000)(B) Regulation (EU) No 575/2013
Article reference
(C) Amounts subject to pre-
regulation (EU) No 575/2013
treatment or prescribed
residual amount of
regulation (EU) No 575/2013
1 Capital instruments and the related share premium accounts 435,750 –of which: ordinary share capital 435,750 26 (1), 27, 28, 29, EBA
list 26 (3)–
of which: instrument type 2 – list 26 (3) –of which: instrument type 3 – list 26 (3) –
2 Retained earnings 168,291 26 (1) (c) –3 Accumulated other comprehensive income (and other reserves, to include unrealised gains and
losses under the applicable accounting standards)512 26 (1) –
3a Funds for general banking risk – 26 (1) (f) –4 Amount of qualifying items referred to in Article 484 (3) and the related share premium accounts
subject to phase out from CET1– 486 (2) –
Public sector capital injections grandfathered until 1 January 2018 – 483 (2) –5 Minority interests (amount allowed in consolidated CET1) – 84, 479, 480 –5a Independently reviewed interim profits net of any foreseeable charge or dividend – 26 (2) –6 Common Equity Tier 1 (CET1) capital before regulatory adjustments 604,553 –7 Additional value adjustments (negative amount) (267) 34, 105 –8 Intangible assets (net of related tax liability) (negative amount) (117,932) 36 (1) (b), 37, 472 (4) –9 Empty Set in the EU – –10 Deferred tax assets that rely on future profitability excluding those arising from temporary
differences (net of related tax liability where the conditions in Article 38 (3) are met) (negative amount)
– 36 (1) (c), 38, 472 (5) –
11 Fair value reserves related to gains or losses on cash flow hedges – 33 (a) –12 Negative amounts resulting from the calculation of expected loss amounts – 36 (1) (d), 40, 159, 472
(6)–
13 Any increase in equity that results from securitised assets (negative amount) – 32 (1) –14 Gains or losses on liabilities valued at fair value resulting from changes in own credit standing – 33 (b) –15 Defined-benefit pension fund assets (negative amount) – 36 (1) (e), 41, 472 (7) –16 Direct and indirect holdings by an institution of own CET1 instruments (negative amount) – 36 (1) (f), 42, 472 (8) –17 Holdings of the CET1 instruments of financial sector entities where those entities have reciprocal
cross holdings with the institution designed to inflate artificially the own funds of the institution (negative amount)
– 36 (1) (g), 44, 472 (9) –
18 Direct and indirect holdings by the institution of the CET1 instruments of financial sector entities where the institution does not have a significant investment in those entities (amount above the 10% threshold and net of eligible short positions) (negative amount)
– 36 (1) (h), 43, 45, 46, 49 (2) (3), 79, 472 (10)
–
19 Direct, indirect and synthetic holdings by the institution of CET1 instruments of financial sector entities where the institution has a significant investment in those entities (amount above 10% threshold and net of eligible short positions) (negative amount)
– 36 (1) (i), 43, 45, 47, 48 (1) (b), 49 (1) to (3), 79,
470, 472 (11)
–
20 Empty Set in the EU – –20a Exposure amount of the following items which qualify for a RW of 1250%, where the institution
opts for the deduction alternative– 36 (1) (k) –
20b of which: qualifying holdings outside the financial sector (negative amount) – 36 (1) (k) (i), 89 to 91 –20c of which: securitisation positions (negative amount) – 36 (1) (k) (ii), 243 (1) (b),
244 (1) (b), 258–
20d of which: free deliveries (negative amount) – 36 (1) 9k) (iii), 379 (3) –21 Deferred tax assets arising from temporary differences (amount above 10% threshold, net of
related tax liability where the conditions in 38 (3) are met) (negative amount)– 36 (1) (c), 38, 48 (1) (a),
470, 472 (5)–
22 Amount exceeding the 15% threshold (negative amount) – 48 (1) –23 of which: direct and indirect holdings by the institution of the CET1 instruments of financial
sector entities where the institution has a significant investment in those entities– 36 (1) (i), 48 (1) (b), 470,
472 (11)–
24 Empty Set in the EU – –25 of which: deferred tax assets arising from temporary differences – 36 (1) (c), 38, 48 (1) (a),
470, 472 (5)–
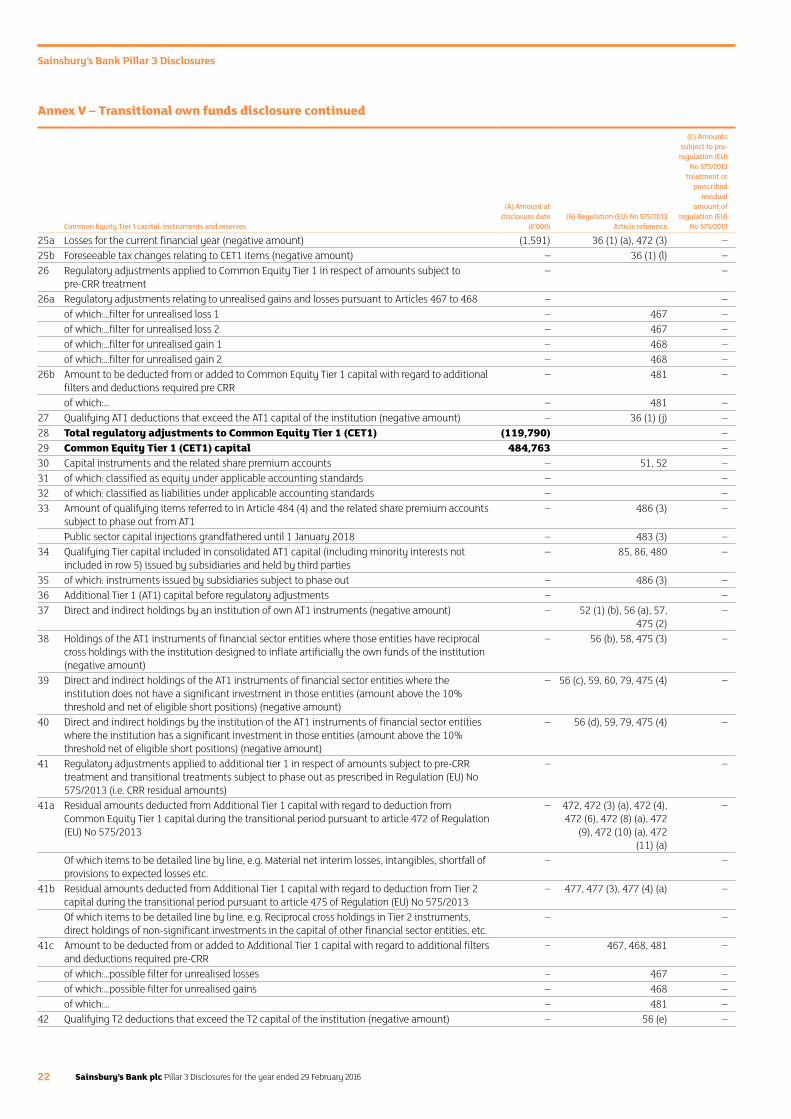
Sainsbury’s Bank Pillar 3 Disclosures
Sainsbury’s Bank plc Pillar 3 Disclosures for the year ended 29 February 201622
Common Equity Tier 1 capital: instruments and reserves
(A) Amount at disclosure date
(£’000)(B) Regulation (EU) No 575/2013
Article reference
(C) Amounts subject to pre-
regulation (EU) No 575/2013
treatment or prescribed
residual amount of
regulation (EU) No 575/2013
25a Losses for the current financial year (negative amount) (1,591) 36 (1) (a), 472 (3) –25b Foreseeable tax changes relating to CET1 items (negative amount) – 36 (1) (l) –26 Regulatory adjustments applied to Common Equity Tier 1 in respect of amounts subject to
pre-CRR treatment– –
26a Regulatory adjustments relating to unrealised gains and losses pursuant to Articles 467 to 468 – –of which:…filter for unrealised loss 1 – 467 –of which:…filter for unrealised loss 2 – 467 –of which:…filter for unrealised gain 1 – 468 –of which:…filter for unrealised gain 2 – 468 –
26b Amount to be deducted from or added to Common Equity Tier 1 capital with regard to additional filters and deductions required pre CRR
– 481 –
of which:… – 481 –27 Qualifying AT1 deductions that exceed the AT1 capital of the institution (negative amount) – 36 (1) (j) –28 Total regulatory adjustments to Common Equity Tier 1 (CET1) (119,790) –29 Common Equity Tier 1 (CET1) capital 484,763 –30 Capital instruments and the related share premium accounts – 51, 52 –31 of which: classified as equity under applicable accounting standards – –32 of which: classified as liabilities under applicable accounting standards – –33 Amount of qualifying items referred to in Article 484 (4) and the related share premium accounts
subject to phase out from AT1– 486 (3) –
Public sector capital injections grandfathered until 1 January 2018 – 483 (3) –34 Qualifying Tier capital included in consolidated AT1 capital (including minority interests not
included in row 5) issued by subsidiaries and held by third parties– 85, 86, 480 –
35 of which: instruments issued by subsidiaries subject to phase out – 486 (3) –36 Additional Tier 1 (AT1) capital before regulatory adjustments – –37 Direct and indirect holdings by an institution of own AT1 instruments (negative amount) – 52 (1) (b), 56 (a), 57,
475 (2)–
38 Holdings of the AT1 instruments of financial sector entities where those entities have reciprocal cross holdings with the institution designed to inflate artificially the own funds of the institution (negative amount)
– 56 (b), 58, 475 (3) –
39 Direct and indirect holdings of the AT1 instruments of financial sector entities where the institution does not have a significant investment in those entities (amount above the 10% threshold and net of eligible short positions) (negative amount)
– 56 (c), 59, 60, 79, 475 (4) –
40 Direct and indirect holdings by the institution of the AT1 instruments of financial sector entities where the institution has a significant investment in those entities (amount above the 10% threshold net of eligible short positions) (negative amount)
– 56 (d), 59, 79, 475 (4) –
41 Regulatory adjustments applied to additional tier 1 in respect of amounts subject to pre-CRR treatment and transitional treatments subject to phase out as prescribed in Regulation (EU) No 575/2013 (i.e. CRR residual amounts)
– –
41a Residual amounts deducted from Additional Tier 1 capital with regard to deduction from Common Equity Tier 1 capital during the transitional period pursuant to article 472 of Regulation (EU) No 575/2013
– 472, 472 (3) (a), 472 (4), 472 (6), 472 (8) (a), 472
(9), 472 (10) (a), 472 (11) (a)
–
Of which items to be detailed line by line, e.g. Material net interim losses, intangibles, shortfall of provisions to expected losses etc.
– –
41b Residual amounts deducted from Additional Tier 1 capital with regard to deduction from Tier 2 capital during the transitional period pursuant to article 475 of Regulation (EU) No 575/2013
– 477, 477 (3), 477 (4) (a) –
Of which items to be detailed line by line, e.g. Reciprocal cross holdings in Tier 2 instruments, direct holdings of non-significant investments in the capital of other financial sector entities, etc.
– –
41c Amount to be deducted from or added to Additional Tier 1 capital with regard to additional filters and deductions required pre-CRR
– 467, 468, 481 –
of which:…possible filter for unrealised losses – 467 –of which:…possible filter for unrealised gains – 468 –of which:… – 481 –
42 Qualifying T2 deductions that exceed the T2 capital of the institution (negative amount) – 56 (e) –
Annex V – Transitional own funds disclosure continued
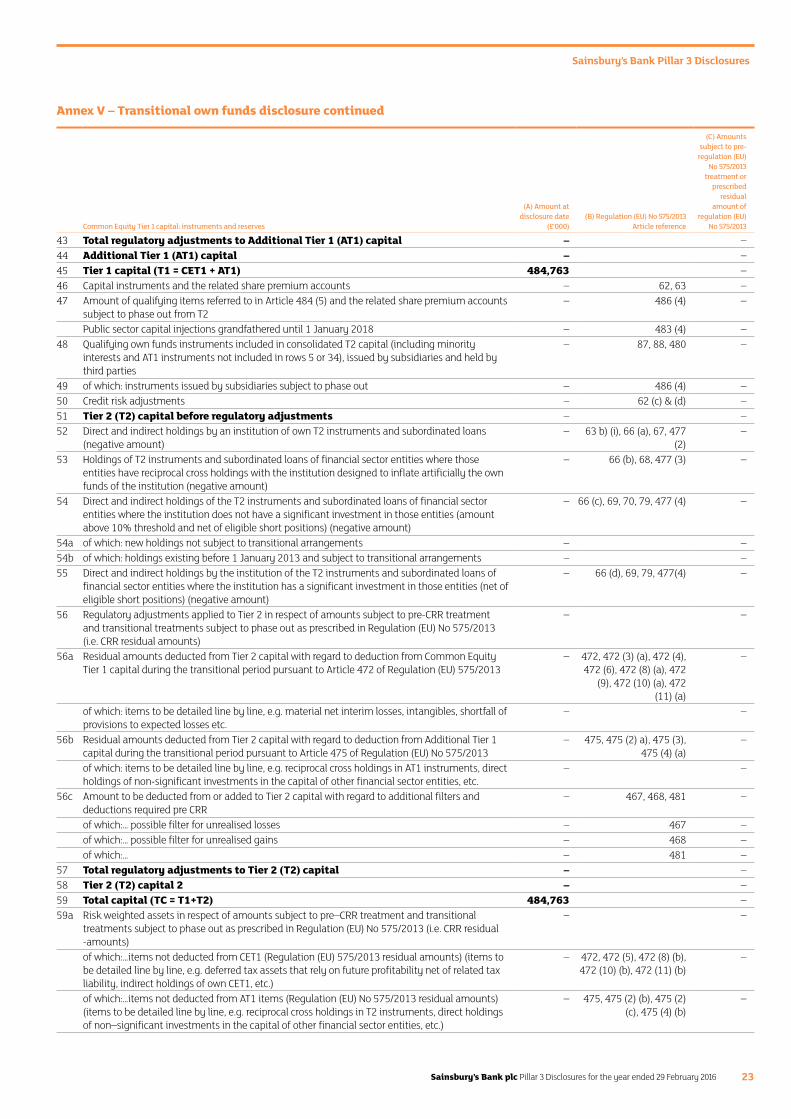
Sainsbury’s Bank Pillar 3 Disclosures
Sainsbury’s Bank plc Pillar 3 Disclosures for the year ended 29 February 2016 23
Common Equity Tier 1 capital: instruments and reserves
(A) Amount at disclosure date
(£’000)(B) Regulation (EU) No 575/2013
Article reference
(C) Amounts subject to pre-
regulation (EU) No 575/2013
treatment or prescribed
residual amount of
regulation (EU) No 575/2013
43 Total regulatory adjustments to Additional Tier 1 (AT1) capital – –44 Additional Tier 1 (AT1) capital – –45 Tier 1 capital (T1 = CET1 + AT1) 484,763 –46 Capital instruments and the related share premium accounts – 62, 63 –47 Amount of qualifying items referred to in Article 484 (5) and the related share premium accounts
subject to phase out from T2– 486 (4) –
Public sector capital injections grandfathered until 1 January 2018 – 483 (4) –48 Qualifying own funds instruments included in consolidated T2 capital (including minority
interests and AT1 instruments not included in rows 5 or 34), issued by subsidiaries and held by third parties
– 87, 88, 480 –
49 of which: instruments issued by subsidiaries subject to phase out – 486 (4) –50 Credit risk adjustments – 62 (c) & (d) –51 Tier 2 (T2) capital before regulatory adjustments – –52 Direct and indirect holdings by an institution of own T2 instruments and subordinated loans
(negative amount)– 63 b) (i), 66 (a), 67, 477
(2)–
53 Holdings of T2 instruments and subordinated loans of financial sector entities where those entities have reciprocal cross holdings with the institution designed to inflate artificially the own funds of the institution (negative amount)
– 66 (b), 68, 477 (3) –
54 Direct and indirect holdings of the T2 instruments and subordinated loans of financial sector entities where the institution does not have a significant investment in those entities (amount above 10% threshold and net of eligible short positions) (negative amount)
– 66 (c), 69, 70, 79, 477 (4) –
54a of which: new holdings not subject to transitional arrangements – –54b of which: holdings existing before 1 January 2013 and subject to transitional arrangements – –55 Direct and indirect holdings by the institution of the T2 instruments and subordinated loans of
financial sector entities where the institution has a significant investment in those entities (net of eligible short positions) (negative amount)
– 66 (d), 69, 79, 477(4) –
56 Regulatory adjustments applied to Tier 2 in respect of amounts subject to pre-CRR treatment and transitional treatments subject to phase out as prescribed in Regulation (EU) No 575/2013 (i.e. CRR residual amounts)
– –
56a Residual amounts deducted from Tier 2 capital with regard to deduction from Common Equity Tier 1 capital during the transitional period pursuant to Article 472 of Regulation (EU) 575/2013
– 472, 472 (3) (a), 472 (4), 472 (6), 472 (8) (a), 472
(9), 472 (10) (a), 472 (11) (a)
–
of which: items to be detailed line by line, e.g. material net interim losses, intangibles, shortfall of provisions to expected losses etc.
– –
56b Residual amounts deducted from Tier 2 capital with regard to deduction from Additional Tier 1 capital during the transitional period pursuant to Article 475 of Regulation (EU) No 575/2013
– 475, 475 (2) a), 475 (3), 475 (4) (a)
–
of which: items to be detailed line by line, e.g. reciprocal cross holdings in AT1 instruments, direct holdings of non-significant investments in the capital of other financial sector entities, etc.
– –
56c Amount to be deducted from or added to Tier 2 capital with regard to additional filters and deductions required pre CRR
– 467, 468, 481 –
of which:… possible filter for unrealised losses – 467 –of which:… possible filter for unrealised gains – 468 –of which:… – 481 –
57 Total regulatory adjustments to Tier 2 (T2) capital – –58 Tier 2 (T2) capital 2 – –59 Total capital (TC = T1+T2) 484,763 –59a Risk weighted assets in respect of amounts subject to pre–CRR treatment and transitional
treatments subject to phase out as prescribed in Regulation (EU) No 575/2013 (i.e. CRR residual -amounts)
– –
of which:…items not deducted from CET1 (Regulation (EU) 575/2013 residual amounts) (items to be detailed line by line, e.g. deferred tax assets that rely on future profitability net of related tax liability, indirect holdings of own CET1, etc.)
– 472, 472 (5), 472 (8) (b), 472 (10) (b), 472 (11) (b)
–
of which:…items not deducted from AT1 items (Regulation (EU) No 575/2013 residual amounts) (items to be detailed line by line, e.g. reciprocal cross holdings in T2 instruments, direct holdings of non–significant investments in the capital of other financial sector entities, etc.)
– 475, 475 (2) (b), 475 (2) (c), 475 (4) (b)
–
Annex V – Transitional own funds disclosure continued
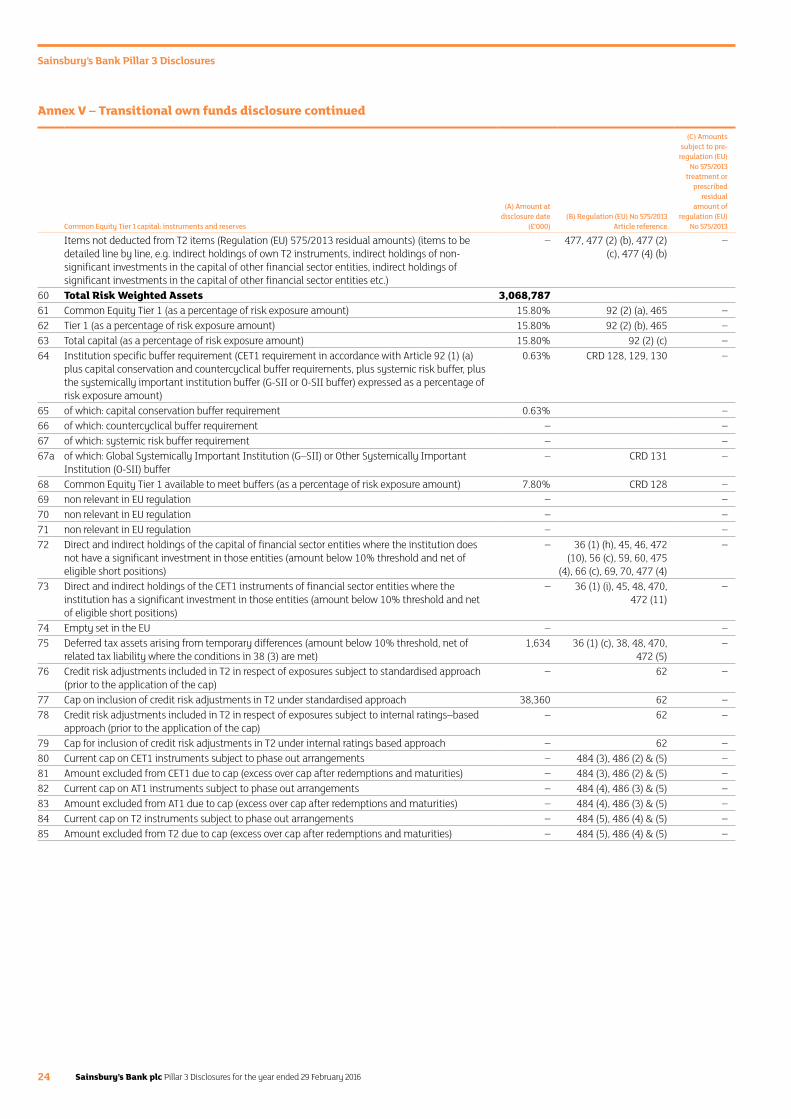
Sainsbury’s Bank Pillar 3 Disclosures
Sainsbury’s Bank plc Pillar 3 Disclosures for the year ended 29 February 201624
Common Equity Tier 1 capital: instruments and reserves
(A) Amount at disclosure date
(£’000)(B) Regulation (EU) No 575/2013
Article reference
(C) Amounts subject to pre-
regulation (EU) No 575/2013
treatment or prescribed
residual amount of
regulation (EU) No 575/2013
Items not deducted from T2 items (Regulation (EU) 575/2013 residual amounts) (items to be detailed line by line, e.g. indirect holdings of own T2 instruments, indirect holdings of non- significant investments in the capital of other financial sector entities, indirect holdings of significant investments in the capital of other financial sector entities etc.)
– 477, 477 (2) (b), 477 (2) (c), 477 (4) (b)
–
60 Total Risk Weighted Assets 3,068,78761 Common Equity Tier 1 (as a percentage of risk exposure amount) 15.80% 92 (2) (a), 465 –62 Tier 1 (as a percentage of risk exposure amount) 15.80% 92 (2) (b), 465 –63 Total capital (as a percentage of risk exposure amount) 15.80% 92 (2) (c) –64 Institution specific buffer requirement (CET1 requirement in accordance with Article 92 (1) (a)
plus capital conservation and countercyclical buffer requirements, plus systemic risk buffer, plus the systemically important institution buffer (G-SII or O-SII buffer) expressed as a percentage of risk exposure amount)
0.63% CRD 128, 129, 130 –
65 of which: capital conservation buffer requirement 0.63% –66 of which: countercyclical buffer requirement – –67 of which: systemic risk buffer requirement – –67a of which: Global Systemically Important Institution (G–SII) or Other Systemically Important
Institution (O-SII) buffer– CRD 131 –
68 Common Equity Tier 1 available to meet buffers (as a percentage of risk exposure amount) 7.80% CRD 128 –69 non relevant in EU regulation – –70 non relevant in EU regulation – –71 non relevant in EU regulation – –72 Direct and indirect holdings of the capital of financial sector entities where the institution does
not have a significant investment in those entities (amount below 10% threshold and net of eligible short positions)
– 36 (1) (h), 45, 46, 472 (10), 56 (c), 59, 60, 475
(4), 66 (c), 69, 70, 477 (4)
–
73 Direct and indirect holdings of the CET1 instruments of financial sector entities where the institution has a significant investment in those entities (amount below 10% threshold and net of eligible short positions)
– 36 (1) (i), 45, 48, 470, 472 (11)
–
74 Empty set in the EU – –75 Deferred tax assets arising from temporary differences (amount below 10% threshold, net of
related tax liability where the conditions in 38 (3) are met)1,634 36 (1) (c), 38, 48, 470,
472 (5)–
76 Credit risk adjustments included in T2 in respect of exposures subject to standardised approach (prior to the application of the cap)
– 62 –
77 Cap on inclusion of credit risk adjustments in T2 under standardised approach 38,360 62 –78 Credit risk adjustments included in T2 in respect of exposures subject to internal ratings–based
approach (prior to the application of the cap)– 62 –
79 Cap for inclusion of credit risk adjustments in T2 under internal ratings based approach – 62 –80 Current cap on CET1 instruments subject to phase out arrangements – 484 (3), 486 (2) & (5) –81 Amount excluded from CET1 due to cap (excess over cap after redemptions and maturities) – 484 (3), 486 (2) & (5) –82 Current cap on AT1 instruments subject to phase out arrangements – 484 (4), 486 (3) & (5) –83 Amount excluded from AT1 due to cap (excess over cap after redemptions and maturities) – 484 (4), 486 (3) & (5) –84 Current cap on T2 instruments subject to phase out arrangements – 484 (5), 486 (4) & (5) –85 Amount excluded from T2 due to cap (excess over cap after redemptions and maturities) – 484 (5), 486 (4) & (5) –
Annex V – Transitional own funds disclosure continued
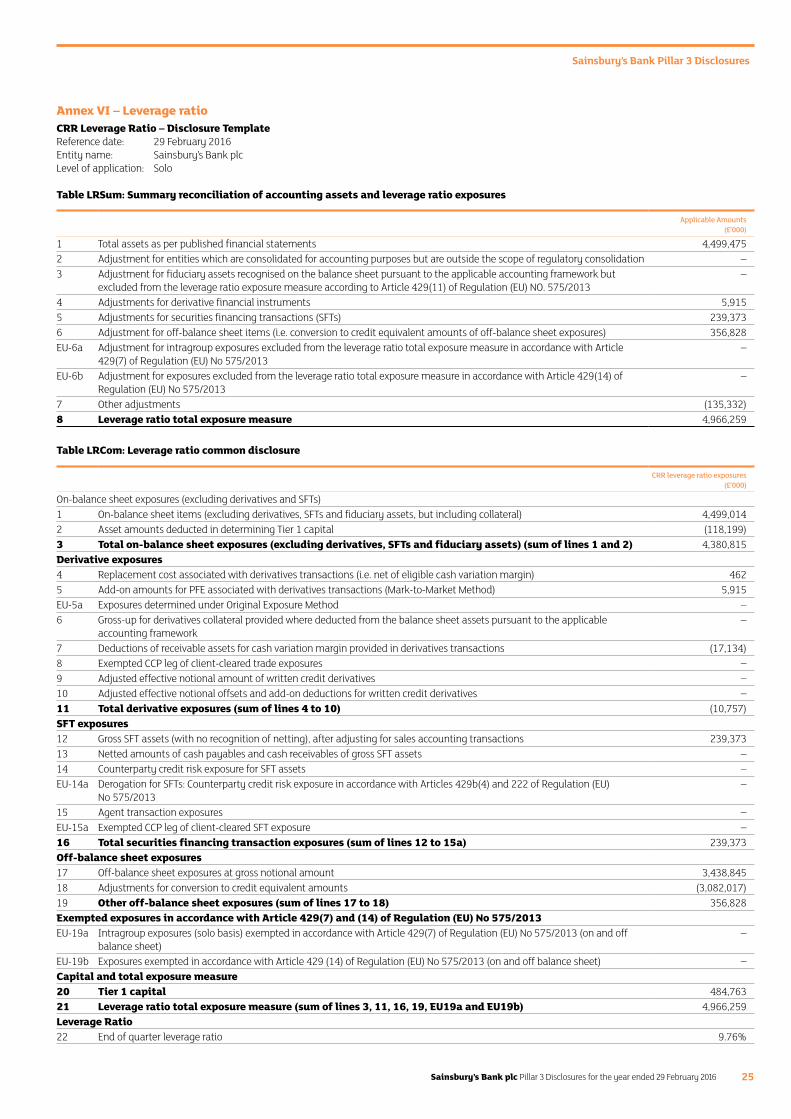
Sainsbury’s Bank Pillar 3 Disclosures
Sainsbury’s Bank plc Pillar 3 Disclosures for the year ended 29 February 2016 25
Annex VI – Leverage ratioCRR Leverage Ratio – Disclosure TemplateReference date: 29 February 2016Entity name: Sainsbury’s Bank plcLevel of application: Solo
Table LRSum: Summary reconciliation of accounting assets and leverage ratio exposures
Applicable Amounts (£’000)
1 Total assets as per published financial statements 4,499,4752 Adjustment for entities which are consolidated for accounting purposes but are outside the scope of regulatory consolidation –3 Adjustment for fiduciary assets recognised on the balance sheet pursuant to the applicable accounting framework but
excluded from the leverage ratio exposure measure according to Article 429(11) of Regulation (EU) NO. 575/2013–
4 Adjustments for derivative financial instruments 5,9155 Adjustments for securities financing transactions (SFTs) 239,3736 Adjustment for off-balance sheet items (i.e. conversion to credit equivalent amounts of off-balance sheet exposures) 356,828EU-6a Adjustment for intragroup exposures excluded from the leverage ratio total exposure measure in accordance with Article
429(7) of Regulation (EU) No 575/2013–
EU-6b Adjustment for exposures excluded from the leverage ratio total exposure measure in accordance with Article 429(14) of Regulation (EU) No 575/2013
–
7 Other adjustments (135,332)8 Leverage ratio total exposure measure 4,966,259
Table LRCom: Leverage ratio common disclosure
CRR leverage ratio exposures(£’000)
On-balance sheet exposures (excluding derivatives and SFTs)1 On-balance sheet items (excluding derivatives, SFTs and fiduciary assets, but including collateral) 4,499,0142 Asset amounts deducted in determining Tier 1 capital (118,199)3 Total on-balance sheet exposures (excluding derivatives, SFTs and fiduciary assets) (sum of lines 1 and 2) 4,380,815Derivative exposures4 Replacement cost associated with derivatives transactions (i.e. net of eligible cash variation margin) 4625 Add-on amounts for PFE associated with derivatives transactions (Mark-to-Market Method) 5,915EU-5a Exposures determined under Original Exposure Method –6 Gross-up for derivatives collateral provided where deducted from the balance sheet assets pursuant to the applicable
accounting framework–
7 Deductions of receivable assets for cash variation margin provided in derivatives transactions (17,134)8 Exempted CCP leg of client-cleared trade exposures –9 Adjusted effective notional amount of written credit derivatives –10 Adjusted effective notional offsets and add-on deductions for written credit derivatives –11 Total derivative exposures (sum of lines 4 to 10) (10,757)SFT exposures 12 Gross SFT assets (with no recognition of netting), after adjusting for sales accounting transactions 239,37313 Netted amounts of cash payables and cash receivables of gross SFT assets –14 Counterparty credit risk exposure for SFT assets –EU-14a Derogation for SFTs: Counterparty credit risk exposure in accordance with Articles 429b(4) and 222 of Regulation (EU)
No 575/2013–
15 Agent transaction exposures –EU-15a Exempted CCP leg of client-cleared SFT exposure –16 Total securities financing transaction exposures (sum of lines 12 to 15a) 239,373Off-balance sheet exposures17 Off-balance sheet exposures at gross notional amount 3,438,84518 Adjustments for conversion to credit equivalent amounts (3,082,017)19 Other off-balance sheet exposures (sum of lines 17 to 18) 356,828Exempted exposures in accordance with Article 429(7) and (14) of Regulation (EU) No 575/2013EU-19a Intragroup exposures (solo basis) exempted in accordance with Article 429(7) of Regulation (EU) No 575/2013 (on and off
balance sheet)–
EU-19b Exposures exempted in accordance with Article 429 (14) of Regulation (EU) No 575/2013 (on and off balance sheet) –Capital and total exposure measure20 Tier 1 capital 484,76321 Leverage ratio total exposure measure (sum of lines 3, 11, 16, 19, EU19a and EU19b) 4,966,259Leverage Ratio22 End of quarter leverage ratio 9.76%
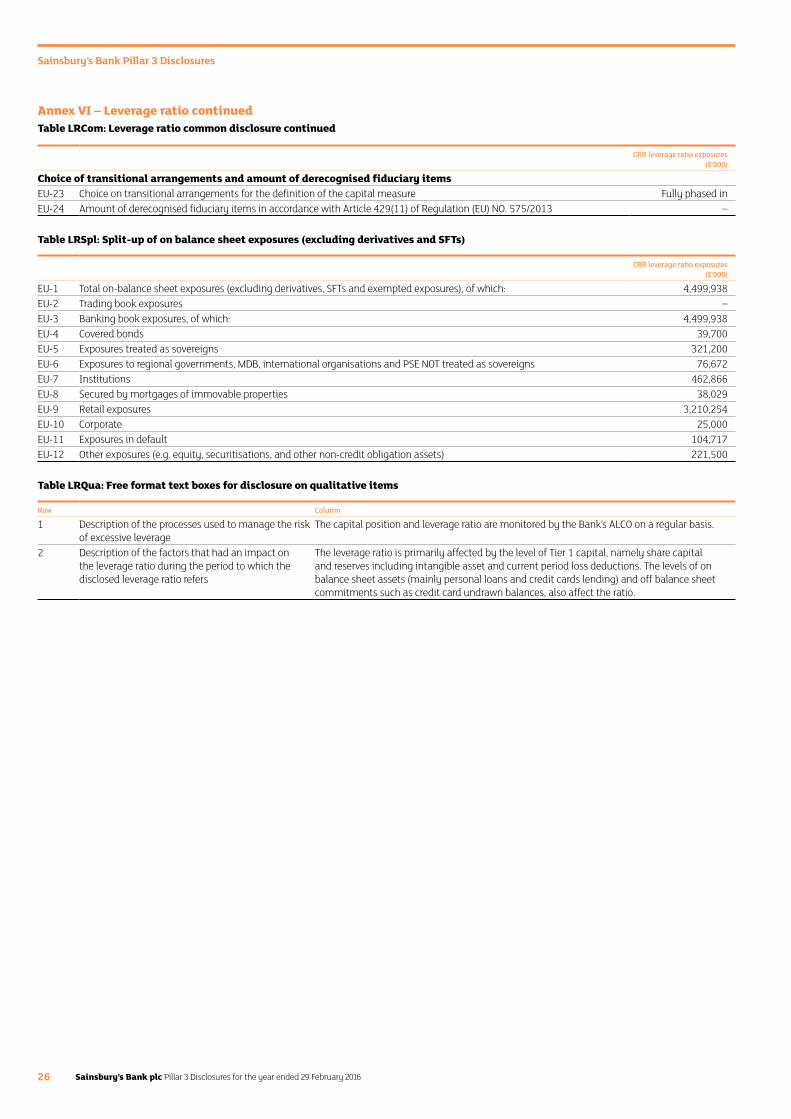
Sainsbury’s Bank Pillar 3 Disclosures
Sainsbury’s Bank plc Pillar 3 Disclosures for the year ended 29 February 201626
CRR leverage ratio exposures(£’000)
Choice of transitional arrangements and amount of derecognised fiduciary itemsEU-23 Choice on transitional arrangements for the definition of the capital measure Fully phased inEU-24 Amount of derecognised fiduciary items in accordance with Article 429(11) of Regulation (EU) NO. 575/2013 –
Table LRSpl: Split-up of on balance sheet exposures (excluding derivatives and SFTs)
CRR leverage ratio exposures(£’000)
EU-1 Total on-balance sheet exposures (excluding derivatives, SFTs and exempted exposures), of which: 4,499,938EU-2 Trading book exposures –EU-3 Banking book exposures, of which: 4,499,938EU-4 Covered bonds 39,700EU-5 Exposures treated as sovereigns 321,200EU-6 Exposures to regional governments, MDB, international organisations and PSE NOT treated as sovereigns 76,672EU-7 Institutions 462,866EU-8 Secured by mortgages of immovable properties 38,029EU-9 Retail exposures 3,210,254EU-10 Corporate 25,000EU-11 Exposures in default 104,717EU-12 Other exposures (e.g. equity, securitisations, and other non-credit obligation assets) 221,500
Table LRQua: Free format text boxes for disclosure on qualitative items
Row Column
1 Description of the processes used to manage the risk of excessive leverage
The capital position and leverage ratio are monitored by the Bank’s ALCO on a regular basis.
2 Description of the factors that had an impact on the leverage ratio during the period to which the disclosed leverage ratio refers
The leverage ratio is primarily affected by the level of Tier 1 capital, namely share capital and reserves including intangible asset and current period loss deductions. The levels of on balance sheet assets (mainly personal loans and credit cards lending) and off balance sheet commitments such as credit card undrawn balances, also affect the ratio.
Annex VI – Leverage ratio continuedTable LRCom: Leverage ratio common disclosure continued
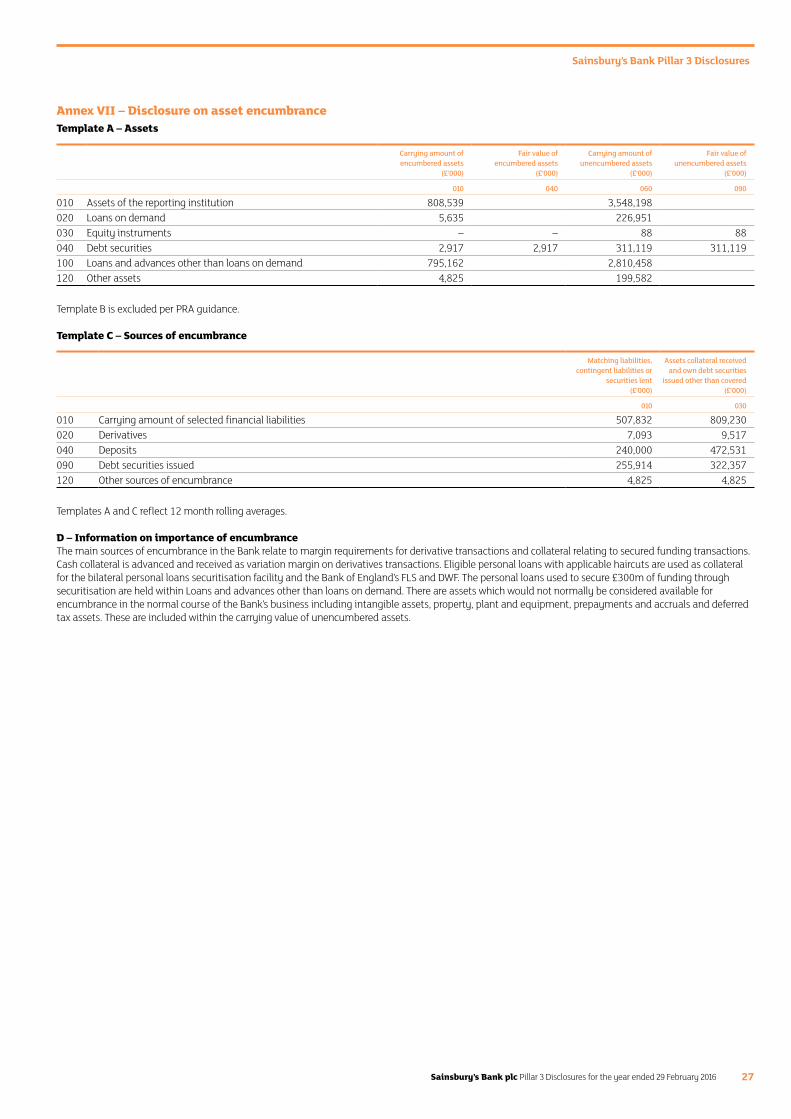
Sainsbury’s Bank Pillar 3 Disclosures
Sainsbury’s Bank plc Pillar 3 Disclosures for the year ended 29 February 2016 27
Annex VII – Disclosure on asset encumbranceTemplate A – Assets
Carrying amount of encumbered assets
(£’000)
Fair value of encumbered assets
(£’000)
Carrying amount of unencumbered assets
(£’000)
Fair value of unencumbered assets
(£’000)
010 040 060 090
010 Assets of the reporting institution 808,539 3,548,198020 Loans on demand 5,635 226,951030 Equity instruments – – 88 88040 Debt securities 2,917 2,917 311,119 311,119100 Loans and advances other than loans on demand 795,162 2,810,458120 Other assets 4,825 199,582
Template B is excluded per PRA guidance.
Template C – Sources of encumbrance
Matching liabilities, contingent liabilities or
securities lent (£’000)
Assets collateral received and own debt securities
issued other than covered (£’000)
010 030
010 Carrying amount of selected financial liabilities 507,832 809,230020 Derivatives 7,093 9,517040 Deposits 240,000 472,531090 Debt securities issued 255,914 322,357120 Other sources of encumbrance 4,825 4,825
Templates A and C reflect 12 month rolling averages.
D – Information on importance of encumbranceThe main sources of encumbrance in the Bank relate to margin requirements for derivative transactions and collateral relating to secured funding transactions. Cash collateral is advanced and received as variation margin on derivatives transactions. Eligible personal loans with applicable haircuts are used as collateral for the bilateral personal loans securitisation facility and the Bank of England’s FLS and DWF. The personal loans used to secure £300m of funding through securitisation are held within Loans and advances other than loans on demand. There are assets which would not normally be considered available for encumbrance in the normal course of the Bank’s business including intangible assets, property, plant and equipment, prepayments and accruals and deferred tax assets. These are included within the carrying value of unencumbered assets.

Sainsbury’s Bank Pillar 3 Disclosures
Sainsbury’s Bank plc Pillar 3 Disclosures for the year ended 29 February 201628
Annex VIII – Disclosure in relation to the requirement for a countercyclical capital bufferTable 1 – Geographical distribution of credit exposures relevant for the calculation of the countercyclical capital buffer
Row
General credit exposures Trading book exposures Securitisation exposure Own funds requirements
Own funds require-
ment weights
Counter- cyclical capital
buffer rate (%)
Exposure value for SA
(£’000)
Exposure value IRB
(£’000)
Sum of long and
short position
of trading book
(£’000)
Value of trading
book exposure
for internal models (£’000)
Exposure value
for SA (£’000)
Exposure value
for IRB (£’000)
Of which:General
credit exposures
(£’000)
Of which:Trading
book exposures
(£’000)
Of which:Securitisa-
tion exposures
(£’000)Total
(£’000)
010 020 030 040 050 060 070 080 090 100 110 120
010 Breakdown by countryUnited Kingdom 4,479,530 – – – 106,582 – 213,775 – – 213,775 99.56 0.00Germany 107,662 – – – – – 480 – – 480 0.22 0.00Luxembourg 45,293 – – – – – – – – – – 0.00Denmark 30,000 – – – – – 479 – – 479 0.22 0.00USA 17,241 – – – – – – – – – – 0.00France 9,094 – – – – – – – – – – 0.00Finland 5,044 – – – – – – – – – – 0.00
020 Total 4,693,864 – – – 106,582 – 214,734 – – 214,734 100.00 0.00
Table 2 – Amount of institution–specific countercyclical capital buffer
Row Column
010
010 Total risk exposure amount (£’000) 4,800,446020 Institution specific countercyclical buffer rate (%) 0.00030 Institution specific countercyclical buffer requirement (£’000) –


![[[Pillar 3 Disclosures Quarterly Statutory Return]]](https://img.pdfslide.net/doc/110x75/625c032c23894d2dce57fb27/pillar-3-disclosures-quarterly-statutory-return.jpg)