Embed Size (px)
Citation preview

Saint Petersburg and the Leningrad region - slide package for a foreign investor
Mikhail Belokon January 2014

• Turku was the first foreign twin city of Saint Petersburg • Numerous common projects have been realized during these 60 years
(1953–2013): academic exchange, investments and environmental projects
• Saint Petersburg has celebrated “The Day of Turku” every two years since 1965, as well as Turku celebrates “The Day of Saint Petersburg”
• In 2013, President Vladimir Putin and President Sauli Niinistö met in Turku, where they discussed the cooperation between Russia and Finland, as well as the collaboration between Saint Petersburg and Turku
• As one of the results, the governments of the cities signed a long term program of cooperation
This slide package is dedicated to the 60th anniversary of the partnership between Saint Petersburg and Turku

1. General information_____________________________________________ __ 4
2. Regional economy ____________________ 7
3. Prosperity and consumption________________________________________ 21
4. External economic relations _______ _ 25
5. Business environment_____________________________________________ 36
6. Additional information _________ 45
The information in this document is complied from a variety of sources. The Pan-European Institute assumes no responsibility for the completeness or accuracy of the information.
Contents

Helsinki 300 km Tallinn 320 km Riga 490 km Moscow 630 km Vilnius 660 km Minsk 690 km Stockholm 690 km Warsaw 1030 km Oslo 1090 km Berlin 1320 km London 2100 km Paris 2170 km
Distances from Saint Petersburg to some European capitals:
1. General information a) Geographical location
4

Saint Petersburg Leningrad region
Area (% of Russia’s total)
1 439 km2 (0,008 %)
84 500 km2
(0,5 %)
Population (% of Russia’s total)
5 028 000 (3,5 %)
1 751 135 (1,2%)
Main cities (thousand people)
- Gatchina (95,1), Vyborg (80,9), Sosnovy Bor (67,0)
Borders with Leningrad region Finland, Estonia, St. Petersburg the Novgorod, Pskov, Vologda regions, Republic of Karelia
Main industries Machine building, metallurgy, metal-processing, energy, food, chemical and petrochemical, light industry, construction
Engineering, chemicals, forestry, agriculture, wood working, pulp and paper, food, fuel, non-ferrous metallurgy and power
Natural resources Sand and gravel deposits, peat, clay, pebble, sandstones, loam
Forest, bauxite, slate, limestone, phosphorite, clay, granite, gravel
1. General information b) Basic facts
5

2008 2009 2010 2011 2012
City Region City Region City Region City Region City Region
Population (thousand) 4 799 1 699 4 833 1 705 4 899 1 719 4 953 1 734 5 028 1 751
Population change from previous year (%) 0,7 0,4 0,7 0,4 1,4 0,8 1,1 0,9 1,5 1,0
Unemployment (thousand) 55,2 55,4 111,1 65,7 70,0 47,7 51,2 40,4 33,0 30,0
Level of unemployment (ILO definition, %) 2,0 6,0 4,1 7,2 2,6 5,2 1,9 4,4 1,1 3,1
Development of labour force – economically active population (thousand)
2 704 918 2 718 912 2 661 915 2 677 921 2 896 977
Number of pensioners (thousand) 1 277 445 1 289 448 1 330 454 1 343 460 1 358 466
1. General information c) Population and labour force
6
Petrostat 2013, Rosstat 2013, Author’s calculations

2012
Saint Petersburg Leningrad region
Performance Share in Russia's total Performance Share in Russia's total
GDP (bn €) 52,1 3,4 % 14,8 1,0 %
Economically active population (thousand)
2 895,9 3,8 % 977,3 1,3 %
Retail trade (bn €) 19,3 3,9 % 5,2 1,0 %
Investment in fixed capital (bn €) 8,8 2,8 % 8,3 2,6 %
FDI (mn €) 693,0 4,8 % 836,0 5,8 %
Exports (bn $) 20,6 3,9 % 16,0 3,0 %
Imports (bn $) 35,9 11,5 % 5,1 1,6 %
Enterprises (thousand) 348,4 7,6 % 38,9 0,8 %
2. Regional economy a) Saint Petersburg and Leningrad region in the economy of Russia
7
Petrostat 2013, Rosstat 2013, Author’s calculations

Year Saint Petersburg
Leningrad region
Russia
2007 32,0 8,8 949,9
2008 38,7 10,6 1 115,6
2009 33,5 9,8 881,9
2010 41,8 12,6 1 157,7
2011 45,9 13,7 1 361,0
2012 52,1 14,8 1 526,8
GDP of Saint Petersburg, Leningrad region and Russia, bn €
2. Regional economy b) GDP of Saint Petersburg and Leningrad region
8
Petrostat 2013, Rosstat 2013, Author’s calculations
21
-13
25
10
14
21
-8
29
9 8
17
-21
31
18
12
-25
-15
-5
5
15
25
35
2008 2010 2011 2012
%-c
han
ge f
rom
pre
vio
us
year
Saint Petersburg Leningrad region Russia

2. Regional economy c) Structure of GDP in 2011
9
Petrostat 2013, Rosstat 2013, Author’s calculations

2011 2012
SPb LR SPb LR
Ranking of investment potential 3 26 3 27
Labour potential 3 26 3 28
Consumption potential 3 29 3 28
Production potential 3 23 3 23
Financial potential 3 26 3 29
Institutional potential 2 25 2 30
Innovation potential 3 30 3 29
Infrastructure potential 2 7 2 7
Natural resource potential 83 46 83 46
Tourism potential 4 21 4 19
Ranking of investment risk 5 7 4 8
2. Regional economy d) Investment potential ranking (out of 83 Russian regions)
10
RA Expert 2013 1=best Saint Petersburg = SPb Leningrad region = LR
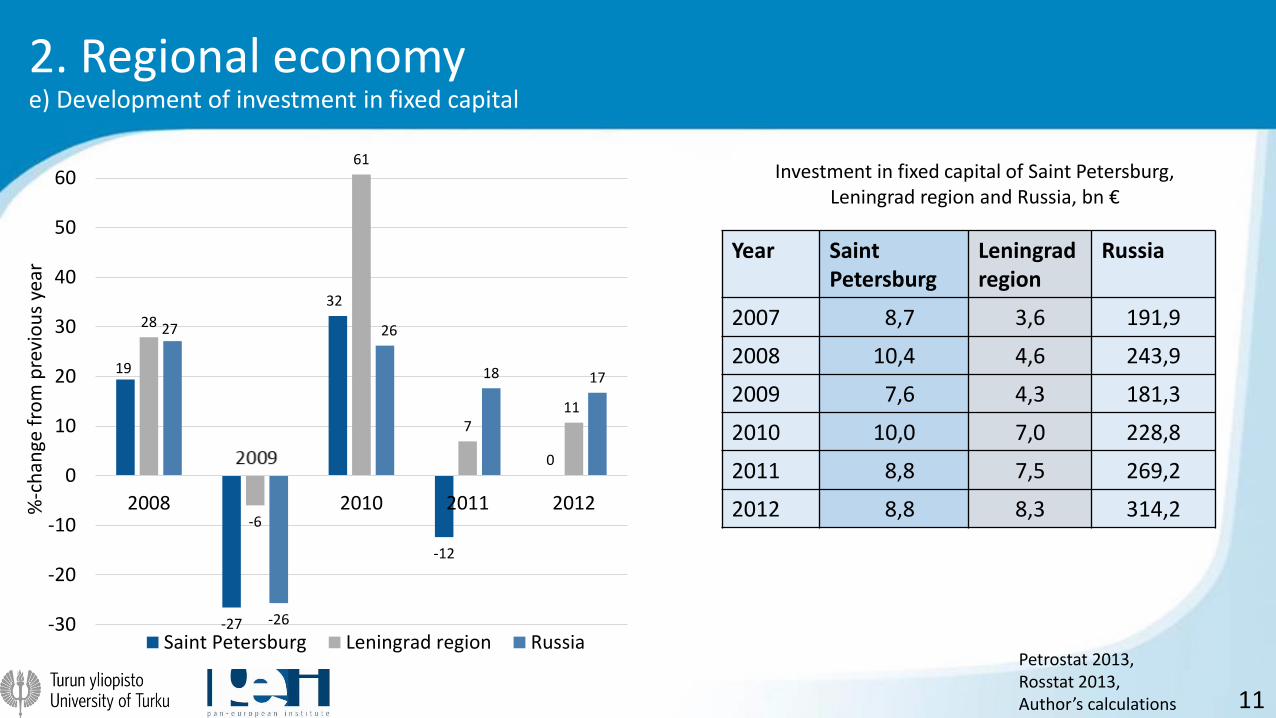
Investment in fixed capital of Saint Petersburg, Leningrad region and Russia, bn €
Year Saint Petersburg
Leningrad region
Russia
2007 8,7 3,6 191,9
2008 10,4 4,6 243,9
2009 7,6 4,3 181,3
2010 10,0 7,0 228,8
2011 8,8 7,5 269,2
2012 8,8 8,3 314,2
2. Regional economy e) Development of investment in fixed capital
11
Petrostat 2013, Rosstat 2013, Author’s calculations
19
-27
32
-12
0
28
-6
61
7 11
27
-26
26
18 17
-30
-20
-10
0
10
20
30
40
50
60
2008 2010 2011 2012%-c
han
ge f
rom
pre
vio
us
year
Saint Petersburg Leningrad region Russia

2. Regional economy f) Investments into fixed capital by sectors in 2012
12
Petrostat 2013, Rosstat 2013, Author’s calculations

Saint Petersburg Leningrad region
The territory of St. Petersburg and Leningrad region is the European gateway of Russia and a major destination and transportation hub for all the transportation modes
Sea and river transport
• St. Petersburg is Russia’s largest sea port in the Baltic Sea and the largest river port
• The port complex includes: The Grand Seaport of St. Petersburg (freight turnover amounted 57,8 mn tonnes in 2012), The Lumber port, river ports on Vasilievsky Island and in the Nevsky Freight District, port facilities in Lomonosov and Kronshtadt
• Passenger terminal on Vasilievsky Island (regular voyages to Estonia, Finland, Latvia, and Sweden)
• The Baltic Sea is connected with the Black Sea through canals
• River ports: Leningradsky, Podporozhsky and Sviritsky • The length of navigable waterways over 2000 km • The total length of all rivers 50 000 km • Main rivers: Neva, Svir, Volkhov and Vuoksa • Sea ports: Ust-Luga (47 mn tonnes in 2012),
Primorsk (75 mn tonnes of oil and oil products in 2012), Vyborg (1,5 mn tonnes), Vysotsk (14 mn tonnes)
Airports • Airport complex Pulkovo located 16 km south of Saint Petersburg and consists of 3 buildings, the newest one was built in 2013 • Direct air links with most major countries and airlines • Over 11 mn passengers in 2012, the Pulkovo Aiport is the 36th busiest airport in Europe
2. Regional economy g) Transport infrastructure (1)
13

Saint Petersburg Leningrad region
Railways • 5 railway stations: Baltiyskiy, Finlandskiy, Ladozhskiy, Moskovskiy, Vitebskiy
• Length of roads – 423 km, freight turnover – 110 mn tonnes • Trains to the Czech Republic, Estonia, Finland, Latvia, Lithuania, • High-speed trains to Moscow (4 hours) and Helsinki (3,5 hours)
• Main railway stations: Gatchina, Mga, Volkhovstroy, Vyborg • Length of roads – more than 3 000 km, freight turnover –
more than 100 mn tonnes • Railway density 33 km / 1000 km2
Highways • Length of roads – more than 3 000 km • Connected to Estonia, Finland, Moscow, Murmansk and Pskov • St. Petersburg Ring Road was opened in 2011, length – 142 km • Ongoing construction of Western Rapid Diameter, a toll road
• Length of roads – over 22 000km • 15 federal routes, 5 of which are in the International E-road
network • Ongoing construction of the Moscow–Saint Petersburg
motorway, length 684 km
Public transport
• Metro: 67 stations (126 planned), passengers in 2012 – 784 mn • Tramway system: length – 228 km, passengers in 2012 – 426 mn • Trolleybus system: passengers in 2012 – 312 mn • Bus system: passengers in 2012 – 472 mn • Aquabus: passengers in 2012 – 0,1 mn
• Suburban electric trains and buses to Saint Petersburg and within the Leningrad region
• A subway station located on the territory of Leningrad region, building one more station is in process
2. Regional economy g) Transport infrastructure (2)
14

2008 2009 2010 2011 2012
City Region City Region City Region City Region City Region
Cargo traffic (million tonnes) 120,3 170,3 101,9 162,4 109,0 161,1 110,4 166,2 125,1 174,6
• by railways 7,6 39,7 5,2 32,0 6,3 35,9 7,5 36,9 7,6 37,6
• by roads 11,0 3,7 7,0 3,6 7,6 3,9 10,6 5,2 18,8 5,6
• by inland waterway 2,5 10,6 1,3 6,6 1,2 2,1 0,7 6,0 7,4 7,4
• by pipelines 89,5 116,3 79,3 120,2 84,9 119,2 84,7 118,1 90,9 124,0
• by seaways 9,7 - 9,1 - 9,0 - 6,9 - 0,4 -
• by airways (thousand tonnes) 10,1 - 8,8 - 9,0 - 8,8 - 10,0 -
Passanger traffic (million people) 2207,0 132,2 2092,0 121,2 2072,0 109,2 2143,0 101,9 2060,0 104,5
2. Regional economy h) Development of transport volumes
15
Petrostat 2013, Rosstat 2013, Author’s calculations

2. Regional economy i) Development of industrial production
16
Petrostat 2013, Rosstat 2013, Author’s calculations
6
-2
10
4
-17
9
13
4
8
26
3 1
-3
14
7 4 5 6 7
1
-9
8
5 3
-20
-10
0
10
20
30
2005 2006 2007 2008 2010 2011 2012
%-c
han
ge f
rom
pre
vio
us
year
St. Petersburg Leningrad region Russia

2008 2009 2010 2011 2012
City Region City Region City Region City Region City Region
Industrial production index 103,6 101,0 83,4 96,9 109,4 113,8 113,3 107,0 104,3 104,2
• mining operations 84,2 104,2 35,9 63,8 143,3 112,7 116,3 108,7 107,3 109,5
• manufacturing activity 103,2 100,1 78,9 98,9 110,5 115,4 113,3 108,6 104,7 105,7
• electricity, gas and water 105,8 103,4 106,5 94,6 100,5 107,1 113,2 97,9 100,5 93,2
2. Regional economy j) Development of industrial production 2008-2012
17
Petrostat 2013, Rosstat 2013, Author’s calculations

114%
109%
106% 106%
115%
110%
111%
107%
113%
109%
105%
107%
109%
111%
113%
115%
2008 2009 2010 2011 2012
Development of consumer prices
Saint Petersburg Leningrad region Russia
2. Regional economy k) Development of prices (%, end of the year)
18
Petrostat 2013, Rosstat 2013, Author’s calculations
118%
108%
108% 107%
106%
117%
101%
112%
104%
93%
114% 117%
112%
105%
90%
95%
100%
105%
110%
115%
120%
2008 2009 2010 2011 2012
Development of industrial prices
Saint Petersburg Leningrad region Russia

Retail sales of Saint Petersburg, Leningrad region and Russia, bn €
Year Saint Petersburg
Leningrad region
Russia
2007 12,8 2,9 309,5
2008 16,0 3,6 386,3
2009 13,8 3,2 330,8
2010 17,1 4,2 411,8
2011 18,1 5,1 465,0
2012 21,1 5,8 533,9
2. Regional economy l) Development of retail trade
19
Petrostat 2013, Rosstat 2013, Author’s calculations
25
-14
24
6
17
27
-12
32
21
13
25
-14
25
13 15
-20
-10
0
10
20
30
40
2008 2010 2011 2012
%-c
han
ge f
rom
pre
vio
us
year
Saint Petersburg Leningrad region Russia

2008 2009 2010 2011 2012
City Region City Region City Region City Region City Region
State- and municipal-owned 6 872 3 814 6 762 3 807 6 365 3 502 5 879 3 378 5 575 3 307
Religious and public organisations
9 878 2 252 9 917 2 182 6 739 1 607 6 246 1 590 5 924 1 556
Private 389 958 37 818 411 570 38 350 344 829 34 484 339 131 33 221 321 618 32 527
Public–private 4 295 781 4 057 743 1 872 494 1 470 437 1 394 428
Foreign 9 448 597 9 467 650 8 611 577 8 818 596 8 363 584
Joint Russian and foreign 9 019 689 9 016 696 5 991 536 5 879 517 5 575 506
Total 429 469 45 951 450 789 46 428 374 407 41 200 367 423 39 738 348 449 38 908
2. Regional economy m) Distribution of enterprises and organisations by ownership (number)
20
Petrostat 2013, Rosstat 2013, Author’s calculations

501
624
543
680 720
823
376
487
417
519 568
658
388
480 424
524 570
671 675
849
758
960
1095
1252
0
200
400
600
800
1000
1200
2007 2008 2009 2010 2011 2012
Gro
ss a
vera
ge w
age,
€/m
on
th
Saint Petersburg Leningrad region Russia Moscow
3. Prosperity and consumption a) Development of gross average wages, €/month
21
Petrostat 2013, Rosstat 2013, Author’s calculations

462
469
488
609
630
685
119
136
119
144
152
162
0
100
200
300
400
500
600
700
2007 2008 2009 2010 2011 2012
Saint Petersburg
Per capita income (€/month)
Minimum subsistence level (€/month)
291
321
284
366
386
432
110
122
110
135
141
150
0
100
200
300
400
500
600
700
2007 2008 2009 2010 2011 2012
Leningrad region
Per capita income (€/month)
Minimum subsistence level (€/month)
3. Prosperity and consumption b) Main socio-economic indicators of living standards, €/month
22
Petrostat 2013, Rosstat 2013, Author’s calculations

272
278 281
289 289
236
245
266
282 284
212
219
228
242
258 260 264
280 285
292
200
220
240
260
280
300
2008 2009 2010 2011 2012
Saint Petersburg Leningrad region Russia Moscow
3. Prosperity and consumption c) Number of passenger cars per 1000 persons
23
Petrostat 2013, Rosstat 2013, Author’s calculations

22,5 22,7 23,0 23,3 23,8 24,9 25,4 25,8 26,2 26,6
21,8 22,2 22,6 23,0 23,4
18,8 18,8 18,7 18,7 19,3
0
5
10
15
20
25
30
2008 2009 2010 2011 2012
Squ
are
met
ers
Saint Petersburg Leningrad region Russia Moscow
3. Prosperity and consumption d) Living area (square meters per person)
24
Petrostat 2013, Rosstat 2013, Author’s calculations

13,0
16,1
9,7 8,9
14,8 16,0
15,1
17,5
12,8
18,4
23,5
27,8
0
5
10
15
20
25
30
2007 2008 2009 2010 2011 2012
Saint Petersburg
Export of goods Import of goods
6,1
7,9
5,2
7,6
11,0
12,4
4,8 5,9
2,6 3,4
5,4 4,0
0
5
10
15
20
25
30
2007 2008 2009 2010 2011 2012
Leningrad region
Export of goods Import of goods
4. External economic relations a) Exports & imports, bn €
25
Petrostat 2013, Rosstat 2013, Author’s calculations

5,1% 5,1%
4,5%
3,0%
4,0% 3,9%
2,4% 2,5% 2,4% 2,6%
3,0% 3,0%
0%
1%
2%
3%
4%
5%
6%
2007 2008 2009 2010 2011 2012
Share in Russia’s exports
Saint Petersburg Leningrad region
10,4% 9,6%
10,7% 10,7% 10,7% 11,4%
3,3% 3,3%
2,2% 2,0% 2,5%
1,6%
0%
2%
4%
6%
8%
10%
12%
2007 2008 2009 2010 2011 2012
Share in Russia’s imports
Saint Petersburg Leningrad region
4. External economic relations b) Share in Russia’s exports and imports
26
Petrostat 2013, Rosstat 2013, Author’s calculations

4. External economic relations c) Exports by country in 2012
27
Petrostat 2013, Rosstat 2013, Author’s calculations

4. External economic relations d) Imports by country in 2012
28
Petrostat 2013, Rosstat 2013, Author’s calculations
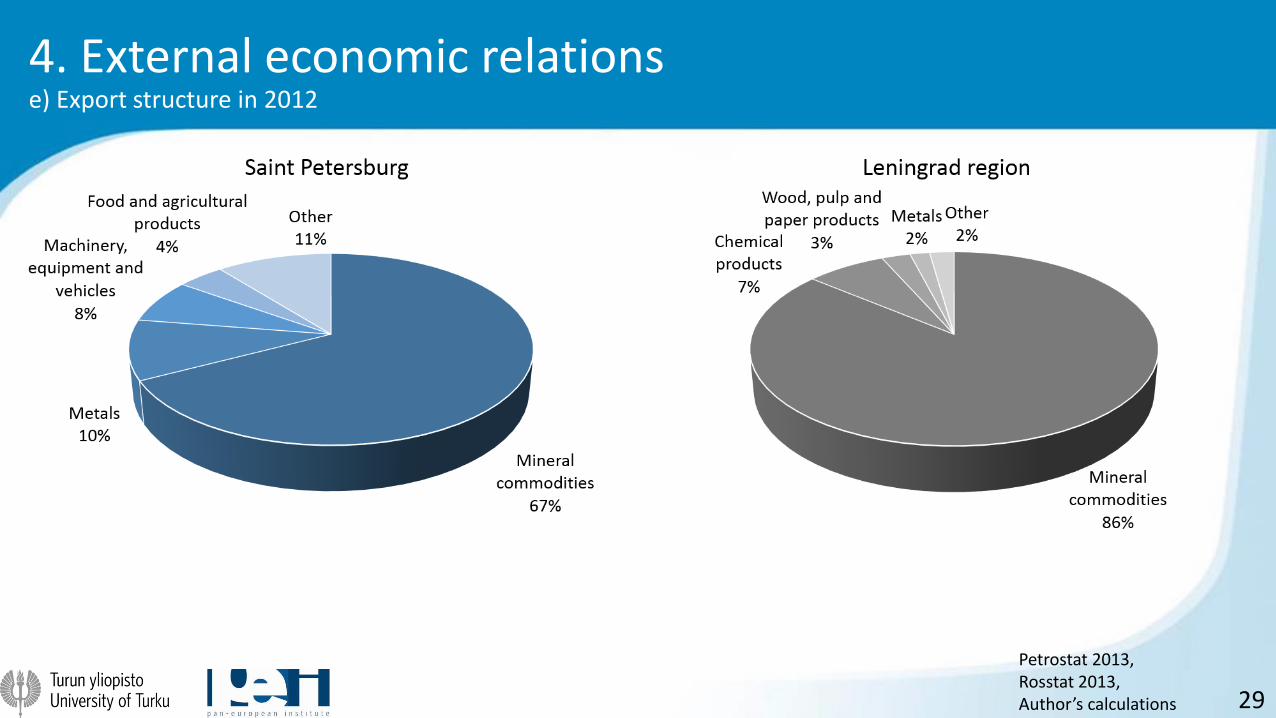
4. External economic relations e) Export structure in 2012
29
Petrostat 2013, Rosstat 2013, Author’s calculations

4. External economic relations f) Import structure in 2012
30
Petrostat 2013, Rosstat 2013, Author’s calculations

2007 2008 2009 2010 2011 2012
City Region City Region City Region City Region City Region City Region
FDI 567 277 934 328 862 241 405 286 773 408 693 837
Portfolio 370 0 18 0 99 0 3 79 152 33 42 35
Trade loans 1 382 37 1 440 24 1 672 6 1 383 2 2 032 23 2 854 28
Other loans 2 268 428 1 640 301 1 342 650 1 402 111 2 051 69 4 758 189
Total 4 587 741 4 032 654 3 975 897 3 933 479 4 403 533 8 347 1 089
4. External economic relations g) Foreign investment inflow, mn €
31
Petrostat 2013, Rosstat 2013, Author’s calculations

567
934
862
405
773
693
277
328
241
286
408
836
0
100
200
300
400
500
600
700
800
900
1000
2007 2008 2009 2010 2011 2012
Dev
elo
pm
ent
of
FDI i
nfl
ow
, € m
illio
n
Saint Petersburg Leningrad region
4. External economic relations h) Development of FDI inflow, mn €
32
Petrostat 2013, Rosstat 2013, Author’s calculations

2,8%
5,1%
7,5%
3,9%
5,8%
4,8%
1,4% 1,8%
2,1%
2,8% 3,1%
5,8%
0%
1%
2%
3%
4%
5%
6%
7%
8%
9%
10%
2007 2008 2009 2010 2011 2012
Shar
e in
Ru
ssia
’s t
ota
l FD
I, %
Saint Petersburg Leningrad region
4. External economic relations i) Share in Russia’s total FDI, %
33
Petrostat 2013, Rosstat 2013, Author’s calculations

4. External economic relations j) Foreign investment by country of origin in 2012
34
Petrostat 2013, Rosstat 2013, Author’s calculations

2,2 2,5 2,5 2,8 2,6 3,1
2,1
2,3 2,3 2,3 2,9
2,9
0
1
2
3
4
5
6
2007 2008 2009 2010 2011 2012
Number of tourists visited St. Petersburg, mn
Russian tourists Foreign tourists
http://www.lentravel.ru/activity http://sptoday.ru/2013_04_15/kolichestvo-turistov-posetivshix-peterburg-za-2012-god-prevysilo-chislo-zhitelej-goroda/
1,34 1,41 1,42 1,44 1,44 1,44
0,36 0,38 0,40 0,43 0,44 0,45
0
0,5
1
1,5
2
2007 2008 2009 2010 2011 2012
Number of tourists visited Leningrad region, mn
Russian tourists Foreign tourists
1,6 1,6 1,7
1,2 1,7 2,0
0
1
2
3
4
2010 2011 2012
Money spent by tourists in St. Petersburg, bn €
Russian tourists Foreign tourists
4. External economic relations k) Tourism
35

Total area 129.4 hectares (two sites): • Neudorf 19.0 hectares • Novoorlovskaya 110.4 hectares
Focus industries: • Tool engineering • Pharmaceuticals and health technologies • IT and telecom • Energy efficiency
Incentives for resident investors: • Land tax exemption • Property tax exemption • Corporate income tax reduced to 13,5% • Social insurance contributions reduced to 14,0% • Free customs area
Land lease: USD 6 700-17 000 per hectare annually
Land purchase: starting USD 835 000 per hectare
Land plots available for lease: 1 hectare
5. Business environment a) Special economic zones in Saint Petersburg
36 http://eng.russez.ru/

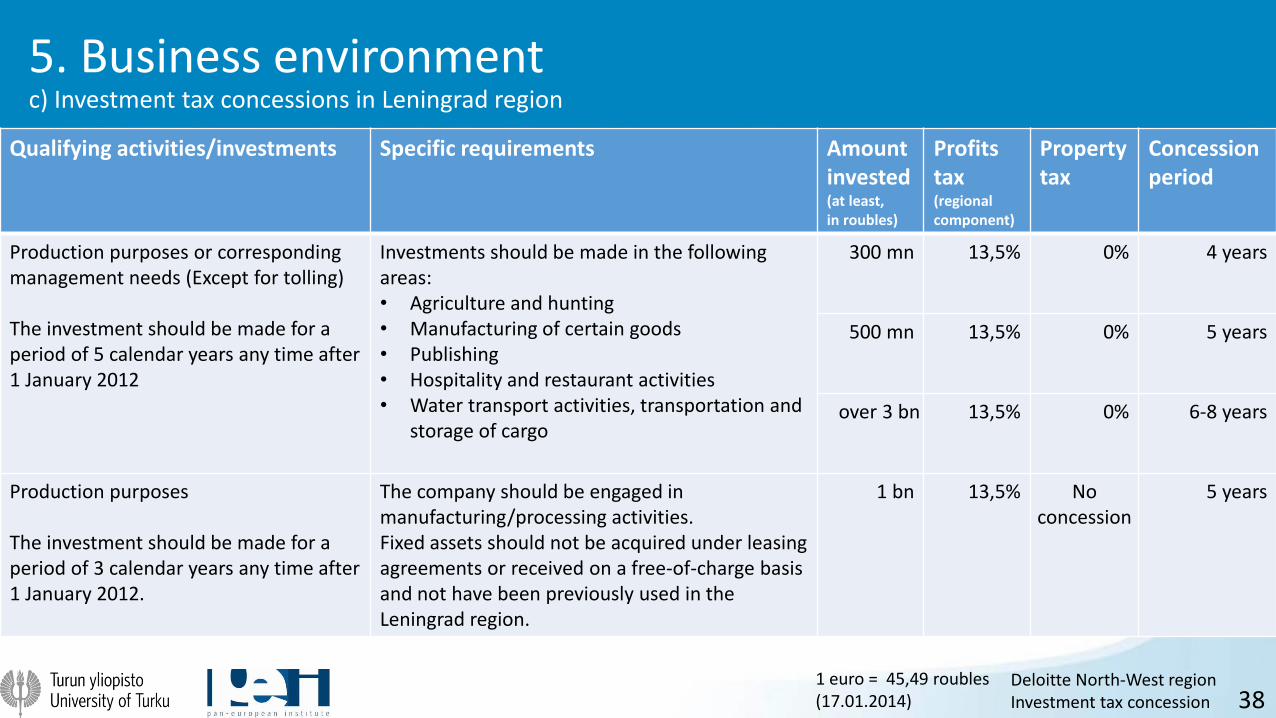
Qualifying activities/investments Specific requirements Amount invested (at least, in roubles)
Profits tax (regional component)
Property tax
Concession period
Production purposes or corresponding management needs The investment should be made for a period of 5 calendar years any time after 1 January 2012
Investments should be made in the following areas: • Manufacturing/processing • Electricity, gas and water • Transport (with certain exceptions)
800 mn 13,5% 0% 5 years
The company should be engaged in a high-technology field; revenue from the above-mentioned activities should make up no less than 80% of the company’s revenue
50 mn 13,5% No concession
5 years
Objects for operations for any purposes The investment should be made for a period of 5 calendar years any time after 1 January 2012
Including rent (Except for leasing) 15 mn 13,5% No concession
7 years
5. Business environment b) Investment tax concessions in Saint Petersburg
37 Deloitte North-West region Investment tax concession
1 euro = 45,49 roubles (17.01.2014)
Qualifying activities/investments Specific requirements Amount invested (at least, in roubles)
Profits tax (regional component)
Property tax
Concession period
Production purposes or corresponding management needs (Except for tolling) The investment should be made for a period of 5 calendar years any time after 1 January 2012
Investments should be made in the following areas: • Agriculture and hunting • Manufacturing of certain goods • Publishing • Hospitality and restaurant activities • Water transport activities, transportation and
storage of cargo
300 mn 13,5% 0% 4 years
500 mn 13,5% 0% 5 years
over 3 bn 13,5% 0% 6-8 years
Production purposes The investment should be made for a period of 3 calendar years any time after 1 January 2012.
The company should be engaged in manufacturing/processing activities. Fixed assets should not be acquired under leasing agreements or received on a free-of-charge basis and not have been previously used in the Leningrad region.
1 bn 13,5% No concession
5 years
5. Business environment c) Investment tax concessions in Leningrad region
38 Deloitte North-West region Investment tax concession
1 euro = 45,49 roubles (17.01.2014)
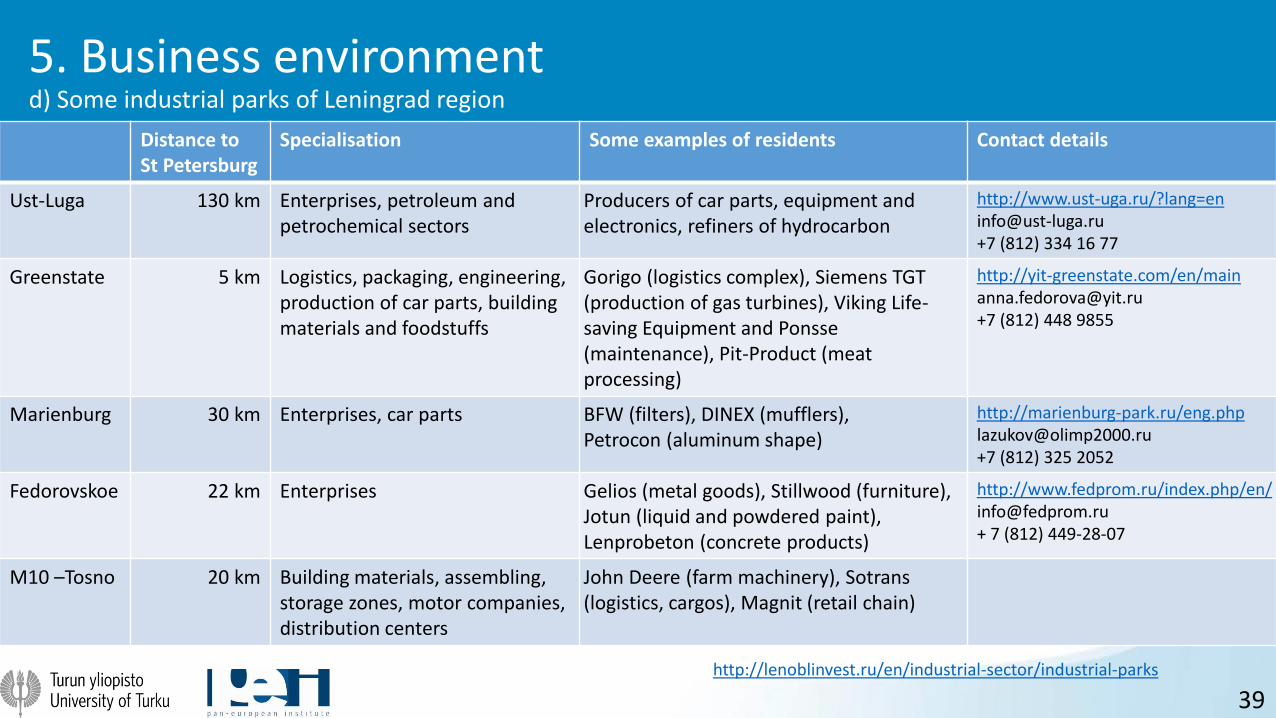
Distance to St Petersburg
Specialisation Some examples of residents Contact details
Ust-Luga 130 km Enterprises, petroleum and petrochemical sectors
Producers of car parts, equipment and electronics, refiners of hydrocarbon
http://www.ust-uga.ru/?lang=en [email protected] +7 (812) 334 16 77
Greenstate 5 km Logistics, packaging, engineering, production of car parts, building materials and foodstuffs
Gorigo (logistics complex), Siemens TGT (production of gas turbines), Viking Life-saving Equipment and Ponsse (maintenance), Pit-Product (meat processing)
http://yit-greenstate.com/en/main [email protected] +7 (812) 448 9855
Marienburg 30 km Enterprises, car parts BFW (filters), DINEX (mufflers), Petrocon (aluminum shape)
http://marienburg-park.ru/eng.php [email protected] +7 (812) 325 2052
Fedorovskoe 22 km Enterprises Gelios (metal goods), Stillwood (furniture), Jotun (liquid and powdered paint), Lenprobeton (concrete products)
http://www.fedprom.ru/index.php/en/ [email protected] + 7 (812) 449-28-07
M10 –Tosno 20 km Building materials, assembling, storage zones, motor companies, distribution centers
John Deere (farm machinery), Sotrans (logistics, cargos), Magnit (retail chain)
5. Business environment d) Some industrial parks of Leningrad region
39 http://lenoblinvest.ru/en/industrial-sector/industrial-parks

Company Opened Annual production volume
Value of investments
Number of workers
Toyota 2007 50 000 $ 133 mn 600
General Motors
2008 60 000 $ 303 mn 1 300
Nissan 2009 50 000 $ 200 mn 1 500
Hyundai 2010 150 000 $ 650 mn 2 400
Scania 2010 6 500 $ 10 mn 600
Yo-Mobile 2015 45 000 € 142 mn -
Gross investment by car producers $1,3 bn
Gross investment by government $0,2 bn
St. Petersburg is Russia's leading center for the automotive industry:
• 5 plants, one more is being built
• 6 000 workers
• Volume of output: € 4,5 bn (2012)
• 20% of the overall production of cars in Russia
Year Produced cars
2011 257 000
2012 386 000
2013 (Jan – Sep) 286 000
http://www.spbdnevnik.ru/news/2013-11-06/boleey-20-legkovykh-avtomobiley-rossiyskogo-proizvodstva-vypuskayutsya-v-peterburge/ http://gov.spb.ru/gov/otrasl/c_industrial/avtomobilnyj-klaster/
5. Business environment e) Automobile cluster in Saint Petersburg
40
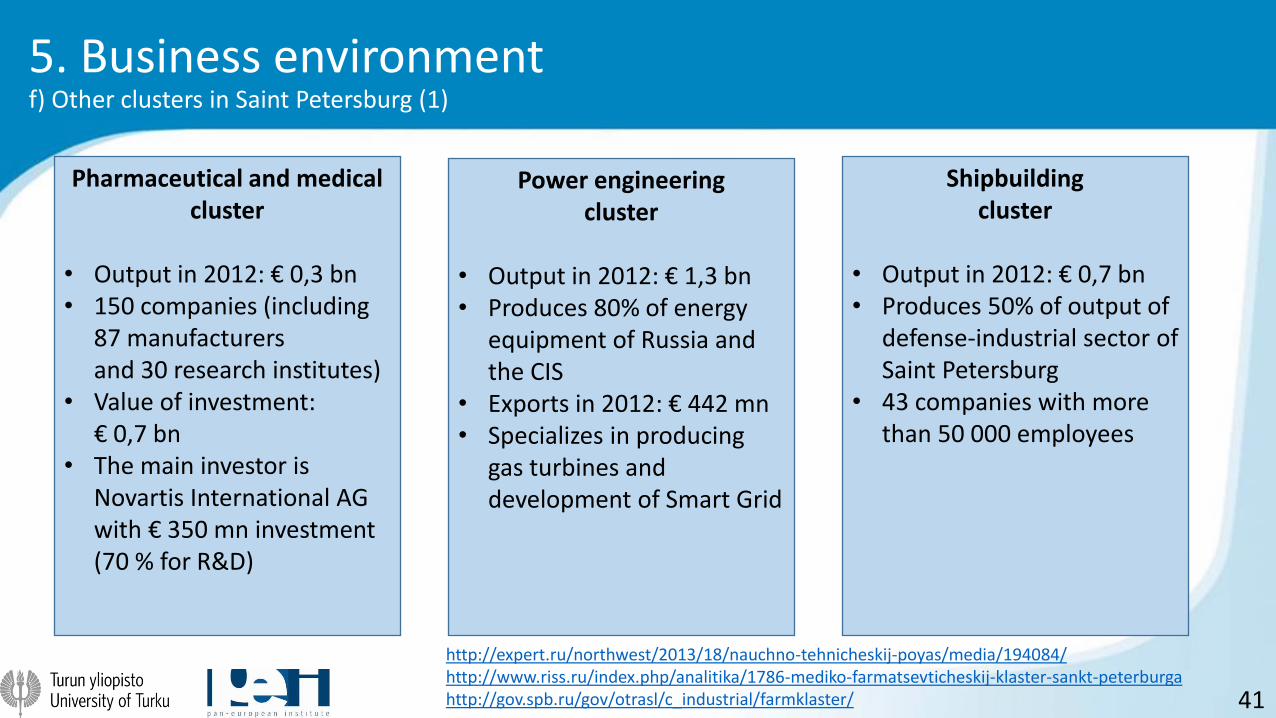
Power engineering cluster
• Output in 2012: € 1,3 bn • Produces 80% of energy
equipment of Russia and the CIS
• Exports in 2012: € 442 mn • Specializes in producing
gas turbines and development of Smart Grid
5. Business environment f) Other clusters in Saint Petersburg (1)
41
http://expert.ru/northwest/2013/18/nauchno-tehnicheskij-poyas/media/194084/ http://www.riss.ru/index.php/analitika/1786-mediko-farmatsevticheskij-klaster-sankt-peterburga http://gov.spb.ru/gov/otrasl/c_industrial/farmklaster/
Pharmaceutical and medical cluster
• Output in 2012: € 0,3 bn • 150 companies (including
87 manufacturers and 30 research institutes)
• Value of investment: € 0,7 bn
• The main investor is Novartis International AG with € 350 mn investment (70 % for R&D)
Shipbuilding cluster
• Output in 2012: € 0,7 bn • Produces 50% of output of
defense-industrial sector of Saint Petersburg
• 43 companies with more than 50 000 employees

Radio electronics cluster
• Output in 2012: € 2 bn • 54 companies • Public-private partnership • 5 universities for teaching
students
IT Cluster
• Volume of output in 2012: € 0,01 bn
• 86 participants (200 planned, including Microsoft and Kaspersky Lab)
• The main object is Ingira Technopark
• Value of investment: € 0,6 bn
• Commissioning not earlier than 2015
5. Business environment f) Other clusters in Saint Petersburg (2)
42
http://expert.ru/northwest/2013/18/nauchno-tehnicheskij-poyas/media/194084/ http://ingria-park.ru/english/about/
Aerospace cluster
• Output in 2012: € 0,4 bn • 32 participants (including
12 companies and 13 scientific and educational institutions)
• The main specialization is the satellite navigation technologies

Credit rating agency Saint Petersburg Leningrad region Russia
Standard and Poor’s BBB (stable) BB+ (stable) BBB (stable)
Moody’s Ваа1 (stable) Ва1 (stable) Ваа1 (stable)
Fitch Ratings BBB (stable) BB+ (positive) BBB (stable)
St. Petersburg is the 21th Russian city for
doing business
http://www.forbes.ru/rating/30-luchshih-gorodov-dlya-biznesa-2013/2013?full=1&table=1
http://www.finmarket.ru/economics/article/3554778
St. Petersburg is the leading Russian city
http://im.kommersant.ru/ISSUES.PHOTO/SF/2013/004/sgdcyuok.gif
St. Petersburg took the 7th place and Leningrad
region took the 10th place out of 83 Russian regions in the investment rating
St. Petersburg took the 2nd place and Leningrad
region took the 18th place out of 83 Russian
regions in the quality of life rating
http://ria.ru/infografika/20121219/915370916.html
5. Business environment g) Saint Petersburg and Leningrad region in the rankings in 2013
43
Forbes General'nyj
direktor Kommersant RIA Novosti
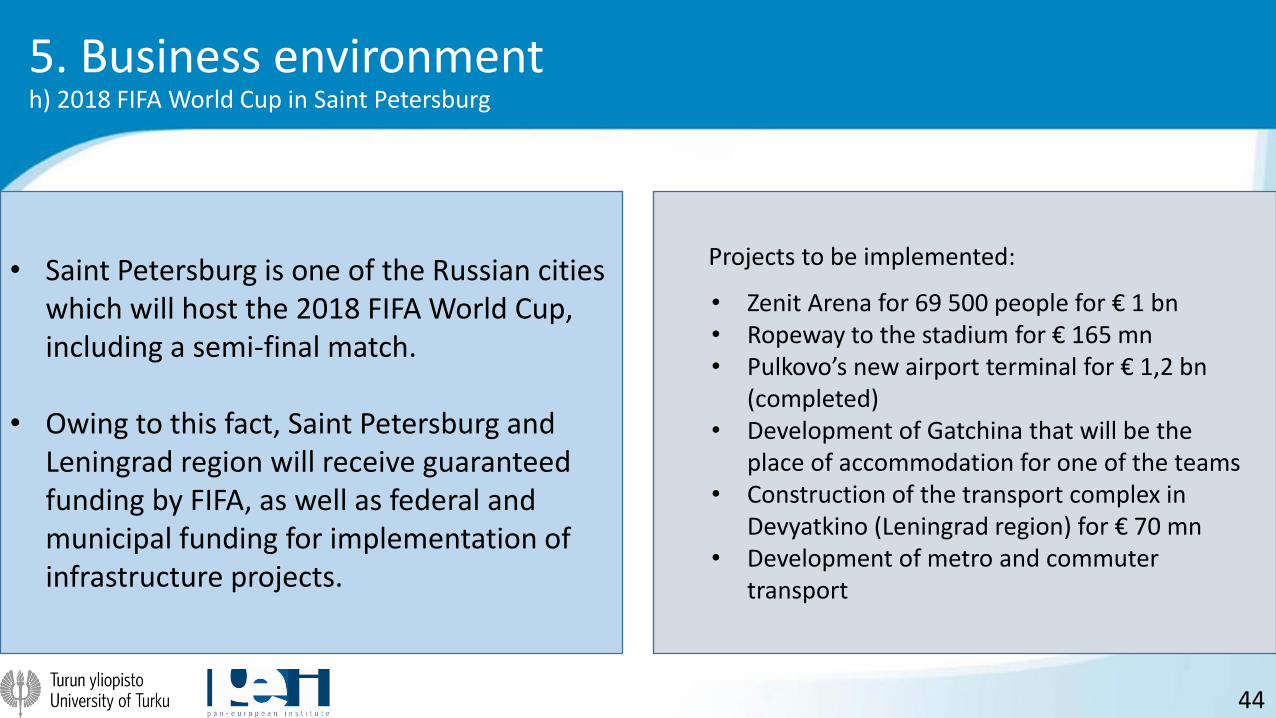
Projects to be implemented:
• Zenit Arena for 69 500 people for € 1 bn • Ropeway to the stadium for € 165 mn • Pulkovo’s new airport terminal for € 1,2 bn
(completed) • Development of Gatchina that will be the
place of accommodation for one of the teams • Construction of the transport complex in
Devyatkino (Leningrad region) for € 70 mn • Development of metro and commuter
transport
5. Business environment h) 2018 FIFA World Cup in Saint Petersburg
44
• Saint Petersburg is one of the Russian cities which will host the 2018 FIFA World Cup, including a semi-final match.
• Owing to this fact, Saint Petersburg and
Leningrad region will receive guaranteed funding by FIFA, as well as federal and municipal funding for implementation of infrastructure projects.

Country Phone Address E-mail Web page
Armenia +7 (812) 571-72-36 22, ulitsa Dekabristov http://russia.mfa.am/ru/
Azerbaijan +7 (812) 717-38-90 27/2, 2-ya Sovetskaya ulitsa [email protected] http://azconsulate.spb.ru/
Belgium +7 (812) 579-57-91 11, Saperniy pereulok [email protected] http://www.diplomatie.be/saint-petersburg
Bulgaria +7 (812) 401-01-52 27, ulitsa Ryleeva [email protected] http://www.mfa.bg/embassies/russia/setlang/ll
China +7 (812) 713-80-09 134, naberezhnaya kanala Griboedova [email protected] http://saint-petersburg.china-consulate.org/
Cyprus +7 (812) 380-78-00 27, Furshtatskaya ulitsa [email protected] http://www.mfa.gov.cy/mfa/consulate/consulate_spb.nsf/dmlindex_en/dmlindex_en?OpenDocument
The Czech Republic +7 (812) 271-04-59 5, Tverskaya ulitsa [email protected] http://mzv.cz/
Denmark +7 (812) 703-39-00 42, Naberezhnaya reki Moiki [email protected] http://www.dipinfo.ru/eng/gk/denmark
Estonia +7 (812) 702-09-20 14, Bolshaya Monetnaya ulitsa [email protected] http://peterburg.estemb.ru/
Finland +7 (812) 331-76-00 4, Preobrazhenskaya ploshchad [email protected] http://www.finland.org.ru/ru/
France +7 (812) 332-22-70 15, Naberezhnaya reki Moiki [email protected] http://www.francespb.org/
Germany +7 (812) 320-24-00 39, Furshtatskaya ulitsa http://www.sankt-petersburg.diplo.de/Vertretung/stpetersburg/ru/Startseite.html
The United Kingdom +7 (812) 320-32-00 5, Ploshad Proletarskoy Diktaturi [email protected] http://ukinrussia.fco.gov.uk/ru/about-us/other-locations/st-petersburg-consulate-general/
Greece +7 (812) 334-35-86 17, prospect Chernishevskogo http://www.dipinfo.ru/eng/gk/greece
Hungary +7 (812) 312-64-58 15, ulitsa Marata [email protected] http://www.mfa.gov.hu/
Israel +7 (812) 406-05-00 [email protected] http://embassies.gov.il/SPB/Pages/default.aspx
Italy +7 (812) 318-07-91 10, Teatralnaya ploshchad [email protected] http://www.conssanpietroburgo.esteri.it/
6. Additional information a) Consulates general (1)
45

Country Phone Address E-mail Web page
India 640-72-22 Ryleyeva ulitsa, 35 [email protected] http://www.indianconsulate.ru
Japan 449-47-70 29, naberezhnaya reki Moiki [email protected] http://st-petersburg.ru.emb-japan.go.jp
Kazakhstan 325-25-46 15А, Vilensky pereulok [email protected] http://kazconsulate.spb.ru/
South Korea 448-19-09 32A, ulitsa Nekrasova [email protected] http://rus-stpetersburg.mofa.go.kr/worldlanguage/europe/rus-stpetersburg/main/index.jsp
Latvia 327-60-54 11, 10-ya liniya, Vasilievsky island [email protected] http://www.latviaspb.ru/en/stpetersburg
Lithuania 327-02-30 37, ulitsa Ryleeva [email protected] http://consulate-stpetersburg.mfa.lt
The Netherlands 334-02-00 11, naberezhnaya Reki Moyki [email protected] http://www.nlcg.spb.ru/
Norway 336-64-20 25, Nevsky prospect [email protected] http://www.norvegia.ru
Poland 336-31-40 12, 5-ya Sovetskaya ulitsa [email protected] http://www.petersburgkg.polemb.net/index.php?document=161
Romania 312-61-41 4, ulitsa Gorokhovaya [email protected] http://www.sanktpetersburg.mae.ro
Slovakia 244-36-66 21/2, ulitsa Orbeli [email protected] http://www.mfa.sk/zu/index/podstranka.php?id=1165
Spain 702-62-66 9, Furshtatskaya ulitsa [email protected] http://www.espana.spb.ru/
Sweden 329-14-30 1/3, Malaya Konyushennaya ulitsa [email protected]
http://www.swedenabroad.com/en-GB/Embassies/Saint-Petersburg/
Switzerland 327-08-17 9,17, prospect Chernyshevskogo [email protected] http://eda.admin.ch
Turkey 577-18-12 24, 7-ya Sovetskaya ulitsa [email protected] http://stpetersburg.cg.mfa.gov.tr
Ukraine 331-51-69 1B, ulitsa Bonch-Bruevicha [email protected] http://www.cons-ua.ru
The USA 331-26-00 15, Furshtatskaya ulitsa [email protected] http://stpetersburg.usconsulate.gov
6. Additional information a) Consulates general (2)
46

The Governor of Saint Petersburg
• Address: Smloniy • +7 (812) 576-4501 • http://gov.spb.ru/governor/ • [email protected]
Committee on External Relations of Saint Petersburg
• Address: Smloniy • +7 (812) 576-7204 • www.kvs.spb.ru • [email protected]
The Regional Government of Leningrad region
• Address: prosp. Suvorovskiy, 67 • +7 (812) 577-4774 • www.lenobl.ru • [email protected]
The Committee on Foreign Economic and Interregional Relations of Leningrad region
• Address: prosp. Suvorovskiy, 67 • +7 (812) 274-4742 • www.inter.lenobl.ru • [email protected]
6. Additional information b) Some authorities
47
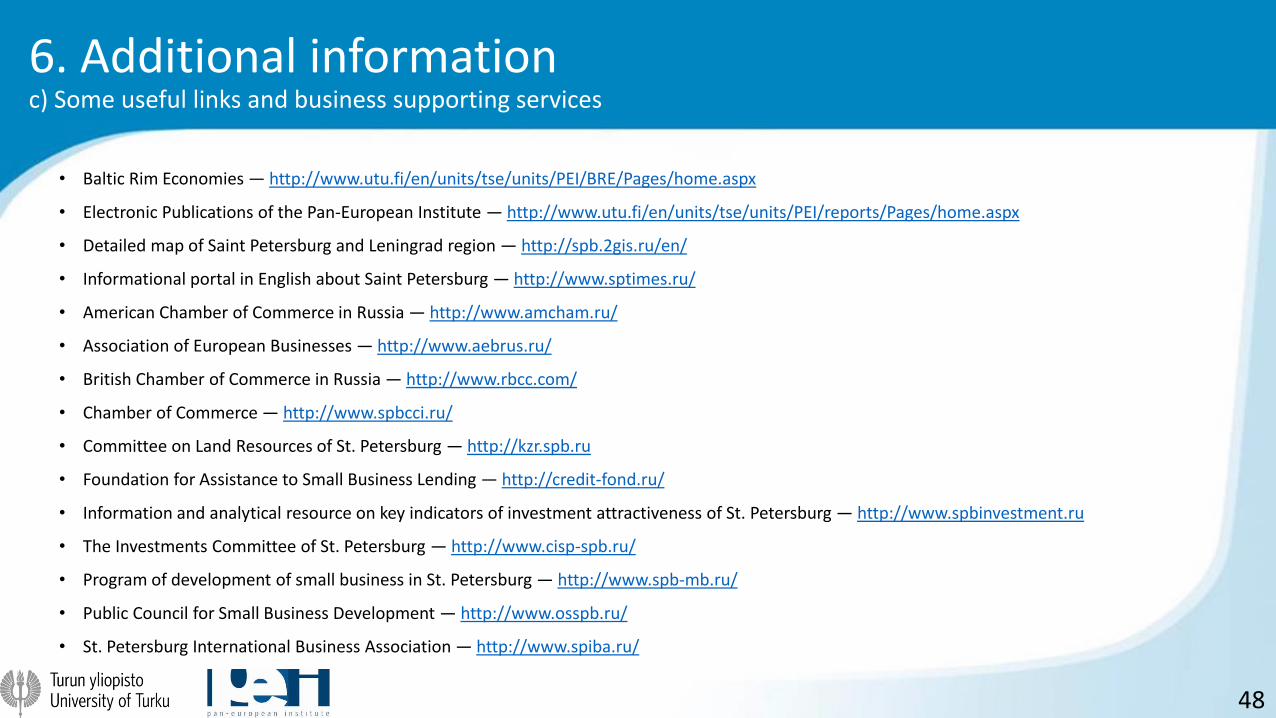
• Baltic Rim Economies — http://www.utu.fi/en/units/tse/units/PEI/BRE/Pages/home.aspx
• Electronic Publications of the Pan-European Institute — http://www.utu.fi/en/units/tse/units/PEI/reports/Pages/home.aspx
• Detailed map of Saint Petersburg and Leningrad region — http://spb.2gis.ru/en/
• Informational portal in English about Saint Petersburg — http://www.sptimes.ru/
• American Chamber of Commerce in Russia — http://www.amcham.ru/
• Association of European Businesses — http://www.aebrus.ru/
• British Chamber of Commerce in Russia — http://www.rbcc.com/
• Chamber of Commerce — http://www.spbcci.ru/
• Committee on Land Resources of St. Petersburg — http://kzr.spb.ru
• Foundation for Assistance to Small Business Lending — http://credit-fond.ru/
• Information and analytical resource on key indicators of investment attractiveness of St. Petersburg — http://www.spbinvestment.ru
• The Investments Committee of St. Petersburg — http://www.cisp-spb.ru/
• Program of development of small business in St. Petersburg — http://www.spb-mb.ru/
• Public Council for Small Business Development — http://www.osspb.ru/
• St. Petersburg International Business Association — http://www.spiba.ru/
6. Additional information c) Some useful links and business supporting services
48