Embed Size (px)
Citation preview
Salary Analytics™
Integrated salary reporting system
raporty-placowe.pl
Copyright by ProXmedia 2011
Salary Analytics™ usagesuggested forms of use
Recruitment
Labour market monitoring
Consulting Services - HR consultancy
Company presentations: board meetings, team meetings etc.
Competitor analysis - operating in various sectors on the market
Copyright by ProXmedia 2011
The following pages contain examples of the application’s screenshots

Copyright by ProXmedia 2011
Report „Departments” Shows a breakdown of salary ranges for various firm departments
Main features The possibility to adjust the
salary range thresholds
The possibility of limiting the sample from the bottom and top of the boundary
The possibility to customize the data for a specific period of time
The possibility to view additional information for each series such as decile relation, Gini index etc.
The possibility to observe salary trend, satisfaction levels, qualification occurrence - in all salary ranges
* Random data

Copyright by ProXmedia 2011
Main features The possibility to adjust the
salary range thresholds
The possibility of limiting the sample from the bottom and top of the boundary
The possibility to customize the data for a specific period of time
The possibility to view additional information for each series such as decile relation, Gini index etc.
The possibility to observe salary trend, satisfaction levels, qualification occurrence - in all salary ranges
Report „Sectors”Shows a breakdown of salary ranges for the sectors according to PKD
* Random data

Main features
Copyright by ProXmedia 2011
The possibility of presenting data for departments, sectors, groups and individual professions
The possibility to filter by all available data ranges
The possibility of limiting the sample from the bottom and top of the boundary
The possibility to customize the data for a specific period of time
The possibility of presenting multiple data series at once
Job offer sourcesShows a breakdown of job origin sources as a percentage
* Random data

Main features
Copyright by ProXmedia 2011
The possibility to adjust the salary range thresholds
The possibility of limiting the sample from the bottom and top of the boundary
The possibility to customize the data for a specific period of time
The possibility of presenting multiple data series at the same time with the division into salary ranges
Histogram Shows a breakdown of the number of people in each salary ranges
* Random data

Main features
Copyright by ProXmedia 2011
The possibility to adjust the salary range thresholds
The possibility of limiting the sample from the bottom and top of the boundary
The possibility to customize the data for a specific period of time
The possibility to analyze a single salary range
Satisfaction levelsShows the satisfaction levels in salary ranges
* Random data

Copyright by ProXmedia 2011
Main features The possibility to adjust the
salary range thresholds
The possibility of limiting the sample from the bottom and top of the boundary
The possibility to customize the data for a specific period of time
The possibility to analyze professional qualifications for various sectors of the economy
Professional QualificationsShows qualification’s occurrence in salary ranges
* Random data

Main features
Copyright by ProXmedia 2011
The possibility to adjust the salary range thresholds
The possibility to customize the data for a specific period of time
The possibility to analyze the salary trend from previous quarters
The possibility to analyze data from the current quarter (or even half of the quarter)
Salary trend Presents the change in average earnings on a quarterly basis
* Random data

Copyright by ProXmedia 2011
Main features The possibility to adjust the
salary range thresholds
The possibility of limiting the sample from the bottom and top of the boundary
The possibility to customize the data for a specific period of time
The possibility to view additional information for each series such as decile relation, Gini index etc.
The possibility to observe salary trend, satisfaction levels, qualification occurrence - in all salary ranges
Report „Professions” Shows a breakdown of profession groups in salary ranges
* Random data
Copyright by ProXmedia 2011
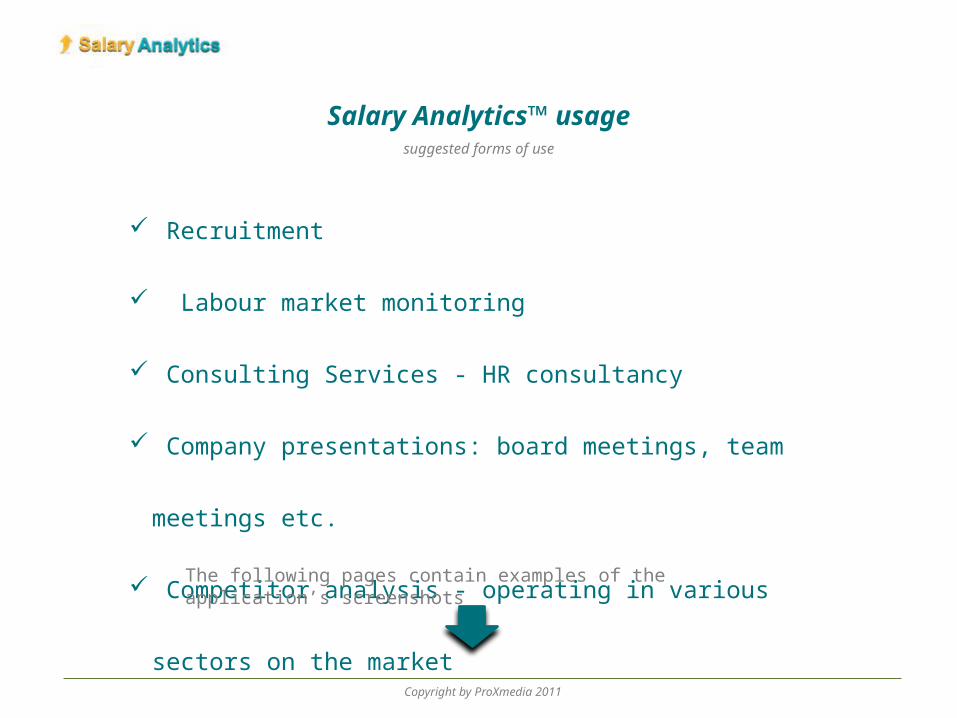
Main features The possibility to customize
the data for a specific period of time which allows the observation of changes in the professional qualifications
The possibility of limiting the sample from the bottom and top of the boundary
The possibility to view additional information for each series such as median and salary average
The possibility to observe the frequency of specific professional qualifications in a given period of time and location
Report „Professional Qualifications” Shows the impact of professional qualifications on wages
* Random data

Copyright by ProXmedia 2011
Main features The possibility to customize
the data for a specific period of time which allows the observation of changes in the language skills over time
The possibility to view additional information for each series such as median and average salary
The possibility to observe the frequency of specific language skills in a given period of time and location
The possibility to adjust the minimum language skills level
Report „Language skills”Shows the impact of language skills on wages
* Random data

Copyright by ProXmedia 2011
Main features The possibility to adjust the
minimum sample size
The possibility of limiting the sample from the bottom and top of the boundary
The possibility to customize the data for a specific period of time
The possibility to view additional information for each series such as median and average salary
The possibility to sort the data by levels of satisfaction and occurrence
Report „Benefits” Presents the distribution of satisfaction with received benefits
* Random data
Copyright by ProXmedia 2011
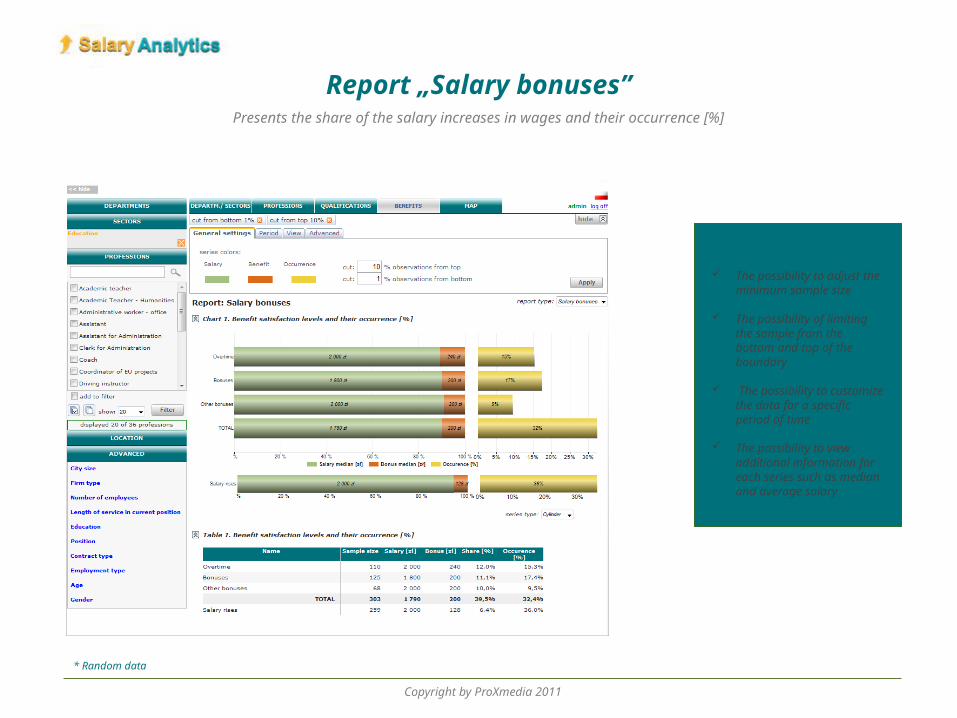
Main features The possibility to adjust the
minimum sample size
The possibility of limiting the sample from the bottom and top of the boundary
The possibility to customize the data for a specific period of time
The possibility to view additional information for each series such as median and average salary
Report „Salary bonuses”Presents the share of the salary increases in wages and their occurrence [%]
* Random data

Copyright by ProXmedia 2011
Main features The possibility of limiting the
sample from the bottom and top of the boundary
The possibility to customize the data for a specific period of time
The possibility to view additional information for each series such as median and average salary
The possibility to analyze pay increases in various sectors of the economy and different position levels
Report „Salary rises”Shows the levels of satisfaction with the received increases and their occurrence [%]
* Random data

Copyright by ProXmedia 2011
Main features The possibility to adjust the
salary range thresholds
The possibility of limiting the sample from the bottom and top of the boundary
The possibility to customize the data for a specific period of time
The possibility to view additional information for each series such as decile relation, Gini index etc.
The possibility to adjust the format of the map that is based on the median, average wages, according to working hours or place of residence
Report „Map - regions” Presents the distribution of wages by region
* Random data

Copyright by ProXmedia 2011
Main features The possibility to analyze
salary trend (year-on-year and quarter-on-quarter)
The possibility of limiting the sample from the bottom and top of the boundary
The possibility to customize the data for a specific period of time
The possibility to view additional information for each series such as decile relation, Gini index etc.
The possibility to adjust the format of the map that is based on the median, average wages, according to working hours or place of residence
Report „Map - voivodeships ”Shows a breakdown of salaries broken down by province
* Random data

Copyright by ProXmedia 2011
Report „Map - sub regions”Shows a breakdown of salaries broken down into sub regions
Main features The possibility to adjust the
salary range thresholds
The possibility of limiting the sample from the bottom and top of the boundary
The possibility to customize the data for a specific period of time
The possibility to view additional information for each series such as decile relation, Gini index etc.
The possibility to adjust the format of the map that is based on the median, average wages, according to working hours or place of residence
* Random data

Copyright by ProXmedia 2011
Main features The possibility to adjust the
salary range thresholds
The possibility of limiting the sample from the bottom and top of the boundary
The possibility to customize the data for a specific period of time
The possibility to view additional information for each series such as decile relation, Gini index etc.
The possibility to adjust the format of the map that is based on the median, average wages, according to working hours or place of residence
Report „Map – drill down”Presents the distribution of wages in sub location ("drill down" function)
* Random data
Additional information
Source of data:
Copyright by ProXmedia 2011
Please contact us at
Survey data are collected from online users wishing to compare their current salary to other users working in the same sector and holding similar position.
Users are not getting any money for completing the surveys, the only incentive is the desire to compare their data to the others. Every person can only fill in questionnaire once per year.
The more precise user fills in the data, the more detailed is the report he receives.
All questionnaires are manually verified.
The frequency of data collection :New user’s data are collected every day, additionally every year we conduct the annual salary survey for the existing users allowing them to compare their changes with similar users.