Embed Size (px)
Citation preview
8/10/2019 Salary guide (Oil Gas)
http://slidepdf.com/reader/full/salary-guide-oil-gas 1/32
THE OIL & GAS
GLOBAL SALARYGUIDE 2012Global salaries and recruiting trends.
8/10/2019 Salary guide (Oil Gas)
http://slidepdf.com/reader/full/salary-guide-oil-gas 2/32
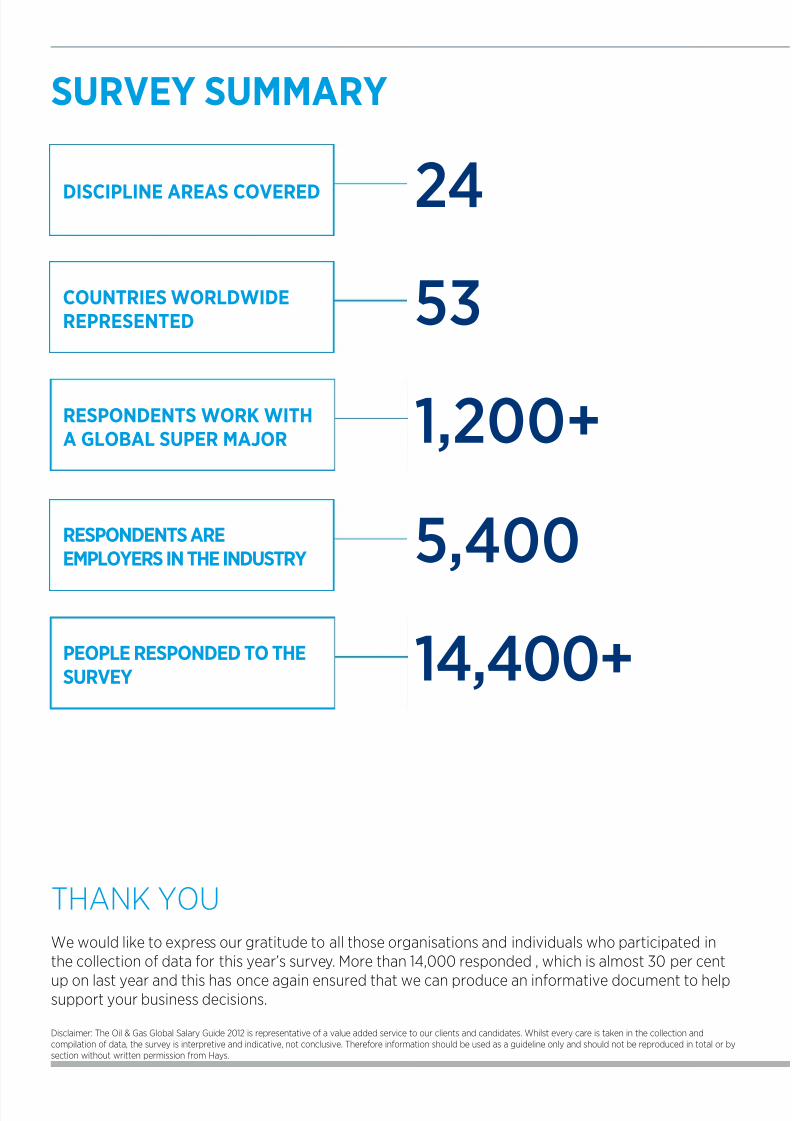
DISCIPLINE AREAS COVERED
24COUNTRIES WORLDWIDEREPRESENTED 53
RESPONDENTS WORK WITHA GLOBAL SUPER MAJOR 1,200+
RESPONDENTS AREEMPLOYERS IN THE INDUSTRY 5,400
PEOPLE RESPONDED TO THE
SURVEY 14,400+
SURVEY SUMMARY
THANK YOU
We would like to express our gratitude to all those organisations and individuals who participated in
the collection of data for this year’s survey. More than 14,000 responded , which is almost 30 per cent
up on last year and this has once again ensured that we can produce an informative document to helpsupport your business decisions.
Disclaimer: The Oil & Gas Global Salary Guide 2012 is representative of a value added service to our clients and candidates. Whilst every care is taken in the collection and
compilation of data, the survey is interpretive and indicative, not conclusive. Therefore information should be used as a guideline only and should not be reproduced in total or by
section without written permission from Hays.
8/10/2019 Salary guide (Oil Gas)
http://slidepdf.com/reader/full/salary-guide-oil-gas 3/32
1
CONTENTS
2 A global perspective
Section one - salary information
6 Overview and salaries by country
7 Salaries by discipline area
8 Salaries by company type
9 Contractor day rates by region
Section two - industry benefits
12 Overview of benefits
13 Benefits by company type
14 Benefits by region
Section three - industry employment
17 Staffing levels
18 Diversity and movement of workforce
20 Experience and tenure
22 Employment mix
Section four - economic outlook
26 Industry outlook
27 Most significant issues
From boom times in Australia and Brazil to unrest in North Africa, our report
on salaries once again displays the many trends, events and forces that shape
the complex world of how people are paid in the oil and gas industry. We are
often very aware of remuneration within our own regional industry (it is one
of those topics that impacts us all in some way), however very few of us have
a good handle on how remuneration changes as we move around the world.This is the endearing quality and attraction of this document and we are
pleased to say the main reason why it receives so much interest throughout
the industry.
In general the trend in remuneration for 2011 was up; driven on by a buoyant
oil price and most countries around the world seeking to explore for, or
extract the energy resources they need to advance their own economies.
Indeed it was a year that stood out from others in the breadth of geographic
coverage. Whilst South America and Asia Pacific continued to lead the way
in new investment, two of the traditional power houses of the industry, the
North Sea and the Gulf of Mexico, also came back on line in terms of hiring.
This added to an already busy market, where very few areas of the globe
were left untouched.
This wider participation was also reflected in those completing our survey,
both in their geographic coverage and their number. To have over 14,000
respondents this year was a tremendous number which exceeded all
expectations. This large response has allowed us to drill down into more
specific roles, disciplines and regions. In this regard individuals can more
clearly identify their own situation whilst at the same time we can ensure that
the figures we produce are an accurate portrayal of the market.
Whilst assessing our own individual package against the figures is an
emotive and often interesting activity, it is the movement of remuneration
and employment trends over the last three years that provide the most
fascinating insights. In general the market in 2010 reflected the tail end of the
global recession of the previous year and was further weighed down by the
oil disaster in the Gulf of Mexico. In 2011 we have seen these issues left behind
and the market regain most of those losses, particularly so when it comes
to permanent salary packages and benefits. Contractor rates are still below
the highs of 2008, and with the general drift towards permanent staffing
it remains to be seen whether they will return in the near future. Whilst the
markets have softened towards the end of the year in the face of intense
negative sentiment around Europe, the data shows an entrenched confidence
that should prevail through 2012 and beyond.
Last year’s Salary Guide was downloaded by over 150,000 people. With a
further 10,000 hard copies distributed at various industry exhibitions and
conferences, it is fast becoming the reference of choice for those wishing tocompare remuneration globally. This continues to be our driving ambition,
and we will continue to work hard in improving the content to ensure that it
remains as such.
There are numerous people to thank in the compilation of this document, not
least of which are the many industry professionals that took valuable time
to complete the survey. We would also like to thank those in our respective
teams at ‘Hays Oil & Gas’ and ‘Oil and Gas Job Search’ that spent many an
hour analysing the data and designing the format. Once again their hard
work and the time taken by those responding have combined to produce a
great reference document for our industry.
Matt Underhill Managing Director, Hays Oil & Gas
Duncan Freer Managing Director, Oil and Gas Job Search
8/10/2019 Salary guide (Oil Gas)
http://slidepdf.com/reader/full/salary-guide-oil-gas 4/32
OIL & GAS SALARY GUIDE 20122
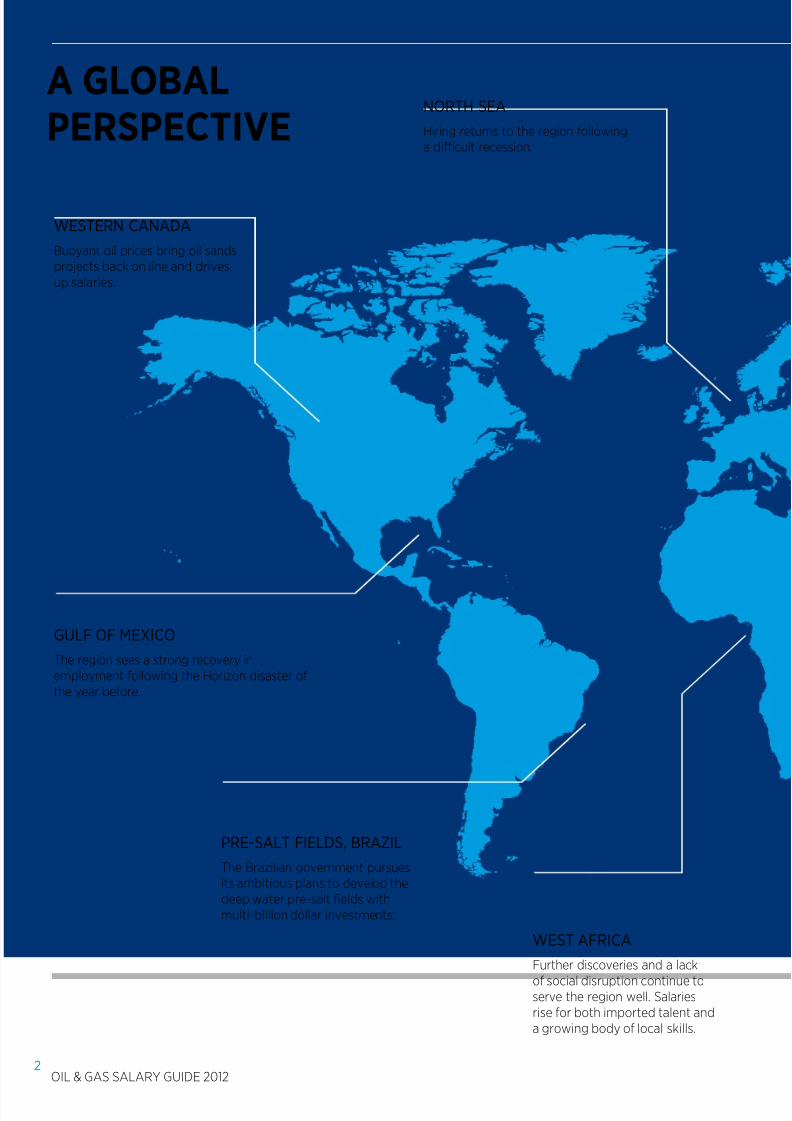
A GLOBALPERSPECTIVE
PRE-SALT FIELDS, BRAZIL
The Brazilian government pursues
its ambitious plans to develop the
deep water pre-salt fields with
multi-billion dollar investments.
GULF OF MEXICO
The region sees a strong recovery in
employment following the Horizon disaster of
the year before.
NORTH SEA
Hiring returns to the region following
a difficult recession.
WESTERN CANADA
Buoyant oil prices bring oil sands
projects back on line and drives
up salaries.
WEST AFRICA
Further discoveries and a lack
of social disruption continue toserve the region well. Salaries
rise for both imported talent and
a growing body of local skills.
8/10/2019 Salary guide (Oil Gas)
http://slidepdf.com/reader/full/salary-guide-oil-gas 5/32
3
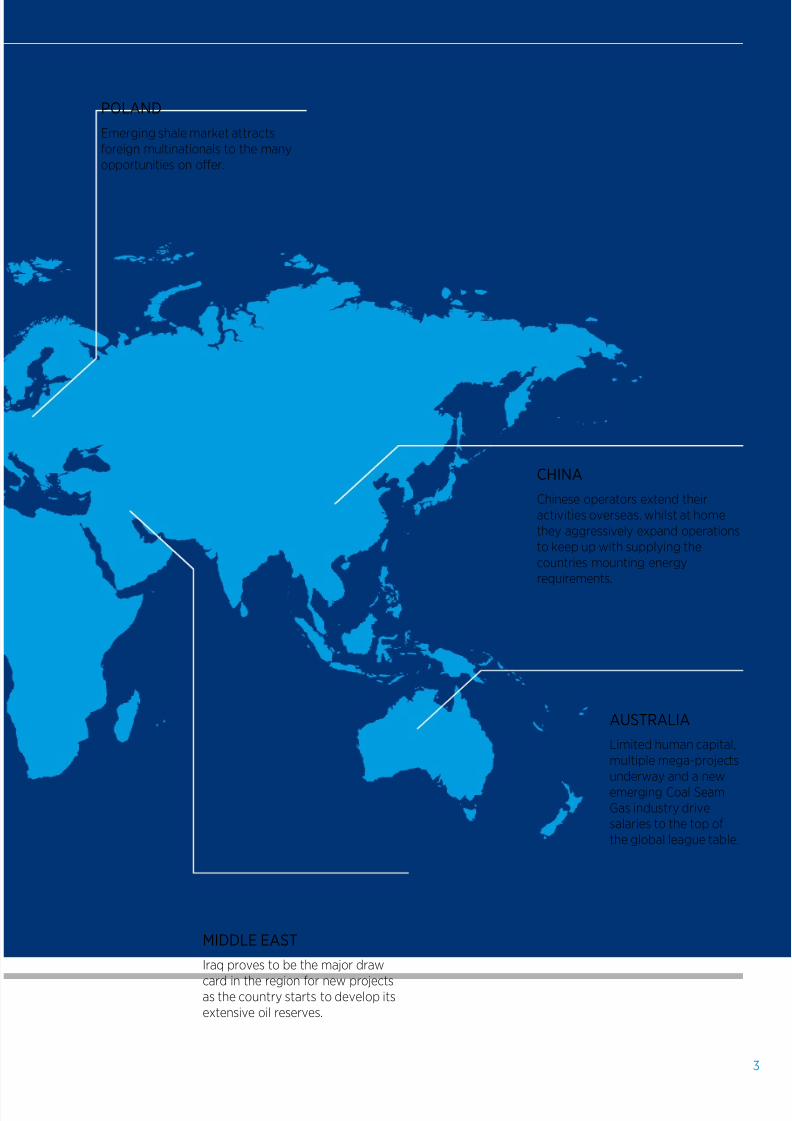
AUSTRALIA
Limited human capital,
multiple mega-projects
underway and a new
emerging Coal Seam
Gas industry drive
salaries to the top of
the global league table.
POLAND
Emerging shale market attracts
foreign multinationals to the many
opportunities on offer.
CHINA
Chinese operators extend their
activities overseas, whilst at home
they aggressively expand operations
to keep up with supplying the
countries mounting energy
requirements.
MIDDLE EAST
Iraq proves to be the major draw
card in the region for new projectsas the country starts to develop its
extensive oil reserves.
8/10/2019 Salary guide (Oil Gas)
http://slidepdf.com/reader/full/salary-guide-oil-gas 6/32
OIL & GAS SALARY GUIDE 20124
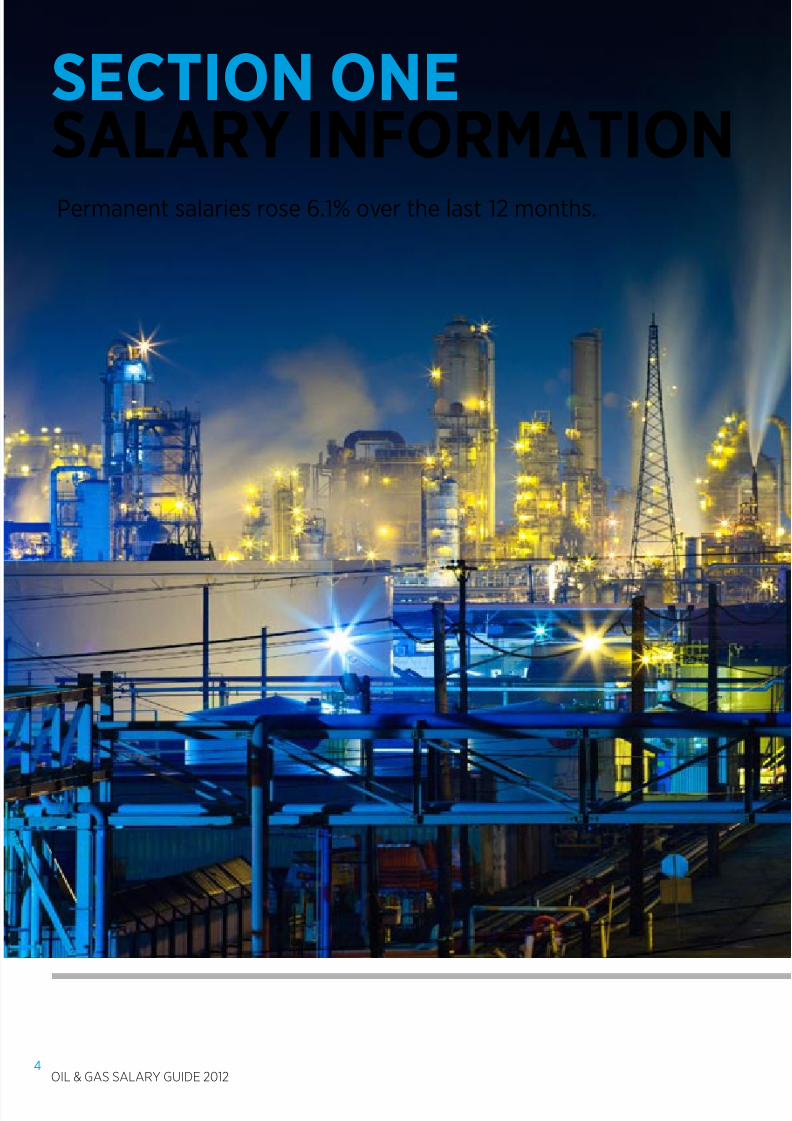
SECTION ONESALARY INFORMATION Permanent salaries rose 6.1% over the last 12 months.
8/10/2019 Salary guide (Oil Gas)
http://slidepdf.com/reader/full/salary-guide-oil-gas 7/32
5
S E C T I O N O N E -
S A L A R Y I N F O R M A T I O N
S E C T I O N T W O - I N D U S T R Y
B E N E F I T S
S E C T I O N T H R E E - I N D U S T R Y E M P L O Y M E N T
S E C T I O N F
O U R - E C O N O M I C O U T L O O K
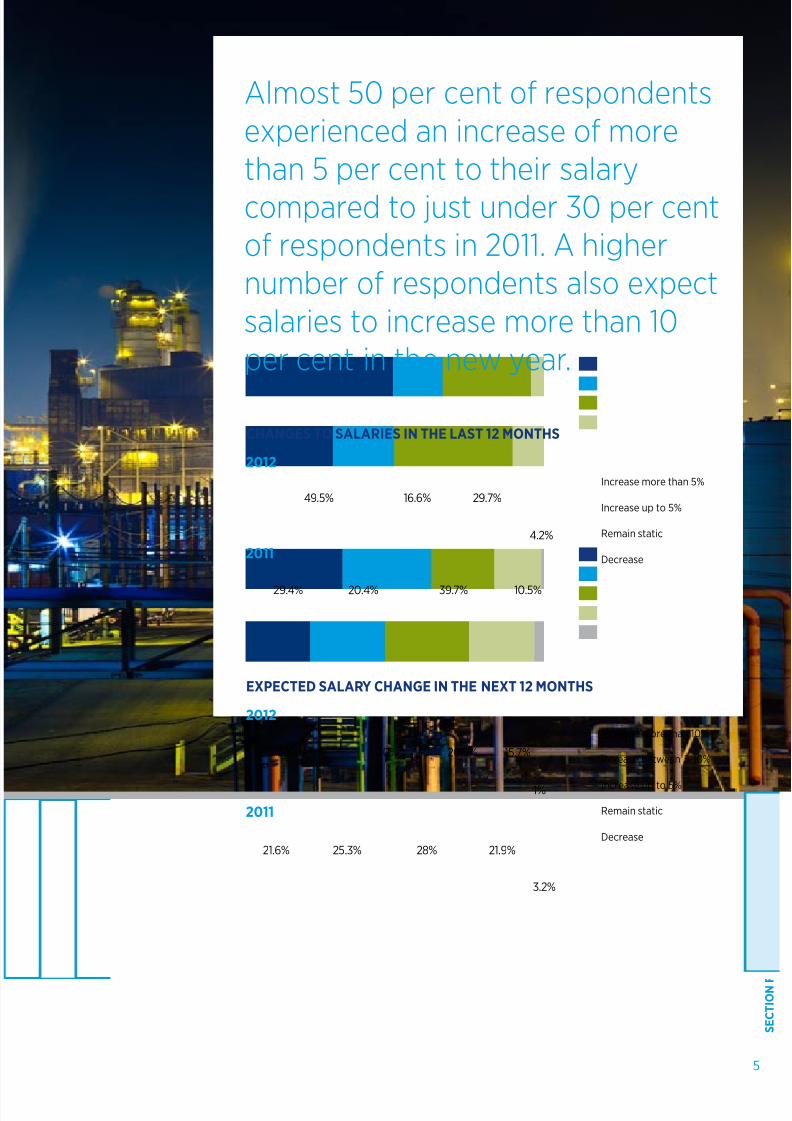
Almost 50 per cent of respondents
experienced an increase of more
than 5 per cent to their salary
compared to just under 30 per centof respondents in 2011. A higher
number of respondents also expect
salaries to increase more than 10
per cent in the new year.
Increase more than 5%
Increase up to 5%
Remain static
Decrease
Increase more than 10%
Increase between 5-10%
Increase up to 5%
Remain static
Decrease
CHANGES TO SALARIES IN THE LAST 12 MONTHS
EXPECTED SALARY CHANGE IN THE NEXT 12 MONTHS
2012
2011
2012
2011
49.5% 16.6% 29.7%
4.2%
29.4% 20.4% 39.7% 10.5%
32.4% 30% 20.9% 15.7%
21.6% 25.3% 28% 21.9%
1%
3.2%
8/10/2019 Salary guide (Oil Gas)
http://slidepdf.com/reader/full/salary-guide-oil-gas 8/32
OIL & GAS SALARY GUIDE 20126
SALARYSALARY INFORMATION
SALARIES
Algeria 40,600 89,200
Angola 48,400 107,700
Argentina 68,800 N/A
Australia 164,000 173,100Azerbaijan 40,400 139,200
Bahrain N/A 77,900
Brazil 119,600 106,700
Brunei 140,500 94,400
Canada 128,700 123,300
China 55,700 143,700
Colombia 69,000 122,600
Denmark 106,300 152,400
Egypt 35,300 132,300
France 92,100 118,400
Ghana 40,200 139,900
India 39,300 101,600
Indonesia 45,000 157,200
Iran 52,200 93,900
Iraq 36,900 131,000
Italy 68,400 95,800
Kazakhstan 39,700 128,500
Kuwait N/A 73,000
Libya 44,100 69,200
Malaysia 46,800 128,400
Mexico 43,600 117,300
Netherlands 138,500 N/A
New Zealand 116,500 112,400
Nigeria 45,600 123,200
Norway 180,300 122,800
Oman 68,000 80,300
Pakistan 31,600 51,300
Papua New Guinea 29,600 189,900
Philippines 37,100 111,300
Poland 61,000 129,300
Portugal 49,400 116,600
Qatar N/A 72,300
Romania 34,400 123,000
Russia 59,100 138,200
Saudi Arabia 102,900 67,100Singapore 79,700 99,300
South Africa 79,200 95,000
South Korea N/A 147,500
Spain 70,700 73,100
Sudan 29,200 79,400
Thailand 40,300 137,200
Trinidad and Tobago 65,300 162,400
Turkey 67,100 89,300
United Arab Emirates N/A 69,400
United Kingdom 87,100 80,900
United States of America 124,000 119,200
Venezuela 75,500 109,400
Vietnam 47,600 151,900
Yemen 30,000 75,100
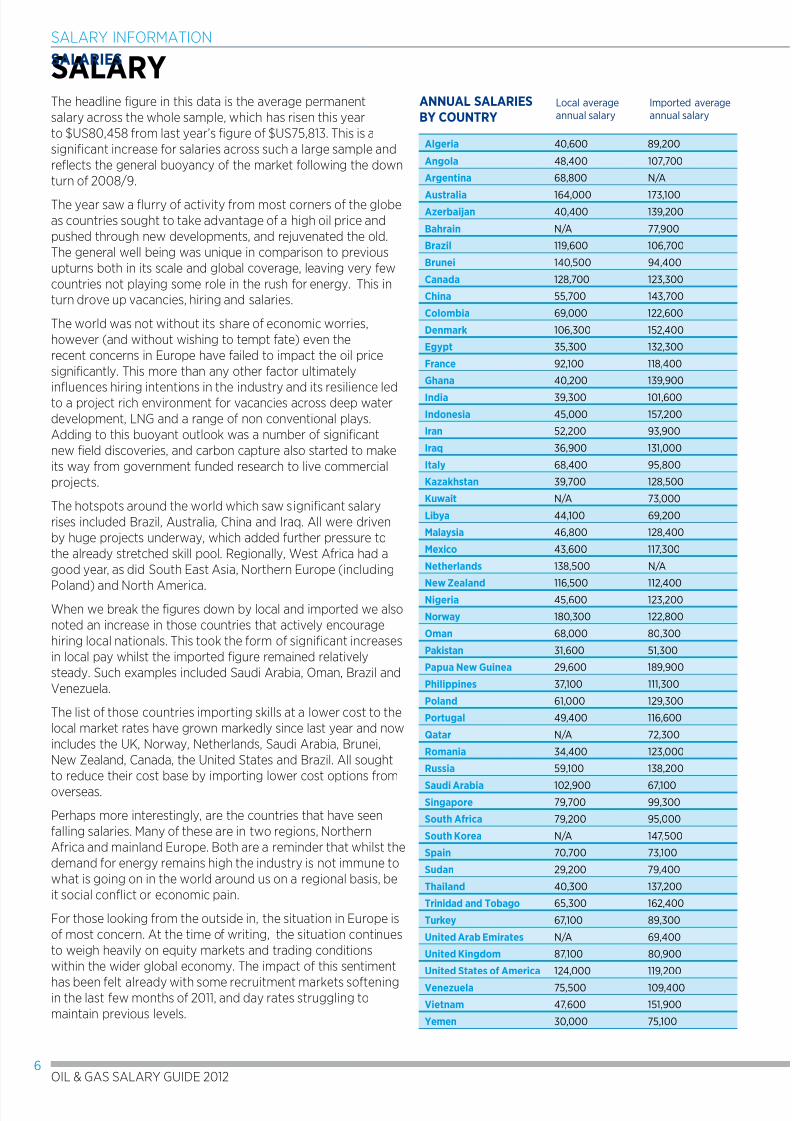
The headline figure in this data is the average permanent
salary across the whole sample, which has risen this year
to $US80,458 from last year’s figure of $US75,813. This is a
significant increase for salaries across such a large sample and
reflects the general buoyancy of the market following the down
turn of 2008/9.
The year saw a flurry of activity from most corners of the globe
as countries sought to take advantage of a high oil price and
pushed through new developments, and rejuvenated the old.
The general well being was unique in comparison to previous
upturns both in its scale and global coverage, leaving very few
countries not playing some role in the rush for energy. This in
turn drove up vacancies, hiring and salaries.
The world was not without its share of economic worries,
however (and without wishing to tempt fate) even the
recent concerns in Europe have failed to impact the oil price
significantly. This more than any other factor ultimately
influences hiring intentions in the industry and its resilience ledto a project rich environment for vacancies across deep water
development, LNG and a range of non conventional plays.
Adding to this buoyant outlook was a number of significant
new field discoveries, and carbon capture also started to make
its way from government funded research to live commercial
projects.
The hotspots around the world which saw significant salary
rises included Brazil, Australia, China and Iraq. All were driven
by huge projects underway, which added further pressure to
the already stretched skill pool. Regionally, West Africa had a
good year, as did South East Asia, Northern Europe (including
Poland) and North America.When we break the figures down by local and imported we also
noted an increase in those countries that actively encourage
hiring local nationals. This took the form of significant increases
in local pay whilst the imported figure remained relatively
steady. Such examples included Saudi Arabia, Oman, Brazil and
Venezuela.
The list of those countries importing skills at a lower cost to the
local market rates have grown markedly since last year and now
includes the UK, Norway, Netherlands, Saudi Arabia, Brunei,
New Zealand, Canada, the United States and Brazil. All sought
to reduce their cost base by importing lower cost options from
overseas.
Perhaps more interestingly, are the countries that have seen
falling salaries. Many of these are in two regions, Northern
Africa and mainland Europe. Both are a reminder that whilst the
demand for energy remains high the industry is not immune to
what is going on in the world around us on a regional basis, be
it social conflict or economic pain.
For those looking from the outside in, the situation in Europe is
of most concern. At the time of writing, the situation continues
to weigh heavily on equity markets and trading conditions
within the wider global economy. The impact of this sentiment
has been felt already with some recruitment markets softeningin the last few months of 2011, and day rates struggling to
maintain previous levels.
ANNUAL SALARIESBY COUNTRY
Local average
annual salary
Imported average
annual salary
8/10/2019 Salary guide (Oil Gas)
http://slidepdf.com/reader/full/salary-guide-oil-gas 9/32
7
S E C T I O N O N E -
S A L A R Y I N F O R M A T I O N
S E C T I O N T W O - I N D U S T R Y
B E N E F I T S
S E C T I O N T H R E E - I N D U S T R Y E M P L O Y M E N T
S E C T I O N F
O U R - E C O N O M I C O U T L O O K
SALARY INFORMATION
SALARIES
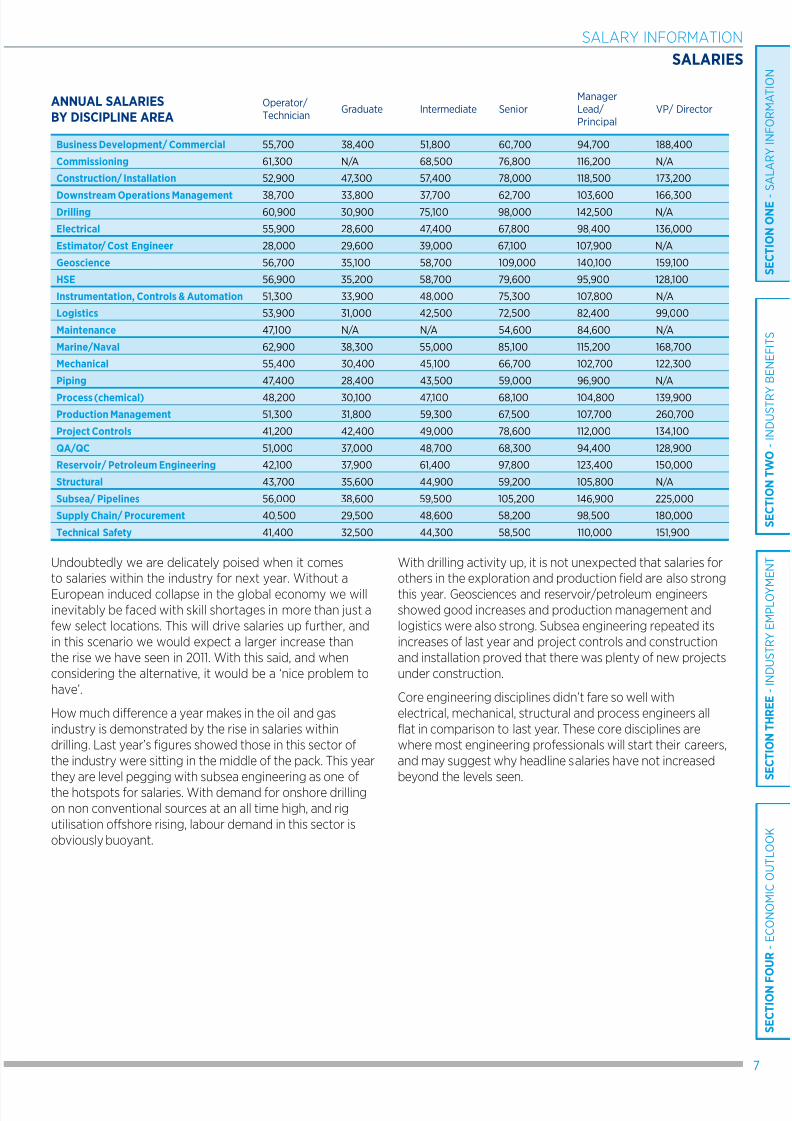
ANNUAL SALARIESBY DISCIPLINE AREA
Operator/
TechnicianGraduate Intermediate Senior
Manager
Lead/Principal
VP/ Director
Business Development/ Commercial 55,700 38,400 51,800 60,700 94,700 188,400
Commissioning 61,300 N/A 68,500 76,800 116,200 N/A
Construction/ Installation 52,900 47,300 57,400 78,000 118,500 173,200
Downstream Operations Management 38,700 33,800 37,700 62,700 103,600 166,300Drilling 60,900 30,900 75,100 98,000 142,500 N/A
Electrical 55,900 28,600 47,400 67,800 98,400 136,000
Estimator/ Cost Engineer 28,000 29,600 39,000 67,100 107,900 N/A
Geoscience 56,700 35,100 58,700 109,000 140,100 159,100
HSE 56,900 35,200 58,700 79,600 95,900 128,100
Instrumentation, Controls & Automation 51,300 33,900 48,000 75,300 107,800 N/A
Logistics 53,900 31,000 42,500 72,500 82,400 99,000
Maintenance 47,100 N/A N/A 54,600 84,600 N/A
Marine/Naval 62,900 38,300 55,000 85,100 115,200 168,700
Mechanical 55,400 30,400 45,100 66,700 102,700 122,300
Piping 47,400 28,400 43,500 59,000 96,900 N/A
Process (chemical) 48,200 30,100 47,100 68,100 104,800 139,900
Production Management 51,300 31,800 59,300 67,500 107,700 260,700
Project Controls 41,200 42,400 49,000 78,600 112,000 134,100
QA/QC 51,000 37,000 48,700 68,300 94,400 128,900
Reservoir/ Petroleum Engineering 42,100 37,900 61,400 97,800 123,400 150,000
Structural 43,700 35,600 44,900 59,200 105,800 N/A
Subsea/ Pipelines 56,000 38,600 59,500 105,200 146,900 225,000
Supply Chain/ Procurement 40,500 29,500 48,600 58,200 98,500 180,000
Technical Safety 41,400 32,500 44,300 58,500 110,000 151,900
Undoubtedly we are delicately poised when it comes
to salaries within the industry for next year. Without a
European induced collapse in the global economy we willinevitably be faced with skill shortages in more than just a
few select locations. This will drive salaries up further, and
in this scenario we would expect a larger increase than
the rise we have seen in 2011. With this said, and when
considering the alternative, it would be a ‘nice problem to
have’.
How much difference a year makes in the oil and gas
industry is demonstrated by the rise in salaries within
drilling. Last year’s figures showed those in this sector of
the industry were sitting in the middle of the pack. This year
they are level pegging with subsea engineering as one of
the hotspots for salaries. With demand for onshore drilling
on non conventional sources at an all time high, and rig
utilisation offshore rising, labour demand in this sector is
obviously buoyant.
With drilling activity up, it is not unexpected that salaries for
others in the exploration and production field are also strong
this year. Geosciences and reservoir/petroleum engineersshowed good increases and production management and
logistics were also strong. Subsea engineering repeated its
increases of last year and project controls and construction
and installation proved that there was plenty of new projects
under construction.
Core engineering disciplines didn’t fare so well with
electrical, mechanical, structural and process engineers all
flat in comparison to last year. These core disciplines are
where most engineering professionals will start their careers,
and may suggest why headline salaries have not increased
beyond the levels seen.
8/10/2019 Salary guide (Oil Gas)
http://slidepdf.com/reader/full/salary-guide-oil-gas 10/32
OIL & GAS SALARY GUIDE 20128
SALARY INFORMATION
SALARIES
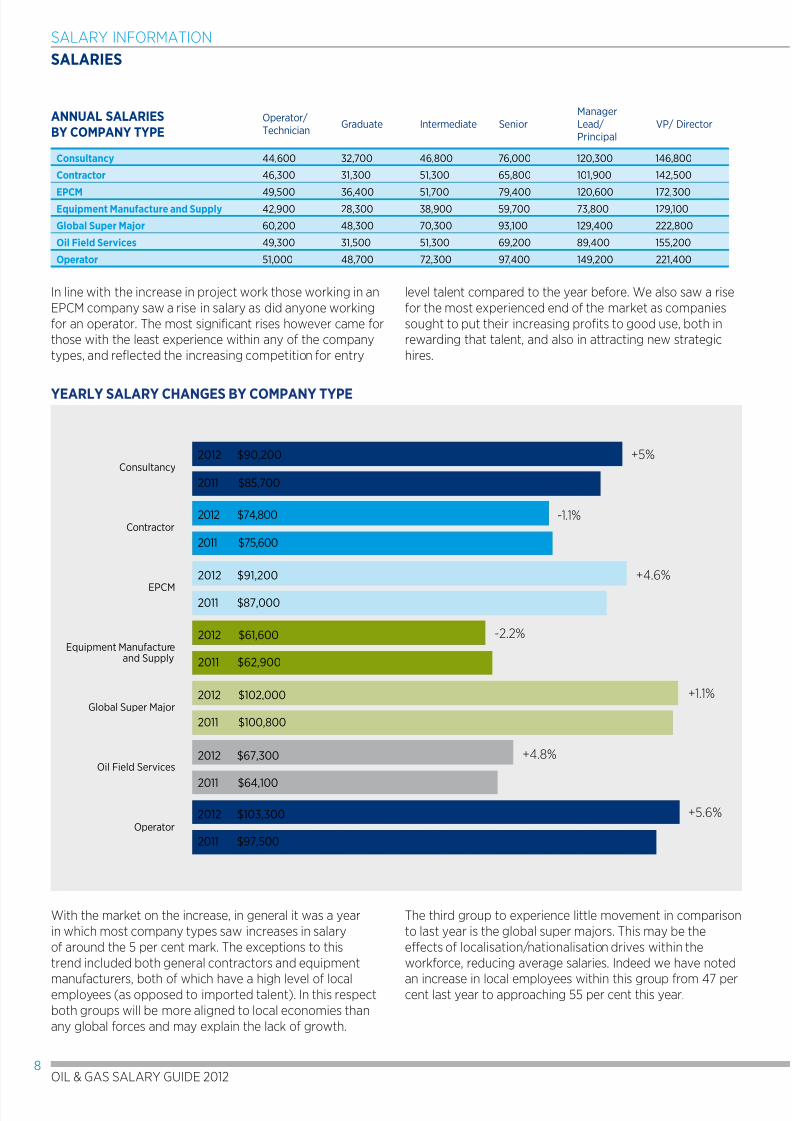
ANNUAL SALARIESBY COMPANY TYPE
Operator/
TechnicianGraduate Intermediate Senior
Manager
Lead/Principal
VP/ Director
Consultancy 44,600 32,700 46,800 76,000 120,300 146,800
Contractor 46,300 31,300 51,300 65,800 101,900 142,500
EPCM 49,500 36,400 51,700 79,400 120,600 172,300Equipment Manufacture and Supply 42,900 28,300 38,900 59,700 73,800 129,100
Global Super Major 60,200 48,300 70,300 93,100 129,400 222,800
Oil Field Services 49,300 31,500 51,300 69,200 89,400 155,200
Operator 51,000 48,700 72,300 97,400 149,200 221,400
In line with the increase in project work those working in an
EPCM company saw a rise in salary as did anyone working
for an operator. The most significant rises however came for
those with the least experience within any of the company
types, and reflected the increasing competition for entry
level talent compared to the year before. We also saw a rise
for the most experienced end of the market as companies
sought to put their increasing profits to good use, both in
rewarding that talent, and also in attracting new strategic
hires.
2012 $102,000
2011 $100,800
2012 $67,300
2011 $64,100
YEARLY SALARY CHANGES BY COMPANY TYPE
Consultancy
Contractor
EPCM
Equipment Manufacture
Global Super Major
Oil Field Services
Operator
and Supply
2012 $90,200
2011 $85,700
2012 $74,800
2011 $75,600
2012 $91,200
2011 $87,000
2012 $61,600
2011 $62,900
2012 $103,300
2011 $97,500
+5%
-1.1%
+4.6%
-2.2%
+1.1%
+4.8%
+5.6%
With the market on the increase, in general it was a year
in which most company types saw increases in salary
of around the 5 per cent mark. The exceptions to this
trend included both general contractors and equipment
manufacturers, both of which have a high level of localemployees (as opposed to imported talent). In this respect
both groups will be more aligned to local economies than
any global forces and may explain the lack of growth.
The third group to experience little movement in comparison
to last year is the global super majors. This may be the
effects of localisation/nationalisation drives within the
workforce, reducing average salaries. Indeed we have noted
an increase in local employees within this group from 47 percent last year to approaching 55 per cent this year.
8/10/2019 Salary guide (Oil Gas)
http://slidepdf.com/reader/full/salary-guide-oil-gas 11/32
9
S E C T I O N O N E -
S A L A R Y I N F O R M A T I O N
S E C T I O N T W O - I N D U S T R Y
B E N E F I T S
S E C T I O N T H R E E - I N D U S T R Y E M P L O Y M E N T
S E C T I O N F
O U R - E C O N O M I C O U T L O O K
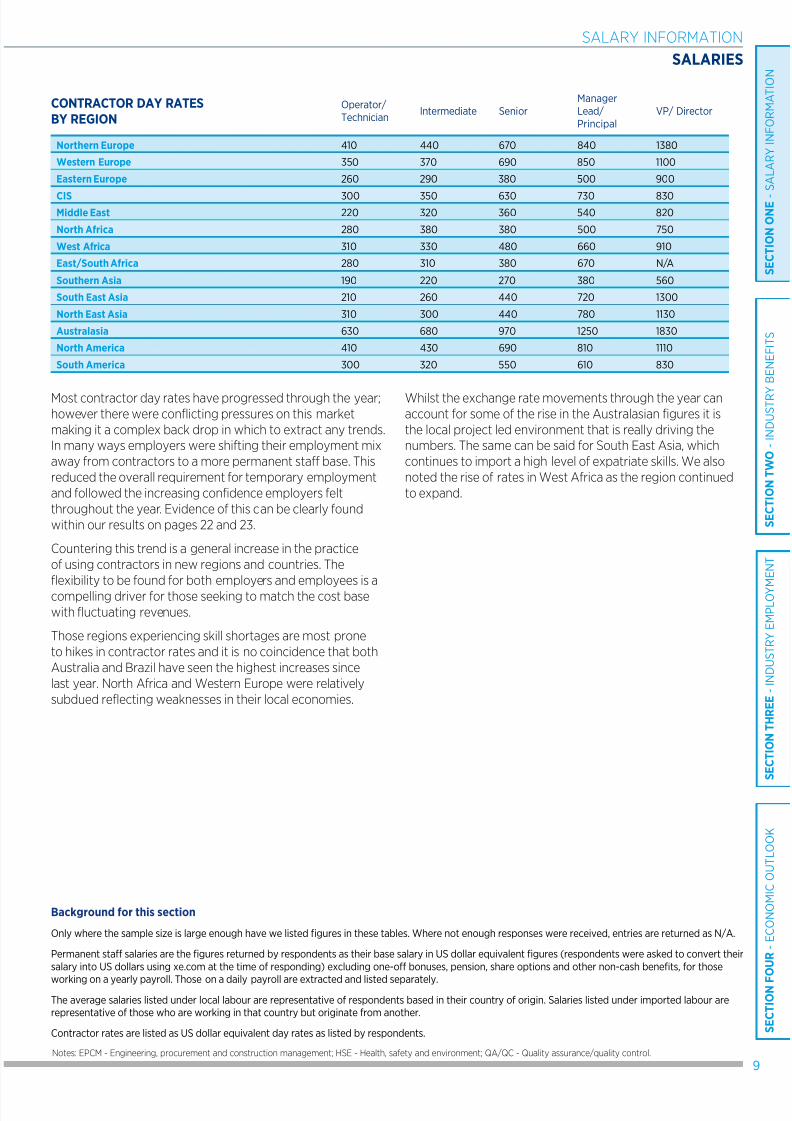
Most contractor day rates have progressed through the year;however there were conflicting pressures on this market
making it a complex back drop in which to extract any trends.
In many ways employers were shifting their employment mix
away from contractors to a more permanent staff base. This
reduced the overall requirement for temporary employment
and followed the increasing confidence employers felt
throughout the year. Evidence of this can be clearly found
within our results on pages 22 and 23.
Countering this trend is a general increase in the practice
of using contractors in new regions and countries. The
flexibility to be found for both employers and employees is a
compelling driver for those seeking to match the cost base
with fluctuating revenues.
Those regions experiencing skill shortages are most prone
to hikes in contractor rates and it is no coincidence that both
Australia and Brazil have seen the highest increases since
last year. North Africa and Western Europe were relatively
subdued reflecting weaknesses in their local economies.
Whilst the exchange rate movements through the year canaccount for some of the rise in the Australasian figures it is
the local project led environment that is really driving the
numbers. The same can be said for South East Asia, which
continues to import a high level of expatriate skills. We also
noted the rise of rates in West Africa as the region continued
to expand.
CONTRACTOR DAY RATESBY REGION
Operator/
TechnicianIntermediate Senior
Manager
Lead/
Principal
VP/ Director
Northern Europe 410 440 670 840 1380
Western Europe 350 370 690 850 1100
Eastern Europe 260 290 380 500 900
CIS 300 350 630 730 830Middle East 220 320 360 540 820
North Africa 280 380 380 500 750
West Africa 310 330 480 660 910
East/South Africa 280 310 380 670 N/A
Southern Asia 190 220 270 380 560
South East Asia 210 260 440 720 1300
North East Asia 310 300 440 780 1130
Australasia 630 680 970 1250 1830
North America 410 430 690 810 1110
South America 300 320 550 610 830
Background for this section
Only where the sample size is large enough have we listed figures in these tables. Where not enough responses were received, entries are returned as N/A.
Permanent staff salaries are the figures returned by respondents as their base salary in US dollar equivalent figures (respondents were asked to convert their
salary into US dollars using xe.com at the time of responding) excluding one-off bonuses, pension, share options and other non-cash benefits, for those
working on a yearly payroll. Those on a daily payroll are extracted and listed separately.
The average salaries listed under local labour are representative of respondents based in their country of origin. Salaries listed under imported labour arerepresentative of those who are working in that country but originate from another.
Contractor rates are listed as US dollar equivalent day rates as listed by respondents.
Notes: EPCM - Engineering, procurement and construction management; HSE - Health, safety and environment; QA/QC - Quality assurance/quality control.
SALARY INFORMATION
SALARIES
8/10/2019 Salary guide (Oil Gas)
http://slidepdf.com/reader/full/salary-guide-oil-gas 12/32
OIL & GAS SALARY GUIDE 201210
SECTION TWOINDUSTRY BENEFITSBenefits rise in the form of incentives.
8/10/2019 Salary guide (Oil Gas)
http://slidepdf.com/reader/full/salary-guide-oil-gas 13/32
11
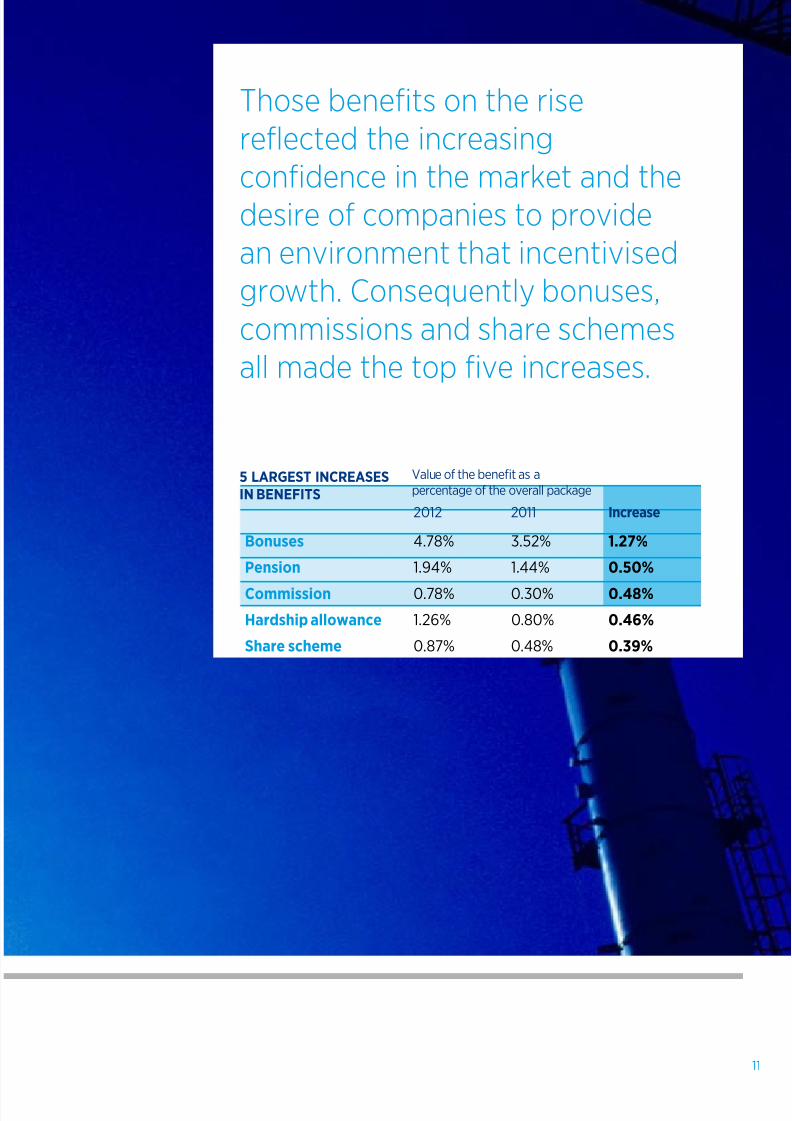
Those benefits on the rise
reflected the increasing
confidence in the market and the
desire of companies to provide
an environment that incentivised
growth. Consequently bonuses,
commissions and share schemes
all made the top five increases.
5 LARGEST INCREASES
IN BENEFITS
2012 2011 Increase
Bonuses 4.78% 3.52% 1.27%
Pension 1.94% 1.44% 0.50%
Commission 0.78% 0.30% 0.48%
Hardship allowance 1.26% 0.80% 0.46%
Share scheme 0.87% 0.48% 0.39%
Value of the benefit as a
percentage of the overall package
8/10/2019 Salary guide (Oil Gas)
http://slidepdf.com/reader/full/salary-guide-oil-gas 14/32
OIL & GAS SALARY GUIDE 201212
OVERVIEW OF INDUSTRY BENEFITS
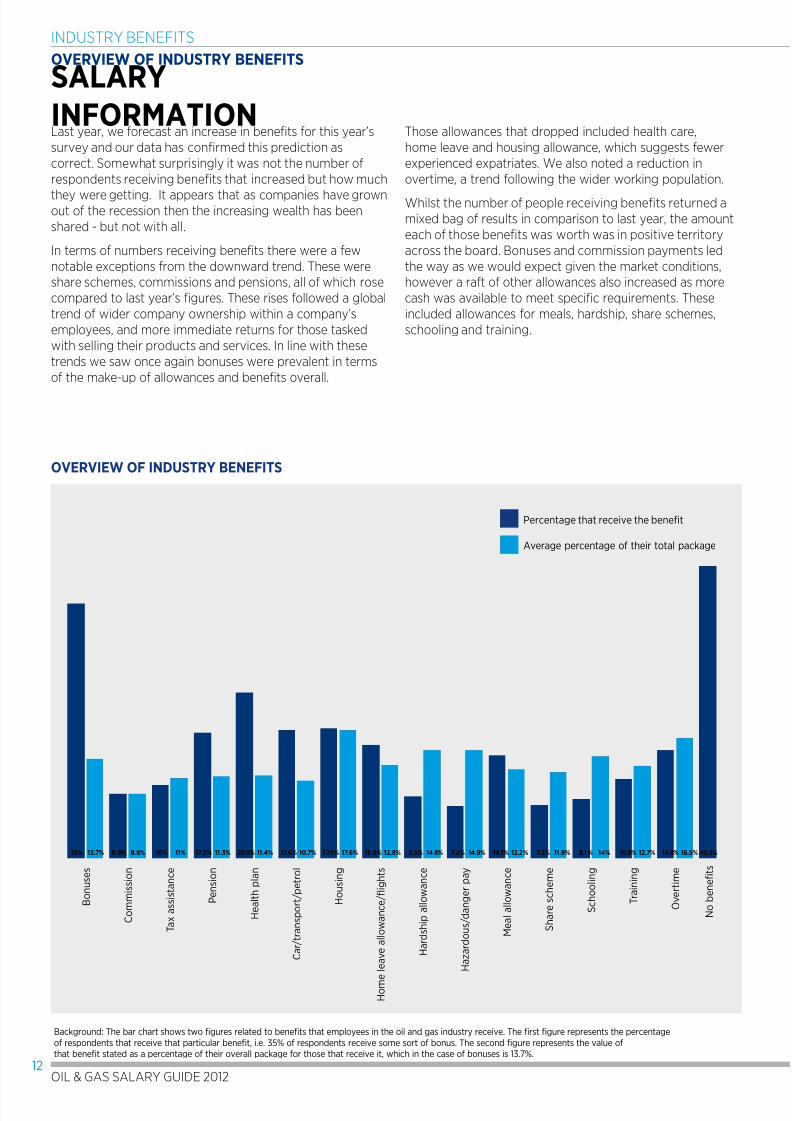
Last year, we forecast an increase in benefits for this year’s
survey and our data has confirmed this prediction as
correct. Somewhat surprisingly it was not the number of
respondents receiving benefits that increased but how much
they were getting. It appears that as companies have grownout of the recession then the increasing wealth has been
shared - but not with all.
In terms of numbers receiving benefits there were a few
notable exceptions from the downward trend. These were
share schemes, commissions and pensions, all of which rose
compared to last year’s figures. These rises followed a global
trend of wider company ownership within a company’s
employees, and more immediate returns for those tasked
with selling their products and services. In line with these
trends we saw once again bonuses were prevalent in terms
of the make-up of allowances and benefits overall.
Those allowances that dropped included health care,
home leave and housing allowance, which suggests fewer
experienced expatriates. We also noted a reduction in
overtime, a trend following the wider working population.
Whilst the number of people receiving benefits returned a
mixed bag of results in comparison to last year, the amount
each of those benefits was worth was in positive territory
across the board. Bonuses and commission payments led
the way as we would expect given the market conditions,
however a raft of other allowances also increased as more
cash was available to meet specific requirements. These
included allowances for meals, hardship, share schemes,
schooling and training.
SALARY
INFORMATION
Background: The bar chart shows two figures related to benefits that employees in the oil and gas industry receive. The first figure represents the percentage
of respondents that receive that particular benefit, i.e. 35% of respondents receive some sort of bonus. The second figure represents the value ofthat benefit stated as a percentage of their overall package for those that receive it, which in the case of bonuses is 13.7%.
INDUSTRY BENEFITS
OVERVIEW OF INDUSTRY BENEFITS
35% 13.7% 8.9% 8.8% 10% 11% 17.2% 11 .3% 28.8% 11.4% 17.6% 10.7% 1 7.8% 17.6% 15.6% 12.8% 8.5% 14.8% 7.2% 14.9% 14.1% 12.2% 7.3% 11 .9% 8.1 % 14% 10.9% 12.7% 14.8% 16.5% 40.2%
B o n u s e s
C o m m i s s i o n
T a x a s s i s t a n c e
P e n s i o n
H e a l t h p l a n
C a r / t r a n s p o r t / p e t r o l
H o u s i n g
H o m e l e a v e a l l o w a n c e / fl i g h t s
H a r d s h i p a l l o w a n c e
H a z a r d o u s / d a n g e r p a y
M e a l a l l o w a n c e
S h a r e s c h e m e
S c h o o l i n g
T r a i n i n g
O v e r t i m e
N o b e n e fi t s
Percentage that receive the benefit
Average percentage of their total package
8/10/2019 Salary guide (Oil Gas)
http://slidepdf.com/reader/full/salary-guide-oil-gas 15/32
13
S E C T I O N O N E -
S A L A R Y I N F O R M A T I O N
S E C T I O N T W O - I N D U S T R Y
B E N E F I T S
S E C T I O N T H R E E - I N D U S T R Y E M P L O Y M E N T
S E C T I O N F
O U R - E C O N O M I C O U T L O O K
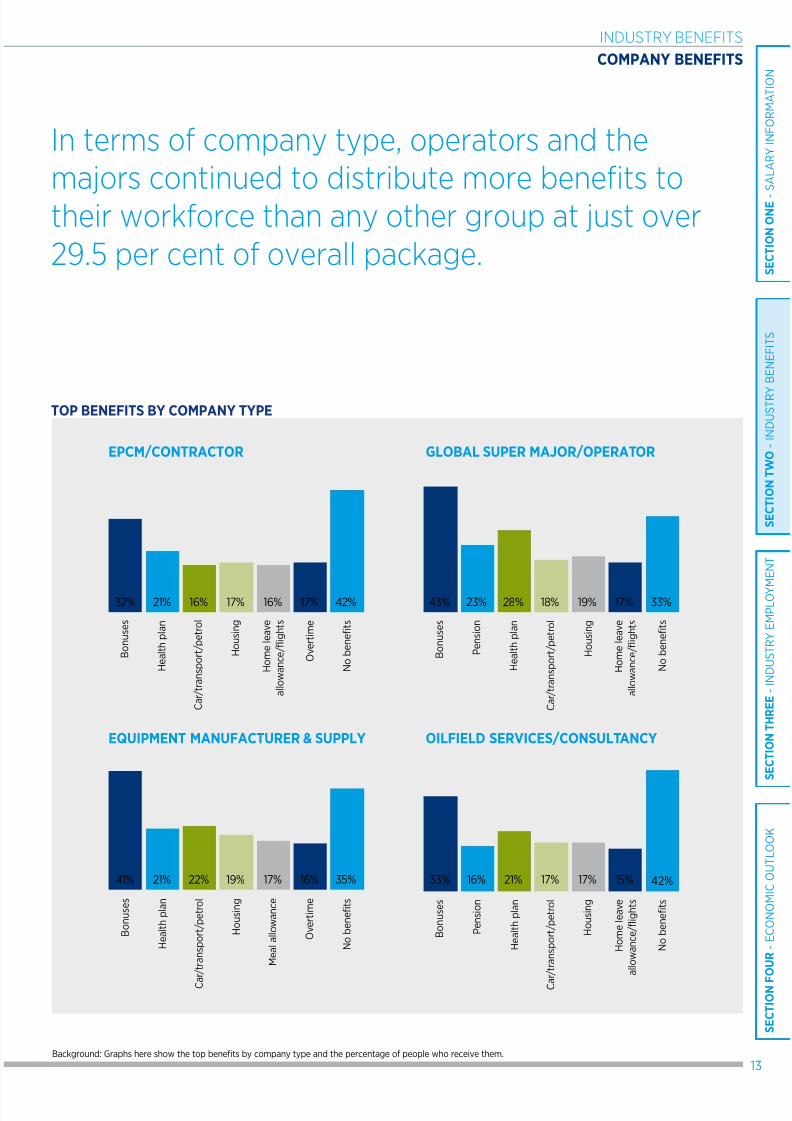
Background: Graphs here show the top benefits by company type and the percentage of people who receive them.
INDUSTRY BENEFITS
COMPANY BENEFITS
41% 21% 22% 19% 17% 16% 35%
32% 21% 16% 17% 16% 17% 42%
33% 16% 21% 17% 17% 15% 42%
43% 23% 28% 18% 19% 17% 33%
TOP BENEFITS BY COMPANY TYPE
EPCM/CONTRACTOR GLOBAL SUPER MAJOR/OPERATOR
EQUIPMENT MANUFACTURER & SUPPLY OILFIELD SERVICES/CONSULTANCY
In terms of company type, operators and the
majors continued to distribute more benefits to
their workforce than any other group at just over
29.5 per cent of overall package.
B o n u s e s
B o n u s e s
B o n u s e s
B o n u s e s
P e n s i o n
P e n s i o n
H e a l t h p l a n
H e a l t h p l a n
H e a l t h p l a n
H e a l t h p l a n
C a r / t r a n s p o r t / p e t r o l
C a r / t r a n s p o r t / p e t r o l
C a
r / t r a n s p o r t / p e t r o l
C a
r / t r a n s p o r t / p e t r o l
H o u s i n g
H o u s i n g
H o u s i n g
H o u s i n g
H o m e l e a v e
a l l o w a n c e / fl i g h t s
H o m e l e a v e
a l l o w a n c e / fl i g h t s
H o m e l e a v e
a l l o w a n c e / fl i g h t s
M e a l a l l o w a n c e
O v e r t i m e
O v e r t i m e
N o b e n e fi t s
N o b e n e fi t s
N o b e n e fi t s
N o b e n e fi t s
8/10/2019 Salary guide (Oil Gas)
http://slidepdf.com/reader/full/salary-guide-oil-gas 16/32
OIL & GAS SALARY GUIDE 201214
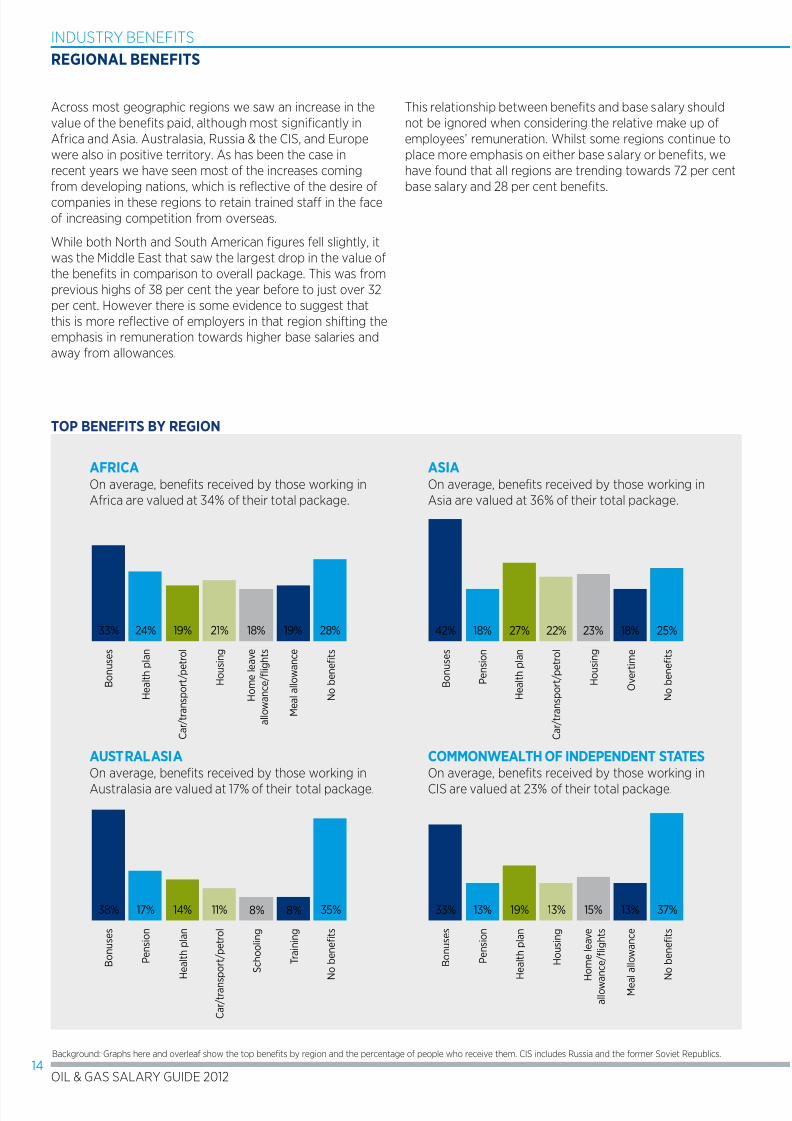
Background: Graphs here and overleaf show the top benefits by region and the percentage of people who receive them. CIS includes Russia and the former Soviet Republics.
INDUSTRY BENEFITS
REGIONAL BENEFITS
TOP BENEFITS BY REGION
AFRICA ASIA
AUSTRALASIA COMMONWEALTH OF INDEPENDENT STATES
On average, benefits received by those working in
Africa are valued at 34% of their total package.
On average, benefits received by those working in
Asia are valued at 36% of their total package.
On average, benefits received by those working in
Australasia are valued at 17% of their total package.
On average, benefits received by those working in
CIS are valued at 23% of their total package.
33% 24% 19% 21% 18% 19% 28%
38% 17% 14% 11% 8% 8% 35% 33% 13% 19% 13% 15% 13% 37%
42% 18% 27% 22% 23% 18% 25%
Across most geographic regions we saw an increase in the
value of the benefits paid, although most significantly in
Africa and Asia. Australasia, Russia & the CIS, and Europe
were also in positive territory. As has been the case in
recent years we have seen most of the increases coming
from developing nations, which is reflective of the desire of
companies in these regions to retain trained staff in the face
of increasing competition from overseas.
While both North and South American figures fell slightly, it
was the Middle East that saw the largest drop in the value of
the benefits in comparison to overall package. This was from
previous highs of 38 per cent the year before to just over 32
per cent. However there is some evidence to suggest that
this is more reflective of employers in that region shifting the
emphasis in remuneration towards higher base salaries and
away from allowances.
This relationship between benefits and base salary should
not be ignored when considering the relative make up of
employees’ remuneration. Whilst some regions continue to
place more emphasis on either base salary or benefits, we
have found that all regions are trending towards 72 per cent
base salary and 28 per cent benefits.
B o n u s e s
B o n u s e s
B o n u s e s
B o n u s e s
P e n s i o n
P e n s i o n
P e n s i o n
H e a l t h p l a n
H e a l t h p l a n
H e a l t h p l a n
H e a l t h p l a n
C a r / t r a n s
p o r t / p e t r o l
C a r / t r a n s p o r t / p e t r o l
C a r / t r a n s p o r t / p e t r o l
H o u s i n g
H o u s i n g
H o u s i n g
H o m e l e a v e
a l l o w a n c e / fl i g h t s
T r a i n i n g
N o b e n e fi t s
N o b e n e fi t s
N o b e n e fi t s
N o b e n e fi t s
M e a l a l l o w a n c e
H o m e l e a v e
a l l o w a n c e / fl i g h t s
O v e r t i m e
S c h o o l i n g
M e a
l a l l o w a n c e
8/10/2019 Salary guide (Oil Gas)
http://slidepdf.com/reader/full/salary-guide-oil-gas 17/32
15
S E C T I O N O N E -
S A L A R Y I N F O R M A T I O N
S E C T I O N T W O - I N D U S T R Y
B E N E F I T S
S E C T I O N T H R E E - I N D U S T R Y E M P L O Y M E N T
S E C T I O N F
O U R - E C O N O M I C O U T L O O K
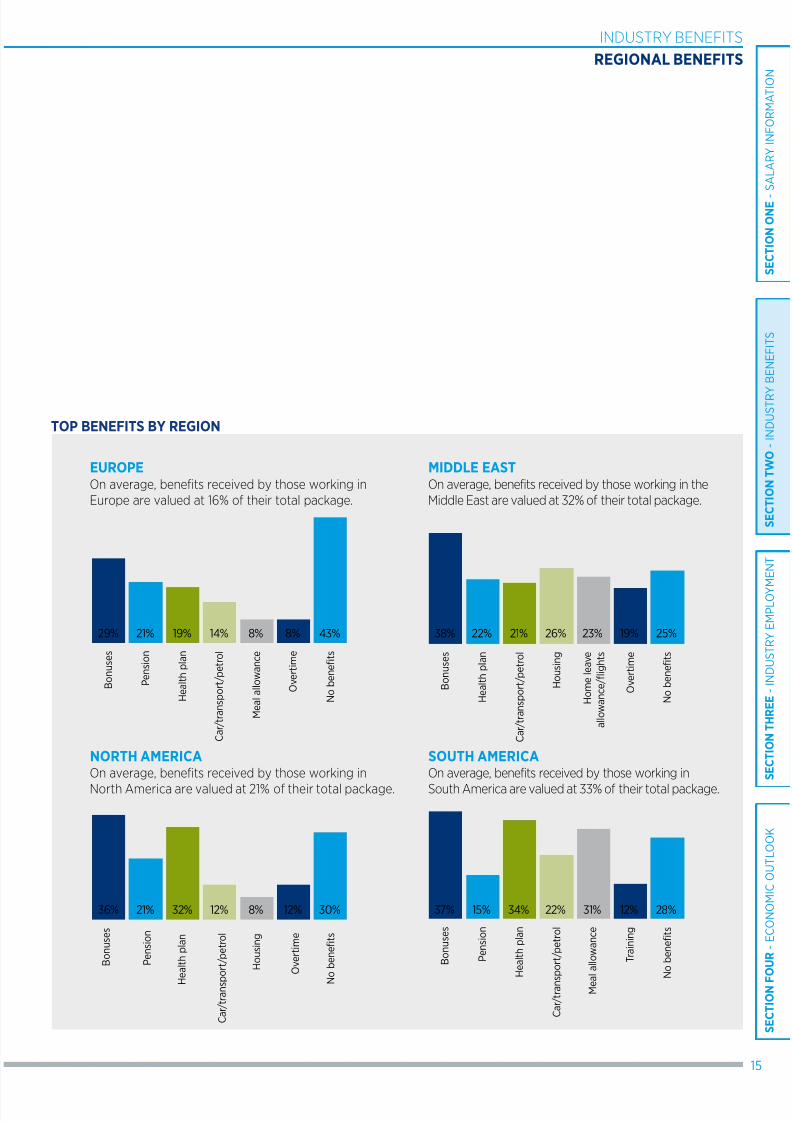
INDUSTRY BENEFITS
REGIONAL BENEFITS
TOP BENEFITS BY REGION
EUROPE MIDDLE EAST
NORTH AMERICA SOUTH AMERICA
On average, benefits received by those working in
Europe are valued at 16% of their total package.
On average, benefits received by those working in the
Middle East are valued at 32% of their total package.
On average, benefits received by those working in
North America are valued at 21% of their total package.
On average, benefits received by those working in
South America are valued at 33% of their total package.
29% 21% 19% 14% 8% 8% 43%
36% 21% 32% 12% 8% 12% 30% 37% 15% 34% 22% 31% 12% 28%
38% 22% 21% 26% 23% 19% 25%
B o n u s e s
B o n u s e s
B o n u s e s
B o n u s e s
P e n s i o n
P e n s i o n
P e n s i o n
H e a l t h p l a n
H
e a l t h p l a n
H e a l t h p l a n
H e a l t h p l a n
C a r / t r a n s p o r t / p e t r o l
C a r / t r a n s p o r t / p e t r o l
C a r / t r a n s p
o r t / p e t r o l
C a r / t r a n s p o r t / p e t r o l
H o u s i n g
H o m e l e a v e
a l l o w a n c e / fl i g h t s
M e a l a l l o w a n c e
O v e r t i m e
O v e r t i m e
N o b e n e fi t s
N o b e n e fi t s
N
o b e n e fi t s
N o b e n e fi t s
M e a l a l l o w a n c e
O v e r t i m e
H o u s i n g
T r a i n i n g

8/10/2019 Salary guide (Oil Gas)
http://slidepdf.com/reader/full/salary-guide-oil-gas 18/32
OIL & GAS SALARY GUIDE 201216
SECTION THREEINDUSTRY
EMPLOYMENTOver a fifth of all employers expect salaries to
increase by more than 10 per cent in the next year.
8/10/2019 Salary guide (Oil Gas)
http://slidepdf.com/reader/full/salary-guide-oil-gas 19/32
17
S E C T I O N O N E -
S A L A R Y I N F O R M A T I O N
S E C T I O N T W O - I N D U S T R Y
B E N E F I T S
S E C T I O N T H R E E - I N D U S T R Y E M P L O Y M E N T
S E C T I O N F
O U R - E C O N O M I C O U T L O O K
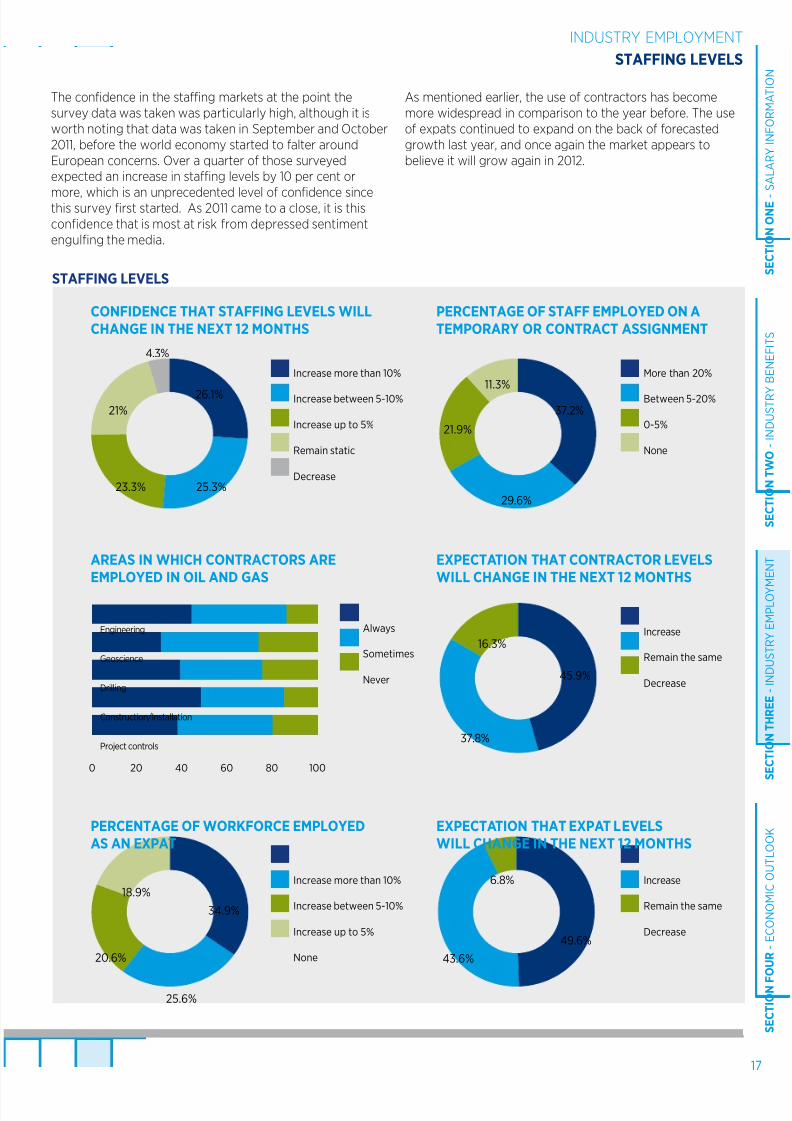
The confidence in the staffing markets at the point the
survey data was taken was particularly high, although it is
worth noting that data was taken in September and October
2011, before the world economy started to falter around
European concerns. Over a quarter of those surveyed
expected an increase in staffing levels by 10 per cent or
more, which is an unprecedented level of confidence sincethis survey first started. As 2011 came to a close, it is this
confidence that is most at risk from depressed sentiment
engulfing the media.
As mentioned earlier, the use of contractors has become
more widespread in comparison to the year before. The use
of expats continued to expand on the back of forecasted
growth last year, and once again the market appears to
believe it will grow again in 2012.
STAFFING LEVELS
CONFIDENCE THAT STAFFING LEVELS WILL
CHANGE IN THE NEXT 12 MONTHS
PERCENTAGE OF STAFF EMPLOYED ON A
TEMPORARY OR CONTRACT ASSIGNMENT
AREAS IN WHICH CONTRACTORS ARE
EMPLOYED IN OIL AND GAS
EXPECTATION THAT CONTRACTOR LEVELS
WILL CHANGE IN THE NEXT 12 MONTHS
PERCENTAGE OF WORKFORCE EMPLOYED
AS AN EXPAT
EXPECTATION THAT EXPAT LEVELS
WILL CHANGE IN THE NEXT 12 MONTHS
Increase more than 10%
Increase between 5-10%
Increase up to 5%
Remain static
Decrease
More than 20%
Between 5-20%
0-5%
None
Increase
Remain the same
Decrease
Engineering
Geoscience
Drilling
Construction/Installation
Project controls
Always
Sometimes
Never
Increase
Remain the same
Decrease
Increase more than 10%
Increase between 5-10%
Increase up to 5%
None
26.1%
25.3%23.3%
21%
4.3%
37.2%
29.6%
21.9%
11.3%
45.9%
37.8%
16.3%
34.9%
25.6%
20.6%
18.9%
49.6%
43.6%
6.8%
INDUSTRY EMPLOYMENT
STAFFING LEVELS
0 20 40 60 80 100
8/10/2019 Salary guide (Oil Gas)
http://slidepdf.com/reader/full/salary-guide-oil-gas 20/32
OIL & GAS SALARY GUIDE 201218
INDUSTRY EMPLOYMENT
DIVERSITY & MOVEMENT OF WORKFORCE
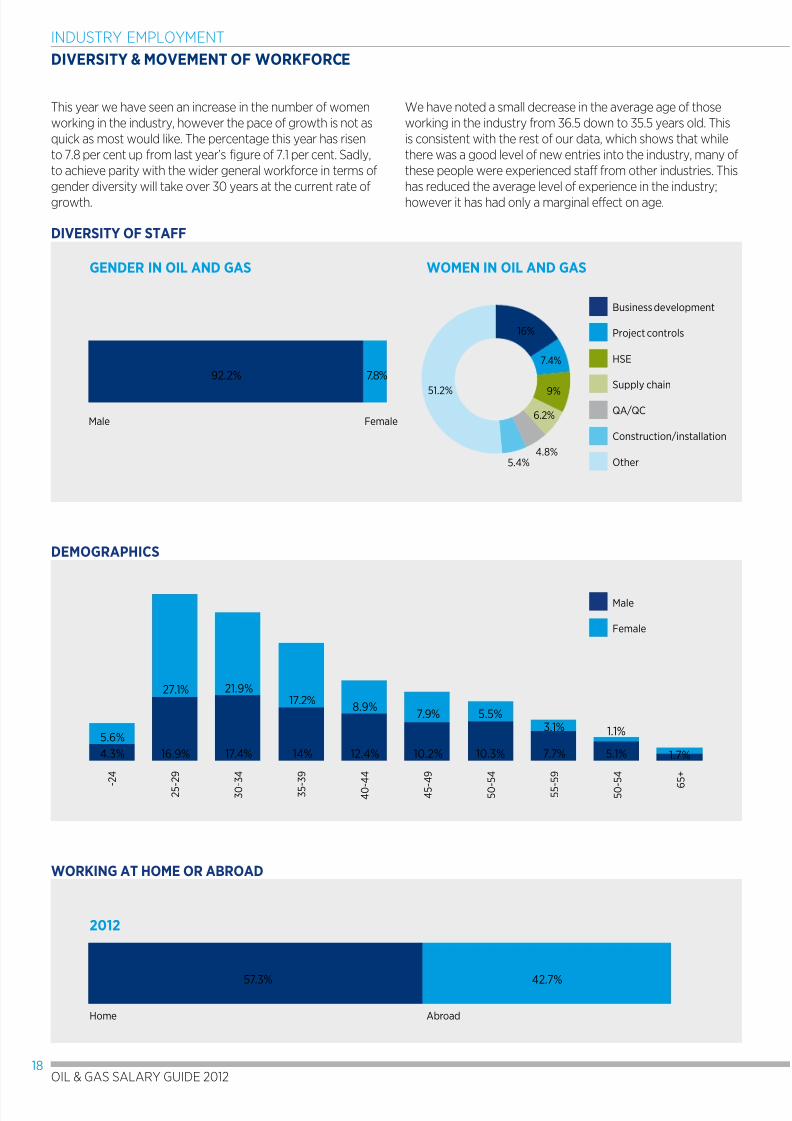
This year we have seen an increase in the number of women
working in the industry, however the pace of growth is not as
quick as most would like. The percentage this year has risen
to 7.8 per cent up from last year’s figure of 7.1 per cent. Sadly,
to achieve parity with the wider general workforce in terms of
gender diversity will take over 30 years at the current rate of
growth.
We have noted a small decrease in the average age of those
working in the industry from 36.5 down to 35.5 years old. This
is consistent with the rest of our data, which shows that while
there was a good level of new entries into the industry, many of
these people were experienced staff from other industries. This
has reduced the average level of experience in the industry;
however it has had only a marginal effect on age.
DIVERSITY OF STAFF
GENDER IN OIL AND GAS WOMEN IN OIL AND GAS
Business development
Project controls
HSE
Supply chain
QA/QC
Construction/installation
Other
92.2% 7.8%
DEMOGRAPHICS
Male
Female
-
2 4
2 5 -
2 9
3 0 -
3 4
3 5 -
3 9
4 0 - 4 4
4 5 -
4 9
5 0 -
5 4
5 5 -
5 9
5 0 -
5 4
6
5 +
4.3%
5.6%
16.9%
27.1%
17.4%
21.9%
14%
17.2%
12.4%
8.9%
10.2%
7.9%
10.3%
5.5%
7.7%
3.1%
5.1%
1.1%
1.7%
Male Female
WORKING AT HOME OR ABROAD
57.3% 42.7%
2012
Home Abroad
16%
7.4%
9%
6.2%
4.8%5.4%
51.2%
8/10/2019 Salary guide (Oil Gas)
http://slidepdf.com/reader/full/salary-guide-oil-gas 21/32
19
S E C T I O N O N E -
S A L A R Y I N F O R M A T I O N
S E C T I O N T W O - I N D U S T R Y
B E N E F I T S
S E C T I O N T H R E E - I N D U S T R Y E M P L O Y M E N T
S E C T I O N F
O U R - E C O N O M I C O U T L O O K
INDUSTRY EMPLOYMENT
DIVERSITY & MOVEMENT OF WORKFORCE
MOVEMENT OF THE WORKFORCE
53.8% 46.2% 23.2% 76.8% 28.8% 71.2% 33.5% 66.5% 51.6% 48.4% 88.4% 11.6% 29.2% 70.8% 27.2% 72.8%
28.3% 71.7% 42.4% 57.6% 16.9% 83.1% 42.1% 57.9% 28.2% 71.8% 20.7% 79.3% 29.3% 70.7% 27.3% 72.7%
A u s t r a l a s i a
A s i a
A f r i c a
E u r o p e
C I S
M i d d l e E a s t
N o r t h A m e r i c a
S o u t h A m e r i c a
A u s t r a l a
s i a
A
s i a
A f r
i c a
E u r o
p e
C I S
M i d d l e E
a s t
N o r t h A m e r
i c a
S o u t h A m e r
i c a
IMPORTED WORKFORCE VERSUS LOCAL WORKFORCE
WORKING OVERSEAS VERSUS WORKING IN HOME COUNTRY
Imported labour
Local labour
Working overseas
Working in homecountry
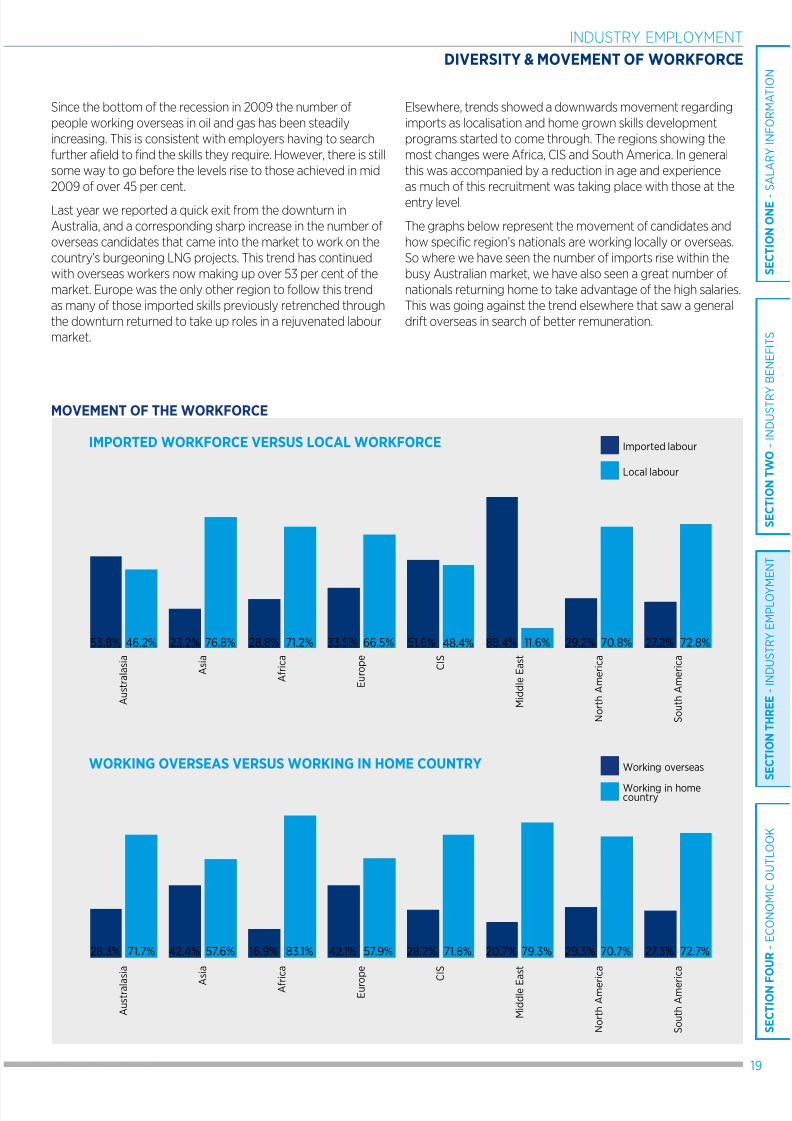
Since the bottom of the recession in 2009 the number of
people working overseas in oil and gas has been steadily
increasing. This is consistent with employers having to search
further afield to find the skills they require. However, there is still
some way to go before the levels rise to those achieved in mid
2009 of over 45 per cent.
Last year we reported a quick exit from the downturn in
Australia, and a corresponding sharp increase in the number of
overseas candidates that came into the market to work on the
country’s burgeoning LNG projects. This trend has continued
with overseas workers now making up over 53 per cent of the
market. Europe was the only other region to follow this trend
as many of those imported skills previously retrenched through
the downturn returned to take up roles in a rejuvenated labour
market.
Elsewhere, trends showed a downwards movement regarding
imports as localisation and home grown skills development
programs started to come through. The regions showing the
most changes were Africa, CIS and South America. In general
this was accompanied by a reduction in age and experience
as much of this recruitment was taking place with those at the
entry level.
The graphs below represent the movement of candidates and
how specific region’s nationals are working locally or overseas.
So where we have seen the number of imports rise within the
busy Australian market, we have also seen a great number of
nationals returning home to take advantage of the high salaries.
This was going against the trend elsewhere that saw a general
drift overseas in search of better remuneration.
8/10/2019 Salary guide (Oil Gas)
http://slidepdf.com/reader/full/salary-guide-oil-gas 22/32
OIL & GAS SALARY GUIDE 201220
YEARS OF EXPERIENCE
INDUSTRY EMPLOYMENT
EXPERIENCE AND TENURE
FOR SPECIFIC DISCIPLINE AREAS
0-4 years
5-9 years
10-19 years
20+ years
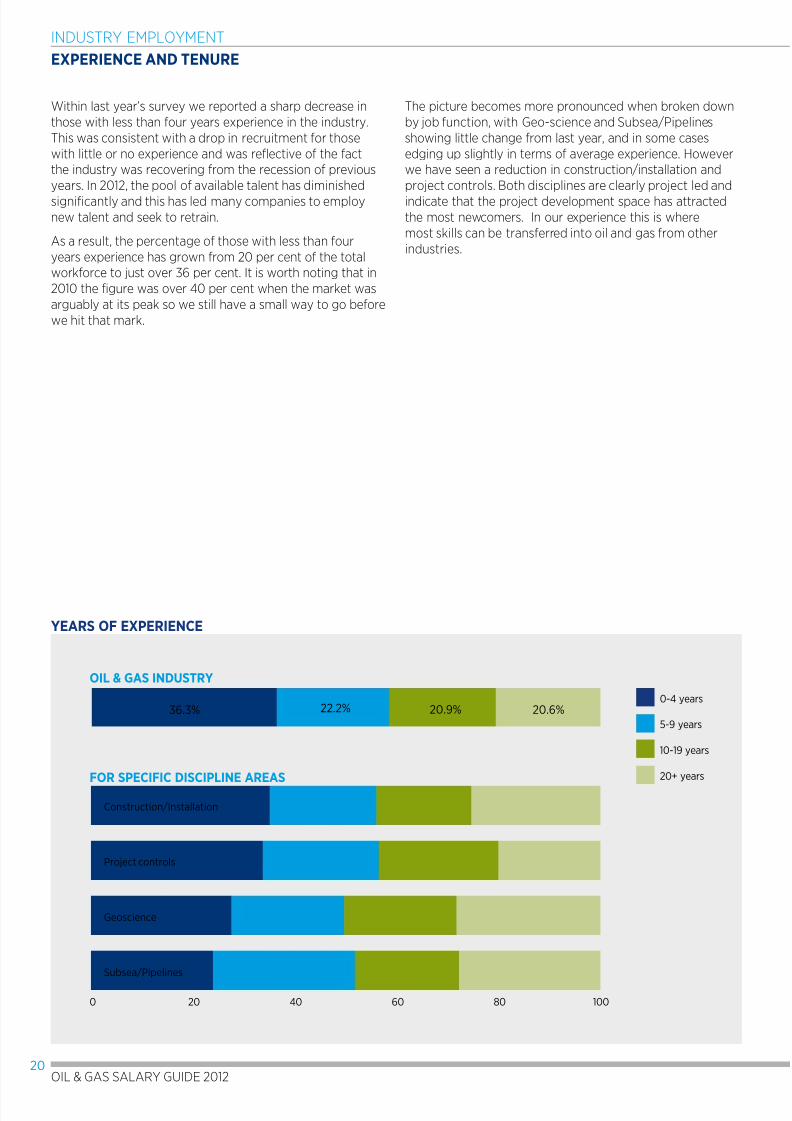
36.3% 22.2% 20.9% 20.6%
Within last year’s survey we reported a sharp decrease in
those with less than four years experience in the industry.
This was consistent with a drop in recruitment for those
with little or no experience and was reflective of the fact
the industry was recovering from the recession of previous
years. In 2012, the pool of available talent has diminished
significantly and this has led many companies to employnew talent and seek to retrain.
As a result, the percentage of those with less than four
years experience has grown from 20 per cent of the total
workforce to just over 36 per cent. It is worth noting that in
2010 the figure was over 40 per cent when the market was
arguably at its peak so we still have a small way to go before
we hit that mark.
The picture becomes more pronounced when broken down
by job function, with Geo-science and Subsea/Pipelines
showing little change from last year, and in some cases
edging up slightly in terms of average experience. However
we have seen a reduction in construction/installation and
project controls. Both disciplines are clearly project led and
indicate that the project development space has attractedthe most newcomers. In our experience this is where
most skills can be transferred into oil and gas from other
industries.
Construction/Installation
Project controls
Geoscience
Subsea/Pipelines
0 20 40 60 80 100
OIL & GAS INDUSTRY
8/10/2019 Salary guide (Oil Gas)
http://slidepdf.com/reader/full/salary-guide-oil-gas 23/32
21
S E C T I O N O N E -
S A L A R Y I N F O R M A T I O N
S E C T I O N T W O - I N D U S T R Y
B E N E F I T S
S E C T I O N T H R E E - I N D U S T R Y E M P L O Y M E N T
S E C T I O N F
O U R - E C O N O M I C O U T L O O K
TIME IN CURRENT ROLE
INDUSTRY EMPLOYMENT
EXPERIENCE AND TENURE
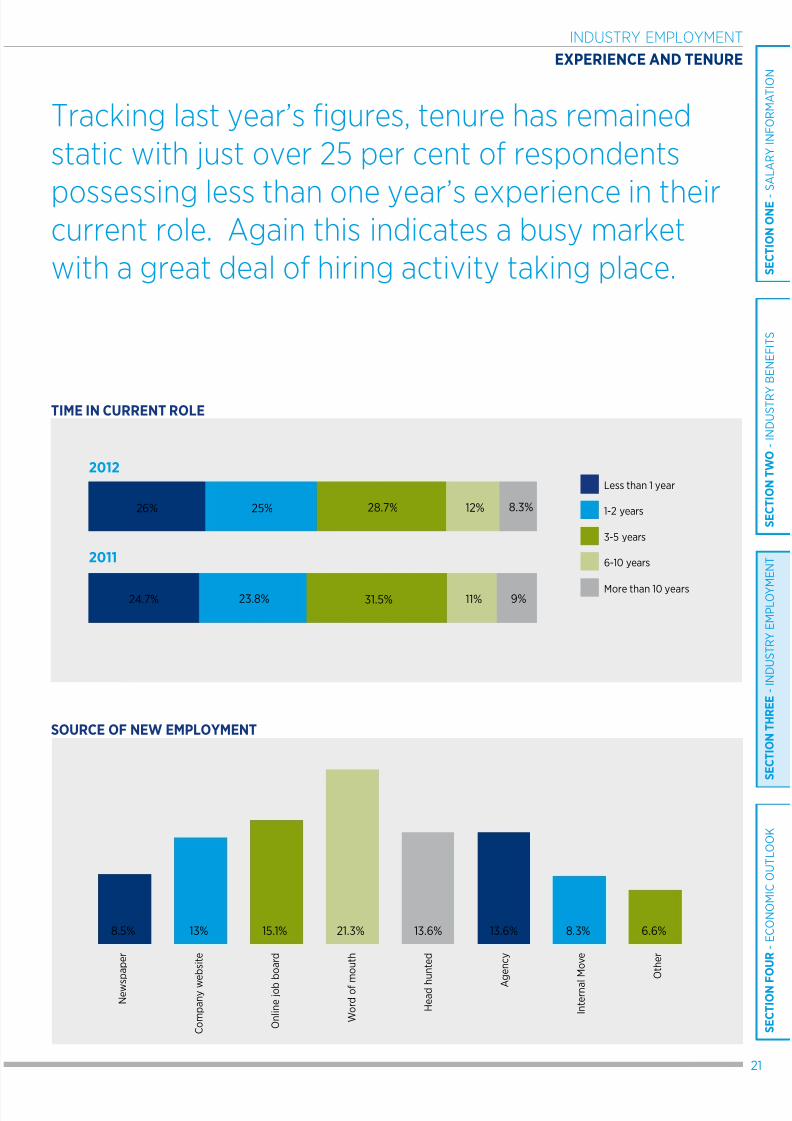
Tracking last year’s figures, tenure has remained
static with just over 25 per cent of respondents
possessing less than one year’s experience in theircurrent role. Again this indicates a busy market
with a great deal of hiring activity taking place.
SOURCE OF NEW EMPLOYMENT
Less than 1 year
1-2 years
3-5 years
6-10 years
More than 10 years
2012
2011
26% 25% 28.7% 12% 8.3%
24.7% 23.8% 31.5% 11% 9%
N e w s
p a p e r
C o m p a n y w e b s i t e
O n l i n e j o b b o a r d
W o r d o f m
o u t h
H e a d h
u n t e d
A g e n c y
I n t e r n a l
M o v e
O t h e r
8.5% 13% 15.1% 21.3% 13.6% 13.6% 8.3% 6.6%
8/10/2019 Salary guide (Oil Gas)
http://slidepdf.com/reader/full/salary-guide-oil-gas 24/32
OIL & GAS SALARY GUIDE 201222
INDUSTRY EMPLOYMENT
EMPLOYMENT MIX
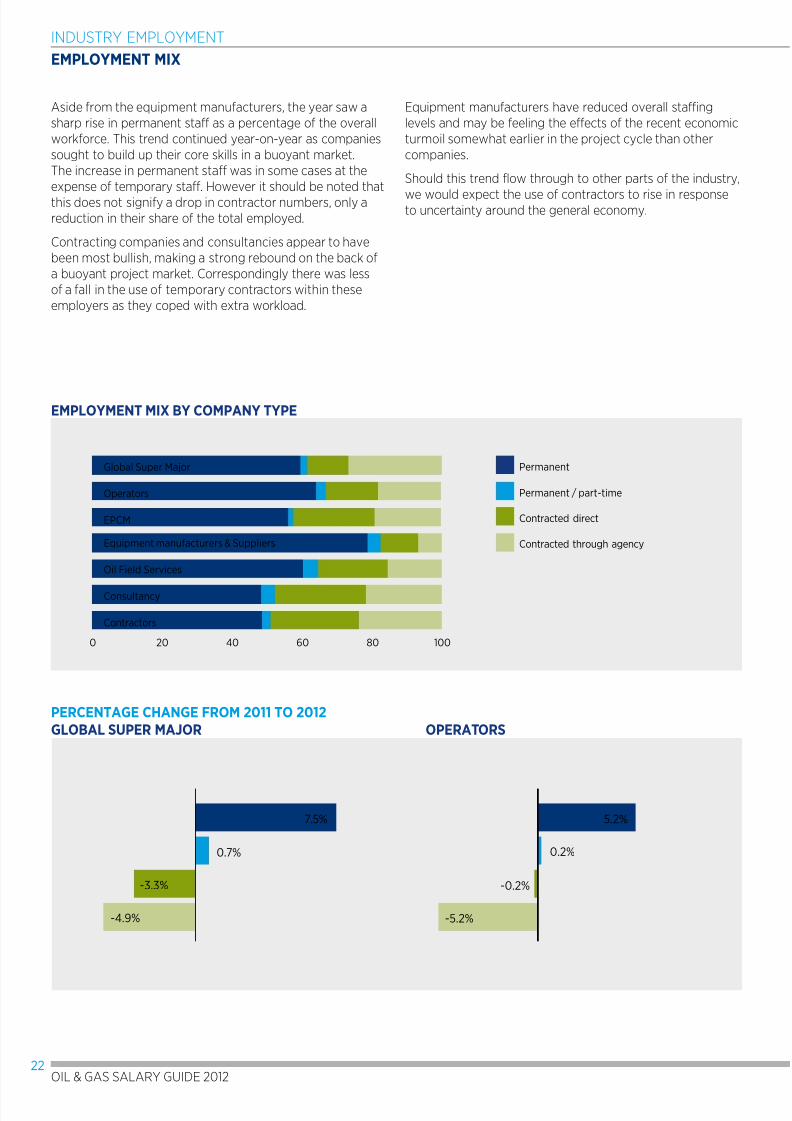
Aside from the equipment manufacturers, the year saw a
sharp rise in permanent staff as a percentage of the overall
workforce. This trend continued year-on-year as companies
sought to build up their core skills in a buoyant market.
The increase in permanent staff was in some cases at the
expense of temporary staff. However it should be noted that
this does not signify a drop in contractor numbers, only a
reduction in their share of the total employed.
Contracting companies and consultancies appear to have
been most bullish, making a strong rebound on the back of
a buoyant project market. Correspondingly there was less
of a fall in the use of temporary contractors within these
employers as they coped with extra workload.
Equipment manufacturers have reduced overall staffing
levels and may be feeling the effects of the recent economic
turmoil somewhat earlier in the project cycle than other
companies.
Should this trend flow through to other parts of the industry,
we would expect the use of contractors to rise in responseto uncertainty around the general economy.
EMPLOYMENT MIX BY COMPANY TYPE
GLOBAL SUPER MAJOR OPERATORS
0 20 40 60 80 100
Permanent
Permanent / part-time
Contracted direct
Contracted through agency
PERCENTAGE CHANGE FROM 2011 TO 2012
Global Super Major
Operators
EPCM
Equipment manufacturers & Suppliers
Oil Field Services
Consultancy
Contractors
7.5%
0.7%
-3.3%
-4.9%
5.2%
0.2%
-0.2%
-5.2%
8/10/2019 Salary guide (Oil Gas)
http://slidepdf.com/reader/full/salary-guide-oil-gas 25/32
23
S E C T I O N O N E -
S A L A R Y I N F O R M A T I O N
S E C T I O N T W O - I N D U S T R Y
B E N E F I T S
S E C T I O N T H R E E - I N D U S T R Y E M P L O Y M E N T
S E C T I O N F
O U R - E C O N O M I C O U T L O O K
INDUSTRY EMPLOYMENT
EMPLOYMENT MIX
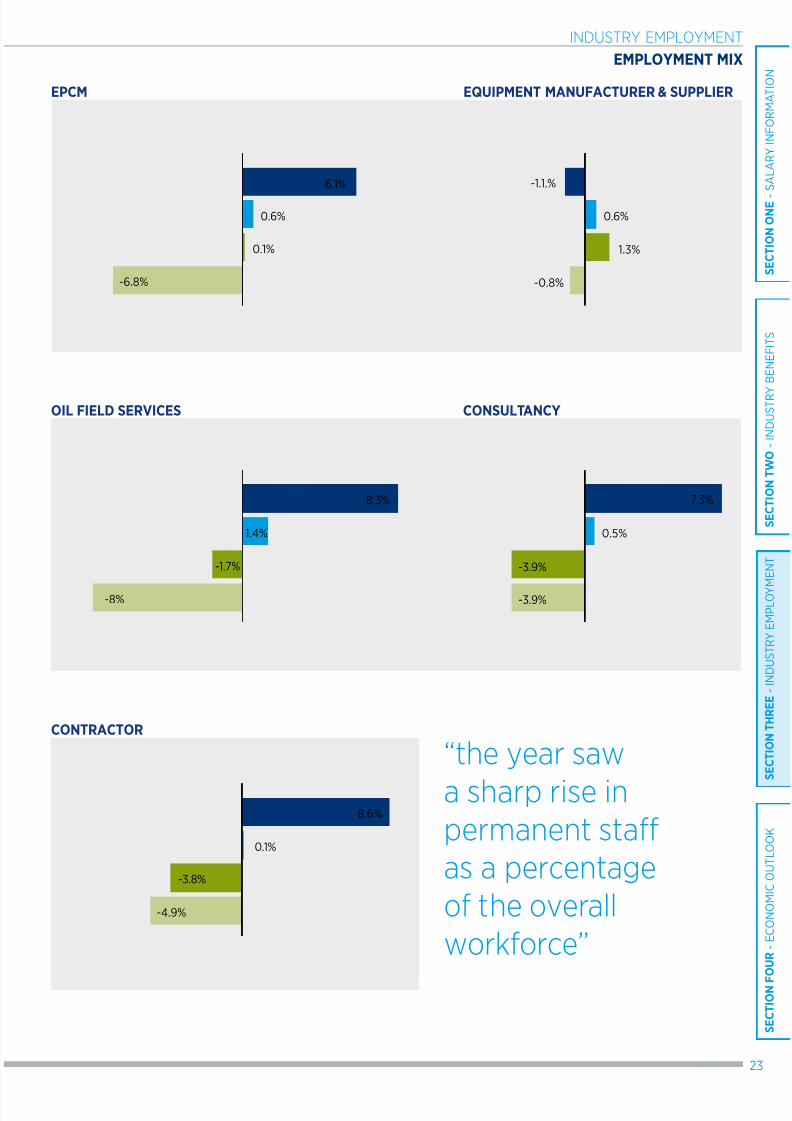
“the year saw
a sharp rise inpermanent staff
as a percentage
of the overall
workforce”
EPCM EQUIPMENT MANUFACTURER & SUPPLIER
OIL FIELD SERVICES CONSULTANCY
CONTRACTOR
8.6%
0.1%
-3.8%
-4.9%
-8%
-1.7%
1.4%
8.3% 7.3%
0.5%
-3.9%
-3.9%
-0.8%
1.3%
0.6%
-1.1.%
-6.8%
0.1%
0.6%
6.1%
8/10/2019 Salary guide (Oil Gas)
http://slidepdf.com/reader/full/salary-guide-oil-gas 26/32
OIL & GAS SALARY GUIDE 201224
SECTION FOURECONOMIC OUTLOOKIt was a good year for the Oil & Gas industry with
confidence being led by a robust oil price.
8/10/2019 Salary guide (Oil Gas)
http://slidepdf.com/reader/full/salary-guide-oil-gas 27/32
25
S E C T I O N O N E -
S A L A R Y I N F O R M A T I O N
S E C T I O N T W O - I N D U S T R Y
B E N E F I T S
S E C T I O N T H R E E - I N D U S T R Y E M P L O Y M E N T
S E C T I O N F
O U R - E C O N O M I C O U T L O O K
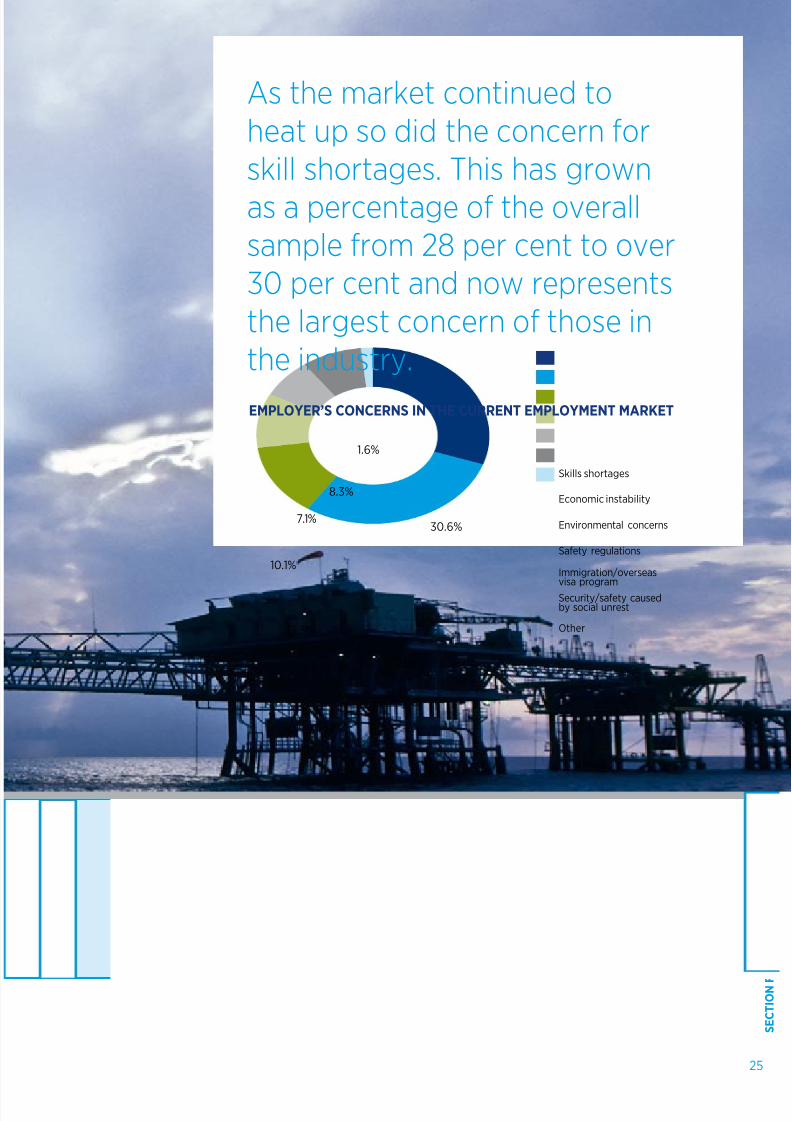
As the market continued to
heat up so did the concern for
skill shortages. This has grown
as a percentage of the overallsample from 28 per cent to over
30 per cent and now represents
the largest concern of those in
the industry.
Skills shortages
Economic instability
Environmental concerns
Safety regulations
Immigration/overseasvisa program
Other
Security/safety causedby social unrest
30.6%
29%
13.3%
10.1%
7.1%
8.3%
1.6%
EMPLOYER’S CONCERNS IN THE CURRENT EMPLOYMENT MARKET
8/10/2019 Salary guide (Oil Gas)
http://slidepdf.com/reader/full/salary-guide-oil-gas 28/32
OIL & GAS SALARY GUIDE 201226
ECONOMIC OUTLOOK
INDUSTRY OUTLOOK
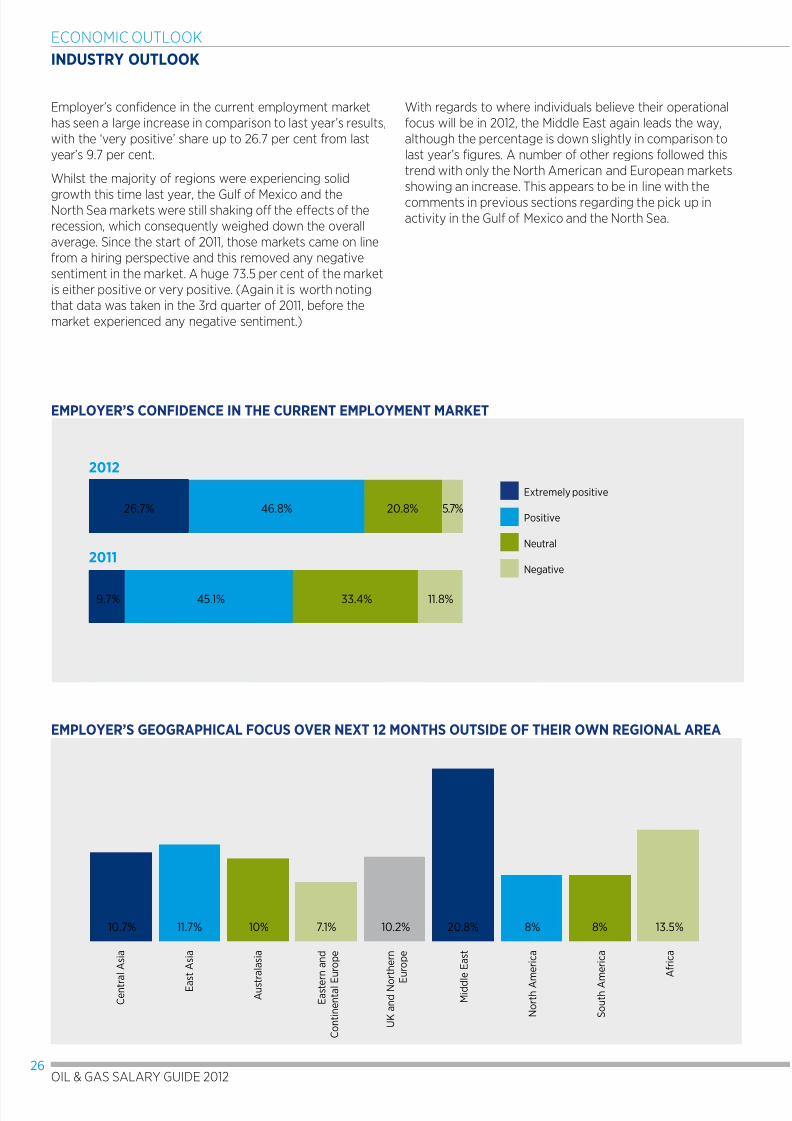
Employer’s confidence in the current employment market
has seen a large increase in comparison to last year’s results,
with the ‘very positive’ share up to 26.7 per cent from last
year’s 9.7 per cent.
Whilst the majority of regions were experiencing solid
growth this time last year, the Gulf of Mexico and theNorth Sea markets were still shaking off the effects of the
recession, which consequently weighed down the overall
average. Since the start of 2011, those markets came on line
from a hiring perspective and this removed any negative
sentiment in the market. A huge 73.5 per cent of the market
is either positive or very positive. (Again it is worth noting
that data was taken in the 3rd quarter of 2011, before the
market experienced any negative sentiment.)
With regards to where individuals believe their operational
focus will be in 2012, the Middle East again leads the way,
although the percentage is down slightly in comparison to
last year’s figures. A number of other regions followed this
trend with only the North American and European markets
showing an increase. This appears to be in line with the
comments in previous sections regarding the pick up in
activity in the Gulf of Mexico and the North Sea.
EMPLOYER’S CONFIDENCE IN THE CURRENT EMPLOYMENT MARKET
EMPLOYER’S GEOGRAPHICAL FOCUS OVER NEXT 12 MONTHS OUTSIDE OF THEIR OWN REGIONAL AREA
Extremely positive
Positive
Neutral
Negative
2012
2011
26%
24.7%
C e n t r a l A s i a
E a s t A s i a
A u s t
r a l a s i a
M i d d l e E a s t
N o r t h A m e r i c a
S o u t h A m e r i c a
A f r i c a
10.7%
26.7% 5.7%46.8% 20.8%
9.7% 45.1% 33.4% 11.8%
11.7% 10% 7.1% 10.2% 20.8% 8% 8% 13.5%
E a s t e r n a n d
C o n t i n e n t a l E
u r o p e
U K a n d N o
r t h e r n
E
u r o p e
8/10/2019 Salary guide (Oil Gas)
http://slidepdf.com/reader/full/salary-guide-oil-gas 29/32
27
S E C T I O N O N E -
S A L A R Y I N F O R M A T I O N
S E C T I O N T W O - I N D U S T R Y
B E N E F I T S
S E C T I O N T H R E E - I N D U S T R Y E M P L O Y M E N T
S E C T I O N F
O U R - E C O N O M I C O U T L O O K
EMPLOYER’S CONCERNS IN THE CURRENT EMPLOYMENT MARKET
ECONOMIC OUTLOOK
MOST SIGNIFICANT ISSUES
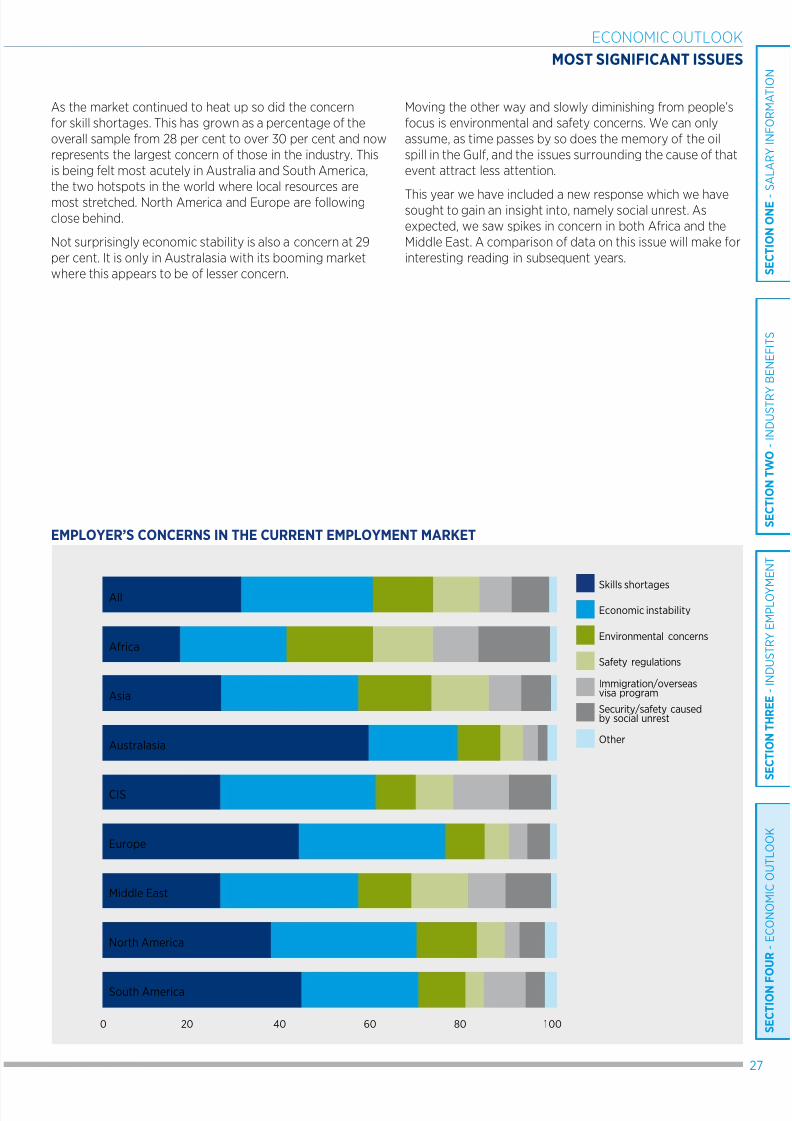
As the market continued to heat up so did the concern
for skill shortages. This has grown as a percentage of the
overall sample from 28 per cent to over 30 per cent and now
represents the largest concern of those in the industry. This
is being felt most acutely in Australia and South America,
the two hotspots in the world where local resources are
most stretched. North America and Europe are following
close behind.
Not surprisingly economic stability is also a concern at 29
per cent. It is only in Australasia with its booming market
where this appears to be of lesser concern.
Moving the other way and slowly diminishing from people’s
focus is environmental and safety concerns. We can only
assume, as time passes by so does the memory of the oil
spill in the Gulf, and the issues surrounding the cause of that
event attract less attention.
This year we have included a new response which we havesought to gain an insight into, namely social unrest. As
expected, we saw spikes in concern in both Africa and the
Middle East. A comparison of data on this issue will make for
interesting reading in subsequent years.
All
Africa
Asia
Australasia
CIS
Europe
Middle East
North America
South America
0 20 40 60 80 100
Skills shortages
Economic instability
Environmental concerns
Safety regulations
Immigration/overseasvisa program
Other
Security/safety causedby social unrest
8/10/2019 Salary guide (Oil Gas)
http://slidepdf.com/reader/full/salary-guide-oil-gas 30/32
OIL & GAS SALARY GUIDE 201228
COUNTRIES WORLDWIDE
32
OFFICES WORLDWIDE 257
CONSULTANTS WORLDWIDE 7,620
PERMANENT CANDIDATESPLACED LAST YEAR 60,000
ABOUT HAYS
PEOPLE PLACED INTO
TEMPORARY ASSIGNMENTS
LAST YEAR 190,000
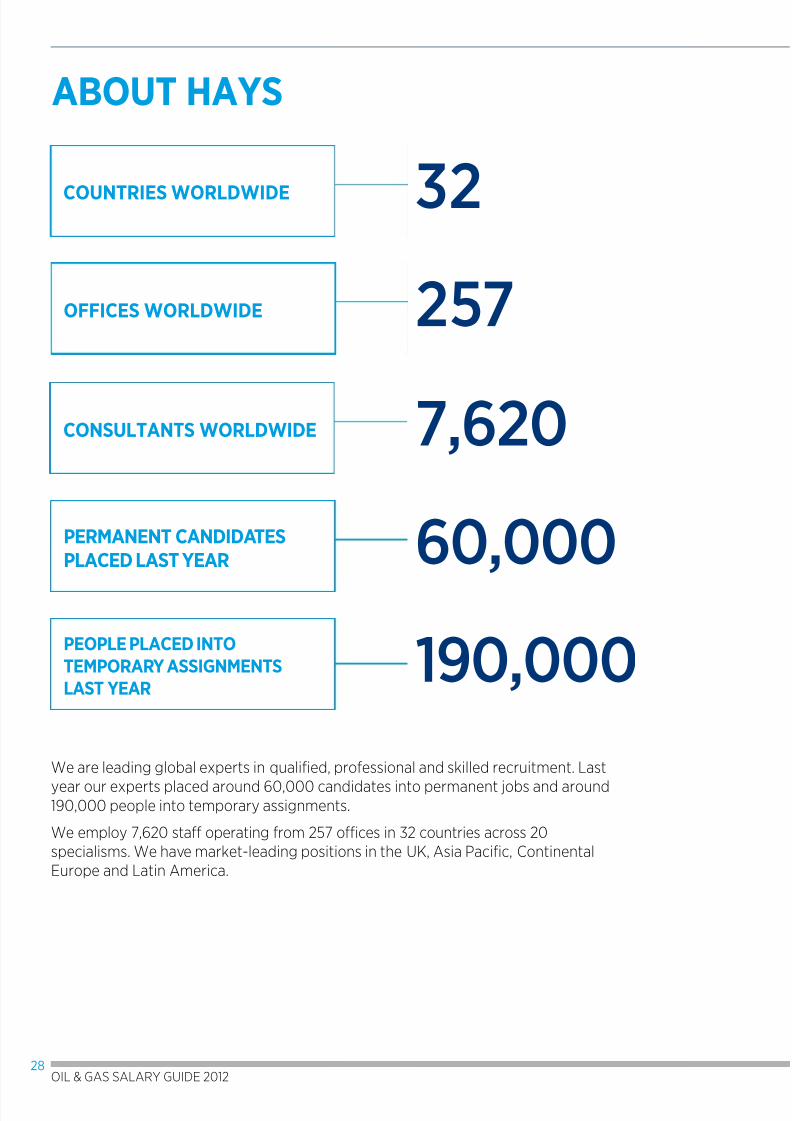
We are leading global experts in qualified, professional and skilled recruitment. Last
year our experts placed around 60,000 candidates into permanent jobs and around190,000 people into temporary assignments.
We employ 7,620 staff operating from 257 offices in 32 countries across 20
specialisms. We have market-leading positions in the UK, Asia Pacific, Continental
Europe and Latin America.

8/10/2019 Salary guide (Oil Gas)
http://slidepdf.com/reader/full/salary-guide-oil-gas 31/32
29
© 2012 Copyright Oil and Gas Jobsearch.com Limited :: Part of The Jobsearch Group
8/10/2019 Salary guide (Oil Gas)
http://slidepdf.com/reader/full/salary-guide-oil-gas 32/32
United Kingdom
Aberdeen
T: +44 12 2459 2870E: [email protected]
London
T: +44 203 465 0133E: [email protected]
Russia
MoscowT: + 7 495 228 2208
Poland
Warsaw
T: +48 22 584 5650
Netherlands
Rotterdam
T: +31 10 201 3700E: [email protected]
France
ParisT: +33 (0)1 42 99 16 60
Canada
Calgary
T: +1 403 269 4297
United States
Houston
T: +1 866 420 4297
Mexico
Mexico CityT: + 52 (55) 5249 2500
Colombia
Bogotá D.C.
T: +57 (1) 313 58 67
Brazil
Rio de Janeiro
T: +55 21 2430 6600
United Arab Emirates
Dubai
T: +971 4 361 2882E: [email protected]
India
MumbaiT: +91 22 4248 2500
ChinaBeijing
T: +86 10 6598 9122
Shanghai
T: +86 21 2322 9600
Singapore
Singapore City
T: +65 6303 0152E: [email protected]
Australia
PerthT: +61 8 9254 4579
Melbourne
T: +61 3 9670 2066
Brisbane
T: +61 7 3231 2962
SydneyT: +61 2 9249 2299
Adelaide
T: +61 8 8212 5242
New Zealand
Wellington
T: +64 4 473 6860E: [email protected]
United Kingdom
Manchester
T: +44 161 975 6026E: [email protected]
Australia
PerthT: +61 404 162 491
United Arab EmiratesDubai
T: +971 4311 7175
oilandgasjobsearch.com
To find your local office please visit the Hays website: hays-oilgas.com