Embed Size (px)
Citation preview

(Translation)
Page | 1 INVESTOR RELATIONS [email protected]
Management Discussion and Analysis 3Q/2013
Executive Summary
In 3Q/2013, PTT Global Chemical Public Company Limited (“the Company”) reported net profit of 9,610 MB or 2.13 Baht/share,
increased 130% from 2Q/2013 with net profit of 4,172 MB or Baht 0.93 Baht/share, and decreased 25% from 3Q/2012 (restated) with net
profit of 12,879 MB or 2.86 Baht/share.
Performance Summary
(Unit: Million Baht) 3Q/2013 3Q/2012
(Restate) 2Q/2013
YoY
% + /(-)
QoQ
% + /(-)
9M/2013 9M/2012 YoY
% + /(-)
Sale Revenue 141,394 145,309 111,887 -3% 26%
394,590 418,216 -6%
EBITDA 16,388 18,581 11,466 -12% 43% 44,273 41,106 8%
EBITDA Margin (%) 12% 13% 10% -1% 1% 11% 10% 14%
Net Profit 9,610 12,879 4,172 -25% 130% 25,857 24,239 7%
Earnings Per Share 2.13 2.86 0.93 -26% 129% 5.73 5.38 7%
Adjusted EBITDA* 12,619 15,306 12,888 -18% -2%
42,569 40,609 5%
Adjusted EBITDA Margin (%) 9% 11% 12% -2% -3%
11% 10% 1%
Note: * Adjusted EBITDA refers to EBITDA excluding impact of inventory value (excludes Inventory and NRV)
In 3Q/2013, Dubai crude price averaged at 106 USD/BBL, rose from previous quarter by 5 USD/BBL or 6% due to the anticipation
of lower supply with concern on unrest in Middle East and North Africa. This caused prices of most petroleum and petrochemical products to
rise from previous quarter. Refinery business had a higher spread of petroleum product over Dubai crude price which resulted in an
increase in Market GRM to 3.49 USD/BBL from 2.38 USD/BBL from previous quarter. The CDU utilization rate in 3Q/2013 was 98%.
Aromatics Business had gross margin (P2F) of 260 USD/ton, decreased from previous quarter at 325 USD/ton due to lower spreads of
paraxylene and benzene over condensate resulted from the ease in supply tightness of paraxylene and benzene. The BTX utilization rate
was at 91%. Olefins business had utilization rate of 75%, down from previous quarter due to the lower feed of natural gas from unplanned
shutdown of PTT Public Company Limited’s (“PTT”) GSP#5. Polyethylene utilization rate was at 88% due to unplanned 78-day shutdown of
LDPE plant resulting in less excess output of olefins. HDPE price averaged at 1,489 USD/ton for this quarter or increased 3% from previous
quarter.
In 3Q/2013, the Company had stock gain (Net NRV) up to 3,768 MB from increasing in crude price during the quarter and Thai
Baht depreciation. In addition, the Company realized Oil Spill expenses and its provision of 1,059 MB in this quarter.
As a result of the market situation and business operations mentioned earlier, in this 3Q/2013, the Company reported EBITDA of
16,388 MB, increased from 2Q/2013 by 43% while the EBITDA margin of this quarter was 12%.

(Translation)
Page | 2 INVESTOR RELATIONS [email protected]
Management Discussion and Analysis 3Q/2013
Summary of the Company’s major events that had significant impact on the financial statements of 3Q/2013, 3Q/2012, and 2Q/2013 are as
follows:
• In 3Q/2012, the purchase price adjustment (PPA) for the investment of NatureWorks and Vencorex on May 31, 2012 was restated.
The valuation of the PPA was completed at the end of 4Q/2012, thus the accounting standard required the Company to realize the
adjusted PPA on the investment date, and therefore 3Q/2012 financial statements were restated.
• On January 10, 2013, PTT Utility Company Limited (“PTTUT”) amalgamated with Independent Power (Thailand) Company Limited
(“IPT”) and became Global Power Synergy Company Limited (“GPSC”) which diluted the Company’s shareholding portion from
60% to 30.31%. In this regard, the Company has changed the method of recording transaction from recognition of all revenue &
expenses of PTTUT’s profit and loss into the Company’s consolidated financial statement (Consolidation) to realizing only gain/loss
of the investment portion in to the Company’s financial statements (Take equity). This method has been applied since 1Q/2013.
However, year-on-year comparison is based on different accounting basis.
Summary of the Company’s major events during 3Q/2013 until the release of financial statement as follows:
• On July 10, 2013, the Company' shutdown LDPE plant (capacity 300,000 tons per year) was shutdown to repair the cylinder of the
Booster/Primary Compressor with an estimate repair period of 3.5 months. The Company expected the impact of no greater than
2% of the year net profit. However, the LDPE plant has started up since September 26, 2013. The total shutdown period was 2.5
months.
• On July 27, 2013, at 6.50 Hrs. a leakage in the flexible hose was found at the Single Point Mooring (SPM) while discharging crude
oil from a vessel to the Refinery. The leakage resulted in oil spill of approximately 50,000 liters or equivalent to 316 barrels into the
sea. The company has urgently performed oil slick removal from the sea and Prao bay has been completely cleaned afterward. In
this regard, the Company has set up measures to take care of environment, community as well as improvement in standard of
operations. However, in 3Q/2013, the operation of refinery was not affected by the oil spill.
• On August 14, 2013, there was a lightning strike accident on the equipment of PTT’s Gas Separation Plant Unit 5 ("GSP#5"). This
has resulted in cease of its operation, and being unable to feed raw materials for production to the Company. However, the
Company has arranged preliminary mitigation plans by sourcing natural gas from other sources, and allocating natural gas,
especially ethane among the Company’s olefins plants to maximize the value and to minimize impact to the its performance as
well as its customers. Initially, the Company expected the GSP#5 shutdown of 3-5 months with an impact of 400 MB per month.
However, since October 21, 2013, GSP#5 has officially resumed its operation at 50% capacity which will result in higher volume of
raw material supplied to the Company in 4Q/2013 as well. The actual period of shutdown was 9 weeks.
• On August 16, 2013, the Company’s Board of Directors has approved a resolution for the payment of interim dividend for the first
6-month period of 2013 from January 1, 2013 to June 30, 2013 to the Company’s shareholders at the rate of Baht 1.62 per share,
amounting to approximately Baht 7,304 million or 45% of the net profit for the first 6-month period of 2013.
(Translation)
Page | 3 INVESTOR RELATIONS [email protected]
Management Discussion and Analysis 3Q/2013
• On August 30, 2013, the Company has completed the entire business transfer of Bangkok Polyethylene Public Company Limited
(“BPE”) and PTT Polyethylene Company Limited (“PTTPE”) to the Company and the transactions have been effective under the
law, and the Company has completed the dissolution of BPE and PTTPE.
• On September 20, 2013, the Company’s Board of Directors resolved as recommended by the Nomination and Remuneration
Committee to appoint Mr. Bowon Vongsinudom, President, to be Chief Executive Officer and Secretary to the Board of Director
and acting President effective from October 1, 2013 onwards.
Petroleum Market Overview
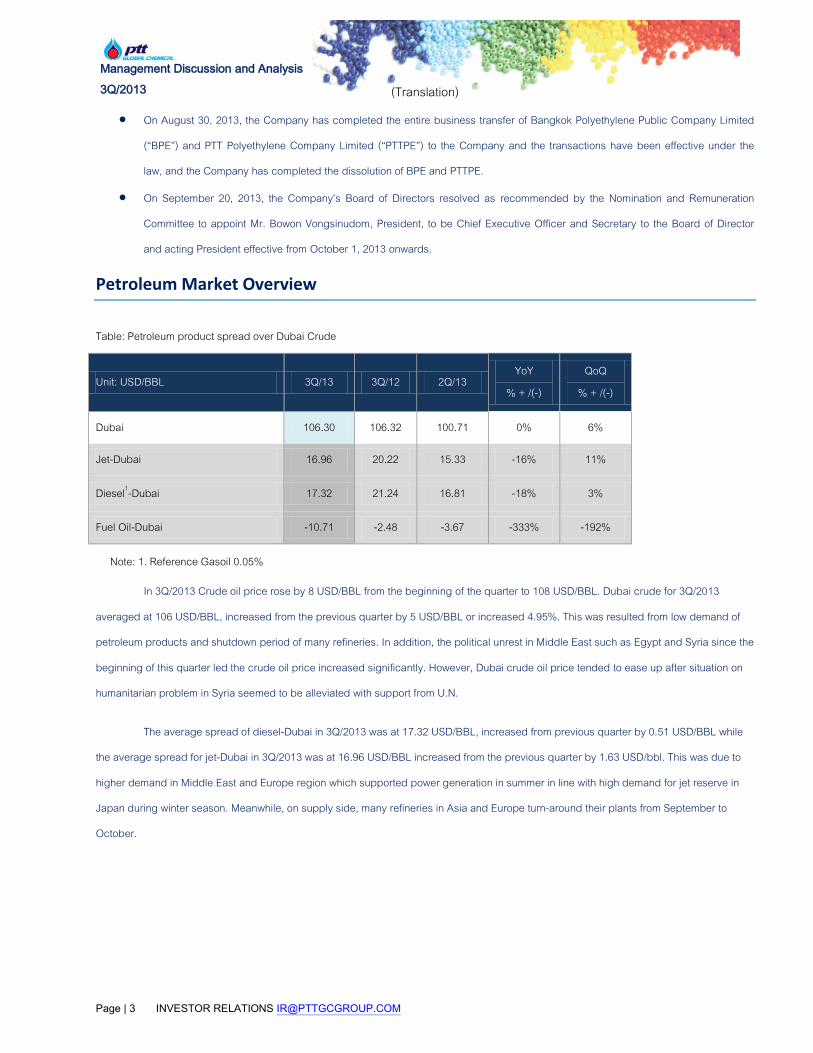
In 3Q/2013 Crude oil price rose by 8 USD/BBL from the beginning of the quarter to 108 USD/BBL. Dubai crude for 3Q/2013
averaged at 106 USD/BBL, increased from the previous quarter by 5 USD/BBL or increased 4.95%. This was resulted from low demand of
petroleum products and shutdown period of many refineries. In addition, the political unrest in Middle East such as Egypt and Syria since the
beginning of this quarter led the crude oil price increased significantly. However, Dubai crude oil price tended to ease up after situation on
humanitarian problem in Syria seemed to be alleviated with support from U.N.
The average spread of diesel-Dubai in 3Q/2013 was at 17.32 USD/BBL, increased from previous quarter by 0.51 USD/BBL while
the average spread for jet-Dubai in 3Q/2013 was at 16.96 USD/BBL increased from the previous quarter by 1.63 USD/bbl. This was due to
higher demand in Middle East and Europe region which supported power generation in summer in line with high demand for jet reserve in
Japan during winter season. Meanwhile, on supply side, many refineries in Asia and Europe turn-around their plants from September to
October.
Table: Petroleum product spread over Dubai Crude
Unit: USD/BBL 3Q/13 3Q/12 2Q/13 YoY
% + /(-)
QoQ
% + /(-)
Dubai 106.30 106.32 100.71 0% 6%
Jet-Dubai 16.96 20.22 15.33 -16% 11%
Diesel1-Dubai 17.32 21.24 16.81 -18% 3%
Fuel Oil-Dubai -10.71 -2.48 -3.67 -333% -192%
Note: 1. Reference Gasoil 0.05%

(Translation)
Page | 4 INVESTOR RELATIONS [email protected]
Management Discussion and Analysis 3Q/2013
Aromatics Market Overview
Table: Spread of aromatics product and condensate
Unit: USD/Ton 3Q/13 3Q/12 2Q/13 YoY
% + /(-)
QoQ
% + /(-)
Condensate 929 918 871 1% 7%
Paraxylene FECP 1,440 1,344 1,409 7% 2%
Paraxylene FECP-Condensate 511 426 539 20% -5%
Benzene Spot Korea 1,258 1,177 1,286 7% -2%
Benzene Spot Korea-Condensate 329 259 415 27% -21%
Naphtha Condensate -8 -4 -12 -121% 33%
Overall aromatics market in 3Q/2013 indicated that the margin decreased from 2Q/2013due to supply recovery as Refinery and
Aromatics plants in U.S., Europe and Asia went back up to normal operation levels which led the paraxylene and Benzene price to edge up.
Furthermore, Naphtha Cracker in Europe region and North Asia expanded their capacity from 80% to 85% resulting from probable improving
in PE market.
Paraxylene (FECP) in 3Q/2013 was at 1,440 USD/ton, increased from previous quarter which stood at 1,409 USD/ton, rose by
31USD/ton. This was because of higher cost of feedstock or the average price of Naphtha which increased by 7%. However, the average
spread for Paraxylene (FECP)-Naphtha reversely decreased by 6%, down to 520 USD/ton resulting from the ease in tight supply and the
resumption of Aromatics plants in Malaysia and India which had total production capacity of 1 million ton per year as well as new Paraxylene
capacity of 1 million tons per year including HC Petrochemical in South Korea that was able to start commissioning as planned with capacity
of 800,000 tons per year. This will result in more stabilized Asian market and higher reserve of downstream products for the upcoming high
season in 4Q/2013.
Benzene price in 3Q/2013 stood at 1,258 USD/ton, decreasing by 2% and the spread for Benzene-Condensate reduced
dramatically by 21%. This large decline was from substantial rise in crude oil price and Naphtha price. In aspect of demand side, the
demand for midstream and downstream products (Stylene Monomer(SM) and Phenol) slowed down resulting from the turnaround of the
Aromatics plants in the region during this time.

(Translation)
Page | 5 INVESTOR RELATIONS [email protected]
Management Discussion and Analysis 3Q/2013
Olefins and Olefin Derivatives Market Overview
Ethylene and Derivatives Market Overview
In 3Q/2013, Ethylene price increased by 57 USD/ton to 1,322 USD/ton from 2Q/2013 due to the maintenance shutdown of several
Olefins plants in Asia and Europe and the recovery of PE and MEG markets from the previous quarter as a consequence of easing Europe’s
debt crisis and improving China’s economy.
Polyethylene price increased in 3Q/2013 from previous quarter in line with Crude oil price and Ethylene price due to the tight
market as there were maintenance shutdowns of several Polyethylene plants in the region during this period, and the reduction of export
from Middle East to Asia, while the demand was seasonally recovering. Consequently, HDPE price averaged at 1,489 USD/ton - rose by 3%
from previous quarter, LLDPE price averaged at 1,490 USD/ton in 3Q/2013, rose by 4% from the previous quarter, and LDPE price averaged
at 1,569 USD/ton, rose by 9% from the previous quarter.
Table: Olefins and Olefins derivatives price and spread
Unit: USD/Ton 3Q/2013 3Q/2012 2Q/2013 YoY
% + /(-)
QoQ
% + /(-)
Naphtha 920 915 858 1% 7%
Ethylene 1,322 1,200 1,265 10% 5%
HDPE 1,489 1,343 1,443 11% 3%
HDPE-Naphtha 569 428 585 33% -3%
LLDPE 1,490 1,341 1,433 11% 4%
LLDEP-Naphtha 570 426 575 34% -1%
LDPE 1,569 1,327 1,444 18% 9%
LDPE-Naphtha 649 412 586 58% 11%
MEG 1,143 1,065 1,173 7% -3%
MEG-0.65 Ethylene 284 285 351 0% -19%

(Translation)
Page | 6 INVESTOR RELATIONS [email protected]
Management Discussion and Analysis 3Q/2013
Performance Analysis by Business Unit
Refinery Business Unit
Table: Refinery Intake
3Q/2013 3Q/2012 2Q/2013 YoY
% + /(-)
QoQ
% + /(-)
Crude (M.BBL) 13.10 13.51 8.36 -3% 57%
(KBD) 142.36 146.84 91.82 -3% 55%
Condensate Residue & Others (M.BBL) 5.10 5.07 3.27 1% 56%
(KBD) 55.46 55.11 35.98 1% 54%
Total Intake (M.BBL) 18.20 18.58 11.63 -2% 56%
(KBD) 197.82 201.96 127.80 -2% 55%
CDU Utilization Rate 98% 101% 63%
CDU Capacity = 145 KBD, Condensate Residue Splitter Capacity = 58 KBD, Total Capacity = 203 KBD
This quarter the Company’s refinery has CDU utilization rate of 98%, down from 3Q/2012 at 101% and up from 2Q/2013 at 63%
which had the refinery shutdown for 44 days. In 3Q/2013, there was a shutdown of hydrocracking unit for 9 days (3-11 July) while total
intake was 197.82 KBD, 2% down from 3Q/2012 and 55% up from 2Q/2013.
Table: Gross Refinery Margin
Unit: USD/BBL 3Q/2013 3Q/2012 2Q/2013 YoY
% - /(+)
QoQ
% - /(+)
Market GRM 3.49 5.94 2.38 -41% 47%
CDU GRM 4.32 7.61 2.73 -43% 58%
CRS GRM 2.83 2.73 2.38 4% 19%
Hedging Gain/(Loss) 0.98 0.02 1.23 N/A -20%
Stock Gain/(Loss) Net NRV 4.21 2.51 -2.92 68% N/A
Accounting GRM 8.68 8.47 0.69 2% N/A
The Company’s Market GRM for 3Q/2013 was at 3.48 USD/BBL (CDU GRM of 4.31 USD/BBL and CRS GRM of 2.90 USD/BBL)
decreased 41% compared to 3Q/2012 at 5.94 USD/BBL which was due mainly to lower product spreads. Jet-Dubai spread decreased 16%
while Diesel-Dubai decreased 18%. In comparison to 2Q/2013 Market GRM at 2.38 USD/BBL, 3/2013 Market GRM increased 46% due to

(Translation)
Page | 7 INVESTOR RELATIONS [email protected]
Management Discussion and Analysis 3Q/2013
refinery plant shutdown of 44 days during 2Q/2013. This resulted in a change in production yield from the ramp-up period to the ramp-up
with higher output of intermediates and fuel oil than usual.
.
Table: Petroleum Sales
Product 3/2013 3/2012 2/2013 YoY
% + /(-)
QoQ
% + /(-) '000 Barrels % '000 Barrels % '000 Barrels %
Naphtha 1,204 7% 1,400 8% 876 9% -14% 37%
Reformate 781 5% 1,454 8% 780 8% -46% 0%
Jet/Kero 1,953 12% 1,482 8% 1,087 11% 32% 80%
Diesel 5,804 36% 10,084 57% 5,421 54% -42% 7%
Bio Diesel 2,543 16% - 0% - 0% 0%
Fuel Oil 2,358 15% 2,235 13% 1,349 13% 5% 75%
Others 1,512 9% 1,159 7% 544 5% 30% 178%
Total 16,155 100% 17,815 100% 10,057 100% -9% 61%
In 3Q/2013 the Company has gain from commodity hedging of 0.98 USD/bbl. Due to an increase in crude price, the Company
reported inventory stock gain (include NRV) of 4.21 USD/bbl. When compared to 3Q/2012 which had stock gain and NRV of 2.51 USD/bbl,
and 2Q/2012 which had stock loss of 2.92 USD/bbl, in 3Q/2013, the Company reported refinery accounting GRM of 8.68 USD/bbl increased
from 3Q/2012 with accounting GRM of 8.47 USD/bbl and increased from 2Q/2013 which reported loss of 0.69 USD/bbl.

(Translation)
Page | 8 INVESTOR RELATIONS [email protected]
Management Discussion and Analysis 3Q/2013
Aromatics Business Unit
In 3Q/2013, Aromatics Business had total intake of 1.5 million ton, decreased 2% from 3Q/2012 and increased 7% from 2Q/2013.
The BTX utilization rate in 3Q/2013 was at 91%, increased from 3Q/2012 at 90% and increased 2Q/2013 at 84%, while, in 3Q/2013, Aromatic
Plant Unit 2 shutdown for 17 days during 2-18 September 2013.
Table: Aromatics Intake and Productions
3Q/2013 3Q/2012 2Q/2013
YoY
% + /(-)
QoQ
% + /(-)
Total Intake ('000 Tons) 1,529 1,566 1,426 -2% 7%
BTX Production ('000 Tons) 533 527 489 1% 9%
BTX Utilization Rate 91% 90% 84%
*Aromatics capacity 2.259 Mton/Year
Table: Aromatics Sales Volume
Product
3Q/2013 3Q/2012 2Q/2013 YoY
% + /(-)
QoQ
% + /(-) '000 Tons % '000 Tons % '000 Tons %
Benzene (BZ) 134 15% 153 18% 161 20% -12% -17%
Paraxylene (PX) 309 35% 315 37% 276 34% -2% 12%
Cyclohexane 54 6% 57 7% 52 6% -4% 5%
Other BTX Products 15 2% 14 2% 15 2% 7% 2%
Total BTX Products 514 59% 539 63% 504 62% -5% 2%
Naphtha and Raffinate 270 31% 208 25% 189 23% 30% 42%
Condensate Residue - 0% - 0% 20 0 N/A N/A
Other By-Products 93 11% 102 12% 96 12% -9% -3%
Total 876 100% 850 100% 810 100% 3% 8%
In 3Q/2013, the Company sold total BTX product of 514 Kton, down 5% from 3Q/2012 while Paraxylene spread increased 20%
and Benzene spread increased 27%. This resulted in 7% increase in 3Q/2013 P2F at 260 USD/ton BTX from 3Q/2012. When compared to
2Q/2013, the total BTX sale increased by 2%, while Paraxylene spread decreased by 5%, and Benzene spread decreased by 21%.

(Translation)
Page | 9 INVESTOR RELATIONS [email protected]
Management Discussion and Analysis 3Q/2013
In 3Q/2013, Olefins Plant I4-1 was shutdown and unable to produce Pyrolysis Gasoline as feed stock for Benzene production. In
addition, the Company received less discount on Condensate price than in 3Q/2012 and 2Q/2013 and this resulted in lower product prices,
and decrease in Aromatics Market P2F (USD/Ton BTX) from previous quarter by 20%
Table: Aromatics market P2F
Unit: USD/Ton 3Q/2013 3Q/2012 2Q/2013 YoY
% + /(-)
QoQ
% + /(-)
Market P2F 260 243 325 7% -20%
(LCM)/LCM Reversal 0.0 23.3 0.0 N/A N/A
Hedging Gain/(Loss) 0.0 0.0 (0.8) N/A N/A
Stock Gain/(Loss) 84.1 41.1 -46.0 N/A N/A
Accounting P2F 344 308 278 12% 24%
The Company reported stock gain (including NRV) in 3Q/2013 at 84.10 USD/ton BTX, increased from 3Q/2012 at 41.10 USD/ton
BTX while in 2Q/2013, stock loss was at 46.0 USD/ton BTX. The Company reported accounting P2F at 344 USD/ton, 12% increase from
3Q/2012 and 24% increase from 2Q/2013.
Olefins and Derivatives Business Unit
Table: Sales volume and utilization rate of olefins and derivatives
3Q/2013 3Q/2012 2Q/2013
YoY
% + /(-)
QoQ
% + /(-)
Sale Volume
'000 Ton
Utilization
Rate
Sale Volume
'000 Ton
Utilization
Rate
Sale Volume
'000 Ton
Utilization
Rate
Olefins1 129 75% 188 91% 218 93% (32%) (41%)
HDPE 208 106% 198 100% 193 96% 5% 8%
LLDPE 119 113% 111 113% 70 72% 7% 70%
LDPE 25 5% 96 113% 71 99% (74%) (66%)
Total Polyethylene 352 88% 404 102% 334 90% -13% 5%
MEG2 95 92% 91 93% 104 100% 5% (8%)
Note: 1. Sales volume of olefins is external volume
2. Utilization calculated on MEG capacity of 395 KTA

(Translation)
Page | 10 INVESTOR RELATIONS [email protected]
Management Discussion and Analysis 3Q/2013
The utilization rate of olefins in 3Q/2013 was at 75%, down from 3Q/2012 at 91% and down from 2Q/2012 at 93% mainly due to the
impact of an accident incurring from the thunder storm and lightning strike on the Waste Heat Recovery Unit or WHRU of PTT’s Gas
Separation Plant Unit 5 (“GSP#5”), the gas supplier of PTTGC’s I4-2 plant (Olefins production capacity: 450 Ktons per year). This has
resulted in cease of GSP#5’s operation and GSP#5 was unable to supply gas feedstock to the Company. However, the Company has
arranged mitigation plans to minimize the impact by sourcing natural gas from other sources and allocate natural gas, especially ethane
among PTTGC’s olefins plants to maximize the value and to reallocate olefins products to efficiently operate both upstream and downstream
products to minimize impact to PTTGC’s performance and customers. On October 21, 2013, GSP#5 was able to come back on operation for
50% of its capacity which allow the Company to have more gas feedstock for 4Q/2013. Furthermore, in 3Q/2013, olefins I4-1 plant which is a
mixed feed cracker had a maintenance shutdown for 52 days (1 August – 21 September) and naphtha feedstock portion of the Company
this quarter is 4% of all feedstock.
Table: Olefins and derivatives adjusted EBITDA
3Q/2013 3Q/2012 2Q/2013 YoY
% + /(-)
QoQ
% + /(-)
Adj. EBITDA Margin 26% 27% 28% -1% -2%
From previously mentioned factors, in 3Q/2013, the performance of olefins and olefins derivatives business decreased when
compared to same quarter last year and last quarter even though HDPE price increased 11% from 3Q/2012 and increased 3% from
2Q/2013. Adjusted EBITDA Margin of olefins and olefins derivatives in 3Q/2013 was at 26%, decreased from 3Q/2012 at 27% and
decreased from 2Q/2013 at 28%.
Olefins Business Unit
From the impact of PTT’s GSP#5 shutdown, volume of olefins external sales in the quarter decreased from the same quarter last
year by 32% and decreased by 41% from 2Q/2013, while Ethylene price was at 1,445 USD/ton, increased 10% from same quarter last year
and increased 5% from previous quarter. However, sales revenue of olefins business unit decreased in line with the decrease in utilization
rate.
Polymer Business Unit
Overall performance of polymer product decreased when compared to 3Q/2012 and 2Q/2013. The performance of each product
are shown as follows:
Performance: HDPE
The total utilization rate of the 3 HDPE plants in 3Q/2013 was at 106%, increased from 100% in 3Q/2012 and from 96% in 2Q/2013,
due to a planned shutdown of HDPE I-1 plant for 15 days and another 30 days for BPE2 plant, while there was a 15-day shutdown of BPE1 in
3Q/2012.

(Translation)
Page | 11 INVESTOR RELATIONS [email protected]
Management Discussion and Analysis 3Q/2013
Overall performance of HDPE improved in 3Q/2013 when compared with 3Q/2012 and 2Q/2013 from an increase in sales volume and price.
HDPE sales volume increased by 5% and 8% respectively, while HDPE price in 3Q/2013 was at 1,489 USD/ton increased 11% from 3Q/2012
and increased 3% from 2Q/2013. From mentioned factors, sales revenue of HDPE increased 16% and 15% respectively.
Performance: LLDPE
The utilization rate of LLDPE plant in 3Q/2013 was at 113%, at the same level with 3Q/2012 and increased from 2Q/2013 at 72% as
LLDPE plant was able to operate at its full capacity the same way as 3Q/2012. However, there was a maintenance shutdown in 2Q/2013 of
25 days. Overall performance of LLDPE improved in 3Q/2013 compared to 3Q/2012 and 2Q/2013, mainly due to the higher sales volume
and price. Sales volume increased 7% and 70% compared to the same period last year, and previous quarter respectively, while LLDPE
price in 3Q/2013 was at 1,530 USD/ton, increased 11% from 3Q/2012 and 4% increase from 2Q/2013. Sales revenue of LLDPE increased
21% and 84% compared to the same period last year, and previous quarter respectively.
Performance: LDPE
3Q/2013 utilization rate of LDPE was at 5% decreased from 3Q/2013 at 113% and 2Q/2013 at 99%. This was due to LDPE plant
shutdown on July 10, 2013 to repair the cylinder of the Booster/Primary Compressor with an estimate shutdown period of 3.5 months. The
Company expected the impact of no greater than 2% of the year net profit. However, the LDPE plant has started up approximately 2 weeks
earlier than expected on September 26, 2013. LDPE price was at 1,569 USD/ton 18% increase when compare to 3Q/2012 and 9% from
previous quarter which was partially due to the short in supply from the Company’s LDPE plant shutdown.
Performance: MEG
The utilization rate of MEG in 3Q/2013 was at 92%, decreased from 93% in 3Q/2012 and decreased from 100% in 2Q/2013 (the
calculation of utilization is based on MEG total capacity of 395,000 tons/year) due to MEG plant planned shutdown of 11 day in 3Q/2013
while in 3Q/2012 LDPE plant extended capacity of 95,000 ton/year had not started commissioning and there was not shutdown in 2Q/2013.
Overall performance of MEG had improved in 3Q/2013 when compared to 3Q/2012 with 13% higher revenue from an increase of
5% in sales volumes and MEG price increased 7% to 1,143 USD/ton in 3Q/2013. In comparison to 2Q/2012, sales revenue increased 6%,
although market price decreased 3% and sales volume decreased 8%. This was due to increase in sales volume to new markets where the
average selling price was 8% higher.

(Translation)
Page | 12 INVESTOR RELATIONS [email protected]
Management Discussion and Analysis 3Q/2013
Operating Performance
3Q/2013 3Q/2012 2Q/2013 YoY QoQ
9 Month Ending
M. Baht % M. Baht % M. Baht % M. Baht % M. Baht %
M. Baht %
Sales Revenue
141,394 100 145,309 100 111,887 100 -3,915 -3 29,507 26
394,590 100
Feedstock Cost
-116,522 -82 -119,602 -82 -87,594 -78 3,080 3 -28,928 -33
-316,235 -80
Product to Feed Margin
24,872 18 25,707 18 24,293 22 -835 -3 579 2
78,355 20
Variable Cost (1) -6,211 -4 -5,136 -4 -6,204 -6 -1,075 -21 -7 -0
-19,318 -5
Fixed Cost (2) -4,028 -3 -3,940 -3 -4,163 -4 -88 -2 135 3
-12,319 -3
Stock Gain/(Loss) & NRV (3) 3,768 3 3,275 2 -1,422 -1 493 15 5,190 365
1,703 0
Gain/(Loss) Hedging
Commodity (4) 560 0 -30 -0 419 0 590 0 141 34
1,127 0
Other Income (5) 1,235 1 1,311 1 1,362 1 -76 -6 -127 -9
3,921 1
SG&A (6) -3,808 -3 -2,606 -2 -2,819 -3 -1,202 -46 -989 -35
-9,196 -2
EBITDA
16,388 12 18,581 13 11,466 10 -2,193 -12 4,922 43
44,273 11
Depreciation & Amortization (7) -4,149 -3 -4,328 -3 -4,187 -4 179 4 38 1
-12,288 -3
EBIT
12,239 9 14,253 10 7,279 7 -2,014 -14 4,960 68
31,985 8
Financing Expenses
-1,144 -1 -1,438 -1 -1,120 -1 294 20 -24 -2
-3,379 -1
FX Gain/(Loss) (8) -738 -1 746 1 -2,726 -2 -1,484 -199 1,988 73
-1,478 -0
Shares of gain/(loss) from
investments (9) -54 -0 25 0 -22 -0 -79 -316 -32 -145
-94 -0
Corporate Income Tax (10) -708 -1 -562 -0 509 0 -146 -26 -1,217 -239
-1,419 -0
Net Profit After Income Tax
9,595 7 13,024 9 3,920 4 -3,429 -26 5,675 145
25,615 6
Portion of Net Profit:
Shareholders
9,610 7 12,879 9 4,172 4 -3,269 -25 5,438 130
25,857 7
Minorities
-15 -0 145 0 -252 -0 -160 -110 237 94
-242 -0
Adjusted EBITDA
12,619 9 15,306 11 12,888 12 -2,687 -18 -269 -2
42,569 11
หมายเหตุ: 1. Adjusted EBITDA คือ EBITDA ที่ไมรวมผลกระทบจากมูลคาสตอกน้ํามัน (Stock Gain/Loss และ NRV)

(Translation)
Page | 13 INVESTOR RELATIONS [email protected]
Management Discussion and Analysis 3Q/2013
Performance Comparison
(1) Variable Cost
Variable cost increased by 1,075 MB or 21% as a result of the change in the proportion of investment in PTTUT, and the change in the
method to recognize the performance of GPSC (PTTUT amalgamation) from consolidation to take equity. Previously, the cost of electricity
and steam purchased from GPSC were not in the consolidated financial statement. After the change in the proportion of investment in GPSC,
and its status from the Company’s subsidiary to associate, this transaction was realized as the Company cost in the consolidated financial
statement with an increasing amount of 1,854 MB or 36%. Variable cost of other products decreased by 779 MB or 15%, due to the lower
sales volume by 4% from Olefins and Polymer businesses resulted from shutdown of GSP#5, planned shutdown of Olefins plant I-4/1, and
maintenance shutdown of LDPE plant. This caused sales volume and production cost to decrease compared to the same period last year.
In comparison to the previous quarter, other variable cost decreased by 1,075 MB or 21% due mainly to the decrease in production of
Olefins and LDPE as mentioned above.
(2) Fixed Cost
In 3Q/2013, fixed cost increased by 88 MB or 2% due to the increase in the one-time/special production fixed costs in 3Q/2013 comprising
1.) Decrease in fixed cost of PTTUT of 141 MB due to the change in the method to recognize the performance of PTTUT from consolidation
to take equity, as a result of the change in the proportion of investment in PTTUT, 2.) Increase in fixed cost of 220 MB due mainly to the
increase in number of employees as well as employee salary of 254 MB or 18%.
In comparison to the previous quarter, fixed costs were down by 88 MB, or 18% which was not considered as a significant change.
(3) Stock Gain/ (Loss) and NRV
Stock Gain and NRV in 3Q/2013 were reported at 3,768 MB, of which Stock Gain was 3,790 MB, and NRV Loss was 22 MB, while Stock Gain
in 3Q/2012 was 2,167 MB and NRV Gain 1,108 MB. The Stock Gain in 3Q/2013 of 3,790 MB was the result of Stock Gain from Aromatics of
1,366 MB, and Stock Gain from Refinery of 2,424 MB. Additional factors were crude price which reduced from 101 USD/bbl at the beginning
of the period, and closed in September 2013 at 108 USD/bbl with Baht depreciation. However, there was a refinery shutdown 44 days in
2Q/2013 resulting the beginning balance of crude in 3Q/2013 was the cost of inventory purchased in April 2013 at the exchange rate of
29.08 Baht/USD. Therefore, the exchange rate had a significant impact on the amount of Stock Gain in this quarter
In 3Q/2013, the company reported NRV Loss of 22 MB mainly resulted from LDPE product of which plant unplanned shutdown starting from
July 10, 2013. The shutdown expenses were recorded as product cost resulting in higher product cost, while the expected selling price was
below the product. Consequently, the Company realized NRV Loss for LDPE in this quarter.
Previously, the company had total Stock Gain and NRV of 3,275 MB in 3/2012 and 1,422 MB in 2Q/2013.
(4) Gain/(Loss) Commodity Hedging
The Company reported an increase in gain from commodity hedging by 590 MB or 1,969% as a result of Crack Spread Hedging with the
main reason to maintain profit level. In 3Q/2013, the actual spread for petroleum products was higher than the spread that the company has
sold in advance with the volume of 4.7 million barrels.

(Translation)
Page | 14 INVESTOR RELATIONS [email protected]
Management Discussion and Analysis 3Q/2013
(5) Other Income
The Company reported a decrease in other income of 76 MB, or 6% from 3Q/2012, due mainly to the adjustment in accounting transaction of
employees’ benefit of Myriant in 3Q/2013. There was no such transaction in 3Q/2013 resulting in a decrease in other income of 197 MB.
However, there was an increase in service income of 121 MB resulted from the increase in Share Facilities service of Vencorex of 54 MB.
In comparison to 2Q/2013, other income decreased by 127 MB or 9% due mainly to LDPE plant shutdown in 3Q/2013 which caused lower
product export, and lower Export Tax Credit from Custom Department. In previous quarter, the Company received Marine Cargo insurance
claim payment of 101 MB from the incident of raw material shipwreck.
(6) SG&A
SG&A expenses increased by 1,202 MB, or 46% from 3Q/2012 due mainly to expenses relevant to the Oil Spill of 1,059 MB. In addition, the
Company had loss for sale of asset of 87 MB due mainly to the loss from sale of depreciated Spare Part and Catalyst.
In comparison to 2Q/2013, SG&A increased by 989 MB or 35% due mainly to expenses relevant to the Oil Spill of 1,059 MB.
(7) Depreciation and Amortization
Depreciation and amortization costs decreased by 179 MB or 4% from 3Q/2013 due mainly to the decrease in the depreciation and
amortization of PTTUT of 258 MB from the change in method of performance recognition of PTTUT from Consolidation to Take Equity with
lower shareholding portion in PTTUT. In addition, the Company realized higher depreciation and amortization from the cost of plant
shutdown for maintenance of new projects.
In comparison to 2Q/2013, depreciation and amortization costs decreased by 38 MB or 1% which was not considered as a significant
change.
(8) Gain/(Loss) from Foreign Exchange
In 3Q/2013, the Company had loss from foreign exchange of 738 MB resulted from Thai Baht depreciation by Bath 0.26 per USD or 1%
(Based on average sales BOT, end of 3Q/2013 at Baht 31.53 per USD vs. 2Q/2013 at Baht 31.27 per USD). At the end of 3Q/2013, the
Company had foreign liabilities of about USD 1,380 million, and risk protection derivatives of USD 858 million.
The Company had gain from foreign exchange of 746 MB in 3Q/2012, loss from foreign exchange of 2,726 MB in 2Q/2013.
(9) Gain/(Loss) from Share of Investment
In 3Q/2013, the Company realized total share of loss from investment of 54 MB comprising loss from Myriant of 210 MB and profit from other
subsidiaries of 148 MB, while the Company realized total share of profit from investment of 25 MB in 3Q/2012 comprising loss from Myriant of
163 MB and profit from other subsidiaries of 188 MB.
(10) Corporate Income Tax
Corporate Income Tax increased by 146 MB or 16% from 3Q/2012, due mainly to tax privilege exercised from GT NOX project, thus causing
lower corporate income tax than usual.
In comparison to 2Q/2013, Corporate Income Tax decreased by 1,217 MB due to a down in performance of non-tax privilege operations
especially from the refinery shutdown for maintenance and decrease in product spreads.

(Translation)
Page | 15 INVESTOR RELATIONS [email protected]
Management Discussion and Analysis 3Q/2013
Statement of Financial Position
Asset
As at September 30,2013, the Company had total asset of 412,194 MB decreased 23,868 MB or decreased 5% from December 2012 which
due mainly to decrease in current asset of 13,662 MB or 8% decrease. Non-current asset also decreased 10,206 MB or 4% decrease.
1) Current asset decreased 13,662 MB mainly due to the following reasons.
• Cash and cash equivalent decreased 18,448 MB or 59% decrease. The main factor was due to an increase of short term
investment by 8,871 MB from both investment in the bill of exchange (B/E) and more than 3-month periods of fixed deposit,
coupled with increasing investment in PPCL’s share of 4,644 MB in order to bring PTTGC to be completely holding of 100% in
PPCL (previously PTTGC holds 60% of the shares) meanwhile, cash and cash equivalent items of PTTUT decreased 3,139
MB, mainly due to changing structure and shareholders’ ratio which affected to the transforming of financial report practices in
compliance to the generally accepted accounting standards. PTTGC thus changed Consolidated financial methodology to be
Taking Equity methodology. In addition, declining in cash and cash equivalent was also resulted from repayment of principal,
refinancing of interest, and dividend payment which totally accounted for 29,297 MB and cash outflow for purchasing news
asset of 13,831 MB. While, cash generated from operations and cash generated from AR Factoring of Vencorex accounted for
39,481 MB and 1,539 MB, respectively.
• Non-current asset increased 7,958 MB or 28% increased, due mainly to increasing in short term investment of PTTGC by
8,593 MB and raising investment in the bill of exchange (B/E) and fixed deposit. While, the short term investment of PTTUT
decreased 1,253 MB, mainly due to changing in financial report practices in compliance to the generally accepted accounting
standards.
• Account receivable decreased 8,011 MB or 15% decrease due to diminishing of account receivable in Olefins and Polymer
Business Unit of which 2,856 MB. Key factors affecting account receivable derived from a large declining of sales volume of
those business unit especially LDPE product amid the maintenance shutdown throughout this quarter despite of moving up of
LDPE price. Moreover, Account receivable of Petroleum and Aromatics Business Unit also decrease of 2,009 MB or 11%
decrease and 2,475 MB, or 20% decrease, respectively. As a result of dwindling in Petroleum and Aromatics sales volume
35 39
240 226
101 98
60 50
238 237
137 121
61 55
As at December 31, 2013 As at September 30, 2013
Cash / cash equivalent /
Short term investment
Current Asset
PP&E
Non Current Asset
Unit: Billion Baht Unit: Billion Baht
Other Liabilities
IBD
Shareholders’
Equity

(Translation)
Page | 16 INVESTOR RELATIONS [email protected]
Management Discussion and Analysis 3Q/2013
and price along this period compared to the end of previous year. Lastly, changing structure and shareholders’ ratio in PTTUT
which affected to the financial report and reducing in account receivable of 953 MB.
3Q/2013 (Day) YE 2012 (Day) +/(-) (Day)
AR Turnover 33 30 3
• In 3Q/2013, AR Turnover averaged at 33 days, increased from the year end 2012 by 3 days, During this third quarter, there
has been found that export sale volumes in Petroleum business unit went up compared to the end of year 2012 and the
condition of credit term for international region would extend more than inbound credit term, resulting in account receivable of
Petroleum business unit which rose to 29 days from 24 days. For EO/EG Business Unit, AR Turnover averaged at 49 days
increased from 44 days, as a result of further expanding to targeted customers with longer credit term which no less than 45
days. For Green Chemicals Business Unit, AR Turnover averaged at 44 days increased from 38 days, mainly came from
increasing in account receivable turnover of Emery Specialty Chemical (ESC) with credit term ranging from 15-180 days.
• Inventory increased 6,319 MB or 15% increase mainly due to an increase in inventory of Petroleum business unit in total of
5,378 MB especially in Crude inventory intake rose by 1.36 M.BBL compared to the end of year 2012. Changing in
Compressor since August 2006 and crude oil spill incident at the end of July 2013 caused reduction of refining CDU Utilization
rate while outstanding crude had to be collected additionally in inventory. Furthermore, Aromatics Business Unit had an
increase in inventory by 1,175 MB due to maintenance shutdown ranging from 2 to 18 September 2013. However, inventory of
PTTUT ,which was spare part turned out to be decreased which total of 208 MB resulting from reshuffle structure and
shareholders’ ratio in PTTUT which affected to the financial report and inventory quantity.
• Inventory turnover of 3Q/2013 averaged at 20 days, at the same level as the end of year 2012. However, there have been
experienced in decreasing of inventory turnover in some business units as follows; for Aromatics Business Unit, inventory
turnover became lessen depending upon further plan of expanding a Nameplate production capacity in October 2013. This
led to accelerative intake of Aromatics feed stock. Meanwhile, for High Volume Specialties business unit, especially for Phenol
product, its inventory turnover also decreased from intentionally plan to stabilize inventory in the suitable level.
• Other current asset decreased 1,480 MB or 21% decreased, due to declining in account receivable of energy and fuel fund by
252 MB. A large amount of subsidy for LPG Price was substantially diminished from 42 million kg. to 34 million kg. Meanwhile,
rate of compensation of LPG price was reduced sharply from 15.74 Baht per kg. to 12.03 Baht per kg except Diesel Price
which have not been subsidize by Fuel fund in this year.
2) Non-current asset decreased 10,206 MB or 4% decrease which due mainly to:
• Plant property and equipment decreased 14,921 MB or 6% decrease from PTTUT asset value 17,558 MB whole amount due to
change in accounting policy and depreciation within the period increase 8,735 MB. However, there was an increase in new
asset and work in progress of 11,372 MB from an increase in plant turnaround which partially realized as asset and an
increase in project values.
3Q/2013 (Day) YE 2012 (Day) +/(-) (Day)
Inventory Turnover 20 20 0

(Translation)
Page | 17 INVESTOR RELATIONS [email protected]
Management Discussion and Analysis 3Q/2013
• Non-current asset increased 4,715 MB or increased 14% due mainly from an increased in investment in associates 5,239
million baht from change in shareholding structure in PTTUT from 60% to 30.31% resulting in the change in investment from
being a subsidiary (with elimination) to an investment in associates. The goodwill of PTTUT arises from the merger of the
Company (PTTCH + PTTAR) fell to 633 million baht as well as intangible assets of PTTUT were down by 175 million baht
resulted from the change in shareholding structure. However, due to the increased in loans to companies such as Myriant of
20.95 million or an increase of 616 million baht.
Liabilities
As at September 30, 2013, the Company had total liability of 175,205 MB, decreased 22,812 MB or 12% decrease from December 31, 2012
which resulted mainly from an increase in current liabilities of 9,344 MB or 13% increase and decreased in non-current liabilities of 32,156
MB or 25% decrease.
1) 1) Current liabilities increased 9,344 MB or 14% increase from the following reasons:
• Short term loan from financial institution increased 1,235 MB or 43% increase, due to sale discounted of AR Factoring in
Vencorex which of 1,580 MB in order to continually implement in working capital on operation activities. While, overdraft loan
from Account receivable (Vencorex) decreased by 312 MB, resulting from less borrowing from financial institution.
• Account payable decreased 4,110 MB or 11% decrease, mainly due to the declining in account payable of Petroleum
Business Unit by 3,992 MB. The acquisition of product liabilities during transportation became lessen in line with account
payable of Olefins and Polymers Business Unit decreasing which of 2,533 MB. The main reason was that the contract
• However, account payable in Aromatics Business Unit increased 2,545 MB, resulting from higher demand of feedstock since
the end of the year 2012 to prepare it before Aromatics plant shut down during January 2013. Additionally, account payable of
PPCL increased 357 MB from GPSC (Merger and Acquisition between PTTUT and IPT). After changing structure and
shareholders’ ratio of PTTUT, this also affected to account payable of PPCL. Furthermore, account payable of Emery climbed
up this quarter from the end of year 2012(Low Season), mainly due to much lower utilization during that low season. Lastly,
account payable in PTTME decreased by 254 MB from hiring the sub contract for BV Project and Phenol Tank.
• Other Account Payable decreased 1,107 MB or 12% decrease as a result of declining in accrued interest expense, employee
benefit expenses such as Bonus in January, accrued Loyalty fee of PPCL and other account payable of PTTUT which
decreased by 196 MB, 140 MB, 292 MB and 285 MB, respectively.
• Account Payable (contractors) decreased by 871 MB or 25% decrease, mainly due to the diminishing of the contractor of
PTTGC by 1,152 MB which PTTGC gradually repaid that amount to contractors in 3Q/2013 amid the finished project. However,
the contractor of PPCL increased to 357 MB from Phenol II Project.
• Long term loan payable within one year increased 13,873 MB or 102% increase. A large amount of loan increasing in this
quarter was come from rearranging of debenture with the maturity within one year (EX-AR), due April 2013, which be classified
and included in the current asset item. This debenture accounted for 15,000 MB. In addition, PPA value of this debenture was
taken into consider by another 164 MB. Another factor was that long term loan due within one year of PTTUT which totally
decreased of 1,796 MB. This resulted from changing structure and shareholders’ ratio of PTTUT.

(Translation)
Page | 18 INVESTOR RELATIONS [email protected]
Management Discussion and Analysis 3Q/2013
• Corporate income tax payable decrease 292 MB due to corporate income tax payable as at end 3Q/2013 was corporate
income tax payable for 3Q/2013 only. This is due to corporate income tax paid for first half of 2013 in August. As for as at
year end 2012, corporate income tax payable include second half corporate income tax. In addition, corporate income tax
rate decreased from 23% to 20%.
• Current other liability increased 616 MB or 54% increased due from
o Derivative increased 972 MB of which are PTTGC 827 MB from sell forward contract increased to 473 MB
and cross currency swap (CCS) for change in US liability to baht liability, increased 500 MUSD. The trend
of baht appreciate over CCS the Company had done. This resulted in loss from mark to market the
derivative. In addition, PPCL had buy forward and CCS contract which resulted in mark to market loss of
122 MB from the forward contract at higher rate than baht value at end 3Q/2013
o Current liability decreased 356 MB due mainly from a decrease in fuel fund payable of 114 MB from fuel
fund contribution rate that has decreased from 1.5 baht/kg to 0.8 baht/kg. Withholding tax paid payable for
USD bond interest decreased 35 MB from paying off interest payments and filing of tax, on September 19,
2012. As the end of year balances from 19 September 2012 to the end of the year. Also, VAT payable
decreased 157 MB from defer Vat as at year end 2012 of PTTPE for land purchase pending tax invoice.
2) Non-current liability decreased 32,156 MB or 25% decrease which mainly due to:
• Long-term loan decreased 31,417 MB or decreased 26% due mainly to a decrease in long term loan of PTTUT’s whole amount of
12,191 MB from change is shareholding portion in PTTUT. Also, PTTGC has repaid long term loan of 4,752 MB of which are
revolving 2,000 MB. There was a reclassified of loan due within one year to current liability of 15,114 MB (payable in April 2015).
The depreciation of 0.75 baht / USD (referring to average BOT at end of 3Q/2013 at 31.53 baht/ USD and end of year 2012 at
30.78 baht/USD) which led to an increase in USD bond value in baht of 975 MB
Shareholder’s Equity
As of September 30, 2013, the Company recorded total shareholders’ of 236,989 MB decreased 1,056 MB from December 31, 2012. The
Company’s equity portion increased 7,809 MB or 4% increase due to the Company’s net profit of 25,857 MB and an increase in
shareholding portion of PPCL from 60% to 100% in the amount of 80 MB. Also, dividend was paid for 18,347 MB and loss in the foreign
currency translation differences for in international operations of by 316 MB and loss from financial derivative valuation to reduce risk of
cash flow for 97 MB.
Statement of Cash Flows
Statement of cash flows of 9 months ending September 30, 2013 the Company had net cash from operating activities of 39,481 MB, net
cash used in investing activities of 26,647 MB mainly from investment in subsidiaries, net cash used in financing activities of 27,515 MB
from repaying long-term loan, debenture, and dividend. Therefore, the Company had cash and cash equivalents at ending 3Q/2013 of
12,821 MB from 31,269 MB at the beginning of the quarter. Cash and cash equivalent and short term investment totaled to 49,571 MB

(Translation)
Page | 19 INVESTOR RELATIONS [email protected]
Management Discussion and Analysis 3Q/2013
Key Financial Ratios
Financial Ratios 3Q/2013 2Q/2013 1Q/2013 4Q/2013
(Restate)
Current Ratio 1.86 1.92 2.51 2.31
EBITDA to sales revenue 11.19% 11.51% 10.27% 10.16%
Net Profits to sales revenues 6.61% 7.17% 6.35% 6.04%
Return on total assets 10.50% 11.80% 11.13% 10.43%
Return on equity 16.11% 17.09% 16.39% 16.15%
Interest Bearing Debt to equity 0.51 0.51 0.48 0.57
Net interest bearing debt to equity 0.30 0.26 0.25 0.32
Net interest bearing debt to EBITDA 1.18 0.98 1.06 1.34
Note:
Current ratio = Current assets divided by current liabilities
EBITDA to sales revenue = EBITDA divided by sales revenue (for the last 4 quarters)
Net profit on sale revenue = Net profit divided by sales revenue (for the last 4 quarters)
Return on total assets = Net profit (for the last 4 quarters) divided by average total assets
Return on equity = Net profit (for the last 4 quarters) divided by average total shareholder’s equity
Interest Bearing Debt to Shareholders’ Equity = Interest Barring Debt divided by shareholder’s equity
Net Interest Bearing Debt to Shareholders’ Equity = Interest Barring Debt net from cash and cash equivalent and current
investments divided by shareholder’s equity
Net Interest Bearing Debt to EBITDA = Interest Barring Debt net from cash and cash equivalent and current
investments divided by EBITDA (for the last 4 quarters)
(Translation)
Page | 20 INVESTOR RELATIONS [email protected]
Management Discussion and Analysis 3Q/2013
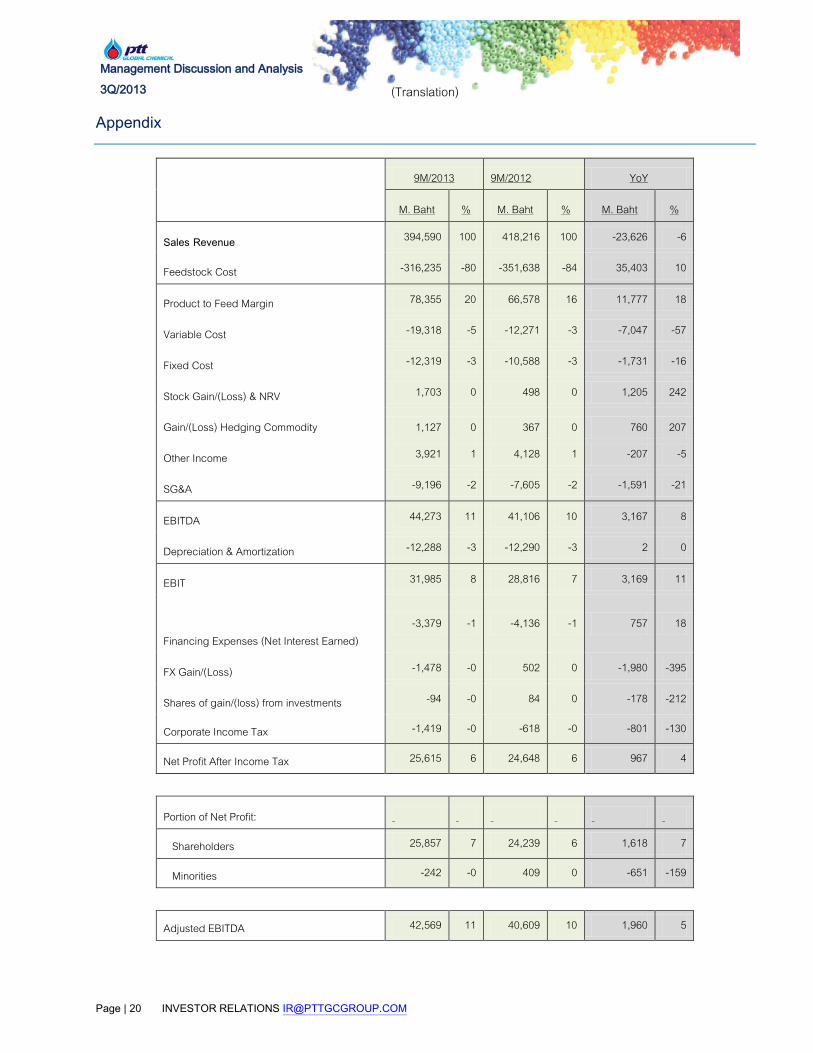
Appendix
9M/2013 9M/2012 YoY
M. Baht % M. Baht % M. Baht %
Sales Revenue 394,590 100 418,216 100 -23,626 -6
Feedstock Cost -316,235 -80 -351,638 -84 35,403 10
Product to Feed Margin 78,355 20 66,578 16 11,777 18
Variable Cost -19,318 -5 -12,271 -3 -7,047 -57
Fixed Cost -12,319 -3 -10,588 -3 -1,731 -16
Stock Gain/(Loss) & NRV 1,703 0 498 0 1,205 242
Gain/(Loss) Hedging Commodity 1,127 0 367 0 760 207
Other Income 3,921 1 4,128 1 -207 -5
SG&A -9,196 -2 -7,605 -2 -1,591 -21
EBITDA 44,273 11 41,106 10 3,167 8
Depreciation & Amortization -12,288 -3 -12,290 -3 2 0
EBIT 31,985 8 28,816 7 3,169 11
Financing Expenses (Net Interest Earned) -3,379 -1 -4,136 -1 757 18
FX Gain/(Loss) -1,478 -0 502 0 -1,980 -395
Shares of gain/(loss) from investments -94 -0 84 0 -178 -212
Corporate Income Tax -1,419 -0 -618 -0 -801 -130
Net Profit After Income Tax 25,615 6 24,648 6 967 4
Portion of Net Profit:
Shareholders 25,857 7 24,239 6 1,618 7
Minorities -242 -0 409 0 -651 -159
Adjusted EBITDA 42,569 11 40,609 10 1,960 5