Embed Size (px)
Citation preview
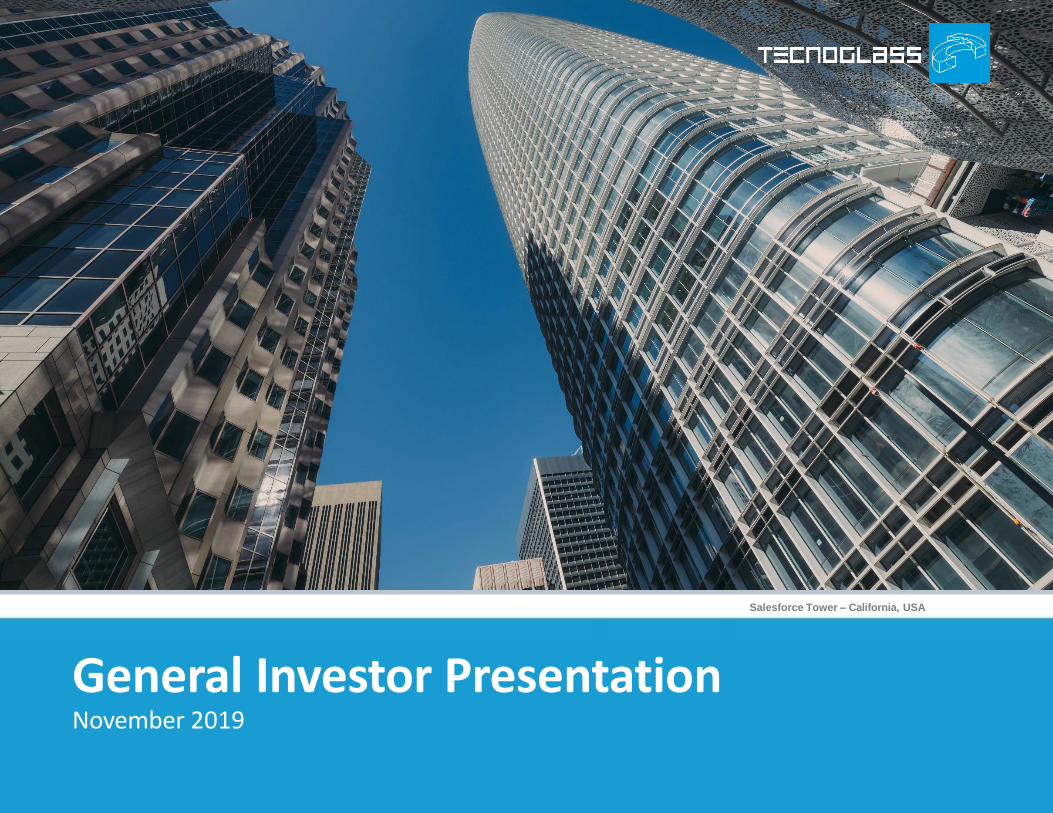
General Investor PresentationNovember 2019
Salesforce Tower – California, USA
Disclaimer
2
DisclaimerThis presentation (including any information which has been or may be supplied in writing or orally in connection herewith or in connection with any further inquiries, this “Presentation”) containsinformation regarding Tecnoglass Inc. and its subsidiaries, as applicable, where it holds a direct or indirect interest (together “Tecnoglass” or the “Company”) that is confidential and proprietary tothe Company. We have prepared this document solely for informational purposes. You should not definitively rely upon it or use it to form the definitive basis for any decision, contract, commitmentor action whatsoever, with respect to any proposed transaction or otherwise. By participating in this Presentation, each participant agrees to the terms hereof, as follows: Each participant will andwill cause its directors, officers, employees, affiliates, agents, advisors and representatives to use the information contained in this Presentation only to evaluate the proposed transaction in respectof the Company and may not communicate, reproduce, distribute or disclose it to any other person, or refer to it publicly, in whole or in part at any time except with our prior written consent. If youare not the intended recipient of this document, please delete and destroy all copies immediately.
Neither the Company nor any of its representatives makes any representation or warranty, express or implied, as to the accuracy or completeness of the information contained in this Presentation,and nothing contained herein is, or shall be relied upon as, a promise or representation, whether as to the past or the future. Only those representations and warranties that are made in a definitivewritten agreement relating to a transaction in respect of the Company, when and if executed, and subject to any limitations and restrictions as may be specified in such definitive agreement, shallhave any legal effect.
This Presentation does not purport to contain all of the information that may be required to evaluate a potential transaction in respect of the Company, and any person participating in thisPresentation should conduct its own independent investigation and analysis.
Forward Looking StatementsThis presentation includes certain forward-looking statements within the meaning of the Private Securities Litigation Reform Act of 1995. including statements regarding future financialperformance. future growth and future acquisitions. These statements are based on Tecnoglass’ current expectations or beliefs and are subject to uncertainty and changes in circumstances. Actualresults may vary materially from those expressed or implied by the statements herein due to changes in economic. business. competitive and/or regulatory factors. and other risks and uncertaintiesaffecting the operation of Tecnoglass’ business. These risks. uncertainties and contingencies are indicated from time to time in Tecnoglass’ filings with the Securities and Exchange Commission. Theinformation set forth herein should be read in light of such risks. Further. investors should keep in mind that Tecnoglass’ financial results in any particular period may not be indicative of futureresults. Tecnoglass is under no obligation to. and expressly disclaims any obligation to. update or alter its forward-looking statements. whether as a result of new information. future events. changesin assumptions or otherwise.
Financial PresentationCertain of the financial information contained herein is unaudited and does not conform to SEC Regulation S-X. Furthermore. it includes EBITDA (earnings before interest. taxes depreciation andamortization) which is a non-GAAP financial measure as defined by Regulation G promulgated by the SEC under the Securities Act of 1933. as amended. Accordingly, such information may bematerially different when presented in Tecnoglass’ filings with the Securities and Exchange Commission. Tecnoglass believes that the presentation of this non-GAAP financial measure providesinformation that is useful to investors as it indicates more clearly the ability of Tecnoglass to meet capital expenditures and working capital requirements and otherwise meet its obligations as theybecome due. EBITDA was derived by taking earnings before interest. taxes. depreciation and amortization as adjusted for certain one-time non-recurring items and exclusions.
No offer or solicitationThis announcement is not intended to and does not constitute an offer to sell or the solicitation of an offer to subscribe for or buy or an invitation to purchase or subscribe for any securities or thesolicitation of any vote or approval in any jurisdiction. nor shall there be any sale. issuance or transfer of securities in any jurisdiction in contravention of applicable law. No offer of securities shall bemade except by means of a prospectus meeting the requirements of Section 10 of the Securities Act of 1933. asamended.

Tecnoglass at a GlanceOverview
Note:1. 2015 and 2016 financial Information has been retroactively adjusted to reflect the acquisition under common control of ES Windows. 2017 financial statements include 10 months of GM&P’s operations after
being acquired in March 1, 2017.2. See the Appendix for a reconciliation of non-GAAP financial measures to the most closely comparable GAAPmeasure.
3
Leading Position in U.S. MarketTrack Record of Revenue Growth(1)
2018CAGR ‘12 – LTM Q3‘19:19,2%
U.S.
Other Countries
80%
Colombia17%
Six Strategic Brands
Key Stats
$427.4MLTM Q3’19 Revenue
~22%LTM Q3’19Adjusted
EBITDA Margin (2)
~19.2%2012 – LTM
Q3’19 RevenueCAGR
~24%2012 – LTM Q3’19
Adjusted EBITDA CAGR (2)
Tecnoglass is a leading architectural glass manufacturer in North, Central and South America with vertically integrated operations under one roof
130.3
183.3 197.5
242.2
305.0 314.5
371.0
427.4
2012 2013 2014 2015 2016 2017 2018 LTM 3Q'19
86%
12%
2%

4
Global Leader in Architectural Glass and WindowsSupplying Architectural Glass Products to Landmark Properties in the U.S and Latin America
Via 57 West New York, NY
Wyly Theatre Dallas, TX
El Dorado Airport Bogotá,Colombia
LaSalle School of Business Philadelphia, PA
Astoria Houston,TX
South Miami Dade Cultural Arts Center
Miami, FL
Brickell City Centre Miami, FL
Torre GlobalCiudad de Panamá, Panamá
Santo DomingoAirport Santo Domingo,
Dominican Republic
2929Weslayan Houston, TX
W HotelFt. Lauderdale,FL
WaterwaySquare Houston, TX
Parcel N Washington,DC
HotelMarriott Aruba, Aruba
Bahaia Centro Santa Marta,Colombia
50 United Nations Plaza New York, NY
Grove at GrandBay Miami, FL
FordhamUniversity New York, NY
Ambar Oceanic Santa Marta,Colombia
Ernst & Young Cleveland,OH
Leading manufacturer, distributor and installer of high-spec architectural glass and windows for commercial and residential applications
Global presence with leadership position inU.S. and other markets, completing projects inover 20 countries
30+ year track record of product innovation and reputation for quality
Broad portfolio of products specified across a well-diversified base of over 1,000 customers
Vertically integrated, state-of‐the‐art manufacturing complex with significant recent capital investments
Strategic, cost-efficient business model providing a significant structural competitive advantage and high barriers to entry
Highly skilled, loyal employee base led by an experienced management team
Double-digit organic growth track recordwith strong margins
5
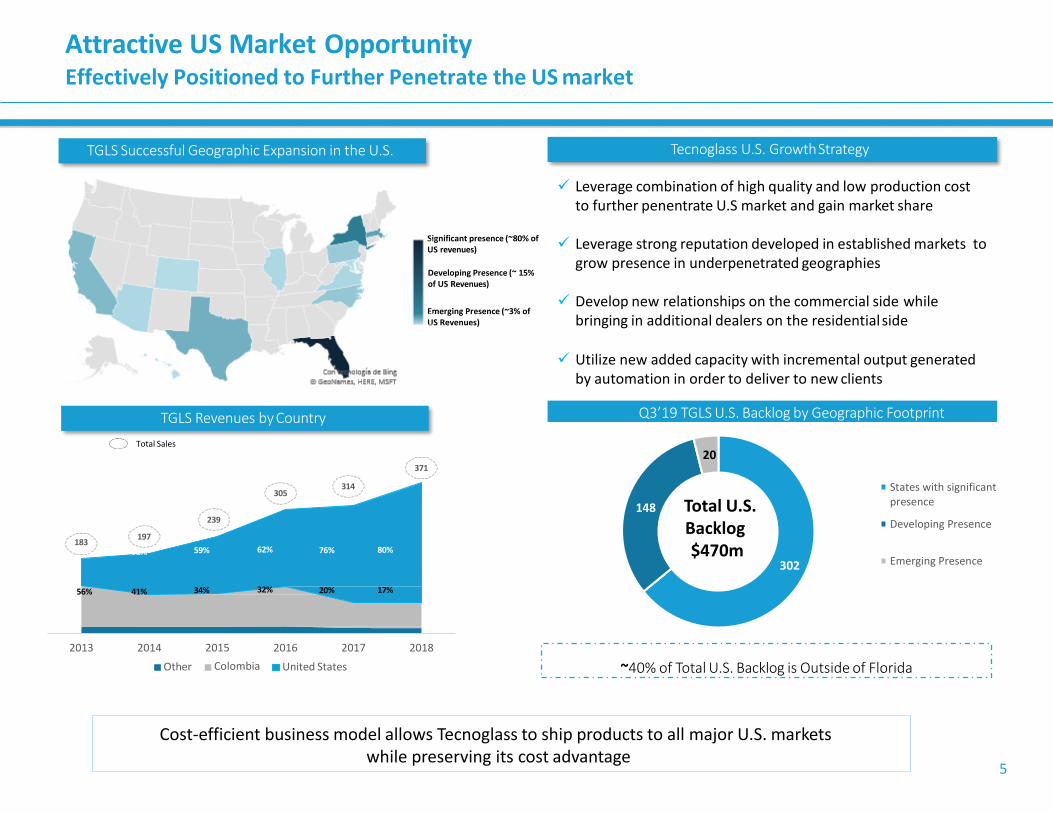
Attractive US Market OpportunityEffectively Positioned to Further Penetrate the US market
Significant presence (~80% of US revenues)
Developing Presence (~ 15% of US Revenues)
Emerging Presence (~3% of US Revenues)
239
305314
371
2013 2014 2016 2017 2018
Other
2015
Colombia United States
Total Sales
18336%
197
51% 59% 62% 76% 80%
56% 41% 34% 32% 20% 17%
TGLS Revenues by Country
83%
14%
Total U.S.Backlog$470m
~40% of Total U.S. Backlog is Outside of Florida
Tecnoglass U.S. GrowthStrategy
Leverage combination of high quality and low production cost to further penentrate U.S market and gain market share
Leverage strong reputation developed in established markets to grow presence in underpenetrated geographies
Develop new relationships on the commercial side whilebringing in additional dealers on the residentialside
Utilize new added capacity with incremental output generated by automation in order to deliver to new clients
Cost-efficient business model allows Tecnoglass to ship products to all major U.S. markets while preserving its cost advantage
TGLS Successful Geographic Expansion in the U.S.
Q3’19 TGLS U.S. Backlog by Geographic Footprint
302
148
20
States with significantpresence
Developing Presence
Emerging Presence
6
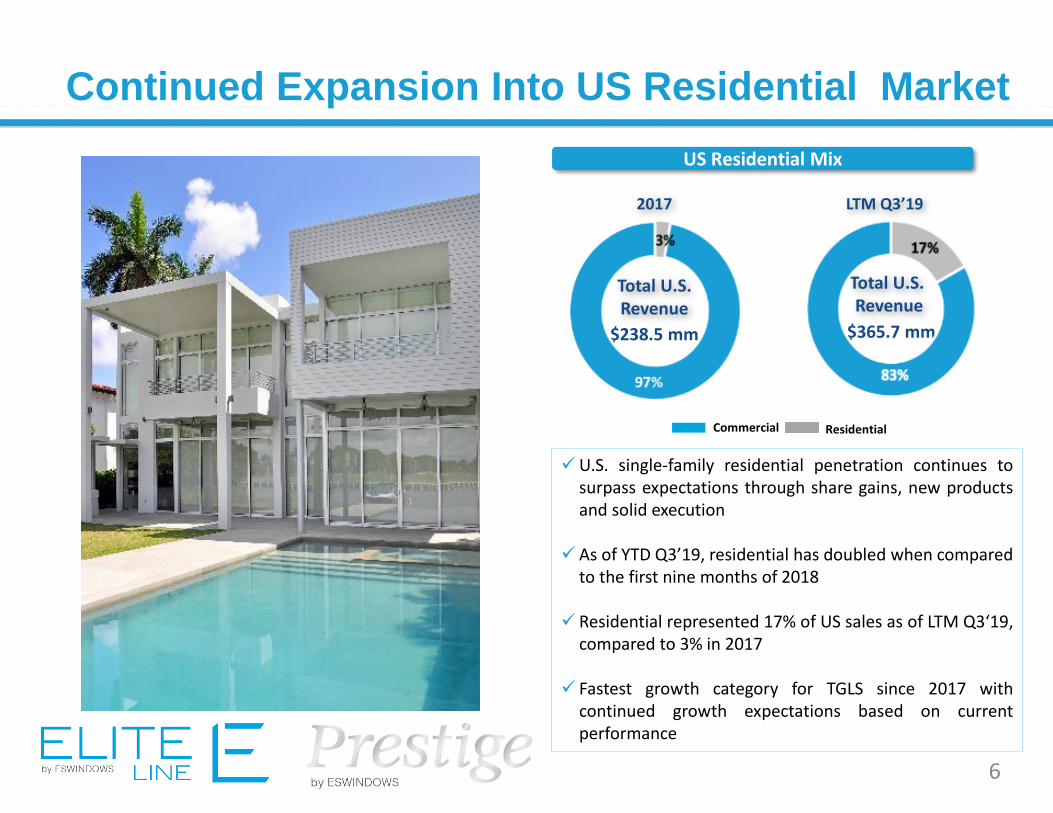
Continued Expansion Into US Residential Market
$238.5 mm
Total U.S.Revenue
US Residential Mix
LTM Q3’192017
$365.7 mm
Total U.S. Revenue
U.S. single-family residential penetration continues tosurpass expectations through share gains, new productsand solid execution
As of YTD Q3’19, residential has doubled when comparedto the first nine months of 2018
Residential represented 17% of US sales as of LTM Q3‘19,compared to 3% in 2017
Fastest growth category for TGLS since 2017 withcontinued growth expectations based on currentperformance
Commercial Residential
6
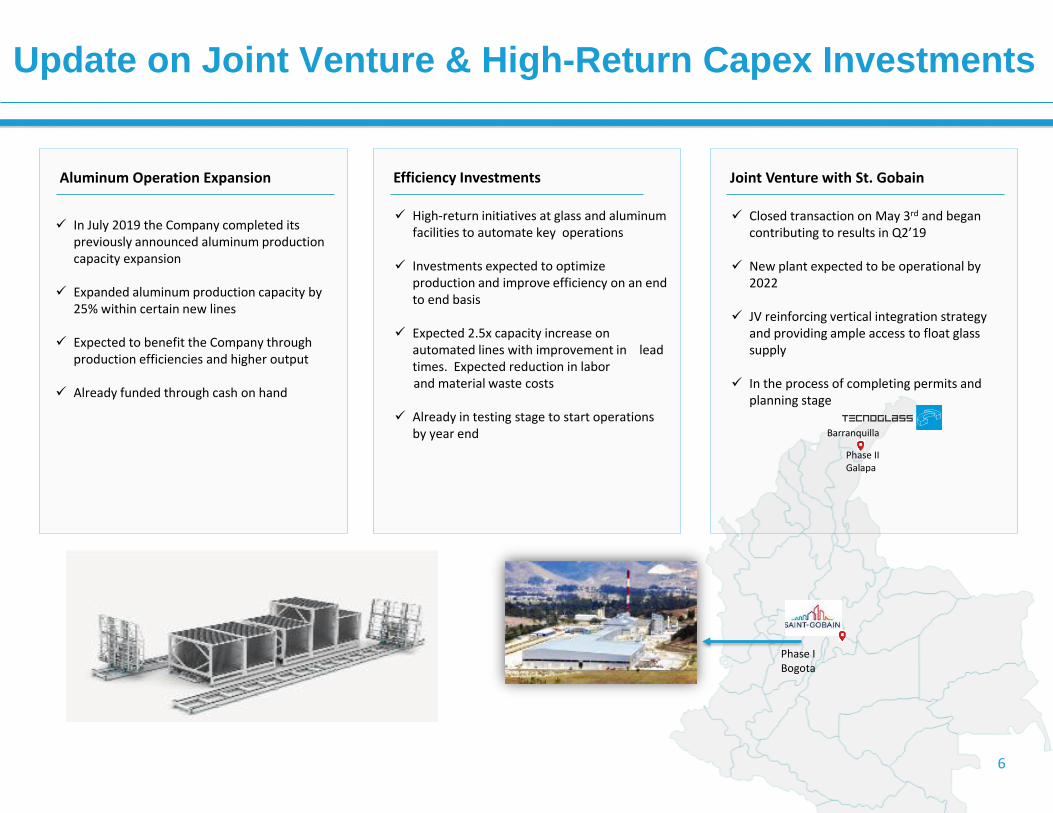
Update on Joint Venture & High-Return Capex Investments
In July 2019 the Company completed its previously announced aluminum production capacity expansion
Expanded aluminum production capacity by 25% within certain new lines
Expected to benefit the Company through production efficiencies and higher output
Already funded through cash on hand
Aluminum Operation Expansion
High-return initiatives at glass and aluminum facilities to automate key operations
Investments expected to optimize production and improve efficiency on an end to end basis
Expected 2.5x capacity increase on automated lines with improvement in lead times. Expected reduction in labor and material waste costs
Already in testing stage to start operations by year end
Efficiency Investments
Closed transaction on May 3rd and began contributing to results in Q2’19
New plant expected to be operational by 2022
JV reinforcing vertical integration strategy and providing ample access to float glass supply
In the process of completing permits and planning stage
Joint Venture with St. Gobain
Phase I Bogota
Phase II Galapa
Barranquilla
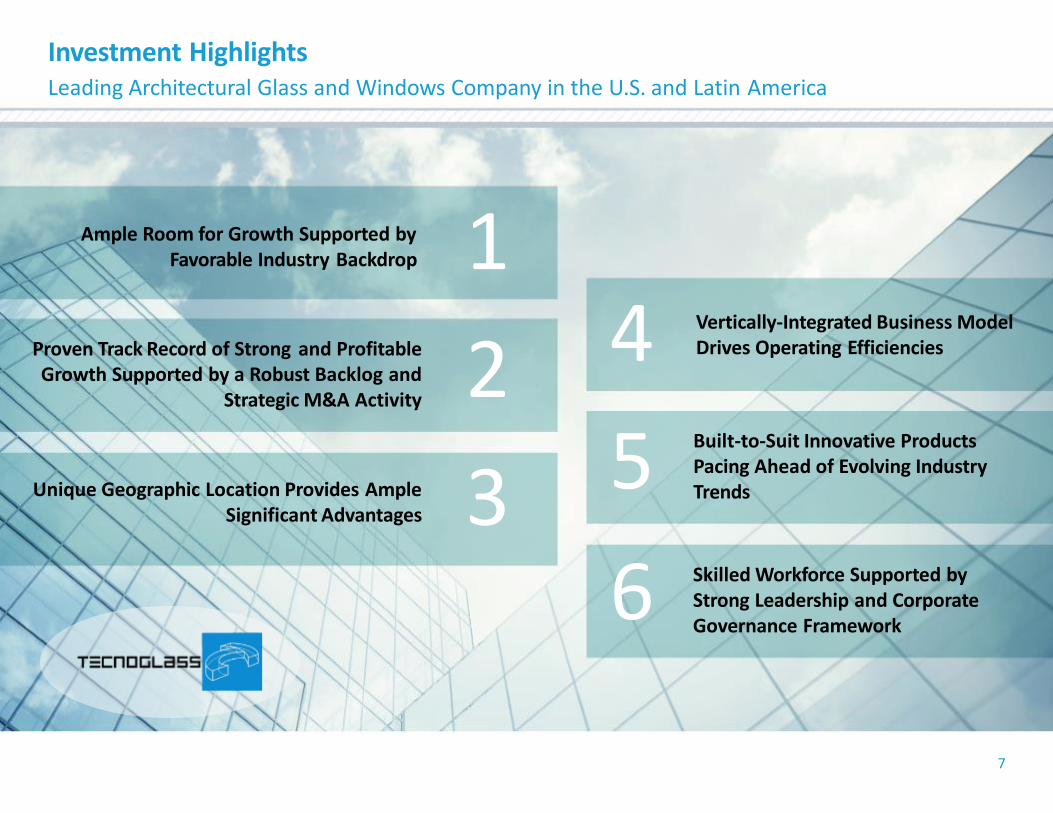
Investment HighlightsLeading Architectural Glass and Windows Company in the U.S. and Latin America
Ample Room for Growth Supported by Favorable Industry Backdrop
Vertically-Integrated Business Model Drives Operating EfficienciesProven Track Record of Strong and Profitable
Growth Supported by a Robust Backlog andStrategic M&A Activity
Unique Geographic Location Provides AmpleSignificant Advantages
Built-to-Suit Innovative Products Pacing Ahead of Evolving Industry Trends
Skilled Workforce Supported by Strong Leadership and Corporate Governance Framework
4
5
6
1
2
3
7
8
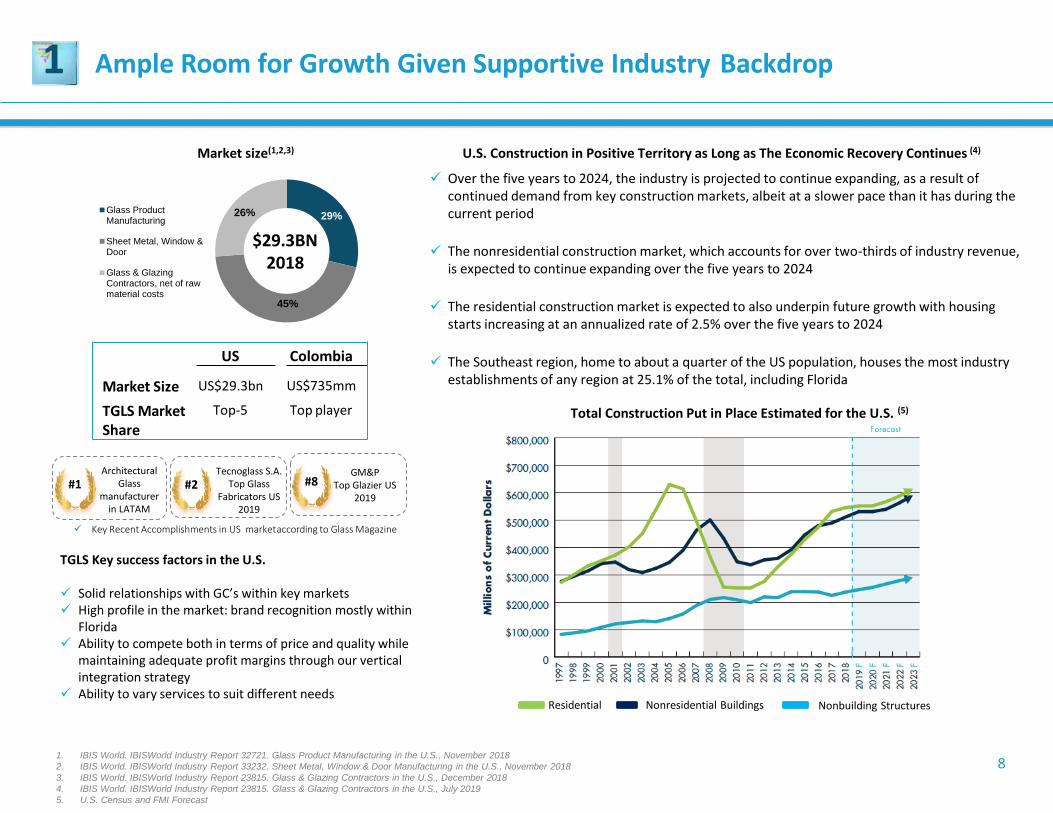
$29.3BN 2018
US Colombia
Market Size US$29.3bn US$735mm
TGLS MarketShare
Top-5 Top player
Over the five years to 2024, the industry is projected to continue expanding, as a result of continued demand from key construction markets, albeit at a slower pace than it has during the current period
The nonresidential construction market, which accounts for over two-thirds of industry revenue, is expected to continue expanding over the five years to 2024
The residential construction market is expected to also underpin future growth with housing starts increasing at an annualized rate of 2.5% over the five years to 2024
The Southeast region, home to about a quarter of the US population, houses the most industry establishments of any region at 25.1% of the total, including Florida
Key Recent Accomplishments in US marketaccording to Glass Magazine
1. IBIS World. IBISWorld Industry Report 32721. Glass Product Manufacturing in the U.S., November 2018
2. IBIS World. IBISWorld Industry Report 33232. Sheet Metal, Window & Door Manufacturing in the U.S., November 2018
3. IBIS World. IBISWorld Industry Report 23815. Glass & Glazing Contractors in the U.S., December 2018
4. IBIS World. IBISWorld Industry Report 23815. Glass & Glazing Contractors in the U.S., July 2019
5. U.S. Census and FMI Forecast
Ample Room for Growth Given Supportive Industry Backdrop1
Residential Nonresidential Buildings Nonbuilding Structures
Total Construction Put in Place Estimated for the U.S. (5)
29%
45%
26%Glass ProductManufacturing
Sheet Metal, Window &Door
Glass & GlazingContractors, net of rawmaterial costs
#2Tecnoglass S.A.
Top Glass Fabricators US
2019
#1Architectural
Glass manufacturer
in LATAM
#8GM&P
Top Glazier US2019
TGLS Key success factors in the U.S.
Solid relationships with GC’s within key markets High profile in the market: brand recognition mostly within
Florida Ability to compete both in terms of price and quality while
maintaining adequate profit margins through our vertical integration strategy
Ability to vary services to suit different needs
Market size(1,2,3) U.S. Construction in Positive Territory as Long as The Economic Recovery Continues (4)
2
Figures in US$mm
9
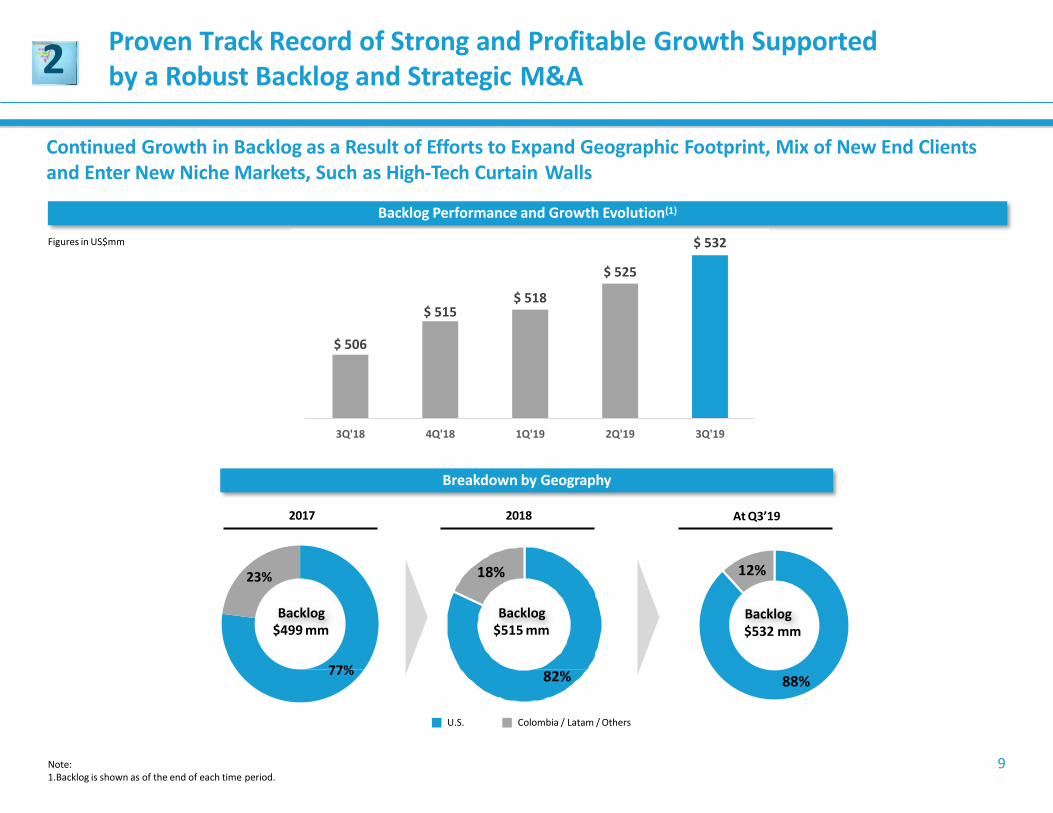
Proven Track Record of Strong and Profitable Growth Supported by a Robust Backlog and Strategic M&A
Breakdown by Geography
Backlog Performance and Growth Evolution(1)
Continued Growth in Backlog as a Result of Efforts to Expand Geographic Footprint, Mix of New End Clients and Enter New Niche Markets, Such as High-Tech Curtain Walls
Note:1.Backlog is shown as of the end of each time period.
Colombia / Latam / OthersU.S.
Backlog$499 mm
Backlog$515 mm
77%
23%
82%
18%
2017 2018 At Q3’19
$532 mmBacklog
$ 506
$ 515$ 518
$ 525
$ 532
490
495
500
505
510
515
520
525
530
535
3Q'18 4Q'18 1Q'19 2Q'19 3Q'19
88%
12%
2
10
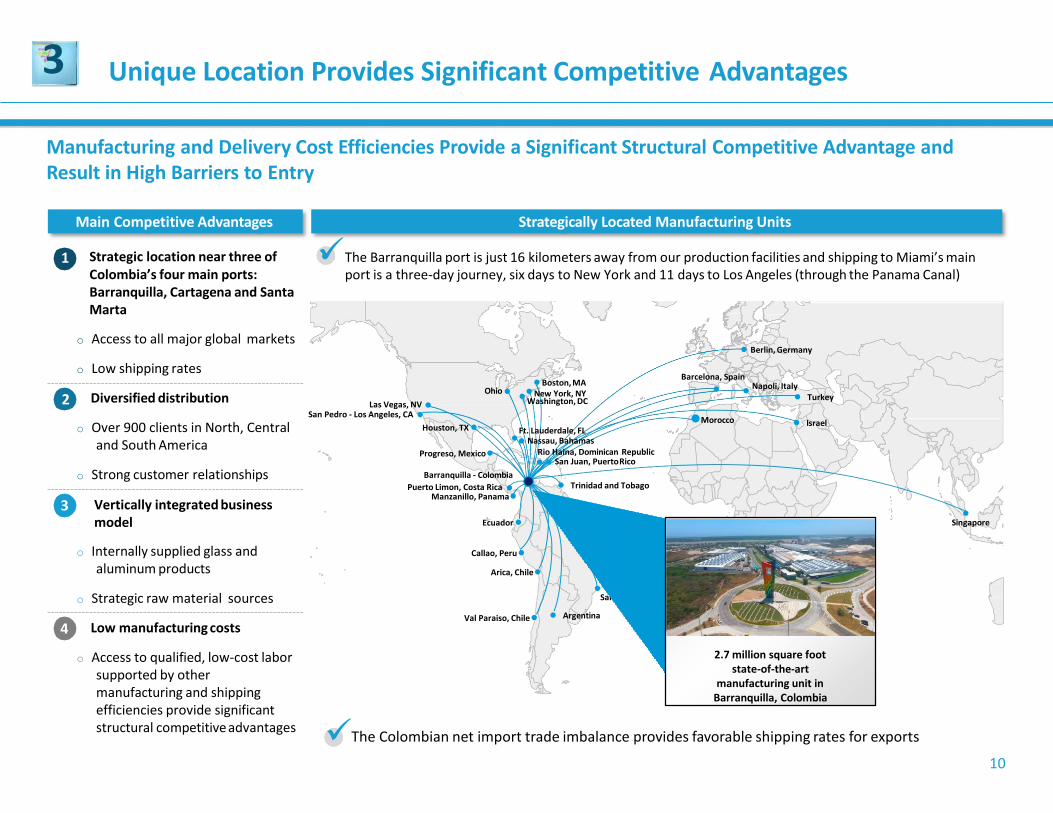
Unique Location Provides Significant Competitive Advantages3
Barranquilla - Colombia
Puerto Limon, Costa Rica
Manzanillo, Panama
Progreso, Mexico
Singapore
Morocco Israel
Turkey
Barcelona, SpainNapoli, Italy
Ecuador
Trinidad and Tobago
Brazil
Ft. Lauderdale, FL
ArgentinaVal Paraiso, Chile
Callao, Peru
Arica, Chile
Washington, DCLas Vegas, NV
San Pedro - Los Angeles, CA
Houston, TX
Boston, MA
New York, NYOhio
Nassau, Bahamas
Rio Haina, Dominican Republic San Juan, PuertoRico
Rio de Janeir Santos, Brazil
o, Brazil
Berlin, Germanyo Access to all major global markets
o Low shipping rates
Diversified distribution
o Over 900 clients in North, Central and South America
o Strong customer relationships
o Internally supplied glass and aluminum products
o Strategic raw material sources
Low manufacturing costs
o Access to qualified, low-cost labor supported by other manufacturing and shipping efficiencies provide significant structural competitiveadvantages
Manufacturing and Delivery Cost Efficiencies Provide a Significant Structural Competitive Advantage and Result in High Barriers to Entry
Main Competitive Advantages Strategically Located Manufacturing Units
1 Strategic location near three of Colombia’s four main ports: Barranquilla, Cartagena and Santa Marta
2
3 Vertically integrated business model
4
The Colombian net import trade imbalance provides favorable shipping rates for exports
The Barranquilla port is just 16 kilometers away from our production facilities and shipping to Miami’s mainport is a three-day journey, six days to New York and 11 days to Los Angeles (through the Panama Canal)
2.7 million square foot state-of-the-art
manufacturing unit in Barranquilla, Colombia
11
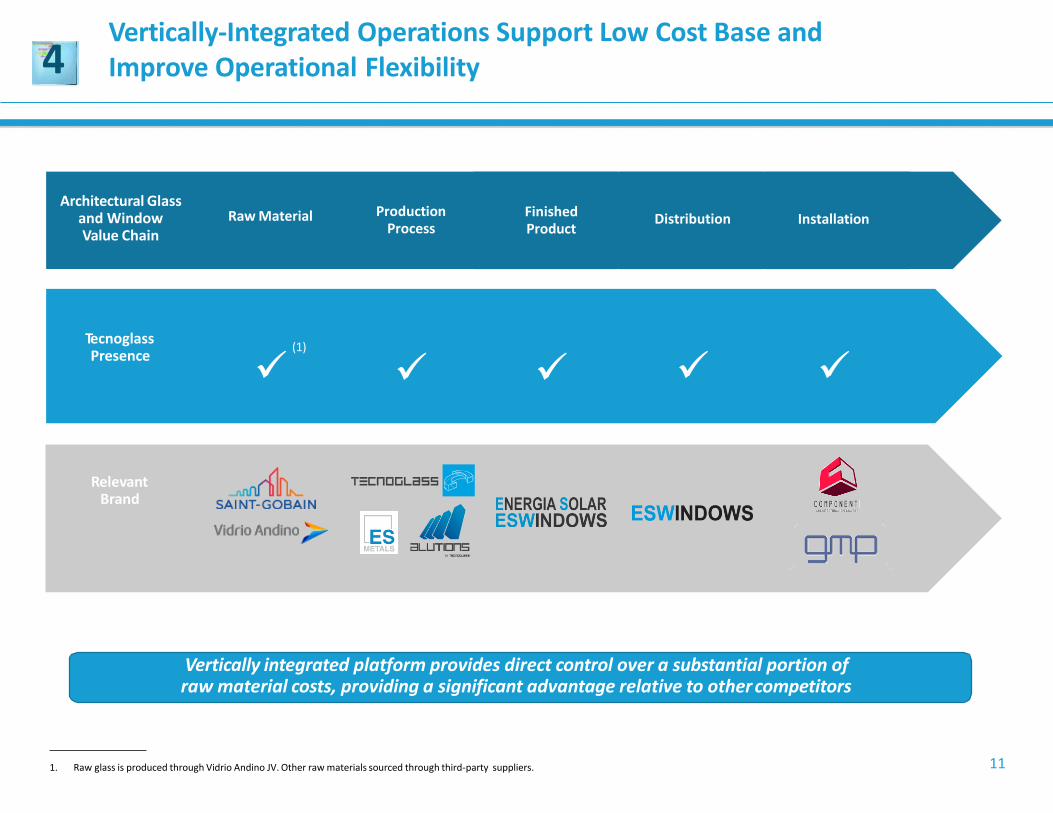
4Vertically-Integrated Operations Support Low Cost Base and Improve Operational Flexibility
Vertically integrated platform provides direct control over a substantial portion of raw material costs, providing a significant advantage relative to other competitors
Tecnoglass Presence
Relevant Brand
Architectural Glass and Window Value Chain
Production Process
Installation
(1)
Finished Product
Distribution
Raw Material
1. Raw glass is produced through Vidrio Andino JV. Other raw materials sourced through third-party suppliers.
5 Built-to-Suit Innovative Products Pacing Ahead of Evolving Industry Trends
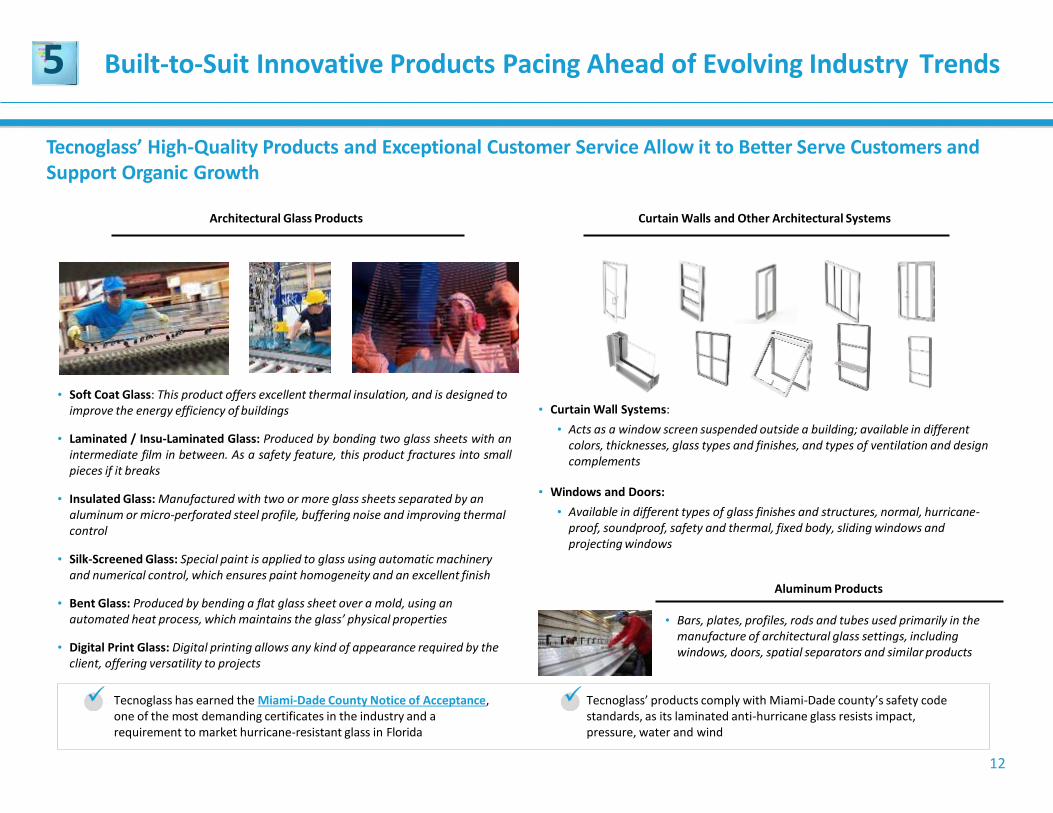
Tecnoglass’ High-Quality Products and Exceptional Customer Service Allow it to Better Serve Customers and Support Organic Growth
• Soft Coat Glass: This product offers excellent thermal insulation, and is designed to improve the energy efficiency of buildings
• Laminated / Insu-Laminated Glass: Produced by bonding two glass sheets with anintermediate film in between. As a safety feature, this product fractures into smallpieces if it breaks
• Insulated Glass: Manufactured with two or more glass sheets separated by an aluminum or micro-perforated steel profile, buffering noise and improving thermal control
• Silk-Screened Glass: Special paint is applied to glass using automatic machinery and numerical control, which ensures paint homogeneity and an excellent finish
• Bent Glass: Produced by bending a flat glass sheet over a mold, using an automated heat process, which maintains the glass’ physical properties
• Digital Print Glass: Digital printing allows any kind of appearance required by the client, offering versatility to projects
• Curtain Wall Systems:
• Acts as a window screen suspended outside a building; available in different colors, thicknesses, glass types and finishes, and types of ventilation and design complements
• Windows and Doors:
• Available in different types of glass finishes and structures, normal, hurricane-proof, soundproof, safety and thermal, fixed body, sliding windows and projecting windows
• Bars, plates, profiles, rods and tubes used primarily in the manufacture of architectural glass settings, including windows, doors, spatial separators and similar products
Tecnoglass has earned the Miami-Dade County Notice of Acceptance, one of the most demanding certificates in the industry and a requirement to market hurricane-resistant glass in Florida
Tecnoglass’ products comply with Miami-Dade county’s safety code standards, as its laminated anti-hurricane glass resists impact, pressure, water and wind
12
Architectural Glass Products Curtain Walls and Other Architectural Systems
Aluminum Products
13
6
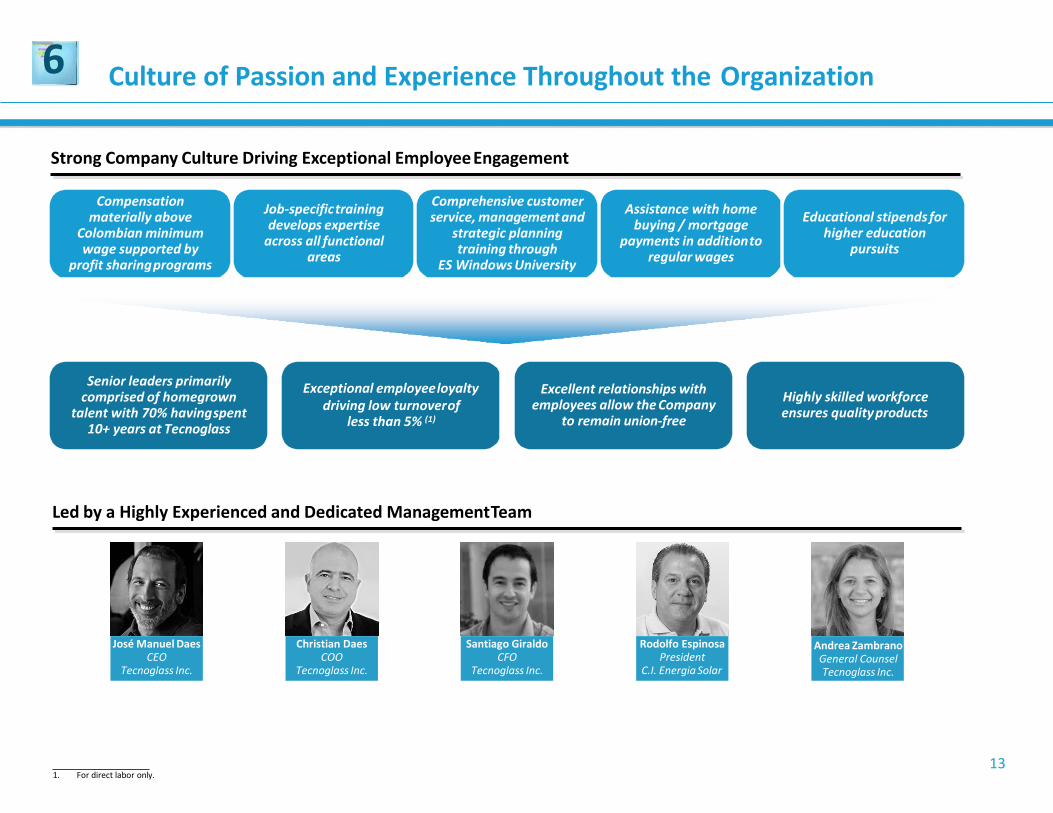
Strong Company Culture Driving Exceptional EmployeeEngagement
José Manuel DaesCEO
Tecnoglass Inc.
Christian DaesCOO
Tecnoglass Inc.
Rodolfo EspinosaPresident
C.I. Energia Solar
Santiago GiraldoCFO
Tecnoglass Inc.
Andrea Zambrano General Counsel Tecnoglass Inc.
Job-specifictraining develops expertise
across all functional areas
Educational stipends for higher education
pursuits
Assistance with home buying / mortgage
payments in additionto regular wages
Senior leaders primarily comprised of homegrown
talent with 70% havingspent 10+ years at Tecnoglass
Highly skilled workforce ensures qualityproducts
Exceptional employeeloyaltydriving low turnoverof
less than 5% (1)
Led by a Highly Experienced and Dedicated ManagementTeam
Compensation materially above
Colombian minimum wage supported by
profit sharingprograms
Comprehensive customer service, management and
strategic planning training through
ES Windows University
Excellent relationships with employees allow the Company
to remain union-free
1. For direct labor only.
Culture of Passion and Experience Throughout the Organization
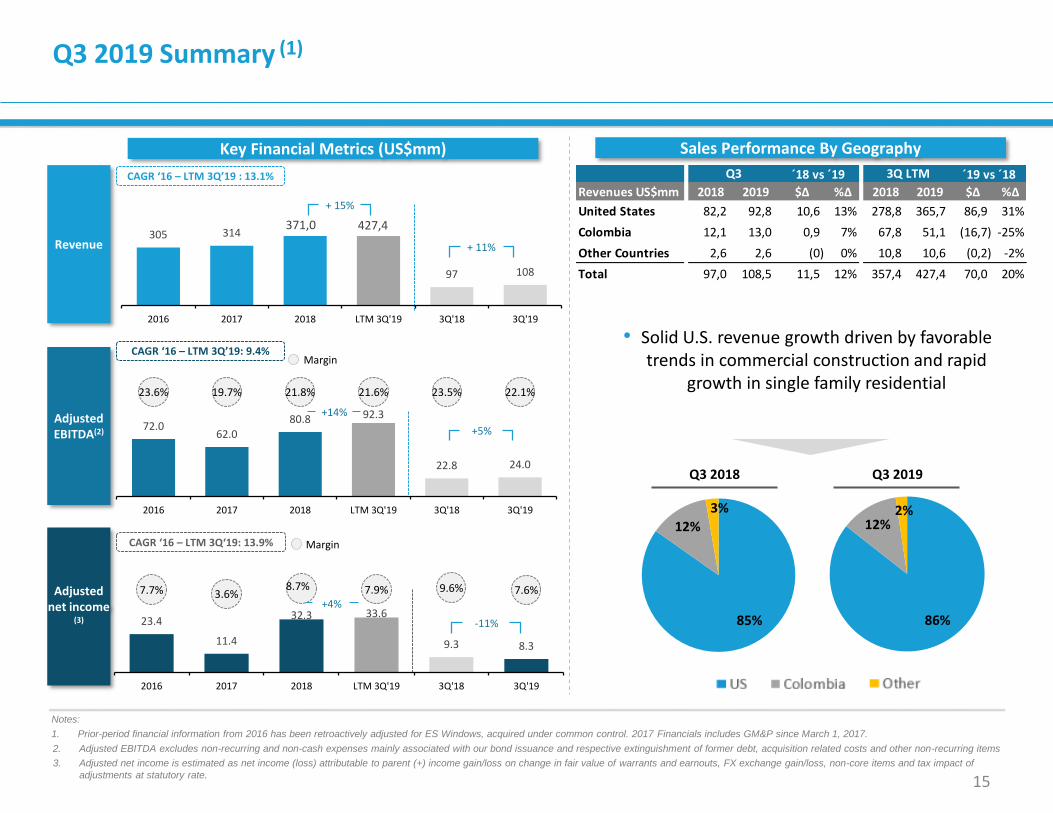
Q3 2019 Summary (1)
15
Sales Performance By GeographyKey Financial Metrics (US$mm)
AdjustedEBITDA(2)
Revenue
CAGR ‘16 – LTM 3Q’19: 9.4%
Adjusted net income
(3)
Q3 2019Q3 2018
Margin
CAGR ‘16 – LTM 3Q’19 : 13.1%
+ 15%
+ 11%
+5%
CAGR ‘16 – LTM 3Q‘19: 13.9% Margin
371,0
Notes:
1. Prior-period financial information from 2016 has been retroactively adjusted for ES Windows, acquired under common control. 2017 Financials includes GM&P since March 1, 2017.
2. Adjusted EBITDA excludes non-recurring and non-cash expenses mainly associated with our bond issuance and respective extinguishment of former debt, acquisition related costs and other non-recurring items
3. Adjusted net income is estimated as net income (loss) attributable to parent (+) income gain/loss on change in fair value of warrants and earnouts, FX exchange gain/loss, non-core items and tax impact of
adjustments at statutory rate.
-11%
• Solid U.S. revenue growth driven by favorable trends in commercial construction and rapid
growth in single family residential
427,4
+14%
+4%
86%
12%2%
85%
12%
3%
23.4
11.4
32.3 33.6
9.3 8.3
7.7% 3.6%8.7% 7.9% 9.6% 7.6%
2016 2017 2018 LTM 3Q'19 3Q'18 3Q'19
305 314
97 108
2016 2017 2018 LTM 3Q'19 3Q'18 3Q'19
72.062.0
80.8 92.3
22.8 24.0
23.6% 19.7% 21.8% 21.6% 23.5% 22.1%
2016 2017 2018 LTM 3Q'19 3Q'18 3Q'19
Revenues US$mm 2018 2019 $Δ %Δ 2018 2019 $Δ %Δ
United States 82,2 92,8 10,6 13% 278,8 365,7 86,9 31%
Colombia 12,1 13,0 0,9 7% 67,8 51,1 (16,7) -25%
Other Countries 2,6 2,6 (0) 0% 10,8 10,6 (0,2) -2%
Total 97,0 108,5 11,5 12% 357,4 427,4 70,0 20%
Q3 ´18 vs ´19 3Q LTM ´19 vs ´18
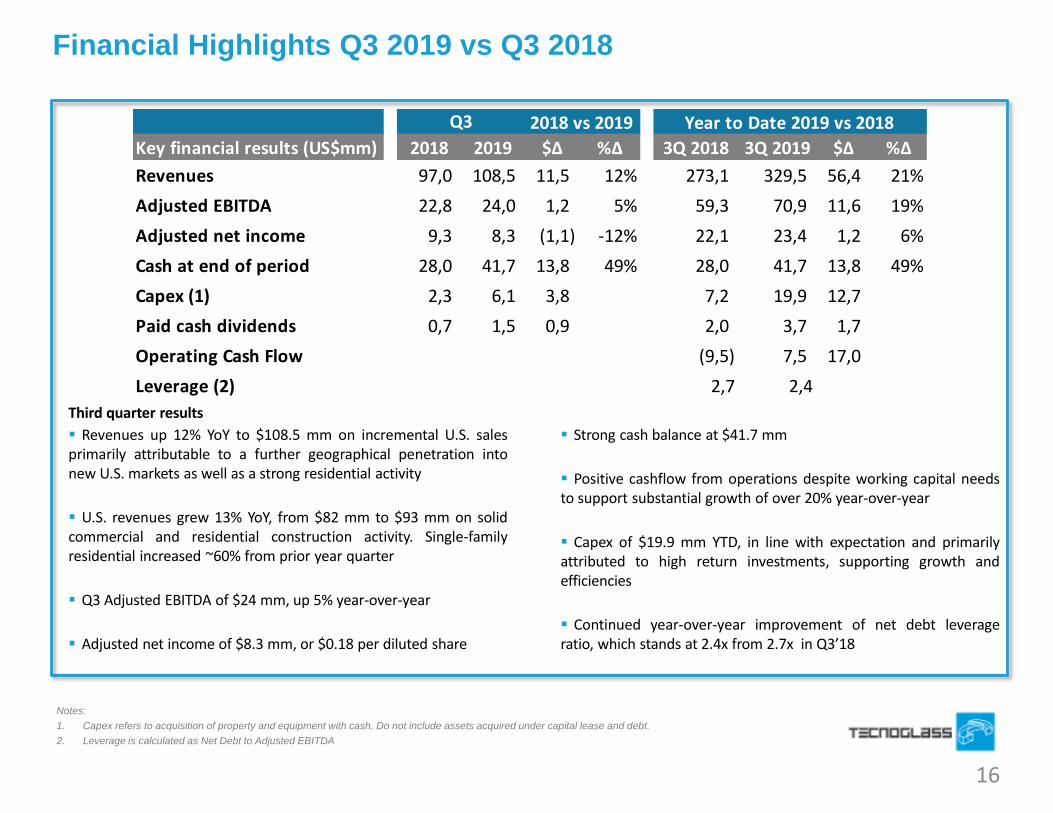
Financial Highlights Q3 2019 vs Q3 2018
16
Notes:
1. Capex refers to acquisition of property and equipment with cash. Do not include assets acquired under capital lease and debt.
2. Leverage is calculated as Net Debt to Adjusted EBITDA
Third quarter results
Revenues up 12% YoY to $108.5 mm on incremental U.S. salesprimarily attributable to a further geographical penetration intonew U.S. markets as well as a strong residential activity
U.S. revenues grew 13% YoY, from $82 mm to $93 mm on solidcommercial and residential construction activity. Single-familyresidential increased ~60% from prior year quarter
Q3 Adjusted EBITDA of $24 mm, up 5% year-over-year
Adjusted net income of $8.3 mm, or $0.18 per diluted share
Strong cash balance at $41.7 mm
Positive cashflow from operations despite working capital needsto support substantial growth of over 20% year-over-year
Capex of $19.9 mm YTD, in line with expectation and primarilyattributed to high return investments, supporting growth andefficiencies
Continued year-over-year improvement of net debt leverageratio, which stands at 2.4x from 2.7x in Q3’18
Key financial results (US$mm) 2018 2019 $Δ %Δ 3Q 2018 3Q 2019 $Δ %Δ
Revenues 97,0 108,5 11,5 12% 273,1 329,5 56,4 21%
Adjusted EBITDA 22,8 24,0 1,2 5% 59,3 70,9 11,6 19%
Adjusted net income 9,3 8,3 (1,1) -12% 22,1 23,4 1,2 6%
Cash at end of period 28,0 41,7 13,8 49% 28,0 41,7 13,8 49%
Capex (1) 2,3 6,1 3,8 7,2 19,9 12,7
Paid cash dividends 0,7 1,5 0,9 2,0 3,7 1,7
Operating Cash Flow (9,5) 7,5 17,0
Leverage (2) 2,7 2,4
Q3 2018 vs 2019 Year to Date 2019 vs 2018
17
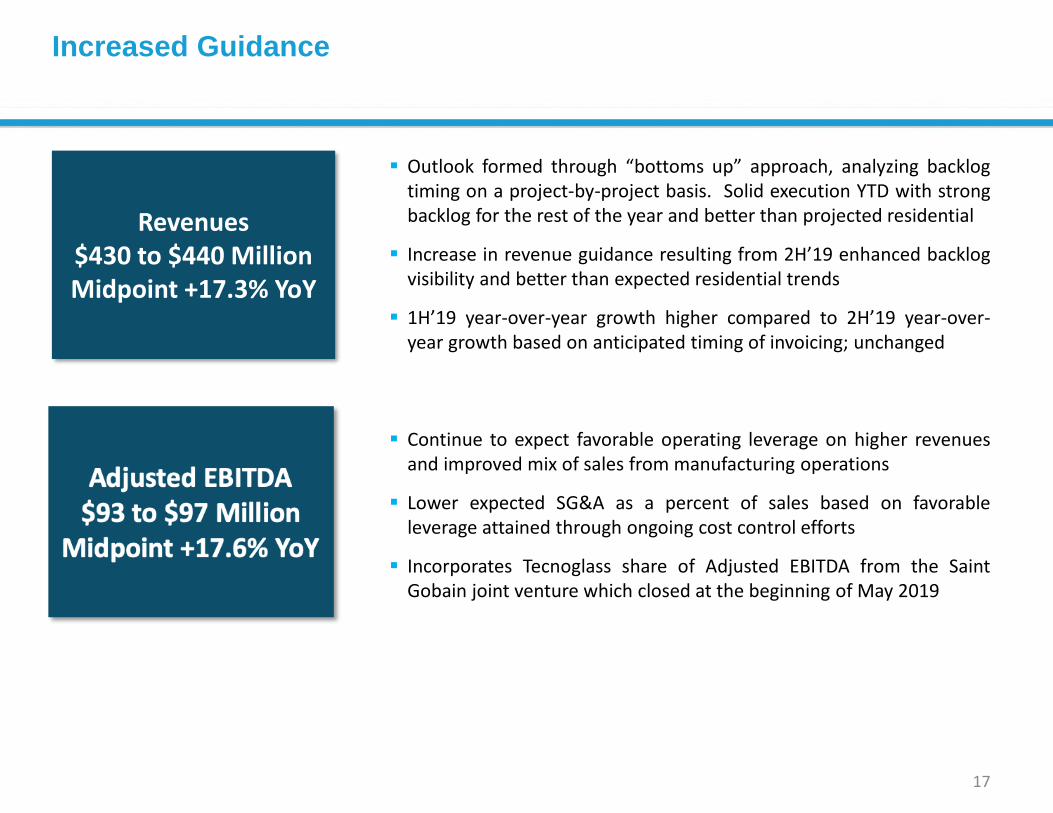
Outlook formed through “bottoms up” approach, analyzing backlogtiming on a project-by-project basis. Solid execution YTD with strongbacklog for the rest of the year and better than projected residential
Increase in revenue guidance resulting from 2H’19 enhanced backlogvisibility and better than expected residential trends
1H’19 year-over-year growth higher compared to 2H’19 year-over-year growth based on anticipated timing of invoicing; unchanged
Increased Guidance
Continue to expect favorable operating leverage on higher revenuesand improved mix of sales from manufacturing operations
Lower expected SG&A as a percent of sales based on favorableleverage attained through ongoing cost control efforts
Incorporates Tecnoglass share of Adjusted EBITDA from the SaintGobain joint venture which closed at the beginning of May 2019
Revenues $430 to $440 MillionMidpoint +17.3% YoY
17
Rec Pier Hotel– Maryland, USA
Appendix
18
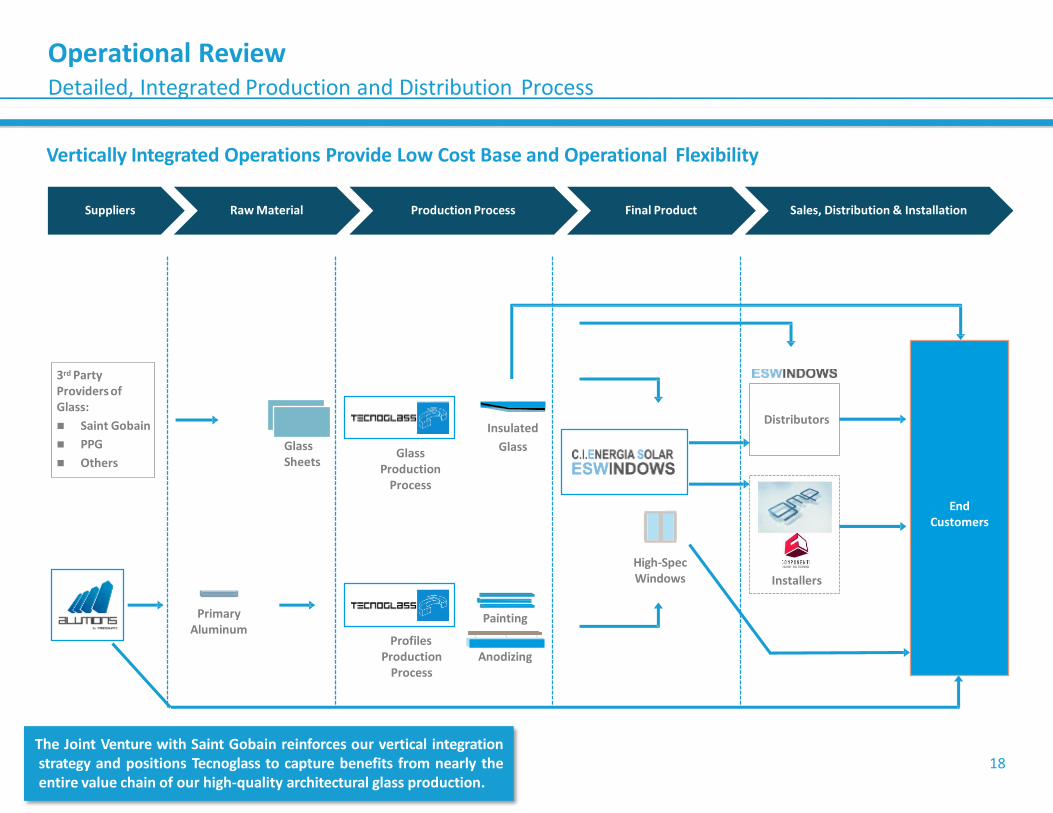
Operational ReviewDetailed, Integrated Production and Distribution Process
Suppliers Raw Material Production Process Final Product Sales, Distribution & Installation
3rd Party Providers of Glass:
Saint Gobain
PPG
Others
Glass Sheets
Insulated
Glass
Painting
Anodizing
End Customers
Distributors
Installers
Primary Aluminum
Glass Production
Process
Profiles Production
Process
High-Spec Windows
Vertically Integrated Operations Provide Low Cost Base and Operational Flexibility
The Joint Venture with Saint Gobain reinforces our vertical integrationstrategy and positions Tecnoglass to capture benefits from nearly theentire value chain of our high-quality architectural glass production.
19
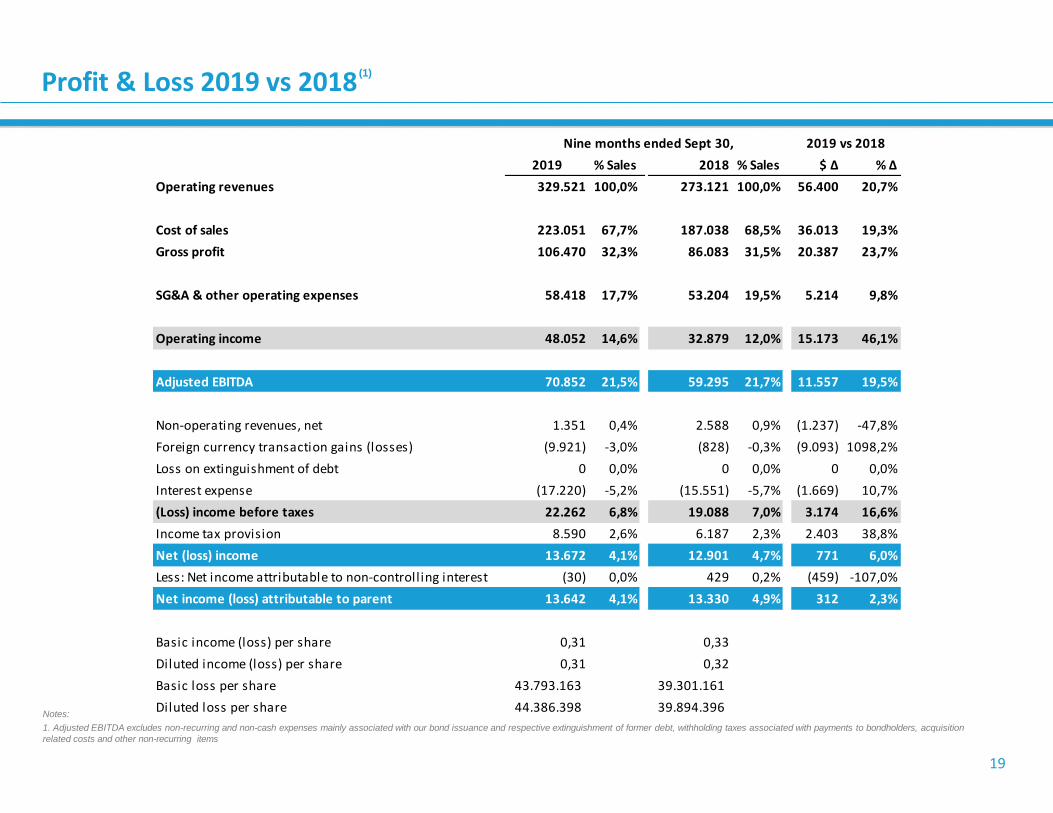
Profit & Loss 2019 vs 2018 (1)
Notes:
1. Adjusted EBITDA excludes non-recurring and non-cash expenses mainly associated with our bond issuance and respective extinguishment of former debt, withholding taxes associated with payments to bondholders, acquisition
related costs and other non-recurring items
2019 % Sales 2018 % Sales $ ∆ % ∆
Operating revenues 329.521 100,0% 273.121 100,0% 56.400 20,7%
Cost of sales 223.051 67,7% 187.038 68,5% 36.013 19,3%
Gross profit 106.470 32,3% 86.083 31,5% 20.387 23,7%
SG&A & other operating expenses 58.418 17,7% 53.204 19,5% 5.214 9,8%
Operating income 48.052 14,6% 32.879 12,0% 15.173 46,1%
Adjusted EBITDA 70.852 21,5% 59.295 21,7% 11.557 19,5%
Non-operating revenues, net 1.351 0,4% 2.588 0,9% (1.237) -47,8%
Foreign currency transaction gains (losses) (9.921) -3,0% (828) -0,3% (9.093) 1098,2%
Loss on extinguishment of debt 0 0,0% 0 0,0% 0 0,0%
Interest expense (17.220) -5,2% (15.551) -5,7% (1.669) 10,7%
(Loss) income before taxes 22.262 6,8% 19.088 7,0% 3.174 16,6%
Income tax provision 8.590 2,6% 6.187 2,3% 2.403 38,8%
Net (loss) income 13.672 4,1% 12.901 4,7% 771 6,0%
Less: Net income attributable to non-controlling interest (30) 0,0% 429 0,2% (459) -107,0%
Net income (loss) attributable to parent 13.642 4,1% 13.330 4,9% 312 2,3%
Basic income (loss) per share 0,31 0,33
Diluted income (loss) per share 0,31 0,32
Basic loss per share 43.793.163 39.301.161
Diluted loss per share 44.386.398 39.894.396
Nine months ended Sept 30, 2019 vs 2018
20
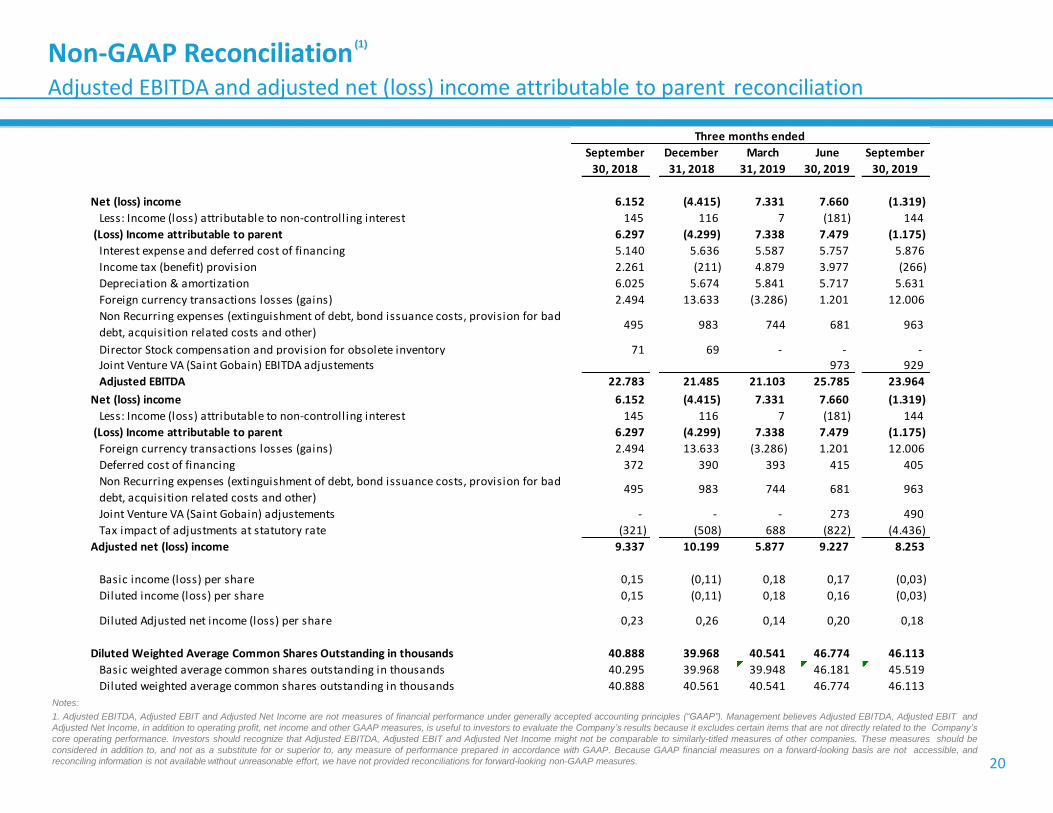
(1)Non-GAAP ReconciliationAdjusted EBITDA and adjusted net (loss) income attributable to parent reconciliation
Notes:
1. Adjusted EBITDA, Adjusted EBIT and Adjusted Net Income are not measures of financial performance under generally accepted accounting principles (“GAAP”). Management believes Adjusted EBITDA, Adjusted EBIT and
Adjusted Net Income, in addition to operating profit, net income and other GAAP measures, is useful to investors to evaluate the Company’s results because it excludes certain items that are not directly related to the Company’s
core operating performance. Investors should recognize that Adjusted EBITDA, Adjusted EBIT and Adjusted Net Income might not be comparable to similarly-titled measures of other companies. These measures should be
considered in addition to, and not as a substitute for or superior to, any measure of performance prepared in accordance with GAAP. Because GAAP financial measures on a forward-looking basis are not accessible, and
reconciling information is not available without unreasonable effort, we have not provided reconciliations for forward-looking non-GAAP measures.
September December March June September
30, 2018 31, 2018 31, 2019 30, 2019 30, 2019
Net (loss) income 6.152 (4.415) 7.331 7.660 (1.319)
Less: Income (loss) attributable to non-controlling interest 145 116 7 (181) 144
(Loss) Income attributable to parent 6.297 (4.299) 7.338 7.479 (1.175)
Interest expense and deferred cost of financing 5.140 5.636 5.587 5.757 5.876
Income tax (benefit) provision 2.261 (211) 4.879 3.977 (266)
Depreciation & amortization 6.025 5.674 5.841 5.717 5.631
Foreign currency transactions losses (gains) 2.494 13.633 (3.286) 1.201 12.006
Non Recurring expenses (extinguishment of debt, bond issuance costs, provision for bad
debt, acquisition related costs and other) 495 983 744 681 963
Director Stock compensation and provision for obsolete inventory 71 69 - - - Joint Venture VA (Saint Gobain) EBITDA adjustements 973 929
Adjusted EBITDA 22.783 21.485 21.103 25.785 23.964
Three months ended
Net (loss) income 6.152 (4.415) 7.331 7.660 (1.319)
Less: Income (loss) attributable to non-controlling interest 145 116 7 (181) 144
(Loss) Income attributable to parent 6.297 (4.299) 7.338 7.479 (1.175)
Foreign currency transactions losses (gains) 2.494 13.633 (3.286) 1.201 12.006
Deferred cost of financing 372 390 393 415 405
Non Recurring expenses (extinguishment of debt, bond issuance costs, provision for bad
debt, acquisition related costs and other) 495 983 744 681 963
Joint Venture VA (Saint Gobain) adjustements - - - 273 490
Tax impact of adjustments at statutory rate (321) (508) 688 (822) (4.436)
Adjusted net (loss) income 9.337 10.199 5.877 9.227 8.253
Basic income (loss) per share 0,15 (0,11) 0,18 0,17 (0,03)
Diluted income (loss) per share 0,15 (0,11) 0,18 0,16 (0,03)
Diluted Adjusted net income (loss) per share 0,23 0,26 0,14 0,20 0,18
Diluted Weighted Average Common Shares Outstanding in thousands 40.888 39.968 40.541 46.774 46.113
Basic weighted average common shares outstanding in thousands 40.295 39.968 39.948 46.181 45.519
Diluted weighted average common shares outstanding in thousands 40.888 40.561 40.541 46.774 46.113