Embed Size (px)
Citation preview

Salient Interactive Miner™ 5.x Training Guide
Introduction & Technology Summary
Getting Started in 6 Easy Steps
Practical Applications
QRG_ALT_4_9_13 2 Salient Management Company
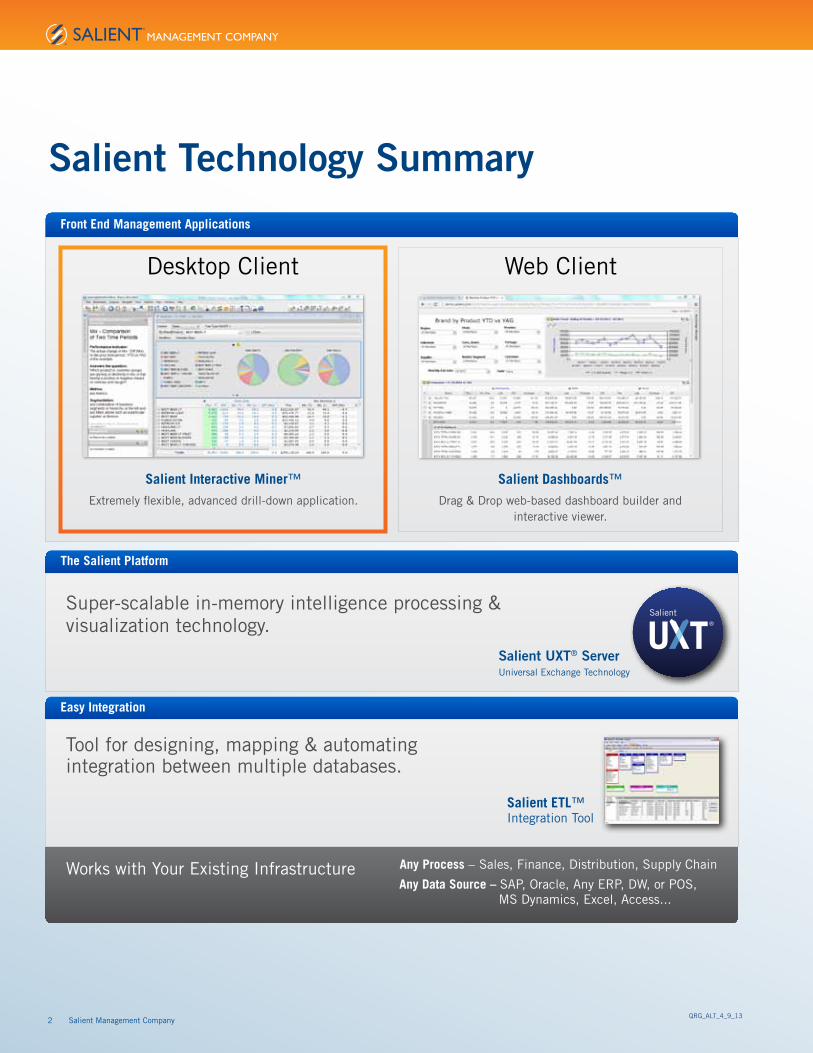
Desktop Client Web Client
Front End Management Applications
Super-scalable in-memory intelligence processing & visualization technology.
The Salient Platform
Salient UXT® Server Universal Exchange Technology
Works with Your Existing Infrastructure
Salient ETL™ Integration Tool
Easy Integration
Tool for designing, mapping & automating integration between multiple databases.
Any Process – Sales, Finance, Distribution, Supply Chain
Any Data Source – SAP, Oracle, Any ERP, DW, or POS, MS Dynamics, Excel, Access...
Salient
Salient Dashboards™
Drag & Drop web-based dashboard builder and interactive viewer.
Salient Interactive Miner™
Extremely flexible, advanced drill-down application.
Salient Technology Summary
Salient Interactive Miner 5.x: Getting Started 3
The Salient Interactive Miner (SIM) provides the intuitive tools your team needs to analyze business questions, from high level overviews to root level causes. The following document will guide you through the basics of the SIM interface and provide you with the ability to examine your business from top to bottom.
• Self-Service for Business Users
• Drill-Down Logic Out-of-Box
• No Query Writing
Table of Contents
4 Getting Started
5 Select a Time Frame
6 Choose the Context / Create Filters
8 Pick an Analysis
9 Insert Metrics
10 Save & Share – Bookmarks
11 Drill-Down
Practical Application “How-To’s”
12 MTD or YTD vs YAG
14 MTD and YTD vs YAG (1 Metric)
15 MTD and YTD vs YAG (Multiple Metrics)
16 Trend any one “thing” with multiple metrics, “cause and effect”
18 Trend multiple “things” at once for any metric
19 Rolling 12-month vs. YAG bar/line chart, 1 metric, 1 member
20 User-Defined Exceptions
22 Distribution Gap Analysis
23 New Product Intro/Penetration Over Time
24 Scattergram Analysis
25 Simple Scattergram
26 Basic crosstab, 1 metric
27 Crosstab with 2 related metrics
28 Crosstab with variance vs. YAG, 1 metric
29 Deltamap
30 P&L Format, for any one part of the business at a time
32 Consolidated P&L across multiple parts of the business
34 Rolling 12-month P&L over time
35 Rolling 12-month P&L over time vs YAG
36 P&L, for combinations of time periods across multiple parts of the business
38 Price range analysis for any one product
40 Price range analysis for multiple products
42 Numbers grid showing demand by price point and customer
Advanced Concepts
43 Numerical filters (Of These)
44 Key lists
45 MultiView
46 Save & Share Intelligence: Storyboards
47 Knowledge Manager
4 Salient Interactive Miner 5.x: Getting Started
The SIM Workspace
Metrics
Date Bar
Help Tools
Pointer Tools
Bookmark and Storyboards Panel
Analysis Shortcuts
Date Selector
Context Area
Getting Started:
Salient Interactive Miner™ 5.x
Getting Started in 6 easy stepsMost managers have a specific business situation that they want to analyze or question deeper when they use SIM. By following these 6 logical steps, you will quickly and easily be able to engage the appropriate analysis, and find meaningful, actionable information. Then, save and share logical bookmarks with your colleagues.
Select the Time Frame
Choose the Context
Match an Analysis to Your Question
Insert the Corresponding Metrics
Save and Share Intelligence
Drill Down to Underlying Detail
1
2
3
4
5
6
Important! In addition to this Getting Started document, there is an extensive help section within SIM. Two ways to access it are:
Click on the help icon to view the entire help document.Click on the help pointer and select an item in question.
Salient Interactive Miner 5.x: Getting Started 5
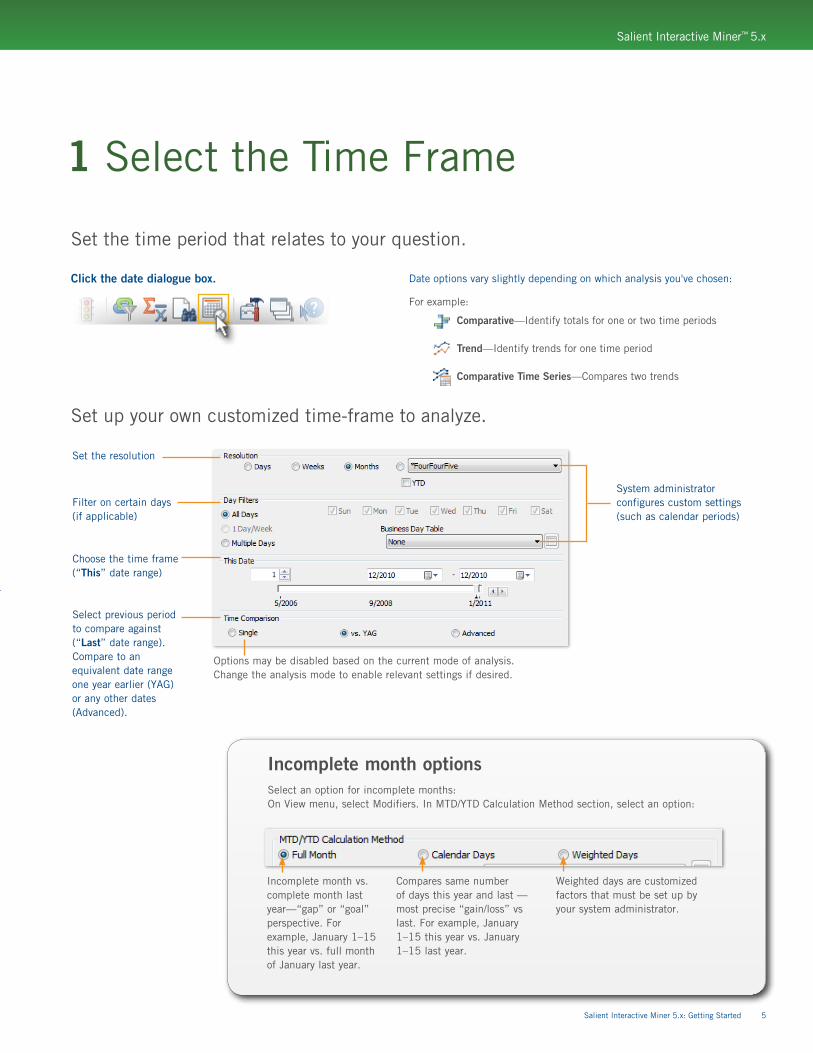
Set the time period that relates to your question.
Set up your own customized time-frame to analyze.
Date options vary slightly depending on which analysis you've chosen:
For example:
Comparative—Identify totals for one or two time periods
Trend—Identify trends for one time period
Comparative Time Series—Compares two trends
Click the date dialogue box.
1 Select the Time Frame
Set the resolution
Filter on certain days (if applicable)
Choose the time frame (“This” date range)
Select previous period to compare against (“Last” date range). Compare to an equivalent date range one year earlier (YAG) or any other dates (Advanced).
System administrator configures custom settings (such as calendar periods)
Options may be disabled based on the current mode of analysis. Change the analysis mode to enable relevant settings if desired.
Incomplete month vs. complete month last year—“gap” or “goal” perspective. For example, January 1–15 this year vs. full month of January last year.
Compares same number of days this year and last —most precise “gain/loss” vs last. For example, January 1–15 this year vs. January 1–15 last year.
Weighted days are customized factors that must be set up by your system administrator.
Incomplete month optionsSelect an option for incomplete months: On View menu, select Modifiers. In MTD/YTD Calculation Method section, select an option:
Salient Interactive Miner™ 5.x
6 Salient Interactive Miner 5.x: Getting Started
Choose the part of the business and sub-groupings.
Pick your sub-groupings:
To change the groupings and sub-groupings.
The By (1st By) shown below controls the groupings shown at the highest level. The 2nd By controls the sub-groupings that one would see next when expanding an item or drilling down. Additional levels of sub-groupings are available as you continue to expand, using the plus symbol on each row.
Let’s start with the Comparative analysis for this lesson.
2 Choose the Context
Set 1st By Set Next By
If key tabs are on
Set 1st 'By'left click
Set 2nd 'By'right click
(Note: this was for version 4.8 and earlier)
Drilling down
The “drilled” view shows data for the selected member grouped according to what was previously the 2nd By (for example, by Family).
Double-click on a grouping
Use the Numbers/Graph Toggle if you are not already in a grid view
Salient Interactive Miner™ 5.x
Tip: Right-click here to access options to hide “key tabs”.
1st By Next By (2nd By \ 3rd By \ 4th By \ 5th By
Salient Interactive Miner 5.x: Getting Started 7
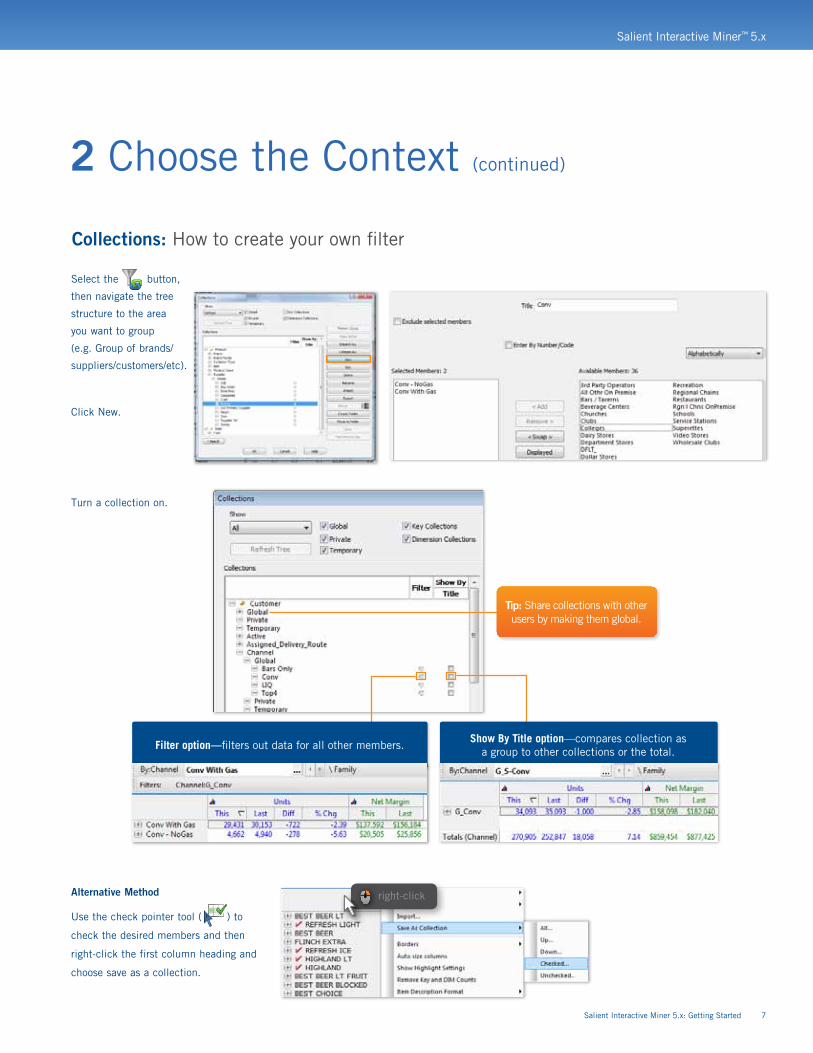
Turn a collection on.
Alternative Method
Use the check pointer tool ( ) to
check the desired members and then
right-click the first column heading and
choose save as a collection.
Tip: Share collections with other users by making them global.
Collections: How to create your own filter
2 Choose the Context (continued)
Show By Title option—compares collection as a group to other collections or the total.
Filter option—filters out data for all other members.
Select the button,
then navigate the tree
structure to the area
you want to group
(e.g. Group of brands/
suppliers/customers/etc).
Click New.
right-click
Salient Interactive Miner™ 5.x
8 Salient Interactive Miner 5.x: Getting Started
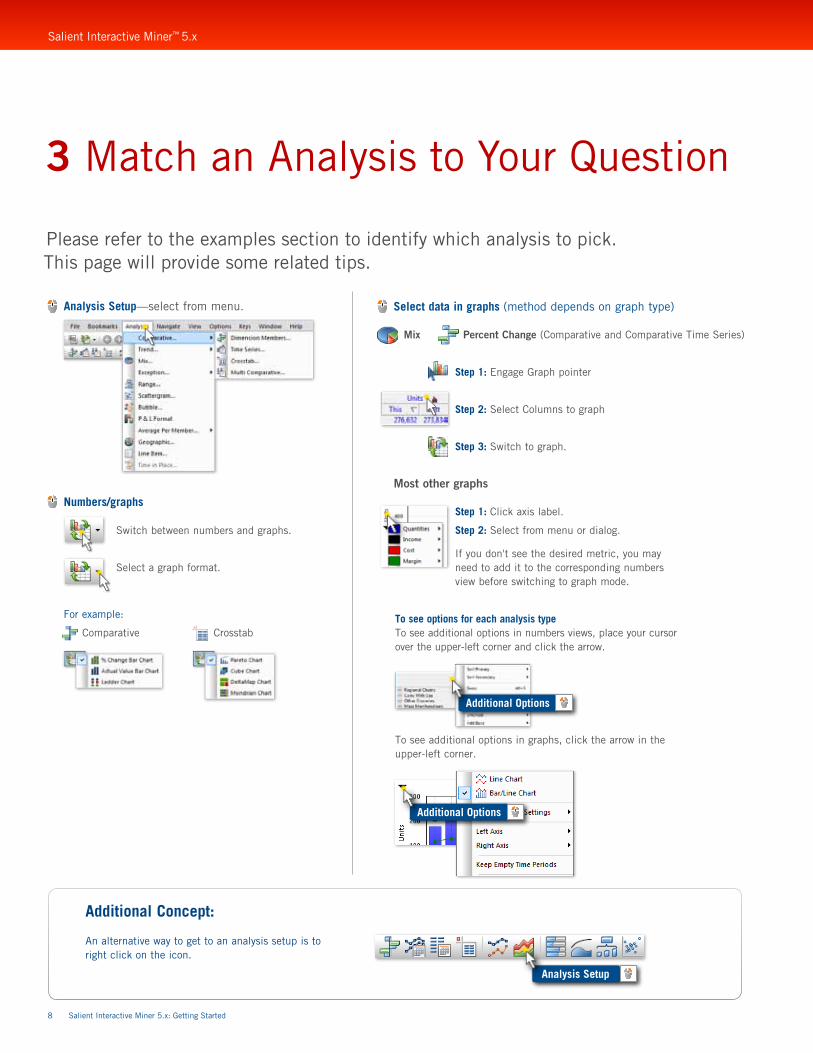
Additional Concept:
An alternative way to get to an analysis setup is to right click on the icon.
Please refer to the examples section to identify which analysis to pick. This page will provide some related tips.
3 Match an Analysis to Your Question
Analysis Setup—select from menu.
Numbers/graphs
Step 1: Engage Graph pointer
Step 2: Select Columns to graph
Step 3: Switch to graph.
Step 1: Click axis label.
Step 2: Select from menu or dialog.
If you don't see the desired metric, you may need to add it to the corresponding numbers view before switching to graph mode.
To see options for each analysis typeTo see additional options in numbers views, place your cursor over the upper-left corner and click the arrow.
To see additional options in graphs, click the arrow in the upper-left corner.
Switch between numbers and graphs.
Select a graph format.
Select data in graphs (method depends on graph type)
Most other graphs
Comparative
Percent Change (Comparative and Comparative Time Series)Mix
Crosstab
For example:
Salient Interactive Miner™ 5.x
Additional Options
Additional Options
Analysis Setup
Salient Interactive Miner 5.x: Getting Started 9
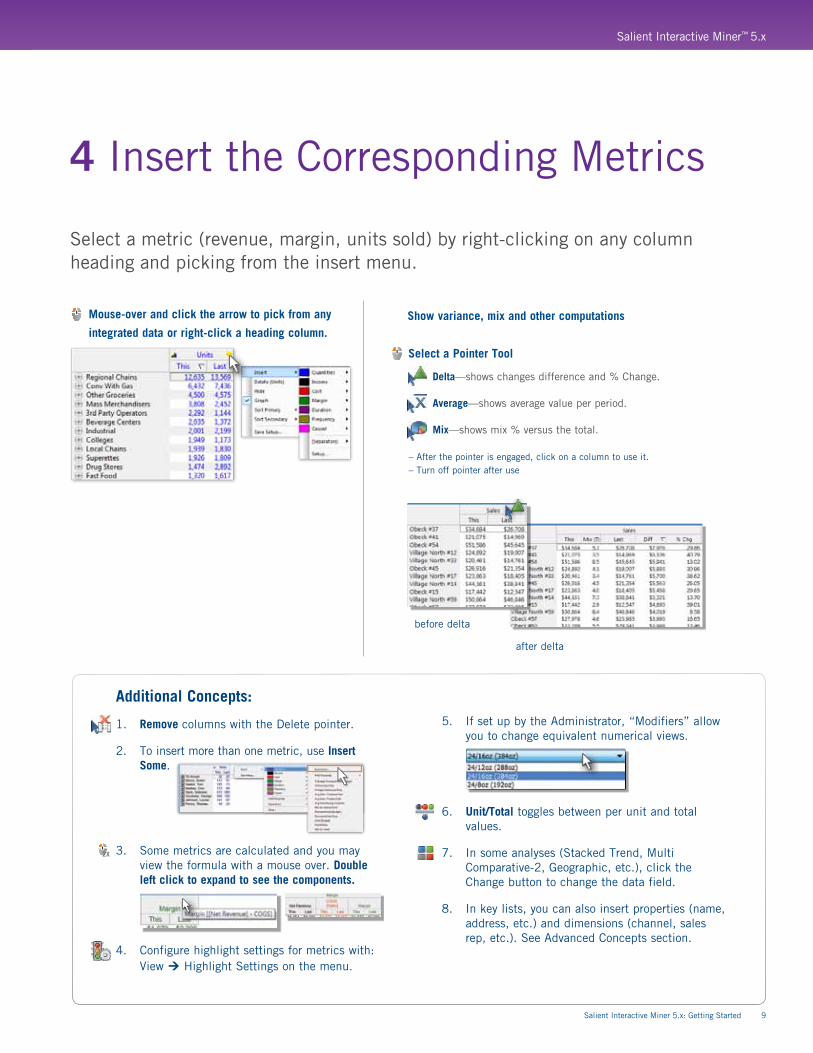
Select a metric (revenue, margin, units sold) by right-clicking on any column heading and picking from the insert menu.
4 Insert the Corresponding Metrics
5. If set up by the Administrator, “Modifiers” allow you to change equivalent numerical views.
6. Unit/Total toggles between per unit and total values.
7. In some analyses (Stacked Trend, Multi Comparative-2, Geographic, etc.), click the Change button to change the data field.
8. In key lists, you can also insert properties (name, address, etc.) and dimensions (channel, sales rep, etc.). See Advanced Concepts section.
Additional Concepts:
1. Remove columns with the Delete pointer.
2. To insert more than one metric, use Insert Some.
3. Some metrics are calculated and you may view the formula with a mouse over. Double left click to expand to see the components.
4. Configure highlight settings for metrics with: View Highlight Settings on the menu.
Mouse-over and click the arrow to pick from any
integrated data or right-click a heading column.Show variance, mix and other computations
before delta
after delta
Delta—shows changes difference and % Change. Average—shows average value per period. Mix—shows mix % versus the total.
– After the pointer is engaged, click on a column to use it.– Turn off pointer after use
Select a Pointer Tool
Salient Interactive Miner™ 5.x
10 Salient Interactive Miner 5.x: Getting Started
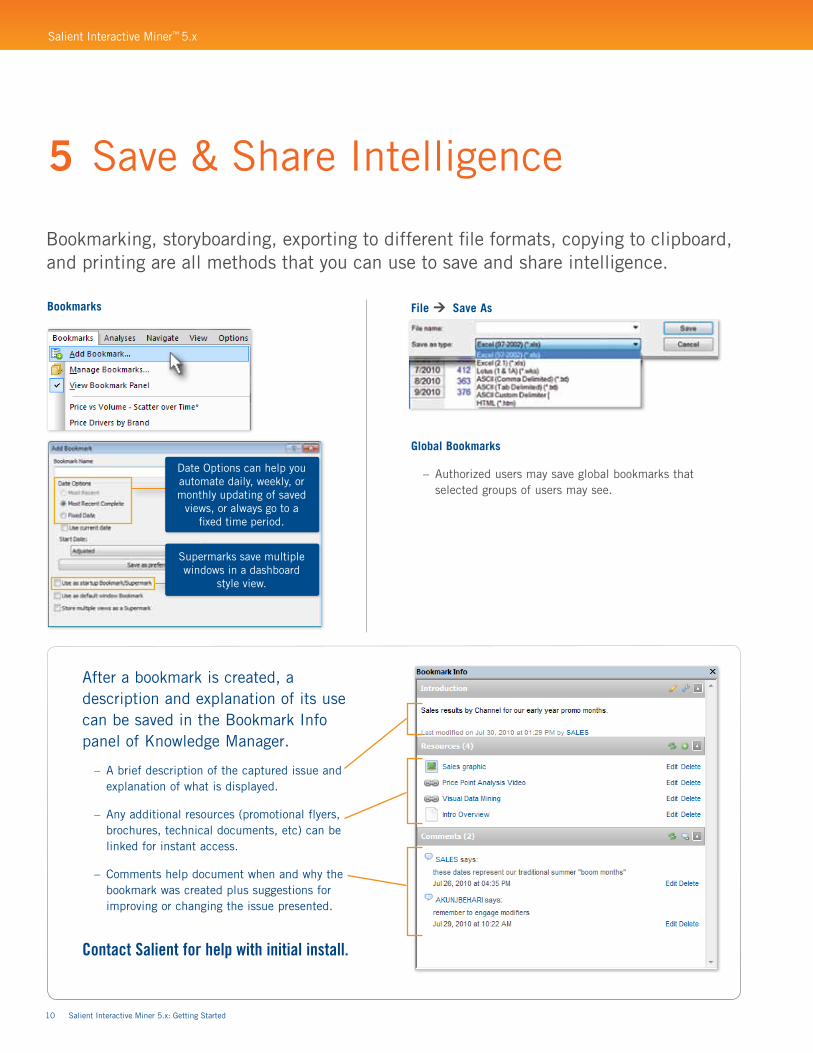
5 Save & Share Intelligence
File Save As
Global Bookmarks
– Authorized users may save global bookmarks that selected groups of users may see.
After a bookmark is created, a description and explanation of its use can be saved in the Bookmark Info panel of Knowledge Manager.
– A brief description of the captured issue and explanation of what is displayed.
– Any additional resources (promotional flyers, brochures, technical documents, etc) can be linked for instant access.
– Comments help document when and why the bookmark was created plus suggestions for improving or changing the issue presented.
Contact Salient for help with initial install.
Bookmarking, storyboarding, exporting to different file formats, copying to clipboard, and printing are all methods that you can use to save and share intelligence.
Bookmarks
Date Options can help you automate daily, weekly, or monthly updating of saved
views, or always go to a fixed time period.
Supermarks save multiple windows in a dashboard
style view.
Salient Interactive Miner™ 5.x
Salient Interactive Miner 5.x: Getting Started 11
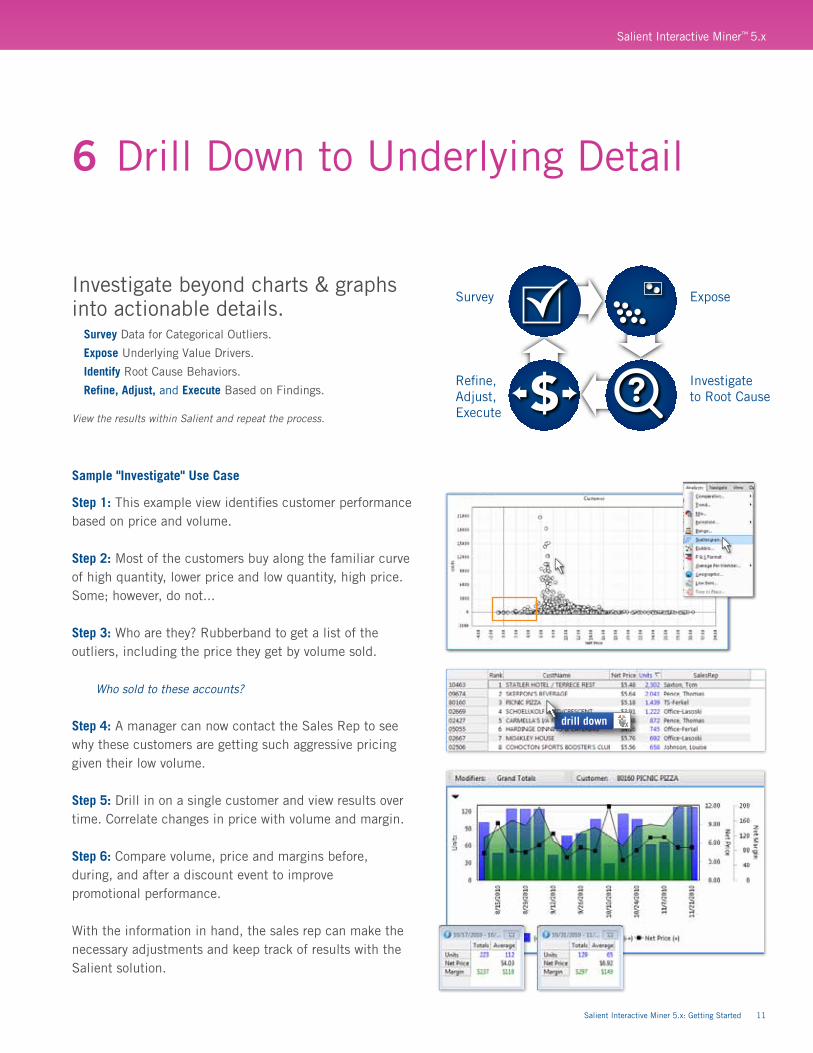
6 Drill Down to Underlying Detail
Investigate beyond charts & graphs into actionable details.
Survey Data for Categorical Outliers.
Expose Underlying Value Drivers.
Identify Root Cause Behaviors.
Refine, Adjust, and Execute Based on Findings.
View the results within Salient and repeat the process.
Step 1: This example view identifies customer performance based on price and volume. Step 2: Most of the customers buy along the familiar curve of high quantity, lower price and low quantity, high price. Some; however, do not... Step 3: Who are they? Rubberband to get a list of the outliers, including the price they get by volume sold.
Who sold to these accounts?
Step 4: A manager can now contact the Sales Rep to see why these customers are getting such aggressive pricing given their low volume. Step 5: Drill in on a single customer and view results over time. Correlate changes in price with volume and margin.
Step 6: Compare volume, price and margins before, during, and after a discount event to improve promotional performance.
With the information in hand, the sales rep can make the necessary adjustments and keep track of results with the Salient solution.
Sample "Investigate" Use Case
drill down
Survey Expose
Investigate to Root Cause
Refine, Adjust, Execute
Salient Interactive Miner™ 5.x
12 Salient Interactive Miner 5.x: Training Guide
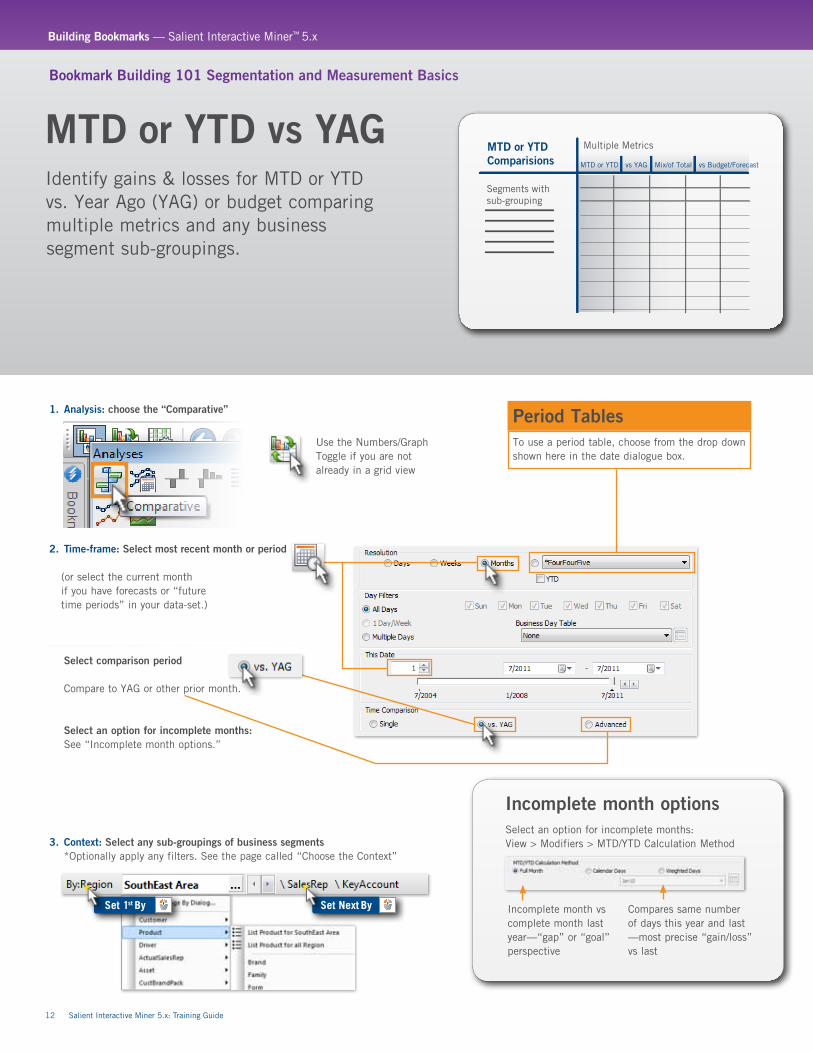
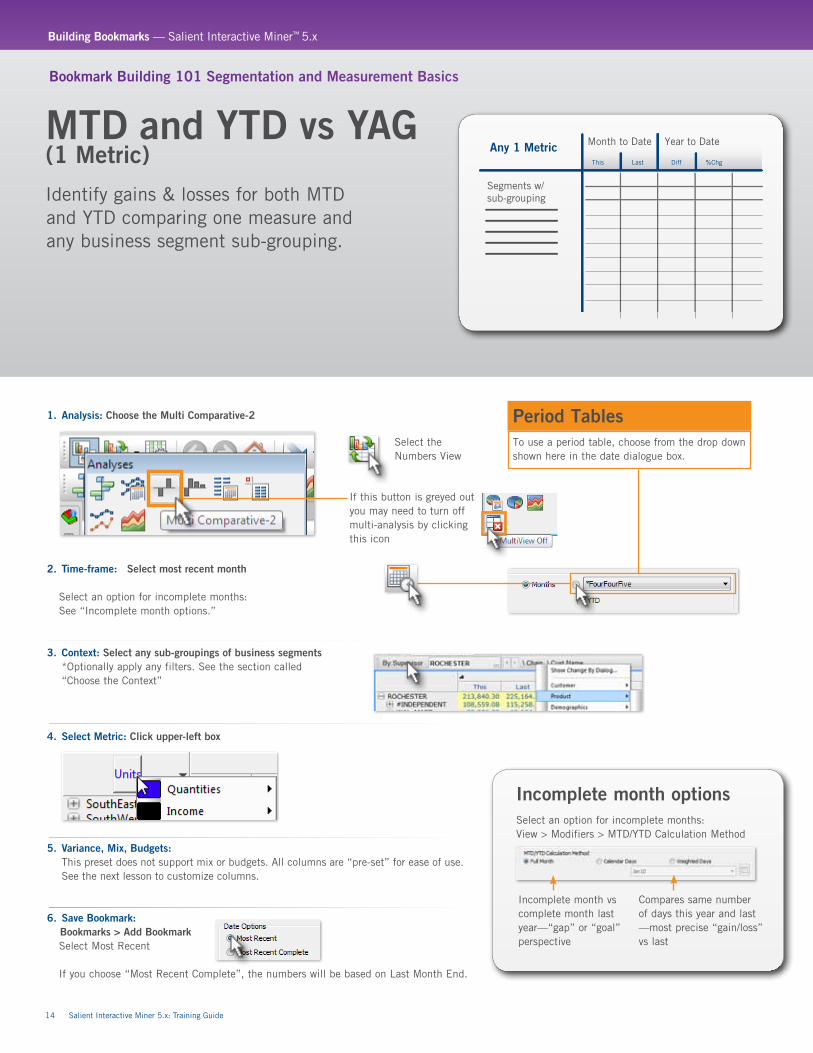
1. Analysis: choose the “Comparative”
2. Time-frame: Select most recent month or period
(or select the current monthif you have forecasts or “futuretime periods” in your data-set.)
Select comparison period
Compare to YAG or other prior month.
Select an option for incomplete months: See “Incomplete month options.”
3. Context: Select any sub-groupings of business segments *Optionally apply any filters. See the page called “Choose the Context”
Segments withsub-grouping
MTD or YTDComparisions
Multiple Metrics
MTD or YTD vs YAG Mix/of Total vs Budget/Forecast
MTD or YTD vs YAG
Bookmark Building 101 Segmentation and Measurement Basics
Incomplete month vs complete month last year—“gap” or “goal” perspective
Compares same number of days this year and last —most precise “gain/loss” vs last
Identify gains & losses for MTD or YTD vs. Year Ago (YAG) or budget comparing multiple metrics and any business segment sub-groupings.
Use the Numbers/Graph Toggle if you are not already in a grid view
Incomplete month optionsSelect an option for incomplete months: View > Modifiers > MTD/YTD Calculation Method
Set 1st By Set Next By
Period TablesTo use a period table, choose from the drop down shown here in the date dialogue box.
Building Bookmarks — Salient Interactive Miner™ 5.x
Salient Interactive Miner 5.x: Training Guide 13
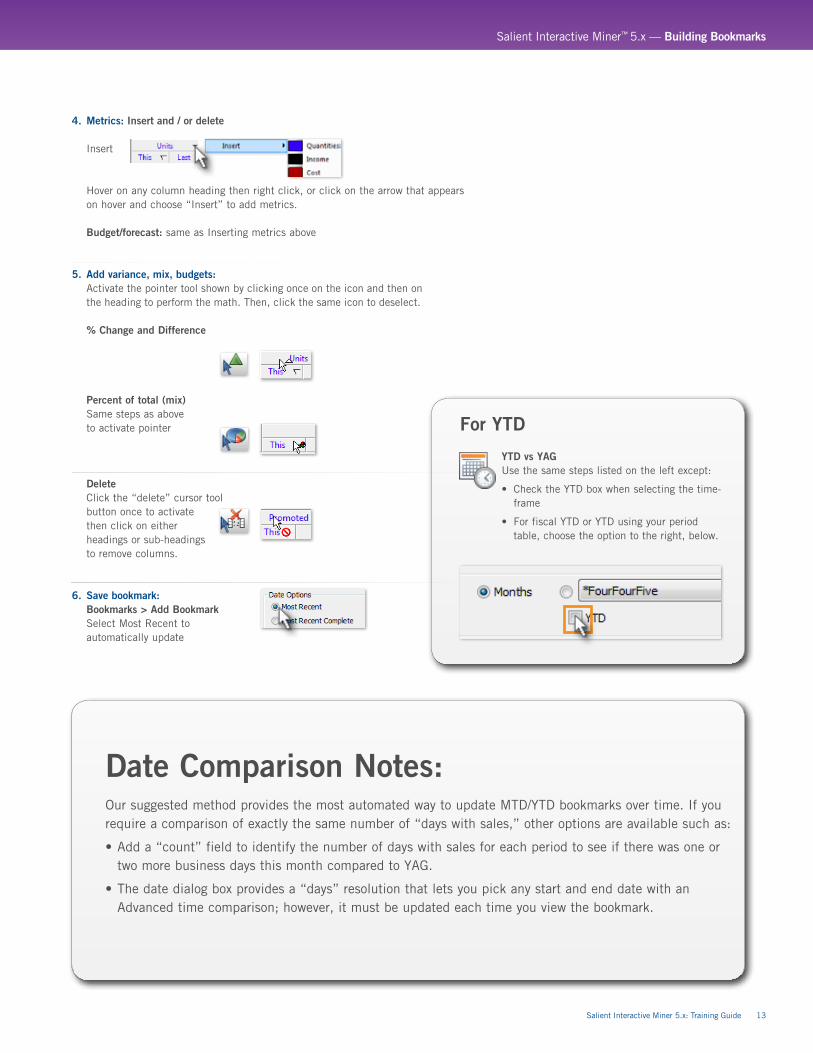
4. Metrics: Insert and / or delete
Insert
Hover on any column heading then right click, or click on the arrow that appears on hover and choose “Insert” to add metrics. Budget/forecast: same as Inserting metrics above
5. Add variance, mix, budgets: Activate the pointer tool shown by clicking once on the icon and then on the heading to perform the math. Then, click the same icon to deselect.
% Change and Difference
Percent of total (mix) Same steps as above to activate pointer
Delete Click the “delete” cursor tool button once to activate then click on either headings or sub-headings to remove columns.
6. Save bookmark: Bookmarks > Add Bookmark Select Most Recent to automatically update
Date Comparison Notes: Our suggested method provides the most automated way to update MTD/YTD bookmarks over time. If you require a comparison of exactly the same number of “days with sales,” other options are available such as:
•Add a “count” field to identify the number of days with sales for each period to see if there was one or two more business days this month compared to YAG.
•The date dialog box provides a “days” resolution that lets you pick any start and end date with an Advanced time comparison; however, it must be updated each time you view the bookmark.
YTD vs YAGUse the same steps listed on the left except:
• Check the YTD box when selecting the time-frame
• For fiscal YTD or YTD using your period table, choose the option to the right, below.
For YTD
Salient Interactive Miner™ 5.x — Building Bookmarks
Incomplete month vs complete month last year—“gap” or “goal” perspective
Compares same number of days this year and last —most precise “gain/loss” vs last
Incomplete month optionsSelect an option for incomplete months: View > Modifiers > MTD/YTD Calculation Method
14 Salient Interactive Miner 5.x: Training Guide
1. Analysis: Choose the Multi Comparative-2
2. Time-frame: Select most recent month
Select an option for incomplete months: See “Incomplete month options.”
3. Context: Select any sub-groupings of business segments *Optionally apply any filters. See the section called “Choose the Context”
4. Select Metric: Click upper-left box
5. Variance, Mix, Budgets: This preset does not support mix or budgets. All columns are “pre-set” for ease of use. See the next lesson to customize columns.
6. Save Bookmark: Bookmarks > Add Bookmark
Select Most Recent
If you choose “Most Recent Complete”, the numbers will be based on Last Month End.
Segments w/ sub-grouping
Any 1 Metric Month to Date
This Last Diff %Chg
Year to Date
Bookmark Building 101 Segmentation and Measurement Basics
Identify gains & losses for both MTD and YTD comparing one measure and any business segment sub-grouping.
MTD and YTD vs YAG(1 Metric)
Select the Numbers View
If this button is greyed out you may need to turn off multi-analysis by clicking this icon
Period TablesTo use a period table, choose from the drop down shown here in the date dialogue box.
Building Bookmarks — Salient Interactive Miner™ 5.x
Salient Interactive Miner 5.x: Training Guide 15
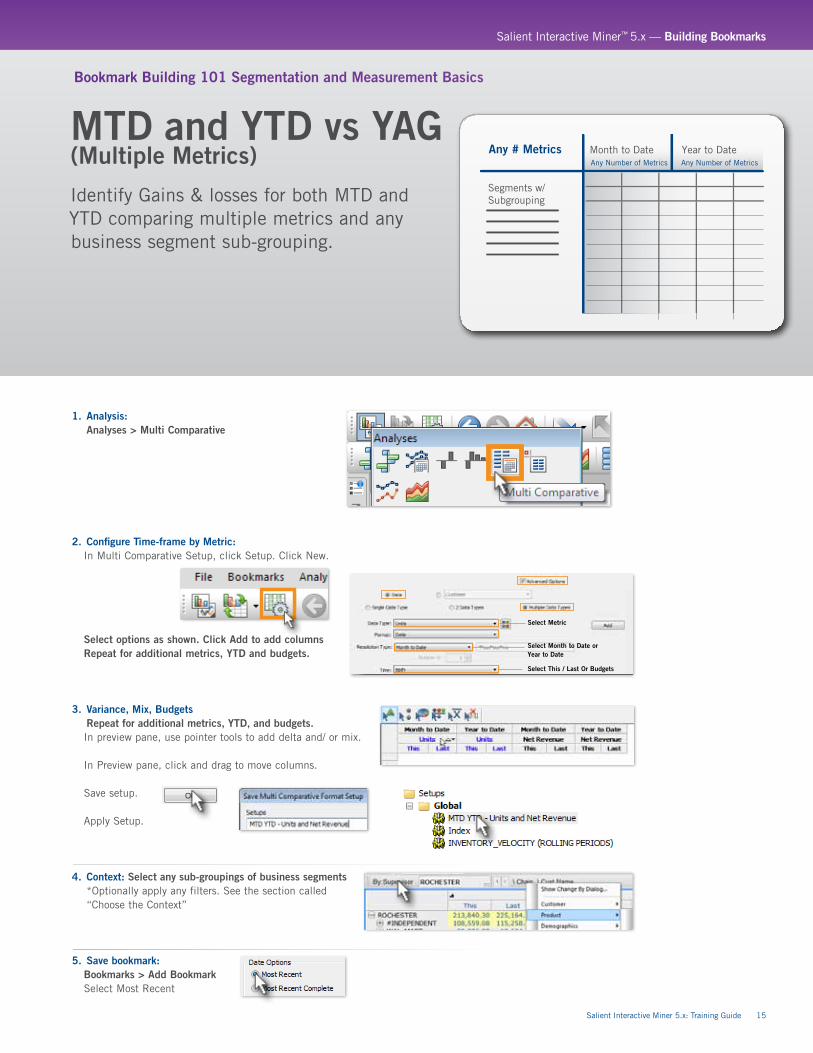
Segments w/ Subgrouping
Any # Metrics Year to DateMonth to DateAny Number of Metrics Any Number of Metrics
Bookmark Building 101 Segmentation and Measurement Basics
Identify Gains & losses for both MTD and YTD comparing multiple metrics and any business segment sub-grouping.
MTD and YTD vs YAG(Multiple Metrics)
1. Analysis: Analyses > Multi Comparative
2. Configure Time-frame by Metric:In Multi Comparative Setup, click Setup. Click New.
Select options as shown. Click Add to add columns Repeat for additional metrics, YTD and budgets.
3. Variance, Mix, Budgets Repeat for additional metrics, YTD, and budgets.
In preview pane, use pointer tools to add delta and/ or mix.
In Preview pane, click and drag to move columns.
Save setup.
Apply Setup.
4. Context: Select any sub-groupings of business segments *Optionally apply any filters. See the section called “Choose the Context”
5. Save bookmark:Bookmarks > Add Bookmark Select Most Recent
Select Metric
Select Month to Date or Year to Date
Select This / Last Or Budgets
Salient Interactive Miner™ 5.x — Building Bookmarks
16 Salient Interactive Miner 5.x: Training Guide
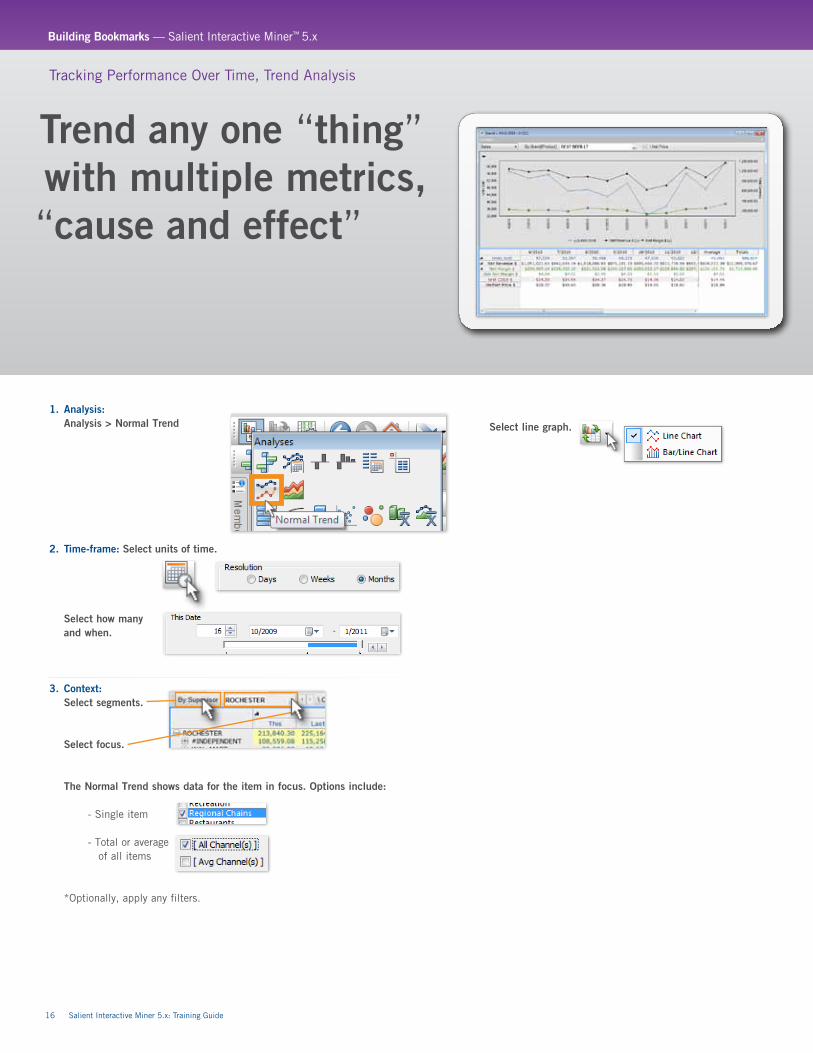
1. Analysis: Analysis > Normal Trend
2. Time-frame: Select units of time.
Select how many and when.
3. Context: Select segments.
Select focus.
The Normal Trend shows data for the item in focus. Options include: - Single item
- Total or average of all items
*Optionally, apply any filters.
Trend any one “thing” with multiple metrics, “cause and effect”
Tracking Performance Over Time, Trend Analysis
Select line graph.
Building Bookmarks — Salient Interactive Miner™ 5.x
Salient Interactive Miner 5.x: Training Guide 17
Additional Concept: Rubber-banding datesTo see details for any subset of the date range, RIGHT-CLICK and drag (available in any time-series).
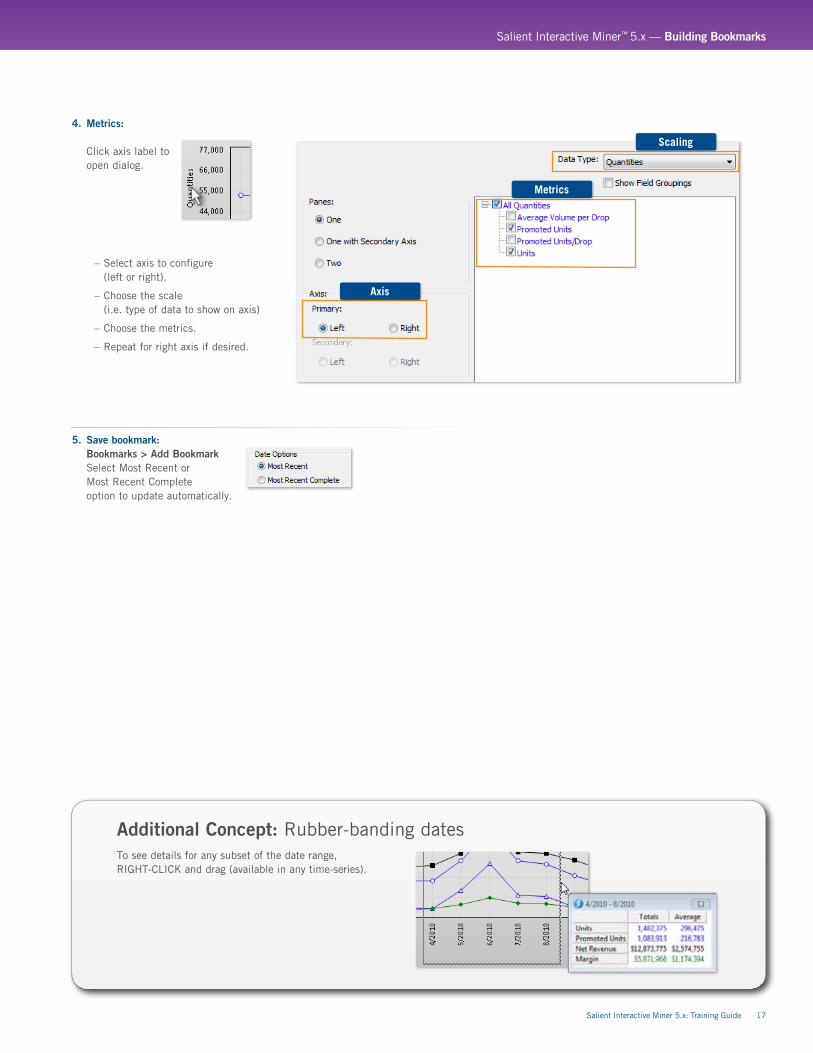
4. Metrics:
Click axis label to open dialog.
– Select axis to configure (left or right).
– Choose the scale (i.e. type of data to show on axis)
– Choose the metrics.
– Repeat for right axis if desired.
5. Save bookmark: Bookmarks > Add Bookmark Select Most Recent or Most Recent Complete option to update automatically.
Axis
Scaling
Metrics
Salient Interactive Miner™ 5.x — Building Bookmarks
18 Salient Interactive Miner 5.x: Training Guide
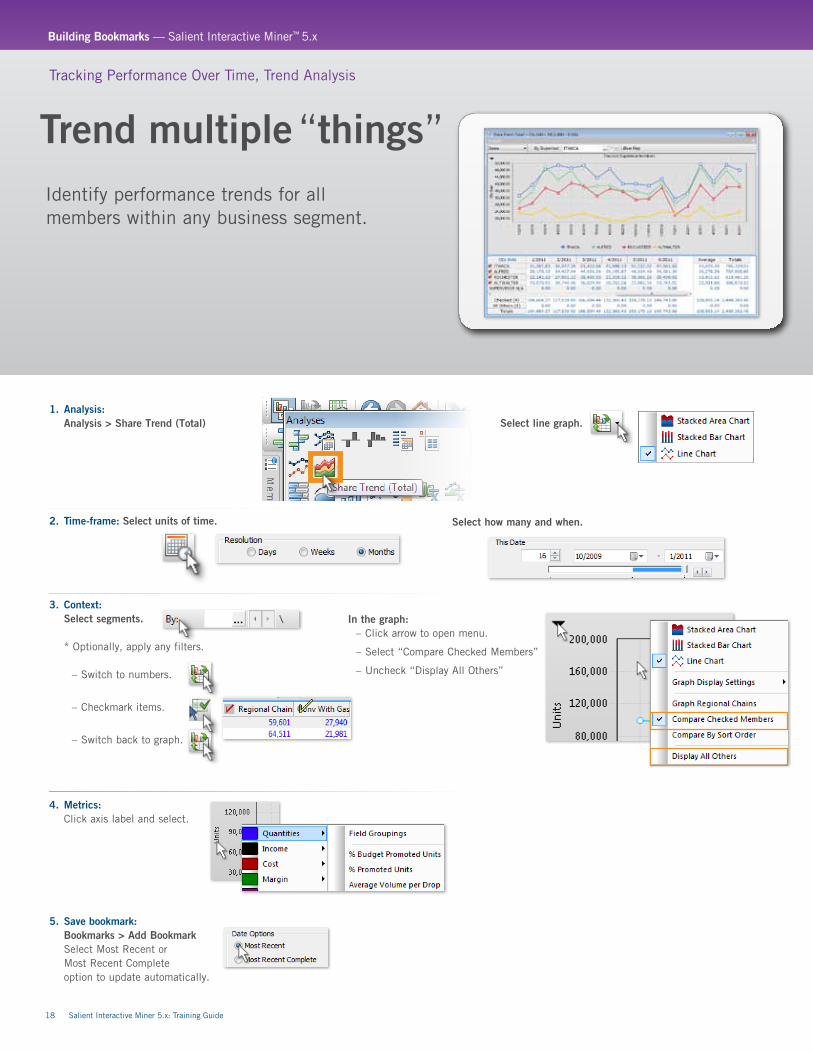
1. Analysis: Analysis > Share Trend (Total)
2. Time-frame: Select units of time.
3. Context: Select segments.
* Optionally, apply any filters.
– Switch to numbers.
– Checkmark items.
– Switch back to graph.
4. Metrics: Click axis label and select.
5. Save bookmark: Bookmarks > Add Bookmark Select Most Recent or Most Recent Complete option to update automatically.
Trend multiple “things”
Tracking Performance Over Time, Trend Analysis
Select line graph.
Select how many and when.
In the graph: – Click arrow to open menu.
– Select “Compare Checked Members”
– Uncheck “Display All Others”
Identify performance trends for all members within any business segment.
Building Bookmarks — Salient Interactive Miner™ 5.x
Salient Interactive Miner 5.x: Training Guide 19
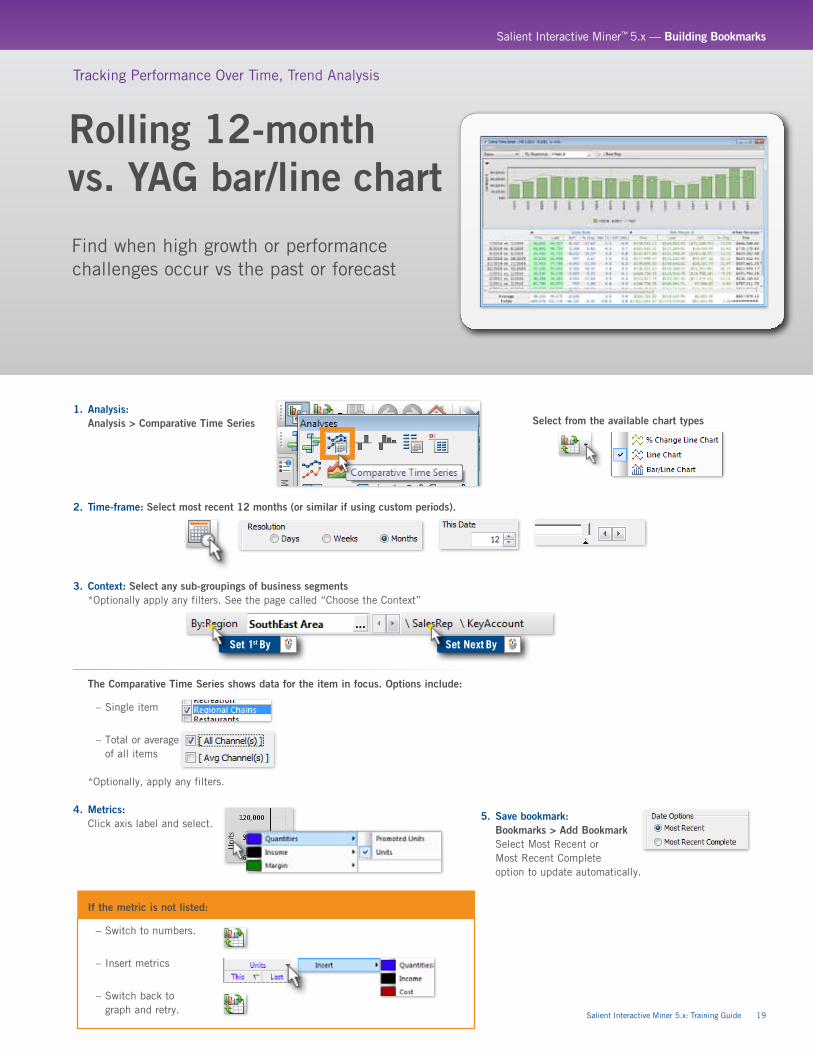
1. Analysis: Analysis > Comparative Time Series
2. Time-frame: Select most recent 12 months (or similar if using custom periods).
3. Context: Select any sub-groupings of business segments *Optionally apply any filters. See the page called “Choose the Context”
The Comparative Time Series shows data for the item in focus. Options include:
– Single item
– Total or average of all items
*Optionally, apply any filters.
4. Metrics: Click axis label and select.
If the metric is not listed:
– Switch to numbers.
– Insert metrics
– Switch back to graph and retry.
Rolling 12-month vs. YAG bar/line chart
Tracking Performance Over Time, Trend Analysis
5. Save bookmark: Bookmarks > Add Bookmark Select Most Recent or Most Recent Complete option to update automatically.
Select from the available chart types
Set 1st By Set Next By
Find when high growth or performance challenges occur vs the past or forecast
Salient Interactive Miner™ 5.x — Building Bookmarks
20 Salient Interactive Miner 5.x: Training Guide
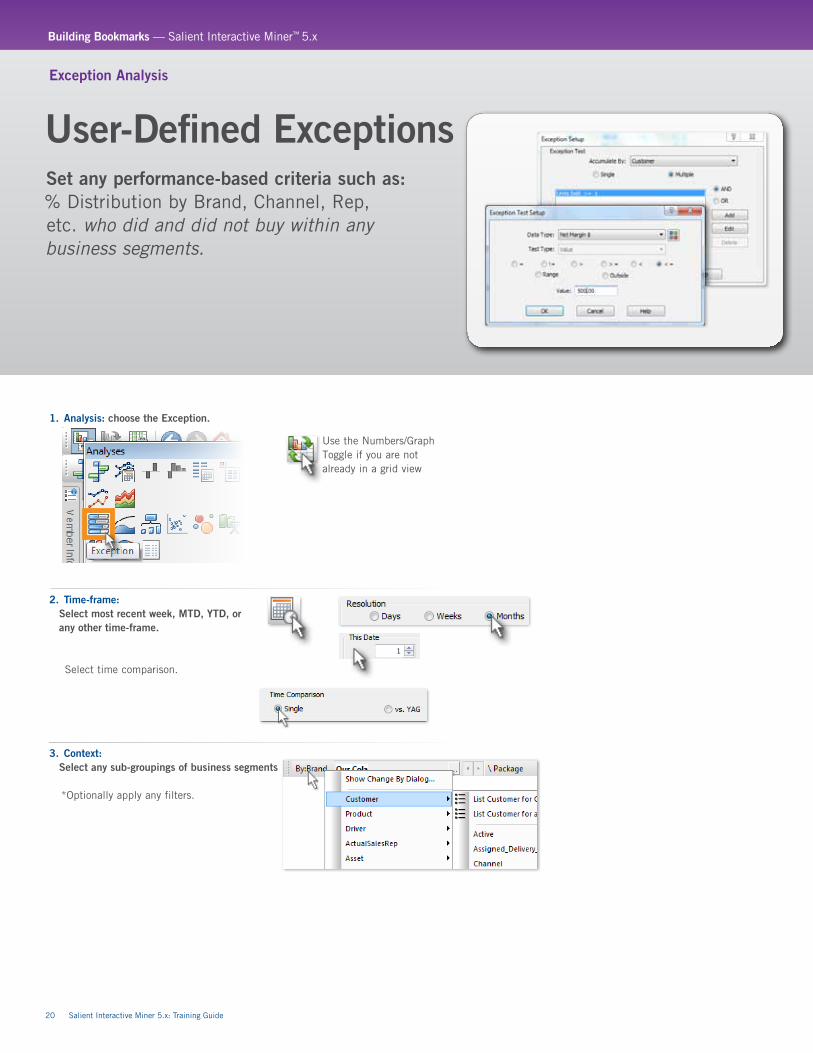
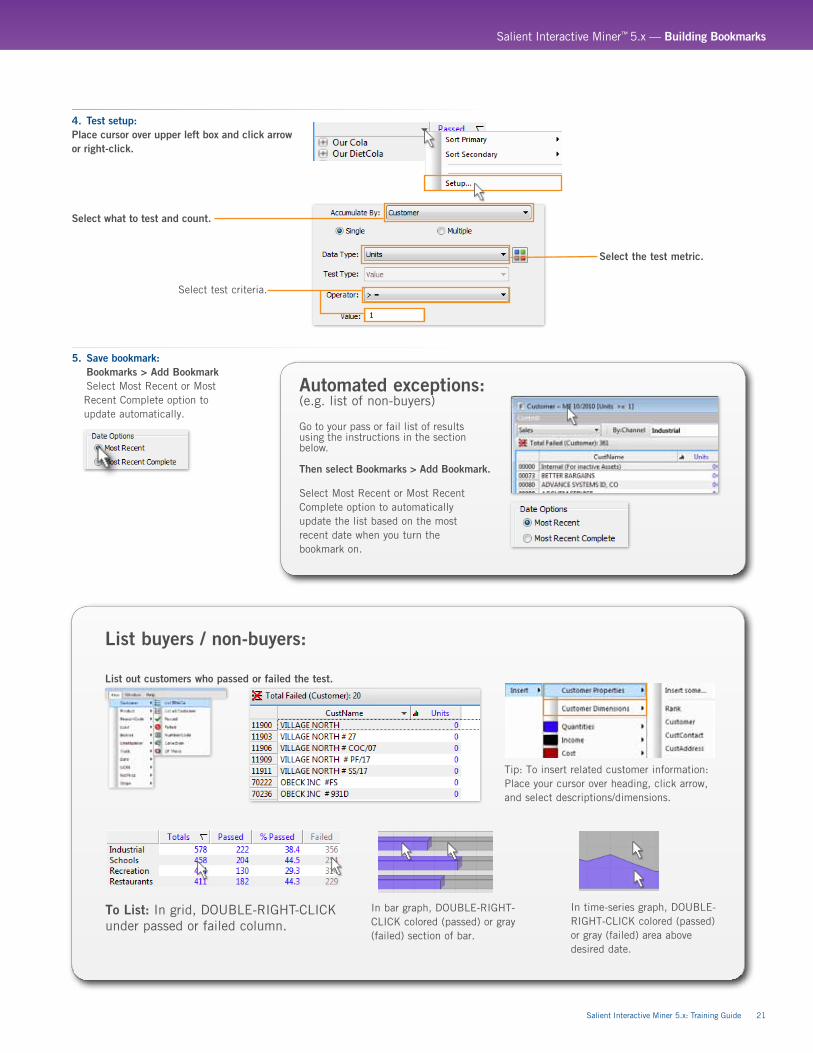
1. Analysis: choose the Exception.
2. Time-frame: Select most recent week, MTD, YTD, or any other time-frame.
Select time comparison.
3. Context: Select any sub-groupings of business segments
*Optionally apply any filters.
User-Defined Exceptions
Exception Analysis
Set any performance-based criteria such as: % Distribution by Brand, Channel, Rep, etc. who did and did not buy within any business segments.
Use the Numbers/Graph Toggle if you are not already in a grid view
Building Bookmarks — Salient Interactive Miner™ 5.x
Salient Interactive Miner 5.x: Training Guide 21
4. Test setup: Place cursor over upper left box and click arrow or right-click. Select what to test and count.
5. Save bookmark: Bookmarks > Add Bookmark
Select Most Recent or Most Recent Complete option to update automatically.
List buyers / non-buyers: List out customers who passed or failed the test.
Select the test metric.
Select test criteria.
To List: In grid, DOUBLE-RIGHT-CLICK under passed or failed column.
In bar graph, DOUBLE-RIGHT-CLICK colored (passed) or gray (failed) section of bar.
In time-series graph, DOUBLE-RIGHT-CLICK colored (passed) or gray (failed) area above desired date.
Tip: To insert related customer information: Place your cursor over heading, click arrow, and select descriptions/dimensions.
Automated exceptions: (e.g. list of non-buyers)
Go to your pass or fail list of results using the instructions in the section below. Then select Bookmarks > Add Bookmark.
Select Most Recent or Most Recent Complete option to automatically update the list based on the most recent date when you turn the bookmark on.
Salient Interactive Miner™ 5.x — Building Bookmarks
22 Salient Interactive Miner 5.x: Training Guide
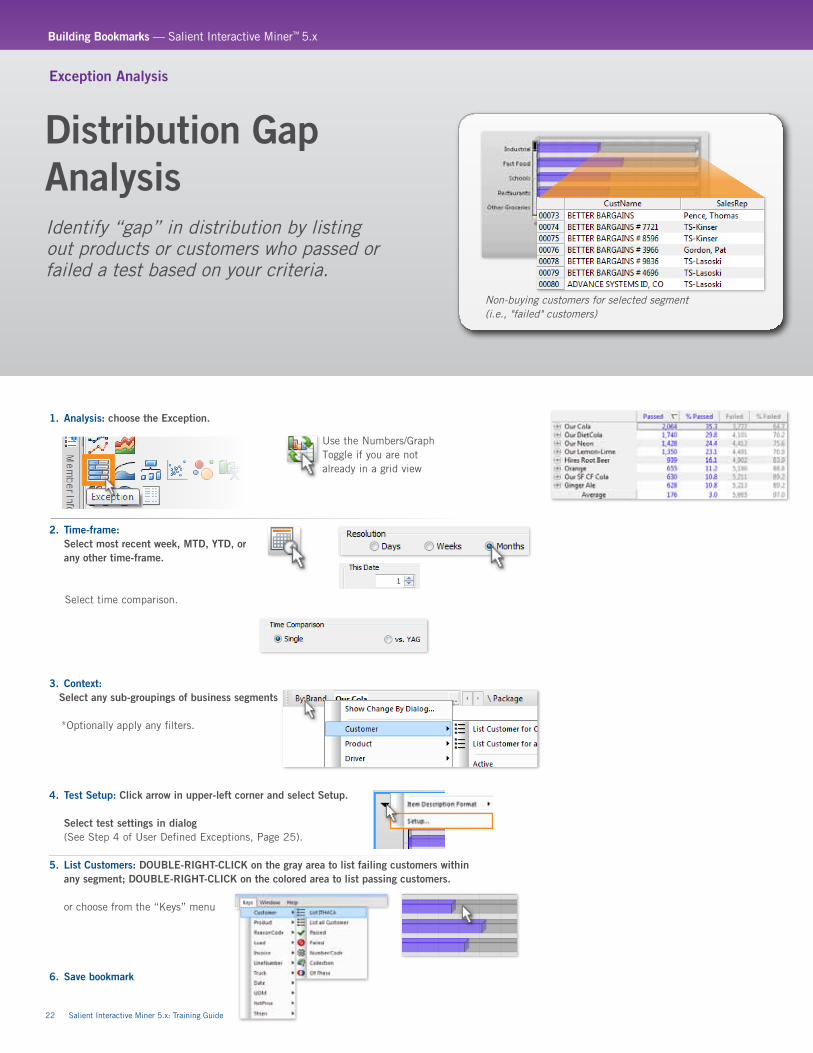
1. Analysis: choose the Exception.
2. Time-frame: Select most recent week, MTD, YTD, or any other time-frame.
Select time comparison.
3. Context: Select any sub-groupings of business segments
*Optionally apply any filters.
4. Test Setup: Click arrow in upper-left corner and select Setup.
Select test settings in dialog (See Step 4 of User Defined Exceptions, Page 25).
5. List Customers: DOUBLE-RIGHT-CLICK on the gray area to list failing customers within any segment; DOUBLE-RIGHT-CLICK on the colored area to list passing customers. or choose from the “Keys” menu
6. Save bookmark
Distribution Gap Analysis
Exception Analysis
Identify “gap” in distribution by listing out products or customers who passed or failed a test based on your criteria.
Non-buying customers for selected segment (i.e., "failed" customers)
Use the Numbers/Graph Toggle if you are not already in a grid view
Building Bookmarks — Salient Interactive Miner™ 5.x
Salient Interactive Miner 5.x: Training Guide 23
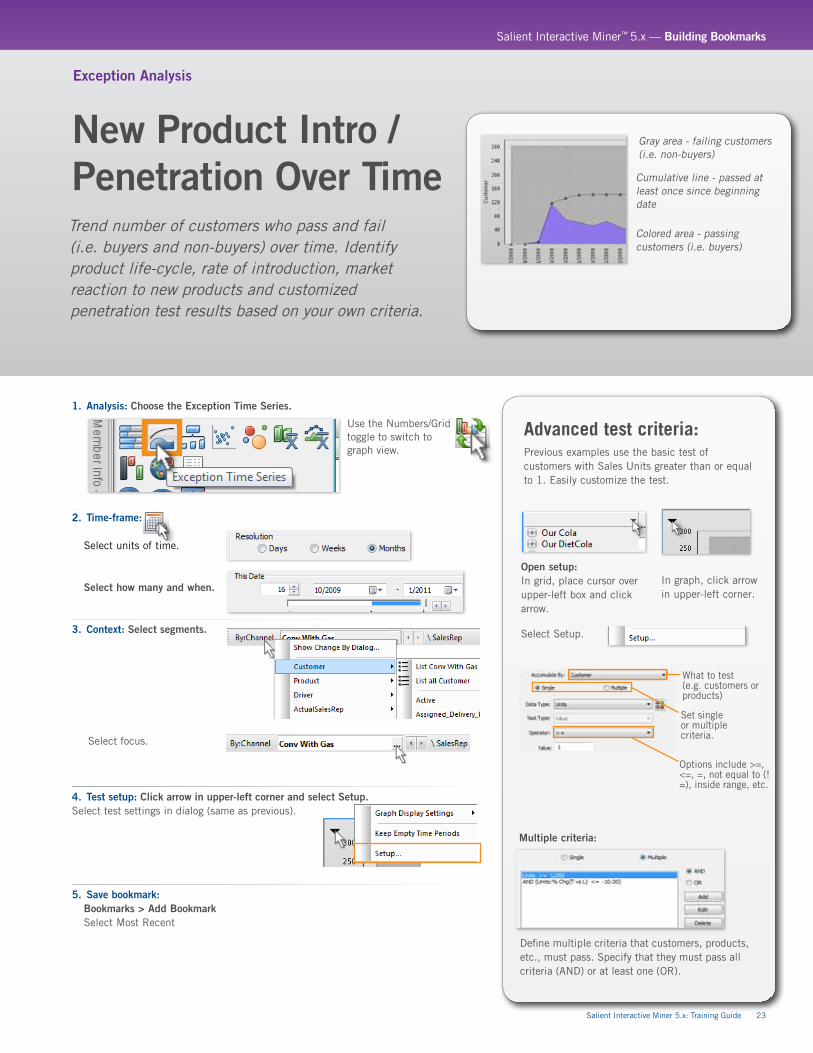
Exception Analysis
Trend number of customers who pass and fail (i.e. buyers and non-buyers) over time. Identify product life-cycle, rate of introduction, market reaction to new products and customized penetration test results based on your own criteria.
New Product Intro /Penetration Over Time
1. Analysis: Choose the Exception Time Series.
2. Time-frame:
Select units of time.
Select how many and when.
3. Context: Select segments. Select focus.
4. Test setup: Click arrow in upper-left corner and select Setup. Select test settings in dialog (same as previous).
5. Save bookmark:Bookmarks > Add Bookmark Select Most Recent
Use the Numbers/Grid toggle to switch to graph view.
Gray area - failing customers (i.e. non-buyers)
Colored area - passing customers (i.e. buyers)
Cumulative line - passed at least once since beginning date
Advanced test criteria: Previous examples use the basic test of customers with Sales Units greater than or equal to 1. Easily customize the test.
Open setup:In grid, place cursor over upper-left box and click arrow.
In graph, click arrow in upper-left corner.
Select Setup.
What to test (e.g. customers or products)
Set single or multiple criteria.
Options include >=, <=, =, not equal to (! =), inside range, etc.
Multiple criteria:
Define multiple criteria that customers, products, etc., must pass. Specify that they must pass all criteria (AND) or at least one (OR).
Salient Interactive Miner™ 5.x — Building Bookmarks
24 Salient Interactive Miner 5.x: Training Guide
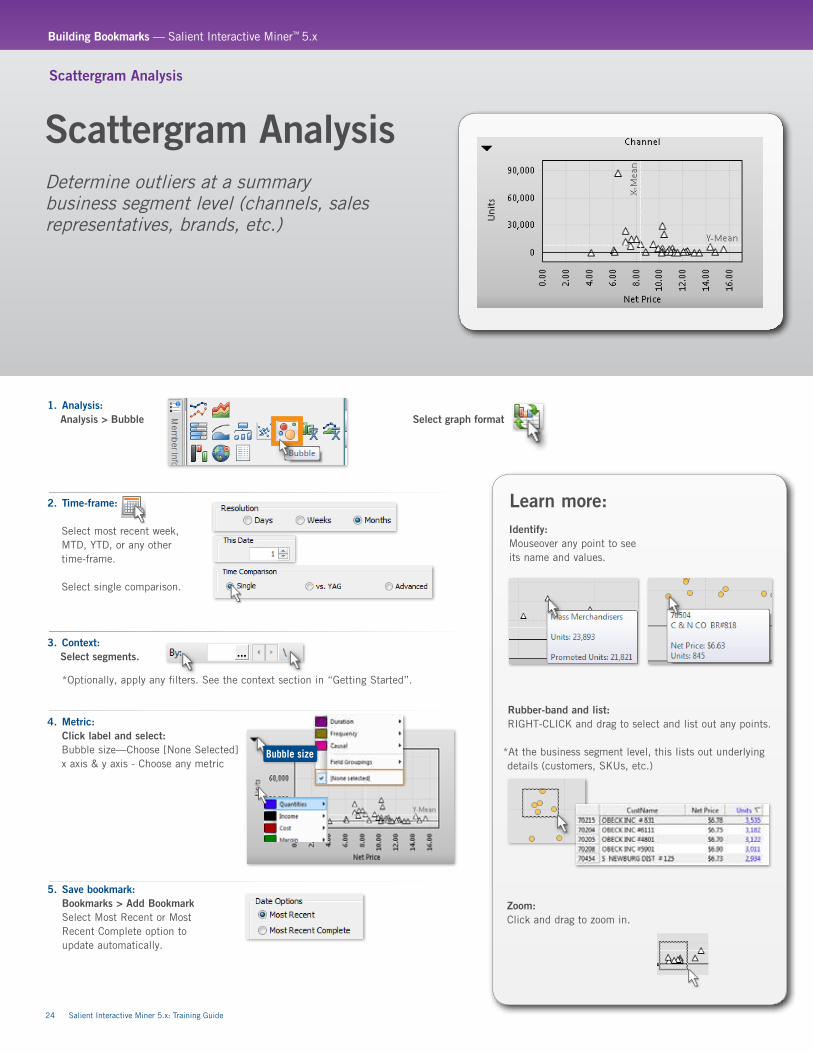
1. Analysis: Analysis > Bubble
2. Time-frame: Select most recent week, MTD, YTD, or any other time-frame. Select single comparison.
3. Context: Select segments.
*Optionally, apply any filters. See the context section in “Getting Started”.
4. Metric: Click label and select: Bubble size—Choose [None Selected] x axis & y axis - Choose any metric
5. Save bookmark: Bookmarks > Add Bookmark Select Most Recent or Most Recent Complete option to update automatically.
Scattergram Analysis
Scattergram Analysis
Determine outliers at a summary business segment level (channels, sales representatives, brands, etc.)
Learn more: Identify:Mouseover any point to see its name and values.
Rubber-band and list:RIGHT-CLICK and drag to select and list out any points.
*At the business segment level, this lists out underlying details (customers, SKUs, etc.)
Zoom:Click and drag to zoom in.
Select graph format
Bubble size
Building Bookmarks — Salient Interactive Miner™ 5.x
Salient Interactive Miner 5.x: Training Guide 25
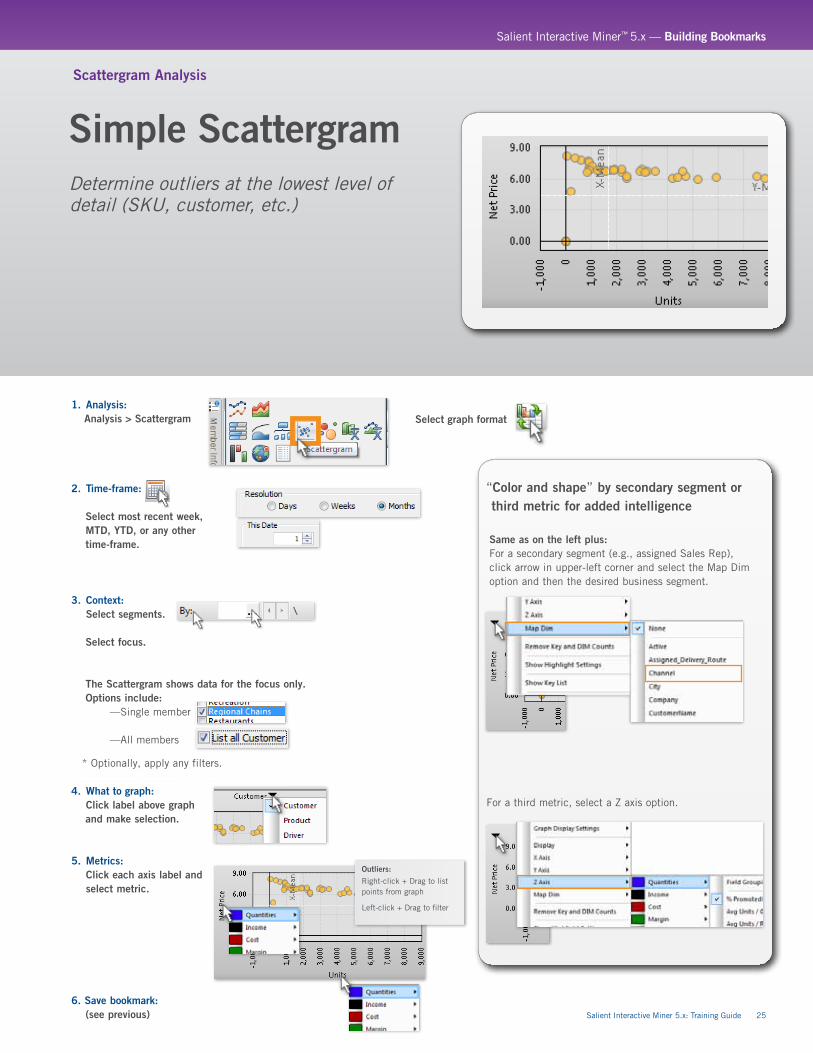
1. Analysis: Analysis > Scattergram
2. Time-frame: Select most recent week, MTD, YTD, or any other time-frame.
3. Context: Select segments. Select focus.
The Scattergram shows data for the focus only. Options include: —Single member —All members
* Optionally, apply any filters.
4. What to graph: Click label above graph and make selection.
5. Metrics: Click each axis label and select metric.
6. Save bookmark: (see previous)
Select graph format
Simple Scattergram
Scattergram Analysis
Determine outliers at the lowest level of detail (SKU, customer, etc.)
“Color and shape” by secondary segment or third metric for added intelligence
Same as on the left plus: For a secondary segment (e.g., assigned Sales Rep), click arrow in upper-left corner and select the Map Dim option and then the desired business segment.
For a third metric, select a Z axis option.
Outliers: Right-click + Drag to list points from graph
Left-click + Drag to filter
Salient Interactive Miner™ 5.x — Building Bookmarks
26 Salient Interactive Miner 5.x: Training Guide
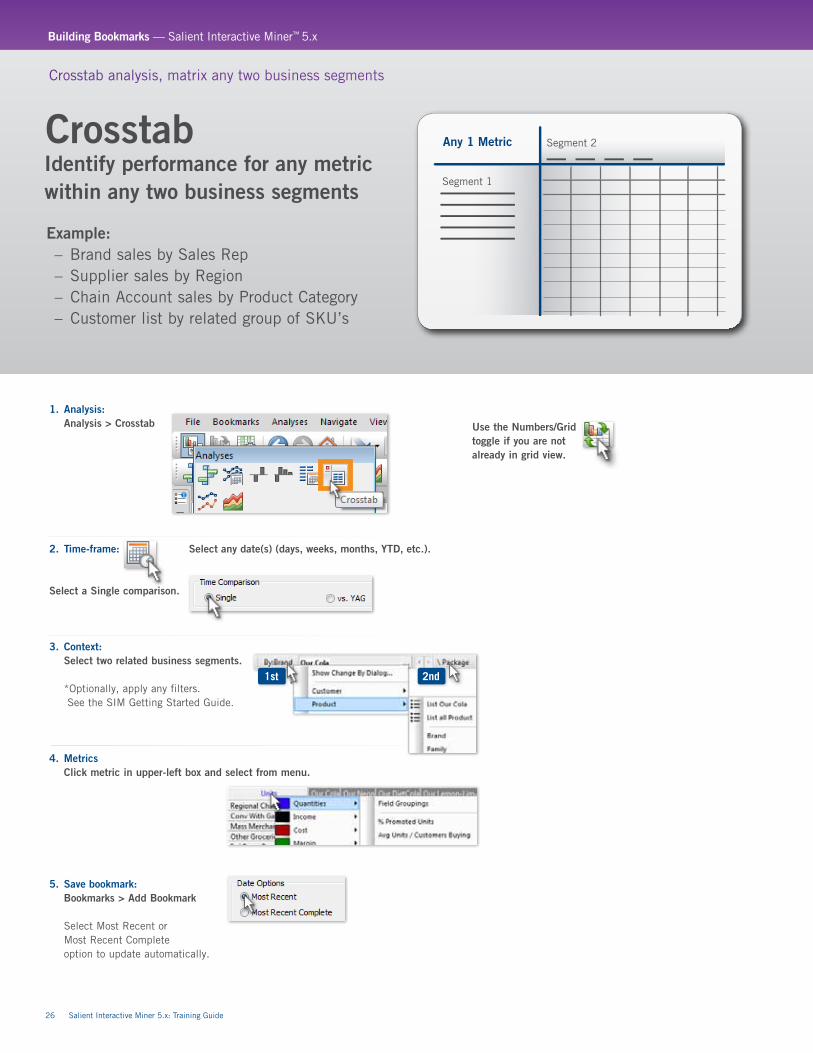
1. Analysis: Analysis > Crosstab
2. Time-frame: Select any date(s) (days, weeks, months, YTD, etc.).
Select a Single comparison.
3. Context: Select two related business segments.
*Optionally, apply any filters. See the SIM Getting Started Guide.
4. Metrics Click metric in upper-left box and select from menu.
5. Save bookmark: Bookmarks > Add Bookmark
Select Most Recent or Most Recent Complete option to update automatically.
Crosstab Identify performance for any metric within any two business segments
Crosstab analysis, matrix any two business segments
Use the Numbers/Grid toggle if you are not already in grid view.
1st 2nd
Segment 1
Any 1 Metric Segment 2
Example: – Brand sales by Sales Rep – Supplier sales by Region – Chain Account sales by Product Category – Customer list by related group of SKU’s
Building Bookmarks — Salient Interactive Miner™ 5.x
Salient Interactive Miner 5.x: Training Guide 27
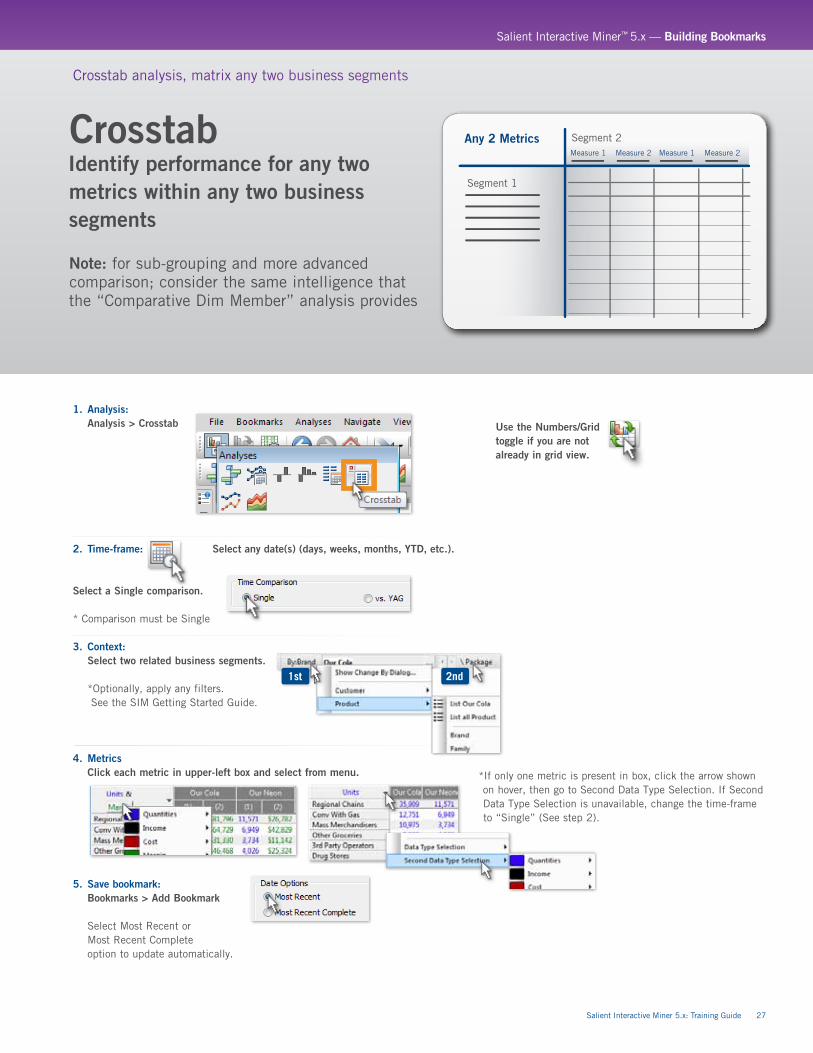
CrosstabIdentify performance for any two metrics within any two business segments
Crosstab analysis, matrix any two business segments
1. Analysis: Analysis > Crosstab
2. Time-frame: Select any date(s) (days, weeks, months, YTD, etc.).
Select a Single comparison.
* Comparison must be Single
3. Context: Select two related business segments.
*Optionally, apply any filters. See the SIM Getting Started Guide.
4. Metrics Click each metric in upper-left box and select from menu.
5. Save bookmark: Bookmarks > Add Bookmark
Select Most Recent or Most Recent Complete option to update automatically.
Use the Numbers/Grid toggle if you are not already in grid view.
1st 2nd
Segment 1
Any 2 MetricsMeasure 1 Measure 2 Measure 1 Measure 2
Segment 2
*If only one metric is present in box, click the arrow shown on hover, then go to Second Data Type Selection. If Second Data Type Selection is unavailable, change the time-frame to “Single” (See step 2).
Note: for sub-grouping and more advanced comparison; consider the same intelligence that the “Comparative Dim Member” analysis provides
Salient Interactive Miner™ 5.x — Building Bookmarks
28 Salient Interactive Miner 5.x: Training Guide
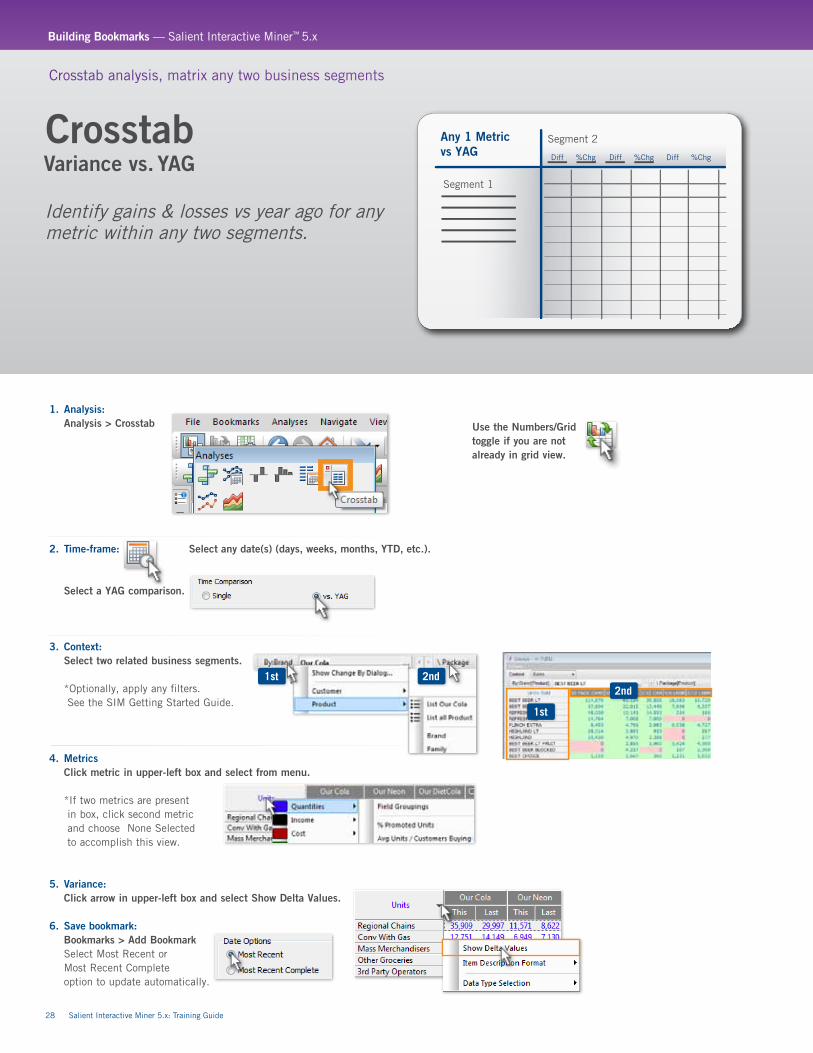
1. Analysis: Analysis > Crosstab
2. Time-frame: Select any date(s) (days, weeks, months, YTD, etc.).
Select a YAG comparison.
3. Context: Select two related business segments.
*Optionally, apply any filters. See the SIM Getting Started Guide.
4. Metrics Click metric in upper-left box and select from menu.
*If two metrics are present in box, click second metric and choose None Selected to accomplish this view.
5. Variance: Click arrow in upper-left box and select Show Delta Values.
6. Save bookmark: Bookmarks > Add Bookmark Select Most Recent or Most Recent Complete option to update automatically.
Crosstab Variance vs. YAG
Crosstab analysis, matrix any two business segments
Use the Numbers/Grid toggle if you are not already in grid view.
1st 2nd
Segment 1
Any 1 Metricvs YAG Diff %Chg Diff %Chg Diff %Chg
Segment 2
1st
2nd
Identify gains & losses vs year ago for any metric within any two segments.
Building Bookmarks — Salient Interactive Miner™ 5.x
Salient Interactive Miner 5.x: Training Guide 29
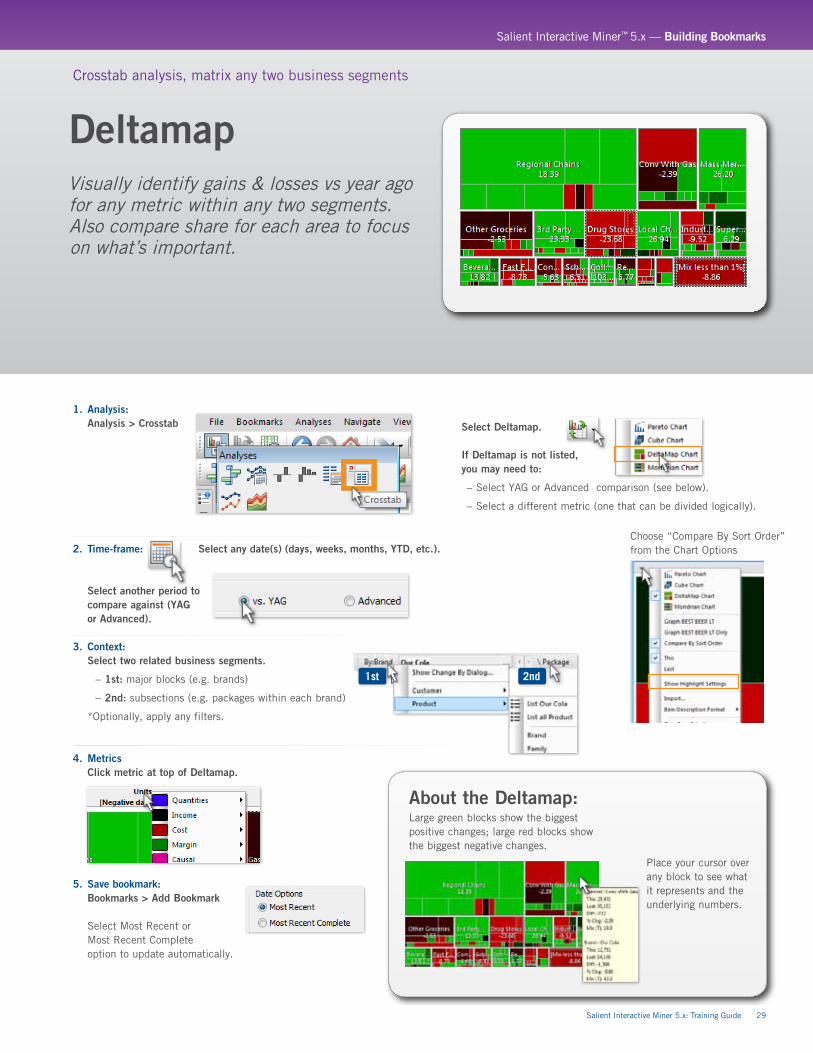
1. Analysis: Analysis > Crosstab
2. Time-frame: Select any date(s) (days, weeks, months, YTD, etc.).
Select another period to compare against (YAG or Advanced).
3. Context: Select two related business segments.
– 1st: major blocks (e.g. brands)
– 2nd: subsections (e.g. packages within each brand)
*Optionally, apply any filters.
4. Metrics Click metric at top of Deltamap.
5. Save bookmark: Bookmarks > Add Bookmark
Select Most Recent or Most Recent Complete option to update automatically.
Select Deltamap.
If Deltamap is not listed, you may need to:
– Select YAG or Advanced comparison (see below).
– Select a different metric (one that can be divided logically).
Deltamap
Crosstab analysis, matrix any two business segments
1st 2nd
About the Deltamap: Large green blocks show the biggest positive changes; large red blocks show the biggest negative changes.
Place your cursor over any block to see what it represents and the underlying numbers.
Choose “Compare By Sort Order” from the Chart Options
Visually identify gains & losses vs year ago for any metric within any two segments. Also compare share for each area to focus on what’s important.
Salient Interactive Miner™ 5.x — Building Bookmarks
30 Salient Interactive Miner 5.x: Training Guide
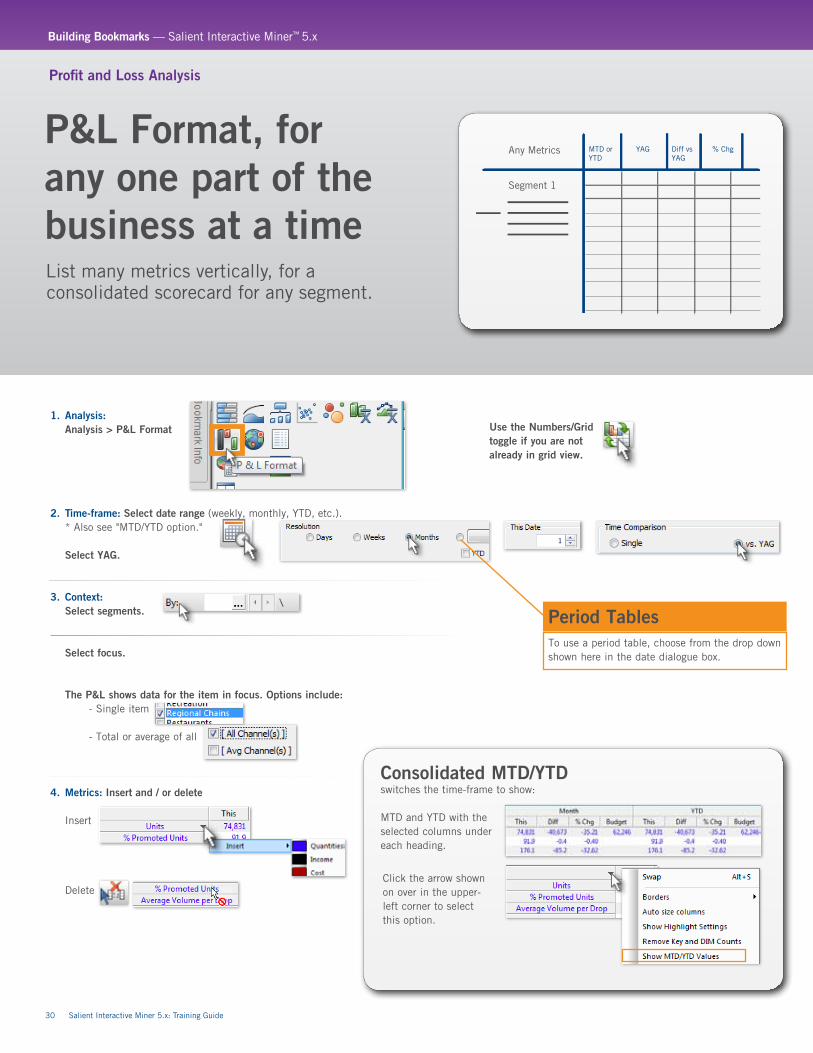
1. Analysis: Analysis > P&L Format
2. Time-frame: Select date range (weekly, monthly, YTD, etc.). * Also see "MTD/YTD option."
Select YAG.
3. Context: Select segments.
Select focus.
The P&L shows data for the item in focus. Options include: - Single item
- Total or average of all
4. Metrics: Insert and / or delete
Insert
Delete
Any Metrics MTD orYTD
YAG Diff vsYAG
% Chg
Segment 1
P&L Format, for any one part of the business at a time
Profit and Loss Analysis
Click the arrow shown on over in the upper-left corner to select this option.
Consolidated MTD/YTD switches the time-frame to show:
MTD and YTD with the selected columns under each heading.
Use the Numbers/Grid toggle if you are not already in grid view.
List many metrics vertically, for a consolidated scorecard for any segment.
Period TablesTo use a period table, choose from the drop down shown here in the date dialogue box.
Building Bookmarks — Salient Interactive Miner™ 5.x
Salient Interactive Miner 5.x: Training Guide 31
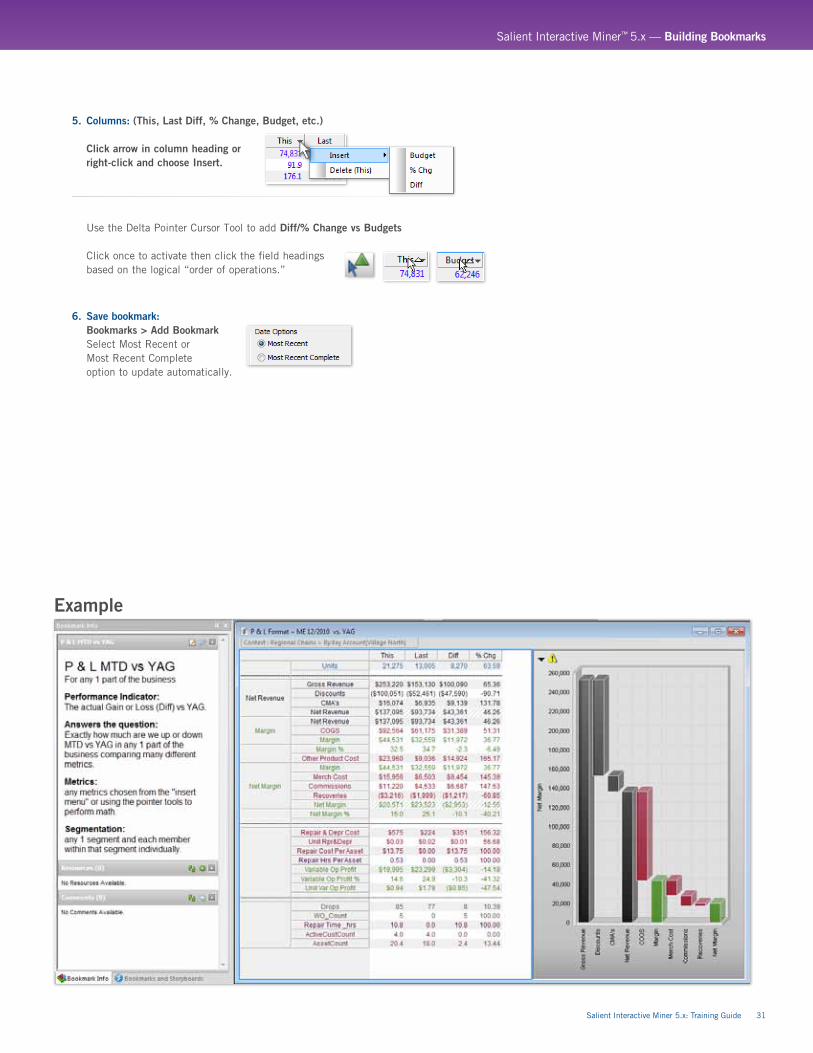
5. Columns: (This, Last Diff, % Change, Budget, etc.)
Click arrow in column heading or right-click and choose Insert.
Use the Delta Pointer Cursor Tool to add Diff/% Change vs Budgets
Click once to activate then click the field headings based on the logical “order of operations.”
6. Save bookmark: Bookmarks > Add Bookmark Select Most Recent or Most Recent Complete option to update automatically.
Example
Salient Interactive Miner™ 5.x — Building Bookmarks
32 Salient Interactive Miner 5.x: Training Guide
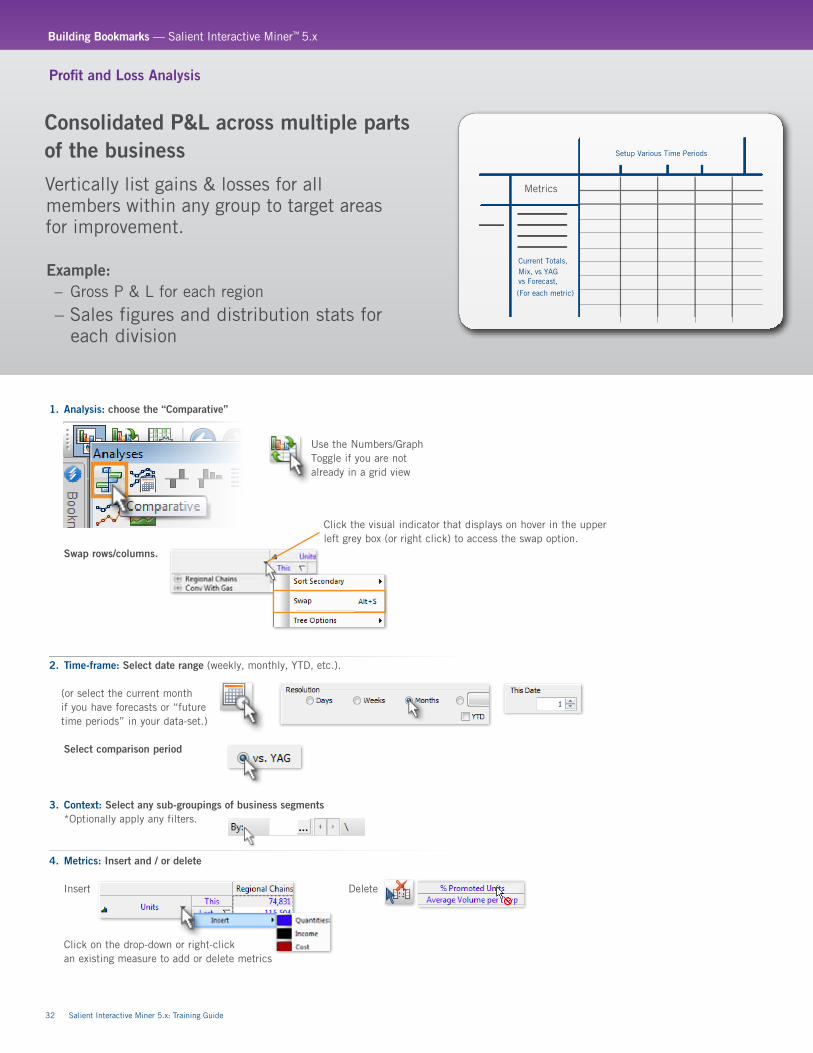
1. Analysis: choose the “Comparative”
Swap rows/columns.
2. Time-frame: Select date range (weekly, monthly, YTD, etc.).
(or select the current monthif you have forecasts or “futuretime periods” in your data-set.)
Select comparison period
3. Context: Select any sub-groupings of business segments *Optionally apply any filters.
4. Metrics: Insert and / or delete
Insert Delete
Click on the drop-down or right-click an existing measure to add or delete metrics
Metrics
Setup Various Time Periods
Current Totals,Mix, vs YAGvs Forecast,
(For each metric)
Consolidated P&L across multiple parts of the business
Profit and Loss Analysis
Click the visual indicator that displays on hover in the upper left grey box (or right click) to access the swap option.
Use the Numbers/Graph Toggle if you are not already in a grid view
Vertically list gains & losses for all members within any group to target areas for improvement.
Example: – Gross P & L for each region
– Sales figures and distribution stats for each division
Building Bookmarks — Salient Interactive Miner™ 5.x
Salient Interactive Miner 5.x: Training Guide 33
5. Add Variance, Mix, Budgets:
% Change and Difference
Percent of total (mix)
Budget/forecast: same as inserting metrics above
6. Save bookmark: Bookmarks > Add Bookmark Select Most Recent to automatically update
Additional Concepts: SeparatorsInsert horizontal lines or spaces to separate groups of related metrics.
Expanding metricsDouble-click on a calculated metric to expand it into its components.
Click arrow to open menu.
Select blank, dashed, or double dashed.
double-click
Salient Interactive Miner™ 5.x — Building Bookmarks
34 Salient Interactive Miner 5.x: Training Guide
1. Analysis: choose the “Normal Trend”
Swap rows/columns.
2. Time-frame: Select most recent 12 months.
3. Context: Select segments.
Select focus.
4. Metrics: Click label and select: Insert Delete
5. Save bookmark: Bookmarks > Add Bookmark Select Most Recent to automatically update
Rolling 12-month P&L over time
Profit and Loss Analysis
MetricMetric
Any Metrics Consecutive Days, Wks, MonthsRolling 12 Month (Month over Month)
Use the Numbers/Graph Toggle if you are not already in a grid view
Left or right-click near the visual indicator that display on hover in the upper left grey box (or right click) to access the swap option.
Consolidate financials or many metrics for any part of the business over time (rolling Periods, Months, Weeks, Quarters...)
Building Bookmarks — Salient Interactive Miner™ 5.x
Salient Interactive Miner 5.x: Training Guide 35
1. Analysis: Analysis > Comparative Time Series
Swap rows/columns.
2. Time-frame: Select most recent 12 months.
Select vs. YAG
3. Context: Select segments.
Select focus.
4. Metrics: Click label and select: Insert Delete
5. Add Variance and Budgets: % Change and Difference
Budget/forecast - same as inserting metrics above
6. Save bookmark: Bookmarks > Add Bookmark Select Most Recent to automatically update
Rolling 12-month P&L over time vs YAG
Profit and Loss Analysis
Metric
Rolling 12 Month (Month over Month) vs YAG
Monthvs YAG
Monthvs YAG
Monthvs YAG
Monthvs YAG
Monthvs YAG
Select numbers grid.
Left or right-click near the visual indicator that displays on hover in the upper left grey box (or right click) to access the swap option.
Idenify gains & losses (diff & %change) vs Year ago or forecast with consolidated financials or other stats for any part of the business over time (rolling Periods, Months, Weeks, Quarters...)
Salient Interactive Miner™ 5.x — Building Bookmarks
36 Salient Interactive Miner 5.x: Training Guide
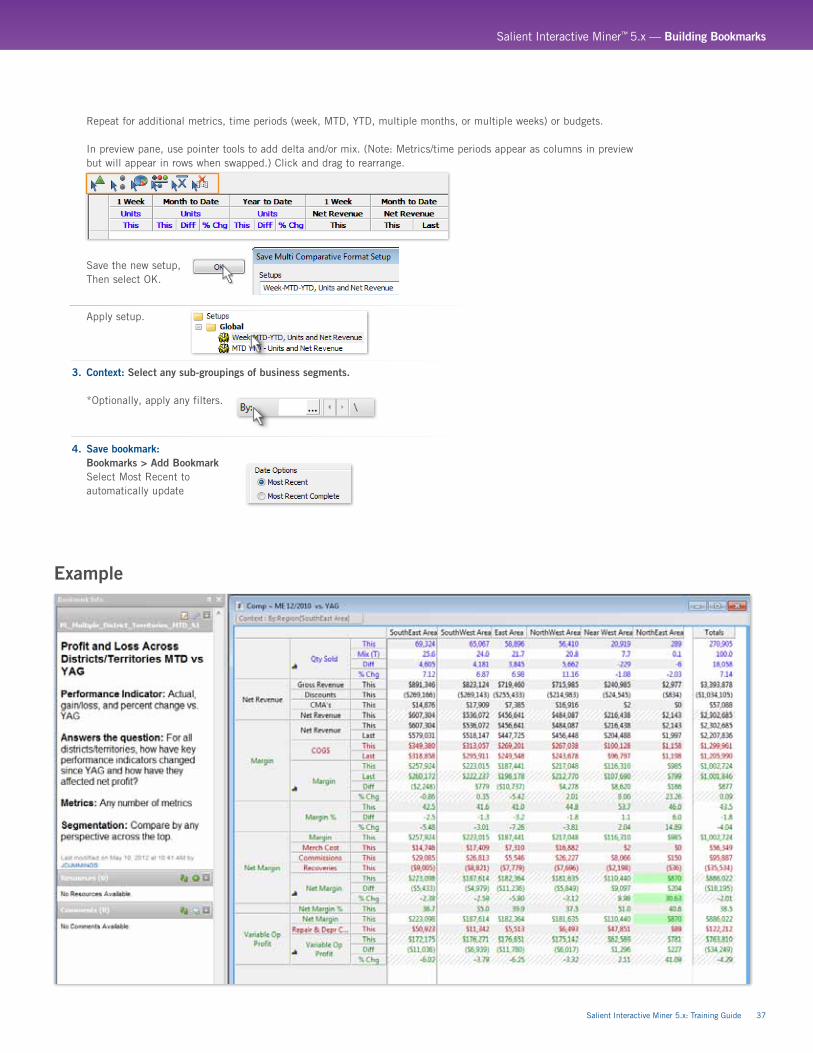
1. Analysis: Analysis > Multi Comparative
` Swap rows/columns.
2. Configure columns with metrics by Time Period:On the Analyses Menu, select Comparative > Multi-Comparative. In Multi Comparative Setup, click Setup.In the next dialog click New. Select options as shown and click Add.
Measures Grouped by Time Period
Multiple Segments Multi Segments
Current Totals,Mix, vs YAGvs Forecast,
(For each metric)
P&L, for combinations of time periods
Profit and Loss Analysis
Select metric
Select time period
Select This/Last or budget
Click the visual indicator that display on hover in the upper left grey box (or right click) to access the swap option.
Consolidate your daily, monthly, MTD, YTD or period-based reporting into one consolidated gains & losses drill-down perspective to target areas for improvement.
Building Bookmarks — Salient Interactive Miner™ 5.x
Salient Interactive Miner 5.x: Training Guide 37
Repeat for additional metrics, time periods (week, MTD, YTD, multiple months, or multiple weeks) or budgets.
In preview pane, use pointer tools to add delta and/or mix. (Note: Metrics/time periods appear as columns in preview but will appear in rows when swapped.) Click and drag to rearrange.
Save the new setup, Then select OK.
Apply setup.
3. Context: Select any sub-groupings of business segments.
*Optionally, apply any filters.
4. Save bookmark: Bookmarks > Add Bookmark Select Most Recent to automatically update
Example
Salient Interactive Miner™ 5.x — Building Bookmarks
38 Salient Interactive Miner 5.x: Training Guide
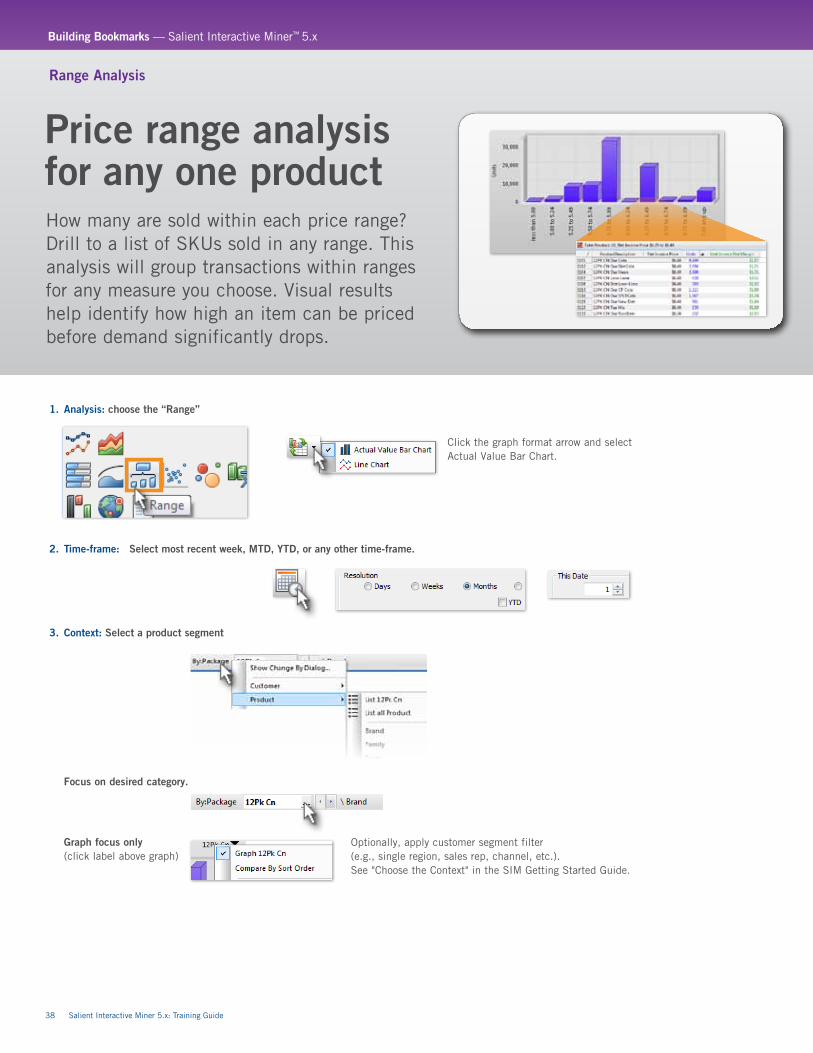
1. Analysis: choose the “Range”
2. Time-frame: Select most recent week, MTD, YTD, or any other time-frame.
3. Context: Select a product segment
Focus on desired category.
Graph focus only (click label above graph)
Price range analysis for any one product
Range Analysis
How many are sold within each price range? Drill to a list of SKUs sold in any range. This analysis will group transactions within ranges for any measure you choose. Visual results help identify how high an item can be priced before demand significantly drops.
Click the graph format arrow and select Actual Value Bar Chart.
Optionally, apply customer segment filter (e.g., single region, sales rep, channel, etc.). See "Choose the Context" in the SIM Getting Started Guide.
Building Bookmarks — Salient Interactive Miner™ 5.x
Salient Interactive Miner 5.x: Training Guide 39
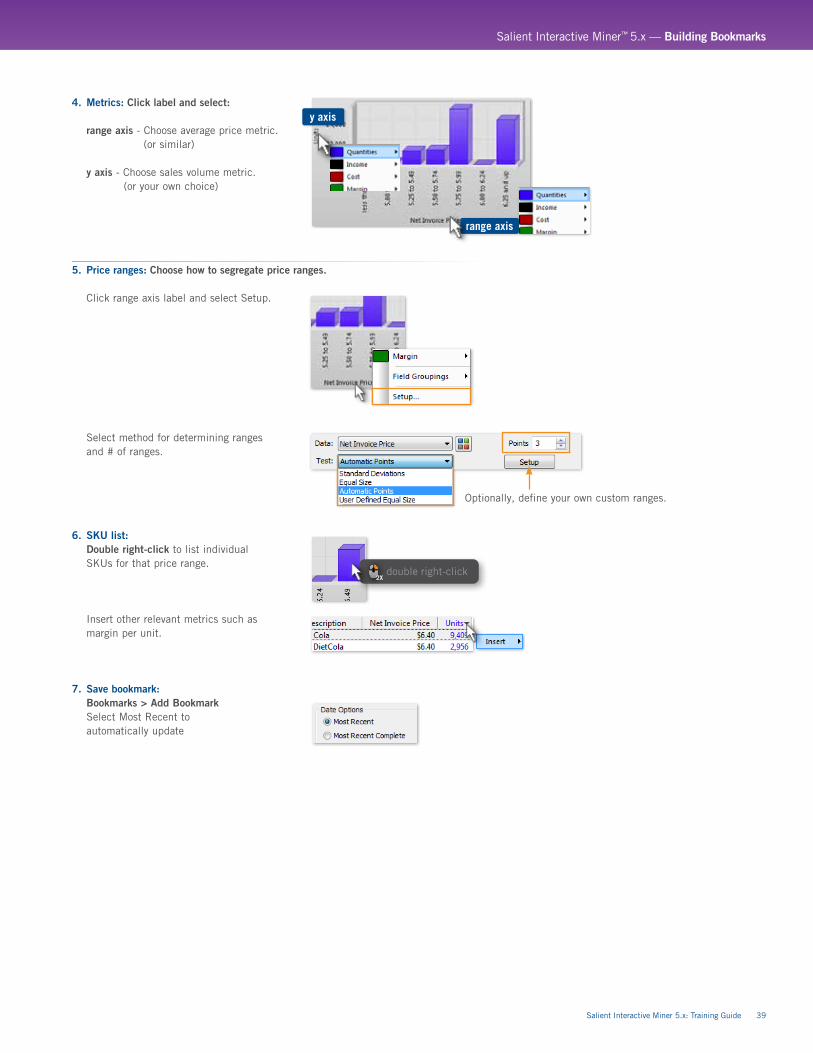
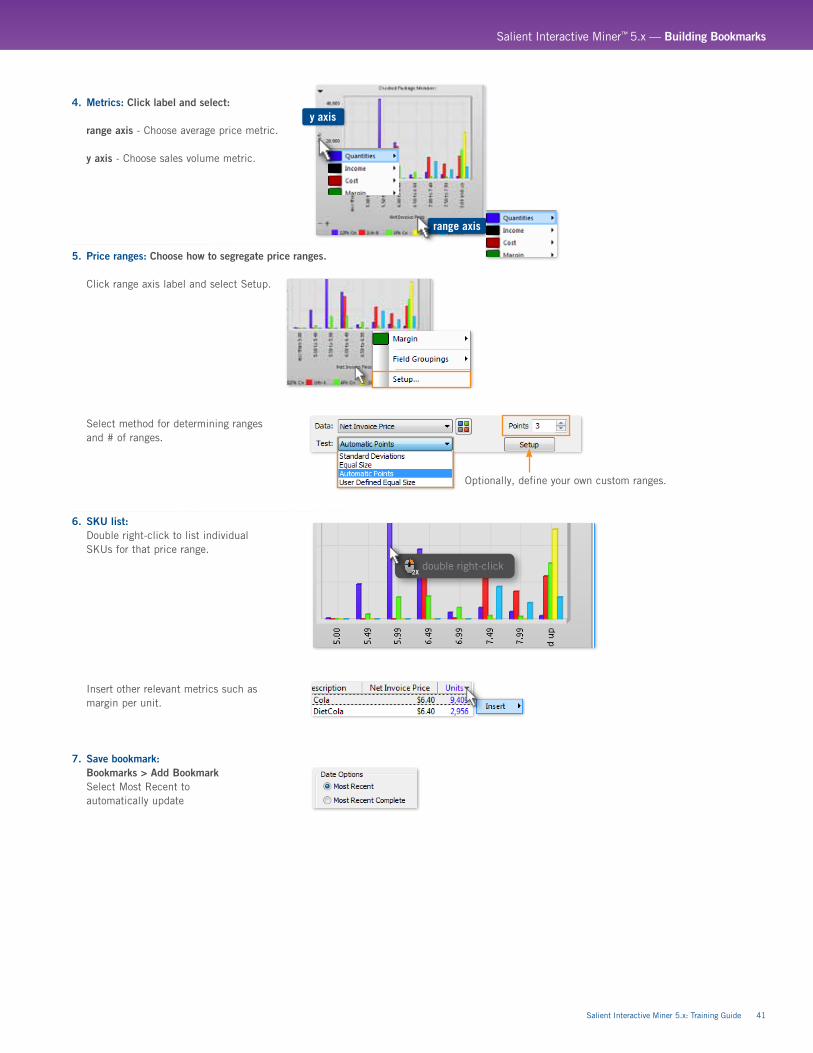
4. Metrics: Click label and select: range axis - Choose average price metric. (or similar)
y axis - Choose sales volume metric. (or your own choice)
5. Price ranges: Choose how to segregate price ranges.
Click range axis label and select Setup.
Select method for determining ranges and # of ranges.
6. SKU list: Double right-click to list individual SKUs for that price range.
Insert other relevant metrics such as margin per unit.
7. Save bookmark: Bookmarks > Add Bookmark Select Most Recent to automatically update
y axis
range axis
Optionally, define your own custom ranges.
double right-click
Salient Interactive Miner™ 5.x — Building Bookmarks
40 Salient Interactive Miner 5.x: Training Guide
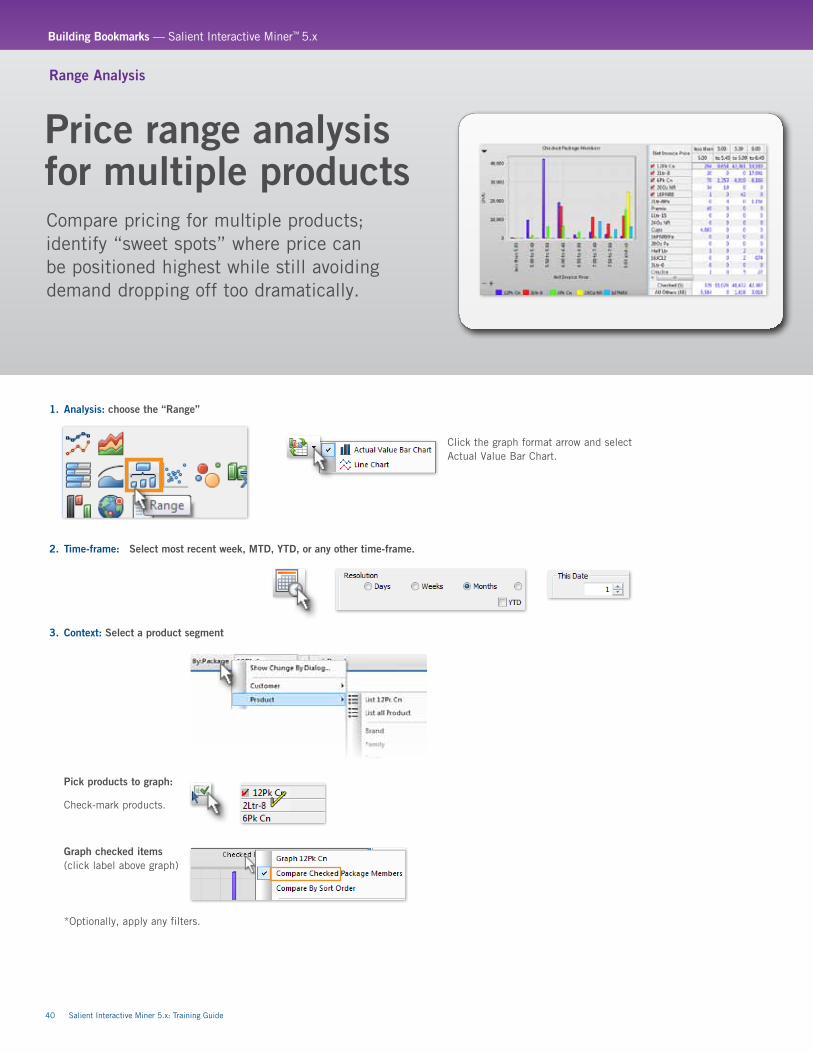
1. Analysis: choose the “Range”
2. Time-frame: Select most recent week, MTD, YTD, or any other time-frame.
3. Context: Select a product segment
Pick products to graph: Check-mark products.
Graph checked items (click label above graph)
*Optionally, apply any filters.
Price range analysis for multiple products
Range Analysis
Compare pricing for multiple products; identify “sweet spots” where price can be positioned highest while still avoiding demand dropping off too dramatically.
Click the graph format arrow and select Actual Value Bar Chart.
Building Bookmarks — Salient Interactive Miner™ 5.x
Salient Interactive Miner 5.x: Training Guide 41
4. Metrics: Click label and select: range axis - Choose average price metric.
y axis - Choose sales volume metric.
5. Price ranges: Choose how to segregate price ranges.
Click range axis label and select Setup.
Select method for determining ranges and # of ranges.
6. SKU list: Double right-click to list individual SKUs for that price range.
Insert other relevant metrics such as margin per unit.
7. Save bookmark: Bookmarks > Add Bookmark Select Most Recent to automatically update
y axis
range axis
Optionally, define your own custom ranges.
double right-click
Salient Interactive Miner™ 5.x — Building Bookmarks
42 Salient Interactive Miner 5.x: Training Guide
1. Analysis: choose the “Comparative”
2. Time-frame: Select most recent week, MTD, YTD, or any other time-frame.
Select another period to compare against (YAG or Advanced).
3. Context: Select sub-groupings (up to five levels to show market type/channel, brand, product, price, and customer) Expand desired groupings.
4. Metrics: volume, price, margin Insert Delete
Difference / %change To make it easier to find price change occurances
5. Save bookmark: Bookmarks > Add Bookmark
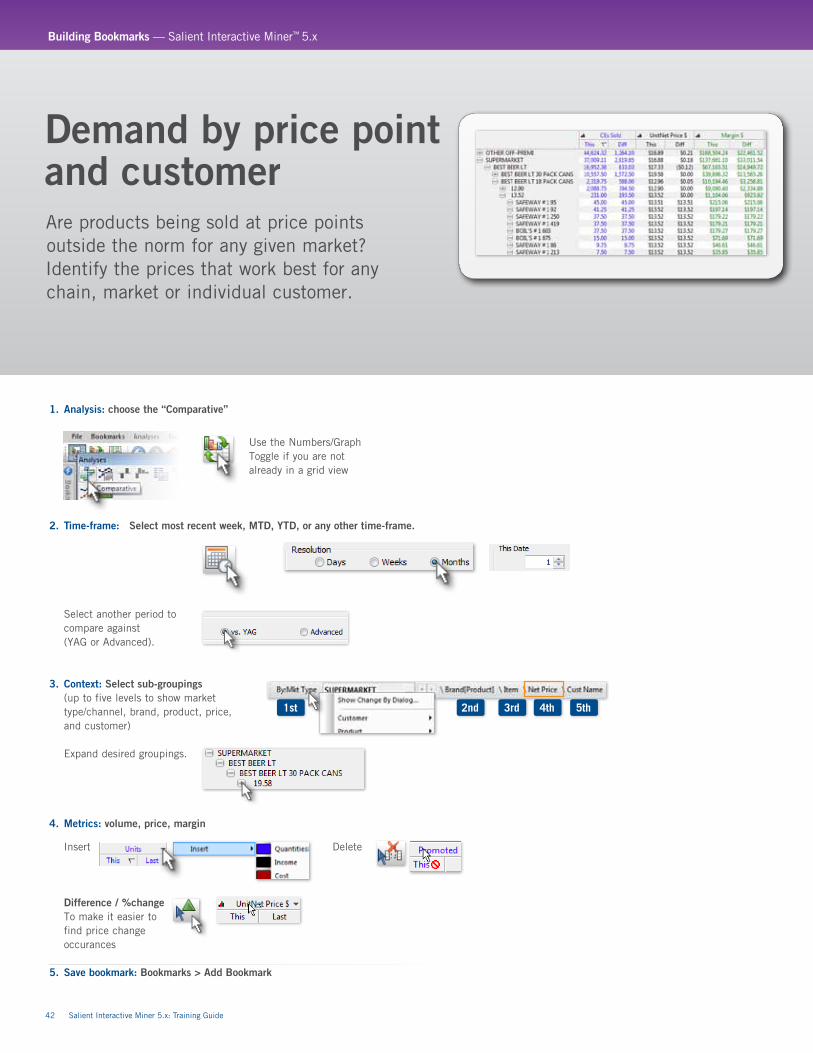
Demand by price point and customerAre products being sold at price points outside the norm for any given market? Identify the prices that work best for any chain, market or individual customer.
1st 2nd 3rd 4th 5th
Use the Numbers/Graph Toggle if you are not already in a grid view
Building Bookmarks — Salient Interactive Miner™ 5.x
Salient Interactive Miner 5.x: Getting Started 43
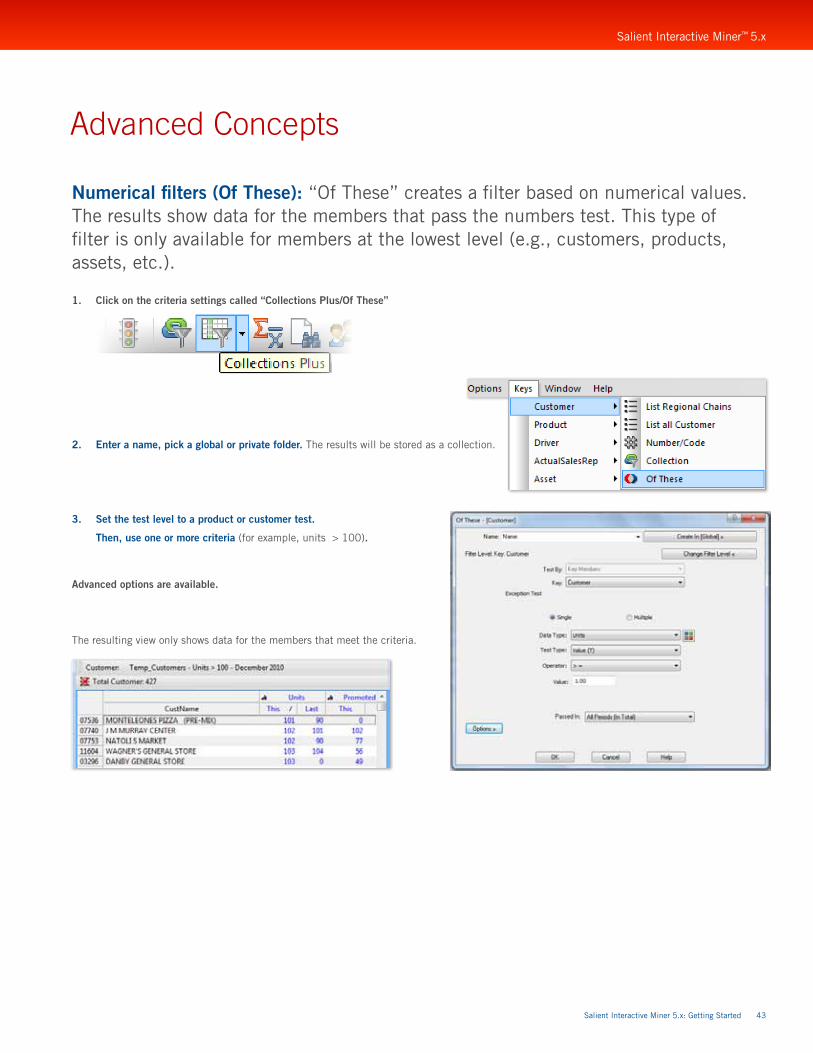
Numerical filters (Of These): “Of These” creates a filter based on numerical values. The results show data for the members that pass the numbers test. This type of filter is only available for members at the lowest level (e.g., customers, products, assets, etc.).
Advanced Concepts
1. Click on the criteria settings called “Collections Plus/Of These”
2. Enter a name, pick a global or private folder. The results will be stored as a collection.
3. Set the test level to a product or customer test.
Then, use one or more criteria (for example, units > 100).
Advanced options are available.
The resulting view only shows data for the members that meet the criteria.
Salient Interactive Miner™ 5.x
44 Salient Interactive Miner 5.x: Getting Started
Advanced Concepts
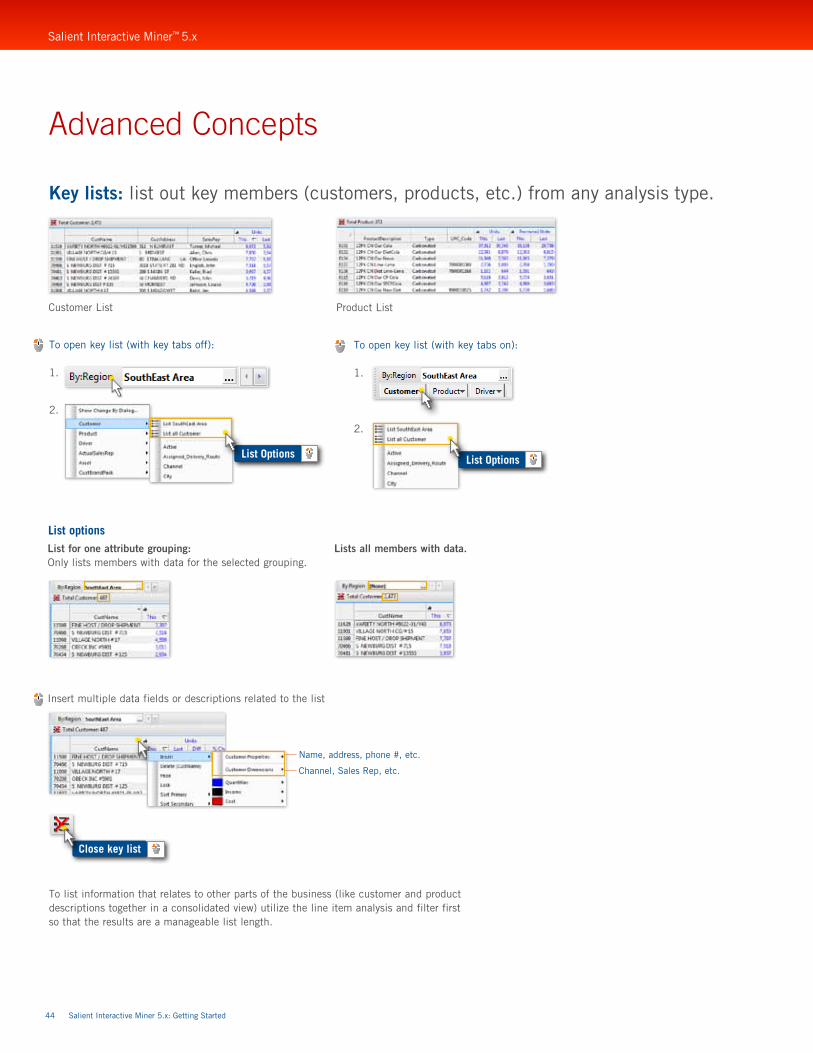
To open key list (with key tabs off):
1.
2.
To open key list (with key tabs on):
1.
2.
Insert multiple data fields or descriptions related to the list
List for one attribute grouping: Only lists members with data for the selected grouping.
Lists all members with data.
List options
List Options List Options
Close key list
Name, address, phone #, etc.
Channel, Sales Rep, etc.
To list information that relates to other parts of the business (like customer and product descriptions together in a consolidated view) utilize the line item analysis and filter first so that the results are a manageable list length.
Customer List Product List
Key lists: list out key members (customers, products, etc.) from any analysis type.
Salient Interactive Miner™ 5.x
Salient Interactive Miner 5.x: Getting Started 45
Advanced Concepts
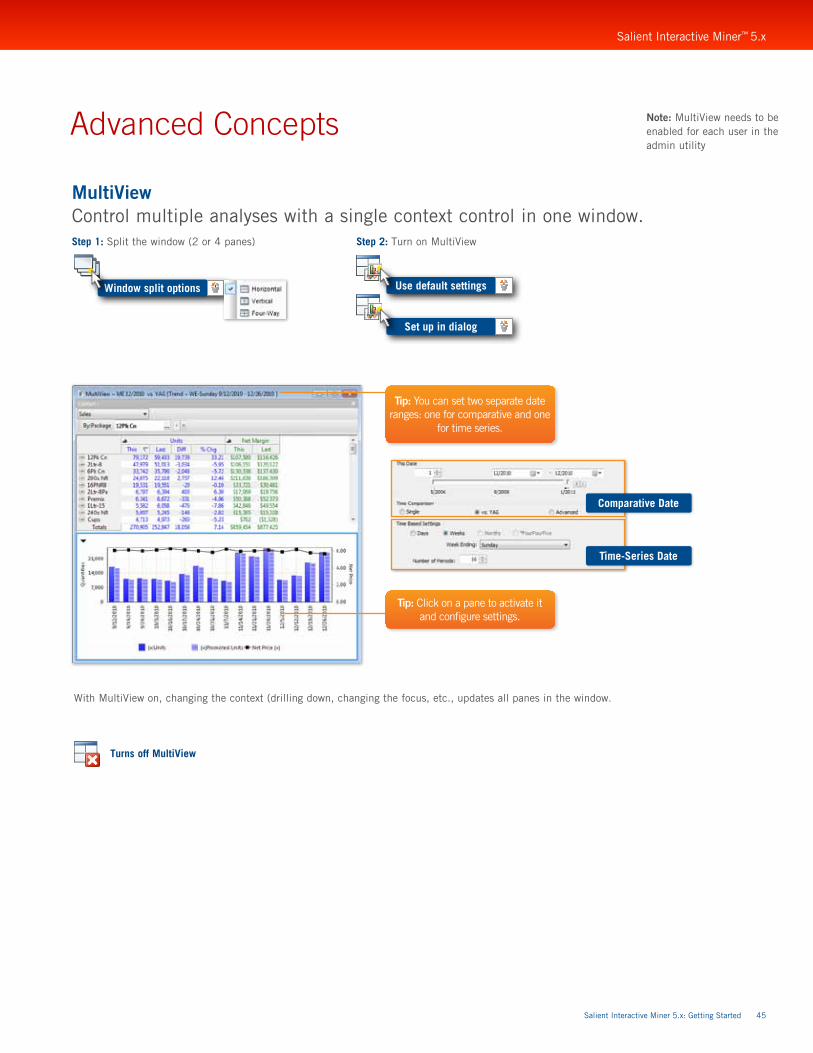
MultiView Control multiple analyses with a single context control in one window.Step 1: Split the window (2 or 4 panes)
Turns off MultiView
Step 2: Turn on MultiView
Tip: You can set two separate date ranges: one for comparative and one
for time series.
Tip: Click on a pane to activate it and configure settings.
Comparative Date
Time-Series Date
With MultiView on, changing the context (drilling down, changing the focus, etc., updates all panes in the window.
Window split options Use default settings
Set up in dialog
Note: MultiView needs to be enabled for each user in the admin utility
Salient Interactive Miner™ 5.x
46 Salient Interactive Miner 5.x: Getting Started
Save & Share Intelligence
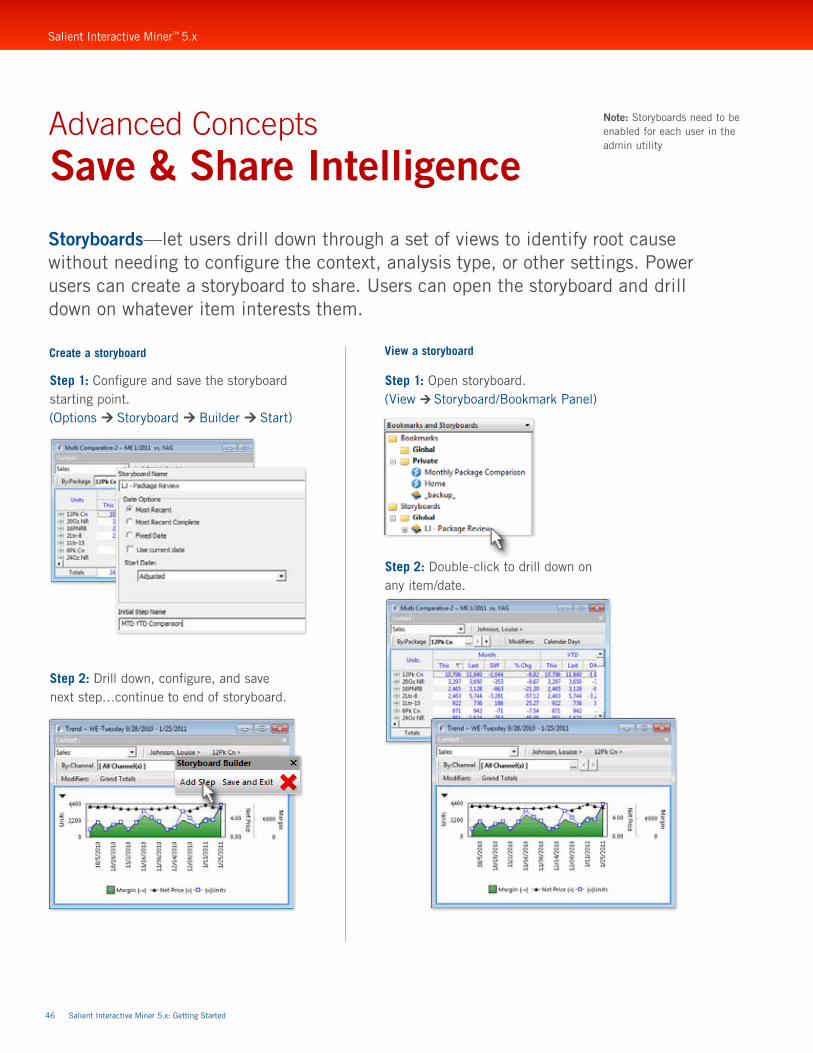
Storyboards—let users drill down through a set of views to identify root cause without needing to configure the context, analysis type, or other settings. Power users can create a storyboard to share. Users can open the storyboard and drill down on whatever item interests them.
Create a storyboard View a storyboard
Step 1: Configure and save the storyboard starting point. (Options Storyboard Builder Start)
Step 2: Drill down, configure, and save next step…continue to end of storyboard.
Step 1: Open storyboard.(View Storyboard/Bookmark Panel)
Step 2: Double-click to drill down on any item/date.
Advanced Concepts Note: Storyboards need to be enabled for each user in the admin utility
Salient Interactive Miner™ 5.x
Salient Interactive Miner 5.x: Getting Started 47
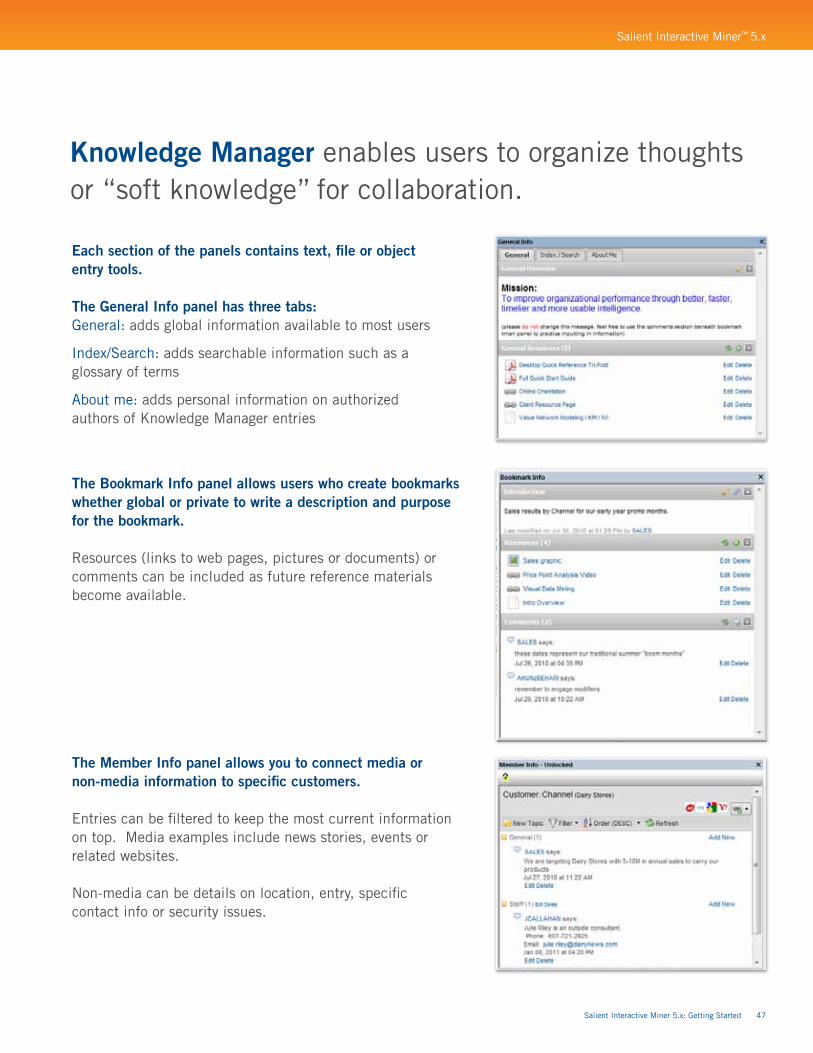
Knowledge Manager enables users to organize thoughts or “soft knowledge” for collaboration.
Each section of the panels contains text, file or object entry tools. The General Info panel has three tabs: General: adds global information available to most users
Index/Search: adds searchable information such as a glossary of terms
About me: adds personal information on authorized authors of Knowledge Manager entries
The Bookmark Info panel allows users who create bookmarks whether global or private to write a description and purpose for the bookmark.
Resources (links to web pages, pictures or documents) or comments can be included as future reference materials become available.
The Member Info panel allows you to connect media or non-media information to specific customers.
Entries can be filtered to keep the most current information on top. Media examples include news stories, events or related websites.
Non-media can be details on location, entry, specific contact info or security issues.
Salient Interactive Miner™ 5.x
©2013 Salient CorporationSalient Management Company 203 Colonial Drive, Horseheads, NY 14845 USA phone 607.739.4511 / 800.447.1868 fax 607.739.4045 www.salient.com
SALIENT MANAGEMENT COMPANY
We’ll make your information actionable, your organization transparent and every
process more controllable than ever before.
To discuss how Salient can help, call (607) 739-4511, or email the
Salient Management Institute at [email protected].
“If people do not see the process, they can not improve it.” W. Edwards Deming
About the Solution
Salient Management Company’s visual data mining solution enables users to evaluate results, identify outliers and their root causes, and refine managerial decision-making continuously. Drawing from existing systems, the solution automatically computes net value added by sales activity – revenue, costs, margins, adjustments – which is then made available for interactive interrogation and exploitation. Embedded expert analytics let business managers quickly locate the short lists of problems and opportunities they can attack immediately and monitor continuously. Founded in 1986, Salient today serves more than 45,000 users in 61 countries. For more information visit salient.com.