Embed Size (px)
Citation preview
Salina USD 305
i
• Budget General Information (characteristics of district)
• Supplemental Information for Tables in Summary of Expenditures
• KSDE Website Information Available
• Summary of Expenditures (Sumexpen.xlsx)
1
2014-15 Budget General Information USD #305
Introduction Salina USD 305 is the tenth largest school district in Kansas and encompasses the city of Salina, located in Saline County in north central Kansas. Salina USD 305 is a progressive, learner-focused school district. We believe our entire school community is responsible for the success of our students and we each share in the responsibility. It takes everyone, working cooperatively, to reach our common goal: Learning for all, Whatever it takes! An early-learning center, eight elementary, two middle, two high schools, and an alternative education school serve students in pre-kindergarten through grade 12. Enrollment is 7,306 (September 2013). Additionally, a diploma completion program for adults provides opportunity to complete requirements to earn a Central or South High School diploma. The school district is the sponsoring agency for the following educational programs:
• Central Kansas Cooperative in Education: CKCIE is a special education cooperative of 12 school districts providing special education support services to public schools.
• Heartland Head Start: This multi-county program serves preschool students and their parents and partners with other social service agencies to provide support services for these families.
• Salina Adult Education Center: This program provides adult basic education, English as a second language support and GED preparation for people 16 or older and out of school.
Board Members The board of education meets at 5 p.m. the second and fourth Tuesdays of each month (except July, October, November, December, January and May) in the district office, 1511 Gypsum, Salina. Board Members (elected July, 2014)
• Johnna Vosseller, President • Brett Cooper, Vice-President • Dr. Phil Black, Member • Carol Brandert, Member • Nedra Elbl, Member • Larry Michel, Member • Mary Anne Trickle, Member
Key Staff Superintendent: William D. Hall Executive Director of Business: Lisa Peters Accountant: Crystal Fowler-Srna Executive Director of Student and Administrative Support Services: Stan Vaughn Executive Director of School Improvement: Linn Exline Director of Staff Development: Pam Irwin Executive Director of Special Education Cooperative: Mike Lowers Executive Director of Human Resources: Dr. Nancy Kiltz Executive Director of Operations: Mike Nulton
2
General Counselor: Eryn Wright Director of Food and Nutrition Services: Cindy Foley Director of Bond Projects: Kristofer Upson Public Information Director: Jennifer Bradford-Vernon
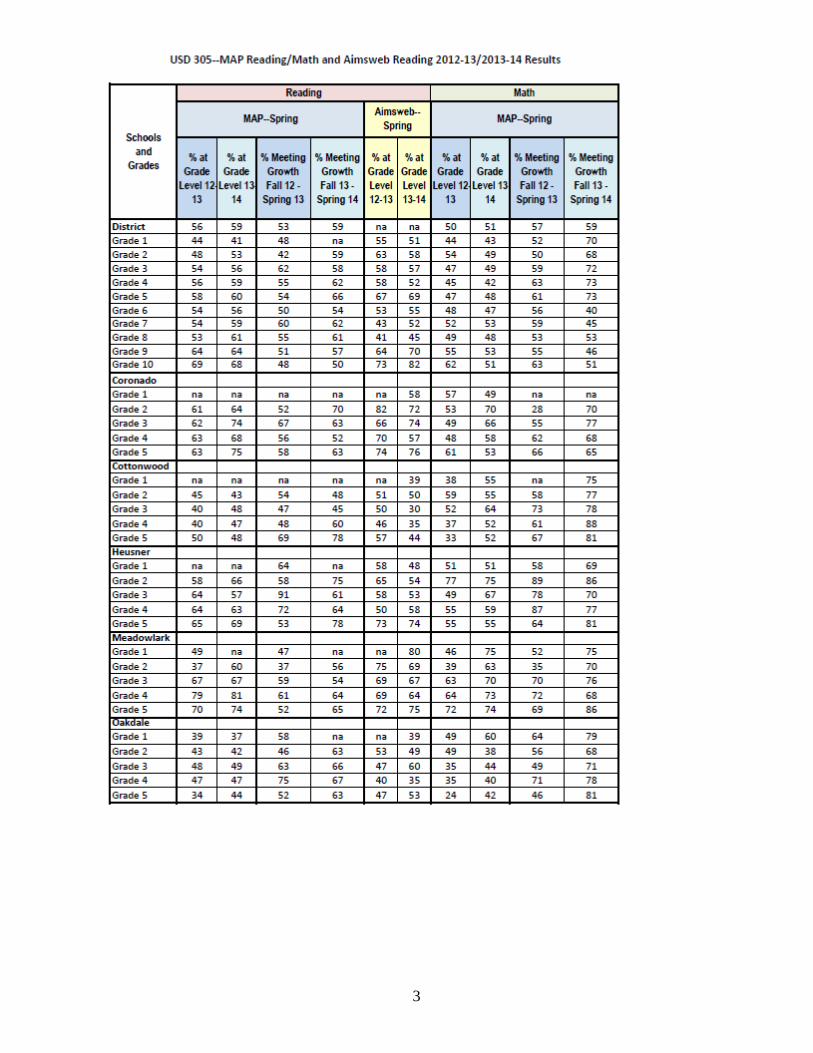
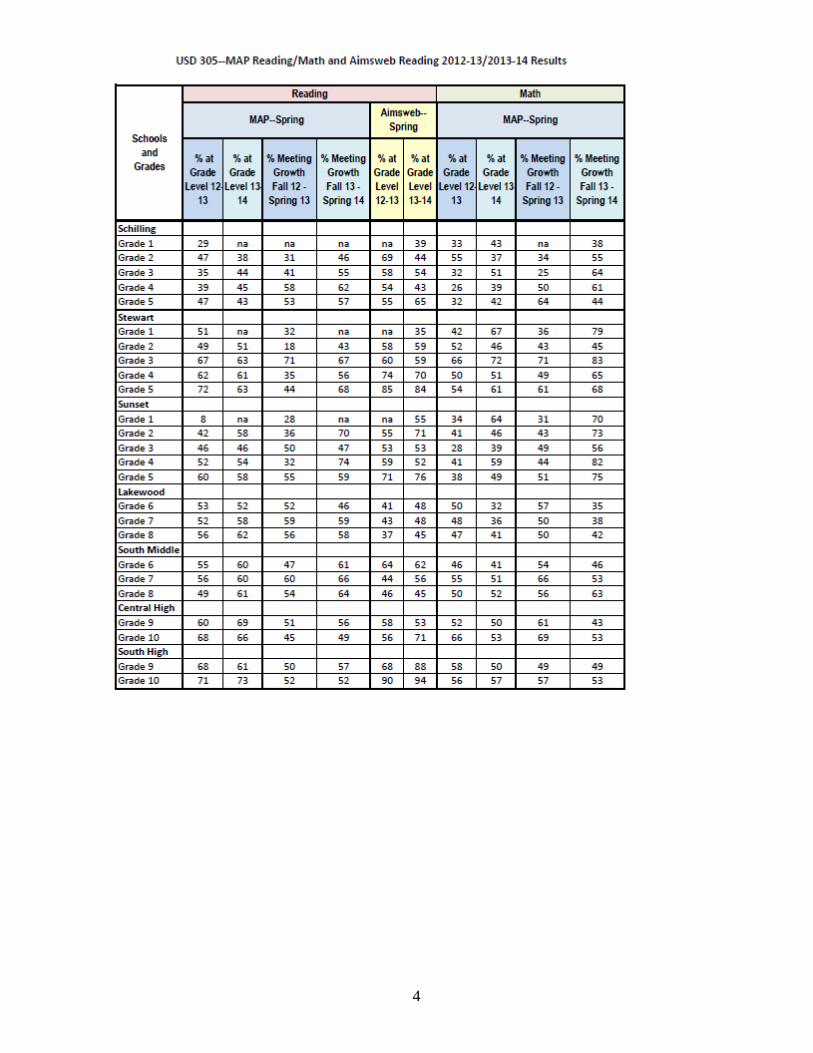
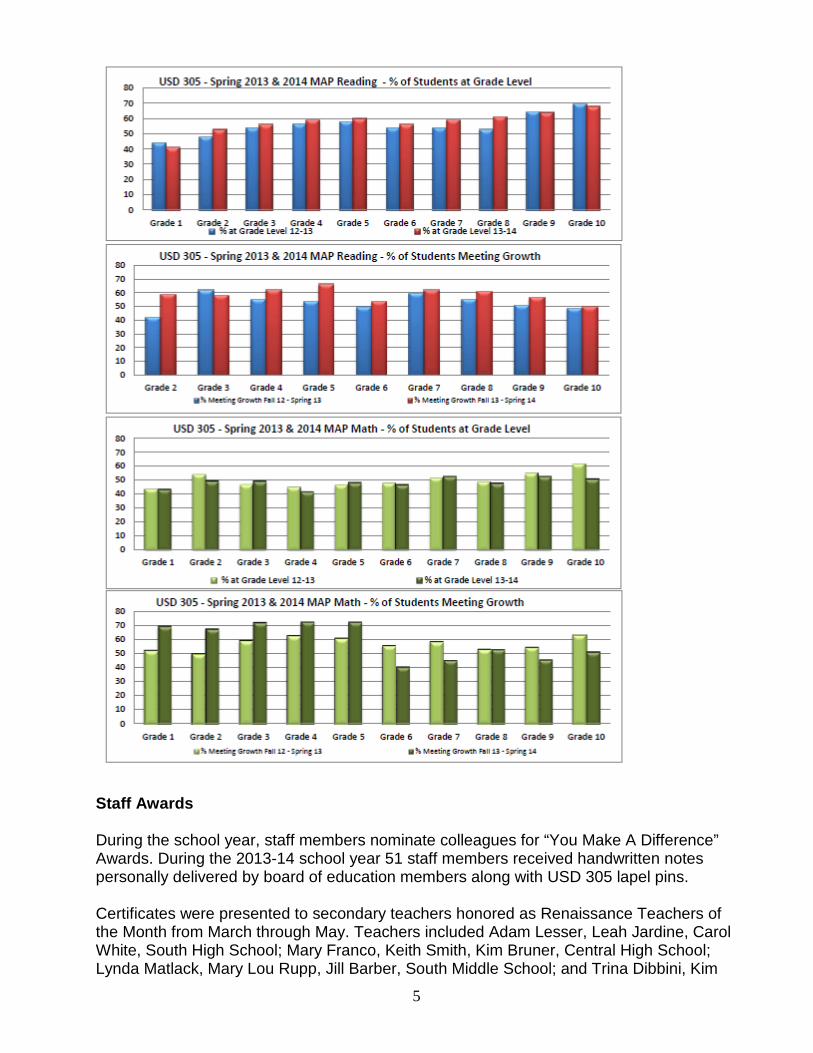
The District’s Accomplishments and Challenges Accomplishments: Standard Achievement Assessments – 2013-2014 The NWEA MAP (Measure of Academic Progress) is a norm-referenced assessment designed to measure reading comprehension and math computation and problem solving. The percent of students meeting math growth goals at the elementary level increased at every grade when comparing the 2012-13 school year to the 2013-14 school year. At the secondary level, all grades had a decrease in the percent of students meeting growth goals. In reading all grades 2-12, with the exception of third grade, showed an increase in the percent of students meeting the growth goal. District results show an increase in the percent of students at grade level in both reading and math as well as an increase in the percent of students meeting growth goals in both subjects. The Aimsweb assessment reported on the graph below for grades 1-5 is an oral reading fluency assessment. Fluency has a strong correlation with comprehension. At grades 6-10 the data is reported from the Aimsweb MAZE assessment which is a silent reading comprehension assessment.
3
4
5
Staff Awards During the school year, staff members nominate colleagues for “You Make A Difference” Awards. During the 2013-14 school year 51 staff members received handwritten notes personally delivered by board of education members along with USD 305 lapel pins. Certificates were presented to secondary teachers honored as Renaissance Teachers of the Month from March through May. Teachers included Adam Lesser, Leah Jardine, Carol White, South High School; Mary Franco, Keith Smith, Kim Bruner, Central High School; Lynda Matlack, Mary Lou Rupp, Jill Barber, South Middle School; and Trina Dibbini, Kim
6
Goff, Patty Emme, Lakewood Middle School. Renaissance Teachers of the Month from September through October were Jeff Harris and Kevin Poland, South High School; Brandy Moon and Larry Cullins, Central High School; Olivia Fabrizius and Jessa Herrs, South Middle School; and Sue Jordan and Brandon Cheeks, Lakewood Middle School. Renaissance Teachers of the Month from November through December were Cody Stockwell and Sheryl H. Brown, Lakewood Middle School; Melissa Harvey and Zach Allen, South Middle School; Ryan Holmquist and Melinda Jett, Central High School; and Brittany Haynes and Daniel Colton, South High School. Renaissance Teachers of the Month for January and February were Kristen Hymer and Jayson Emig, Lakewood Middle School; Michelle Cooper and Lesa Landauer, South Middle School; Ava Nanney and Larry Dennison, Central High School; and Candace Mahoney and Jenifer Wolters, South High School. Nora Rindt, Schilling Elementary ESL/bilingual teacher, and Anna Voth, Central High School math teacher, were recognized by the board of education as the district’s 2014 Kansas Horizon Award recipients. The board of education recognized Tara Vanderbilt, Meadowlark Elementary fifth grade teacher, as the Elementary Teacher of the Year, and Deanna Cullins, Central High School math teacher, as the Secondary Teacher of the Year. Brandon Cheeks, Lakewood Middle School history and government teacher, was recognized by the board of education as the district’s nominee for the 2014 Master Teacher Award. Grants The Salina Education Foundation announced the following recipients for grants from the 21st Century Advantage Grant program: Jane Maresch, Central High; Gary Goodwin, Central High; Tammy Moon, Coronado; Patti Flenthrope, Cottonwood; Teri Aldrich, Heartland Programs; Shelly Parks, Heartland Programs; Amy Frost, Heusner; Trina Dibbini, Lakewood; Deb Robertson, Opportunity Now; Matt Moshier, South High; and Barbara Livengood, South Middle. The Salina Education Foundation announced the following Outside-the-Box recipients: Terri Rassette, Cottonwood; Brandon Cheeks, Lakewood; and Michele Palmgren, South High. The Salina Education Foundation announced that Lindsay Eitel and Amanda Merrick are the 2014 LIFT (Loan Initiative for Future Teachers) scholarship recipients. As such, they will receive $5,000 per year while attending college and working toward an initial teaching degree. The Greater Salina Community Foundation (GSCF) presented several grant awards to USD 305 schools and programs. Some of the grants include the L.P. Mullen Fund for Youth Science, Technology and Invention awarded to:
• Central High School’s FIRST Robotics Team • South High School’s Band Pit Percussion Section
In addition, all eight elementary schools received GSCF funding for school marathon programs. . Heartland Programs was awarded $5,000 for parent education classes from

7
the Greater Salina Community Foundation YW Legacy Fund. Cottonwood and Sunset received annual grants from the George & Jeanne Frisbie Donor Advised Fund. Community Service Staff and students participated in the 2013 United Way Campaign and the 2014 Project Salina Food Drive. Student Awards Superintendent’s Excellence Awards Certificates were presented to the following students who were state qualifiers for the following sports and activities, or who qualified to participate at the state or national level: Track/Salina South High School: Paige Rose, Demi Roets, Tierra Lundgren, Brooke, Keller, Courtney Frost, Briawna Sunderlin, Emily Webb, Megan Holloway, Erica Sander, Tristan Irish, Michael Jones, Drew Hilt, Cade Calvert, Jonathan Dominguez, Justin Stonebraker and Marcus Cutler. Sue Montoy, team coach. Track/Salina Central High School: Mareshah Francois, Jetta Green, Morgan Hauserman, Shaelyn Martin, Katelyn May, Michelle Parker, Bronwyn Ross, Halie Turner, Erin Harvey, Isaac Rodriguez, Terrell Rodriguez, Noah Smucker, Zach Engling, Decker Gates, Austin Palmateer and Spencer Schrader. Rick O’Neill, coach. Golf/Salina South High School: Ben Hargrave. Dan Smith, coach. Golf/Salina Central High School: Matt Grammer, Will Shadwick, Matt Martin, Jacob Martin, Christian Leyh and Max Humphrey. Patrick Newell, coach. Swimming/Salina Central High School: Sydney Dauer, Emily Ewing, Samantha Govreau, Paige Johnson, Hannah Schulte, Sarah Schulte and Leatha Craft. Dawn Sheforgen, coach. Swimming/Salina South High School: Kortney Borcherding, Taylor Thompson, Brianna McClain, Martina Schartz, Marisa Tomlins and Chandler LaFrance. Dawn Sheforgen, coach. Girls Tennis/Salina High School South: The South Lady Cougar Tennis Team had 3 state qualifiers this season. The team finished 8th overall in team standings at the state tournament. Marissa Mitchell placed 10th in singles at state, Molly Courbot and Sophia Darnell placed 11th in doubles at state. Ryan Stuart is the team’s coach. Girls Tennis/Salina High School Central: The Central Lady Mustang Tennis Team had 5 state qualifiers this season. Meg Johnson qualified for state singles for the first time and finished 5th place at regionals in singles, Sydney Kossow and Jera Richardson qualified for state for the first time and finished 5th place at regionals, MacKenzie Morris and Morgan Hauserman finished the year as league champions, regional champions, finished 6th place at state and earned all-state honors. MacKenzie Morris finished her career with a state championship her junior year and finished her career at Salina Central with 130 wins. Mike Goll is the team’s coach. Cross Country/Salina High School South: Anna Zuercher finished 68th at state, Emilee Holloway finished 27th at state, Tristan Irish finished 19th at state and Josh Reed finished 36th at state. Travis Peterson is the team’s coach. Cross Country/Salina Central High School: Daniel Villarreal finished 9th at state. Josh Gooch is the team’s coach. Golf/Salina High School South: Karissa Boyles finished 80th overall and Analisa Bridge finished 39th overall. Trey Crow is the team’s coach.
8
Golf/Salina High School Central: The Central High Girls golf team placed 9th as a team at state. Team members are Emily Ewing, Alissa Kim (#1 individual medalist with a score of 77), Kristonna Kramer, Hannah Boaz, Alycia Buchanan and Grace Truelove. Steve Ewing is the team’s coach. Fort Hays State Math Relays/Salina High School South: The South High math team finished 4th overall. Team members include Rory Bowell, Tristan Irish, Kevin Kraus, Tim Kroeker, Shelbey Logan, Melissa Mahoney, Sean Meckley, Marisa Mitchell, Garrett Mortimer, Bi Nguyen, Tyler Ross, Colin Truhe, Jiaying (Jane) Wang, Bailey Waters, Ethan Zajac, Sarah Zajac and Anna Zuercher. Candace Mahoney is the team’s sponsor. Fort Hays State Math Relays/Salina High School Central: The Central High math team placed 2nd overall. Team members include Sam Allen, Audrey Augustine, Tanner Robl, Emily Wood, Marysa Bradshaw, Zane Heigele, Ben Koenig, Jack Weiner, Zach Hilbig, JD McHenry, Joshua Walters, Alec Wilson, Hannah Janzen, Dylan Wentzel and Umar Sandhu. Josh Gooch is the team’s sponsor. Eco-Meet/Salina High School South: The South High Eco-Meet team qualified for state. Team members are Jane Wang, Tristan Irish and Colin Truhe. Matt Mosher sponsored the team. Salina High School Central/Choir: Central High had the following students selected to the KMEA State Festival Choir. They were Dominick Thompson, Grant DeMars and Maria Putzier. Ryan Holmquist is the vocal music director. Salina High School South/Choir: South High had the following students selected to the KMEA State Festival Choir. They were Timeri Herrington, Amanda Huehl-Phillips and Jonathan Flores. Eddie Creer Jr. is the vocal music director. Salina High School Central/Band: Central High’s band students were selected to participate in the KMEA All-State Band. Toby King was selected for trombone and Aaron Thomas was selected on drum set. Ben Rohrer is the band director. Salina High School South/Band: South High’s band students were selected to participate in the KMEA All-State Band. Ryan Zimmerman was selected for oboe, Tristan Irish for clarinet, Melissa Cairns for trumpet and Rory Bowell for tuba. Hannah Caswell was selected for flute for all-state orchestra. Darren Brooks is the band director. Salina High School Central/Orchestra: Central High had two students selected to participate in the KMEA All-State Orchestra. Shane Rivas Martin was selected on second violin and Anthony Cox on double bass. Andrew Book is the orchestra director. Salina High School South/Orchestra: South High had one student, Ethan Zajac, selected to participate in the KMEA All-State Orchestra. Karen Chapman is the orchestra director. Salina Central High School/Thespian: Central High’s Thespian Troupe received the Gold Honor Troupe Award at the 2014 Kansas State Thespian Conference. Troupe members include Jeffrey Michel, Korin Koch, Shekhinah Jones, Miranda Allen, Daniel Lorentz, Jessica Johnson and Samantha Highsmith. Chad Nulik is the theatre director. Salina South High School/Thespian: South High’s Thespian Troupe received the Gold Honor Troupe Award at the 2014 Kansas State Thespians Conference. Troupe members include Michael Hutton, Jonathan Flores and Timeri Herrington. Kate Lindsay is the theatre director. Salina High School South/Debate: Aundie Davis, Angeles Garcia, Isidro Nieto, Cooper Teschke, Pierce Carey and Alexcis Barnes qualified for 4-Speaker State Debate Class 5A. Logan Frost and Logan Harner qualified for 2-Speaker State Debate. The team is coached by Jody Eves. Salina High School Central/Debate: Drayton Willey, Gabe Geisen, Bobby Tech and Candy Dao qualified for 4-Speaker State Speech Championships Class 5A. The team is coached by Glenn Nelson.
9
Salina High School South/Art: Kansas Regional Scholastic Art Awards Competition participants included Shai Boeschling, Silver Key; Sara Phomphansy, Silver Key; Callie Vessar, Honorable Mention; and Madison Searcy, Honorable Mention. Kurt Wolf is the art teacher. Salina High School Central/Art: Kansas Regional Scholastic Art Awards Competition participants included Alex Dominguez, two Gold Keys and two Honorable Mentions; Noah Wellbrock-Talley, Gold Key and two Honorable Mentions; Austin Bieberly, two Silver Keys and Honorable Mention; Megan Johnson, Gold Key; Mallory Wiggins, Silver Key; Patty Dominguez, Silver Key; Olivia Opat, Silver Key; Madi Carlgren, Honorable Mention; Dillon Hopkins, Honorable Mention; Mady Suskey, Honorable Mention; Cynthia Jimenez, Honorable Mention; and Colton Yungeberg, Honorable Mention. Larry Cullins is the art teacher. Salina High School South/Wrestling: 5-A State Wrestling Tournament qualifiers included Tyler Irwin, senior; John McNabb, senior; Cole Hoover, junior; and Allen Heberly, freshman. Gary Seibel coaches the team. Salina High School Central/Wrestling: 5-A State Wrestling Tournament qualifiers included Gunner Rairden, freshman; Chance Sorell, sophomore; Donivyn Will, freshman; Dayton Will, junior; Easton Ryser, sophomore; Dalton Peters, sophomore; Kyle True, sophomore; Jack Helvey, sophomore; and Vince Johnson, senior. Shannon Peters coaches the team. Salina High School South/Swimming: Competing at state were Rory Bowell, junior; Zeke Kaszycki, junior; Trey Lorenson, junior; Colin Truhe, junior; Ben Weishaar, junior; Zach Kaszycki, sophomore; and Brendan Borcherding, sophomore. Dustin Burgardt coaches the team. Salina High School Central/Swimming: Competing at state were Cade Rosalez, senior; Kyler Bell, senior; Bryen Baker, senior; Noah Hadnot, senior; Ian Korinek, senior; Erick Nilson, junior; Peyton Chard, sophomore; and Eldon Taskinen, freshman. Dustin Burgardt coaches the team. Salina High School Central/Boys’ Basketball: Team members are Treyton Hines, senior; Max Kuhn, senior; Tanner Robl, senior; Jordan McNelly, junior; RaShun Allen, junior; Vance Johnson, junior; Malcom Gardner, junior; Nick Shaffer, junior; TJ Ralston, junior; Adrian Castelli, sophomore; JD McHenry, sophomore; Garrett Campion, sophomore; Travis Bigler, sophomore; and Brayden Neuschafer, freshman. Doug Finch coaches the team. Salina High School Central/Girls’ Basketball: Team members are Marysa Bradshaw, junior; Morgan Hauserman, junior; Bailey Driver, junior; Shea Myers, junior; Madi Carlgren, senior; Keisha Hamilton, sophomore; Emily Wood, senior; MacKenzie Morris, senior; Brooke Peters, senior; Casey Knoth, freshman; Hailey Mayfield, senior; and Shaelyn Martin, senior. Geoff Andrews coaches the team. Football/Salina High School South: The South High football team qualified for state. Team captains are Justin Stonebraker, Cade Calvert, Zach Nachbar and Kole Smith. Sam Sellers is the coach. South High School National Business Professionals of America: Mikayla Janda, senior; Sarah McConnell, senior; Marisa Mitchell, senior; Katie Siemsen, senior; Anna Zuercher, senior; Garrett Mortimer, senior; Courtney Main, senior; Megan Mong, junior; Bailey Waters, junior; Andrew Haines, senior; and Tyler McElwee, senior. Kaisha Edgerle is the sponsor. South High School Forensics: Alexcis Barnes, Pierce Carey, Ben Cooper, Aundie Davis, Alvaro Escobedo, Maddison Teschke and Katie Zuercher. Jody Eves, coach. Central High School Forensics: Grace Claman, Candy Dao, A.J. Dix, Gabe Geisen, Malik Grassity, Akiyaa Hagen, Jamie Hawley, Kaitlynn Holman, Shekhinah Jones, Bobby Tech,
10
Drayton Willey, Natashia Petersen, Sam Allen and Haley Holman. Nicholas Owen, coach. South High School Journalism: India Brelsford, Tiffany Bowers, Courtney Main, Jonathan Dominguez, MaKayla Stanford, Saige Otter, Marisa Mitchell, Carly Sackrider, Shaylele Arpin, Brittany Pappada and Cassidy Sweet. Kim Warren, coach. Central High School Journalism: Emily Wood, Kamen Kossow, Dakota Rowlison, Austin Huynh, Sara Ingrassia, Malina Barber-Regier, MacKenzie Morris, Casey Campbell, Connor Martens, Riley Miller, Riley Gates, Hannah Schroeder, Abbi Schroeder, Caroline Holgerson, Sarah Brown, Eryn Hassler, Eli Berner and Bailey Driver. JD Garber, coach. Central High School FFA: Matt Rowe, Jeffrey Michel, Samantha Gargarello, Zach Koshgarian, Daniel Lorentz, Megan Morrow, Wes Jennings, Kyle True, JD McHenry, Andrew Rutherford, Travis Bigler, James Michel, Lupita Bujanda, Jordan Graves and Brock Alstatt. Greg Anderes, coach. South High School Science Olympiad: Melissa Cairns, Tyler Ross, Jane Wang, Bi Nguyen, Ethan Zajac, Sarah Zajac, Noah Zajac, Colby Johnson, Merry Lewis, Bailey Waters, Anna Zuercher, Shantelle Mogollon and Ryan Zimmerman. Man Tran and Lyric Cairns, coaches. Central High School Science Olympiad: Cortney Berndt, Dekeysha Cooper, Mary Freelove, Gabe Geisen, Maya Kathrineberg, Ben Koenig, Kennedy Lancaster, Kjerstyn Lindgren, Madison Livengood, Daniel Lorentz, Bryan Martell, Connor Martens, Katherine Stanley-Lorson, Umar Sandhu, Dylan Wentzel and Emmanuel West. Sheila Shaffer, coach. Salina High School South/Tennis: Team members are Matt Berneking, freshman; Gage Kerns, senior; and Pierce Carey, sophomore. David Stueve coaches the team. Central High School Tennis: Justin Bengtson, Nathan Garlow, Zachary Hampton, Jeffrey Michel, Jack Weiner and Umberto Rossetto. Mike Goll is the coach. Challenges: Salina USD 305 is a diverse district which presents strengths but also needs. Students’ needs have increased dramatically; there are a larger number of Special Education students with severe needs, more students requiring ELL services and more with economic need. Costs such as utilities, transportation and insurance continue to rise. All-day kindergarten is not currently offered at USD 305. However, facility/physical impediments to providing all-day kindergarten will be addressed due to a bond that was approved April 2014. Unfortunately, the legislature has not resolved the issue of funding all-day kindergarten and as a result the funding remains a challenge. The 2014-15 school funding formula is not adequately funded:
• Adequacy of base state aid per pupil (BSAPP) is not determined. Salina USD 305 believes BSAPP is underfunded.
• All-day kindergarten is not funded at 1.0 FTE. • Special Education excess cost is not fully funded at 92% as required by law.
Currently it is only funded at 79%.
Unfunded mandates remain a challenge: • Kansas Board of Regents Qualified Admissions • Bullying Prevention • Financial Literacy • KIDS and other state reporting requirements
11
Other challenges include: • No valid and reliable assessment data is available from SY 2013-2014 reading and
math tests due to cyber attacks against the online testing system and other transitional year issues.
• Continuing the implementation of the teacher and principal evaluation system including the addition of student growth measures in 2014-15.
• The new Student Data Privacy Act restricts how and to whom student data may be disclosed. It requires annual written notice to parents that must be signed and returned by the parent and kept on file by the district. Stricter than federal law, districts must make significant changes to current practices and to contracts with service providers.
• Tracking employee work hours for the Affordable Care Act in order to avoid penalties.
In addition, the projected shortfall in state government revenue over the next five years presents doubt about the future of school funding. To continue to provide the quality of educational services that local and state constituents expect, it is critical that the state responsibly fund public education.
12
Supplemental Information for the Following Tables 1. Summary of Total Expenditures by Function (All Funds) 2. Summary of General Fund Expenditures by Function 3. Summary of Supplemental General Fund Expenditures by Function 4. Summary of General and Supplemental General Fund Expenditures by Function 5. Summary of Special Education Fund by Function 6. Instruction Expenditures (1000) 7. Student Support Expenditures (2100)
8. Instructional Support Expenditures (2200) 9. General Administration Expenditures (2300) 10. School Administration Expenditures (2400)
11. Central Services Expenditures (2500) 12. Operations and Maintenance Expenditures (2600)
13. Transportation Expenditures (2700) 14. Other Support Services Expenditures (2900)
15. Food Service Expenditures (3100)
16. Community Services Operations (3300) 17. Capital Improvements (4000) 18. Debt Services (5100)
19. Miscellaneous Information – Transfers (5200) 20. Miscellaneous Information Unencumbered Cash Balance by Fund 21. Reserve Funds Unencumbered Cash Balance 22. Other Information – Enrollment Information 23. Miscellaneous Information Mill Rates by Fund 24. Other Information – Assessed Valuation and Bonded Indebtedness
13
Note: The FTE (full time equivalency) used in this report to calculate the “Amount Per Pupil” is defined as following: Enrollment (FTE) includes the enrollment of the district used for state aid and budget authority, and all other preschool enrollment and kindergarten students attending full time.
14
KSDE Website Information Available K-12 Statistics (Building, District or State Totals) http://svapp15586.ksde.org/k12/k12.aspx
• Attendance / Enrollment Reports • Staff Reports • Graduates / Dropouts Reports • Crime / Violence Reports
School Finance Reports and Publications http://www.ksde.org/Agency/FiscalandAdministrativeServices/SchoolFinance/ReportsandPublications.aspx
• Assessed Valuation • Cash Balances • Headcount Enrollment • Mill Levies • Personnel (Certified/Non-Certified) • Salary Reports
Kansas Building Report Card http://svapp15586.ksde.org/rcard/
• Attendance Rate • Graduation Rate • Dropout Rate • School Violence • Assessments
o Reading o Mathematics o Writing
• Graduates Passing Adv. Science Courses • Graduates Passing Adv. Math Courses
USD# 305
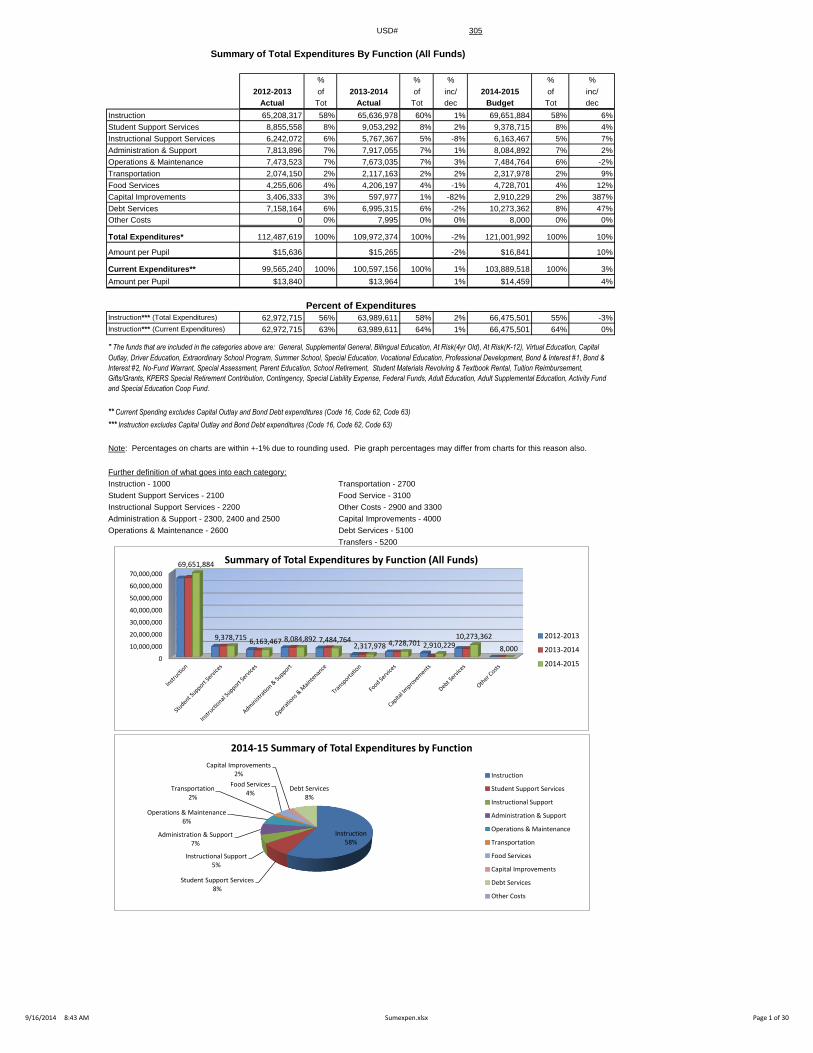
Summary of Total Expenditures By Function (All Funds)
% % % % %
2012-2013 of 2013-2014 of inc/ 2014-2015 of inc/
Actual Tot Actual Tot dec Budget Tot dec
Instruction 65,208,317 58% 65,636,978 60% 1% 69,651,884 58% 6%
Student Support Services 8,855,558 8% 9,053,292 8% 2% 9,378,715 8% 4%
Instructional Support Services 6,242,072 6% 5,767,367 5% -8% 6,163,467 5% 7%
Administration & Support 7,813,896 7% 7,917,055 7% 1% 8,084,892 7% 2%
Operations & Maintenance 7,473,523 7% 7,673,035 7% 3% 7,484,764 6% -2%
Transportation 2,074,150 2% 2,117,163 2% 2% 2,317,978 2% 9%
Food Services 4,255,606 4% 4,206,197 4% -1% 4,728,701 4% 12%
Capital Improvements 3,406,333 3% 597,977 1% -82% 2,910,229 2% 387%
Debt Services 7,158,164 6% 6,995,315 6% -2% 10,273,362 8% 47%
Other Costs 0 0% 7,995 0% 0% 8,000 0% 0%
Total Expenditures* 112,487,619 100% 109,972,374 100% -2% 121,001,992 100% 10%
Amount per Pupil $15,636 $15,265 -2% $16,841 10%
Current Expenditures** 99,565,240 100% 100,597,156 100% 1% 103,889,518 100% 3%
Amount per Pupil $13,840 $13,964 1% $14,459 4%
Instruction*** (Total Expenditures) 62,972,715 56% 63,989,611 58% 2% 66,475,501 55% -3%
Instruction*** (Current Expenditures) 62,972,715 63% 63,989,611 64% 1% 66,475,501 64% 0%
Note: Percentages on charts are within +-1% due to rounding used. Pie graph percentages may differ from charts for this reason also.
Further definition of what goes into each category:
Instruction - 1000 Transportation - 2700
Student Support Services - 2100 Food Service - 3100
Instructional Support Services - 2200 Other Costs - 2900 and 3300
Administration & Support - 2300, 2400 and 2500 Capital Improvements - 4000
Operations & Maintenance - 2600 Debt Services - 5100
Transfers - 5200
Percent of Expenditures
* The funds that are included in the categories above are: General, Supplemental General, Bilingual Education, At Risk(4yr Old), At Risk(K-12), Virtual Education, Capital
Outlay, Driver Education, Extraordinary School Program, Summer School, Special Education, Vocational Education, Professional Development, Bond & Interest #1, Bond &
Interest #2, No-Fund Warrant, Special Assessment, Parent Education, School Retirement, Student Materials Revolving & Textbook Rental, Tuition Reimbursement,
Gifts/Grants, KPERS Special Retirement Contribution, Contingency, Special Liability Expense, Federal Funds, Adult Education, Adult Supplemental Education, Activity Fund
and Special Education Coop Fund.
*** Instruction excludes Capital Outlay and Bond Debt expenditures (Code 16, Code 62, Code 63)
** Current Spending excludes Capital Outlay and Bond Debt expenditures (Code 16, Code 62, Code 63)
0
10,000,000
20,000,000
30,000,000
40,000,000
50,000,000
60,000,000
70,000,000
69,651,884
9,378,715 6,163,467 8,084,892 7,484,764 2,317,978 4,728,701 2,910,229
10,273,362
8,000
Summary of Total Expenditures by Function (All Funds)
2012-2013
2013-2014
2014-2015
Instruction 58%
Student Support Services 8%
Instructional Support 5%
Administration & Support 7%
Operations & Maintenance 6%
Transportation 2%
Food Services 4%
Capital Improvements 2%
Debt Services 8%
2014-15 Summary of Total Expenditures by Function
Instruction
Student Support Services
Instructional Support
Administration & Support
Operations & Maintenance
Transportation
Food Services
Capital Improvements
Debt Services
Other Costs
9/16/2014 8:43 AM Sumexpen.xlsx Page 1 of 30

USD# 305
Summary of General Fund Expenditures
by Function
% % % % %
2012-2013 of 2013-2014 of inc/ 2014-2015 of inc/
Actual Tot Actual Tot dec Budget Tot dec
Instruction 10,647,134 37% 10,239,464 36% -4% 10,232,735 36% 0%
Student Support 2,543,501 9% 2,563,840 9% 1% 2,682,363 9% 5%
Instructional Support 1,611,334 6% 1,624,374 6% 1% 1,724,335 6% 6%
Administration & Support 6,278,393 22% 6,214,852 22% -1% 6,297,629 22% 1%
Operations & Maintenance 6,835,653 24% 6,972,904 24% 2% 6,594,345 23% -5%
Transportation 940,909 3% 1,002,823 4% 7% 1,063,962 4% 6%
Capital Improvements 0 0% 0 0% 0% 0 0% 0%
Other Costs 0 0% 0 0% 0% 0 0% 0%
Total Expenditures 28,856,924 100% 28,618,257 100% -1% 28,595,369 100% 0%
Amount per Pupil $4,011 $3,973 -1% $3,980 0%
The Summary of General Fund Expenditures chart information comes from pages 6-13 and only uses the 'General Fund' line items.
0
2,000,000
4,000,000
6,000,000
8,000,000
10,000,000
12,000,000
Instruction StudentSupport
InstructionalSupport
Administration& Support
Operations &Maintenance
Transportation CapitalImprovements
Other Costs
10,232,735
2,682,363
1,724,335
6,297,629 6,594,345
1,063,962
0 0
Summary of General Fund Expenditures
2012-2013
2013-2014
2014-2015
Instruction 36%
Student Support 9% Instructional Support
6%
Administration & Support
22%
Operations & Maintenance 23%
Transportation 4%
2014-15 Summary of General Fund Expenditures by Function
Instruction
Student Support
Instructional Support
Administration & Support
Operations & Maintenance
Transportation
Capital Improvements
Other Costs
9/16/2014 8:43 AM Sumexpen.xlsx Page 2 of 30
USD# 305
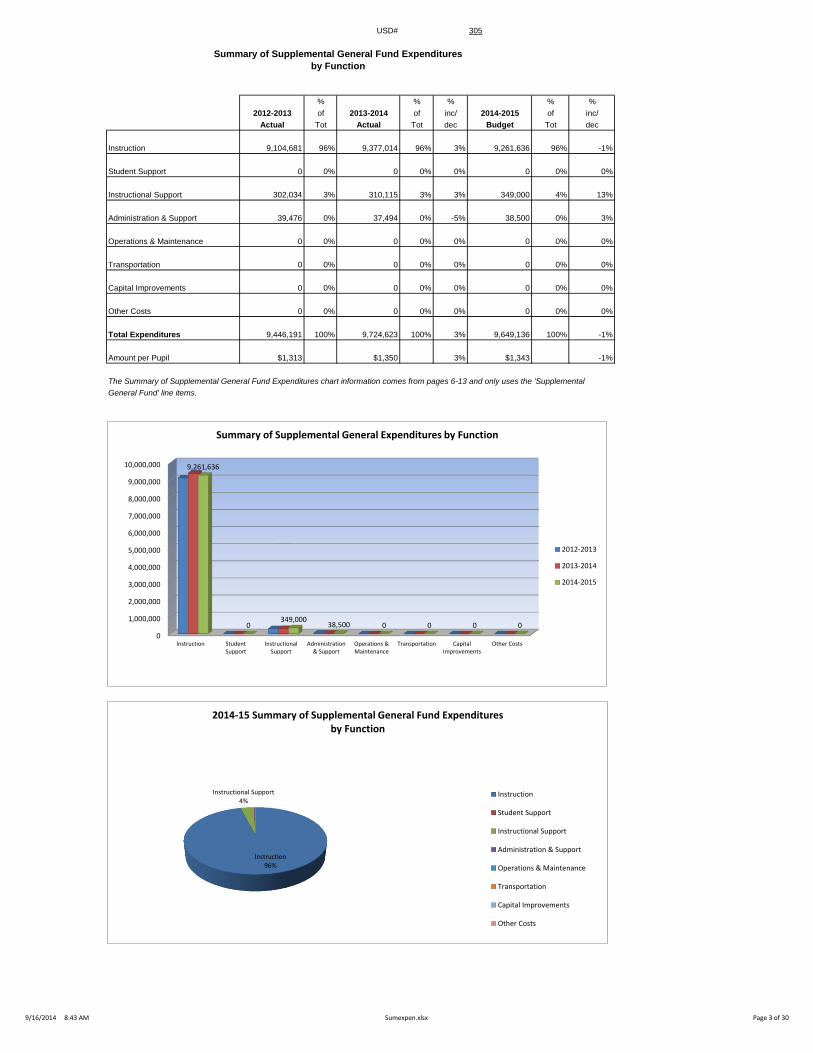
Summary of Supplemental General Fund Expenditures
by Function
% % % % %
2012-2013 of 2013-2014 of inc/ 2014-2015 of inc/
Actual Tot Actual Tot dec Budget Tot dec
Instruction 9,104,681 96% 9,377,014 96% 3% 9,261,636 96% -1%
Student Support 0 0% 0 0% 0% 0 0% 0%
Instructional Support 302,034 3% 310,115 3% 3% 349,000 4% 13%
Administration & Support 39,476 0% 37,494 0% -5% 38,500 0% 3%
Operations & Maintenance 0 0% 0 0% 0% 0 0% 0%
Transportation 0 0% 0 0% 0% 0 0% 0%
Capital Improvements 0 0% 0 0% 0% 0 0% 0%
Other Costs 0 0% 0 0% 0% 0 0% 0%
Total Expenditures 9,446,191 100% 9,724,623 100% 3% 9,649,136 100% -1%
Amount per Pupil $1,313 $1,350 3% $1,343 -1%
The Summary of Supplemental General Fund Expenditures chart information comes from pages 6-13 and only uses the 'Supplemental
General Fund' line items.
0
1,000,000
2,000,000
3,000,000
4,000,000
5,000,000
6,000,000
7,000,000
8,000,000
9,000,000
10,000,000
Instruction StudentSupport
InstructionalSupport
Administration& Support
Operations &Maintenance
Transportation CapitalImprovements
Other Costs
9,261,636
0 349,000
38,500 0 0 0 0
Summary of Supplemental General Expenditures by Function
2012-2013
2013-2014
2014-2015
Instruction 96%
Instructional Support 4%
2014-15 Summary of Supplemental General Fund Expenditures by Function
Instruction
Student Support
Instructional Support
Administration & Support
Operations & Maintenance
Transportation
Capital Improvements
Other Costs
9/16/2014 8:43 AM Sumexpen.xlsx Page 3 of 30
USD# 305
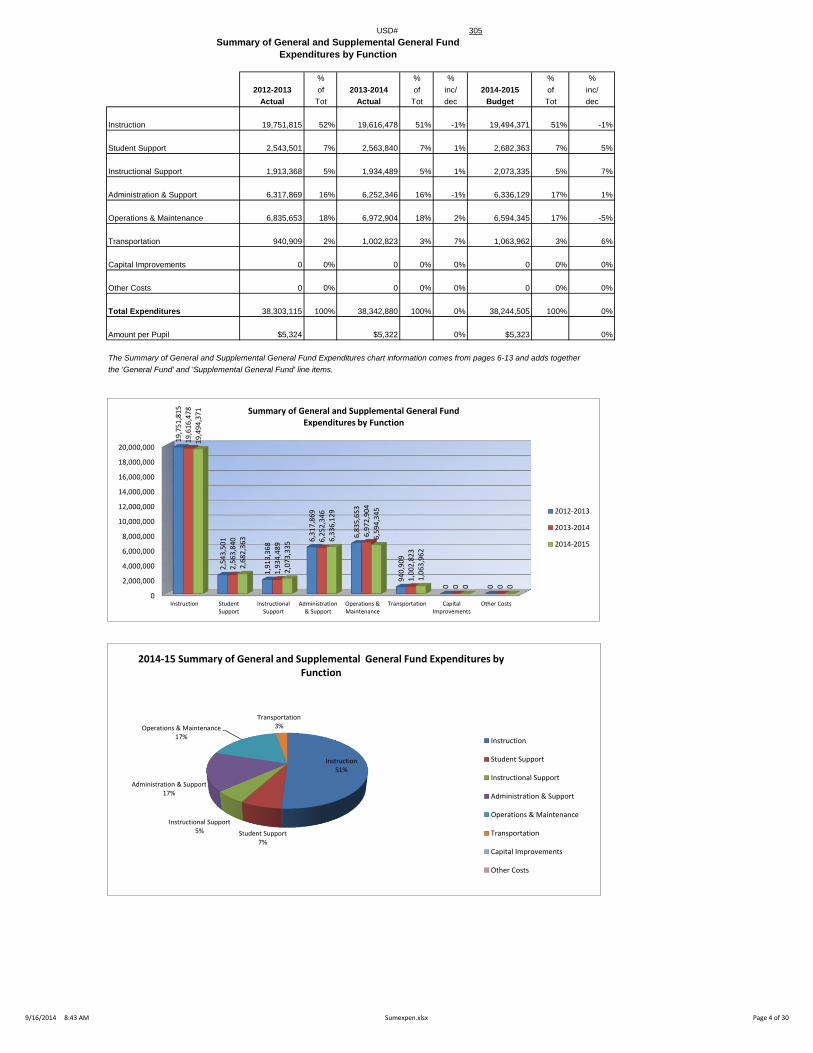
Summary of General and Supplemental General Fund
Expenditures by Function
% % % % %
2012-2013 of 2013-2014 of inc/ 2014-2015 of inc/
Actual Tot Actual Tot dec Budget Tot dec
Instruction 19,751,815 52% 19,616,478 51% -1% 19,494,371 51% -1%
Student Support 2,543,501 7% 2,563,840 7% 1% 2,682,363 7% 5%
Instructional Support 1,913,368 5% 1,934,489 5% 1% 2,073,335 5% 7%
Administration & Support 6,317,869 16% 6,252,346 16% -1% 6,336,129 17% 1%
Operations & Maintenance 6,835,653 18% 6,972,904 18% 2% 6,594,345 17% -5%
Transportation 940,909 2% 1,002,823 3% 7% 1,063,962 3% 6%
Capital Improvements 0 0% 0 0% 0% 0 0% 0%
Other Costs 0 0% 0 0% 0% 0 0% 0%
Total Expenditures 38,303,115 100% 38,342,880 100% 0% 38,244,505 100% 0%
Amount per Pupil $5,324 $5,322 0% $5,323 0%
The Summary of General and Supplemental General Fund Expenditures chart information comes from pages 6-13 and adds together
the 'General Fund' and 'Supplemental General Fund' line items.
0
2,000,000
4,000,000
6,000,000
8,000,000
10,000,000
12,000,000
14,000,000
16,000,000
18,000,000
20,000,000
Instruction StudentSupport
InstructionalSupport
Administration& Support
Operations &Maintenance
Transportation CapitalImprovements
Other Costs
19
,75
1,8
15
2,5
43
,50
1
1,9
13
,36
8 6
,31
7,8
69
6,8
35
,65
3
94
0,9
09
0
0
19
,61
6,4
78
2,5
63
,84
0
1,9
34
,48
9 6
,25
2,3
46
6,9
72
,90
4
1,0
02
,82
3
0
0
19
,49
4,3
71
2,6
82
,36
3
2,0
73
,33
5 6,3
36
,12
9
6,5
94
,34
5
1,0
63
,96
2
0
0
Summary of General and Supplemental General Fund Expenditures by Function
2012-2013
2013-2014
2014-2015
Instruction 51%
Student Support 7%
Instructional Support 5%
Administration & Support 17%
Operations & Maintenance 17%
Transportation 3%
2014-15 Summary of General and Supplemental General Fund Expenditures by Function
Instruction
Student Support
Instructional Support
Administration & Support
Operations & Maintenance
Transportation
Capital Improvements
Other Costs
9/16/2014 8:43 AM Sumexpen.xlsx Page 4 of 30
USD# 305
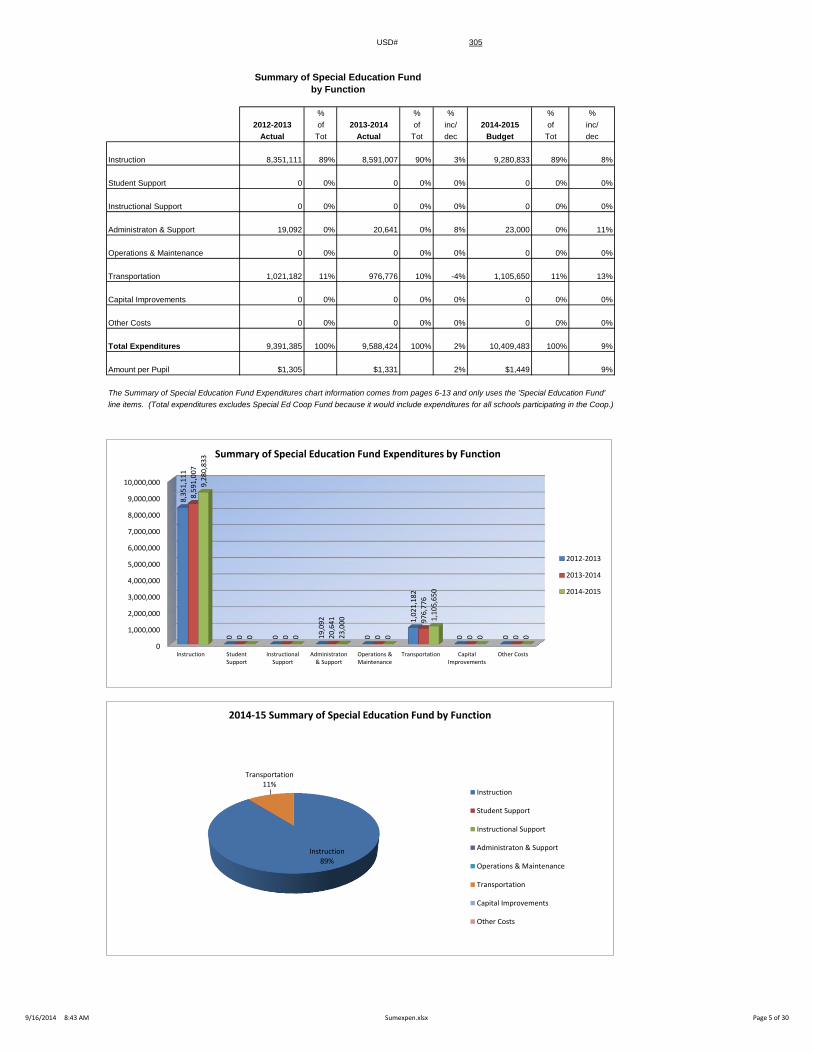
Summary of Special Education Fund
by Function
% % % % %
2012-2013 of 2013-2014 of inc/ 2014-2015 of inc/
Actual Tot Actual Tot dec Budget Tot dec
Instruction 8,351,111 89% 8,591,007 90% 3% 9,280,833 89% 8%
Student Support 0 0% 0 0% 0% 0 0% 0%
Instructional Support 0 0% 0 0% 0% 0 0% 0%
Administraton & Support 19,092 0% 20,641 0% 8% 23,000 0% 11%
Operations & Maintenance 0 0% 0 0% 0% 0 0% 0%
Transportation 1,021,182 11% 976,776 10% -4% 1,105,650 11% 13%
Capital Improvements 0 0% 0 0% 0% 0 0% 0%
Other Costs 0 0% 0 0% 0% 0 0% 0%
Total Expenditures 9,391,385 100% 9,588,424 100% 2% 10,409,483 100% 9%
Amount per Pupil $1,305 $1,331 2% $1,449 9%
The Summary of Special Education Fund Expenditures chart information comes from pages 6-13 and only uses the 'Special Education Fund'
line items. (Total expenditures excludes Special Ed Coop Fund because it would include expenditures for all schools participating in the Coop.)
0
1,000,000
2,000,000
3,000,000
4,000,000
5,000,000
6,000,000
7,000,000
8,000,000
9,000,000
10,000,000
Instruction StudentSupport
InstructionalSupport
Administraton& Support
Operations &Maintenance
Transportation CapitalImprovements
Other Costs
8,3
51
,11
1
0
0 19
,09
2
0
1,0
21
,18
2
0
0
8,5
91
,00
7
0
0 20
,64
1
0
97
6,7
76
0
0
9,2
80
,83
3
0
0 23
,00
0
0
1,1
05
,65
0
0
0
Summary of Special Education Fund Expenditures by Function
2012-2013
2013-2014
2014-2015
Instruction 89%
Transportation 11%
2014-15 Summary of Special Education Fund by Function
Instruction
Student Support
Instructional Support
Administraton & Support
Operations & Maintenance
Transportation
Capital Improvements
Other Costs
9/16/2014 8:43 AM Sumexpen.xlsx Page 5 of 30
USD# 305
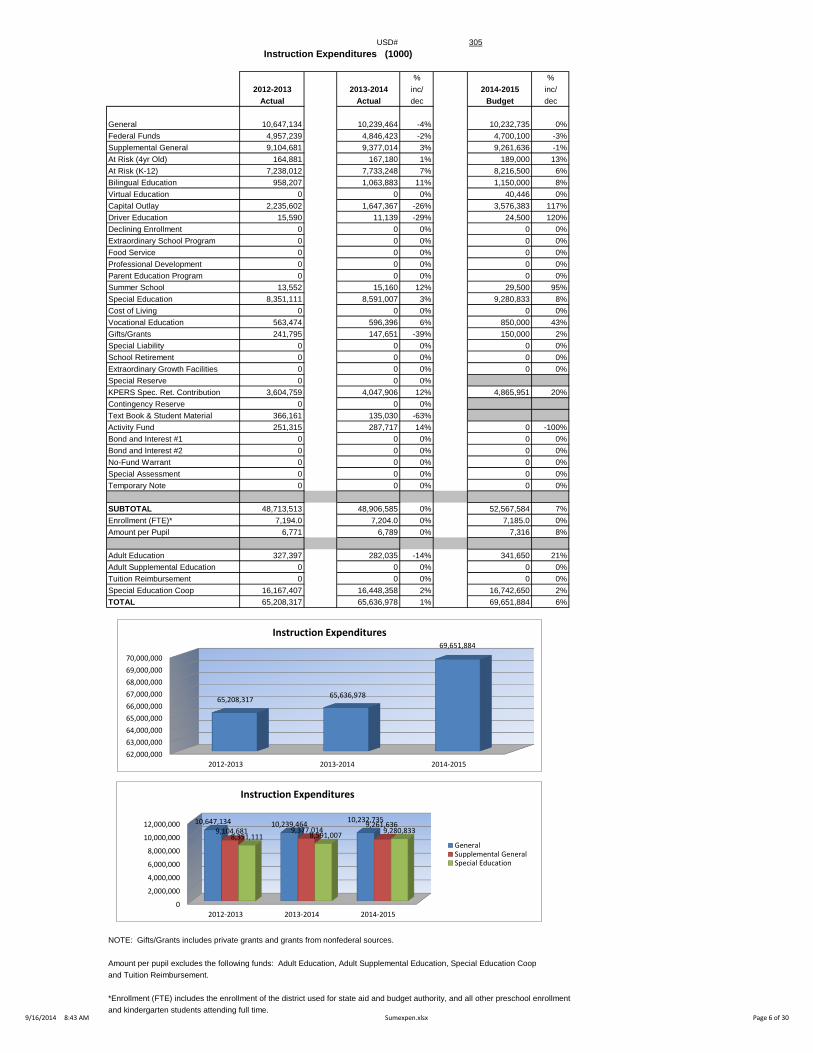
Instruction Expenditures (1000)
% %
2012-2013 2013-2014 inc/ 2014-2015 inc/
Actual Actual dec Budget dec
General 10,647,134 10,239,464 -4% 10,232,735 0%
Federal Funds 4,957,239 4,846,423 -2% 4,700,100 -3%
Supplemental General 9,104,681 9,377,014 3% 9,261,636 -1%
At Risk (4yr Old) 164,881 167,180 1% 189,000 13%
At Risk (K-12) 7,238,012 7,733,248 7% 8,216,500 6%
Bilingual Education 958,207 1,063,883 11% 1,150,000 8%
Virtual Education 0 0 0% 40,446 0%
Capital Outlay 2,235,602 1,647,367 -26% 3,576,383 117%
Driver Education 15,590 11,139 -29% 24,500 120%
Declining Enrollment 0 0 0% 0 0%
Extraordinary School Program 0 0 0% 0 0%
Food Service 0 0 0% 0 0%
Professional Development 0 0 0% 0 0%
Parent Education Program 0 0 0% 0 0%
Summer School 13,552 15,160 12% 29,500 95%
Special Education 8,351,111 8,591,007 3% 9,280,833 8%
Cost of Living 0 0 0% 0 0%
Vocational Education 563,474 596,396 6% 850,000 43%
Gifts/Grants 241,795 147,651 -39% 150,000 2%
Special Liability 0 0 0% 0 0%
School Retirement 0 0 0% 0 0%
Extraordinary Growth Facilities 0 0 0% 0 0%
Special Reserve 0 0 0%
KPERS Spec. Ret. Contribution 3,604,759 4,047,906 12% 4,865,951 20%
Contingency Reserve 0 0 0%
Text Book & Student Material 366,161 135,030 -63%
Activity Fund 251,315 287,717 14% 0 -100%
Bond and Interest #1 0 0 0% 0 0%
Bond and Interest #2 0 0 0% 0 0%
No-Fund Warrant 0 0 0% 0 0%
Special Assessment 0 0 0% 0 0%
Temporary Note 0 0 0% 0 0%
SUBTOTAL 48,713,513 48,906,585 0% 52,567,584 7%
Enrollment (FTE)* 7,194.0 7,204.0 0% 7,185.0 0%
Amount per Pupil 6,771 6,789 0% 7,316 8%
Adult Education 327,397 282,035 -14% 341,650 21%
Adult Supplemental Education 0 0 0% 0 0%
Tuition Reimbursement 0 0 0% 0 0%
Special Education Coop 16,167,407 16,448,358 2% 16,742,650 2%
TOTAL 65,208,317 65,636,978 1% 69,651,884 6%
NOTE: Gifts/Grants includes private grants and grants from nonfederal sources.
Amount per pupil excludes the following funds: Adult Education, Adult Supplemental Education, Special Education Coop
and Tuition Reimbursement.
*Enrollment (FTE) includes the enrollment of the district used for state aid and budget authority, and all other preschool enrollment
and kindergarten students attending full time.
0
2,000,000
4,000,000
6,000,000
8,000,000
10,000,000
12,000,000
2012-2013 2013-2014 2014-2015
10,647,134 10,239,464 10,232,735
9,104,681 9,377,014 9,261,636
8,351,111 8,591,007 9,280,833
Instruction Expenditures
GeneralSupplemental GeneralSpecial Education
62,000,000
63,000,000
64,000,000
65,000,000
66,000,000
67,000,000
68,000,000
69,000,000
70,000,000
2012-2013 2013-2014 2014-2015
65,208,317 65,636,978
69,651,884
Instruction Expenditures
9/16/2014 8:43 AM Sumexpen.xlsx Page 6 of 30
USD# 305
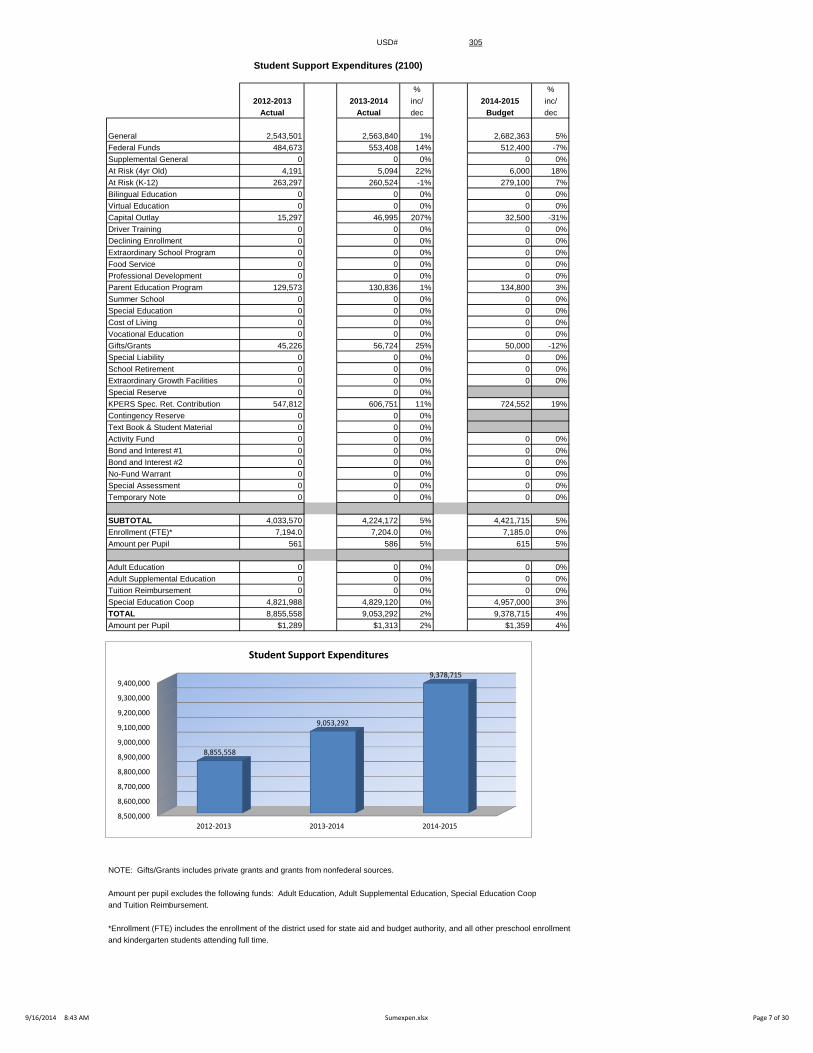
Student Support Expenditures (2100)
% %
2012-2013 2013-2014 inc/ 2014-2015 inc/
Actual Actual dec Budget dec
General 2,543,501 2,563,840 1% 2,682,363 5%
Federal Funds 484,673 553,408 14% 512,400 -7%
Supplemental General 0 0 0% 0 0%
At Risk (4yr Old) 4,191 5,094 22% 6,000 18%
At Risk (K-12) 263,297 260,524 -1% 279,100 7%
Bilingual Education 0 0 0% 0 0%
Virtual Education 0 0 0% 0 0%
Capital Outlay 15,297 46,995 207% 32,500 -31%
Driver Training 0 0 0% 0 0%
Declining Enrollment 0 0 0% 0 0%
Extraordinary School Program 0 0 0% 0 0%
Food Service 0 0 0% 0 0%
Professional Development 0 0 0% 0 0%
Parent Education Program 129,573 130,836 1% 134,800 3%
Summer School 0 0 0% 0 0%
Special Education 0 0 0% 0 0%
Cost of Living 0 0 0% 0 0%
Vocational Education 0 0 0% 0 0%
Gifts/Grants 45,226 56,724 25% 50,000 -12%
Special Liability 0 0 0% 0 0%
School Retirement 0 0 0% 0 0%
Extraordinary Growth Facilities 0 0 0% 0 0%
Special Reserve 0 0 0%
KPERS Spec. Ret. Contribution 547,812 606,751 11% 724,552 19%
Contingency Reserve 0 0 0%
Text Book & Student Material 0 0 0%
Activity Fund 0 0 0% 0 0%
Bond and Interest #1 0 0 0% 0 0%
Bond and Interest #2 0 0 0% 0 0%
No-Fund Warrant 0 0 0% 0 0%
Special Assessment 0 0 0% 0 0%
Temporary Note 0 0 0% 0 0%
SUBTOTAL 4,033,570 4,224,172 5% 4,421,715 5%
Enrollment (FTE)* 7,194.0 7,204.0 0% 7,185.0 0%
Amount per Pupil 561 586 5% 615 5%
Adult Education 0 0 0% 0 0%
Adult Supplemental Education 0 0 0% 0 0%
Tuition Reimbursement 0 0 0% 0 0%
Special Education Coop 4,821,988 4,829,120 0% 4,957,000 3%
TOTAL 8,855,558 9,053,292 2% 9,378,715 4%
Amount per Pupil $1,289 $1,313 2% $1,359 4%
NOTE: Gifts/Grants includes private grants and grants from nonfederal sources.
Amount per pupil excludes the following funds: Adult Education, Adult Supplemental Education, Special Education Coop
and Tuition Reimbursement.
*Enrollment (FTE) includes the enrollment of the district used for state aid and budget authority, and all other preschool enrollment
and kindergarten students attending full time.
8,500,000
8,600,000
8,700,000
8,800,000
8,900,000
9,000,000
9,100,000
9,200,000
9,300,000
9,400,000
2012-2013 2013-2014 2014-2015
8,855,558
9,053,292
9,378,715
Student Support Expenditures
9/16/2014 8:43 AM Sumexpen.xlsx Page 7 of 30

USD# 305
Instructional Support Expenditures (2200)
% %
2012-2013 2013-2014 inc/ 2014-2015 inc/
Actual Actual dec Budget dec
General 1,611,334 1,624,374 1% 1,724,335 6%
Federal Funds 2,577,586 2,256,247 -12% 2,253,450 0%
Supplemental General 302,034 310,115 3% 349,000 13%
At Risk (4yr Old) 0 0 0% 0 0%
At Risk (K-12) 0 4,235 0% 5,000 18%
Bilingual Education 0 0 0% 0 0%
Virtual Education 0 0 0% 0 0%
Capital Outlay 0 0 0% 0 0%
Driver Training 0 0 0% 0 0%
Declining Enrollment 0 0 0% 0 0%
Extraordinary School Program 0 0 0% 0 0%
Food Service 0 0 0% 0 0%
Professional Development 543,509 372,171 -32% 541,500 45%
Parent Education Program 1,244 115 -91% 1,500 1204%
Summer School 0 0 0% 0 0%
Special Education 0 0 0% 0 0%
Cost of Living 0 0 0% 0 0%
Vocational Education 0 0 0% 0 0%
Gifts/Grants 59,933 132,134 120% 96,000 -27%
Special Liability 0 0 0% 0 0%
School Retirement 0 0 0% 0 0%
Extraordinary Growth Facilities 0 0 0% 0 0%
Special Reserve 0 0 0%
KPERS Spec. Ret. Contribution 416,138 438,469 5% 528,582 21%
Contingency Reserve 0 0 0%
Text Book & Student Material 0 0 0%
Activity Fund 0 0 0% 0 0%
Bond and Interest #1 0 0 0% 0 0%
Bond and Interest #2 0 0 0% 0 0%
No-Fund Warrant 0 0 0% 0 0%
Special Assessment 0 0 0% 0 0%
Temporary Note 0 0 0% 0 0%
SUBTOTAL 5,511,778 5,137,860 -7% 5,499,367 7%
Enrollment (FTE)* 7,194.0 7,204.0 0% 7,185.0 0%
Amount per Pupil 766 713 -7% 765 7%
Adult Education 92,026 90,197 -2% 101,000 12%
Adult Supplemental Education 0 0 0% 0 0%
Tuition Reimbursement 0 0 0% 0 0%
Special Education Coop 638,268 539,310 -16% 563,100 4%
TOTAL 6,242,072 5,767,367 -8% 6,163,467 7%
Amount per Pupil $868 $801 -8% $858 7%
NOTE: Gifts/Grants includes private grants and grants from nonfederal sources.
Amount per pupil excludes the following funds: Adult Education, Adult Supplemental Education, Special Education Coop
and Tuition Reimbursement.
*Enrollment (FTE) includes the enrollment of the district used for state aid and budget authority, and all other preschool enrollment
and kindergarten students attending full time.
5,500,000
5,600,000
5,700,000
5,800,000
5,900,000
6,000,000
6,100,000
6,200,000
6,300,000
2012-2013 2013-2014 2014-2015
6,242,072
5,767,367
6,163,467
Instructional Support Expenditures
9/16/2014 8:43 AM Sumexpen.xlsx Page 8 of 30
USD# 305
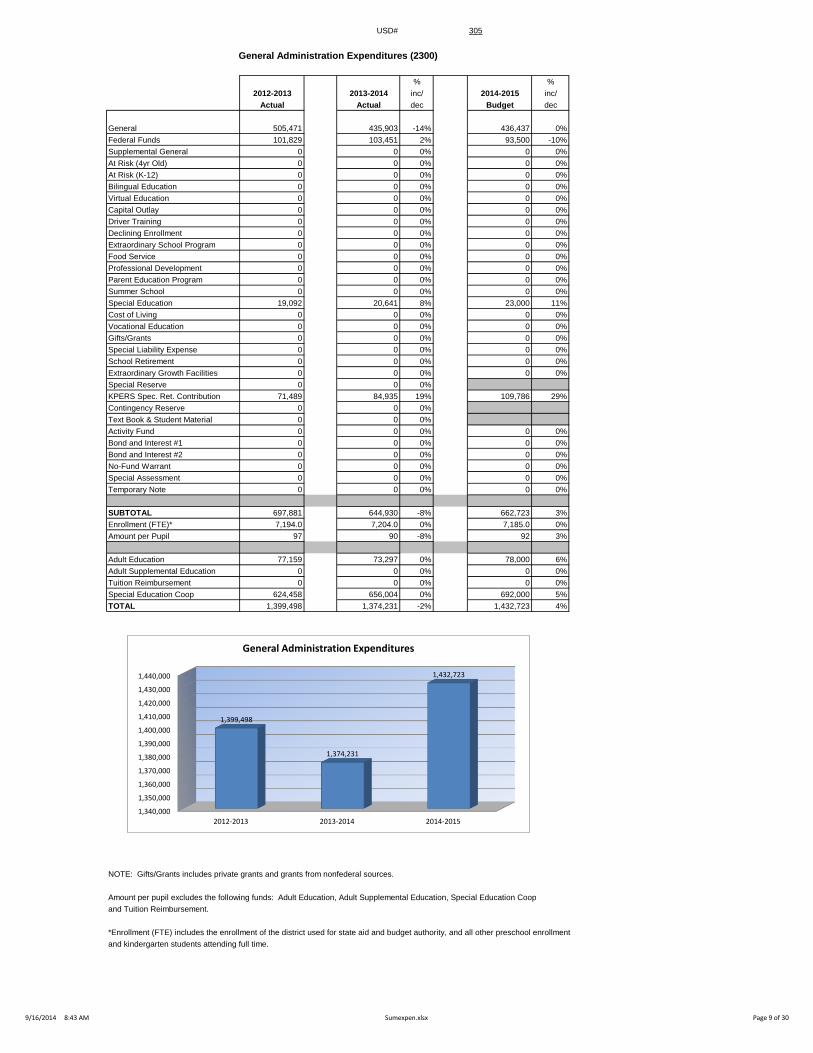
General Administration Expenditures (2300)
% %
2012-2013 2013-2014 inc/ 2014-2015 inc/
Actual Actual dec Budget dec
General 505,471 435,903 -14% 436,437 0%
Federal Funds 101,829 103,451 2% 93,500 -10%
Supplemental General 0 0 0% 0 0%
At Risk (4yr Old) 0 0 0% 0 0%
At Risk (K-12) 0 0 0% 0 0%
Bilingual Education 0 0 0% 0 0%
Virtual Education 0 0 0% 0 0%
Capital Outlay 0 0 0% 0 0%
Driver Training 0 0 0% 0 0%
Declining Enrollment 0 0 0% 0 0%
Extraordinary School Program 0 0 0% 0 0%
Food Service 0 0 0% 0 0%
Professional Development 0 0 0% 0 0%
Parent Education Program 0 0 0% 0 0%
Summer School 0 0 0% 0 0%
Special Education 19,092 20,641 8% 23,000 11%
Cost of Living 0 0 0% 0 0%
Vocational Education 0 0 0% 0 0%
Gifts/Grants 0 0 0% 0 0%
Special Liability Expense 0 0 0% 0 0%
School Retirement 0 0 0% 0 0%
Extraordinary Growth Facilities 0 0 0% 0 0%
Special Reserve 0 0 0%
KPERS Spec. Ret. Contribution 71,489 84,935 19% 109,786 29%
Contingency Reserve 0 0 0%
Text Book & Student Material 0 0 0%
Activity Fund 0 0 0% 0 0%
Bond and Interest #1 0 0 0% 0 0%
Bond and Interest #2 0 0 0% 0 0%
No-Fund Warrant 0 0 0% 0 0%
Special Assessment 0 0 0% 0 0%
Temporary Note 0 0 0% 0 0%
SUBTOTAL 697,881 644,930 -8% 662,723 3%
Enrollment (FTE)* 7,194.0 7,204.0 0% 7,185.0 0%
Amount per Pupil 97 90 -8% 92 3%
Adult Education 77,159 73,297 0% 78,000 6%
Adult Supplemental Education 0 0 0% 0 0%
Tuition Reimbursement 0 0 0% 0 0%
Special Education Coop 624,458 656,004 0% 692,000 5%
TOTAL 1,399,498 1,374,231 -2% 1,432,723 4%
NOTE: Gifts/Grants includes private grants and grants from nonfederal sources.
Amount per pupil excludes the following funds: Adult Education, Adult Supplemental Education, Special Education Coop
and Tuition Reimbursement.
*Enrollment (FTE) includes the enrollment of the district used for state aid and budget authority, and all other preschool enrollment
and kindergarten students attending full time.
1,340,000
1,350,000
1,360,000
1,370,000
1,380,000
1,390,000
1,400,000
1,410,000
1,420,000
1,430,000
1,440,000
2012-2013 2013-2014 2014-2015
1,399,498
1,374,231
1,432,723
General Administration Expenditures
9/16/2014 8:43 AM Sumexpen.xlsx Page 9 of 30

USD# 305
School Administration Expenditures (2400)
% %
2012-2013 2013-2014 inc/ 2014-2015 inc/
Actual Actual dec Budget dec
General 2,743,964 2,779,710 1% 2,885,275 4%
Federal Funds 163,537 121,570 -26% 115,500 -5%
Supplemental General 0 0 0% 0 0%
At Risk (4yr Old) 0 0 0% 0 0%
At Risk (K-12) 36,236 125,032 245% 114,100 -9%
Bilingual Education 0 0 0% 0 0%
Virtual Education 0 0 0% 0 0%
Capital Outlay 0 0 0% 0 0%
Driver Training 0 0 0% 0 0%
Declining Enrollment 0 0 0% 0 0%
Extraordinary School Program 0 0 0% 0 0%
Food Service 0 0 0% 0 0%
Professional Development 0 0 0% 0 0%
Parent Education Program 0 0 0% 0 0%
Summer School 0 0 0% 0 0%
Special Education 0 0 0% 0 0%
Cost of Living 0 0 0% 0 0%
Vocational Education 0 0 0% 0 0%
Gifts/Grants 0 0 0% 0 0%
Special Liability Expense 0 0 0% 0 0%
School Retirement 0 0 0% 0 0%
Extraordinary Growth Facilities 0 0 0% 0 0%
Special Reserve 0 0 0%
KPERS Spec. Ret. Contribution 235,072 268,313 14% 308,891 15%
Contingency Reserve 0 0 0%
Text Book & Student Material 0 0 0%
Activity Fund 0 0 0% 0 0%
Bond and Interest #1 0 0 0% 0 0%
Bond and Interest #2 0 0 0% 0 0%
No-Fund Warrant 0 0 0% 0 0%
Special Assessment 0 0 0% 0 0%
Temporary Note 0 0 0% 0 0%
SUBTOTAL 3,178,809 3,294,625 4% 3,423,766 4%
Enrollment (FTE)* 7,194.0 7,204.0 0% 7,185.0 0%
Amount per Pupil 442 457 3% 477 4%
Adult Education 0 0 0% 0 0%
Adult Supplemental Education 0 0 0% 0 0%
Tuition Reimbursement 0 0 0% 0 0%
Special Education Coop 0 0 0% 0 0%
TOTAL 3,178,809 3,294,625 4% 3,423,766 4%
NOTE: Gifts/Grants includes private grants and grants from nonfederal sources.
Amount per pupil excludes the following funds: Adult Education, Adult Supplemental Education, Special Education Coop
and Tuition Reimbursement.
*Enrollment (FTE) includes the enrollment of the district used for state aid and budget authority, and all other preschool enrollment
and kindergarten students attending full time.
3,050,000
3,100,000
3,150,000
3,200,000
3,250,000
3,300,000
3,350,000
3,400,000
3,450,000
2012-2013 2013-2014 2014-2015
3,178,809
3,294,625
3,423,766
School Administration Expenditures
9/16/2014 8:43 AM Sumexpen.xlsx Page 10 of 30
USD# 305
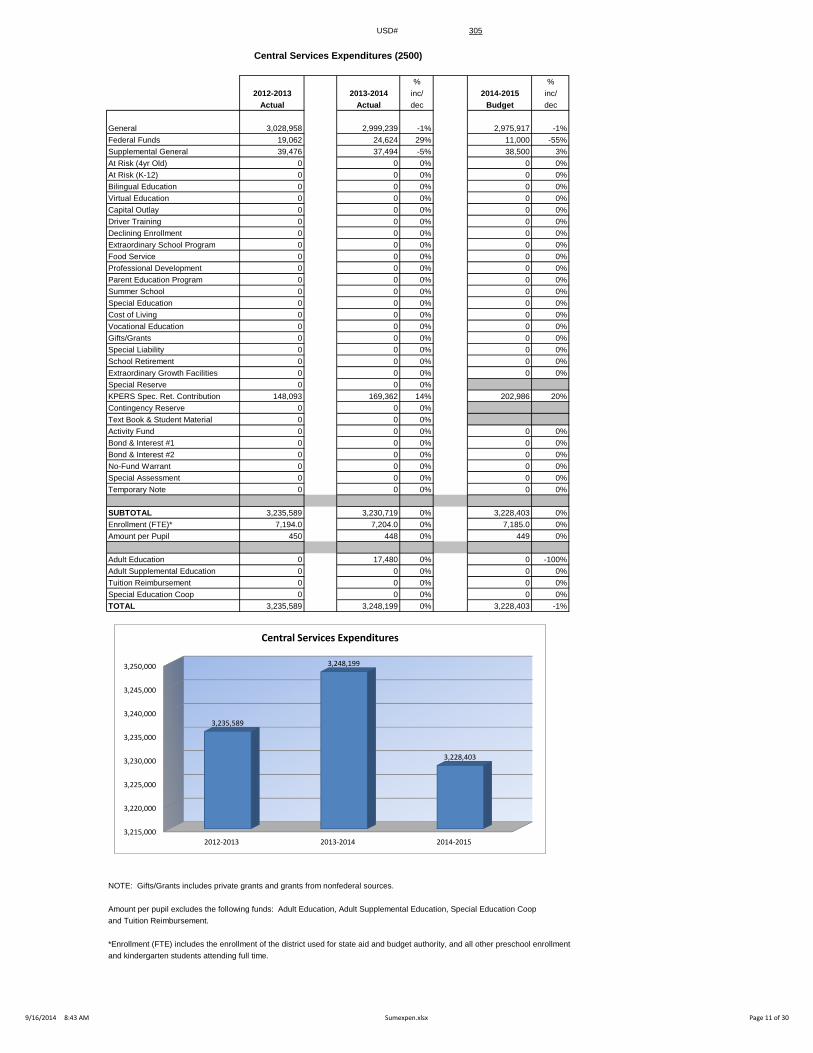
Central Services Expenditures (2500)
% %
2012-2013 2013-2014 inc/ 2014-2015 inc/
Actual Actual dec Budget dec
General 3,028,958 2,999,239 -1% 2,975,917 -1%
Federal Funds 19,062 24,624 29% 11,000 -55%
Supplemental General 39,476 37,494 -5% 38,500 3%
At Risk (4yr Old) 0 0 0% 0 0%
At Risk (K-12) 0 0 0% 0 0%
Bilingual Education 0 0 0% 0 0%
Virtual Education 0 0 0% 0 0%
Capital Outlay 0 0 0% 0 0%
Driver Training 0 0 0% 0 0%
Declining Enrollment 0 0 0% 0 0%
Extraordinary School Program 0 0 0% 0 0%
Food Service 0 0 0% 0 0%
Professional Development 0 0 0% 0 0%
Parent Education Program 0 0 0% 0 0%
Summer School 0 0 0% 0 0%
Special Education 0 0 0% 0 0%
Cost of Living 0 0 0% 0 0%
Vocational Education 0 0 0% 0 0%
Gifts/Grants 0 0 0% 0 0%
Special Liability 0 0 0% 0 0%
School Retirement 0 0 0% 0 0%
Extraordinary Growth Facilities 0 0 0% 0 0%
Special Reserve 0 0 0%
KPERS Spec. Ret. Contribution 148,093 169,362 14% 202,986 20%
Contingency Reserve 0 0 0%
Text Book & Student Material 0 0 0%
Activity Fund 0 0 0% 0 0%
Bond & Interest #1 0 0 0% 0 0%
Bond & Interest #2 0 0 0% 0 0%
No-Fund Warrant 0 0 0% 0 0%
Special Assessment 0 0 0% 0 0%
Temporary Note 0 0 0% 0 0%
SUBTOTAL 3,235,589 3,230,719 0% 3,228,403 0%
Enrollment (FTE)* 7,194.0 7,204.0 0% 7,185.0 0%
Amount per Pupil 450 448 0% 449 0%
Adult Education 0 17,480 0% 0 -100%
Adult Supplemental Education 0 0 0% 0 0%
Tuition Reimbursement 0 0 0% 0 0%
Special Education Coop 0 0 0% 0 0%
TOTAL 3,235,589 3,248,199 0% 3,228,403 -1%
NOTE: Gifts/Grants includes private grants and grants from nonfederal sources.
Amount per pupil excludes the following funds: Adult Education, Adult Supplemental Education, Special Education Coop
and Tuition Reimbursement.
*Enrollment (FTE) includes the enrollment of the district used for state aid and budget authority, and all other preschool enrollment
and kindergarten students attending full time.
3,215,000
3,220,000
3,225,000
3,230,000
3,235,000
3,240,000
3,245,000
3,250,000
2012-2013 2013-2014 2014-2015
3,235,589
3,248,199
3,228,403
Central Services Expenditures
9/16/2014 8:43 AM Sumexpen.xlsx Page 11 of 30
USD# 305
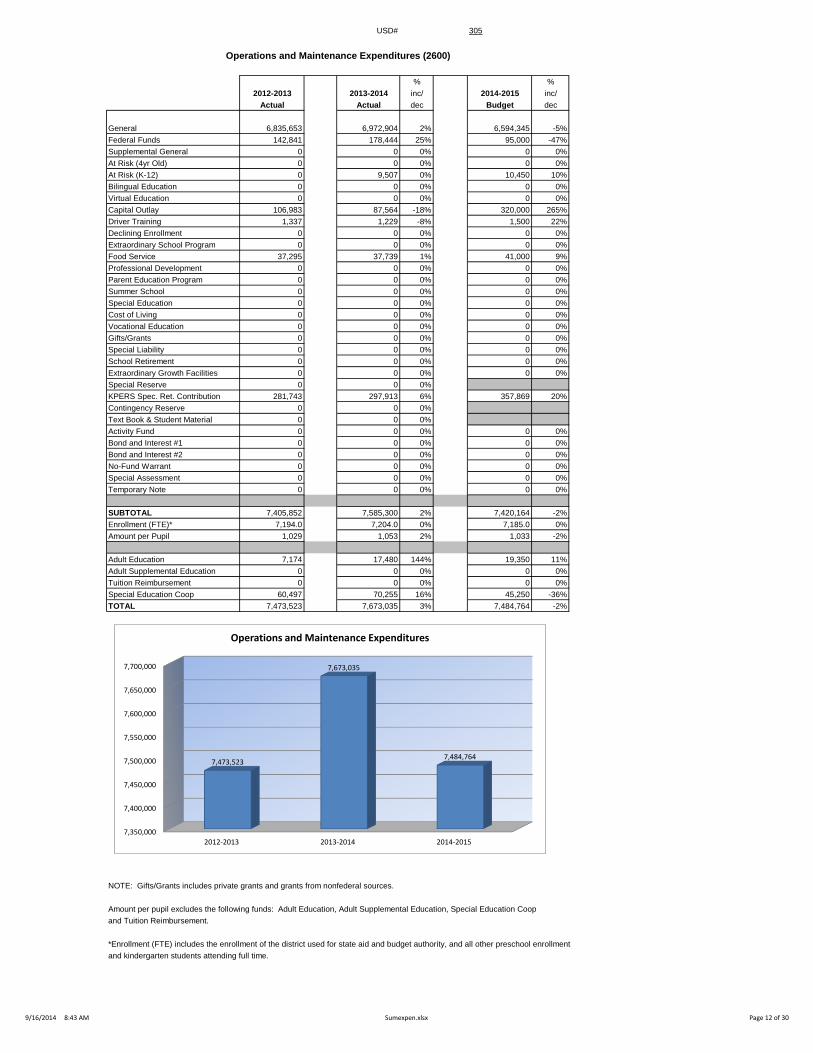
Operations and Maintenance Expenditures (2600)
% %
2012-2013 2013-2014 inc/ 2014-2015 inc/
Actual Actual dec Budget dec
General 6,835,653 6,972,904 2% 6,594,345 -5%
Federal Funds 142,841 178,444 25% 95,000 -47%
Supplemental General 0 0 0% 0 0%
At Risk (4yr Old) 0 0 0% 0 0%
At Risk (K-12) 0 9,507 0% 10,450 10%
Bilingual Education 0 0 0% 0 0%
Virtual Education 0 0 0% 0 0%
Capital Outlay 106,983 87,564 -18% 320,000 265%
Driver Training 1,337 1,229 -8% 1,500 22%
Declining Enrollment 0 0 0% 0 0%
Extraordinary School Program 0 0 0% 0 0%
Food Service 37,295 37,739 1% 41,000 9%
Professional Development 0 0 0% 0 0%
Parent Education Program 0 0 0% 0 0%
Summer School 0 0 0% 0 0%
Special Education 0 0 0% 0 0%
Cost of Living 0 0 0% 0 0%
Vocational Education 0 0 0% 0 0%
Gifts/Grants 0 0 0% 0 0%
Special Liability 0 0 0% 0 0%
School Retirement 0 0 0% 0 0%
Extraordinary Growth Facilities 0 0 0% 0 0%
Special Reserve 0 0 0%
KPERS Spec. Ret. Contribution 281,743 297,913 6% 357,869 20%
Contingency Reserve 0 0 0%
Text Book & Student Material 0 0 0%
Activity Fund 0 0 0% 0 0%
Bond and Interest #1 0 0 0% 0 0%
Bond and Interest #2 0 0 0% 0 0%
No-Fund Warrant 0 0 0% 0 0%
Special Assessment 0 0 0% 0 0%
Temporary Note 0 0 0% 0 0%
SUBTOTAL 7,405,852 7,585,300 2% 7,420,164 -2%
Enrollment (FTE)* 7,194.0 7,204.0 0% 7,185.0 0%
Amount per Pupil 1,029 1,053 2% 1,033 -2%
Adult Education 7,174 17,480 144% 19,350 11%
Adult Supplemental Education 0 0 0% 0 0%
Tuition Reimbursement 0 0 0% 0 0%
Special Education Coop 60,497 70,255 16% 45,250 -36%
TOTAL 7,473,523 7,673,035 3% 7,484,764 -2%
NOTE: Gifts/Grants includes private grants and grants from nonfederal sources.
Amount per pupil excludes the following funds: Adult Education, Adult Supplemental Education, Special Education Coop
and Tuition Reimbursement.
*Enrollment (FTE) includes the enrollment of the district used for state aid and budget authority, and all other preschool enrollment
and kindergarten students attending full time.
7,350,000
7,400,000
7,450,000
7,500,000
7,550,000
7,600,000
7,650,000
7,700,000
2012-2013 2013-2014 2014-2015
7,473,523
7,673,035
7,484,764
Operations and Maintenance Expenditures
9/16/2014 8:43 AM Sumexpen.xlsx Page 12 of 30

USD# 305
Transportation Expenditures (2700)
% %
2012-2013 2013-2014 inc/ 2014-2015 inc/
Actual Actual dec Budget dec
General 940,909 1,002,823 7% 1,063,962 6%
Federal Funds 48,749 81,134 66% 81,000 0%
Supplemental General 0 0 0% 0 0%
At Risk (4yr Old) 22,870 23,662 3% 25,000 6%
At Risk (K-12) 38,542 30,518 -21% 40,000 31%
Bilingual Education 0 0 0% 0 0%
Virtual Education 0 0 0% 0 0%
Capital Outlay 0 0 0% 0 0%
Driver Training 0 0 0% 0 0%
Declining Enrollment 0 0 0% 0 0%
Extraordinary School Program 0 0 0% 0 0%
Food Service 0 0 0% 0 0%
Professional Development 0 0 0% 0 0%
Parent Education Program 0 0 0% 0 0%
Summer School 0 0 0% 0 0%
Special Education 1,021,182 976,776 -4% 1,105,650 13%
Cost of Living 0 0 0% 0 0%
Vocational Education 0 0 0% 0 0%
Gifts/Grants 0 0 0% 0 0%
Special Liability 0 0 0% 0 0%
School Retirement 0 0 0% 0 0%
Extraordinary Growth Facilities 0 0 0% 0 0%
Special Reserve 0 0 0%
KPERS Spec. Ret. Contribution 1,898 2,250 19% 2,366 5%
Contingency Reserve 0 0 0%
Text Book & Student Material 0 0 0%
Activity Fund 0 0 0%
Bond and Interest #1 0 0 0% 0 0%
Bond and Interest #2 0 0 0% 0 0%
No-Fund Warrant 0 0 0% 0 0%
Special Assessment 0 0 0% 0 0%
Temporary Note 0 0 0% 0 0%
SUBTOTAL 2,074,150 2,117,163 2% 2,317,978 9%
Enrollment (FTE)* 7,194.0 7,204.0 0% 7,185.0 0%
Amount per Pupil 288 294 2% 323 10%
Adult Education 0 0 0% 0 0%
Adult Supplemental Education 0 0 0% 0 0%
Tuition Reimbursement 0 0 0% 0 0%
Special Education Coop 0 0 0% 0 0%
TOTAL 2,074,150 2,117,163 2% 2,317,978 9%
NOTE: Gifts/Grants includes private grants and grants from nonfederal sources.
Amount per pupil excludes the following funds: Adult Education, Adult Supplemental Education, Special Education Coop
and Tuition Reimbursement.
*Enrollment (FTE) includes the enrollment of the district used for state aid and budget authority, and all other preschool enrollment
and kindergarten students attending full time.
1,950,000
2,000,000
2,050,000
2,100,000
2,150,000
2,200,000
2,250,000
2,300,000
2,350,000
2012-2013 2013-2014 2014-2015
2,074,150
2,117,163
2,317,978
Transportation Expenditures
9/16/2014 8:43 AM Sumexpen.xlsx Page 13 of 30
USD# 305
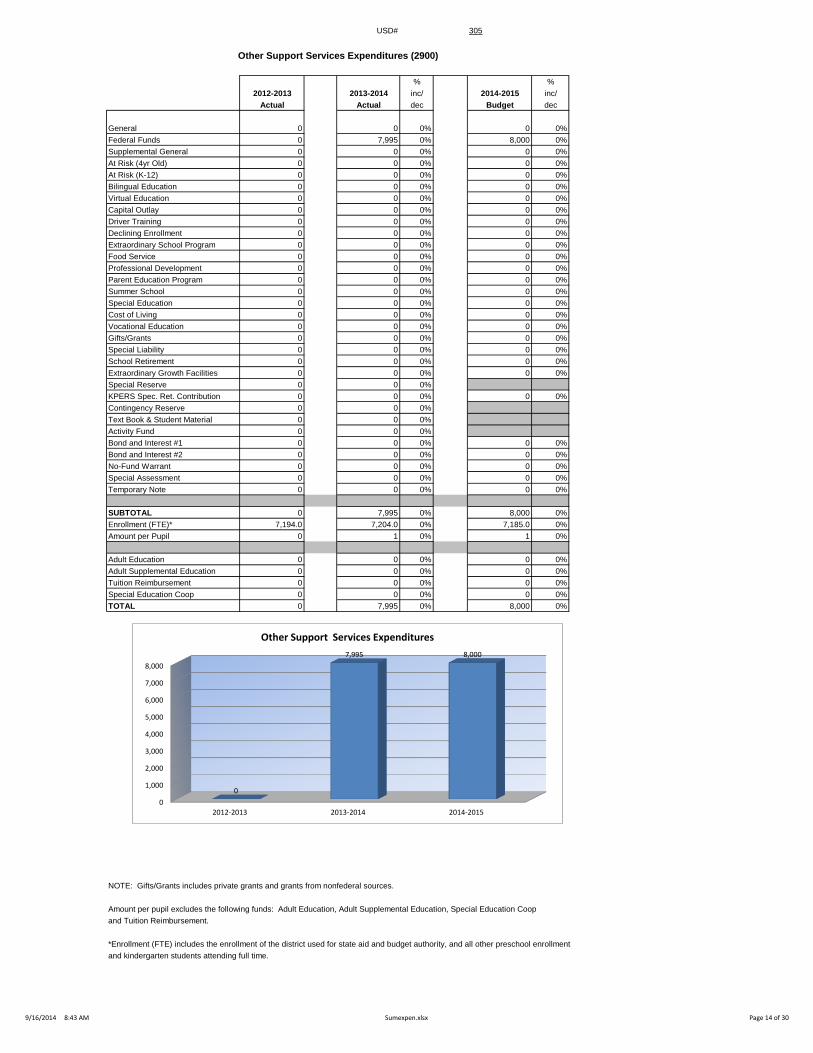
Other Support Services Expenditures (2900)
% %
2012-2013 2013-2014 inc/ 2014-2015 inc/
Actual Actual dec Budget dec
General 0 0 0% 0 0%
Federal Funds 0 7,995 0% 8,000 0%
Supplemental General 0 0 0% 0 0%
At Risk (4yr Old) 0 0 0% 0 0%
At Risk (K-12) 0 0 0% 0 0%
Bilingual Education 0 0 0% 0 0%
Virtual Education 0 0 0% 0 0%
Capital Outlay 0 0 0% 0 0%
Driver Training 0 0 0% 0 0%
Declining Enrollment 0 0 0% 0 0%
Extraordinary School Program 0 0 0% 0 0%
Food Service 0 0 0% 0 0%
Professional Development 0 0 0% 0 0%
Parent Education Program 0 0 0% 0 0%
Summer School 0 0 0% 0 0%
Special Education 0 0 0% 0 0%
Cost of Living 0 0 0% 0 0%
Vocational Education 0 0 0% 0 0%
Gifts/Grants 0 0 0% 0 0%
Special Liability 0 0 0% 0 0%
School Retirement 0 0 0% 0 0%
Extraordinary Growth Facilities 0 0 0% 0 0%
Special Reserve 0 0 0%
KPERS Spec. Ret. Contribution 0 0 0% 0 0%
Contingency Reserve 0 0 0%
Text Book & Student Material 0 0 0%
Activity Fund 0 0 0%
Bond and Interest #1 0 0 0% 0 0%
Bond and Interest #2 0 0 0% 0 0%
No-Fund Warrant 0 0 0% 0 0%
Special Assessment 0 0 0% 0 0%
Temporary Note 0 0 0% 0 0%
SUBTOTAL 0 7,995 0% 8,000 0%
Enrollment (FTE)* 7,194.0 7,204.0 0% 7,185.0 0%
Amount per Pupil 0 1 0% 1 0%
Adult Education 0 0 0% 0 0%
Adult Supplemental Education 0 0 0% 0 0%
Tuition Reimbursement 0 0 0% 0 0%
Special Education Coop 0 0 0% 0 0%
TOTAL 0 7,995 0% 8,000 0%
NOTE: Gifts/Grants includes private grants and grants from nonfederal sources.
Amount per pupil excludes the following funds: Adult Education, Adult Supplemental Education, Special Education Coop
and Tuition Reimbursement.
*Enrollment (FTE) includes the enrollment of the district used for state aid and budget authority, and all other preschool enrollment
and kindergarten students attending full time.
0
1,000
2,000
3,000
4,000
5,000
6,000
7,000
8,000
2012-2013 2013-2014 2014-2015
0
7,995 8,000
Other Support Services Expenditures
9/16/2014 8:43 AM Sumexpen.xlsx Page 14 of 30
USD# 305
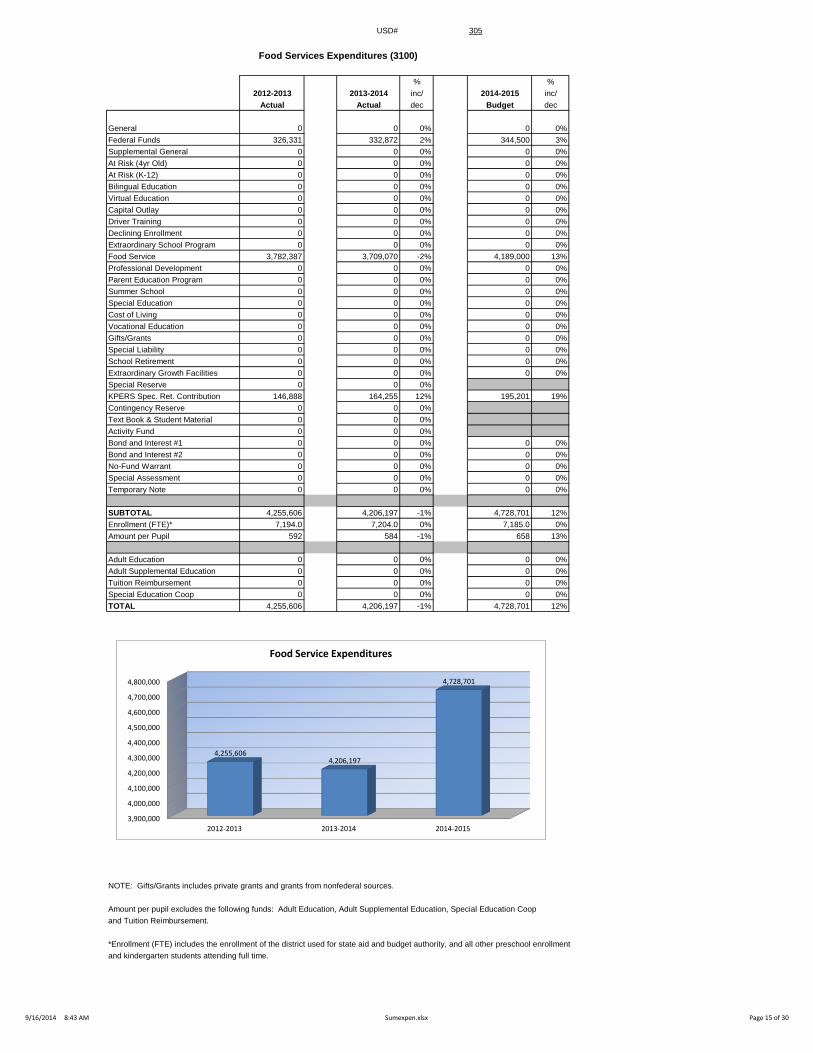
Food Services Expenditures (3100)
% %
2012-2013 2013-2014 inc/ 2014-2015 inc/
Actual Actual dec Budget dec
General 0 0 0% 0 0%
Federal Funds 326,331 332,872 2% 344,500 3%
Supplemental General 0 0 0% 0 0%
At Risk (4yr Old) 0 0 0% 0 0%
At Risk (K-12) 0 0 0% 0 0%
Bilingual Education 0 0 0% 0 0%
Virtual Education 0 0 0% 0 0%
Capital Outlay 0 0 0% 0 0%
Driver Training 0 0 0% 0 0%
Declining Enrollment 0 0 0% 0 0%
Extraordinary School Program 0 0 0% 0 0%
Food Service 3,782,387 3,709,070 -2% 4,189,000 13%
Professional Development 0 0 0% 0 0%
Parent Education Program 0 0 0% 0 0%
Summer School 0 0 0% 0 0%
Special Education 0 0 0% 0 0%
Cost of Living 0 0 0% 0 0%
Vocational Education 0 0 0% 0 0%
Gifts/Grants 0 0 0% 0 0%
Special Liability 0 0 0% 0 0%
School Retirement 0 0 0% 0 0%
Extraordinary Growth Facilities 0 0 0% 0 0%
Special Reserve 0 0 0%
KPERS Spec. Ret. Contribution 146,888 164,255 12% 195,201 19%
Contingency Reserve 0 0 0%
Text Book & Student Material 0 0 0%
Activity Fund 0 0 0%
Bond and Interest #1 0 0 0% 0 0%
Bond and Interest #2 0 0 0% 0 0%
No-Fund Warrant 0 0 0% 0 0%
Special Assessment 0 0 0% 0 0%
Temporary Note 0 0 0% 0 0%
SUBTOTAL 4,255,606 4,206,197 -1% 4,728,701 12%
Enrollment (FTE)* 7,194.0 7,204.0 0% 7,185.0 0%
Amount per Pupil 592 584 -1% 658 13%
Adult Education 0 0 0% 0 0%
Adult Supplemental Education 0 0 0% 0 0%
Tuition Reimbursement 0 0 0% 0 0%
Special Education Coop 0 0 0% 0 0%
TOTAL 4,255,606 4,206,197 -1% 4,728,701 12%
NOTE: Gifts/Grants includes private grants and grants from nonfederal sources.
Amount per pupil excludes the following funds: Adult Education, Adult Supplemental Education, Special Education Coop
and Tuition Reimbursement.
*Enrollment (FTE) includes the enrollment of the district used for state aid and budget authority, and all other preschool enrollment
and kindergarten students attending full time.
3,900,000
4,000,000
4,100,000
4,200,000
4,300,000
4,400,000
4,500,000
4,600,000
4,700,000
4,800,000
2012-2013 2013-2014 2014-2015
4,255,606 4,206,197
4,728,701
Food Service Expenditures
9/16/2014 8:43 AM Sumexpen.xlsx Page 15 of 30
USD# 305
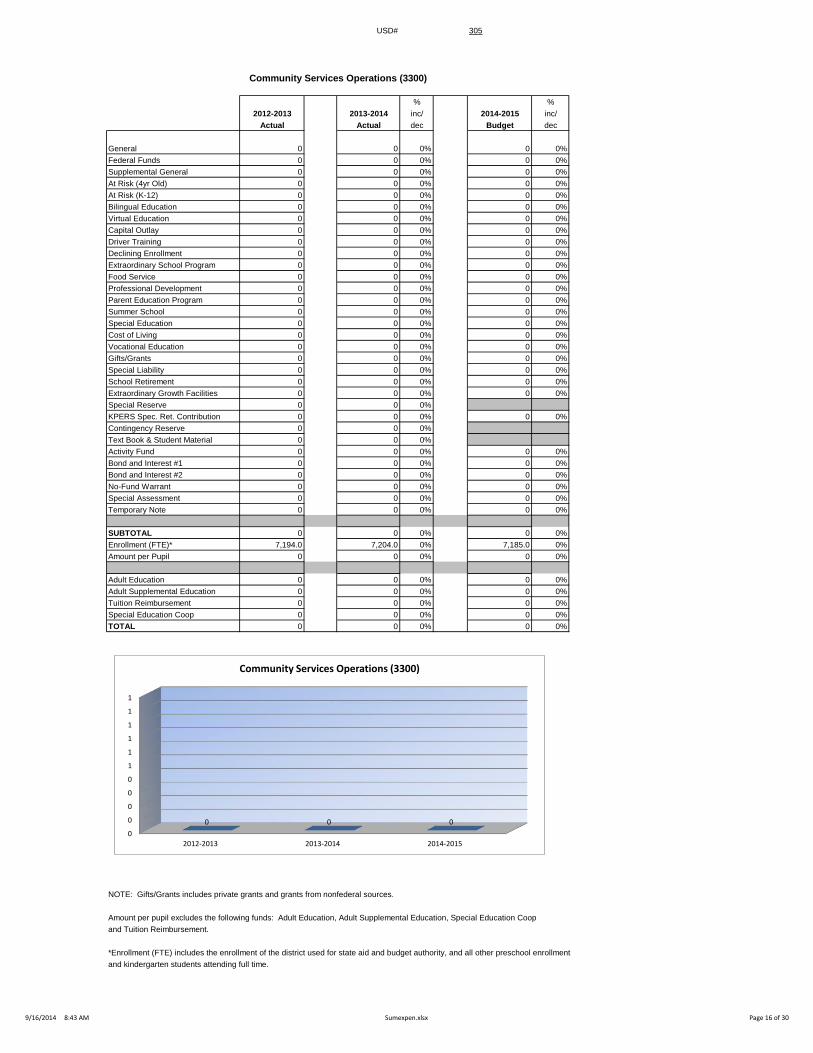
Community Services Operations (3300)
% %
2012-2013 2013-2014 inc/ 2014-2015 inc/
Actual Actual dec Budget dec
General 0 0 0% 0 0%
Federal Funds 0 0 0% 0 0%
Supplemental General 0 0 0% 0 0%
At Risk (4yr Old) 0 0 0% 0 0%
At Risk (K-12) 0 0 0% 0 0%
Bilingual Education 0 0 0% 0 0%
Virtual Education 0 0 0% 0 0%
Capital Outlay 0 0 0% 0 0%
Driver Training 0 0 0% 0 0%
Declining Enrollment 0 0 0% 0 0%
Extraordinary School Program 0 0 0% 0 0%
Food Service 0 0 0% 0 0%
Professional Development 0 0 0% 0 0%
Parent Education Program 0 0 0% 0 0%
Summer School 0 0 0% 0 0%
Special Education 0 0 0% 0 0%
Cost of Living 0 0 0% 0 0%
Vocational Education 0 0 0% 0 0%
Gifts/Grants 0 0 0% 0 0%
Special Liability 0 0 0% 0 0%
School Retirement 0 0 0% 0 0%
Extraordinary Growth Facilities 0 0 0% 0 0%
Special Reserve 0 0 0%
KPERS Spec. Ret. Contribution 0 0 0% 0 0%
Contingency Reserve 0 0 0%
Text Book & Student Material 0 0 0%
Activity Fund 0 0 0% 0 0%
Bond and Interest #1 0 0 0% 0 0%
Bond and Interest #2 0 0 0% 0 0%
No-Fund Warrant 0 0 0% 0 0%
Special Assessment 0 0 0% 0 0%
Temporary Note 0 0 0% 0 0%
SUBTOTAL 0 0 0% 0 0%
Enrollment (FTE)* 7,194.0 7,204.0 0% 7,185.0 0%
Amount per Pupil 0 0 0% 0 0%
Adult Education 0 0 0% 0 0%
Adult Supplemental Education 0 0 0% 0 0%
Tuition Reimbursement 0 0 0% 0 0%
Special Education Coop 0 0 0% 0 0%
TOTAL 0 0 0% 0 0%
NOTE: Gifts/Grants includes private grants and grants from nonfederal sources.
Amount per pupil excludes the following funds: Adult Education, Adult Supplemental Education, Special Education Coop
and Tuition Reimbursement.
*Enrollment (FTE) includes the enrollment of the district used for state aid and budget authority, and all other preschool enrollment
and kindergarten students attending full time.
0
0
0
0
0
1
1
1
1
1
1
2012-2013 2013-2014 2014-2015
0 0 0
Community Services Operations (3300)
9/16/2014 8:43 AM Sumexpen.xlsx Page 16 of 30
USD# 305
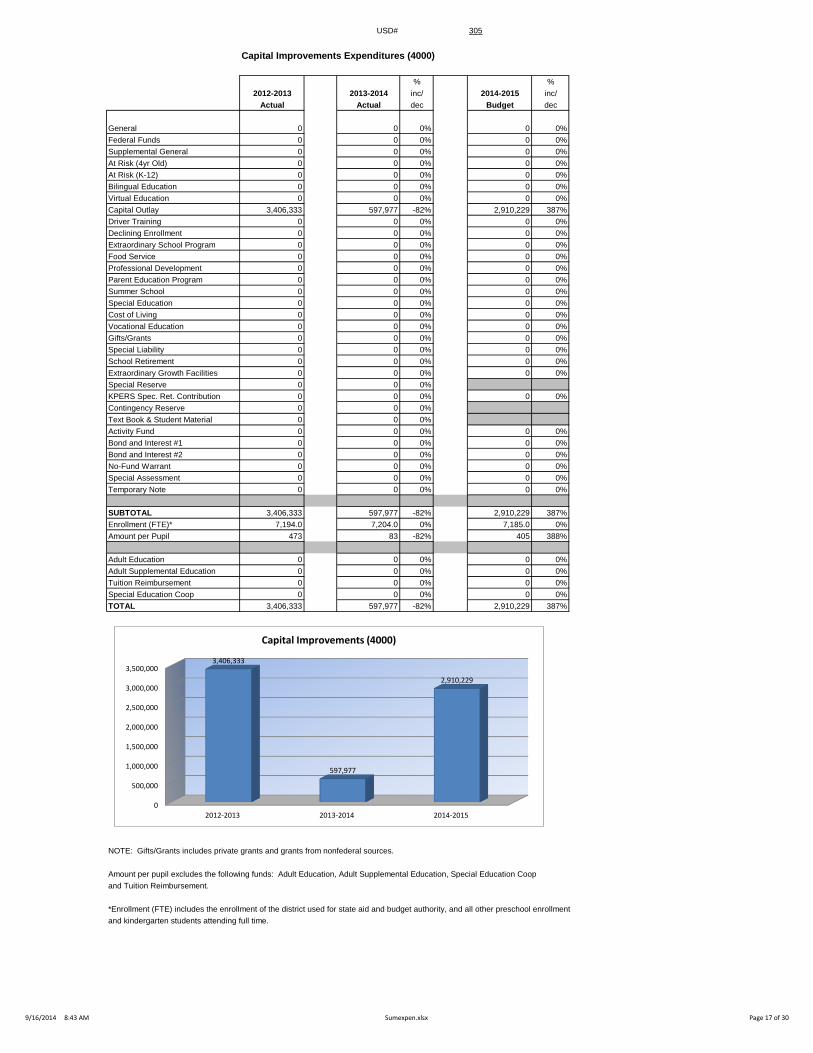
Capital Improvements Expenditures (4000)
% %
2012-2013 2013-2014 inc/ 2014-2015 inc/
Actual Actual dec Budget dec
General 0 0 0% 0 0%
Federal Funds 0 0 0% 0 0%
Supplemental General 0 0 0% 0 0%
At Risk (4yr Old) 0 0 0% 0 0%
At Risk (K-12) 0 0 0% 0 0%
Bilingual Education 0 0 0% 0 0%
Virtual Education 0 0 0% 0 0%
Capital Outlay 3,406,333 597,977 -82% 2,910,229 387%
Driver Training 0 0 0% 0 0%
Declining Enrollment 0 0 0% 0 0%
Extraordinary School Program 0 0 0% 0 0%
Food Service 0 0 0% 0 0%
Professional Development 0 0 0% 0 0%
Parent Education Program 0 0 0% 0 0%
Summer School 0 0 0% 0 0%
Special Education 0 0 0% 0 0%
Cost of Living 0 0 0% 0 0%
Vocational Education 0 0 0% 0 0%
Gifts/Grants 0 0 0% 0 0%
Special Liability 0 0 0% 0 0%
School Retirement 0 0 0% 0 0%
Extraordinary Growth Facilities 0 0 0% 0 0%
Special Reserve 0 0 0%
KPERS Spec. Ret. Contribution 0 0 0% 0 0%
Contingency Reserve 0 0 0%
Text Book & Student Material 0 0 0%
Activity Fund 0 0 0% 0 0%
Bond and Interest #1 0 0 0% 0 0%
Bond and Interest #2 0 0 0% 0 0%
No-Fund Warrant 0 0 0% 0 0%
Special Assessment 0 0 0% 0 0%
Temporary Note 0 0 0% 0 0%
SUBTOTAL 3,406,333 597,977 -82% 2,910,229 387%
Enrollment (FTE)* 7,194.0 7,204.0 0% 7,185.0 0%
Amount per Pupil 473 83 -82% 405 388%
Adult Education 0 0 0% 0 0%
Adult Supplemental Education 0 0 0% 0 0%
Tuition Reimbursement 0 0 0% 0 0%
Special Education Coop 0 0 0% 0 0%
TOTAL 3,406,333 597,977 -82% 2,910,229 387%
NOTE: Gifts/Grants includes private grants and grants from nonfederal sources.
Amount per pupil excludes the following funds: Adult Education, Adult Supplemental Education, Special Education Coop
and Tuition Reimbursement.
*Enrollment (FTE) includes the enrollment of the district used for state aid and budget authority, and all other preschool enrollment
and kindergarten students attending full time.
0
500,000
1,000,000
1,500,000
2,000,000
2,500,000
3,000,000
3,500,000
2012-2013 2013-2014 2014-2015
3,406,333
597,977
2,910,229
Capital Improvements (4000)
9/16/2014 8:43 AM Sumexpen.xlsx Page 17 of 30
USD# 305
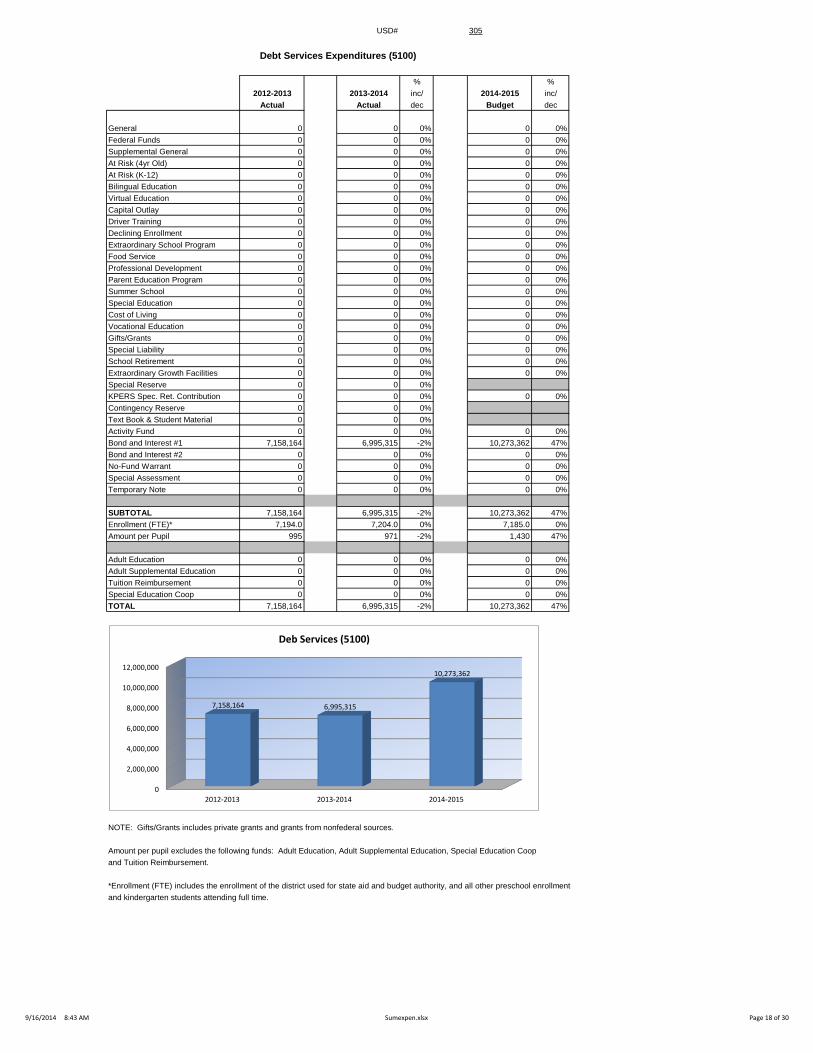
Debt Services Expenditures (5100)
% %
2012-2013 2013-2014 inc/ 2014-2015 inc/
Actual Actual dec Budget dec
General 0 0 0% 0 0%
Federal Funds 0 0 0% 0 0%
Supplemental General 0 0 0% 0 0%
At Risk (4yr Old) 0 0 0% 0 0%
At Risk (K-12) 0 0 0% 0 0%
Bilingual Education 0 0 0% 0 0%
Virtual Education 0 0 0% 0 0%
Capital Outlay 0 0 0% 0 0%
Driver Training 0 0 0% 0 0%
Declining Enrollment 0 0 0% 0 0%
Extraordinary School Program 0 0 0% 0 0%
Food Service 0 0 0% 0 0%
Professional Development 0 0 0% 0 0%
Parent Education Program 0 0 0% 0 0%
Summer School 0 0 0% 0 0%
Special Education 0 0 0% 0 0%
Cost of Living 0 0 0% 0 0%
Vocational Education 0 0 0% 0 0%
Gifts/Grants 0 0 0% 0 0%
Special Liability 0 0 0% 0 0%
School Retirement 0 0 0% 0 0%
Extraordinary Growth Facilities 0 0 0% 0 0%
Special Reserve 0 0 0%
KPERS Spec. Ret. Contribution 0 0 0% 0 0%
Contingency Reserve 0 0 0%
Text Book & Student Material 0 0 0%
Activity Fund 0 0 0% 0 0%
Bond and Interest #1 7,158,164 6,995,315 -2% 10,273,362 47%
Bond and Interest #2 0 0 0% 0 0%
No-Fund Warrant 0 0 0% 0 0%
Special Assessment 0 0 0% 0 0%
Temporary Note 0 0 0% 0 0%
SUBTOTAL 7,158,164 6,995,315 -2% 10,273,362 47%
Enrollment (FTE)* 7,194.0 7,204.0 0% 7,185.0 0%
Amount per Pupil 995 971 -2% 1,430 47%
Adult Education 0 0 0% 0 0%
Adult Supplemental Education 0 0 0% 0 0%
Tuition Reimbursement 0 0 0% 0 0%
Special Education Coop 0 0 0% 0 0%
TOTAL 7,158,164 6,995,315 -2% 10,273,362 47%
NOTE: Gifts/Grants includes private grants and grants from nonfederal sources.
Amount per pupil excludes the following funds: Adult Education, Adult Supplemental Education, Special Education Coop
and Tuition Reimbursement.
*Enrollment (FTE) includes the enrollment of the district used for state aid and budget authority, and all other preschool enrollment
and kindergarten students attending full time.
0
2,000,000
4,000,000
6,000,000
8,000,000
10,000,000
12,000,000
2012-2013 2013-2014 2014-2015
7,158,164 6,995,315
10,273,362
Deb Services (5100)
9/16/2014 8:43 AM Sumexpen.xlsx Page 18 of 30
USD# 305
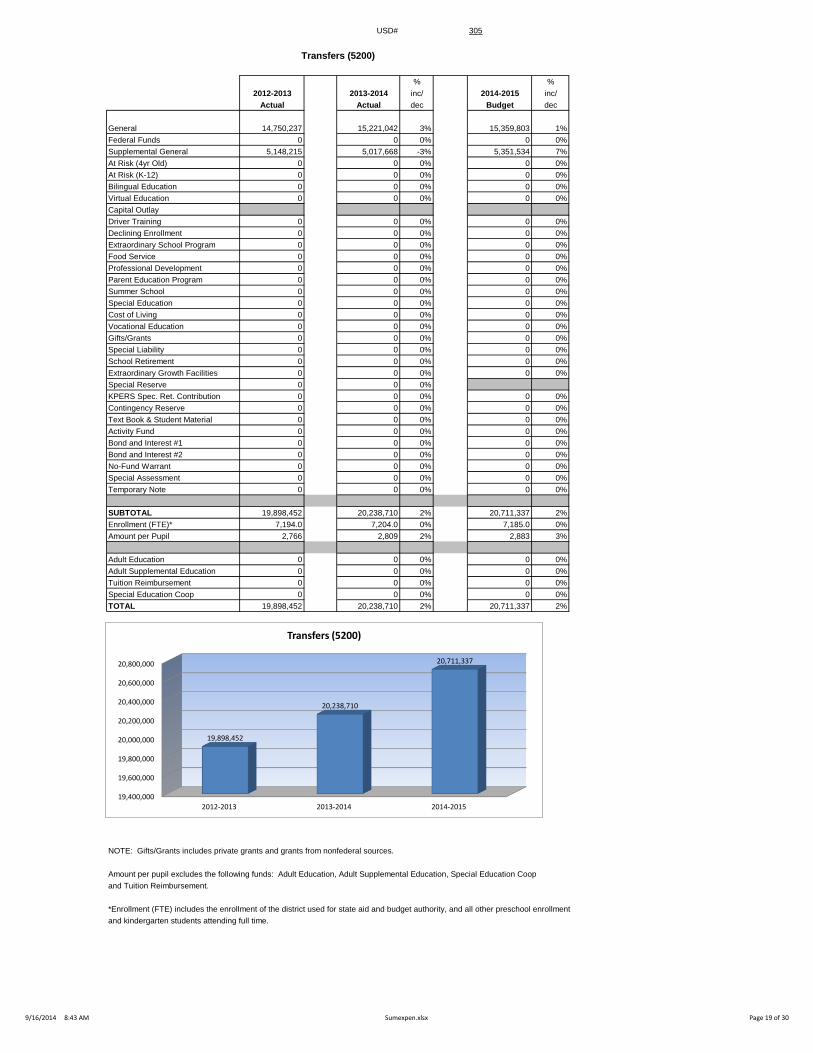
Transfers (5200)
% %
2012-2013 2013-2014 inc/ 2014-2015 inc/
Actual Actual dec Budget dec
General 14,750,237 15,221,042 3% 15,359,803 1%
Federal Funds 0 0 0% 0 0%
Supplemental General 5,148,215 5,017,668 -3% 5,351,534 7%
At Risk (4yr Old) 0 0 0% 0 0%
At Risk (K-12) 0 0 0% 0 0%
Bilingual Education 0 0 0% 0 0%
Virtual Education 0 0 0% 0 0%
Capital Outlay
Driver Training 0 0 0% 0 0%
Declining Enrollment 0 0 0% 0 0%
Extraordinary School Program 0 0 0% 0 0%
Food Service 0 0 0% 0 0%
Professional Development 0 0 0% 0 0%
Parent Education Program 0 0 0% 0 0%
Summer School 0 0 0% 0 0%
Special Education 0 0 0% 0 0%
Cost of Living 0 0 0% 0 0%
Vocational Education 0 0 0% 0 0%
Gifts/Grants 0 0 0% 0 0%
Special Liability 0 0 0% 0 0%
School Retirement 0 0 0% 0 0%
Extraordinary Growth Facilities 0 0 0% 0 0%
Special Reserve 0 0 0%
KPERS Spec. Ret. Contribution 0 0 0% 0 0%
Contingency Reserve 0 0 0% 0 0%
Text Book & Student Material 0 0 0% 0 0%
Activity Fund 0 0 0% 0 0%
Bond and Interest #1 0 0 0% 0 0%
Bond and Interest #2 0 0 0% 0 0%
No-Fund Warrant 0 0 0% 0 0%
Special Assessment 0 0 0% 0 0%
Temporary Note 0 0 0% 0 0%
SUBTOTAL 19,898,452 20,238,710 2% 20,711,337 2%
Enrollment (FTE)* 7,194.0 7,204.0 0% 7,185.0 0%
Amount per Pupil 2,766 2,809 2% 2,883 3%
Adult Education 0 0 0% 0 0%
Adult Supplemental Education 0 0 0% 0 0%
Tuition Reimbursement 0 0 0% 0 0%
Special Education Coop 0 0 0% 0 0%
TOTAL 19,898,452 20,238,710 2% 20,711,337 2%
NOTE: Gifts/Grants includes private grants and grants from nonfederal sources.
Amount per pupil excludes the following funds: Adult Education, Adult Supplemental Education, Special Education Coop
and Tuition Reimbursement.
*Enrollment (FTE) includes the enrollment of the district used for state aid and budget authority, and all other preschool enrollment
and kindergarten students attending full time.
19,400,000
19,600,000
19,800,000
20,000,000
20,200,000
20,400,000
20,600,000
20,800,000
2012-2013 2013-2014 2014-2015
19,898,452
20,238,710
20,711,337
Transfers (5200)
9/16/2014 8:43 AM Sumexpen.xlsx Page 19 of 30
USD# 305
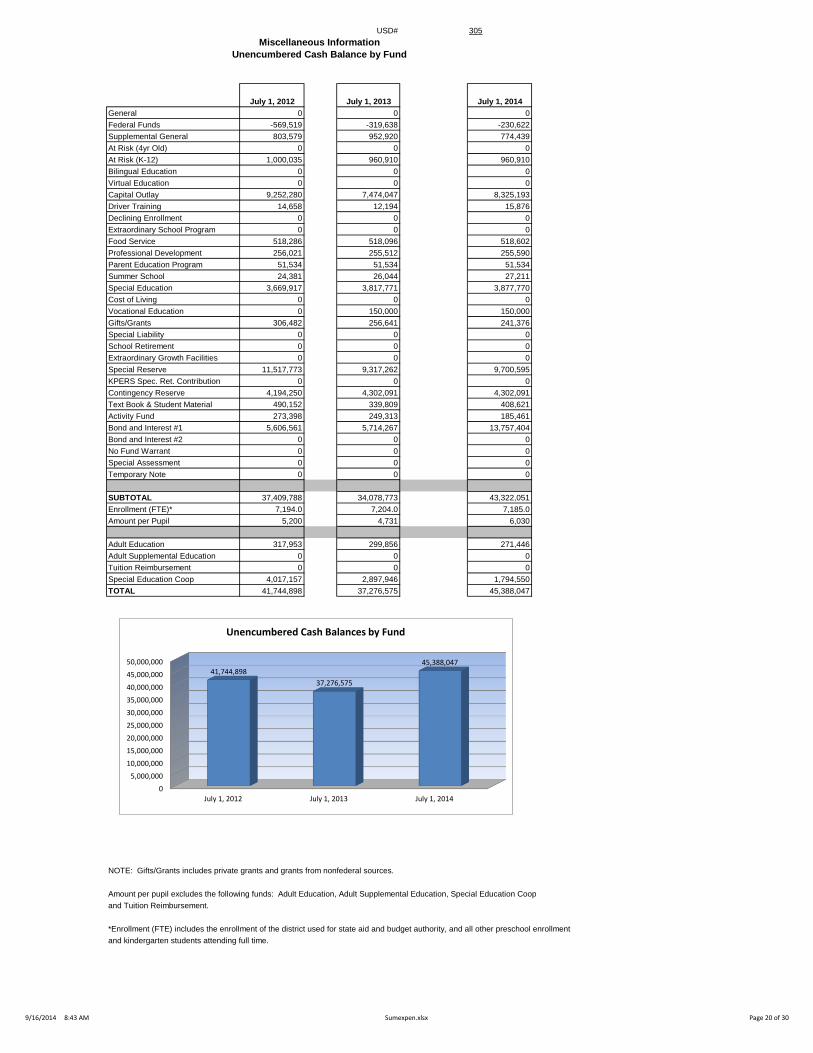
Miscellaneous Information
Unencumbered Cash Balance by Fund
July 1, 2012 July 1, 2013 July 1, 2014
General 0 0 0
Federal Funds -569,519 -319,638 -230,622
Supplemental General 803,579 952,920 774,439
At Risk (4yr Old) 0 0 0
At Risk (K-12) 1,000,035 960,910 960,910
Bilingual Education 0 0 0
Virtual Education 0 0 0
Capital Outlay 9,252,280 7,474,047 8,325,193
Driver Training 14,658 12,194 15,876
Declining Enrollment 0 0 0
Extraordinary School Program 0 0 0
Food Service 518,286 518,096 518,602
Professional Development 256,021 255,512 255,590
Parent Education Program 51,534 51,534 51,534
Summer School 24,381 26,044 27,211
Special Education 3,669,917 3,817,771 3,877,770
Cost of Living 0 0 0
Vocational Education 0 150,000 150,000
Gifts/Grants 306,482 256,641 241,376
Special Liability 0 0 0
School Retirement 0 0 0
Extraordinary Growth Facilities 0 0 0
Special Reserve 11,517,773 9,317,262 9,700,595
KPERS Spec. Ret. Contribution 0 0 0
Contingency Reserve 4,194,250 4,302,091 4,302,091
Text Book & Student Material 490,152 339,809 408,621
Activity Fund 273,398 249,313 185,461
Bond and Interest #1 5,606,561 5,714,267 13,757,404
Bond and Interest #2 0 0 0
No Fund Warrant 0 0 0
Special Assessment 0 0 0
Temporary Note 0 0 0
SUBTOTAL 37,409,788 34,078,773 43,322,051
Enrollment (FTE)* 7,194.0 7,204.0 7,185.0
Amount per Pupil 5,200 4,731 6,030
Adult Education 317,953 299,856 271,446
Adult Supplemental Education 0 0 0
Tuition Reimbursement 0 0 0
Special Education Coop 4,017,157 2,897,946 1,794,550
TOTAL 41,744,898 37,276,575 45,388,047
NOTE: Gifts/Grants includes private grants and grants from nonfederal sources.
Amount per pupil excludes the following funds: Adult Education, Adult Supplemental Education, Special Education Coop
and Tuition Reimbursement.
*Enrollment (FTE) includes the enrollment of the district used for state aid and budget authority, and all other preschool enrollment
and kindergarten students attending full time.
0
5,000,000
10,000,000
15,000,000
20,000,000
25,000,000
30,000,000
35,000,000
40,000,000
45,000,000
50,000,000
July 1, 2012 July 1, 2013 July 1, 2014
41,744,898
37,276,575
45,388,047
Unencumbered Cash Balances by Fund
9/16/2014 8:43 AM Sumexpen.xlsx Page 20 of 30
USD# 305
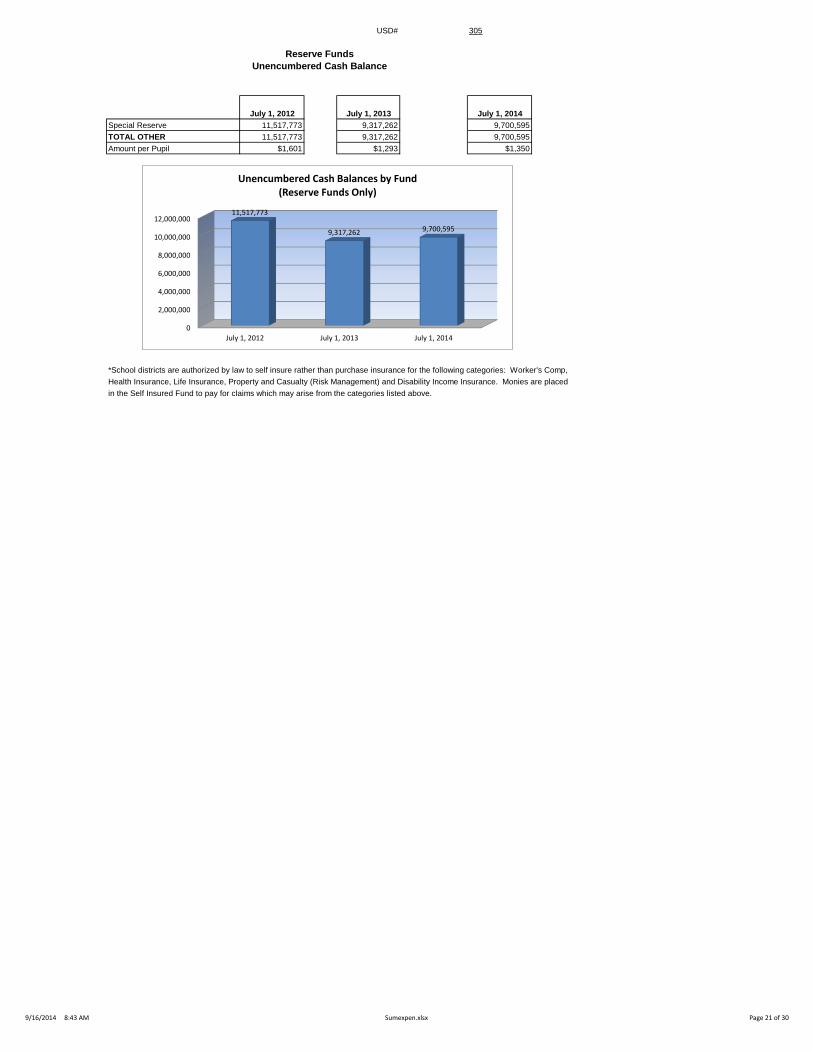
Reserve Funds
Unencumbered Cash Balance
July 1, 2012 July 1, 2013 July 1, 2014
Special Reserve 11,517,773 9,317,262 9,700,595
TOTAL OTHER 11,517,773 9,317,262 9,700,595
Amount per Pupil $1,601 $1,293 $1,350
*School districts are authorized by law to self insure rather than purchase insurance for the following categories: Worker's Comp,
Health Insurance, Life Insurance, Property and Casualty (Risk Management) and Disability Income Insurance. Monies are placed
in the Self Insured Fund to pay for claims which may arise from the categories listed above.
0
2,000,000
4,000,000
6,000,000
8,000,000
10,000,000
12,000,000
July 1, 2012 July 1, 2013 July 1, 2014
11,517,773
9,317,262 9,700,595
Unencumbered Cash Balances by Fund (Reserve Funds Only)
9/16/2014 8:43 AM Sumexpen.xlsx Page 21 of 30
USD# 305
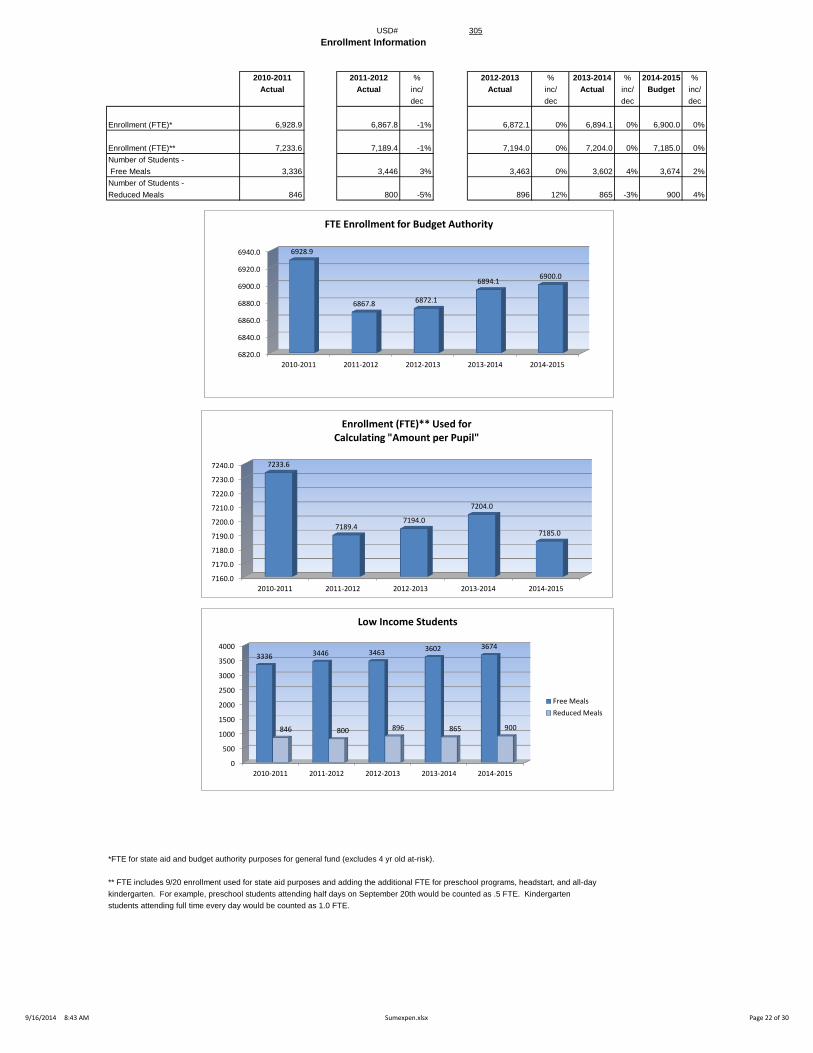
2010-2011 2011-2012 % 2012-2013 % 2013-2014 % 2014-2015 %
Actual Actual inc/ Actual inc/ Actual inc/ Budget inc/
dec dec dec dec
Enrollment (FTE)* 6,928.9 6,867.8 -1% 6,872.1 0% 6,894.1 0% 6,900.0 0%
Enrollment (FTE)** 7,233.6 7,189.4 -1% 7,194.0 0% 7,204.0 0% 7,185.0 0%
Number of Students -
Free Meals 3,336 3,446 3% 3,463 0% 3,602 4% 3,674 2%
Number of Students -
Reduced Meals 846 800 -5% 896 12% 865 -3% 900 4%
*FTE for state aid and budget authority purposes for general fund (excludes 4 yr old at-risk).
** FTE includes 9/20 enrollment used for state aid purposes and adding the additional FTE for preschool programs, headstart, and all-day
kindergarten. For example, preschool students attending half days on September 20th would be counted as .5 FTE. Kindergarten
students attending full time every day would be counted as 1.0 FTE.
Enrollment Information
7160.0
7170.0
7180.0
7190.0
7200.0
7210.0
7220.0
7230.0
7240.0
2010-2011 2011-2012 2012-2013 2013-2014 2014-2015
7233.6
7189.4 7194.0
7204.0
7185.0
Enrollment (FTE)** Used for Calculating "Amount per Pupil"
0
500
1000
1500
2000
2500
3000
3500
4000
2010-2011 2011-2012 2012-2013 2013-2014 2014-2015
3336 3446 3463 3602 3674
846 800 896 865 900
Low Income Students
Free Meals
Reduced Meals
6820.0
6840.0
6860.0
6880.0
6900.0
6920.0
6940.0
2010-2011 2011-2012 2012-2013 2013-2014 2014-2015
6928.9
6867.8 6872.1
6894.1 6900.0
FTE Enrollment for Budget Authority
9/16/2014 8:43 AM Sumexpen.xlsx Page 22 of 30
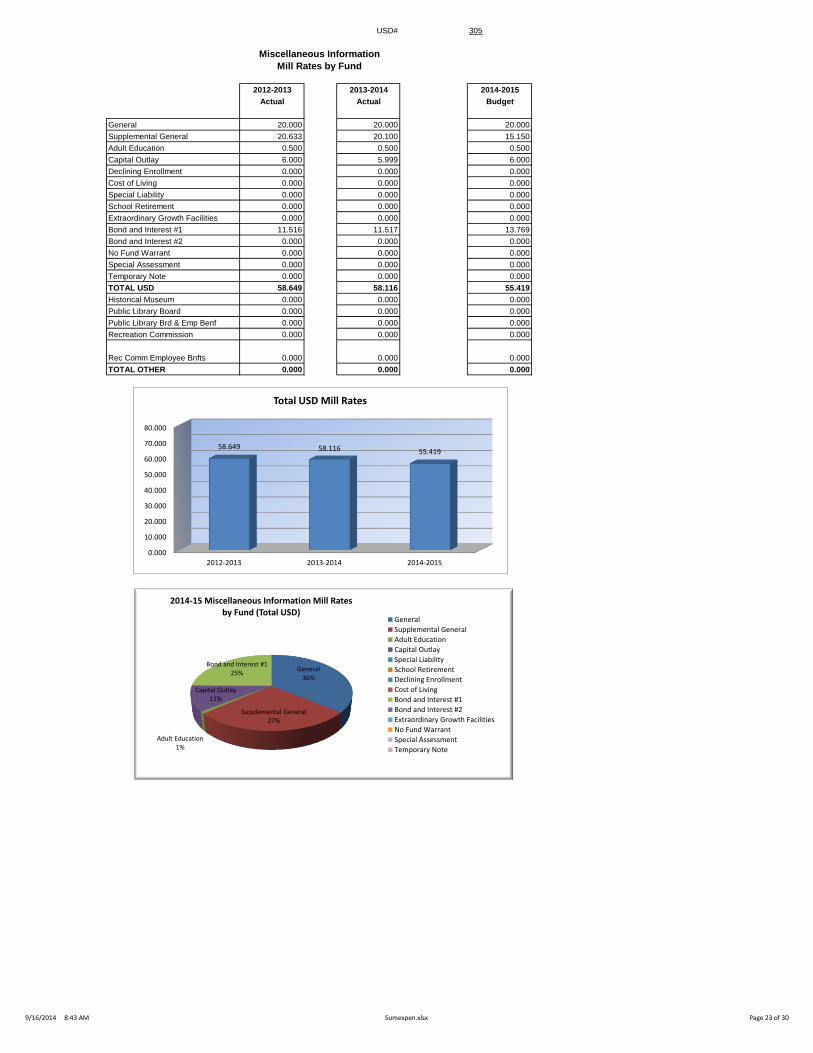
USD# 305
Miscellaneous Information
Mill Rates by Fund
2012-2013 2013-2014 2014-2015
Actual Actual Budget
General 20.000 20.000 20.000
Supplemental General 20.633 20.100 15.150
Adult Education 0.500 0.500 0.500
Capital Outlay 6.000 5.999 6.000
Declining Enrollment 0.000 0.000 0.000
Cost of Living 0.000 0.000 0.000
Special Liability 0.000 0.000 0.000
School Retirement 0.000 0.000 0.000
Extraordinary Growth Facilities 0.000 0.000 0.000
Bond and Interest #1 11.516 11.517 13.769
Bond and Interest #2 0.000 0.000 0.000
No Fund Warrant 0.000 0.000 0.000
Special Assessment 0.000 0.000 0.000
Temporary Note 0.000 0.000 0.000
TOTAL USD 58.649 58.116 55.419
Historical Museum 0.000 0.000 0.000
Public Library Board 0.000 0.000 0.000
Public Library Brd & Emp Benf 0.000 0.000 0.000
Recreation Commission 0.000 0.000 0.000
Rec Comm Employee Bnfts 0.000 0.000 0.000
TOTAL OTHER 0.000 0.000 0.000
0.000
10.000
20.000
30.000
40.000
50.000
60.000
70.000
80.000
2012-2013 2013-2014 2014-2015
58.649 58.116 55.419
Total USD Mill Rates
General 36%
Supplemental General 27%
Adult Education 1%
Capital Outlay 11%
Bond and Interest #1 25%
2014-15 Miscellaneous Information Mill Rates by Fund (Total USD)
General
Supplemental General
Adult Education
Capital Outlay
Special Liability
School Retirement
Declining Enrollment
Cost of Living
Bond and Interest #1
Bond and Interest #2
Extraordinary Growth Facilities
No Fund Warrant
Special Assessment
Temporary Note
9/16/2014 8:43 AM Sumexpen.xlsx Page 23 of 30
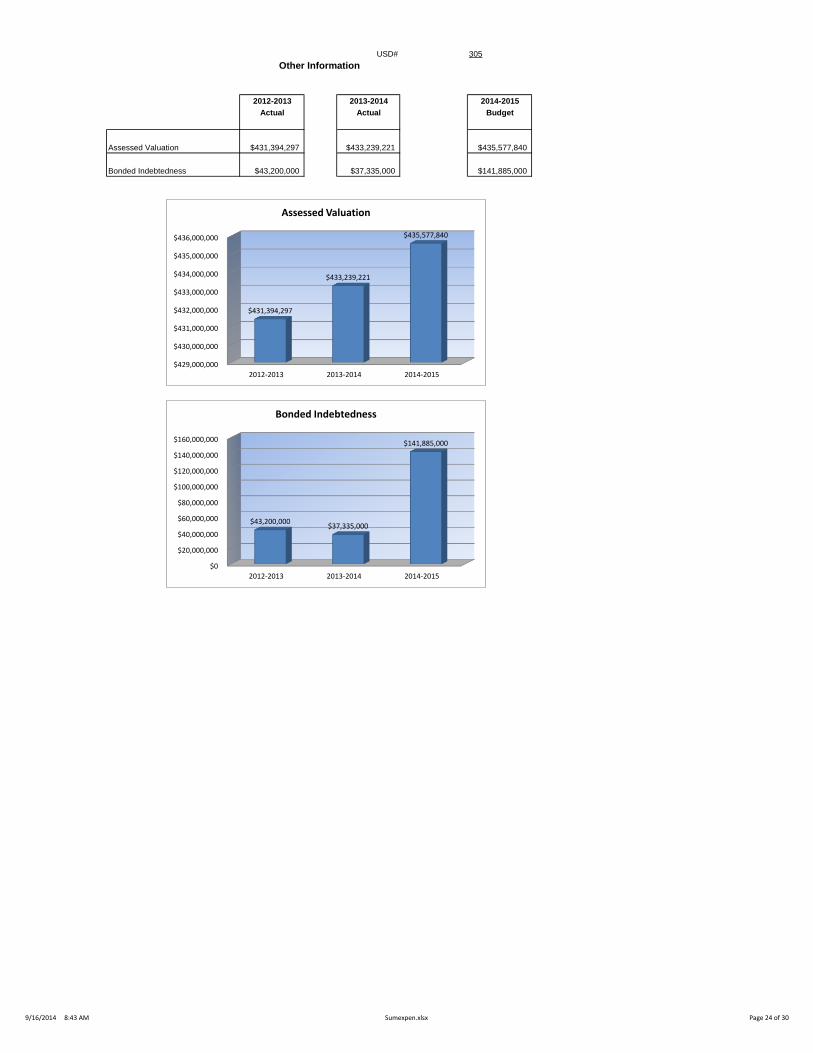
USD# 305
Other Information
2012-2013 2013-2014 2014-2015
Actual Actual Budget
Assessed Valuation $431,394,297 $433,239,221 $435,577,840
Bonded Indebtedness $43,200,000 $37,335,000 $141,885,000
$429,000,000
$430,000,000
$431,000,000
$432,000,000
$433,000,000
$434,000,000
$435,000,000
$436,000,000
2012-2013 2013-2014 2014-2015
$431,394,297
$433,239,221
$435,577,840
Assessed Valuation
$0
$20,000,000
$40,000,000
$60,000,000
$80,000,000
$100,000,000
$120,000,000
$140,000,000
$160,000,000
2012-2013 2013-2014 2014-2015
$43,200,000 $37,335,000
$141,885,000
Bonded Indebtedness
9/16/2014 8:43 AM Sumexpen.xlsx Page 24 of 30
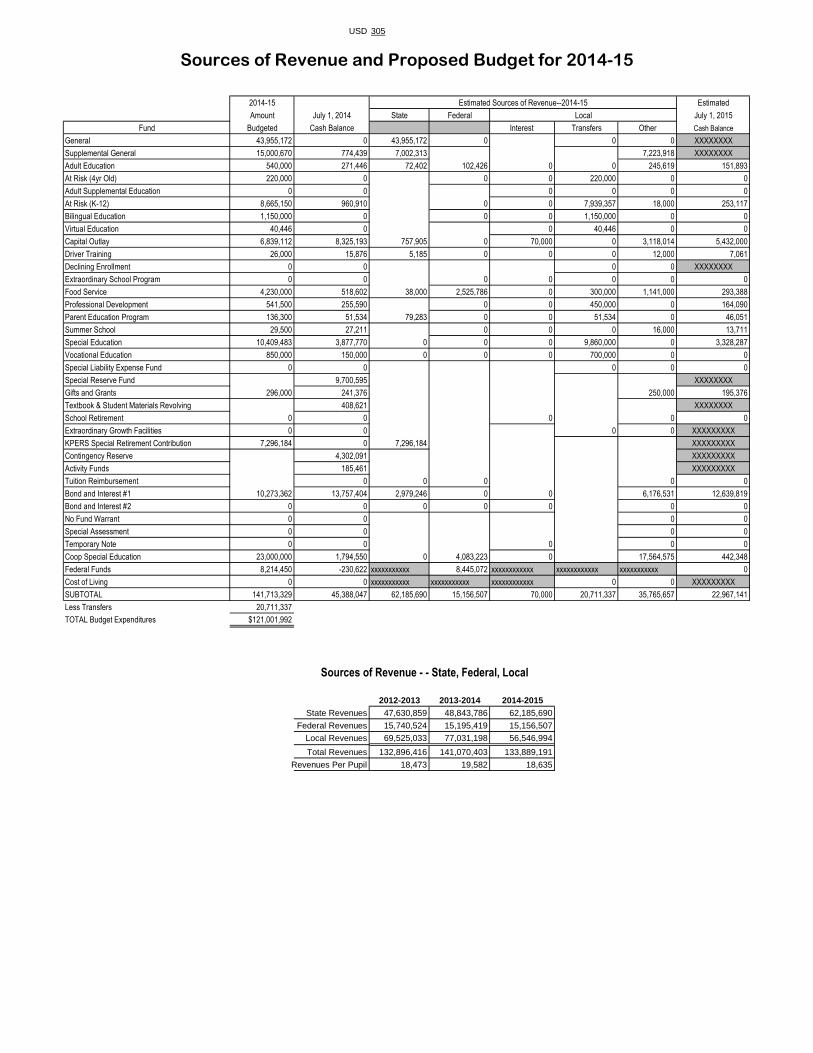
USD 305
2014-15 Estimated Sources of Revenue--2014-15 Estimated
Amount July 1, 2014 State Federal Local July 1, 2015
Fund Budgeted Cash Balance Interest Transfers Other Cash Balance
General 43,955,172 0 43,955,172 0 0 0 XXXXXXXX
Supplemental General 15,000,670 774,439 7,002,313 7,223,918 XXXXXXXX
Adult Education 540,000 271,446 72,402 102,426 0 0 245,619 151,893
At Risk (4yr Old) 220,000 0 0 0 220,000 0 0
Adult Supplemental Education 0 0 0 0 0 0
At Risk (K-12) 8,665,150 960,910 0 0 7,939,357 18,000 253,117
Bilingual Education 1,150,000 0 0 0 1,150,000 0 0
Virtual Education 40,446 0 0 40,446 0 0
Capital Outlay 6,839,112 8,325,193 757,905 0 70,000 0 3,118,014 5,432,000
Driver Training 26,000 15,876 5,185 0 0 0 12,000 7,061
Declining Enrollment 0 0 0 0 XXXXXXXX
Extraordinary School Program 0 0 0 0 0 0 0
Food Service 4,230,000 518,602 38,000 2,525,786 0 300,000 1,141,000 293,388
Professional Development 541,500 255,590 0 0 450,000 0 164,090
Parent Education Program 136,300 51,534 79,283 0 0 51,534 0 46,051
Summer School 29,500 27,211 0 0 0 16,000 13,711
Special Education 10,409,483 3,877,770 0 0 0 9,860,000 0 3,328,287
Vocational Education 850,000 150,000 0 0 0 700,000 0 0
Special Liability Expense Fund 0 0 0 0 0
Special Reserve Fund 9,700,595 XXXXXXXX
Gifts and Grants 296,000 241,376 250,000 195,376
Textbook & Student Materials Revolving 408,621 XXXXXXXX
School Retirement 0 0 0 0 0
Extraordinary Growth Facilities 0 0 0 0 XXXXXXXXX
KPERS Special Retirement Contribution 7,296,184 0 7,296,184 XXXXXXXXX
Contingency Reserve 4,302,091 XXXXXXXXX
Activity Funds 185,461 XXXXXXXXX
Tuition Reimbursement 0 0 0 0 0
Bond and Interest #1 10,273,362 13,757,404 2,979,246 0 0 6,176,531 12,639,819
Bond and Interest #2 0 0 0 0 0 0 0
No Fund Warrant 0 0 0 0
Special Assessment 0 0 0 0
Temporary Note 0 0 0 0 0
Coop Special Education 23,000,000 1,794,550 0 4,083,223 0 17,564,575 442,348
Federal Funds 8,214,450 -230,622 xxxxxxxxxxx 8,445,072 xxxxxxxxxxxx xxxxxxxxxxxx xxxxxxxxxxx 0
Cost of Living 0 0 xxxxxxxxxxx xxxxxxxxxxx xxxxxxxxxxxx 0 0 XXXXXXXXX
SUBTOTAL 141,713,329 45,388,047 62,185,690 15,156,507 70,000 20,711,337 35,765,657 22,967,141
Less Transfers 20,711,337
TOTAL Budget Expenditures $121,001,992
2012-2013 2013-2014 2014-2015
State Revenues 47,630,859 48,843,786 62,185,690
Federal Revenues 15,740,524 15,195,419 15,156,507
Local Revenues 69,525,033 77,031,198 56,546,994
Total Revenues 132,896,416 141,070,403 133,889,191
Revenues Per Pupil 18,473 19,582 18,635
Sources of Revenue and Proposed Budget for 2014-15
Sources of Revenue - - State, Federal, Local
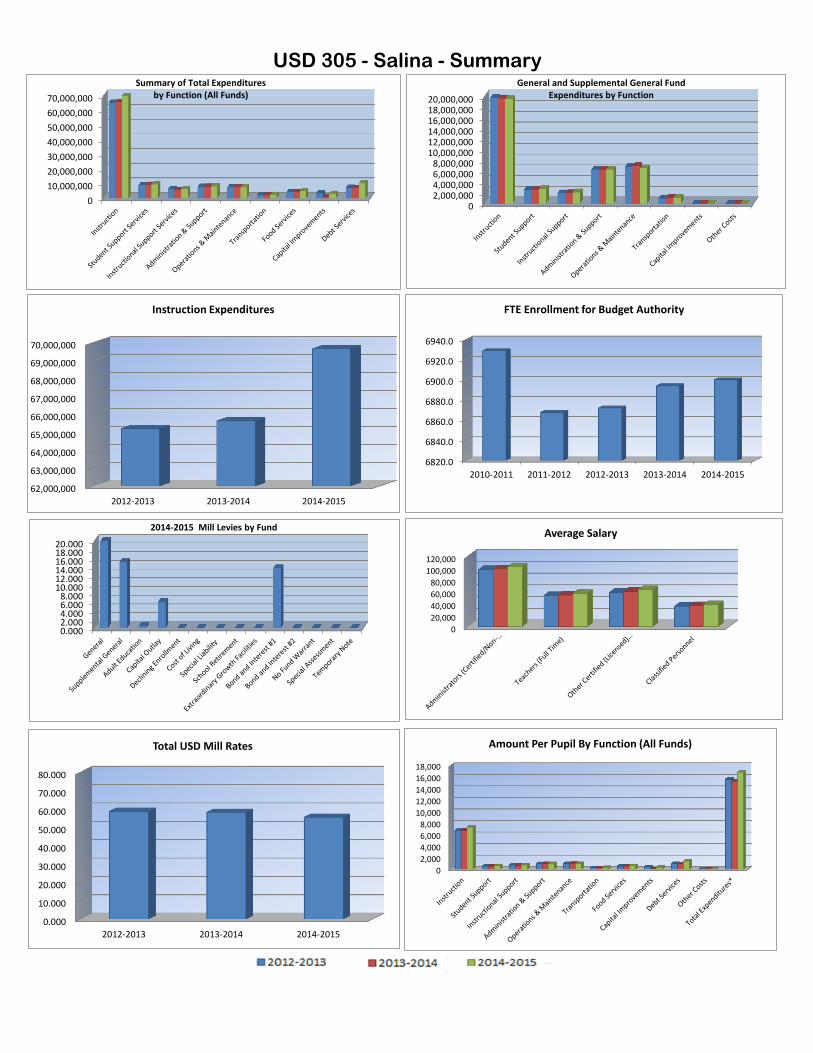
USD 305 - Salina - Summary
0
10,000,000
20,000,000
30,000,000
40,000,000
50,000,000
60,000,000
70,000,000
Summary of Total Expenditures by Function (All Funds)
02,000,0004,000,0006,000,0008,000,000
10,000,00012,000,00014,000,00016,000,00018,000,00020,000,000
General and Supplemental General Fund Expenditures by Function
62,000,000
63,000,000
64,000,000
65,000,000
66,000,000
67,000,000
68,000,000
69,000,000
70,000,000
2012-2013 2013-2014 2014-2015
Instruction Expenditures
6820.0
6840.0
6860.0
6880.0
6900.0
6920.0
6940.0
2010-2011 2011-2012 2012-2013 2013-2014 2014-2015
FTE Enrollment for Budget Authority
0.0002.0004.0006.0008.000
10.00012.00014.00016.00018.00020.000
2014-2015 Mill Levies by Fund
0
20,000
40,000
60,000
80,000
100,000
120,000
Average Salary
0.000
10.000
20.000
30.000
40.000
50.000
60.000
70.000
80.000
2012-2013 2013-2014 2014-2015
Total USD Mill Rates
0
2,000
4,000
6,000
8,000
10,000
12,000
14,000
16,000
18,000
Amount Per Pupil By Function (All Funds)

Intentionally left blank

Intentionally left blank

Intentionally left blank

Intentionally left blank