Embed Size (px)
Citation preview
Research Library Research Library
Books & book chapters Research Publications
2002
Salinity in the classrom, a resource for Western Australian Salinity in the classrom, a resource for Western Australian
Schools Schools
Department of Agriculture, Western Australia
Department of Education, Western Australia
State Salinity Council, Western Australia
Follow this and additional works at: https://researchlibrary.agric.wa.gov.au/books
Part of the Hydrology Commons, and the Natural Resources Management and Policy Commons
Recommended Citation Recommended Citation Department of Agriculture, Western Australia, Department of Education, Western Australia, and State Salinity
Council, Western Australia. (2002), Salinity in the classrom, a resource for Western Australian Schools. Department of Agriculture, Perth, W.A.. Book.
This book is brought to you for free and open access by the Research Publications at Research Library. It has been accepted for inclusion in Books & book chapters by an authorized administrator of Research Library. For more information, please contact [email protected].

A resource for Western Australian schools
Salinity in the ClassroomSalinity in the Classroom
Department of AgricultureWater and Rivers Commission
Page I
Introduction Salinity in the Classroom
Salinity in the Classroom
A Western Australian educational resource for teachers and students of the Early, Middle Childhood and Early Adolescent phases of learning.
Department of Agriculture

Page II
Introduction Salinity in the Classroom
Page III
Introduction Salinity in the Classroom
Copies of this resource can be obtained from: Department of Agriculture, 3 Baron-Hay Court, South Perth 6151, Western Australia
ISBN 0-7307-7618-2
In relying on or using this document or any advice or information expressly or impliedly contained within it, you accept all risks and responsibility for loss, injury, damages, costs and other consequences of any kind whatsoever resulting directly or indirectly to you or any other person from your doing so. It is for you to obtain your own advice and conduct your own investigations and assessments of any proposals that you may be considering in light of your own circumstances. Further, the State of Western Australia, the Chief Executive Officer of the Department of Agriculture, the Agriculture Protection Board, the authors, the publisher and their officers, employees and agents, do not warrant the accuracy, currency, reliability or correctness of this document or any advice or information expressly or impliedly contained within it; and, exclude all liability of any kind whatsoever to any person arising directly or indirectly from reliance on or the use of this document or any advice or information expressly or impliedly contained within it by you or any other person.
Page II
Introduction Salinity in the Classroom
Page III
Introduction Salinity in the Classroom
ForewordSalinity is a natural part of the landscape of south western Australia. Before European settlement there were chains of salt lakes and many of the inland rivers contained pools of salty water.
Early in the development of the land for agriculture an increase in the salinity of dams and soaks used for household and stock water was noticed in the Northam district. The Government Analyst at the time, Mr E A Mann, suggested in 1907 that the increases in salinity might have been due to replacing the perennial natural vegetation with annual crops and pastures. In advice to a farmer he recommended that replanting the native vegetation might fix the problem.
The railway engineers in the early 1900s were the first to take the problem of increasing salinity seriously. They had to ensure that there were supplies of good quality water for the steam engines. Throughout the developing agricultural areas this water came from dams. As the catchment areas for these dams were cleared the engineers observed that the salinity of the dam water increased. It was a railway engineer, Mr W E Wood who, in 1924, published a paper in the Proceedings of the Royal Society of Western Australia detailing the cause of increased salinity in the agricultural regions.
Increasing salinisation of agricultural land and inland waters is a major problem, not only in Western Australia, but in all other states and in many countries throughout the world. In WA salinity caused by replacing the natural vegetation with agricultural crops and pastures now affects about two million hectares of the 18 million hectares of agricultural land. Unless the spread of salinity can be contained it is predicted that it could eventually affect six million hectares, or 30% of the agricultural land.
Unlike many land degradation problems associated with agriculture, increasing salinity has serious effects beyond the farm gate. It causes increases in stream salinity and has made many of the rivers in the South-West unsuitable for water supplies; increasing salinity affects the native vegetation in low lying parts of the landscape and it is predicted that about 450 plant species in the wheatbelt are threatened with extinction if salinity continues to expand. As well as affecting the natural environment, salinity is affecting many of our rural towns by causing buildings to crumble. It also significantly increases the cost of maintaining roads.
While the cause of salinity is well understood, and we know in principle what has to be done to reduce the spread of the problem, we still do not have solutions that we can afford to apply across the agricultural landscape. There is no simple solution.
While salinity will not cause the end of agriculture in WA it will continue to be a major problem for decades. It is important that everyone in WA understands the problem and the difficulties faced, not only by farmers but also by the whole community, in controlling it. We owe it to future generations that we do our best in managing this problem. Learning about salinity, its causes, its significance and its management is the start of the process of doing our best.
Dr Bob NulsenManager, Natural Resources Department of Agriculture
Page IV
Introduction Salinity in the Classroom
Page V
Introduction Salinity in the Classroom
Acknowledgments
AuthorsSection One, written by Gael Bell, Department of Agriculture and Kevin Brady, Department of Education WA. Section Two compiled, adapted, edited and written by Don Crawford, State Salinity Council of WA, David Bicknell, Bruce Radys, Kristy Chandler and Anne Jones, Department of Agriculture. Section Three written and compiled by Carolyn Weaver, Department of Education and Gael Bell, Department of Agriculture. Section Four compiled and adapted by Gael Bell with assistance from Elizabeth Yuncken, Department of Agriculture. Section Five written and compiled by Don Crawford, State Salinity Council of WA, David Bicknell and Gael Bell, Department of Agriculture.‘Bilbies, salinity & A Question of Balance’ written by Gael Bell and Bruce Radys, Department of Agriculture. Illustrated by Joy Killian and John Goodlad, Albany, WA.The Department of Agriculture, the State Salinity Council of Western Australia, Alcoa World Alumina Australia, Shell Development (Australia) Pty Ltd and the Water and Rivers Commission would like to acknowledge the assistance in the production of this resource by:
Gail BakerDepartment of Education
Kevin BradyDepartment of Education
Michael BurkeDepartment of Education
Sue McKenna Department of Conservation & Land Management
Arlene Moncrieff Greening Australia, Western Australia
Alex Waterhouse Water & Rivers Commission Permission was kindly granted by the following agencies to reproduce and adapt worksheets and activities in Sections Three and Four.
Department of Agriculture, for permission to use extracts from ‘Landcare In Your Hands’. Department of Agriculture, Ministry of Education WA, National Soil Conservation Program, Alcoa Landcare project, 1991.
Tilwin Westrup for use of ‘The Salty Licorice Taste Test’, 2000. Department of Agriculture.
Tammin Alcoa Landcare Education Centre for permission to use the ‘Raining Tennis Balls’ activity. Tammin Alcoa, Shire of Tammin and the Department of Education.
Department of Conservation, Forests and Lands, Victoria, 1989 for permission to use extracts from ‘Our Land. Landcare Activities for Upper Primary School Students’.
Department of Natural Resources and Environment. ‘Catchment Education Resource Book. An Educational Resource for Primary and Secondary Schools. Victoria, 1986.
Garry Heady and Terry Roberts for permission to use extracts from ‘Investigate the Catchment with Detective Crow’. Fairbridge Eco Project. Pinjarra, Western Australia, 1999.
NSW Agriculture and Salt Action for permission to use extracts from ‘A Taste of Salt. Rivers, Catchments and Salinity’, 1999.
Salt Action Victoria for permission to use extracts from ‘Saltwatch Curriculum Package’, 1991.
Queensland Department of Primary Industries for permission to use and adapt activities from ‘Catchment Care’ Information for teachers and students activities. Queensland, 1991.
Quentin Beresford, Hugo Bekle, Harry Phillips and Jane Mulcock for permission to use extracts from their book ‘The salinity crisis: landscapes, communities and politics’, University of Western Australia Press, 2001.
NSW Agriculture for permission to use extracts from ‘Dryland Salinity – The Farmers Guide’.
National Land & Water Resources Audit for permission to use extracts from ‘Australian Dryland Salinity Assessment 2000’.
Department of Agriculture, Western Australia for permission to use extracts from ‘Extent and Impacts of Dryland Salinity’ 2001. Resource Management Technical Report 202.
Professor Phil Cocks for permission to use his diagram on water use.
GRDC for sponsorship support in securing the video ‘Salt of the Earth’.
Page IV
Introduction Salinity in the Classroom
Page V
Introduction Salinity in the Classroom
Contents
Section One Links to the Curriculum Frameworks
Section Two Background information
Section Three Early Childhood (typically kindergarten to year 3)
Activities and Worksheets
Section Four Middle Childhood (typically years 4 to 6) Activities and Worksheets
Early Adolescence (typically years 7 to 10)
Activities and Worksheets
Section Five Websites
Useful References
WA Support Projects
Glossary
Page VI
Introduction Salinity in the Classroom
Page 1
Links to curriculum Salinity in the Classroom
How to use this Resource
This resource has been developed to assist teaching about salinity and salinity management issues in Western Australia. For ease of reference it has been divided into five main sections:
In Section One teachers will find a table which will provide them with information regarding activities and their link to the Curriculum Framework.
Section Two, ‘Background information’ provides teachers and students with broad information covering some of the main themes of salinity today. These themes have been broken down into subsections and cover a range of topics such as causes, extent and impact; how salinity is currently being managed and monitored; and the ways in which the community, catchment groups, government and non-government agencies are working together to tackle one of Western Australia’s most serious agricultural and environmental problems. The background information has been written at an introductory level and may therefore be useful to photocopy for some students as support material for the activities in the activity sections of this manual.
The topic of salinity underlies all of the activities in Sections Three and Four. These activities provide teachers with a wide range of contexts for teaching about this important topic. Some activities will require teachers and students to carry out fieldwork in both urban and rural environments while some activities can be carried out in the classroom or laboratory.
Section Three is the Early Childhood section. This provides a range of suggested activities that can be used in conjunction with the big book ‘Bilbies, salinity & A Question of Balance’, which accompanies this manual. At the beginning of this section are ‘teacher’s notes’ which will provide teachers with numerous discussion points when either reading or discussing the book with their students. For more in-depth information teachers are directed to Section Two, ‘Background information’.
The activities in Section Four are targeted at students in the Middle Childhood and Early Adolescent phases of learning. A video and a set of teaching notes, ‘Salt of the Earth’, is included with this manual. The video and notes will provide further teaching and learning opportunities on the topic of salinity. The bolded words in this section refers the reader to the glossary in Section Five.
However, depending on the ability and interests of both teachers and students all of the suggested activities can be adapted and modified for use with all learning phases. Teachers will find that some of the activities in the Early Adolescent phase can be easily adapted for use with students in the Middle Childhood phase (and vice-versa). This is also true of the activities in the Early Childhood phase.
At the top right hand corner of the Middle Childhood and the Early Adolescent activities section there is a reference identifying at what phase these activities may be most suitable i.e. MC or EA. However, as previously mentioned this is a guide only and teachers are encouraged to familiarise themselves with as many of the activities as possible to determine which are most appropriate for their needs and teaching programs.
At the bottom of each page reference is made to ‘support information’ which may be suitable for use with a particular activity. For example in Activity 11, ‘A model water cycle’ the user is referred to support information 2.3, 2.3.1 and 2.4.1, which directs them to the index in Section Two ‘Background information’. In this particular case 2.3 refers to the heading ‘How did salt get into the landscape?’ and 2.3.1 and 2.4.1 refer to the sub-headings, ‘The water cycle‘ and ‘Human intervention in the water cycle’. Teachers are encouraged to familiarise themselves with the background information in a general way as they will find that many themes and topics are covered in a variety of contexts.
Section Five contains a glossary of currently used ‘salinity’ related words and terms, a list of further references, some suggested websites and some support programs and projects. All of this information may be suitable for both teachers and students.
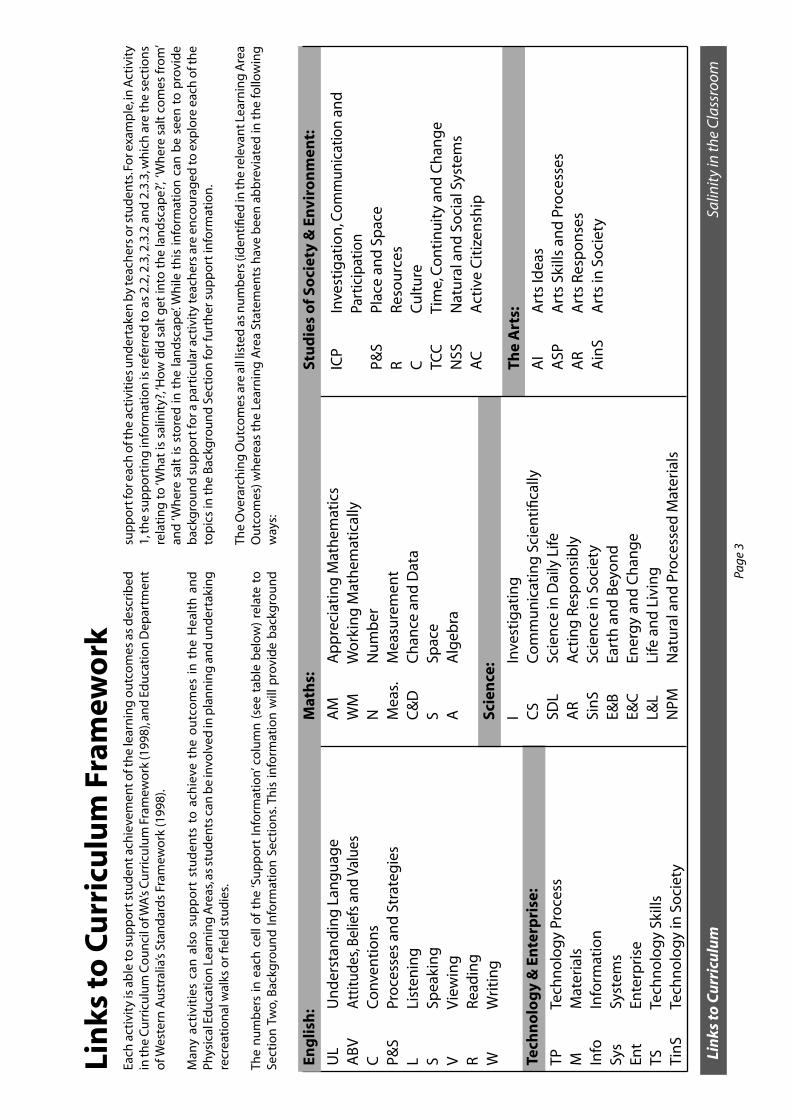
Links to the Curriculum Frameworks
Section 1
Section 1
Page VI
Introduction Salinity in the Classroom
Page 1
Links to curriculum Salinity in the Classroom
Links to the Curriculum FrameworkThe introduction of the Curriculum Framework has allowed schools to explore issues of significance for their students, and to enable their students to achieve important schooling outcomes by working in local contexts. The Framework states:
“The outcomes focused approach will provide schools with more flexibility to enable teachers to develop different teaching and learning programs to help their particular students achieve the outcomes. Schools will respond to their own ethos, the needs of their community and the situations of their students by pursuing common outcomes (and matching) the needs of the students.”(Key Features of the Curriculum Framework, page 14)
Salinity is now a major issue affecting our State. Predictions are that the economic cost of salinity will grow over the next twenty years, and so it will be a major factor in the lives of children who are currently students in schools. While the costs of salinity will need to be borne by everyone, there are undoubtedly some communities where salinity will have a much greater impact than others.
‘Salinity in the Classroom’ should enable teachers to explore the issue of salinity with their students in ways that support the achievement of Curriculum Framework outcomes. Salinity is an issue that lends itself to authentic investigation and active community involvement. Each of the activities in this package has been linked to one or more Learning Area outcomes and Overarching outcomes from the Curriculum Framework. In some cases the activities allow a highly integrated investigation of the issue, particularly its scientific basis, its economic impact and possibilities for rehabilitation, in a way that addresses a number of cross-curricula outcomes.
Section Two, Background information provides a wealth of relevant and important information regarding the topic of salinity. This information will enable teachers to feel confident when dealing with this topic as their background knowledge will be accurate and up to date. This information has been developed and edited by scientists and others working to address the issue of salinity. At the time of printing, this information reflects current thoughts and knowledge on this important topic.
By modifying the activities, teachers may be able to address additional Learning Area or Overarching outcomes; or they may be able to adapt them for use by students at an earlier phase of development. Equally, teachers could adapt the activities to suit the particular topic of investigation they are exploring, or to link them to alternative themes they are investigating with students.
The Curriculum Framework explicitly describes the values that underpin its development. All of these values can be developed and discussed within many of the activities in this package. However, the value of ‘Environmental Responsibility’ has a particular resonance with the issue of salinity. ‘Environmental Responsibility’ encompasses Cultural Heritage, Conservation of the Environment, Sustainable Development and Diversity of Species.

Page 2
Links to curriculum Salinity in the Classroom
Salinity confronts our cultural heritage by denuding the landscape of vegetation and attacking heritage buildings in susceptible areas. Salinity means that environmental conservation is more imperative, but also more problematic. Sustainable development can be discussed much more sharply when the impact of salinity is well understood. Further to this is the severe threat, by salinity, of the loss of diversity within the Western Australian environments.
Also of particular importance and interest is the study of the work currently being carried out by numerous communities in an attempt to manage salinity. This kit should help to highlight for students the strong commitment to community, the personal contribution and sacrifice, and the civic responsibility that many groups and individuals are demonstrating. Hence, students will be able to discuss in a personal context the competing demands of economic development and environmental responsibility.
Teachers, administrators and parents will find that this package will assist in encouraging students to examine the issue of salinity which in turn, will lead to a high level of student engagement and significant levels of student understanding.
Kevin BradyCurriculum ManagerDepartment of Education
Page 2
Links to curriculum Salinity in the Classroom
Each
act
ivit
y is
ab
le to
su
pp
ort
stu
den
t ach
ieve
men
t of t
he
lear
nin
g o
utc
om
es a
s d
escr
ibed
in
the
Cu
rric
ulu
m C
ou
nci
l of W
A’s
Cu
rric
ulu
m F
ram
ewo
rk (1
998)
, an
d E
du
cati
on
Dep
artm
ent
of W
este
rn A
ust
ralia
’s St
and
ard
s Fr
amew
ork
(199
8).
Man
y ac
tivi
ties
can
als
o s
up
po
rt s
tud
ents
to
ach
ieve
th
e o
utc
om
es i
n t
he
Hea
lth
an
d
Phys
ical
Ed
uca
tio
n L
earn
ing
Are
as, a
s st
ud
ents
can
be
invo
lved
in p
lan
nin
g a
nd
un
der
taki
ng
re
crea
tio
nal
wal
ks o
r fiel
d s
tud
ies.
The
nu
mb
ers
in e
ach
cel
l of
the
‘Su
pp
ort
Info
rmat
ion’
co
lum
n (
see
tab
le b
elo
w)
rela
te t
o
Sect
ion
Tw
o, B
ackg
rou
nd
Info
rmat
ion
Sec
tio
ns.
This
info
rmat
ion
will
pro
vid
e b
ackg
rou
nd
Lin
ks t
o C
urr
icu
lum
Fra
mew
ork
sup
po
rt fo
r eac
h o
f th
e ac
tivi
ties
un
der
take
n b
y te
ach
ers
or s
tud
ents
. Fo
r exa
mp
le, in
Act
ivit
y 1,
the
sup
po
rtin
g in
form
atio
n is
refe
rred
to a
s 2.
2, 2
.3, 2
.3.2
an
d 2
.3.3
, wh
ich
are
the
sect
ion
s re
lati
ng
to
‘Wh
at is
sal
init
y?, ‘H
ow
did
sal
t g
et in
to t
he
lan
dsc
ape?
’, ‘W
her
e sa
lt c
om
es fr
om
’ an
d ‘W
her
e sa
lt is
sto
red
in t
he
lan
dsc
ape’.
Wh
ile t
his
info
rmat
ion
can
be
seen
to
pro
vid
e b
ackg
rou
nd
su
pp
ort
for a
par
ticu
lar a
ctiv
ity
teac
her
s ar
e en
cou
rag
ed to
exp
lore
eac
h o
f th
e to
pic
s in
th
e B
ackg
rou
nd
Sec
tio
n fo
r fu
rth
er s
up
po
rt in
form
atio
n.
The
Ove
rarc
hin
g O
utc
om
es a
re a
ll lis
ted
as
nu
mb
ers
(iden
tifie
d in
the
rele
van
t Lea
rnin
g A
rea
Ou
tco
mes
) wh
erea
s th
e Le
arn
ing
Are
a St
atem
ents
hav
e b
een
ab
bre
viat
ed in
th
e fo
llow
ing
w
ays:
Stu
die
s o
f So
ciet
y &
En
viro
nm
ent:
ICP
In
vest
igat
ion
, Com
mun
icat
ion
and
Part
icip
atio
n P&
S
Plac
e an
d S
pac
eR
Res
ou
rces
C
Cu
ltu
re
TCC
Tim
e, C
on
tin
uit
y an
d C
han
ge
NSS
Nat
ura
l an
d S
oci
al S
yste
ms
AC
Act
ive
Cit
izen
ship
Scie
nce
:
I
In
vest
igat
ing
CS
Co
mm
un
icat
ing
Sci
enti
fical
lySD
L
Scie
nce
in D
aily
Life
AR
Act
ing
Res
po
nsi
bly
Sin
S
Scie
nce
in S
oci
ety
E&B
Eart
h a
nd
Bey
on
dE&
C
En
erg
y an
d C
han
ge
L&L
Li
fe a
nd
Liv
ing
NPM
N
atu
ral a
nd
Pro
cess
ed M
ater
ials
Mat
hs:
AM
Ap
pre
ciat
ing
Mat
hem
atic
sW
M
W
ork
ing
Mat
hem
atic
ally
N
N
um
ber
Mea
s.
Mea
sure
men
tC
&D
C
han
ce a
nd
Dat
aS
Spac
eA
A
lgeb
ra
The
Art
s:
AI
Art
s Id
eas
ASP
Art
s Sk
ills
and
Pro
cess
esA
R
A
rts
Res
po
nse
sA
inS
A
rts
in S
oci
ety
Lin
ks to
Cu
rric
ulu
mSa
linit
y in
the
Cla
ssro
om
Page
3
Eng
lish
:
UL
U
nd
erst
and
ing
Lan
gu
age
AB
V
A
ttitu
des,
Belie
fs a
nd V
alue
sC
C
onv
enti
on
sP&
S
Pro
cess
es a
nd
Str
ateg
ies
L
Li
sten
ing
S
Sp
eaki
ng
V
Vie
win
gR
Rea
din
gW
Wri
tin
g
Tech
no
log
y &
En
terp
rise
:
TP
Te
chn
olo
gy
Pro
cess
M
Mat
eria
lsIn
fo
In
form
atio
nSy
s
Syst
ems
Ent
En
terp
rise
TS
Te
chn
olo
gy
Skill
sTi
nS
Te
chn
olo
gy
in S
oci
ety
2.2,
2.3
, 2.3
.2, 2
.3.3
1
W
hat
is s
alt?
1
, 4, 5
, 7
I,
NPM
2.2,
2.3
.1, 2
.3.2
2
Typ
es o
f sal
t
7
N
PM
2.2,
2.3
.1, 2
.3.2
3
The
visi
ble
& th
e in
visi
ble
4,
6, 7
I,
NPM
2.4,
2.4
.1, 2
.4.2
4
Rec
har
ge
rese
arch
4
, 7
I,
NPM
2.2,
2.3
.1, 2
.3.2
, 2.3
.3
5
Salt
in t
he
soil
5, 7
, 12
NPM
, I, E
&B
2.3,
2.3
.2
6
W
here
doe
s sal
t com
e fro
m?
1, 5
, 6
I, N
PM, E
&B
2.2,
2.3
7
Trav
ellin
g w
ith
sal
t
7
N
PM
2.2,
2.3
.1, 2
.3.2
, 2.3
.3
8
Soil
stru
ctu
re a
nd
sal
init
y 1
, 5, 6
, 7
Mea
., WM
N
PM
2.6,
2.6
.2, 2
.8, 2
.8.1
9
W
ater
qu
alit
y
2
, 3, 5
, 6, 7
W
M, N
,C&
D
CS,
SD
L, L
&L,
NPM
2.6,
2.6
.2
10
W
ater
– a
fin
ite
reso
urce
1
, 3, 8
R
P
&S,
ICP,
TCC
2.3,
2.3
.1, 2
.4.1
11
A m
od
el w
ater
cyc
le
7
, 10
V
E&
B
NSS
Inf
2.3,
2.3
.3
12
Ju
st p
assin
g th
roug
h - c
ycle
s 1
, 6, 7
, 12
V
E&
C, C
S, A
R, L
&L
NSS
Sys
2.3,
2.3
.1
13
Th
e w
ater
cyc
le
7
V
E&
B
NSS
2.3,
2.3
.1, 2
.4.1
, 2.6
.2
14
Whe
re d
oes t
he w
ater
go?
7
, 10,
12
V
E&B
N
SS
2.3,
2.3
.1, 2
.4.1
, 2.6
.2
15
Act
ing
out t
he w
ater
cyc
le
7, 1
0, 1
2
E&
B, C
S
NSS
2.3,
2.5
, 2.6
.3,
16
W
hat
do
tre
es d
o?
1, 3
, 7
V, R
, P&
S
CS,
L&
L
R
2.3,
2.3
.1, 2
.4.1
, 2.6
.2
17
Wat
er m
ovem
ent i
n pl
ants
1
, 3, 7
V,
R, P
&S
C
S, L
&L
2.8,
2.8
.1, 2
.8.2
18
Salin
ity
leve
ls
1, 5
V
NPM
2.8,
2.8
.1, 2
.8.2
19
Salin
ity
and
den
sity
2, 7
I, N
PM
2.8,
2.8
.1, 2
.8.2
20
Mak
ing
your
ow
n EC
met
er
2, 3
, 4, 5
, 6, 7
R
C&
D, A
M,
E&
C, N
PM, W
S
TP,
TS
W
M, N
, Mea
s.
Sup
po
rt
No
A
ctiv
ity
Ove
rarc
hin
g
Eng
lish
M
ath
s Sc
ien
ce
Stu
die
s o
f Th
e A
rts
Tech
no
log
y
Info
rmat
ion
St
atem
ent
So
ciet
y &
& E
nte
rpri
se
En
viro
nm
ent
Lin
ks to
Cu
rric
ulu
mSa
linit
y in
the
Cla
ssro
om
Page
4

2.8,
2.8
.1, 2
.8.2
21
Test
ing
for s
oil
salin
ity
7
Mea
s.
I,
NPM
2.4,
2.4.
2, 2.
6, 2.
6.3,
2.7.
2 22
Ef
fect
of s
alt
on
see
d
5
, 6, 7
, 12
C&
D, M
eas.
, W
S, P
M, L
&L
N
SS, R
g
erm
inat
ion
W
M
2.4,
2.4
.1, 2
.4.2
23
Her
e co
mes
th
e sa
lt
1
, 3, 7
C
, R
E&B
P
&S,
TC
C
ASP
2.4,
2.4
.1, 2
.4.2
24
The
wat
erta
ble
5, 7
V
E&B
N
SS
2.4,
2.4
.1, 2
.4.2
, 2.6
.3
25
Rai
nin
g te
nn
is b
alls
5, 6
, 7, 8
UL,
AB
V, S
, R
WM
, N, M
, A
CS,
AR,
E&
B, L
&L
IC
P, P&
S, T
CC
, Sy
s, TS
N
SS, A
C
2.4,
2.4
.1, 2
.4.2
, 2.6
.3
26
Salt
’s o
n t
he
rise
7
E&B
N
SS, R
Sys
2.4,
2.4
.1, 2
.4.2
, 2.6
.3
27
Det
ectiv
e C
row
dis
cove
rs
1, 5
, 6, 7
C, V
L&
L
R
th
e Sa
lt M
on
ster
2.4,
2.4
.1, 2
.4.2
, 2.6
.3
28
Det
ecti
ve C
row
an
d
1
, 3, 6
, 7, 8
UL,
C, P
&S,
V,R
E&B
N
SS
th
e Sa
lt S
tory
2.3.
1, 2
.3.2
, 2.3
.3, 2
.4
29
Cond
ition
s bef
ore
clea
ring
1, 3
, 6, 7
R, V
, C
L&
L, E
&B,
Sin
S
P&
S, R
, C, N
SS
2.3.
1, 2
.3.2
, 2.3
.3., 2
.4
30
Salt
? W
hat
sal
t?
1
, 7
V
E&
B
P&
S
2.3.
1, 2
.3.2
, 2.3
.3., 2
.4
31
‘Insa
ltin
g’ t
he
eart
h
1, 3
, 5, 1
3
R, P
&S,
UL
L&L,
E&
b
NSS
, es.
2.6
32
A
Qu
iz fo
r Sal
twat
cher
s 1
, 7, 9
U
L, P
&S,
R
W
M, N
A
R, S
inS,
E&
B
R
, C, T
CC
2.5,
2.5
.1, 2
.6
33
Sa
linit
y in
1, 3
, 4, 5
, 6,
U
L, A
BV,
C
WM
, C&
D, A
C
S, S
DL,
AR,
P&
S, R
, NSS
Info
, TS
2.6.
1, 2
.6.2
, 2.6
.3
Wes
tern
Au
stra
lia
7, 8
, 10,
12
P&
S, V
, R, W
E&B,
NPM
2.6,
2.6
.3
34
Th
e sa
lty
lico
rice
test
1, 5
, 7
C
&D
I,
SDL,
L&
L, N
PM
2.6,
2.7
, 2.7
.1, 2
.7.2
35
Sa
linit
y q
ues
tio
nn
aire
1, 2
, 3, 5
, 6, 7
, U
L, C
, P&
S, L
, A
P, C
&D
, WM
IC
P, N
SS, P
&S,
R, A
C
I
nfo
, Sys
1
0, 1
2
S,
W
2.6,
2.7
, 2.7
.1, 2
.7.2
36
Sa
linit
y –
1, 2
, 3, 5
, 6, 7
, 8
R, P
&S
AM
, WM
,
IC
P, P&
S, R
it
’s a
catc
hmen
t pro
ble
m
Mea
s, C
&D
Sup
po
rt
No
A
ctiv
ity
Ove
rarc
hin
g
Eng
lish
M
ath
s Sc
ien
ce
Stu
die
s o
f Th
e A
rts
Tech
no
log
y
Info
rmat
ion
St
atem
ent
So
ciet
y &
& E
nte
rpri
se
En
viro
nm
ent
Lin
ks to
Cu
rric
ulu
mSa
linit
y in
the
Cla
ssro
om
Page
5
Page 1
Background information Salinity in the Classroom 2.6
37
N
urs
ery
rhym
es a
nd
1, 3
, 5, 6
, 7, 8
U
L, A
BV
C
S
TS
fa
iry
sto
ries
9,
10,
12
C, L
, S, R
, W
2.6,
2.7
, 2.8
38
Th
e fig
ht
agai
nst
sal
t
1, 3
, 5, 7
, 8, 9
R
Si
nS,
E&
B
R
2.7,
2.7
.1
39
G
oo
d v
s. p
oo
r
1,
5, 6
, 7, 1
2
R
Sin
S,
R, A
C
2.7.
2, 2
.7.3
ca
tchm
ent m
anag
emen
t
2.7,
2.7
.1
40
C
on
tro
llin
g s
alin
ity
1, 3
, 6, 7
L,
V
E&B,
AR
N
SS, A
C
2.7
41
R
edu
cin
g s
alin
ity
1,
3, 7
, 10,
12
C, W
, V
E&
B, S
inS
R
Info
, TP
2.4,
2.7
42
Tree
s as
pu
mp
s
1, 2
, 3, 5
, 6, 7
, C
, P&
S, V
, R, W
A
M, W
M,
I,
CS,
SD
L, S
inS,
L&
L
R, N
SS, A
C
In
fo, T
P
8
, 10,
12
N
, Mea
s, C
&D
2.8
43
D
esal
inat
ion
1,
3, 5
, 7
C, P
&S,
R, W
I, C
S, S
DL,
E&
C, N
PM
I, C
&P,
NSS
TP
2.3,
2.4
, 2.5
, 2.7
44
To c
lear
or
1,
3, 6
, 7, 8
, 12
UL,
C, P
&S
CS,
SD
L, A
R, S
inS,
P&
S, R
,
TS
no
t to
cle
ar
L,
S, V
, R, W
E&B,
L&
L, N
PM
NSS
, AC
Gen
eral
45
Salt
y fa
cts
2,
6, 7
C&
D, A
,
TC
C
In
fo, S
ys
W
M, M
eas.
Gen
eral
46
Salt
co
des
1
U
L, A
BV,
R,
W
M, N
, A
C
,TC
C
P&S,
C
Gen
eral
47
Gam
es to
pla
y
1
CS,
L&
L
P&
S
Gen
eral
48
Salt
wo
rd
1
P&S,
C, R
E&
B
Gen
eral
49
Sup
er s
alin
ity
pu
zzle
1
P&
S, C
, R
E&B
Gen
eral
50
Salt
y se
arch
1
P&S,
C, R
E&
B
Gen
eral
51
Cro
ss-s
alt
1
P&S,
C, R
E&
B
Gen
eral
52
Sup
er s
alin
ity
cros
swor
d
1
P&
S, C
, R
E&B
Sup
po
rt
No
A
ctiv
ity
Ove
rarc
hin
g
Eng
lish
M
ath
s Sc
ien
ce
Stu
die
s o
f Th
e A
rts
Tech
no
log
y
Info
rmat
ion
St
atem
ent
So
ciet
y &
& E
nte
rpri
se
En
viro
nm
ent
Lin
ks to
Cu
rric
ulu
mSa
linit
y in
the
Cla
ssro
om
Page
6

Background information
Section 2
Section 2
Page 1
Background information Salinity in the Classroom
Background information
This information is supplied specifically for teachers to supplement their understanding of the salinity topics involved in the activities supplied in Sections Three and Four. However, the information printed here is deliberately at introductory level, with links to references, networks and other resources for more detailed information (provided in Section Five). This background information may therefore be useful to hand directly to students to support the activities.
INDEX2.1 Salinity in history
2.1.1 A brief history
2.1.2 A timeline of salinity in Western Australia
2.2 What is salinity?
2.3 How did salt get into the landscape?
2.3.1 The water cycle
2.3.2 Where the salt comes from
2.3.3 Where salt is stored in the landscape
2.4 Why has salt become a problem?
2.4.1 Human intervention
2.4.2 Factors determining salinity risk
2.5 Where does salinity occur in Australia?
2.5.1 Extent of salinity in Western Australia
2.5.2 Extent of salinity in Australia
2.6 The impact of salinity
2.6.1 The impact of salinity on agricultural production
2.6.2 The impact of salinity on water quality
2.6.3 The impact of salinity on biodiversity
2.6.4 The impact of salinity on infrastructure
2.6.5 The social impact of salinity
2.7 Managing salinity
2.7.1 Land management practices
2.7.2 Native vegetation management and revegetation
2.7.3 Engineering options
2.8 Measuring and monitoring salinity
2.8.1 Measuring salinity
2.8.2 Visually estimating salinity
2.8.3 Monitoring groundwater levels
2.9 Community and Government action
2.9.1 Farmers, catchment and regional groups for landcare
2.9.2 Government action
2.3.3 Non-government and industry organisations
2.9.4 Research and development organisations
Page 2
Background information Salinity in the Classroom
Page 3
Background information Salinity in the Classroom
2.1 Salinity in history
2.1.1 A brief historySalt occurs naturally in the landscape, but nature generally has the ecosystem balanced so the salt does not cause a problem. However, human activity often upsets this equilibrium and salinity problems can occur.
Salinity is thought to have been a major contributing factor to the demise of the world’s earliest urban society. Established in the lower reaches of the Tigris and Euphrates Rivers in the second half of the fifth millennium BCE (Before the Common Era – a replacement for BC), the enterprising people who became known as the Sumerians settled a perilous land. Consisting of a flat, dusty and dry alluvium plain, interspersed with swamps, its only great advantage for agriculture was the easy access of water from the river system. Through use of irrigation, the Sumerians transformed their parched plain into “a land of extensive grain and forage fields and date palm plantations”. In fact, the prominent civilisation they constructed in Mesopotamia was built upon agricultural productivity, as there were no other major resources to exploit.
In spite of their achievements, the Sumerian civilisation began an irretrievable decline during the third millennium BCE. Land degradation through silting and salinisation was probably the major cause. The deforested upper reaches of the Euphrates were prone to erosion – the soil carried down the river raised the riverbanks above the plain, causing flooding in times of high rainfall. The second severe problem was salt. The irrigated plains so energetically cultivated by the Sumerians had no natural or artificial system of drainage, and excess water seeped into the ground, causing the watertable to rise and bring salt to the surface, killing wheat and other cereal crops.
In the modern era, salinity has become a major worldwide problem. According to the International Food Policy Research Institute, nearly four million acres (1.82 million ha) of farmland are lost to excessive salt every year. Salinity is particularly a problem on irrigated land which produces about 40% of the world’s food. Salinity is not unique to Australia. Other affected areas include the Colorado Valley and Dakotas in North America, the Yellow River in China, the Nile Valley of Egypt and the western prairies in Canada.
In Western Australia, observations of increasing land and stream salinity were first reported many years ago. In 1907 Government Analyst E A Mann suspected that there was a relationship between clearing and the development of land salinity.
In 1902, 8000 ha of trees in the Mundaring Weir catchment were ringbarked to increase run-off. Salinity in the weir increased, and in 1909 it was recommended that regrowth be encouraged and replanting undertaken. This was done and salinity levels fell.
Increasing salinity in railway dams used to supply water to steam engines was also observed. A railway engineer, W E Wood, collated and analysed the early data and with the publication of his paper in 1924 the relationship between clearing and increased land and stream salinity was unequivocally established.

Page 2
Background information Salinity in the Classroom
Page 3
Background information Salinity in the Classroom
As a demonstration of action to control salinity, the Government passed legislation to control clearing on the Wellington catchment in 1976 and extended the clearing bans to Mundaring, Denmark, Warren and Kent catchments in 1978. The State Salinity Action Plan was released in November 1996 and updated to the Salinity Strategy in March 2000.
The timeline mentioned in Section 3.1.2 gives a very extensive listing of dates and notes relating to salinity in WA. Although awareness of salinity as a major water issue developed in the 1960s and 1970s and concern in agriculture started in the 1980s, most of the research and action started in the 1990s. We are actually living in the period of greatest action on salinity management and related natural resource management. This is strongly related to a wide community interest in Ecologically Sustainable Development.
2.1.2 A timeline of salinity in Western AustraliaAn extensive timeline that covers events with relevance to salinity in Western Australia from 1772 till the present is on the CD in this pack. It is titled Important (and some unimportant) Dates By D Bennett and D K Macpherson.
Most of the material is referenced if users want to go to the source material. The timeline is provided as a Microsoft Word document, which will allow teachers to cut and paste dates from the table to make their own timelines.
2.2 What is salinity?Salinity is the problem that occurs when the watertable rises close to the surface and the concentration of soluble salts in the groundwater is sufficient to affect plant growth.
These soluble salts can reach rivers and other waterways through surface and groundwater flow and render the water undrinkable, kill vegetation and destroy ecosystems and built infrastructure.
Problem salinity levels vary depending on the use of the land or water. See Section 2.8.1.
Two types of salinity are recognised in WA – dryland salinity and irrigation salinity. Dryland salinity refers to the salinisation of land that occurs solely from rainfall or local run-off. It does not mean that the land is dry; these areas are often damp or waterlogged. It occurs where native vegetation has been replaced with a land use that does not use all the rainfall and this causes the groundwater level to rise and bring the soluble salts with it towards the surface of the ground.
Irrigation salinity occurs where excess irrigation water raises the watertable or where the irrigated soils are poorly drained thus allowing naturally occurring soluble salts to rise and affect plant growth. In the South-West, reservoirs containing saline water may also contribute.
Dryland salinity is a major issue in Western Australia with approximately 2 million hectares of the agricultural area (18 million hectares in total) affected to date.
Irrigation salinity affects a much smaller area, but is most advanced in the South-West Irrigation Area. It also poses a potential threat to parts of the Ord River Irrigation Area and parts of the Swan Coastal Plain south of Gingin.
Page 4
Background information Salinity in the Classroom
Page 5
Background information Salinity in the Classroom
2.3 How did salt get into the landscape?In Western Australian agricultural areas, wind blown salt (usually in rain water derived from the Indian and Southern Oceans) is the largest source of stored salts. Weathering of rock can also contribute to soil salt, although it accounts for less than 1%.
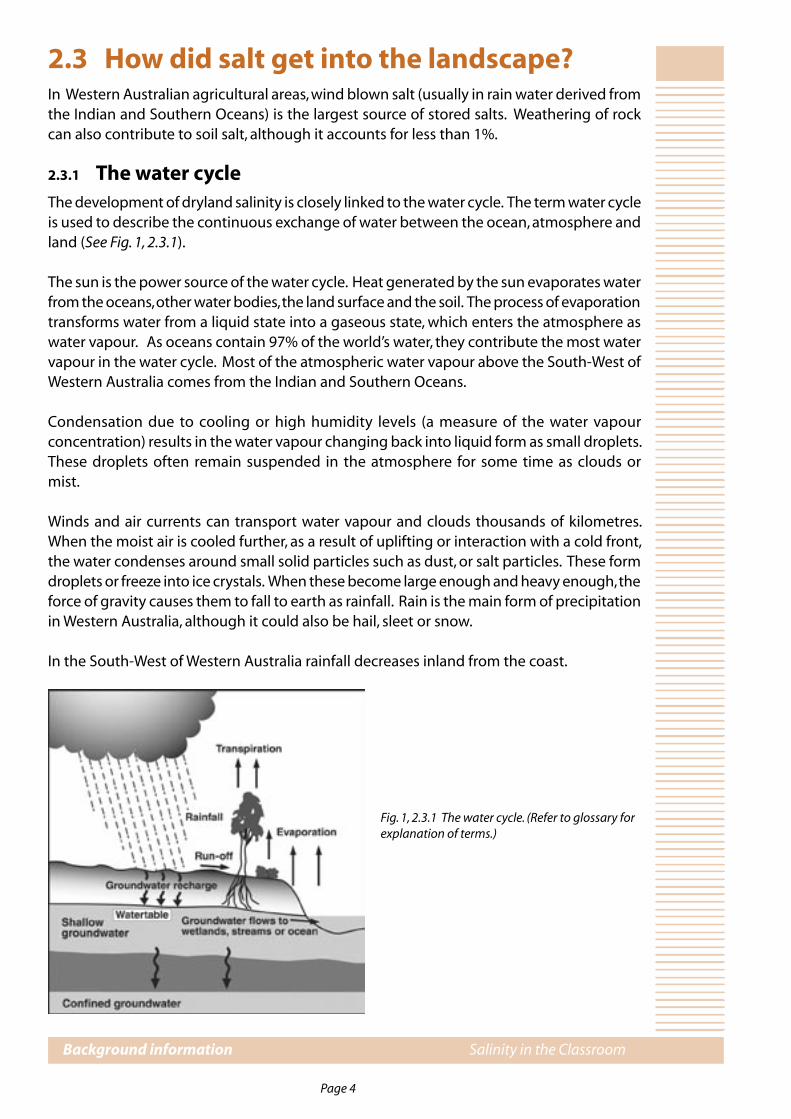
2.3.1 The water cycleThe development of dryland salinity is closely linked to the water cycle. The term water cycle is used to describe the continuous exchange of water between the ocean, atmosphere and land (See Fig. 1, 2.3.1).
The sun is the power source of the water cycle. Heat generated by the sun evaporates water from the oceans, other water bodies, the land surface and the soil. The process of evaporation transforms water from a liquid state into a gaseous state, which enters the atmosphere as water vapour. As oceans contain 97% of the world’s water, they contribute the most water vapour in the water cycle. Most of the atmospheric water vapour above the South-West of Western Australia comes from the Indian and Southern Oceans.
Condensation due to cooling or high humidity levels (a measure of the water vapour concentration) results in the water vapour changing back into liquid form as small droplets. These droplets often remain suspended in the atmosphere for some time as clouds or mist.
Winds and air currents can transport water vapour and clouds thousands of kilometres. When the moist air is cooled further, as a result of uplifting or interaction with a cold front, the water condenses around small solid particles such as dust, or salt particles. These form droplets or freeze into ice crystals. When these become large enough and heavy enough, the force of gravity causes them to fall to earth as rainfall. Rain is the main form of precipitation in Western Australia, although it could also be hail, sleet or snow.
In the South-West of Western Australia rainfall decreases inland from the coast.
Fig. 1, 2.3.1 The water cycle. (Refer to glossary for explanation of terms.)
Page 4
Background information Salinity in the Classroom
Page 5
Background information Salinity in the Classroom
More than 80% of rain falls directly back into the ocean and the rest falls over the land. Rain that falls over the land may:
evaporate before it reaches the ground; hit vegetation and form droplets or a thin layer on the surface of the plant. The
process where water hits vegetation and evaporates back into the atmosphere is called interception;
hit the ground and soak in (infiltrate). Infiltration is the downward movement of water into the soil profile. The type of soil and how wet it is plays an important role in determining the rate of infiltration. Plants can use up the water that has infiltrated in the soil (through growth and transpiration) or it can soak even deeper into the soil. Water that infiltrates below the root zone becomes known as groundwater recharge. Generally groundwater will flow slowly downslope through the soil and can seep out on the ground surface or run out into the ocean or waterways. Water that seeps out of the ground onto the surface is known as discharge;
run off the surface of the ground. When the rate of rainfall is faster than the rate of infiltration, excess water remains on the ground surface. This excess water is known as run-off. Run-off generated from excess rainfall can (1) evaporate (2) infiltrate into the soil at a later stage or (3) flow across the land, eventually making its way back to the ocean via streams and rivers.
This process is continuous and the sun will eventually evaporate the water and start the whole cycle again! The water cycle has existed since water was formed on earth. Human activities have changed the equilibrium in the water cycle throughout the system and the natural environment is changing in response.
2.3.2 Where the salt comes fromThere are three main sources of salt in any landscape:
salt deposited over tens of thousand of years by rainfall. This is called ‘cyclic salt’; salts derived from the weathering of minerals. This is a very slow process; salts derived from marine sediments. This only occurs in discrete parts of Australia
and not for most of the agricultural areas of Western Australia.
Rainfall is by far the greatest contributor of salt in Western Australia. Salt enters the water cycle from sea spray during the evaporation stage. When salty water evaporates, minute particles of salt come out of solution and are blown high into the atmosphere with the water vapour.
In South-West Western Australia rainfall contains up to 25 mg/L total salts near the coast. This results in the rain depositing some 250 kg/ha/year at Perth. This decreases to around 15 kg/ha/year at Merredin.
2.3.3 Where salt is stored in the landscapeAs with rainfall, there are a number of places that the salt can go once it has hit the ground. In some areas (especially those that are saturated), rainfall hits the ground and moves along the surface. It eventually enters a waterway or a water body. There are a number of natural salt lakes throughout the wheatbelt that have been created by an inflow of water over thousands of years.
Page 6
Background information Salinity in the Classroom
Page 7
Background information Salinity in the Classroom
In areas of the landscape that are not saturated, some rainwater (along with the salt) is able to soak into the soil. Plants are able to draw some of the water into their roots, leaving the salt behind. Any water flowing past the plant roots dissolves the extra salt and takes it deeper into the soil. As a result, salt accumulates deep in the soil profile below the plant roots.
Less salt accumulates where soils allow water to move freely through it. In lower rainfall areas more salt accumulates because there is generally more evaporation than rainfall and more salt enters than leaves the soil. Salt will accumulate most in areas that are flat with poor surface drainage.
Where the depth of ‘soil’ above bedrock is great, storage can rise to thousands of tonnes per surface hectare. For the South-West Agricultural Region, estimates are that the region has an average of about 2000 tonnes of salt stored below every hectare in the soil profile between the surface and bedrock. There may be as little as 300 tonnes per hectare in the hills and as much as 10,000 tonnes per hectare in saline valleys (Government of Western Australia Natural Resource Management in Western Australia: The Salinity Strategy, March 2000).
In areas that receive 50 kg/ha/year of salt and no flushing, 1000 tonnes per hectare accumulate in 20,000 years.
2.4 Why has salinity become a problem?The natural ecosystems were thought to be ‘in-balance’ or in equilibrium. In the natural state in the South-West Agricultural Area, less than 1% of rainfall infiltrates below the root zone of the native vegetation. The salt is stored in the soil profile but does not affect anything as the watertable is kept below it by the vegetation. The water entering the system (recharge) equals the water leaving the system (discharge). The watertable is steady, except for seasonal fluctuations due to heavy rain or drought.
2.4.1 Human intervention in the water cycleAustralia’s natural or primary salinity has been exacerbated by changes in land use since European settlement. Primary salinity develops naturally, mainly in areas of internal drainage where rainfall is insufficient to leach salts from the soil profile and where evaporation is high. Over thousands of years, salt slowly accumulated in the South-West of Western Australia, causing changes in biological systems and landscape form and function. There are about 29 million hectares of primary salinity in Australia 14 million hectares as salt marshes, salt lakes and salt flats, and another 15 million hectares with naturally saline subsoils but no groundwater or perched water to take it to the surface. Moist and wet primary saline areas have very high biodiversity in Western Australia.
When European settlers arrived, they cleared the native vegetation to allow for agricultural development. This clearing commenced with the establishment of settlements at Albany (1826), Swan River, Perth (1829), Augusta and Mandurah in 1830 and has continued, at varying rates, to the present day. From the early 1900s to the 1970s, there was massive clearing of the region that became known as the wheatbelt. One estimate suggests that 15 billion trees were removed in this time. (Beresford, Bekle, Phillips and Mulcock ‘The salinity crisis: landscapes, commuities and politics’, UWA Press, 2001, p.80) However, the introduced agricultural crops
Page 6
Background information Salinity in the Classroom
Page 7
Background information Salinity in the Classroom
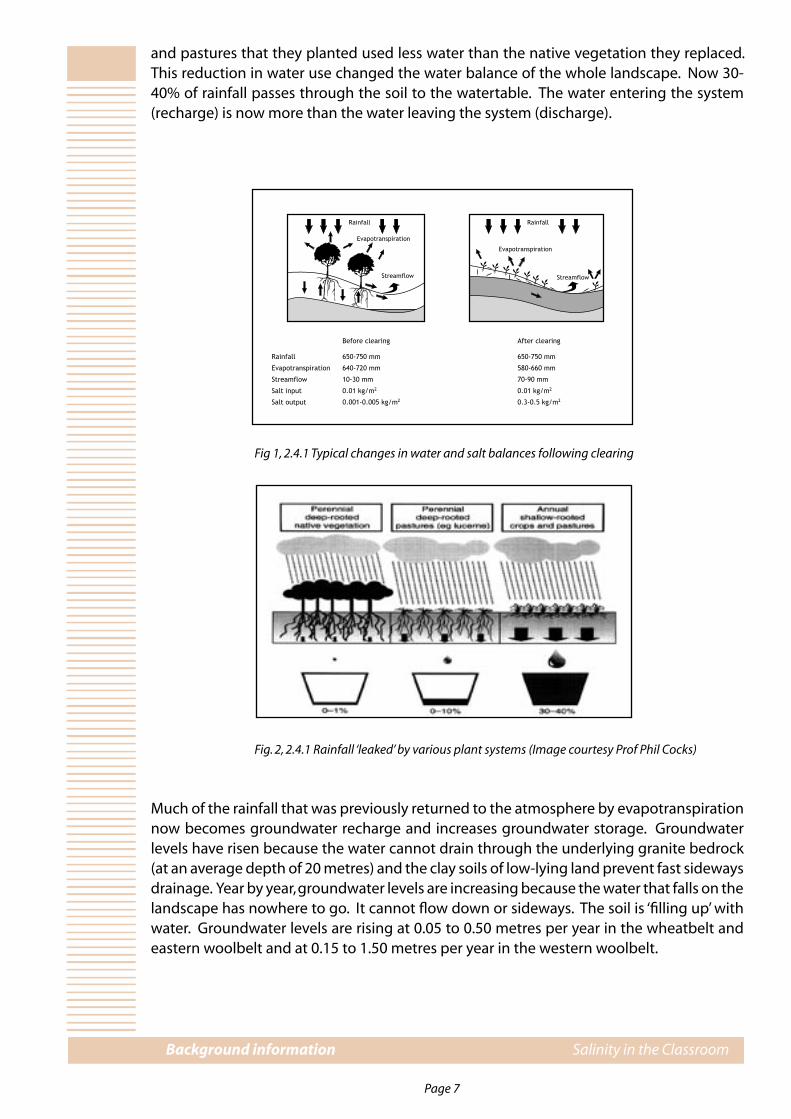
and pastures that they planted used less water than the native vegetation they replaced. This reduction in water use changed the water balance of the whole landscape. Now 30-40% of rainfall passes through the soil to the watertable. The water entering the system (recharge) is now more than the water leaving the system (discharge).
Fig 1, 2.4.1 Typical changes in water and salt balances following clearing
Fig. 2, 2.4.1 Rainfall ‘leaked’ by various plant systems (Image courtesy Prof Phil Cocks)
Much of the rainfall that was previously returned to the atmosphere by evapotranspiration now becomes groundwater recharge and increases groundwater storage. Groundwater levels have risen because the water cannot drain through the underlying granite bedrock (at an average depth of 20 metres) and the clay soils of low-lying land prevent fast sideways drainage. Year by year, groundwater levels are increasing because the water that falls on the landscape has nowhere to go. It cannot flow down or sideways. The soil is ‘filling up’ with water. Groundwater levels are rising at 0.05 to 0.50 metres per year in the wheatbelt and eastern woolbelt and at 0.15 to 1.50 metres per year in the western woolbelt.
Page 8
Background information Salinity in the Classroom
Page 9
Background information Salinity in the Classroom
Rising watertables can lead to salinity and/or waterlogging. Waterlogging is the saturation of soil around plant roots, and it reduces the amount of oxygen available for the plant to respire. Waterlogging occurs when the amount of water added is greater than the ability of that soil to drain or shed that water. Waterlogging can be detrimental to plant growth even if the water is fresh. However, if the watertable is saline the plants suffer a combined effect of salinity and waterlogging.
Once a saline watertable reaches 1 or 2 metres below the soil surface, capillary action can transport salts into the root zone of plants. Capillary action occurs due to surface tensions and water in the soil is drawn higher than the watertable. In many cases the water reaches the ground surface and saline water is discharged forming a wet area or small salt lake. It is these groundwater discharge areas that become affected by dryland salinity.
In these saline discharge areas, water in the soil near the ground surface can be evaporated leaving the salt behind. This increases the concentration of salt in the near surface soil layer. Only a few plants can grow in soil that has high salt concentrations. None of these plants are traditional agricultural crop and pasture species.
The local water systems in the agricultural region will re-establish equilibrium, once the recharge again equals the discharge for that system. However a substantial time lag will exist before this is re-established. For this reason, dryland salinity will be a permanent feature of many Australian landscapes.
Salinity caused by clearing native vegetation and replacing it with shallow-rooted crops and pastures that use less water is called secondary salinity.
2.4.2 Factors determining salinity riskImportant factors for determining salinity risk include:
The extent of clearing of native vegetation Areas that have been extensively cleared are more at risk of salinity. Typically, the
area affected by salinity increases with the proportion of land cleared for pasture or cropping in comparison to land supporting native vegetation or tree plantations.
Climate Rainfall is a major source of water seeping down into the watertable. Recharge will
occur whenever rainfall exceeds the amount that can be used by plants, evaporate, drain away or be stored in the soil.
Soil types Recharge will be greater in areas with porous soils and in rocky areas with fractures or openings which allow more water to seep below the root zone.
Position in the landscape Low-lying lands, such as broad valley floors with naturally shallow watertables tend to be the most susceptible areas as they are often the first areas to be affected by rising watertables.
Restrictions of groundwater flow If groundwater flow is restricted by the geology or shape of the catchment, the watertable may be forced to rise in areas that are not the lowest point of the landscape.

Page 8
Background information Salinity in the Classroom
Page 9
Background information Salinity in the Classroom
Farming practices Many farming practices do not use all the water in the soil, meaning there is less storage space in the soil if there is heavy or persistent rain. This increases the potential for recharge. Poor farming practices include overgrazing, poor crop and pasture growth due to lack of fertiliser or pesticides and long fallows (extended periods between cultivation and sowing).
Development of the countryside Building roads, railways, channels and flood control banks has reduced the effectiveness of natural surface drainage. Heavy rainfall cannot drain away and so seeps into the soil, raising groundwater levels.
Irresponsible and careless use of water Many people live in towns and don’t realise that their activities can also contribute to groundwater recharge. Overwatering lawns, overflowing septic tanks and town drainage can cause recharge.
2.5 Where does salinity occur in Australia?
2.5.1 Extent of salinity in Western Australia Since 1955 landholders and scientists in Western Australia have been attempting to estimate the extent and location of saline land in agricultural areas, and predict the likely impacts and the rate of spread. However the reporting and monitoring of the extent of saline land has been undertaken in a variety of ways, for different purposes and as a result, the areas reported have been variable.
Three estimates of the extent of salinity and predictions have been published in recent years: ABS Statistics (1955-1993), hydrologists’ estimate (1994), and the National Land and Water Resources Audit (2001). Generally, the hydrologists’ estimate provides a better indication of the current extent of salinity across the region, while the National Land and Water Audit provides a better indication of future salinity trends.
ABS Census (1955-1993)
Prior to 1993, salinity statistics were only available from the 5-yearly Australian Bureau of Statistics agricultural census (1955-1993). The ABS asked qualifying landholders to estimate the area of ‘…all salt affected land on your holding which has previously been used for crop and pasture….’. Statistics compiled in the Journal of Agriculture each census showed an increase from 73,476 hectares in 1955 to 529,000 hectares in 1993, representing 3.1% of ‘saline land’ in the agricultural area of the State. This was considered to underestimate the area affected by salinity, especially where there are salt and waterlogging interactions.
Hydrologists’ estimates (1994)
In 1994, Department of Agriculture hydrologists used observations and a variety of field and catchment based methods to estimate that 9% of agricultural area had high soil salinity and shallow watertable. They further estimated that by 2020 up to 3.3 million hectares (17%) was likely to have reduced yields. By the time a new water equilibrium was established, as much as 6.1 million hectares (31%) was expected to have a shallow watertable and potentially be impacted by soil salinity if current trends continued.

Page 10
Background information Salinity in the Classroom
Page 11
Background information Salinity in the Classroom
Table 1, 2.5.1. Estimated areas affected by secondary salinity* to some extent in 1994, 2010-20 (depending on rainfall) and potential (after Ferdowsian et al. 1996).*Includes some non-cleared land which is prone to salinisation in highly-cleared catchments.
National Land & Water Resources Audit (2001)
The Australian Dryland Salinity Assessment stated that of all the States, Western Australia has the largest area at risk of dryland salinity, both now and over the next 50 years. In the Western Australian component of the Audit (Extent and Impacts of Dryland Salinity 2001), the definition of dryland salinity was taken to be the area where watertables were mapped at a regional scale to be within 2 metres of the surface or between 2 and 5 metres and rising to the land surface. The risk of salinity was inferred from the risk of shallow watertables. However it was recognised in the study that not all shallow watertables would result in salinity and reduced productivity. The risk of shallow watertables was determined by analysing depth to groundwater and trends in the watertable level of more than 5,000 groundwater bores.
The following key results were defined: Groundwater is generally rising or stable. No systems have significant falling
trends. Approximately 16% of the region had potential for salinity in 2000 due to
shallow watertables. 20% of the region has potential for salinity in 2020 due to shallow watertables. 33% of the region has potential for salinity in 2050 due to shallow watertables.
The data suggest that current and perceived future land uses will result in about one-third of the South-West Agricultural Areas being affected by shallow watertables and salinity. This will potentially affect about 30,000 km of the road and rail network and at least 35 major rural towns. Surface water resources in the South-West will become more saline.
Page 10
Background information Salinity in the Classroom
Page 11
Background information Salinity in the Classroom
2.5.2 Extent of salinity in Australia
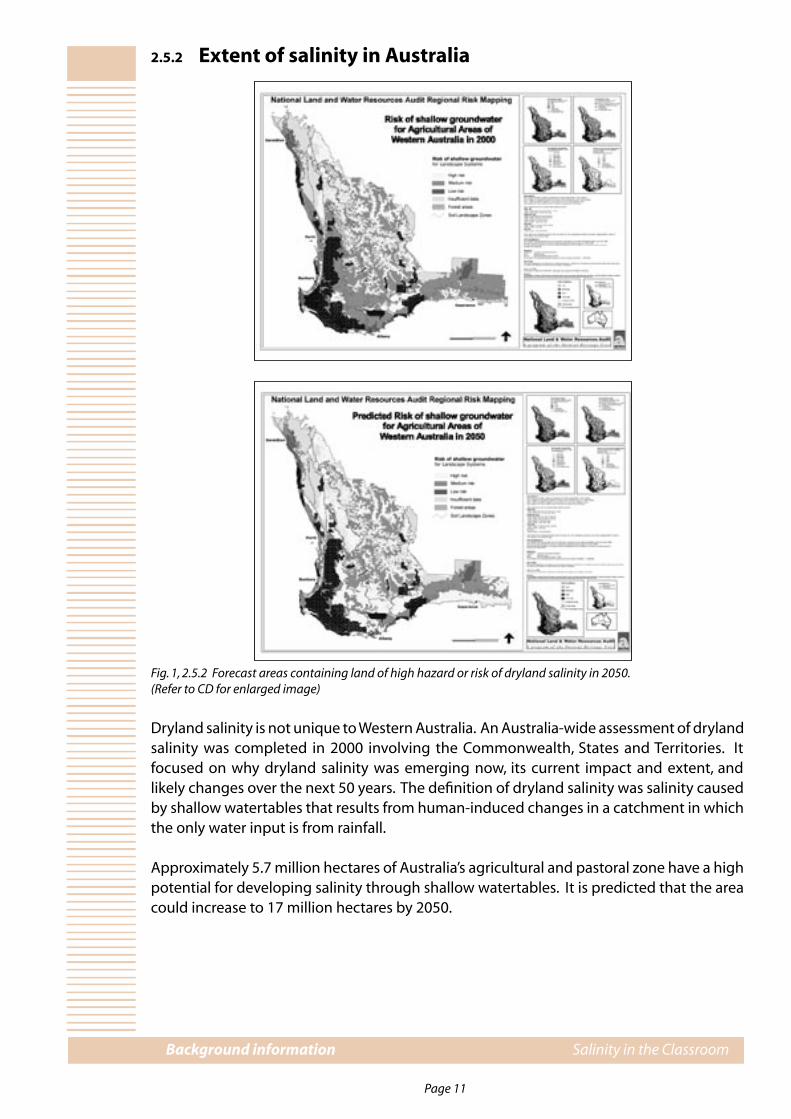
Fig. 1, 2.5.2 Forecast areas containing land of high hazard or risk of dryland salinity in 2050.(Refer to CD for enlarged image)
Dryland salinity is not unique to Western Australia. An Australia-wide assessment of dryland salinity was completed in 2000 involving the Commonwealth, States and Territories. It focused on why dryland salinity was emerging now, its current impact and extent, and likely changes over the next 50 years. The definition of dryland salinity was salinity caused by shallow watertables that results from human-induced changes in a catchment in which the only water input is from rainfall.
Approximately 5.7 million hectares of Australia’s agricultural and pastoral zone have a high potential for developing salinity through shallow watertables. It is predicted that the area could increase to 17 million hectares by 2050.

Page 12
Background information Salinity in the Classroom
Page 13
Background information Salinity in the Classroom
Table 2.5.2. National distribution of salinity affected land (hectares). Note: The Northern Territory and Australian Capital Territory were not included as the dryland salinity problem was considered to be very minor.
State /Territory 1998/2000 2050
NSW 181,000 1,300,000
Vic 670,000 3,110,000
Qld not assessed 3,100,000
SA 390,000 600,000
WA 4,363,000 8,800,000
Tas 54,000 90,000
Total 5,658,000 17,000,000
The largest areas of dryland salinity are in the agricultural zone of South-West Western Australia. Large areas are also at risk in South Australia, Victoria and New South Wales.
2.6 The impact of salinitySalinity impacts on agricultural land, waterway and groundwater quality, biodiversity and built infrastructure. The impact of dryland salinity can occur locally in the paddock, in the valley down in the catchment and outside the catchment. The original cause of the increased recharge (cause of salinity) may be some distance from where its effects and impacts are manifest. Dryland salinity is a land degradation issue which intensifies the impact of other issues such as soil erosion and loss of vegetation. Dryland salinity is difficult to manage because it has a lasting effect on soil, water resources and ecosystems.
2.6.1 The impact of salinity on agricultural productionWestern Australia’s South-West Agricultural Region produces agricultural goods worth more than $4 billion annually for local and export markets on about 18 million hectares of cleared
Fig. 2, 2.5.2 Forecast areas containing land of high hazard or risk of dryland salinity in 2050.
Page 12
Background information Salinity in the Classroom
Page 13
Background information Salinity in the Classroom
land. About 13% of cleared agricultural land is affected by shallow watertables (about 10% is affected by secondary salinity).
Plants suffer from salt toxicity and loss of energy when exposed to high salt concentrations. Plants have two ways to cope with increased salt levels. They can include the salt or exclude it. Plants that include the salt in their systems are more salt-tolerant. Plants that exclude the salt are not as salt-tolerant and must use up energy to keep the salt out of their roots. This means that the plants that exclude salt do not have as much energy to grow. Wheat for example has a 50% decrease in growth when exposed to a salt concentration 6% of seawater. Eventually, plants will run out of energy and salt will begin to enter their roots. Plants that exclude salt cannot survive with high concentrations of salts in their systems. All traditional agricultural crops and pastures exclude the salt.
If effective management is not developed and implemented, the agricultural area affected by shallow watertables/salinity is likely to double in 15 to 25 years, and affect 33% of the total area by 2050. This will have large implications for agricultural production levels, with resulting impacts on the social and economic structure of the State’s rural industries. These areas occur predominantly inland with the most significant changes occurring in the 400 to 800 mm rainfall zone.
The major issues are:
loss of productive cropping land; farms on wheatbelt valley floors being more seriously affected than farms high in
the landscape; and reduced farm business income.
2.6.2 The impact of salinity on water qualityWater suppliesThe discharge of large volumes of saline groundwater into rivers makes the water unfit for drinking and irrigation, causing serious economic, social and environmental problems. Water supplies are threatened, with over a third (36%) of divertible water resources brackish or saline and 16% of marginal quality. Millions of dollars have already been spent on alternative water supplies to replace storages lost to salinity, for example Harris Dam. Industry suffers because there are costs associated with using more saline water and mechanical equipment is likely to have a shorter life due to accelerated corrosion caused by salts in the water.
Rivers and wetlandsMost of our major rivers in the South-West have high increases in salinity each year. Increasing salinity in rivers and wetlands has caused changes to the plants and wildlife. The overall impact is loss of habitat, biodiversity and recreational assets. Animals that rely on fresh water, such as frogs and water birds, are particularly affected.
Frogs are the most sensitive to changes in salinity, and tadpoles can be indicators of salinity changes along streamlines. The slender tree frog is likely to become extinct in inland agricultural areas, and the long-necked turtle may also be at risk from salinisation.
Streams and rivers that are fed by saline run-off and groundwater are gradually degraded with serious effects on the plant and animal life. Fringing vegetation is replaced by more salt-tolerant species or introduced grasses. The water is undrinkable and useless for irrigation.
Page 14
Background information Salinity in the Classroom
Page 15
Background information Salinity in the Classroom
The effects can extend many kilometres downstream from the source of the saline water. Rising watertables and increasing groundwater discharge may also cause inundation and waterlogging of streamlines or low-lying land. This, together with the increasing salinity, has probably contributed to the stands of dead and dying trees along many inland water courses.
2.6.3 The Impact of salinity on biodiversityMaintaining biodiversity is essential for our future well being. The agricultural sector, for example, relies on biodiversity to maintain soil health, absorb nutrients, allow pollination and help control pests. The pharmaceutical, fishing, pastoral and forestry industries also rely on biodiversity and ecosystem services to survive. Biodiversity also has an intrinsic value.Salinity is driving the rapid and catastrophic collapse of existing ecosystems. As root zones come under the influence of saline groundwater, vegetation and soil fauna decline, habitat is lost, plant and animal populations and species decline, functionally important species are killed and the maintenance of ecosystem processes is compromised or destroyed.
The impacts of salinity on natural biodiversity are most obvious in the lower parts of the landscape, and this will continue. The beds and banks of 80% of the region’s rivers and streams are seriously degraded. The degradation of wetlands is already severe and the relief of the region is so low that large areas are being affected by salinity almost simultaneously. Valley floors and wetlands contain plant species that are at most imminent risk of extinction:
Flora
The Greater South-West (south-west of a line from Shark Bay to Israelite Bay) is one of 25 world hot spots for biodiversity. The South-West Agricultural Region has a vascular plant flora of over 4,000 species and approximately 60% are endemic to the region. At least 1,500 plant species will suffer from dryland salinity. Of these endemic species, 450 occur low in the landscape and are under threat of extinction from salinisation and hydrological changes.
Fauna
The region also has a diverse terrestrial and aquatic fauna, with high species diversity in areas low in the landscape, including naturally saline areas. Of the 61 more common waterbird species in the South-West, only 16 prefer strongly saline (more than 20,000 mg/L) or hypersaline (more than 50,000 mg/L) conditions. An average of five waterbird species use hypersaline wetlands, compared with 20 in saline wetlands and 40 in fresh wetlands containing live trees and shrubs. Death of trees and shrubs in many wheatbelt wetlands due to salinity has caused a 50% decrease in the number of waterbird species using them.
Over 560 invertebrates species have been identified in wheatbelt wetlands during biological surveys, with 45% restricted to fresh water (with salinity less than 3,000 mg/L). If all wetlands in the wheatbelt become saline (more than 10,000 mg/L), approximately 220 of these aquatic invertebrate species will disappear from the wheatbelt.

Page 14
Background information Salinity in the Classroom
Page 15
Background information Salinity in the Classroom
2.6.4 The impact of salinity on infrastructure
Roads and rail
Rising watertables which result in waterlogging of the road formation result in a loss of pavement strength and can lead to wheel rutting on the weakened pavement structure. Also, there can be a loss of bond between the pavement base and thin layers of bituminous surfacing leading to increased surface loss, potholes and increased maintenance.
If there is a high salt concentration in the rising watertable, the high salt content in the granular pavement base material will cause further loss of bond between the base and thin bituminous surfacing leading to widespread delamination and blistering of the surface materials. Generally, if the salt is introduced into the base via a rising watertable, the effects of the increased moisture content are more severe than that of the salinity itself. Salt can attack concrete structures and its severity can vary from surface deterioration and etching to rusting of steel reinforcement with subsequent chipping and delamination.
As the watertable rises, the ability of the catchment to absorb heavy rainfall reduces and the risk of flooding the road increases. A rising watertable affects the strength of a rail embankment and the risk of flooding in the same way, and can also affect concrete railway structures when associated with high salt concentrations.
It was estimated that 14,149 km of road and 1,359 km of rail was at high risk of shallow watertables and potential salinity in WA in 2000, and 27,934 km of roads and 2,182 km of rail will be at risk in 2050.
Rural towns and infrastructure
Dryland salinity is a major environmental problem threatening the existence of many rural towns in the low and medium rainfall areas (<600 mm/year) of the agricultural region. Symptoms of townsite salinity include damage to homes, public buildings, roads and railways, destruction of concrete structures, sporting grounds, parks and gardens, dams and reservoirs.
Historically, rural towns were built to support agricultural communities and included facilities for transporting produce to major ports and cities via rail. Because the rail system was constructed in the lower sections of the landscape, the towns also tended to be located in hollows or lower slopes. This location has been a prime reason for the development of dryland salinity while towns in the upper landscape do not have significant problems.
Although the causes of dryland salinity in rural towns are similar to those affecting agricultural land, factors which can make townsite salinity problems worse are:
the location of towns low in the landscape within surrounding agricultural catchments;
disruptions to natural surface run-off and infiltration caused by high shedding surfaces, e.g. roofs and paving;
the use of imported scheme water within towns; and alterations to surface and subsurface water movement within towns due to below
ground man-made structures which divert or impede water flows.
Page 16
Background information Salinity in the Classroom
Page 17
Background information Salinity in the Classroom
2.6.5 The social impact of salinityDeclining water quality, loss of agricultural productivity, fewer facilities and infrastructure, and a loss of landscape and visual amenity as a result of salinity will have profound social ramifications. Life in rural areas, which for many has been the way of life for generations of the same family, is changing. There is a financial and physical burden in taking remedial action to address salinity problems. Maintaining the family’s income can require increasing production from existing land or purchasing more land. Individuals and families will feel an extreme social impact if they are forced to move off the land.
2.7 Managing salinityManaging salinity is about managing the water balance. Ideally the objective is to keep the watertable low so the salt stored in the soil above the groundwater is not mobilised; the aim is to replace the water using function of the original vegetation and restore the original water balance. There is no quick fix or easy solution to salinity. It took time to develop and will take time to halt or reduce.
There are several options for managing salinity, and usually a combination of these is best. Choosing options may depend on what is intended to be achieved. A strategy for managing salinity may be defined in one of three ways:
recovery. The options implemented reduce the area that is affected by salinity; containment. The options implemented do not allow the saline areas to spread, but
do not reduce the amount of area affected; or adaptation. The option implemented is to be able to coexist with the salt or even to
use it. The extent of the saline area may increase.
These strategies may be achieved by: recharge reduction. Water is caught or used before it reaches the watertable; discharge enhancement. Water is drained from the groundwater; and productive or other use (e.g. enhanced biodiversity) of saline water and salt-
affected land.
The tools to achieve better water management are described in the following pages, but are generally categorised under the headings:
land management practices; native vegetation management and revegetation; and engineering options.
Catchment and farm planning is an essential step in a long-term commitment to change the way in which land is used and managed. The activities on farms and towns in their catchments can affect the surface water and groundwater of others in the catchment and region.
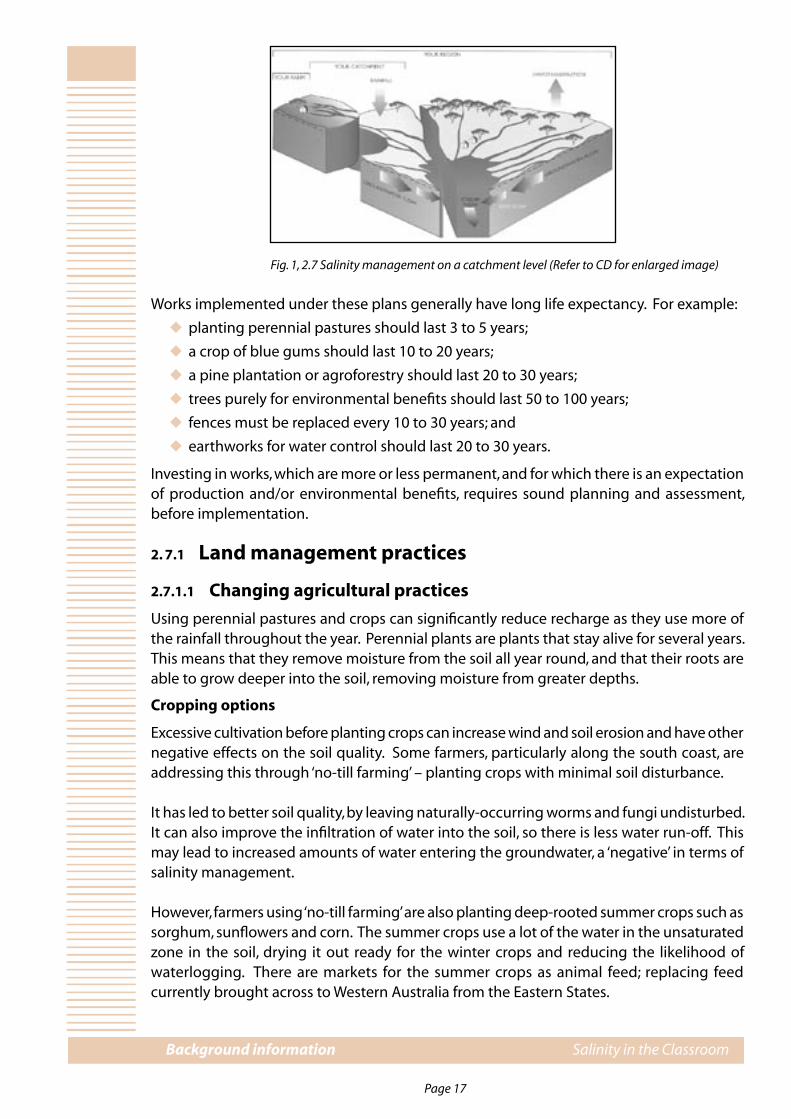
Page 16
Background information Salinity in the Classroom
Page 17
Background information Salinity in the Classroom
Fig. 1, 2.7 Salinity management on a catchment level (Refer to CD for enlarged image)
Works implemented under these plans generally have long life expectancy. For example:
planting perennial pastures should last 3 to 5 years;
a crop of blue gums should last 10 to 20 years;
a pine plantation or agroforestry should last 20 to 30 years;
trees purely for environmental benefits should last 50 to 100 years;
fences must be replaced every 10 to 30 years; and
earthworks for water control should last 20 to 30 years.
Investing in works, which are more or less permanent, and for which there is an expectation of production and/or environmental benefits, requires sound planning and assessment, before implementation.
2. 7.1 Land management practices
2.7.1.1 Changing agricultural practices
Using perennial pastures and crops can significantly reduce recharge as they use more of the rainfall throughout the year. Perennial plants are plants that stay alive for several years. This means that they remove moisture from the soil all year round, and that their roots are able to grow deeper into the soil, removing moisture from greater depths.
Cropping options
Excessive cultivation before planting crops can increase wind and soil erosion and have other negative effects on the soil quality. Some farmers, particularly along the south coast, are addressing this through ‘no-till farming’ – planting crops with minimal soil disturbance.
It has led to better soil quality, by leaving naturally-occurring worms and fungi undisturbed. It can also improve the infiltration of water into the soil, so there is less water run-off. This may lead to increased amounts of water entering the groundwater, a ‘negative’ in terms of salinity management.
However, farmers using ‘no-till farming’ are also planting deep-rooted summer crops such as sorghum, sunflowers and corn. The summer crops use a lot of the water in the unsaturated zone in the soil, drying it out ready for the winter crops and reducing the likelihood of waterlogging. There are markets for the summer crops as animal feed; replacing feed currently brought across to Western Australia from the Eastern States.
Page 18
Background information Salinity in the Classroom
Page 19
Background information Salinity in the Classroom
Pasture
Deep-rooted perennial plants use water throughout the year, so they can be used to lower groundwater levels and reduce recharge. There are various deep-rooted perennials that can be used for pasture.
Lucerne is one example that is being used in Western Australia. As well as assisting in salinity management, lucerne also has benefits for soil health (it fixes nitrogen in the soil reducing the need for fertilisers, and breaks up hard ground) and animal health (it is a prime feed source for sheep, producing better sheep health and wool quality).
Perennial veldt grass is a native of South Africa. It was introduced into Australia in the early 1900s and is now widely naturalised in the South-West. Perennial veldt grass will persist in areas receiving more than 300 mm of rain and is drought tolerant.
Kikuyu is a tropical perennial grass that is active in the warmer months, particularly when moisture is plentiful, and is dormant in winter. Kikuyu will establish with rainfall of 500 mm or more.
Tall wheatgrass is a tussock-forming perennial grass growing to 2 m high. It is a native of the Balkans, Asia Minor and southern Russia. It is adapted to marshy areas, seashores and places inundated by salty water.
Some annual crops and pasture, such as clovers (arrowleaf, balansa, persian) and Cadiz French serradella, can be used to reduce the amount of recharge if they have longer growing periods. The benefits of using annual crops and pastures is that they can be used in agriculture without the need for significant changes to conventional farm practices.
Fodder shrubs
As for pasture (above), deep-rooted perennials can be used for fodder shrubs and have a positive effect on groundwater levels.
An example of a deep-rooted perennial fodder shrub is tagasaste (also known as tree lucerne), which grows very well on deep sand. It is a high water user and its long roots can draw water from as deep as 10 m below ground, reducing recharge and lowering groundwater levels at the same time.
Tagasaste makes very good high protein grazing for livestock. Farmers have found that by growing tagasaste, they are generating similar returns to a high-yield wheat crop on land that was previously generating little or no return. At the same time, they are preventing wind erosion and managing salinity.
Acacia saligna (golden wreath wattle), a fast growing fodder shrub option, can be grown successfully as a wind break or shelterbelt. Depending upon the form, it can also provide palatable and digestible fodder to replace supplementary feeding over the late summer to early winter period. As a legume it is less competitive than eucalypts with annual pastures.
Page 18
Background information Salinity in the Classroom
Page 19
Background information Salinity in the Classroom
2.7.1.2 Commercial farm forestryTrees can be effective in lowering groundwater levels when very large numbers are planted. However, the cost of this tree-planting can be more than the community can afford. One solution to this problem is to plant trees that have a commercial as well as a salinity management value through the production of timber, fruit, flowers, foliage or extracts.
Blue gums and maritime pines
The Department of Conservation and Land Management (CALM) has worked to develop a commercial forestry industry on privately owned farms, on a scale that would make a significant contribution to the rehabilitation of high and medium rainfall degraded agricultural land and river systems.
The most established trees are Eucalyptus globulus (blue gums), which have been farmed in high rainfall areas (>700 mm) in WA since the 1980s. The success of these trees, which can be used for paper and fuel wood, has led to several multi-million dollar projects funded by private investment from Australia and Japan.
Maritime pine plantations are also being established, particularly on otherwise unproductive sandy, free draining soil. Maritime pines originate from coastal areas in Europe and supply the growing market for pine in Western Australia that cannot be supplied from existing plantations. They are grown in deep sands and deep sandy gravels in areas of higher than 400 mm rainfall.
Oil mallees
Oil mallees are indigenous deep-rooted perennials. Their roots grow straight down, so they don’t compete with crops planted nearby, and once harvested they regenerate from the root stock so don’t need to be re-sown. Oil mallees are generally sown in rows (alley farming) with crops planted between the rows.
All parts of a mallee can be used – the leaves for eucalyptus oil, the wood for activated carbon and any waste can be burnt for energy. There are also possibilities for using the wood in fibreboard and creating ethanol fuel. A pilot processing plant is being built in Narrogin by Enercon Pty Ltd from Melbourne. Woodside is also investing in an oil mallee farm near Esperance and in developing a mallee harvester.
Other tree crops
Melaleuca species are also being researched by CALM – they appear are more tolerant of saline and waterlogged soil and the teatree oil produced from melaleucas already has a market so it could be a commercially viable crop.
Banksias are suitable for cut flower production and olives, pistachios and quandongs for fruit. Sandalwood is used for its perfumed wood and jojoba in the cosmetic industry.
2.7.1.3 Using saline land and waterSaline land can be used and, to a certain extent, reclaimed by salt-tolerant plants such as samphire, puccinellia, saltbush and bluebush. Saltbush is most frequently used, including several varieties that are indigenous to the wheatbelt areas. There are plans to revegetate one million hectares of saline land with a mixture of salt-tolerant perennials and annuals in the next ten years.
Page 20
Background information Salinity in the Classroom
Page 21
Background information Salinity in the Classroom
Saltbush and companion annuals can be used as fodder for sheep, but due to the high levels of salt in the leaves they need to be fed in conjunction with other fodder such as clover or hay.
The saltbush reduces the levels of salt in the ground enough to allow other plants to grow around it. (Saltbush provides a micro-climate and micro-environment that is conducive to salts leaching from the soil surface and hence is favourable to the survival of other salt sensitive plants. Saltbush is also thought to be able to lower groundwatertables creating a favourable environment for other salt sensitive plants.) Some farmers are now growing clover or grasses between the saltbush plants, so providing good grazing for sheep in one area. There is also research being done into ‘alley farming’ with saltbush (growing crops between rows of saltbush), rotating saltbush with other crops and animal production on salt land.
Saline aquaculture and other uses
Aquaculture is the farming or culture of aquatic animals and plants in an artificial environment (in captivity). Aquaculture in Australia has the potential to provide food to a growing market, to improve natural stocks through artificial recruitment and transplantation to provide for the culture of sport fish and bait, to cater for the culture of aquatic organisms to treat or recycle organic waste, and to allow for the production of industrial commodities (i.e. oil, animal feed, drugs).
Trout has emerged as the prime species for use in saline water, but black bream, barramundi and pink snapper and brine shrimp also have potential.
Other uses of saline water are desalination to produce drinking quality water, harvesting of salt and minerals and energy production (salt gradient solar ponds or hot salt energy).
2.7.1.4 Irrigated agriculture
Clearing in the Wellington Dam catchment dramatically raised the levels of salinity of the dam water, which is used for irrigation by dairy farmers, orchardists and other farmers. The high salinity levels are killing salt-sensitive pastures such as ryegrass and clover, and leading to a build-up of salt in the soil.
Farmers are now starting to use subsurface drainage (a technique that has been around since Roman times) to manage this. They are taking excess water away from the ground through flexible slotted plastic pipes laid under the ground in rows across the paddock, and channels cut in the paddock at right angles to the pipes. The excess water is taken to drains and eventually to estuaries.
The paddocks are no longer becoming waterlogged (which breaks down the soil structure), the time that they can be used for pasture is extended, there is less salt build-up and less water finding its way into the groundwater (recharge). The pasture production is also increased.
2.7.2 Native vegetation management and revegetationNative vegetation uses more water than introduced annual crops such as wheat, so less water flows through the soil to add to groundwater levels. Reducing this water ‘recharge’ is one of the keys to fighting salinity.
Page 20
Background information Salinity in the Classroom
Page 21
Background information Salinity in the Classroom
Protecting remnant areas of native vegetation has benefits in managing salinity, as well as helping to maintain genetic resources (biodiversity), protecting wetlands (often surrounded by remnant vegetation) and reducing the amount of silt and nutrients that enters water courses (which would otherwise increase the risk of flooding and drainage problems).
Parks and reserves are important places where native vegetation is managed for multiple use recreation, industry, and conservation. Significant areas of native vegetation are also found on land zoned for agriculture.
Well managed farm bush has a role to play in helping to address salinity and other forms of degradation.
Farm bush helps maintain a hydrological balance, maintains biodiversity through the conservation of native plants and animals, assists farm productivity by providing a range of ecological services (resulting in direct and indirect economic returns), prevents erosion and is also extremely important in protecting river, streams and other waterways.
2.7.3 Engineering optionsHigh watertables have developed over much of the South-West and recharge continues to be significantly greater than discharge. For this reason, engineering options such as surface water management and the groundwater management techniques listed below, may be needed to complement agronomic and vegetation options, or to delay the development of salinity. However, options must be implemented with full knowledge of their potential on-site and off-site impacts and practicality, and within the framework of a catchment plan. Engineering options may be expensive to construct and maintain. At present their effectiveness is still being evaluated.
2.7.3.1 Surface water management
Water ponding on the soil surface and waterlogging within the soil profile inhibit plant growth, and encourage groundwater recharge. Directing water along grade lines using drains, banks or cultivation rows can improve plant growth, reduces erosion and potentially reduces recharge, particularly in wet years when most recharge occurs.
Shallow drains built along contour lines can channel water into a series of dams. Water harvested from a catchment can either be used for drought-proofing water supplies or to support new farm enterprises such as aquaculture, horticulture or summer irrigation.
2.7.3.2 Groundwater management
Groundwater management in discharge areas is distinguished from surface water management systems in that it targets removal of the permanent groundwater systems. Methods include deep drains that may be either open (constructed by an excavator) or closed (e.g. buried slotted pipe), pumping systems, relief wells and syphon wells.
Deep drains
Deep drains are constructed at depths generally from 1 to 3 metres depending on site conditions. Deep open drains are most effective in permeable formations that resist slumping and erosion (e.g. clayey sands). Many agricultural soils have a low permeability (e.g. clays)
Page 22
Background information Salinity in the Classroom
Page 23
Background information Salinity in the Classroom
or are unstable (e.g. loose sands) and therefore an evaluation of site responsiveness is very important before construction.
Well designed deep drains have a role in salinity management. When deciding if a deep drain is suitable for a particular site, land managers should ensure the drainage forms part of a catchment water management plan, and that the disposal of any drainage water off-site does not increase the flood risk and does not cause physical or environmental damage downstream.
Groundwater pumping
This form of engineering option refers to bores drilled down to bedrock or into permeable aquifers and situated in low parts of the catchment with various forms of electric or compressed air pumps. They are usually costly to install and maintain and are therefore most often suited to protecting high value assets. Their effectiveness is heavily dependent on aquifer and soil permeability, which determines how many pumps and how much power is needed to achieve the outcome.
Relief wells and syphons
These engineering options involve groundwater under pressure being discharged naturally from bores drilled to bedrock. Discharge through polythene pipes into waterways prevents erosion and these systems may be the most easily managed of the engineering options, however downstream impacts of saline water disposal still need to be considered.
2.8 Measuring and monitoring salinity
2.8.1 Measuring salinityExtreme examples of dryland salinity are highly visible, but it is not always easy to recognise areas affected by milder salinity or identify areas where salinity problems are still developing. Even when there are obvious signs of salinity, it is usually a good idea to make a few simple measurements to confirm the presence of salts.
Measuring the salinity of water sources enables the water to be used appropriately. Humans, livestock and crops all have a different tolerance to salt. For human consumption even relatively low levels of dissolved salts make water unsuitable for drinking. Fresh drinkable water is considered to have less than 500 mg/L of dissolved salts. However, sheep can withstand up to 10 times this amount for limited periods (12,000 mg/L). Salinity is measured by the total soluble (or dissolved) salt (mineral constituents) in water. The use of saline water for crop irrigation can also lead to problems including restricted vigor and eventually death (See Table 1, 2.8.1).
Determining the salinity levels in soil allows the landowner to understand what plant species can be grown on the land. Land can be classed into degrees of soil salinity and plants appropriate to that level of salinity can be established.
Another benefit of measuring salinity is being able to determine the effectiveness of salinity management options. The extent to which land is being affected by salinity can be determined, and how it is changing.
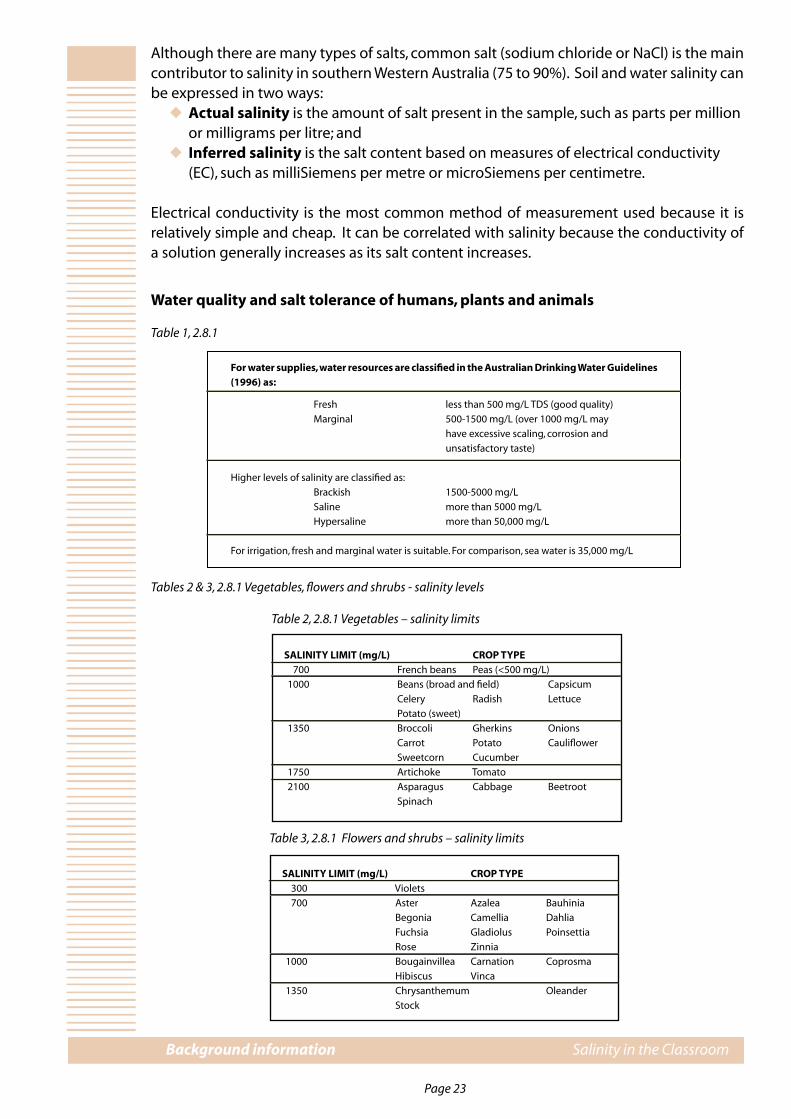
Page 22
Background information Salinity in the Classroom
Page 23
Background information Salinity in the Classroom
Although there are many types of salts, common salt (sodium chloride or NaCl) is the main contributor to salinity in southern Western Australia (75 to 90%). Soil and water salinity can be expressed in two ways:
Actual salinity is the amount of salt present in the sample, such as parts per million or milligrams per litre; and
Inferred salinity is the salt content based on measures of electrical conductivity (EC), such as milliSiemens per metre or microSiemens per centimetre.
Electrical conductivity is the most common method of measurement used because it is relatively simple and cheap. It can be correlated with salinity because the conductivity of a solution generally increases as its salt content increases.
Water quality and salt tolerance of humans, plants and animals
Table 1, 2.8.1
Tables 2 & 3, 2.8.1 Vegetables, flowers and shrubs - salinity levels
Table 2, 2.8.1 Vegetables – salinity limits
SALINITY LIMIT (mg/L) CROP TYPE 700 French beans Peas (<500 mg/L)
1000 Beans (broad and field) Capsicum
Celery Radish Lettuce
Potato (sweet)
1350 Broccoli Gherkins Onions
Carrot Potato Cauliflower
Sweetcorn Cucumber
1750 Artichoke Tomato
2100 Asparagus Cabbage Beetroot
Spinach
SALINITY LIMIT (mg/L) CROP TYPE 300 Violets
700 Aster Azalea Bauhinia
Begonia Camellia Dahlia
Fuchsia Gladiolus Poinsettia
Rose Zinnia
1000 Bougainvillea Carnation Coprosma
Hibiscus Vinca
1350 Chrysanthemum Oleander
Stock
Table 3, 2.8.1 Flowers and shrubs – salinity limits
For water supplies, water resources are classified in the Australian Drinking Water Guidelines (1996) as:
Fresh less than 500 mg/L TDS (good quality)
Marginal 500-1500 mg/L (over 1000 mg/L may
have excessive scaling, corrosion and
unsatisfactory taste)
Higher levels of salinity are classified as:
Brackish 1500-5000 mg/L
Saline more than 5000 mg/L
Hypersaline more than 50,000 mg/L
For irrigation, fresh and marginal water is suitable. For comparison, sea water is 35,000 mg/L

Page 24
Background information Salinity in the Classroom
Page 25
Background information Salinity in the Classroom
In Western Australia technical papers tend to use actual salinity in mg/L while water salinity and soil salinity data collected by the community are usually quoted in milliSiemens per metre (mS/m).
2.8.1.1 Measuring water salinity
The most common way of measuring water salinity is with a hand-held electrical conductivity (EC) probe which can be bought from scientific equipment companies. The probe is dipped into the water sample to measure the electrical conductivity. The reading is usually in milliSiemens per metre (mS/m) or micro-mhos per centimetre (umhos/cm). It is important
Table 5, 2.8.1 Livestock tolerance - salinity levels.
* Depends on type of feed available e.g. green feed, dry feed or saltbush (Centre for Groundwater Studies).
Enterprise Max. for healthy growth (mg/L) Max. to maintain condition (mg/L) Max. tolerated (mg/L)
Poultry 2,000 3,000 3,500
Pigs 2,000 3,000 4,000
Horses 4,000 6,000 7,000
Dairy cattle 3,000 4,000 6,000
Beef cattle 4,000 5,000 10,000
Sheep 6,000 13,000 *
TOTAL DISSOLVED SALTS CONVERSION TABLE (mg/L) EC Units at 25ºC Grains/gallon 250 455 17
500 910 36
750 1,360 52
1,000 1,810 70
1,500 2,710 105
2,000 3,600 140
2,500 4,480 175
3,000 5,300 210
4,000 7,100 280
5,000 8,800 350
10,000 17,000 700
15,000 25,000 1,050
Table 6, 2.8.1 Salinity conversion.
NOTE: For quick conversion use EC units x 0.6 = mg/L mg/L x 1.8 = EC unit mg/L x 0.07 = grains/gallon
SALINITY LIMIT (mg/L) CROP TYPE 300 Loquat
Avocado Blackberry Strawberry
Walnut
1000 Apple Almond Apricot
Grapefruit Lemon Orange
Peach Pear Plum
Raspberry
1350 Fig Grape Olive
Pomegranate
Table 4, 2.8.1 Fruit - salinity levels.
Page 24
Background information Salinity in the Classroom
Page 25
Background information Salinity in the Classroom
to check the units that your machine is using. Many probes are portable, so can be used in the field.
Cleaning the measuring equipment between samples will avoid cross-contamination.
Care is needed to ensure the probe is operating within its limits.
2.8.1.2 Measuring soil salinity
Measuring the salinity of a few soil samples from an area can provide a relatively quick indication of salinity problems. Soil samples however require a little more preparation than water samples to determine the salt content.
To measure the salinity of soil, a sample is mixed with water so that the salts can dissolve into the liquid. The resultant liquid is then measured with the EC probe similar to a water sample. The soil sample can be prepared in two ways, by the saturation extract (ECe) method (The WA Chemistry Centre is the only laboratory that does this test in WA) or by the 1:5 soil suspension (weight to volume) method.
2.8.1.3 Estimating soil salinity from above the ground
Another way to measure soil salinity is by using an electromagnetic induction meter such as an EM38 or EM31. These are portable instruments that provide reliable estimates of soil salinity without intensive soil sampling and analysis.
The EM38 machine measures the apparent soil electrical conductivity (ECa) of about the top 1 metre of soil (in the vertical mode) or the top 0.5 metre of soil (horizontal mode), while the EM31 measures down to about 4 to 6 metres. Soil salinity can be assessed quickly over relatively large areas either by conducting surveys on foot or using 4WD motorbikes equipped with GPS.
These surveys reflect patterns of soil salinity a lot more accurately than ‘point’ soil sampling, however they are relatively expensive and require extensive knowledge of the equipment.
2.8.1.4 Estimating soil salinity from the air
Although airborne geophysics has been used since the 1950s as a method of mineral exploration in Western Australia, the benefits for land management have only recently been discovered. Airborne geophysics involves low flying aircraft (fixed wing or helicopters) collecting three principal datasets:
Magnetics: sensors measure the magnetic susceptibility of the basement rock. Since each rock type has a common ‘signature’, magnetics can locate the position of rocks and geological formations such as dolerite dykes, shear zones and faults. Locating these features may enable more accurate prediction of future outbreaks of salinity, explain the current distribution of salinity and help with identifying successful management options;
Radiometrics: sensors determine the level of radioactive elements (uranium, potassium and thorium) and the total radioactivity in the upper 50 centimetres of the soil profile. Radiometrics show areas of land with similar characteristics and can provide more information about the processes leading to salinity;
Page 26
Background information Salinity in the Classroom
Page 27
Background information Salinity in the Classroom
Electromagnetics: sensors measure the ability of an electrical current to pass through the ground. In most cases this indicates how much salt is in the soil. Airborne electromagnetic systems can therefore determine the mass of salt stored below the ground.
Although airborne geophysics is relatively expensive, it can assist in dryland salinity and land management by:
providing a ‘3D’ type map of the ground and what lies underneath; significantly improving the means to explain why salinity has developed where it
has and help predict future outbreaks; allowing for the more effective placement of treatments (e.g. trees); locating target areas for drilling for both water supplies and salinity control; potentially defining the location of salt, groundwater salinity and magnitude of
resource; providing ‘soil maps’ at a paddock scale (1:25,000) for use by all areas of the
agricultural industry; and delivering the datasets with a Geographic Information System (GIS) view,
incorporating other spatial data, making it more easy and more useful for planning.
2.8.1.5 Estimating soil salinity from space
Satellite imagery through the process of remote sensing can be used to estimate soil salinity. Sensors mounted on a satellite detect the amount of emitted or reflected electromagnetic radiation from features on the earth’s surface and form an image from this. As each soil and vegetation type emits and reflects differently, a map can be produced which indicates what is covering the surface of the earth. This is the technology used in the Land Monitor project (see Section 2.9.2).
By mapping low producing areas in a paddock, satellite images can be used to identify potential land and water degradation problems in farmed areas. Not all poor performing areas are directly related to salinity. Other factors that may lead to poor performance are poor soil types, waterlogging, or soil acidity.
2.8.2 Visually estimating salinityTypically, changes in the health, performance and composition of vegetation are the initial indicators of a developing salinity problem. The first plants to be affected by rising saline watertables are usually deep-rooted species such as trees. Naturally susceptible species, such as karri (Eucalyptus diversicolor) will be affected sooner than tolerant species such as swamp oak (Casuarina obesa). Trees under stress due to salt are also more susceptible to diseases and attack by pests.
Signs that trees are affected by salinity include: slow tree growth; the yellowing of leaves with scorching around the leaf margins; and loss of leaves and death as the salinity increases.
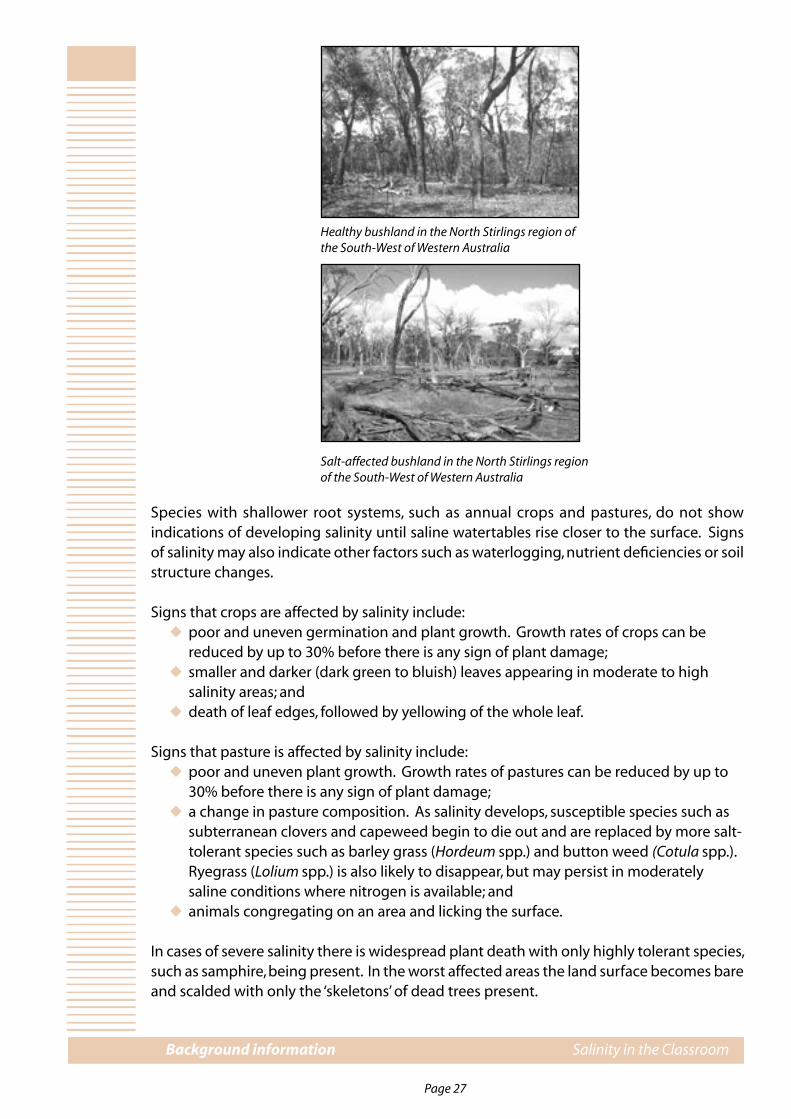
Page 26
Background information Salinity in the Classroom
Page 27
Background information Salinity in the Classroom
Healthy bushland in the North Stirlings region of the South-West of Western Australia
Salt-affected bushland in the North Stirlings region of the South-West of Western Australia
Species with shallower root systems, such as annual crops and pastures, do not show indications of developing salinity until saline watertables rise closer to the surface. Signs of salinity may also indicate other factors such as waterlogging, nutrient deficiencies or soil structure changes.
Signs that crops are affected by salinity include: poor and uneven germination and plant growth. Growth rates of crops can be
reduced by up to 30% before there is any sign of plant damage; smaller and darker (dark green to bluish) leaves appearing in moderate to high
salinity areas; and death of leaf edges, followed by yellowing of the whole leaf.
Signs that pasture is affected by salinity include: poor and uneven plant growth. Growth rates of pastures can be reduced by up to
30% before there is any sign of plant damage; a change in pasture composition. As salinity develops, susceptible species such as
subterranean clovers and capeweed begin to die out and are replaced by more salt-tolerant species such as barley grass (Hordeum spp.) and button weed (Cotula spp.). Ryegrass (Lolium spp.) is also likely to disappear, but may persist in moderately saline conditions where nitrogen is available; and
animals congregating on an area and licking the surface.
In cases of severe salinity there is widespread plant death with only highly tolerant species, such as samphire, being present. In the worst affected areas the land surface becomes bare and scalded with only the ‘skeletons’ of dead trees present.

Page 28
Background information Salinity in the Classroom
Page 29
Background information Salinity in the Classroom
Signs of severely salt affected land include: white crystals of salt appearing on the bare soil surface when it becomes dry.
However salt crystals are hard to see because they are very small; the surface of the soil remaining moist, greasy or boggy well into summer as
groundwater continues to discharge; and clay soils appearing very loose and crumbly and when cultivated having a soft and
spongy texture.
Surface waters can provide another visual clue to the presence of salinity problems. Water in dams or streams that is usually cloudy or muddy can become quite clear when salinity levels rise. In areas that are severely affected by salinity, it is possible to smell the salt.
2.8.3 Monitoring groundwater levelsAs salinity is a direct result of rising watertables, monitoring whether the watertable is rising or falling is important. Salinity levels in groundwater are also less variable than salinity levels in soil so are a good indication of the severity of the salinity problem. Observation wells can be installed to monitor the salinity and level of watertables and can provide advance warnings of developing salinity problems.
An observation well consists of tubing (usually PVC) sunk into the ground, typically to depths of 2 to 10 metres. Part or all of the tube is slotted to allow groundwater to enter. A coarse material such as gravel surrounds the tube to prevent clogging of the slots. The exact design, construction technique and bore casing will vary depending on specific site conditions.
Observation wells can be monitored daily, weekly, monthly, quarterly or annually; depending on the value placed on the information generated and the time and resources available to generate this information.
Fig. 1, 2.8.3 Construction details of a piezometer and observation well
Page 28
Background information Salinity in the Classroom
Page 29
Background information Salinity in the Classroom
A single measurement is of little value as it will show only the groundwater depth at that point in time. However, if measured regularly over several years trends in the data can be used to:
assess the future risk of groundwater rising close to the soil surface where it may affect agricultural production;
evaluate the impact of different management practices on groundwater levels; assist in catchment and farm planning; and assist in management decisions such as when to return to cropping after a phase of
perennial pasture.
2.9 Community and government action2.9.1 Farmers, catchment and regional groups for landcareOver the past 10 to 15 years, groups of rural landholders have begun working together to achieve mutual salinity management and environmental goals. Over 700 catchment and landcare-related groups operate throughout Western Australia. They have been developing local strategies and plans and undertaking works in partnership with local and State Government agencies and private organisations, some with support from community landcare coordinators.
The activities of local landholders and groups are important to the implementation of salinity management plans on individual farms and local catchments. Any State strategy will not succeed if action at the local level is not supported.
The capacity of these individuals and groups to achieve change is increasing through a learning process that occurs in the company of their neighbours. There is less risk for individual landholders in trying new approaches for salinity management if they have the involvement of their neighbours, readily available locally-based technical support and the opportunity to learn from other farmers’ successes and failures.
Regional natural resource management groups have evolved in recognition of the need for an integrated, coordinated and ‘systems’ view of natural resource management issues.
They provide an umbrella network for the smaller landcare, environmental and catchment groups and open the possibility of regionally-developed and implemented strategies to address a variety of environmental issues. In the South-West Agricultural Region of Western Australia there are five regional natural resource management groups: The South Coast Regional Initiative Planning Team (SCRIPT), the South West Catchments Council (SWCC), the Swan Catchment Council (SCC), the Avon Catchment Council (ACC) and the Northern Agriculture Catchment Council (NACC). These groups provide the opportunity to develop effective partnerships between the community, industry and government at the regional level, providing the best means to address salinity.
Natural resource management groups must have increased access to information, skills in conflict resolution and group management in order to be most effect in managing land. In particular, such groups need financial support to identify and implement their strategies to protect natural heritage.

Page 30
Background information Salinity in the Classroom
Page 31
Background information Salinity in the Classroom
Several agricultural production groups also focus on salinity management through their activities. They include the Western Australian No-Tillage Farmers’ Association (WANTFA), the Saltland Pastures Association (SPA), the Oil Mallee Association Inc. (OMA), the Western Australian Lucerne Growers (WALG) and others.
2. 9.2 Government actionThe Western Australian Government formally recognised the magnitude of the threat of salinity in Western Australia in November 1996 with the release of a Salinity Action Plan with a 30 year vision to address dryland salinity in the State. The State Salinity Council was established in early 1997. In April 2000 the Action Plan was updated and replaced by the State Salinity Strategy.
This strategy aims to reduce the impact of salinity in the South-West Agricultural Region of Western Australia. It has as its goals:
to reduce the rate of degradation of agricultural and public land, and where practical recover, rehabilitate or manage salt-affected land;
to protect and restore key water resources to ensure salinity levels are kept to a level that permits safe, potable water supplies in perpetuity;
to protect and restore high value wetlands and natural vegetation, and maintain natural (biological and physical) diversity within the region;
to provide communities with the capacity to address salinity issues and to manage the changes brought about by salinity; and
to protect infrastructure affected by salinity.
Cabinet has established a Standing Committee on Environmental Policy which addresses natural resource management (NRM) and salinity issues. The committee is comprised of the Ministers for Environment and Heritage; Agriculture, Fisheries and Forestry; Housing, Works and Services and Planning and Infrastructure.
Some of the key Government-funded initiatives in the salinity area are:
The Rural Towns ProgramThe Rural Towns Program (RTP) was developed in 1997 as an initiative of the Department of Agriculture under the State Salinity Strategy. It is a community-managed program with policy, broad direction, funding decisions and activities controlled by a Management Committee comprising representatives from the rural community. In March 2002, 37 towns from 34 shires were in the program.
The WA Government allocates $1 million per year to the RTP. For the past three years the Federal Government has also contributed $400,000. Local shires and communities have spent an estimated $1 million per annum in the form of matching funds or in-kind contributions.
The RTP funds on-ground works that the Management Committee agrees contribute to water and salinity management.
Page 30
Background information Salinity in the Classroom
Page 31
Background information Salinity in the Classroom
Rapid Catchment Appraisal The Department of Agriculture will assess more than 2.5 million hectares of land for salinity risk over 2001/2002 and will assess the rest of the agricultural area over the next four years under the Rapid Catchment Appraisal project. This will ensure that all communities in agricultural areas have access to the best available information on salinity management by 2005.
Assessment of risks to natural resources (soils, water, vegetation) will be provided, with options for managing those risks and likely costs (economic, environmental and social).This information will link with regional and local strategies to provide the best information for salinity management. Farming communities will be able to plan with greater confidence. Technical information will include the latest interpretation of satellite images and analysis of agencies’ data using computer modelling tools.
Land Monitor ProjectLand Monitor is an initiative to:
map and monitor changes in the area of salt-affected land from 1988; predict areas at risk from future salinisation; monitor changes in the amount and quality of remnant vegetation and areas of
revegetation from 1988; produce highly accurate digital elevation models (DEM) from which 2 metre
contour intervals can be created; distribute the derived information to the end users and the community; and establish a baseline for continued monitoring.
The project involves State and Commonwealth agencies and will be completed in 2002. Information will be updated at regular intervals.
Water Resource Recovery CatchmentsThe Water & Rivers Commission is working with the community to plan, fund and act on the salinity management of existing and future water supplies in key water resource catchments, namely the Wellington Reservoir (Collie River), and the Warren, Kent and Denmark Rivers.
The target is for the Collie River inflow to the Wellington Dam to be drinking quality water (500 mg/L) by 2015. The targets for the Kent and Warren Rivers are for fresh water at sites suitable for future dams.
Water quality in the Helena and Denmark Rivers is regularly monitored and recommendations made on requirements for action on salinity control.
Natural Diversity Recovery CatchmentsThe Department of Conservation and Land Management is implementing a coordinated Natural Diversity Recovery Program. This program already targets the Toolibin Lake, Lake Muir-Unicup system, Lake Warden system, Lake Bryde-East, Lake Bryde catchments, the Buntine-Marchagee system and the Drummond Nature Reserve.
The Natural Diversity Recovery Program will continue to target catchments based on the biological survey findings. Other initiatives are listed in the Salinity Strategy and on Salinity Council’s website.

Page 32
Background information Salinity in the Classroom E C activities & worksheets Salinity in the Classroom
Page 1
Local Governments are actively involved in the Salinity Council of Western Australia and are developing their role in salinity and natural resource management in the regional framework.
2.9.3 Non-government and industry organisationsMany non-government and industry organisations play a major role in salinity management, through on-ground work or through their influence on policy and their role in creating links between organisations and increasing awareness. Some of these are:
Conservation Council of WA Greening Australia, Western Australia World Wide Fund for Nature ALCOA World Alumina Australia Western Australian Farmers’ Federation Pastoralists and Graziers Association Inc.
2.9.4 Research and development organisationsGiven the complex nature of the salinity problem and the major changes to current farming and land use practices required to manage the problem, salinity management is heavily dependent on research and development.
Groups involved in ongoing research and development include the agencies, Department of Agriculture, Department of Conservation and Land Management (CALM), the Water & Rivers Commission, CSIRO, the Universities (University of Western Australia, Curtin, Murdoch and Edith Cowan), Cooperative Research Centres, Commonwealth Research and Development Corporations (Land & Water Australia, GRDC, RIRDC, MLA).
The Cooperative Research Centre for the Plant-based Management of Dryland Salinity was funded for seven years commencing in 2001/2002. It is situated at UWA and has nodes across Australia.

Early Childhood(typically kindergarten to year 3)
Activities and Worksheets
Section 3
Section 3
Page 32
Background information Salinity in the Classroom E C activities & worksheets Salinity in the Classroom
Page 1
Teacher information and key messages relating to salinity for use with the Big Book ‘Bilbies, salinity & A Question of Balance’.
Page 1. This illustration shows a healthy and balanced ecosystem with numerous native animals, insects, trees and shrubs and the watertable is at a safe low level. The Aborigine is an integral part of this ecosystem. A cross-section of the land shows the soil profile. This soil contains numerous living organisms, rocks and deep roots, which are essential for healthy soils. Also within this soil profile are the sleeping ‘Salt Monsters’ - representing salts stored in the soil. The Bilby is sitting under his favourite tree watching a sailing ship on the horizon. This ship heralds the coming of the Europeans and a change to the established way of life.
The key points are: all plants and animals exist in carefully balanced ecosystems with complex
interdependencies; the water that people need for drinking, washing and other household activities
and the water that many industries use in processing comes from waterways and groundwater. These water resources must be protected to ensure their availability;
water systems are usually considered in terms of catchments, which are areas of land that drain into a common creek or river. The catchment of the river in the picture is almost totally covered by vegetation;
the likelihood of water quality issues (including salinity) depends on many factors, including rainfall, landscape, soil types and land use;
salinity occurs in many parts of the world, and is found throughout eastern, southern and south-western parts of Australia;
secondary salinity problems (either irrigation salinity or dryland salinity) have existed in some parts of the world for thousands of years, and in Australia since the first settlers started clearing land extensively. Some areas in Australia are naturally saline (e.g. some salt lakes);
salt as we know it in WA is generally made up of sodium (Na+), chloride (Cl-) and sometimes other ions. It is part of the Australian landscape, having been deposited over millions of years by rainfall or wind and accumulated in the soil profile; and
prior to European settlement, native vegetation used or intercepted most of the annual rainfall. Very little water seeped past the root zone to recharge the groundwater.
Page 2. The European settlers used farming techniques that had previously been used in European climates and conditions. They brought with them new plant species and animals for agriculture. The land was cleared and ploughed and deep-rooted trees and shrubs were gradually replaced with shallow-rooted plants such as wheat, barley, clover and ryegrass. These agricultural practices impacted on the native flora and fauna, by reducing habitat area, introducing competitors and disease. Within the soil profile the sleeping ‘Salt Monsters’ are beginning to awaken. It is important to note that salinity is caused by a water (hydrological) imbalance. Excess water seeps past the root zone (recharge) and leads to raised groundwater levels. This brings the stored salt to the surface or into waterways (discharge). Plants take up water (surface and groundwater) through their roots and pass it back into the air through their leaves (transpiration). Salinity in our waterways and on land is a widespread problem and getting worse. As groundwater rises, the salt solution will eventually reach the surface through capillary action. It will add water and salts to existing rivers and even create new waterways. Land affected by salt and cleared of vegetation often forms large, bare ‘pans’
E C activities & worksheets Salinity in the Classroom
Page 2
E C activities & worksheets Salinity in the Classroom
Page 3
and when rain falls on these areas it is carried downhill into streams and dams. Streams and rivers fed by this saline run-off are gradually degraded with serious effects on plant and animal life.
The key points are: excess salt in soils can affect the soil structure; this depends on the soil type; rural communities are dependent on the economic benefits derived from
agriculture; producing crops and other primary products for internal and export markets
requires large-scale agriculture that is traditionally focused on annual crops and pastures. The development of agriculture has required the broad scale removal of natural vegetation in many areas;
agriculture produces major economic benefits for Western Australia, through domestic and international markets for our primary produce; and
excess salt in the soil affects soil structure and the ability of plants to extract water and nutrients. Saline areas are unsuitable for many traditional crops and pastures and for many native plants.
Page 3. As the population grew, demands for agricultural land grew to meet production targets. The Government encouraged the uptake and clearing of ‘new’ land for agriculture. This growth resulted in more cleared land and less native bush. Areas for animal habitat became smaller and more weed-infested. As technology developed, tractors began to replace the more traditional farming practices, increasing the ability to farm larger areas. New infrastructure was required to transport people and produce.
More shallow-rooted plants (annuals - wheat, barley, pastures) replaced deep-rooted (perennial) native vegetation. The ‘Salt Monsters’ were being pushed closer to the surface of the land by rising groundwater. Salinity impacts on land, water, biodiversity, infrastructure and people. Fringing vegetation, that is plants on banks and foreshores of waterways, is being lost. In the South-West, around 70% of this vegetation has now disappeared, with much of this from salinity as well as direct clearing. Many plants and algae are sensitive to salt and may be killed by salinities of 1,000 to 2,000 mg/L (marginal/brackish). Diverse fringing vegetation is then replaced by just a few salt-tolerant succulents, weeds and introduced grasses. Severely affected areas may become completely bare.
The key points are: the water cycle describes the movement of water from the ocean into the
atmosphere (by evaporation), onto the ground (by condensation and precipitation), back to the ocean via soil and waterways and back to the air through plants (transpiration);
the water balance was in a state of equilibrium; this natural balance can be upset by land use patterns such as replacing deep-
rooted perennial native plants (high water users) with shallow-rooted annual crops and pastures;
increased water run-off from roads and buildings which allows ‘leakage’ to the groundwater;
the groundwater will eventually find a new balance (or equilibrium) but around six million hectares may become salty in the meantime;
salt dissolved in water can affect the take-up of water by plants (at a cellular level);

E C activities & worksheets Salinity in the Classroom
Page 2
E C activities & worksheets Salinity in the Classroom
Page 3
excessively saline water is unsuitable for most native plants and animals, leading to loss of terrestrial and aquatic biodiversity that cannot be replaced; and
rising groundwater can damage the foundations of buildings, roads, railways and other infrastructure.
Page 4. This illustration shows the devastating effects of salinity. The ‘Salt Monsters’ have reached the surface of the land. Nothing but a few salt-tolerant plants are able to survive. The farmer and the Bilby are both struggling to survive. The Bilby has no native habitat or food and the farmer is unable to grow crops or use her land productively. Salinity has affected over 80% of waterways in the South-West and more than a third of them are brackish or saline and no longer suitable for domestic, agricultural or some industrial uses. In short, the water is undrinkable and unusable for irrigation. As salinity affects the health of waterways, they are no longer able to support fishing, leisure, tourism, business and farming, and the land around the waterways is worth less money. The landscape begins to look unattractive and degraded and of particular importance it does not work effectively.
The key points are: different landscape features can affect recharge and discharge; recharge is usually greatest on valley sides and discharge is usually greatest in valley floors;
salt dissolves in water; saline water is a better conductor of electricity than fresh or distilled water; and
severely affected soils become bare and salt crusted, or greasy and wet. White salt crystals can often be seen on the surface.
Page 5. Management options for salinity are being undertaken at many levels. Salinity is a difficult problem to manage and it is important that individuals, communities, governments and non-government organisations work together to manage this problem. Many of the tools we can use to help fight salinity on farms and in towns relate to or impact on how we manage water. For example, planting deep-rooted trees, perennial pastures, rotating crops, high-water use activities and engineering works can all be used. However, one of the main problems into the future is that the full effect of salinity has not been reached or, in some cases, even known.
The key points are: all levels of government are involved in salinity management, from Federal and
State Government agencies through to local shires; both the Federal Government and the State Government provide funding for
salinity management; scientific and research organisations such as CSIRO and the Cooperative Research
Centre for Plant-based Management of Dryland Salinity are involved in developing new management options and improving existing options;
non-government organisations, industry groups and individual land managers do a lot of work on the ground to manage salinity; and
community organisations such as catchment groups consist of interested community members working together on on-ground salinity management projects.
E C activities & worksheets Salinity in the Classroom
Page 4
E C activities & worksheets Salinity in the Classroom
Page 5
Pages 6 and 7. Salinity can’t be ‘solved’ easily in the short-term, but we can manage the water balance by reducing recharge and managing discharge. There are also numerous ways in which we can measure salinity levels to assist in the collection of data for different management options.
The key points are: different management options will have different long and short-term economic
impacts that must be taken into account; different management options will be more or less suitable for particular
landscapes, hydrological situations and land use patterns; depending on the perceived value of the resource, compared to the cost of the
options available, land and water resources that are affected by, or at risk of salinity, may be recovered (returned to pre-saline state), the salinity may be contained (prevented from getting worse) or we may have to adapt to the salinity;
some management options act to reduce recharge (e.g. trees, lucerne), some work to manage discharge (e.g. deep drainage, pumping);
a combination of management options (e.g. agricultural practices, native vegetation management and engineering) will be needed to manage salinity effectively;
desalination of saline groundwater can be an option in some cases, but the costs of desalination need to be taken into account;
the major changes to land-use patterns (e.g. revegetation of farmland, agroforestry, changing agricultural practices) that are required to manage salinity will have important impacts on the social and economic situations of all Western Australians;
the geological structure of the underlying rock profile can be measured using aerial magnetic surveys. This can be useful in predicting where and why salinity occurs;
rising groundwater can be measured and mapped by drilling bores (piezometers) and measuring the distance to the watertable (surface of the groundwater); and
the amount of salt in the soil at various depths can be mapped using electromagnetics (EM38) or by soil testing;
information about soil structure can be measured and mapped using radiometrics or physical analysis;
the salinity level of soil or water samples can be measured using a salinity or electrical conductivity meter; salinity is measured in parts per million (ppm), milligrams per litre (mg/L) or by electrical conductivity (EC) in units such as milliSiemens per metre (mS/m);
salinity levels can be compared by taste or by density measurements; salt water is denser (heavier) than fresh water and may remain separate in rivers or
estuaries with fresh water sitting on top (stratification).
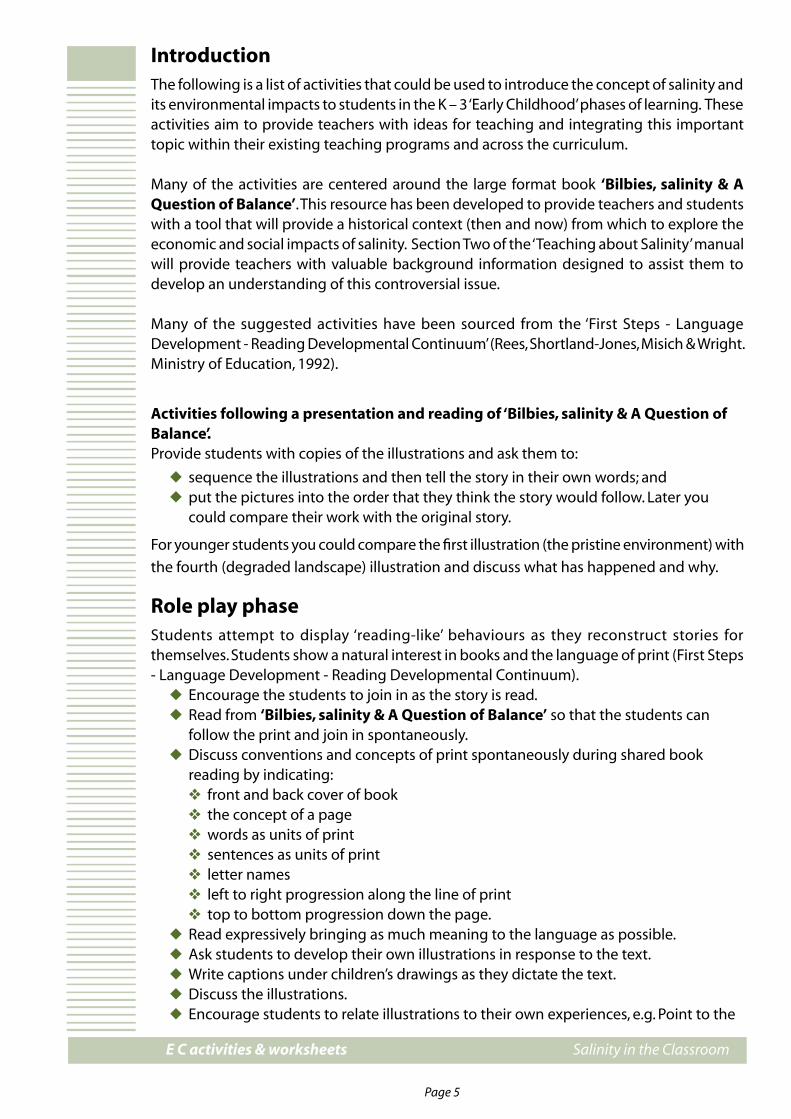
E C activities & worksheets Salinity in the Classroom
Page 4
E C activities & worksheets Salinity in the Classroom
Page 5
IntroductionThe following is a list of activities that could be used to introduce the concept of salinity and its environmental impacts to students in the K – 3 ‘Early Childhood’ phases of learning. These activities aim to provide teachers with ideas for teaching and integrating this important topic within their existing teaching programs and across the curriculum.
Many of the activities are centered around the large format book ‘Bilbies, salinity & A Question of Balance’. This resource has been developed to provide teachers and students with a tool that will provide a historical context (then and now) from which to explore the economic and social impacts of salinity. Section Two of the ‘Teaching about Salinity’ manual will provide teachers with valuable background information designed to assist them to develop an understanding of this controversial issue.
Many of the suggested activities have been sourced from the ‘First Steps - Language Development - Reading Developmental Continuum’ (Rees, Shortland-Jones, Misich & Wright. Ministry of Education, 1992).
Activities following a presentation and reading of ‘Bilbies, salinity & A Question of Balance’.Provide students with copies of the illustrations and ask them to:
sequence the illustrations and then tell the story in their own words; and put the pictures into the order that they think the story would follow. Later you
could compare their work with the original story.
For younger students you could compare the first illustration (the pristine environment) with
the fourth (degraded landscape) illustration and discuss what has happened and why.
Role play phase Students attempt to display ‘reading-like’ behaviours as they reconstruct stories for themselves. Students show a natural interest in books and the language of print (First Steps - Language Development - Reading Developmental Continuum).
Encourage the students to join in as the story is read. Read from ‘Bilbies, salinity & A Question of Balance’ so that the students can
follow the print and join in spontaneously. Discuss conventions and concepts of print spontaneously during shared book
reading by indicating: front and back cover of book the concept of a page words as units of print sentences as units of print letter names left to right progression along the line of print top to bottom progression down the page.
Read expressively bringing as much meaning to the language as possible. Ask students to develop their own illustrations in response to the text. Write captions under children’s drawings as they dictate the text. Discuss the illustrations. Encourage students to relate illustrations to their own experiences, e.g. Point to the

E C activities & worksheets Salinity in the Classroom
Page 6
E C activities & worksheets Salinity in the Classroom
Page 7
illustration and ask ‘Which creature is the Bilby? Why do you think there is a sailing ship on the horizon?’ etc.
Encourage students to predict what the story is about after looking at the cover and the title of the big book.
Encourage students to use the illustrations to predict what might happen next.
Encourage students to retell stories from illustrations and from memory.
Experimental phaseStudents use memory of familiar texts to match some spoken words with written words. The student realises that print contains a constant message and begins printing words (First Steps – Language Development – Reading Continuum’).
Ask students to match words in the text with words in the environment. Develop activities from charted stories. What is the sound of “s” in these words? sit, ship, salt Continue to transcribe students’ oral language for the purpose of teaching reading;
Use the text for sequencing activities, cloze activities, development of sight word vocabulary, letter matching games.
Plan related activities after reading to help deepen and extend students’ understanding, e.g. art, craft, writing.
Read part of a story to the students, then ask them to draw a picture of what they think will happen next.
Help students to focus on the structure of a story, i.e. beginning, middle, end. Encourage students to talk about why they liked or disliked a particular page or section. Ask children to point out something they noticed during a shared reading of the
book, e.g. repetition, letter of own name, illustration detail. Encourage students to make predictions about the story from the title only. Encourage students to use the illustrations to predict what might happen next. Encourage students to identify the main idea of the story through the use of the
title and illustrations. Involve students in cloze activities during shared book sessions. At first omit only
structure words, about one word in twenty. Then move on to omitting some content words along with structure words. Always leave the first sentence intact. (Encourage the students to think of a meaningful replacement, e.g. ‘What will the next word be? Does it make sense; does it sound right?’)
Provide opportunities for students to retell the story from the pictures and from memory.
Provide opportunities for students to arrange pictures or text from the story in
sequence.
Early reading phaseStudents may read slowly and deliberately as they focus on reading exactly what is on the page. Unfamiliar texts may be read word by word. As word recognition increases a wider range of text structures using familiar vocabulary can be read. Readers are beginning to reflect on their own strategies (e.g. For working out unknown words). (‘First Steps – Language Development – Reading Continuum’)
Begin the day by reading ‘Bilbies, salinity & A Question of Balance’ together. (Discuss title, author, and artist. Identify other books on the same or a similar topic. Encourage students to look at the cover and make predictions about the content)
Provide opportunities for students to manipulate and sequence, words, phrases and
E C activities & worksheets Salinity in the Classroom
Page 6
E C activities & worksheets Salinity in the Classroom
Page 7
sentences, after reading a text. Include activities such as: reordering words, phrases and sentences arranging sentences from a text in a logical order and then justifying choices
made completing a prepared cloze on the text using a repetitive phrase from the text to develop own text, e.g. ‘more and more
water’, ‘more and more clearing’... allow time for students to discuss the story they have read.
Ask questions which focus on the author’s craft, e.g. why do you think the author chose a particular word? how do the illustrations help us understand the text?
Model story mapping for the students. (You should think aloud as you explain the process. Show students various examples of maps of familiar stories encouraging them to identify particular features. The students then develop their own maps of a familiar story. These may be used to support them when retelling the story)
Use cloze activities to focus on different aspects of language, e.g. to focus on developing knowledge of basic sight words, delete sight words from a piece of text and place at the top of a page. Children complete the cloze by selecting the appropriate word for the space.
After reading a story ask students to draw a picture of their favourite scene and then retell the story beginning from the part that happened before their picture.
Encourage students to share experiences related to their reading. (Find other books related to environmental topics. Promote discussions before, during and after reading.)
Encourage students to use the illustrations to: predict what may happen next make inferences about character traits identify supporting detail work out unknown words.
Encourage students to substantiate answers and predictions by reading out relevant passages from the text.
Focus on text structure through: comparing several narratives developing story maps modelling different forms of writing for the children having the children identify ‘rules’ for writing different forms asking questions which focus on the author’s craft.
Provide opportunities for students to retell the story from illustrations and from memory.
Ask students to sequence chunks of text and then discuss their arrangement. Ask students to identify all that they know about salinity and then generate a list of
things that they would like to know. (This could also be used before reading a non-fiction text.)
Model both primary and secondary word solving strategies, i.e. use of context and semantic cues: delete words that encourage children to use their semantic knowledge to
predict underline words in context and ask children to explain the meaning find the appropriate word to replace a non-word.

E C activities & worksheets Salinity in the Classroom
Page 8
E C activities & worksheets Salinity in the Classroom
Page 9
Provide activities to follow shared experiences: write stories or poems make a wall story write captions for a mural make an individual, group or class book make a class chart record their experience/thoughts about salinity on tape make an overhead projector transparency about their experience/thoughts (in
words or pictures).
Transitional reading phaseIn the ‘Transitional reading phase’ students begin to integrate a range of reading strategies to make meaning. The reader is becoming more confident in using strategies to comprehend and identify words. They are able to adapt their reading to different types of text. ‘First Steps – Language Development – Reading Continuum’.
Students focus on story title and illustrations to make predictions. (This can be small group or whole class activity).
Students work in small groups, listing their predictions and discussing focus questions such as, What do you think this story will be about? What kind of book do you think it will be?
Students relate the theme of the book to their own experiences/thoughts. Students work with you to develop a semantic map related to the topic or theme of
the book (‘Bilbies, salinity & A Question of Balance’) before reading, e.g.
Students work with you to prepare ‘What we know’ and ‘What we want to know’ charts. Students confirm or reject initial predictions. Students discuss their initial predictions and then read aloud the section of the text
that substantiates them. Students make further predictions, i.e. predict how the story will end. Students read part way through a story and then draw a cartoon or picture of how
they think the story will end. Discuss pictures and then complete the story. Students read to find the main idea of a paragraph. In small groups or working with partners, students retell the story. Cooperative cloze. Students interact on a cloze activity to suggest appropriate
words to fill the gaps (discussion is a very important part of this activity). Individual cloze practice. Students complete cloze activity individually and then get
together to discuss choices. (Prepare cloze by deleting every 10th, 7th or 5th word leaving the first and last sentence intact.)
Text sequencing. (Cut the story into sections.) The students are asked to arrange the story in its correct sequence and then justify their arrangement.
Storymap. Students develop a map that shows the sequence of events and identifies particular excerpts from the story. Students should have the opportunity to explain their map. A student can also use the story map when s/he is retelling the story.
Students write a follow-up story (using a variety of genres i.e. adventure, mystery,

E C activities & worksheets Salinity in the Classroom
Page 8
E C activities & worksheets Salinity in the Classroom
Page 9
love etc.) using cartoons and captions they have developed. Students select particular characters from the story and discuss what these
characters might say after the story. Students can then draw speech bubbles and write in the conversation.
Students complete a story summary focusing on who, what, when, where. Students focus on a particular a character in the story (i.e. the Bilby) and write a
letter to another character (the Farmer). Students develop crossword puzzles based on text from the story.
By using ‘First Steps - Language Development: Writing Learning Continuum’ as a guide you can incorporate the teaching forms of writing, (e.g. Narrative, Recount, Procedure, Description, Report, Explanation and Exposition) to enhance the activities that have been outlined above. Or, you can use these forms of writing to follow on from one of the activities outlined below. Again, using ‘Bilbies, salinity & A Question of Balance’ as your focus the following themes and activities can be incorporated into your teaching programs.
The following activities are based around concepts relating to the topic of salinity and can be used and adapted for K – 3 students.
1 The water cycle
Background informationThere will never be any more fresh water than there is now. No new water is made and water cannot escape from earth. The water we use is recycled over and over again. As the sun heats the seas and lakes, millions of litres of water rise into the air as invisible water vapour. This is known as evaporation. As the vapour rises it cools and turns back into tiny water droplets, forming clouds, some of which are blown inland. The droplets joining together is called condensation. Eventually, the joined droplets fall as rain. The rain soaks into the ground or runs off the land into rivers, which eventually flow back into the sea, and the cycle is repeated. ‘Watercare – A curriculum resource for Schools’. National Landcare Program.
Activities: ask students to consider the following question: ‘Where does our water come from?’; discuss with the students the topic of water and the types of environments that
water can be found in. Brainstorm and blackboard student responses. For example: We think water comes from...
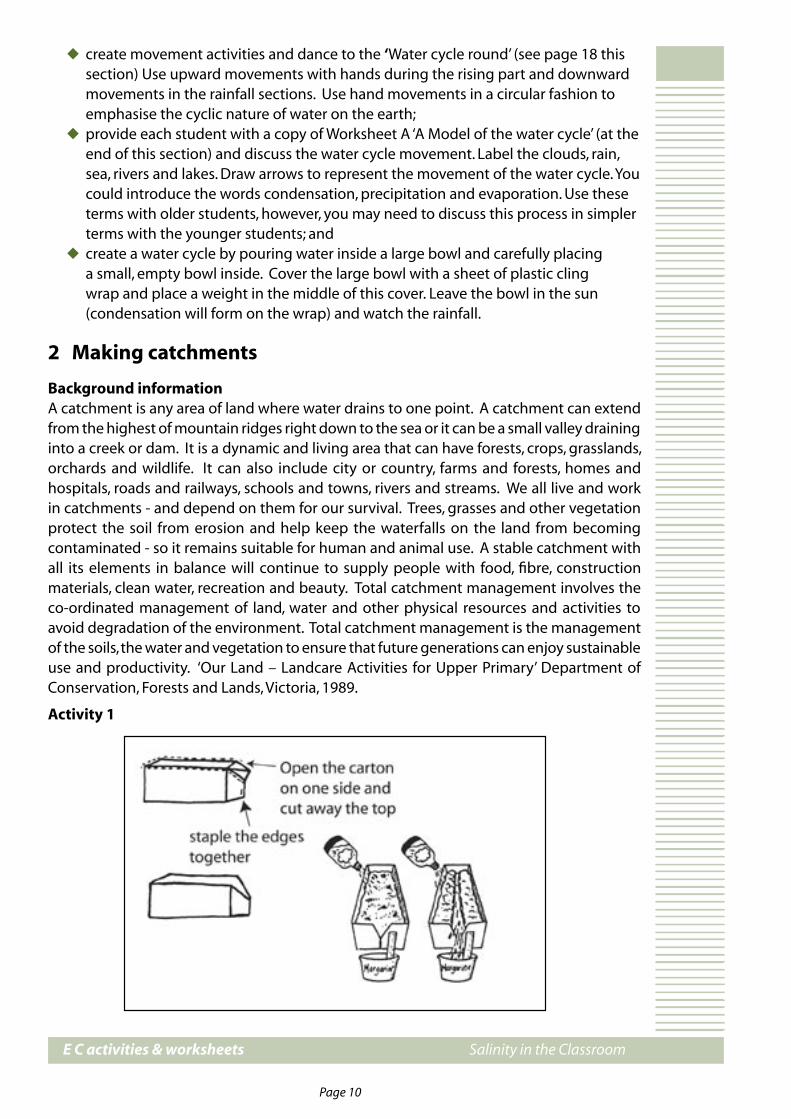
E C activities & worksheets Salinity in the Classroom
Page 10
E C activities & worksheets Salinity in the Classroom
Page 11
create movement activities and dance to the ‘Water cycle round’ (see page 18 this section) Use upward movements with hands during the rising part and downward movements in the rainfall sections. Use hand movements in a circular fashion to emphasise the cyclic nature of water on the earth;
provide each student with a copy of Worksheet A ‘A Model of the water cycle’ (at the end of this section) and discuss the water cycle movement. Label the clouds, rain, sea, rivers and lakes. Draw arrows to represent the movement of the water cycle. You could introduce the words condensation, precipitation and evaporation. Use these terms with older students, however, you may need to discuss this process in simpler terms with the younger students; and
create a water cycle by pouring water inside a large bowl and carefully placing a small, empty bowl inside. Cover the large bowl with a sheet of plastic cling wrap and place a weight in the middle of this cover. Leave the bowl in the sun (condensation will form on the wrap) and watch the rainfall.
2 Making catchments
Background informationA catchment is any area of land where water drains to one point. A catchment can extend from the highest of mountain ridges right down to the sea or it can be a small valley draining into a creek or dam. It is a dynamic and living area that can have forests, crops, grasslands, orchards and wildlife. It can also include city or country, farms and forests, homes and hospitals, roads and railways, schools and towns, rivers and streams. We all live and work in catchments - and depend on them for our survival. Trees, grasses and other vegetation protect the soil from erosion and help keep the waterfalls on the land from becoming contaminated - so it remains suitable for human and animal use. A stable catchment with all its elements in balance will continue to supply people with food, fibre, construction materials, clean water, recreation and beauty. Total catchment management involves the co-ordinated management of land, water and other physical resources and activities to avoid degradation of the environment. Total catchment management is the management of the soils, the water and vegetation to ensure that future generations can enjoy sustainable use and productivity. ‘Our Land – Landcare Activities for Upper Primary’ Department of Conservation, Forests and Lands, Victoria, 1989.
Activity 1

E C activities & worksheets Salinity in the Classroom
Page 10
E C activities & worksheets Salinity in the Classroom
Page 11
Raindrops land on the ground and are soaked up by the soil and litter. However in heavy rain some water will run down slopes and wash soil away. In this experiment you will make different catchments to see how running water causes soil erosion. Using milk or juice cartons - have the pouring side face up and cut the section marked in the diagram.
1 Fill the cartons with soil. Place a layer of mulch material (leaves, bark, sawdust, twigs, grass clippings etc.) over the soil in one of the cartons.
2 Incline the two cartons to represent a slope. Place margarine containers at the base. Now you have two different catchments. Sprinkle the same amount of water over each catchment and measure the time it takes for the water to flow into the containers at the base. Measure the amount of water in the containers. Discuss with the students which catchment is more likely to have soil erosion problems and why?
Activity 2
To observe which surface (a bare or grassed soil surface) absorbs water more quickly find and define (using rulers or sticks) a grassed area and a bare soil area.
1 Pour a measured amount of water from a bucket onto the bare patch from a height of 5 cm. Pour it as quickly as you can without letting it spread outside the measured patch. Using a stopwatch time how long it takes for the water to soak in.
2 Carry out the same activity on the grassed area and compare the times and the effect of the water on both areas.
3 Discuss what would happen in a storm - in which situation is water more likely to run off and cause soil erosion?
Activity 3
People, animals and plants share the mountains, rivers and soil and what happens in one part of the catchment will affect another part. For example, when hills are cleared of trees, soil washes away and ends up blocking the rivers and making the water dirty. In this activity you will be able to plan and make your own model catchment.
1 Prepare a milk carton as discussed in the first activity above. 2 Fill the carton with soil. 3 Shape some hills and a riverbed in the soil. 4 Plan your catchment so that the soil will be protected. 5 Using the diagram below as a guide, determine the best areas to plant trees and the
areas that will be used for farming. Cress can represent trees; wheat or lawn seed can be used for pastures.
6 Using a sieve, gently sift a thin layer of soil where you will be planting the seeds. Sprinkle the seeds onto the soil and cover them with another layer of sifted soil. Water using a fine spray.
7 Place cartons on a tilt in a warm sheltered position and keep moist. When the seeds have germinated you will be able to add plastic models or make your own cardboard or plasticine cut outs.

E C activities & worksheets Salinity in the Classroom
Page 12
E C activities & worksheets Salinity in the Classroom
Page 13
Activity 4
Prepare two pots - one with a plant growing and the other with bare soil. Put each pot on top of a clear container (covered with strong mesh) to observe the run-off. Each day water each pot with approximately 1 cup of water. Ask students to observe, measure and record how much water seeps through the pots. (The pot with the plant in it should absorb some of the water through its root system and therefore have less in the clear container. The pot with the soil will have a greater amount of water in the clear container due to run-off.) This activity demonstrates the difference between a healthy vegetated (native) catchment (specifically deep- rooted perennial vegetation) and a barren eroded catchment. The plant life in a vegetated (native) catchment will use a high level of water, thereby ensuring that large amounts of excess water will not enter the underground watertable. Whereas in a catchment with little vegetation cover, a large amount of water will enter the watertable causing it to rise. This rising watertable brings with it the underground salt, which is the major cause of Western Australia’s salinity problem.
3 Vegetation, Clearing and Rising Groundwater
Background information
VEGETATION NOW AND THENPioneers .. and good intentions.
As European settlers spread through out Australia during the 1800s, they cleared land for the crops and stock needed to feed our growing population. Large areas of forest were also cut down to provide timber for building mines and for building the houses that sprang up in their wake. Towards the end of the 1800s, many trees ended up as railway sleepers, or as fuel for boilers in steam trains. Then, after World War 1, we opened up parts of Australia to returned soldiers who were given land for agricultural purposes.
Although the intention behind all of this pioneering activity was good, the early settlers had little understanding of the consequences of their actions for later generations. The total land area of the agricultural south west WA is about 34 million hectares and the total amount of remaining vegetation cover is now about 6 million ha. In the wheatbelt possibly less than 5% of the original cover remains.
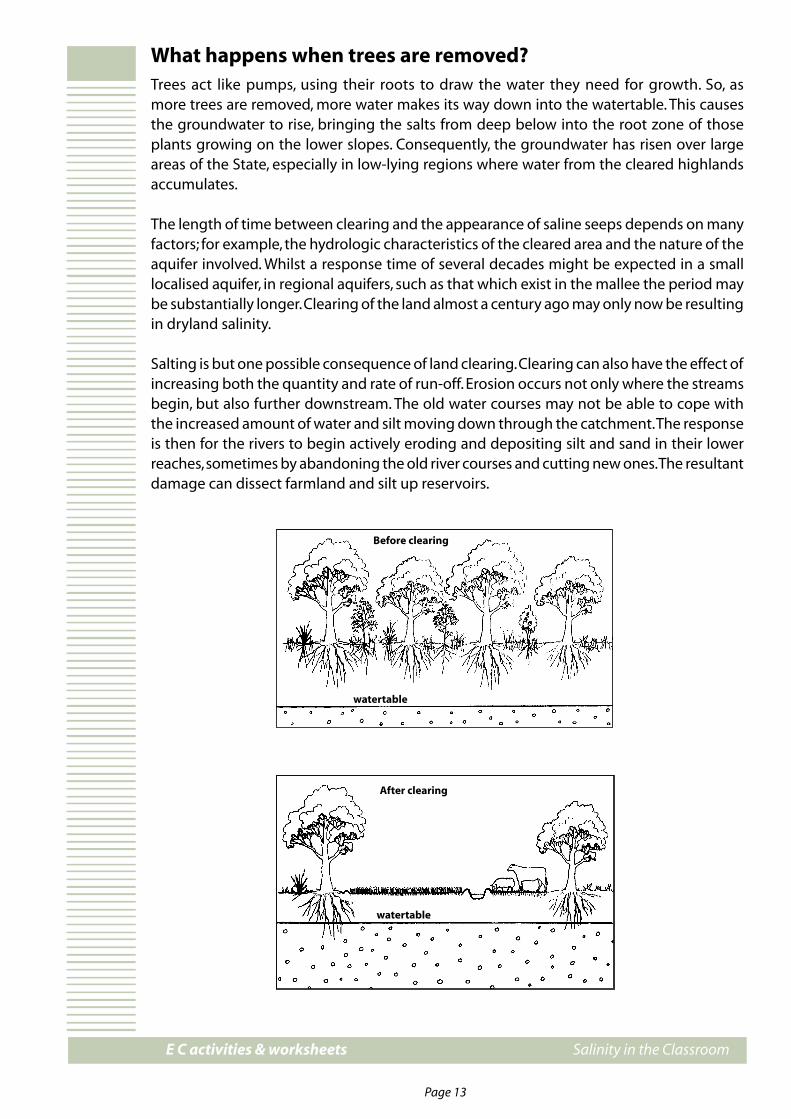
E C activities & worksheets Salinity in the Classroom
Page 12
E C activities & worksheets Salinity in the Classroom
Page 13
What happens when trees are removed?Trees act like pumps, using their roots to draw the water they need for growth. So, as more trees are removed, more water makes its way down into the watertable. This causes the groundwater to rise, bringing the salts from deep below into the root zone of those plants growing on the lower slopes. Consequently, the groundwater has risen over large areas of the State, especially in low-lying regions where water from the cleared highlands accumulates.
The length of time between clearing and the appearance of saline seeps depends on many factors; for example, the hydrologic characteristics of the cleared area and the nature of the aquifer involved. Whilst a response time of several decades might be expected in a small localised aquifer, in regional aquifers, such as that which exist in the mallee the period may be substantially longer. Clearing of the land almost a century ago may only now be resulting in dryland salinity.
Salting is but one possible consequence of land clearing. Clearing can also have the effect of increasing both the quantity and rate of run-off. Erosion occurs not only where the streams begin, but also further downstream. The old water courses may not be able to cope with the increased amount of water and silt moving down through the catchment. The response is then for the rivers to begin actively eroding and depositing silt and sand in their lower reaches, sometimes by abandoning the old river courses and cutting new ones. The resultant damage can dissect farmland and silt up reservoirs.
������ ��������
����������
����� ��������
����������

E C activities & worksheets Salinity in the Classroom
Page 14
E C activities & worksheets Salinity in the Classroom
Page 15
Replanting WA
Despite the variety in plants, all flowering plants have the same basic structure. The main parts are the roots, stems, leaves and flowers. Each of these parts carries out its own special functions, so that the plant as a whole is able to grow and reproduce itself.
The principal function of the roots is the absorption of water and dissolved substances from the soil. These dissolved substances are called mineral salts. The solutions are conducted up the stems to the leaves through a system called xylem (pronounced zy-lem) vessels.
A living plant does not retain all the water it receives from the soil; much of it evaporates into the atmosphere through tiny openings in the leaves called stomata. This process is called transpiration. It is essential to the life of the plant since this water movement helps to pull solutions up the stem, providing rigidity for the plant. If the leaves are removed the roots absorb water at a much slower rate.
Plants are able to pump enormous quantities of water from their roots right up to their leaves so that it is released as water vapour into the atmosphere. When vegetation is cleared there are no natural pumps to do this job and the land begins to suffer with rising groundwater. Rising groundwater causes salt to rise also; this damages the land by causing salinity.
ActivitiesYou or your students can carry out two simple experiments that will provide evidence of how water travels through plants.
Experiment 1. Under supervision ask the students to place a freezer bag over part of a plant in the school garden and secure with a twist tie. Alternatively, they can place the freezer bag over a pot plant and tie. Next day ask students to guess what might have taken place overnight. Students should then observe the bag, and carefully remove it. Discuss with them the outcome of the experiment and ask them to record (either by sketching or writing) their observations.

E C activities & worksheets Salinity in the Classroom
Page 14
E C activities & worksheets Salinity in the Classroom
Page 15
Experiment 2. Place a stick of celery onto a cutting board and carefully cut straight across the base. Place this end into a jar containing food dye dissolved in water. Ensure the celery stick stands upright. Leave overnight. Ask students to describe the steps taken in the experiment (either sketch or write) and record their observations. The video ‘My First Green Video - a practical and fun guide to protecting our environment’ (should be available through your local Resource Centre) provides a practical demonstration of this activity.
This activity can be used as an extension activity to the previous celery experiment.1 Carry out the previous celery experiment and compare it with a celery stick
that has been placed in a solution of coloured salty water. This activity could be further extended by using two living plants - one plant is placed in distilled water and the other plant placed in a solution of salty water. Students can regularly record (measure, sketch or photograph) the growth pattern of both plants. Another variation of this activity could be carried out using seeds which are growing the same soil under the same conditions until they reach approximately 5 to 10 cm. At this stage a salt contaminant can be introduced. Students can record (write, sketch or photograph) the different growth responses.
This activity can be used to investigate the effect of salinity on crop germination. (Bean and Sunflower seeds are suggested. However, seeds of barley, alfalfa (lucerne), wheat, oats, mung beans and millet are good alternatives). 1 Place filter paper in the bottom of several petri dishes (Note: for the younger
students compare two groups; watering with distilled water and watering with a salty solution. As the students get older you may like to introduce a few more salt solutions at different concentrations e.g. slightly salty water - add 1 teaspoon of salt; extremely salty water - add 10 teaspoons of salt). Spread a number of different variety seeds across the filter paper in all of the petri dishes.
2 Add distilled water to one group of seeds (beans and sunflowers) to moisten the seeds - excess water is not necessary. Add the salt solution to the other group of seeds. (e.g. alfalfa (lucerne), mung beans) and cover each dish with plastic cling wrap to prevent them drying out.
3 Place the dishes on a bench in a safe place (they do not need to be in direct sunlight).
4 Check every two days and add solution as necessary to keep the seeds moist. At each check, count the number of germinated seeds. Record over a one to two week period. Record the results in a graph form. Discuss the effect that salt has on seed germination and what the implications for this are in relation to agricultural land and crops.
Groundwater discussionGroundwater is the name given to water found underground.
Ask students ‘How do we know there is water underground?’ The following information will provide assistance in determining the direction the discussion will take:
plants extract groundwater though their roots; a bucket put down a well fills up with water; a spring is where an underground creek comes to the surface;

E C activities & worksheets Salinity in the Classroom
Page 16
E C activities & worksheets Salinity in the Classroom
Page 17
a deep hole may fill up with water; the watertable is the upper level of the
groundwater. Watertable depth is the distance from ground level to the top of the groundwater. A watertable at 2 metres means that the groundwater is 2 metres below the surface;
in many parts of Australia the watertable is rising. This means that groundwater is moving closer to the surface. It is dangerous when the watertable is less than 2 metres from the surface, as this can cause waterlogging and bring salts into the plant root zone; and
explain that replacing big thirsty trees that have deep roots with shallow-rooted crops (e.g. wheat, corn and most grasses) means that less groundwater is used. The excess water stays underground. The ground is like a bath that is slowly filling up with water. The water has nowhere to go except to slowly seep to the surface, bringing the salt with it. This makes the soil and water salty.
These activities are designed so that students will understand that salt in water or soil is not always visible.
‘The visible and the invisible’ demonstrates to students that salt is not readily seen in the water and that polluting materials are either dissolved or suspended in water. Suspended contaminants are much easier to remove than dissolved contaminants. 1 Fill three glass jars with water. 2 Place a teaspoon of table salt into a jar and stir. Note (record, discuss or
photograph) what happens to the salt. 3 Place a teaspoon of chalk or talcum powder into another jar. Observe the
powder, dispersed and visible in the jar. 4 Discuss with students. Which material dissolved and which was suspended.
Which material would be easier to remove. How would we detect the presence of the salt in the water?
5 You may like to follow-up the activity and remove the suspended powder by using a sand filter (see what happens when you try to remove the salt with the same filter. Ask the students the following questions: If you left the salt solution to evaporate over time would you end up with salt crystals at the bottom of the container? Is this what happens to the surface of the soil if the salt has risen to the top?
A follow up activity is to allow the salt solution to evaporate and discuss what is left behind. You could then compare this to the surface of saline soil.
Allow students to taste water that has a known concentration of salt - compare it with distilled water that has no addition of salt. (Activities 7,18 Section Four) The students could discuss which sample they liked or disliked. They could also try to predict by observation only which sample was salty and which sample was not. Further discussion could take place by encouraging students to imagine what would happen if they were plants and were watered with salty water. They could also discuss how micro organisms that live in the soil would react to being watered
with salty water.
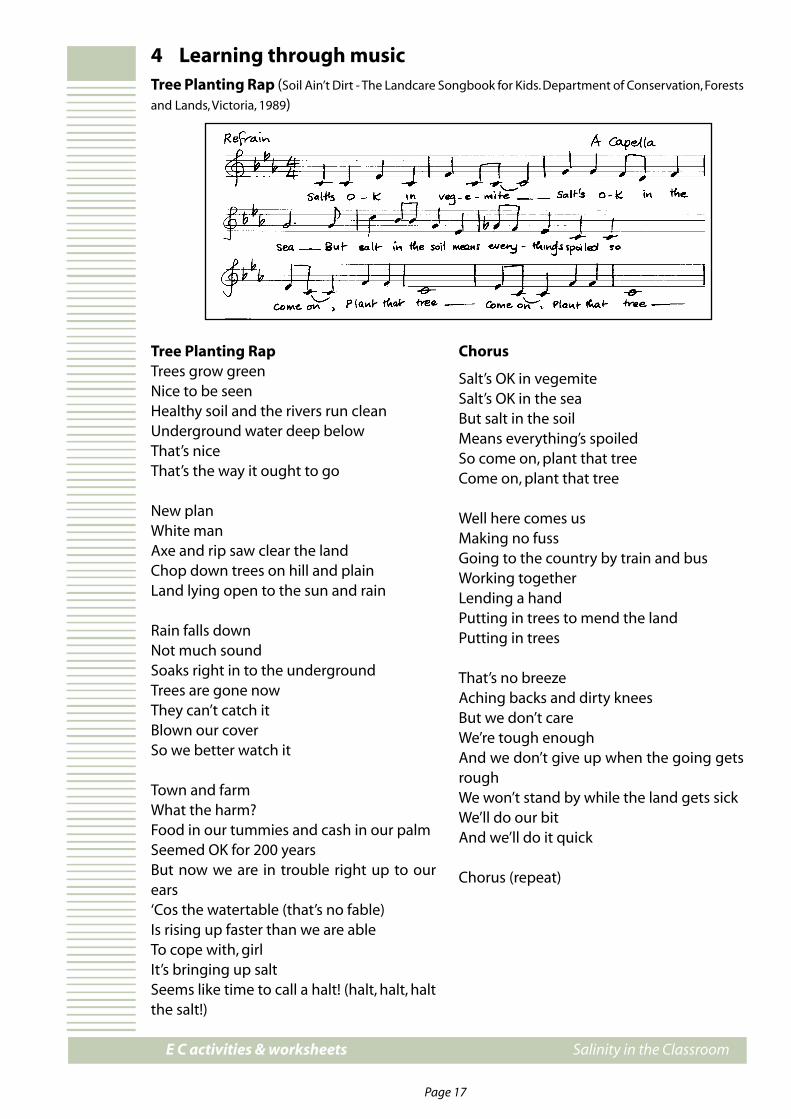
E C activities & worksheets Salinity in the Classroom
Page 16
E C activities & worksheets Salinity in the Classroom
Page 17
4 Learning through musicTree Planting Rap (Soil Ain’t Dirt - The Landcare Songbook for Kids. Department of Conservation, Forests
and Lands, Victoria, 1989)
Tree Planting RapTrees grow greenNice to be seenHealthy soil and the rivers run cleanUnderground water deep belowThat’s niceThat’s the way it ought to go
New planWhite manAxe and rip saw clear the landChop down trees on hill and plainLand lying open to the sun and rain
Rain falls downNot much sound Soaks right in to the underground Trees are gone now They can’t catch it Blown our cover So we better watch it
Town and farm What the harm? Food in our tummies and cash in our palm Seemed OK for 200 years But now we are in trouble right up to our ears ‘Cos the watertable (that’s no fable) Is rising up faster than we are able To cope with, girl It’s bringing up salt Seems like time to call a halt! (halt, halt, halt the salt!)
Chorus
Salt’s OK in vegemiteSalt’s OK in the sea But salt in the soil Means everything’s spoiled So come on, plant that tree Come on, plant that tree
Well here comes us Making no fuss Going to the country by train and bus Working together Lending a hand Putting in trees to mend the land Putting in trees
That’s no breeze Aching backs and dirty knees But we don’t care We’re tough enough And we don’t give up when the going gets rough We won’t stand by while the land gets sick We’ll do our bit And we’ll do it quick
Chorus (repeat)
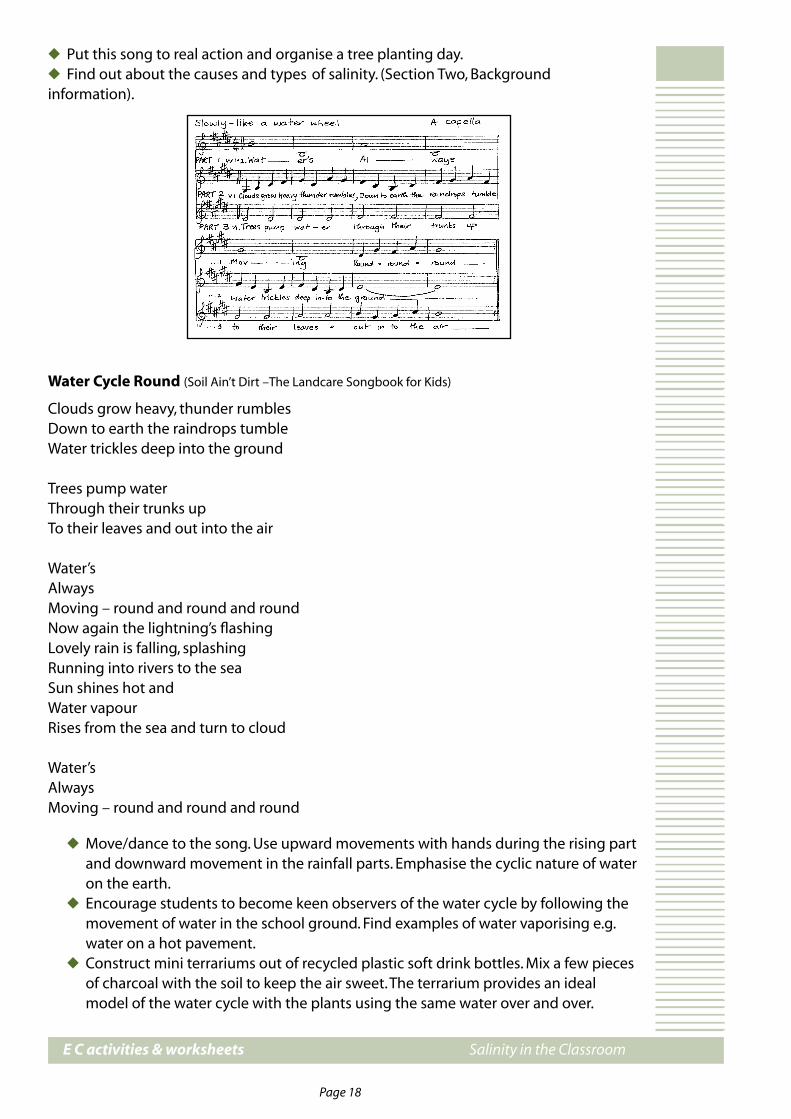
E C activities & worksheets Salinity in the Classroom
Page 18
E C activities & worksheets Salinity in the Classroom
Page 19
Put this song to real action and organise a tree planting day. Find out about the causes and types of salinity. (Section Two, Background information).
Water Cycle Round (Soil Ain’t Dirt –The Landcare Songbook for Kids)
Clouds grow heavy, thunder rumbles Down to earth the raindrops tumble Water trickles deep into the ground
Trees pump water Through their trunks up To their leaves and out into the air
Water’s Always Moving – round and round and round Now again the lightning’s flashing Lovely rain is falling, splashing Running into rivers to the sea Sun shines hot and Water vapour Rises from the sea and turn to cloud
Water’s Always Moving – round and round and round
Move/dance to the song. Use upward movements with hands during the rising part and downward movement in the rainfall parts. Emphasise the cyclic nature of water on the earth.
Encourage students to become keen observers of the water cycle by following the movement of water in the school ground. Find examples of water vaporising e.g. water on a hot pavement.
Construct mini terrariums out of recycled plastic soft drink bottles. Mix a few pieces of charcoal with the soil to keep the air sweet. The terrarium provides an ideal model of the water cycle with the plants using the same water over and over.

E C activities & worksheets Salinity in the Classroom
Page 18
E C activities & worksheets Salinity in the Classroom
Page 19
Worksheet A

E C activities & worksheets Salinity in the Classroom
Page 20
Salinity in the Classroom
Page 1
Bibliography
A Taste of Salt. Rivers, Catchments & Salinity. Compiled by Jane Hulme. Salt Action NSW, 2nd Edition, 2000.
First Steps – Language Development – Developmental Continuum. Developed by Diana Rees, Dr Bruce Shortland-Jones, Kerry Misich & Rebecca Wright. Ministry of Education, 1992.
Soil Ain’t Dirt. The Landcare Songbook for Kids. National Soil Conservation Program.Concepts for songs and activities – Catherine Buxton. Department of Conservation, Forests and Lands. Victoria, 1989.
Saltwatch. Involve me and I’ll understand. A curriculum package for schools. Salt Action, Victoria, 1991.
Our Land. Landcare Activities for Upper Primary. National Soil Conservation Program. Victoria, 1989.
Watercare. A Curriculum Resource for Schools. Angela Carter. National Landcare Program and the South Australia Department of Environment and Natural Resources. South Australia, 1996.
Middle Childhood(typically years 4 to 6)
Activities and Worksheets
Early Adolescence(typically years 7 to 10)
Activities and Worksheets
Section 4
Section 4

E C activities & worksheets Salinity in the Classroom
Page 20
Salinity in the Classroom
Page 1
Contents
Activity Activity Focus Page
Topic: What is salinity?1 What is salt? Chemistry of salt 3 2 Types of salt Chemistry of salt 53 The visible and the invisible Dissolved and suspended solids 64 Recharge research Water movement through soil 75 Salt in the soil Salt content of soil 86 Where does salt come from? Evaporation and dissolving salt 117 Travelling with salt Salt rising through the soil 138 Soil structure and salinity Effect of salt on soil structure 149 Water quality Effect of pollution in rivers 1710 Water – a finite resource Water resource issues 20
Topic: How did salinity get into the landscape?11 A model water cycle Model of evaporation, 21 condensation and precipitation 12 Just passing through – cycles Introduces water and soil cycles 2213 The water cycle Parts of the water cycle 2414 Where does the water go? Introduction to run-off in water cycle 2615 Acting out the water cycle Water cycle including run-off 2916 What do trees do? Water movement through plants 3117 Water movement in plants Transpiration 32
Topic: Measuring and monitoring salinity18 Salinity levels Compares salinity levels by taste 3319 Salinity and density Compares salinity using density 3520 Making your own EC meter Measure salinity with an ammeter 3621 Testing for soil salinity Measure salinity in soil samples 39
Topic: Why has salt become a problem?22 Effect of salt on seed germination Salinity and germination 4023 Here comes the salt Introduction to changing land use 4624 The watertable Introduction to rising groundwater causes 4825 Raining tennis balls Effect of clearing/loss of biodiversity 5026 Salt’s on the rise Make model catchment/groundwater 5327 Detective Crow discovers Introduction to salinity problem 55 the Salt Monster 28 Detective Crow and the Salt Story Introduction to salinity causes 5829 Conditions before clearing Introduction to salinity causes 6130 Salt? What salt? Discussion of salinity causes 6331 ‘Insalting’ the earth Cloze on salinity causes 68

Activity
Salinity in the Classroom
Page 2
Support information Salinity in the Classroom
Page 3
Activity Activity Focus Page
Topic: What is salinity?
Topic: The Impacts of salinity32 A quiz for saltwatchers Learn/reinforce terminology 7033 Salinity in Western Australia Introduction to salinity impacts 7134 The salty licorice test Introduction to biodiversity impacts 7435 Salinity questionnaire Consider social impacts of salinity 7736 Salinity - It’s a catchment problem Salinity impacts in figures 7937 Nursery rhymes and fairy stories General impacts of salinity 8138 The fight against salt Debate, impacts/management 82
Topic: Managing salinity39 Good vs poor Consider causes and management 85 catchment management 40 Controlling salinity Consider management options 8741 Reducing salinity Develop management options 9042 Trees as pumps Calculate tree water usage 9243 Desalination Consider desalination option 9544 To clear or not to clear Debate, impacts/management 96
General45 Salty facts General historical 9846 Salt codes General historical 10047 Games to play General 10148 Saltword General 10340 Super salinity puzzle General 10450 Salty search General 10551 Cross-salt General 10652 Super salinity crossword General 108 Crossword answers 110
Activity

Activity
Salinity in the Classroom
Page 2
Support information Salinity in the Classroom
Page 3
What is salt?
Background informationTable salt is a compound. That is, it is a mixture of two elements called sodium (Na) and chlorine (Cl). The chemical name for this compound is sodium chloride (NaCl).
To show that salt is made up of two elements, you or your students can carry out a simple experiment.
Materials 2 pieces of copper wire battery 250 mL beaker (or glass of water) salt
Procedure1 Dissolve 3 tablespoons of salt in the beaker of water2 Fix the copper wire to the contacts of the battery3 Hang the other ends of the copper wire in the beaker of salty water (see diagram below)
You should see tiny bubbles of gas coming from the wire attached to the negative pole of the battery. The sodium (Na+) combines with the water H2O) to form sodium hydroxide (NaOH) and hydrogen (H2) as a gas i.e. the bubbles.
From the wire attached to the positive pole of the battery, a yellowish-green deposit will begin to form. The copper wire (Cu++) and the chlorine (Cl-) combine to form copper chloride (CuCl2).
Did you know that the crystals of table salt (NaCI) are held together by the attraction between the positive sodium ions (Na+) and the negative chloride ions (Cl-)?
An average grain of salt may have 10,000,000,000,000,000 sodium ions and exactly the same number of chloride ions.Table salt is not pure sodium chloride. To make salt free-flowing, one of the following additives is used: sodium aluminosilicate, tricalcium phosphate or magnesium silicate. Iodised salt also contains potassium iodide.
1 EA
2.2, 2.3, 2.3.2, 2.3.3
Activity

Activity Activity
Support information Salinity in the Classroom
Page 4
Support information Salinity in the Classroom
Page 5
1 cont.EA
2.2, 2.3,2.3.2, 2.3.3
What is salt?
Worksheet
Salt equations1 Write the chemical word equation for each of the two reactions that you saw in the experiment.
1 ...........................................................................................................................................................................
2 ...........................................................................................................................................................................
2 Write a balanced symbol equation for each reaction.
1 ...........................................................................................................................................................................
2 ...........................................................................................................................................................................
3 From the information below, work out the mass number of each element:
���� ������ ��� �� ��� �� ��� �� ���������� ������� ��������� �������� ������
������ �� �� �� ���������� �� �� �� ��
4 Write the chemical symbol of each element, showing the mass number and atomic numbers in their correct configuration.
............................................................................................................................................................................
............................................................................................................................................................................
Activity

Activity Activity
Support information Salinity in the Classroom
Page 4
Support information Salinity in the Classroom
Page 5
Types of saltIn this activity students are encouraged to recognise that there are many different types of salts apart from sodium chloride.
Materials At least seven different salt samples (examples are given below) Magnifying glass Blank paper Science text books (several different types - enough for each person) or other
information sources (e.g. Section Two this resource)
ProcedureDescribe the appearance of the seven salt samples and record your results in a table e.g. Provide students with a blank piece of paper. In groups they should explore their concepts of the word ‘salt’ and what it means.Discussion: What does your group think ‘salt’ is? Where do you think salt comes from? Write your group’s response on the blank sheet of paper.
No Salt Description
1 NaCl
2 CuSO4
3 FeSO4
4 CaCl2
5 MgSO4
6 BaSO4
7 K2CrO4
Discussion1 Why do you think all of these chemicals are called ‘salts’? What does your group
think that salt means? Write on your sheet of paper how your group thinks about salt now.
Clarification1 Each group member should collect a science texbook from the teacher (try to get as
many different books as possible). Use the index to find what the book says about salt. Each person should then compare the information from each text.
2 Use a new piece of blank paper. Write the group’s definition of the term ‘salt’ and what it means in chemistry.
Extension1 Using the periodic table, mark on the table the elements making up the first part of
the salt’s chemical name (Na, Cu, etc.).2 What do you observe about the samples and the place of their metal in the periodic
table?3 Name the salts in the table above.
2EA
2.2, 2.3.1, 2.3.2
Activity
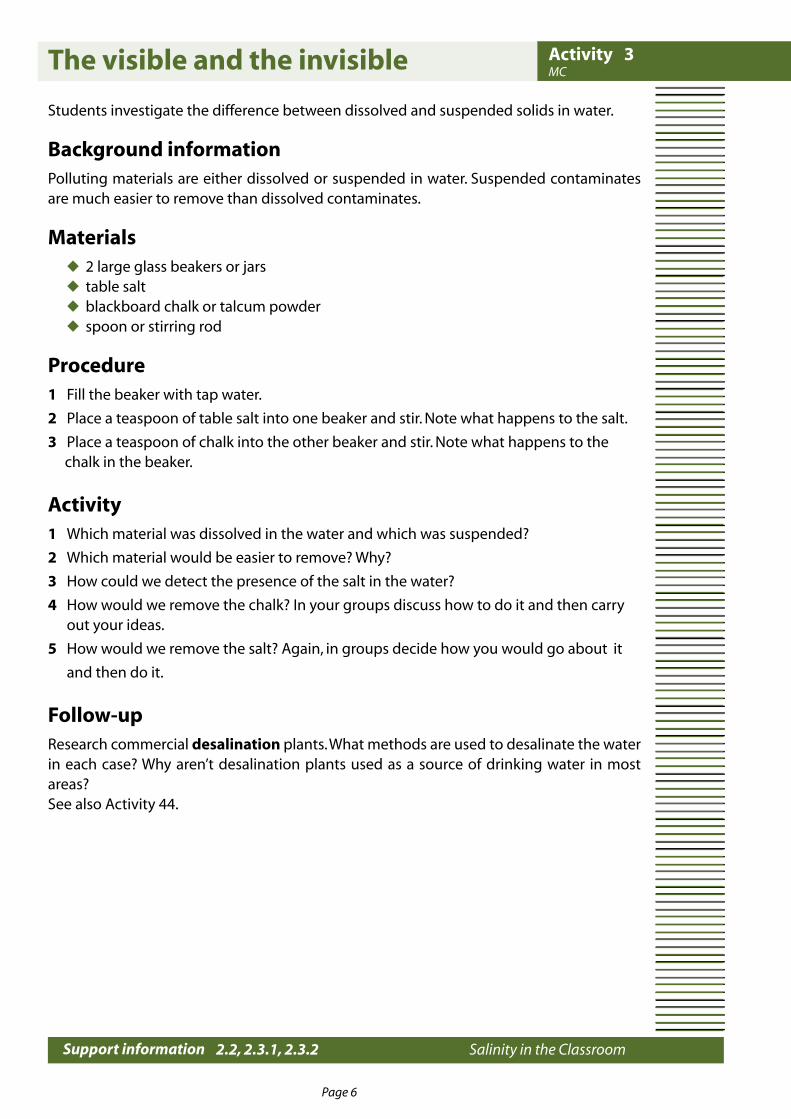
Activity Activity
Support information Salinity in the Classroom
Page 6
Support information Salinity in the Classroom
Page 7
The visible and the invisible
Students investigate the difference between dissolved and suspended solids in water.
Background informationPolluting materials are either dissolved or suspended in water. Suspended contaminates are much easier to remove than dissolved contaminates.
Materials 2 large glass beakers or jars table salt blackboard chalk or talcum powder spoon or stirring rod
Procedure1 Fill the beaker with tap water.
2 Place a teaspoon of table salt into one beaker and stir. Note what happens to the salt.
3 Place a teaspoon of chalk into the other beaker and stir. Note what happens to the chalk in the beaker.
Activity1 Which material was dissolved in the water and which was suspended?
2 Which material would be easier to remove? Why?
3 How could we detect the presence of the salt in the water?
4 How would we remove the chalk? In your groups discuss how to do it and then carry out your ideas.
5 How would we remove the salt? Again, in groups decide how you would go about it
and then do it.
Follow-upResearch commercial desalination plants. What methods are used to desalinate the water in each case? Why aren’t desalination plants used as a source of drinking water in most areas?See also Activity 44.
3MC
2.2, 2.3.1, 2.3.2
Activity
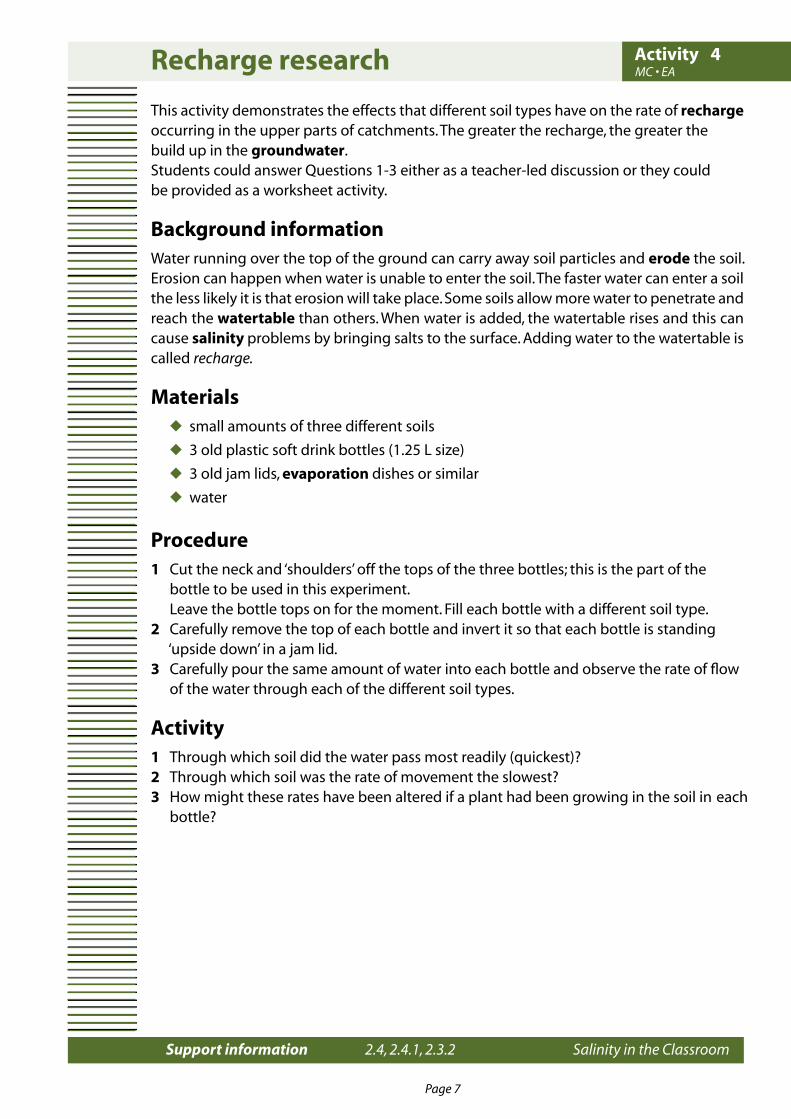
Activity Activity
Support information Salinity in the Classroom
Page 6
Support information Salinity in the Classroom
Page 7
Recharge research
This activity demonstrates the effects that different soil types have on the rate of recharge occurring in the upper parts of catchments. The greater the recharge, the greater thebuild up in the groundwater.Students could answer Questions 1-3 either as a teacher-led discussion or they couldbe provided as a worksheet activity.
Background informationWater running over the top of the ground can carry away soil particles and erode the soil. Erosion can happen when water is unable to enter the soil. The faster water can enter a soil the less likely it is that erosion will take place. Some soils allow more water to penetrate and reach the watertable than others. When water is added, the watertable rises and this can cause salinity problems by bringing salts to the surface. Adding water to the watertable is called recharge.
Materials small amounts of three different soils
3 old plastic soft drink bottles (1.25 L size)
3 old jam lids, evaporation dishes or similar
water
Procedure1 Cut the neck and ‘shoulders’ off the tops of the three bottles; this is the part of the bottle to be used in this experiment. Leave the bottle tops on for the moment. Fill each bottle with a different soil type.2 Carefully remove the top of each bottle and invert it so that each bottle is standing ‘upside down’ in a jam lid.3 Carefully pour the same amount of water into each bottle and observe the rate of flow of the water through each of the different soil types.
Activity1 Through which soil did the water pass most readily (quickest)?2 Through which soil was the rate of movement the slowest?3 How might these rates have been altered if a plant had been growing in the soil in each bottle?
4MC • EA
2.4, 2.4.1, 2.3.2 3.3.3
Activity

Activity Activity
Support information Salinity in the Classroom
Page 8
Support information Salinity in the Classroom
Page 9
Salt in soil
Background informationSalts are natural components of soil. When rocks break down they release some salts; and, since soils are mainly made from weathered rocks, soil will contain these salts. However, the amount of salt in Western Australia’s soil is simply too much to have come only from the weathering of rocks. In parts of the Darling Range, CSIRO surveys have revealed the presence of 170 tonnes of salt per hectare. Drilling by the Department of Agriculture in uncleared soils at Newdegate, east of Lake Grace, revealed an astonishing 534 tonnes per hectare of salt stored in the top 15 metres of soil. In addition to the weathering of rock, there must be another source of salt and research has shown that the sea is the origin of most of this stored salt. Although rain is normally regarded as fresh, it contains small amounts of salt. Bubbles of sea-water enter the atmosphere when it is stirred up by the wind and find their way into clouds, thus putting a small amount of salt in the rain. Measurements of the salt content of rainfall have established that salt deposition via rainfall ranges from more than 200 kg/ha/year near the west coast to 18 kg/ha/year at inland sites such as Merredin. In high rainfall areas, much of the salt is leached out, but in low rainfall areas large amounts of salt accumulate in the soil. In these areas native shrubs and trees transpire almost all of the rain that falls, while leaving the salts deep in the soil. A balance is eventually reached between the amount of salt entering the soil and the amount that leaves it.
This activity gives students the opportunity to find out for themselves that all soils contain salt. Prior to undertaking this activity it would be useful to discuss with students some of WA’s environmental problems and the characteristics and properties of common soils. Salt is a normal ingredient of soils. Students need to be aware that salt only becomes a problem when it occurs in excessive quantities. (For further information see Section Two).
If the school has an EC meter, then levels of salinity can be compared. Alternatively, students could make their own salinity meter (see Activity 20).
Materials test tube access to soils access to distilled water 250 mL beaker stirring rod 2 filter funnels filter funnel stand filter paper 0.6 M silver nitrate (AgNO3) solution (appropriate care should be taken when using
these chemicals).
Teachers may also like to carry out Activity 22 to assist with finding an answer to Question 4 in this activity.
5
2.2, 2.3.1, 2.3.2, 2.3.3
MC • EAActivity

Activity Activity
Support information Salinity in the Classroom
Page 8
Support information Salinity in the Classroom
Page 9
Salt in soil
WorksheetSalt is all right in Vegemite, but too much in the topsoil can devastate plants. Salt is present in all soils and it is only when its concentration reaches a certain level that salinity problems occur. It is relatively simple to show that even soil that is unaffected by salinity contains some salts.
Materials access to different types of soils
access to distilled water
250 mL beaker
stirring rod
two filter funnels
filter funnel, stand and filter paper
test tube
0.6 mL silver nitrate (AgNO3) solution (care should be taken when using this chemical)
Procedure1 Place a handful of soil in the beaker and add 50 ml distilled water.
2 Filter the soil/water mixture.
3 Half-fill a test tube with the filtrate (the water you have filtered from the soil).
4 Add two drops of silver nitrate solution. Silver nitrate turns into a white solid when
mixed with salt, turning the water milky in colour.
Looking at your results1 Does the soil you’ve used contain salt?
...........................................................................................................................................................................
...........................................................................................................................................................................
2 Was there a difference in the degree of ‘milkiness’ between soils?
...........................................................................................................................................................................
...........................................................................................................................................................................
3 Why did you use distilled water in this experiment?
...........................................................................................................................................................................
...........................................................................................................................................................................
4 Find out how much salt there needs to be in the soil before it affects certain plants.
...........................................................................................................................................................................
...........................................................................................................................................................................
...........................................................................................................................................................................
5 cont.
2.2, 2.3.1, 2.3.2, 2.3.3
MC • EAActivity
Activity Activity
Support information Salinity in the Classroom
Page 10
Support information Salinity in the Classroom
Page 11
Activity1 Use a flow chart with words and pictures to illustrate the activity that you have just completed.
2 Describe your observations throughout the whole procedure. ............................................................................................................................................................................. ............................................................................................................................................................................. ............................................................................................................................................................................. .............................................................................................................................................................................
3 What conclusions/hypothesis can you make?................................................................................... ............................................................................................................................................................................. ............................................................................................................................................................................. ............................................................................................................................................................................. ............................................................................................................................................................................. 4 Use the internet to collect information on an area that has been affected by salt. What happened that caused the salt to come to the surface? ............................................................................................................................................................................. ............................................................................................................................................................................. ............................................................................................................................................................................. .............................................................................................................................................................................
What was the result? ............................................................................................................................................................................. ............................................................................................................................................................................. ............................................................................................................................................................................. .............................................................................................................................................................................
How is the community addressing the issue? ............................................................................................................................................................................. ............................................................................................................................................................................. ............................................................................................................................................................................. .............................................................................................................................................................................
What new ideas or information did you get from the internet? ............................................................................................................................................................................. ............................................................................................................................................................................. ............................................................................................................................................................................. ............................................................................................................................................................................. ............................................................................................................................................................................. ............................................................................................................................................................................. .............................................................................................................................................................................
5 cont.MC • EASalt in soil
2.2, 2.3.1, 2.3.2, 2.3.3
Activity
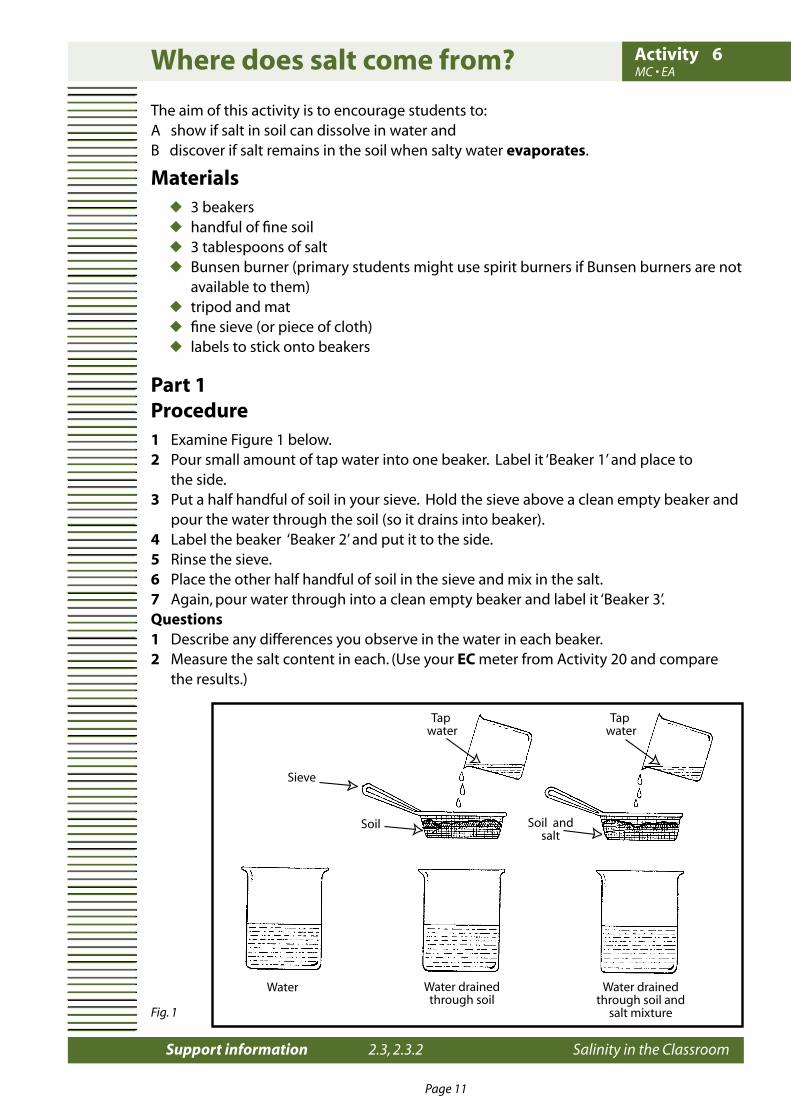
Activity Activity
Support information Salinity in the Classroom
Page 10
Support information Salinity in the Classroom
Page 11
Where does salt come from?
The aim of this activity is to encourage students to:A show if salt in soil can dissolve in water andB discover if salt remains in the soil when salty water evaporates.
Materials 3 beakers handful of fine soil 3 tablespoons of salt Bunsen burner (primary students might use spirit burners if Bunsen burners are not available to them) tripod and mat fine sieve (or piece of cloth) labels to stick onto beakers
Part 1Procedure1 Examine Figure 1 below. 2 Pour small amount of tap water into one beaker. Label it ‘Beaker 1’ and place to the side.3 Put a half handful of soil in your sieve. Hold the sieve above a clean empty beaker and pour the water through the soil (so it drains into beaker).4 Label the beaker ‘Beaker 2’ and put it to the side.5 Rinse the sieve.6 Place the other half handful of soil in the sieve and mix in the salt.7 Again, pour water through into a clean empty beaker and label it ‘Beaker 3’.Questions1 Describe any differences you observe in the water in each beaker.2 Measure the salt content in each. (Use your EC meter from Activity 20 and compare the results.)
����� ����� �������������� ����
����� �������������� ���� ���
���� �������
��������
��������
�����
���� ���� �������
6MC • EA
2.3, 2.3.2
Fig. 1
Activity

Activity Activity
Support information Salinity in the Classroom
Page 12
Support information Salinity in the Classroom
Page 13
Where does salt come from?
Part 2
Procedure1 Place Beaker 3 on the tripod and heat the water that has drained through the soil and salt until all the water evaporates.2 Make your own hypothesis about what you expect to be left in the beaker.
Questions1 Describe what is left in the beaker (if anything) after all the water has evaporated.
............................................................................................................................................................................2 You placed three tablespoons of salt in the soil to start. (a) Do you have three tablespoons in the beaker?
............................................................................................................................................................................ (b) If not, where is the rest of the salt?
............................................................................................................................................................................ (c) Suggest ways you could check this.
............................................................................................................................................................................
Extra questions1 Examine Figure 2. If the watertable rose up through the soil, what might happen to the salt?
............................................................................................................................................................................2 Why might the watertable rise?
............................................................................................................................................................................3 How do you think a rising watertable would affect plants? Explain.
............................................................................................................................................................................4 If salty water reached the surface, describe what may happen next.
............................................................................................................................................................................
���� ����� ����
����������
2.3, 2.3.2
6 cont.MC • EA
Fig. 2
–
Activity
Activity Activity
Support information Salinity in the Classroom
Page 12
Support information Salinity in the Classroom
Page 13
Travelling with salt
This experiment will demonstrate to students how salt rises to the surface of the land so that they can understand that salinity destroys Australian soils.
Worksheet
Materials tall drinking glass paper towelling water salt
Procedure1 Near the top of glass write ‘surface’ and at the bottom write ‘groundwater’.
2 Fill one-third of glass with water.
3 Dissolve two teaspoons of salt in water.
4 Cut a paper towelling strip a bit bigger than the length of the glass. Label the strip “soil”.
5 Place the paper towel strip in glass so that one end is dipped in the water and the other end is overlapping the top of the glass.
6 Observe what happens.
7 Tear off a small piece of wet paper at the end of the strip and place it on your tongue. What can you taste?
8 Remove towelling from water and place in a warm position. Observe the surface after the water has evaporated.
Activity
Answer the following questions:
1 Illustrate in words and drawings the activity that has taken place.
2 Describe your observations throughout the whole procedure?
3 What conclusions/hypothesis can you make?
7MC
2.2, 2.3
Activity

Activity Activity
Support information Salinity in the Classroom
Page 14
Support information Salinity in the Classroom
Page 15
Soil structure and salinity
In this activity, students examine the effects of salt on soil structure.
Background informationSalinity not only affects the movement of water through soil but also the structure of the soil itself. The following experiments demonstrate the effects very clearly.
Where salt concentrations are high, the soil aggregates may become dispersed upon watering. Sodium ions exchange for calcium ions on the clay particles. The resultant loss in electrostatic attraction (Ca++ to Na+) between the clay particles causes them to disperse. In extreme cases, the soil takes on a powder-like appearance. On drying, these soils may become sealed and may limit the infiltration of water into the soil. Low penetration or slow drainage through the soil may reduce plant growth and promote erosion.
Prior to carrying out this activity it would be useful to brainstorm with students some of the environmental problems in Western Australia and to discuss the need for natural resource management providing examples relevant to the local area.
Materials (per group) handful of clay soil
6 petri dishes
distilled water
various salt solutions (1⁄2 tspn salt per litre; 1 tspn salt per litre etc.)
water softener or washing soda
8MC • EA
2.2, 2.3.1, 2.3.2, 2.3.3
Activity

Activity Activity
Support information Salinity in the Classroom
Page 14
Support information Salinity in the Classroom
Page 15
Soil structure and salinity
WorksheetSalinity has many effects on soil and plants. The most obvious effect (at high enough concentrations) is that salinity kills plants and leaves the soil bare. But what happens to the structure of the soil itself? The following experiments allow you to investigate the effects of salt on soil structure.
Materials clay soil
6 petri dishes
distilled water
various salt solutions
water softener or washing soda
Experiment 1
Part 1 Place 20 grams (approximately 3 teaspoons) of soil into each of the six petri dishes.
Add a different salt solution to each of the five petri dishes (label them carefully). Leave one dish without any salt solution.
Dry for 24 hours then answer the following questions:
1 What effect does salty water appear to have on the soil?
............................................................................................................................................................................
............................................................................................................................................................................
............................................................................................................................................................................2 Does this effect change with differing concentrations of salt?
............................................................................................................................................................................
............................................................................................................................................................................
............................................................................................................................................................................3 How might the change in soil structure affect plant growth?
............................................................................................................................................................................
............................................................................................................................................................................
............................................................................................................................................................................4 Once the soil has dried out, describe the appearance of the soil in each dish. Is there any evidence of ‘crusting’? How might this affect plant growth?
............................................................................................................................................................................
............................................................................................................................................................................
............................................................................................................................................................................
8 contMC • EA
2.2, 2.3.1, 2.3.2, 2.3.3
Activity
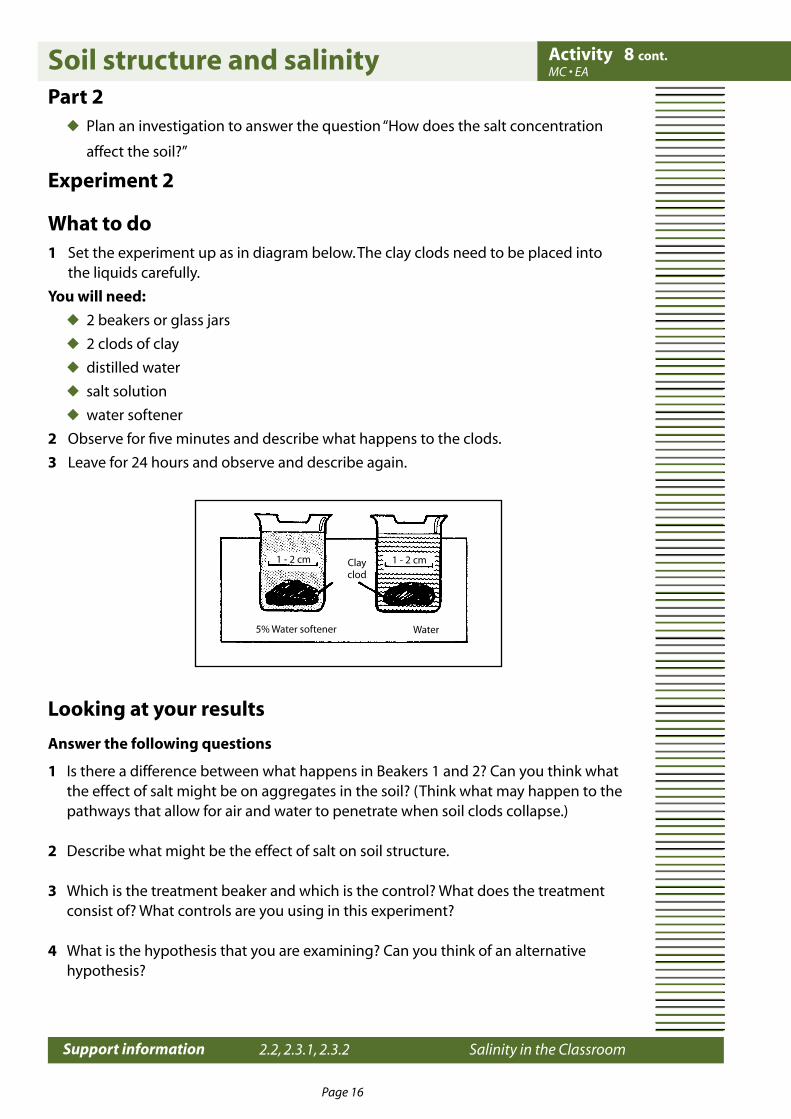
Activity Activity
Support information Salinity in the Classroom
Page 16
Support information Salinity in the Classroom
Page 17
Part 2 Plan an investigation to answer the question “How does the salt concentration
affect the soil?”
Experiment 2
What to do1 Set the experiment up as in diagram below. The clay clods need to be placed into the liquids carefully.
You will need:
2 beakers or glass jars
2 clods of clay
distilled water
salt solution
water softener
2 Observe for five minutes and describe what happens to the clods.
3 Leave for 24 hours and observe and describe again.
Looking at your results
Answer the following questions
1 Is there a difference between what happens in Beakers 1 and 2? Can you think what the effect of salt might be on aggregates in the soil? (Think what may happen to the pathways that allow for air and water to penetrate when soil clods collapse.)
2 Describe what might be the effect of salt on soil structure.
3 Which is the treatment beaker and which is the control? What does the treatment consist of? What controls are you using in this experiment?
4 What is the hypothesis that you are examining? Can you think of an alternative hypothesis?
� � � �� � � � ����������
�� ����� �������� �����
8 cont.MC • EA
2.2, 2.3.1, 2.3.2 3.3.3
Soil structure and salinity Activity
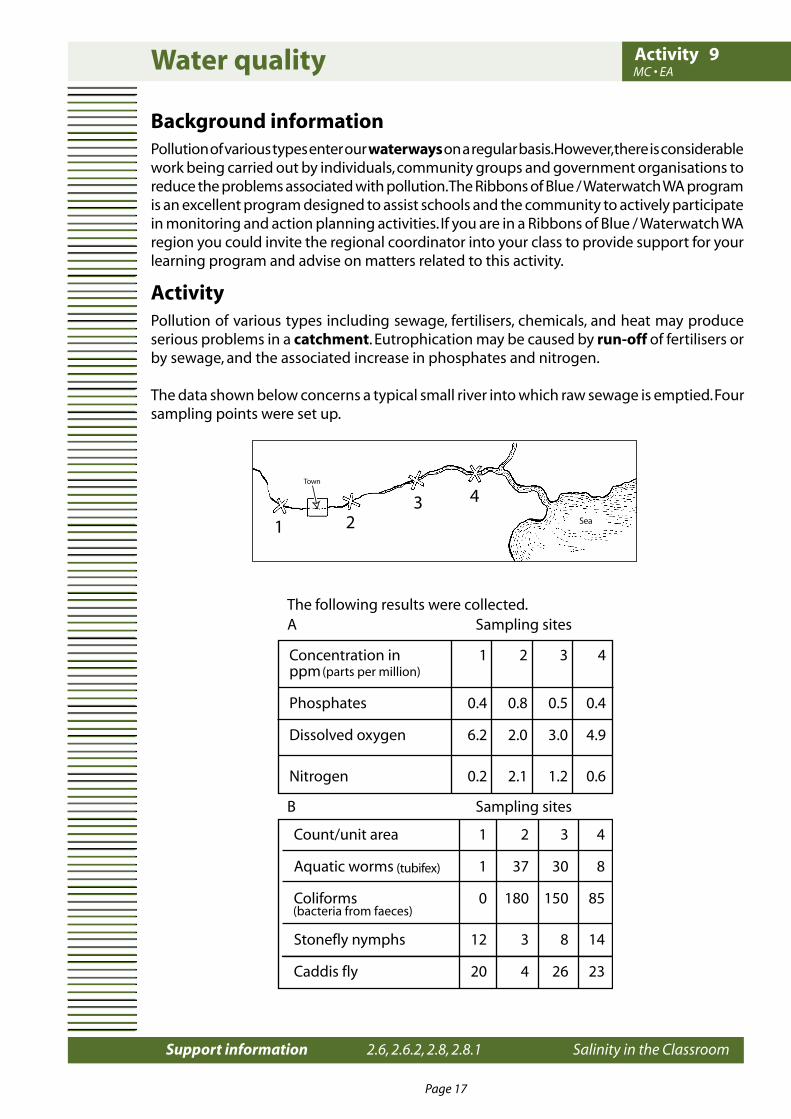
Activity Activity
Support information Salinity in the Classroom
Page 16
Support information Salinity in the Classroom
Page 17
Water quality
Background informationPollution of various types enter our waterways on a regular basis. However, there is considerable work being carried out by individuals, community groups and government organisations to reduce the problems associated with pollution. The Ribbons of Blue / Waterwatch WA program is an excellent program designed to assist schools and the community to actively participate in monitoring and action planning activities. If you are in a Ribbons of Blue / Waterwatch WA region you could invite the regional coordinator into your class to provide support for your learning program and advise on matters related to this activity.
ActivityPollution of various types including sewage, fertilisers, chemicals, and heat may produce serious problems in a catchment. Eutrophication may be caused by run-off of fertilisers or by sewage, and the associated increase in phosphates and nitrogen.
The data shown below concerns a typical small river into which raw sewage is emptied. Four sampling points were set up.
����
� �� �
���
���������� ���� � � � �
������� ����� � �� �� �
��������� � ��� ��� ��
�������� ������ �� � � ��
������ ��� �� � �� ��
��������� ���� �������
���������
������������� �� � � � ����
���������� ��� ��� ��� ���
��������� ������ ��� ��� ��� ���
�������� ��� ��� ��� ���
������ ��� ��������
The following results were collected. A Sampling sites
B Sampling sites
9MC • EA
2.6, 2.6.2, 2.8, 2.8.1
Activity

Activity Activity
Support information Salinity in the Classroom
Page 18
Support information Salinity in the Classroom
Page 19
Water quality
Worksheet1 Using the data in Table A, complete the line graph below by adding the results for oxygen and nitrogen (N.B. perhaps use a different colour or symbol for each).
2 Using the data in Table B, construct a similar type of graph as for Table A.
��������������� �����
�������� ����� ����������
�
�
�
�
� � ��
� � ��������� ����� ����������
�
��������������
��
��
��
��
���
���
���
���
���
9 cont.MC • EA
2.6, 2.6.2, 2.8, 2.8.1
Activity
Activity Activity
Support information Salinity in the Classroom
Page 18
Support information Salinity in the Classroom
Page 19
Water qualityWorksheet Questions
1 Where does the sewage enter the river?............................................................................................
...........................................................................................................................................................................
...........................................................................................................................................................................2 What happens to the levels of nitrogen and phosphate when sewage enters the river?
............................................................................................................................................................................
............................................................................................................................................................................
............................................................................................................................................................................
3 What happens to the oxygen content when sewage enters? ....................................................
............................................................................................................................................................................
............................................................................................................................................................................
............................................................................................................................................................................
4 Algae thrive on high nitrate and phosphate levels. Where would you expect to find
most algae?....................................................................................................................................................
............................................................................................................................................................................
............................................................................................................................................................................5 What happens to the numbers of mayfly and caddis fly nymphs when sewage enters?
............................................................................................................................................................................
............................................................................................................................................................................
6 Fish require dissolved oxygen. Explain how fish numbers would be expected to vary
along the river..............................................................................................................................................
............................................................................................................................................................................
............................................................................................................................................................................
7 Has the river completely recovered by sampling point 4? ...........................................................
Explain your answer....................................................................................................................................
............................................................................................................................................................................
............................................................................................................................................................................
8 Complete the following activities:
graph all information in an Excel spreadsheet
use the internet to find pictures of some of the animals decribed
develop a Powerpoint presentation that you could present to a town council about the river. Your presentation should contain all of the information you have found from answering the previous questions.
9 cont.MC • EA
2.6, 2.6.2, 2.8, 2.8.1
Activity
Activity Activity
Support information Salinity in the Classroom
Page 20
Support information Salinity in the Classroom
Page 21
Water - a finite resource
Students are encouraged to explore the worldwide issue of water as a finite resource.
Background informationA useful starting point for students to obtain information for this activity is the web. (There are also some useful websites listed in Section Five).Useful keywords for the internet: Water, water quality, catchments, water resources, drought, water supply.
Materials Useful internet sites:
The Ribbons of Blue/Waterwatch WA Website is a useful place to start searching. www.wrc.wa.gov.au/ribbons
Books Gaia: An Atlas of Planet Management. The Freshwater Reservoir, pages 108 -109
Activity1 Use the internet and library to research the issue of water as a finite resource.
2 Debate the statement “Future wars will be fought over water’’.
3 Case studies for investigation could include water diversion and management of rivers such as:
a) The Nile, Colorado River (overseas)
b) The Murray, Snowy River (Australia)
c) The Kent River (Western Australia)4 In small groups present your findings to the rest of the class. (This could be in the form of a poster, report, journal or Powerpoint presentation.)
10MC • EA
2.6, 2.6.2
Activity
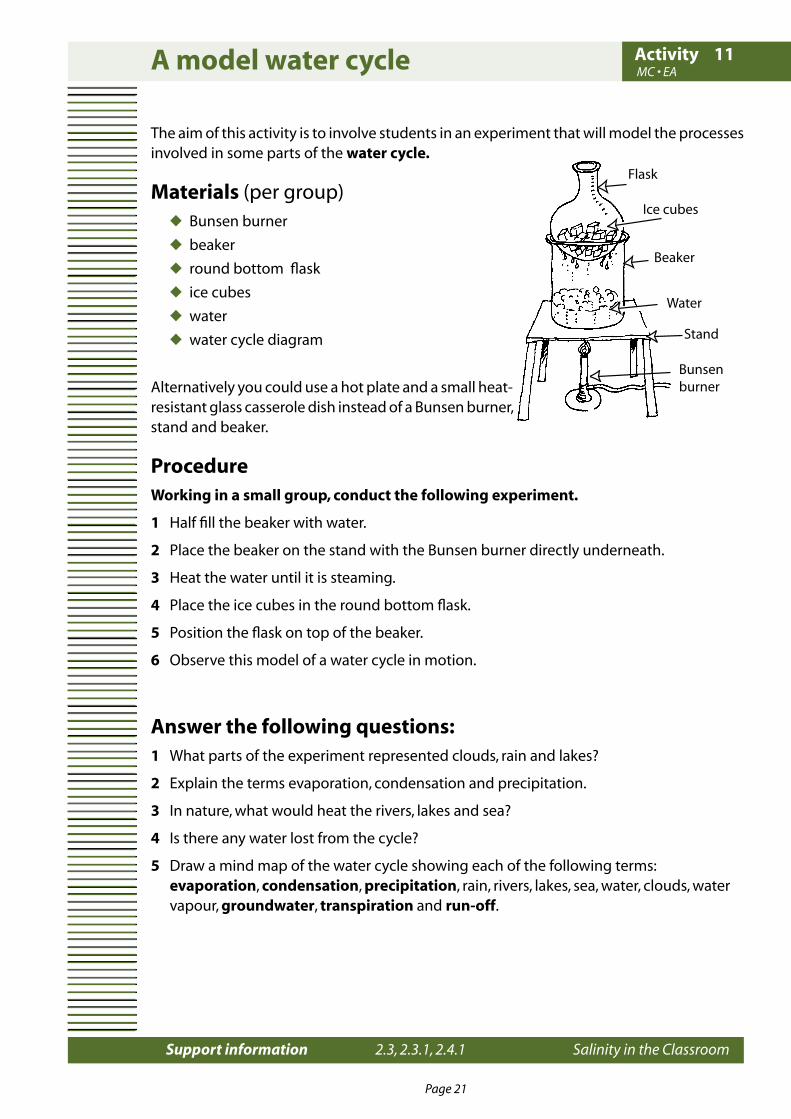
Activity Activity
Support information Salinity in the Classroom
Page 20
Support information Salinity in the Classroom
Page 21
A model water cycle
The aim of this activity is to involve students in an experiment that will model the processes involved in some parts of the water cycle.
Materials (per group) Bunsen burner
beaker
round bottom flask
ice cubes
water
water cycle diagram
Alternatively you could use a hot plate and a small heat-resistant glass casserole dish instead of a Bunsen burner, stand and beaker.
ProcedureWorking in a small group, conduct the following experiment.
1 Half fill the beaker with water.
2 Place the beaker on the stand with the Bunsen burner directly underneath.
3 Heat the water until it is steaming.
4 Place the ice cubes in the round bottom flask.
5 Position the flask on top of the beaker.
6 Observe this model of a water cycle in motion.
Answer the following questions:1 What parts of the experiment represented clouds, rain and lakes?
2 Explain the terms evaporation, condensation and precipitation.
3 In nature, what would heat the rivers, lakes and sea?
4 Is there any water lost from the cycle?
5 Draw a mind map of the water cycle showing each of the following terms: evaporation, condensation, precipitation, rain, rivers, lakes, sea, water, clouds, water vapour, groundwater, transpiration and run-off.
�����
��� �����
������
�����
�����
������������
11
2.3, 2.3.1, 2.4.1
MC • EAActivity
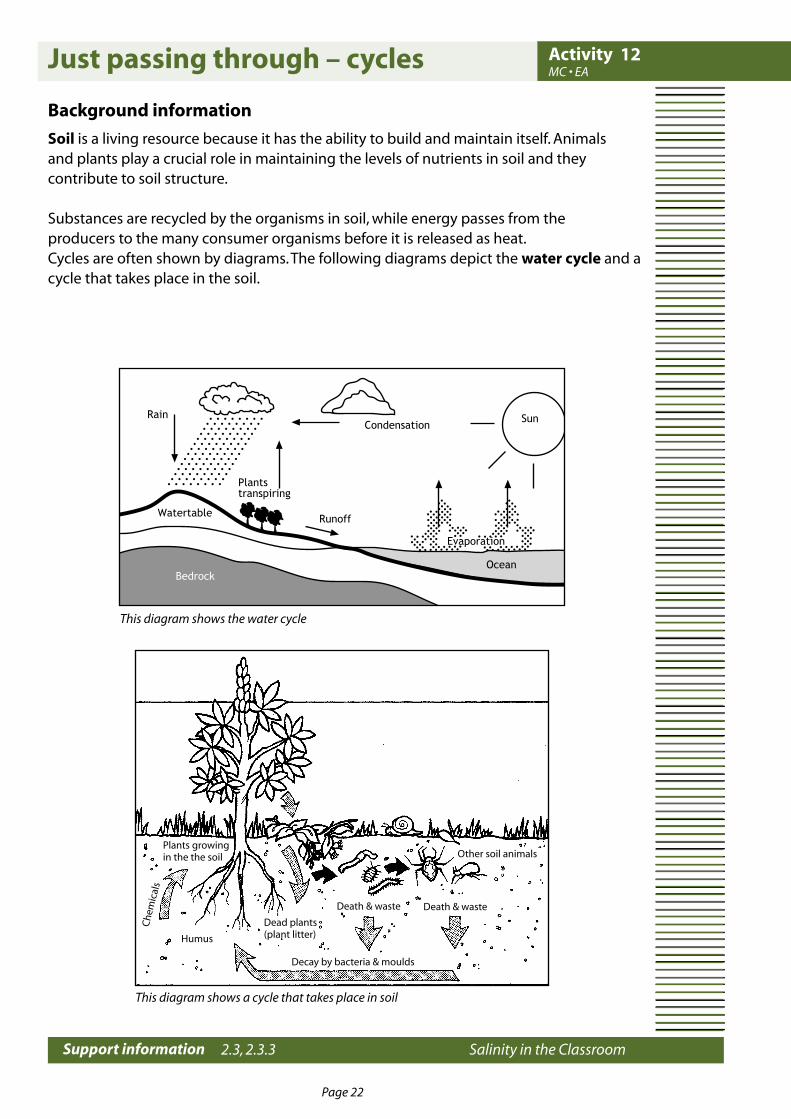
Activity Activity
Support information Salinity in the Classroom
Page 22
Support information Salinity in the Classroom
Page 23
12MC • EA
2.3, 2.3.3
Just passing through – cycles
Background information Soil is a living resource because it has the ability to build and maintain itself. Animalsand plants play a crucial role in maintaining the levels of nutrients in soil and theycontribute to soil structure.
Substances are recycled by the organisms in soil, while energy passes from theproducers to the many consumer organisms before it is released as heat.Cycles are often shown by diagrams. The following diagrams depict the water cycle and a cycle that takes place in the soil.
������ ��������� ��� ��� ����
���� ������������ �������
����� ���� �������
����� � �����
����� �� �������� � ������
�����
���
���
���
����� � �����
This diagram shows the water cycle
This diagram shows a cycle that takes place in soil
Activity
Activity Activity
Support information Salinity in the Classroom
Page 22
Support information Salinity in the Classroom
Page 23
Just passing through – cycles
Worksheet
Questions and tasks
1 How many different stages can you see in the diagrams?
.............................................................................................................................................................................
.............................................................................................................................................................................
.............................................................................................................................................................................
.............................................................................................................................................................................
2 Where does the energy for these cycles come from?
.............................................................................................................................................................................
.............................................................................................................................................................................
.............................................................................................................................................................................
.............................................................................................................................................................................
3 Why are the cycles important to plants? Why are they important to animals, including humans?
.............................................................................................................................................................................
.............................................................................................................................................................................
.............................................................................................................................................................................
.............................................................................................................................................................................
4 What could gardeners use to fertilise the soil instead of chemical fertilisers?
.............................................................................................................................................................................
.............................................................................................................................................................................
.............................................................................................................................................................................
.............................................................................................................................................................................
5 Redraw the soil cycle diagram. Use boxes for the organisms and what they do in the cycle and arrows to connect them. Include chemical fertilisers in your diagram.
6 Add your suggestion from question 4 to the diagram you drew in question 5.
2.3, 2.3.3
12 cont.MC • EA Activity
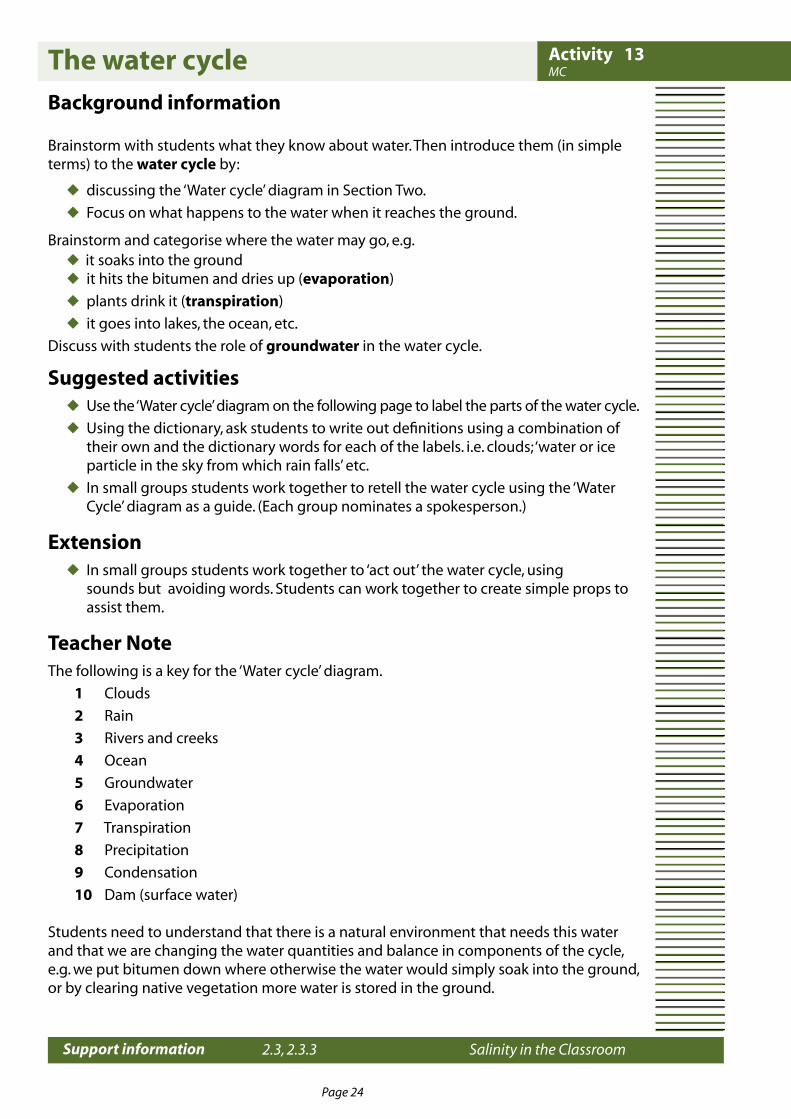
Activity Activity
Support information Salinity in the Classroom
Page 24
Support information Salinity in the Classroom
Page 25
The water cycle Background information
Brainstorm with students what they know about water. Then introduce them (in simple terms) to the water cycle by:
discussing the ‘Water cycle’ diagram in Section Two.
Focus on what happens to the water when it reaches the ground.
Brainstorm and categorise where the water may go, e.g. it soaks into the ground
it hits the bitumen and dries up (evaporation)
plants drink it (transpiration)
it goes into lakes, the ocean, etc.
Discuss with students the role of groundwater in the water cycle.
Suggested activities Use the ‘Water cycle’ diagram on the following page to label the parts of the water cycle.
Using the dictionary, ask students to write out definitions using a combination of their own and the dictionary words for each of the labels. i.e. clouds; ‘water or ice particle in the sky from which rain falls’ etc.
In small groups students work together to retell the water cycle using the ‘Water Cycle’ diagram as a guide. (Each group nominates a spokesperson.)
Extension In small groups students work together to ‘act out’ the water cycle, using sounds but avoiding words. Students can work together to create simple props to assist them.
Teacher NoteThe following is a key for the ‘Water cycle’ diagram.
1 Clouds
2 Rain
3 Rivers and creeks
4 Ocean
5 Groundwater
6 Evaporation
7 Transpiration
8 Precipitation
9 Condensation
10 Dam (surface water)
Students need to understand that there is a natural environment that needs this water and that we are changing the water quantities and balance in components of the cycle, e.g. we put bitumen down where otherwise the water would simply soak into the ground, or by clearing native vegetation more water is stored in the ground.
13MC
2.3, 2.3.3
Activity

Activity Activity
Support information Salinity in the Classroom
Page 24
Support information Salinity in the Classroom
Page 25
The water cycle 13 cont.MC
WorksheetLabel the parts of the water cycle.
2.3, 2.3.3
Activity

Activity Activity
Support information Salinity in the Classroom
Page 26
Support information Salinity in the Classroom
Page 27
Where does the water go?
Background information on the water cycle can be found in Section Two
The aim of this activity is to: (a) Examine and interpret diagrams of the water cycle and soil/rock types.
(b) Infer and predict water movement in various parts of the cycle. Look at Fig. 1.
ActivityThe water cycle can be shown very simply as below: However this only tells part of the story.
�����������
���������
������� ������� ����
��������
Fig. 1
14EA
2.3, 2.3.1, 2.4.1, 2.6.2
Activity
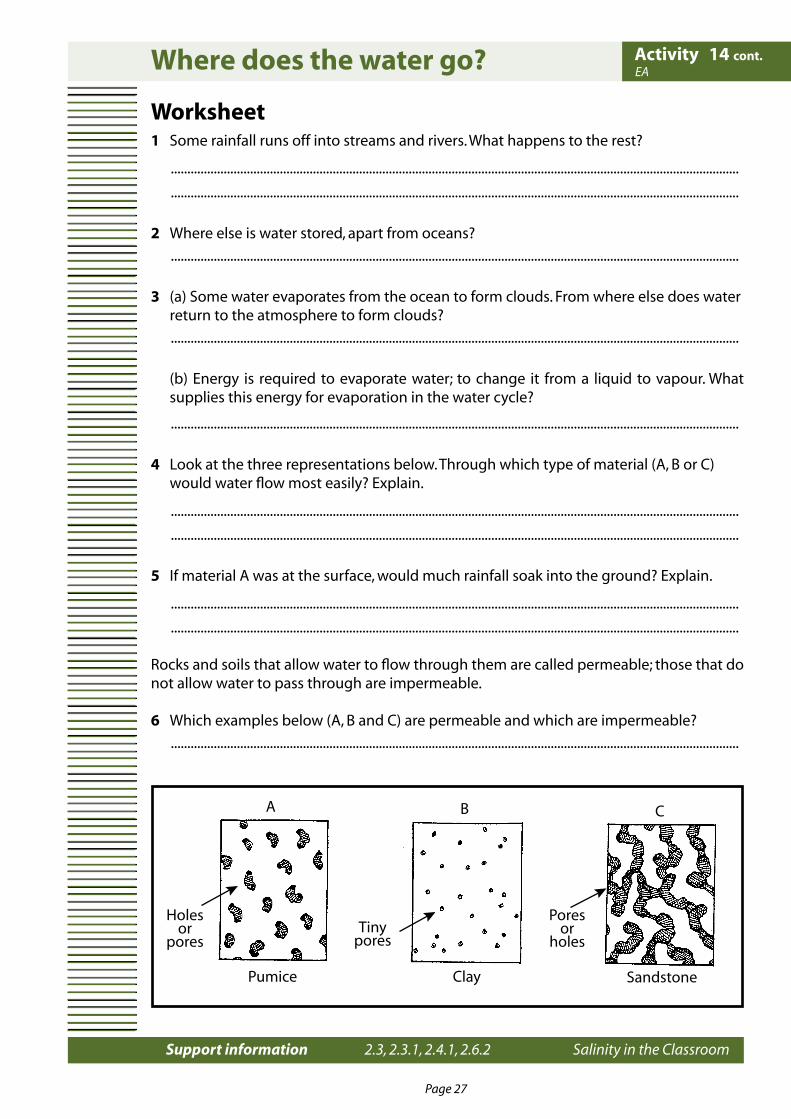
Activity Activity
Support information Salinity in the Classroom
Page 26
Support information Salinity in the Classroom
Page 27
Where does the water go?
Worksheet1 Some rainfall runs off into streams and rivers. What happens to the rest?
............................................................................................................................................................................
............................................................................................................................................................................
2 Where else is water stored, apart from oceans?
............................................................................................................................................................................
3 (a) Some water evaporates from the ocean to form clouds. From where else does water return to the atmosphere to form clouds?
............................................................................................................................................................................
(b) Energy is required to evaporate water; to change it from a liquid to vapour. What supplies this energy for evaporation in the water cycle?
............................................................................................................................................................................
4 Look at the three representations below. Through which type of material (A, B or C) would water flow most easily? Explain.
............................................................................................................................................................................
............................................................................................................................................................................
5 If material A was at the surface, would much rainfall soak into the ground? Explain.
............................................................................................................................................................................
............................................................................................................................................................................
Rocks and soils that allow water to flow through them are called permeable; those that do not allow water to pass through are impermeable.
6 Which examples below (A, B and C) are permeable and which are impermeable?
............................................................................................................................................................................
� � �
�������
���������
�����
�������
�����
������ ���� ���������
EA14 cont.
2.3, 2.3.1, 2.4.1, 2.6.2
Activity
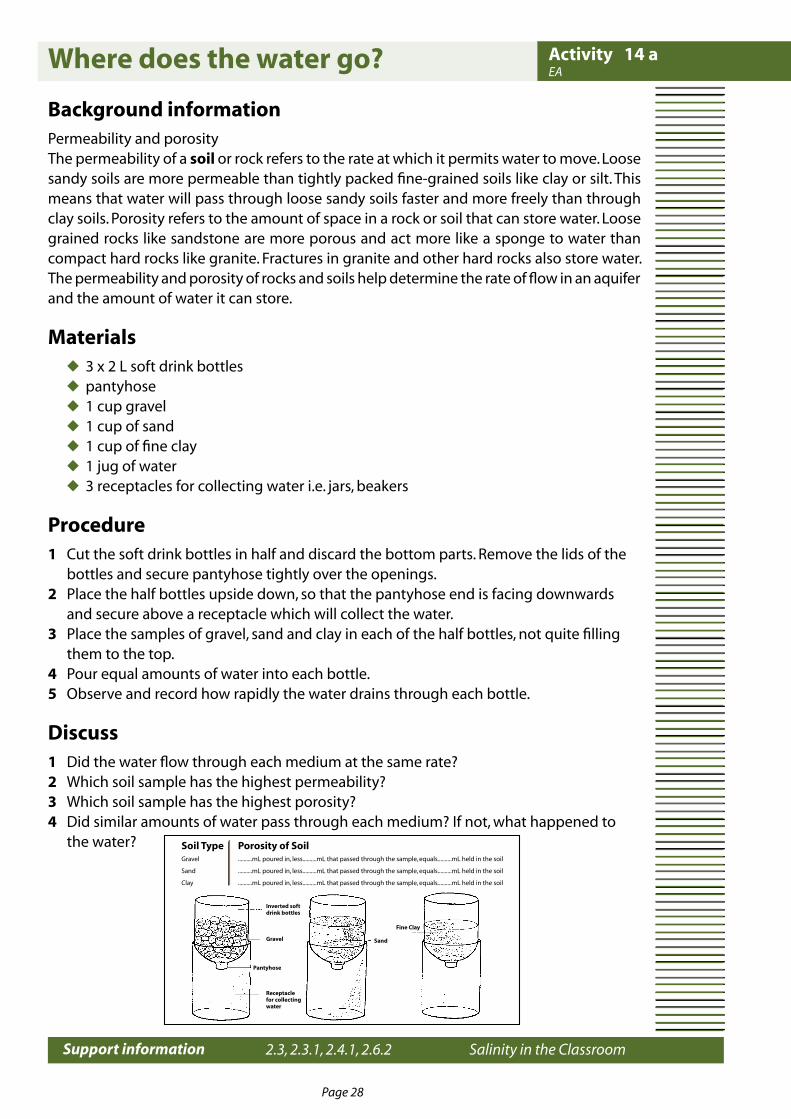
Activity Activity
Support information Salinity in the Classroom
Page 28
Support information Salinity in the Classroom
Page 29
Where does the water go?
Background informationPermeability and porosityThe permeability of a soil or rock refers to the rate at which it permits water to move. Loose sandy soils are more permeable than tightly packed fine-grained soils like clay or silt. This means that water will pass through loose sandy soils faster and more freely than through clay soils. Porosity refers to the amount of space in a rock or soil that can store water. Loose grained rocks like sandstone are more porous and act more like a sponge to water than compact hard rocks like granite. Fractures in granite and other hard rocks also store water. The permeability and porosity of rocks and soils help determine the rate of flow in an aquifer and the amount of water it can store.
Materials 3 x 2 L soft drink bottles pantyhose 1 cup gravel 1 cup of sand 1 cup of fine clay 1 jug of water 3 receptacles for collecting water i.e. jars, beakers
Procedure1 Cut the soft drink bottles in half and discard the bottom parts. Remove the lids of the bottles and secure pantyhose tightly over the openings.2 Place the half bottles upside down, so that the pantyhose end is facing downwards and secure above a receptacle which will collect the water.3 Place the samples of gravel, sand and clay in each of the half bottles, not quite filling them to the top.4 Pour equal amounts of water into each bottle.5 Observe and record how rapidly the water drains through each bottle.
Discuss1 Did the water flow through each medium at the same rate?2 Which soil sample has the highest permeability?3 Which soil sample has the highest porosity?4 Did similar amounts of water pass through each medium? If not, what happened to the water?
14 a
2.3, 2.3.1, 2.4.1, 2.6.2
EA
Soil Type Porosity of SoilGravel ..........mL poured in, less..........mL that passed through the sample, equals..........mL held in the soil
Sand ..........mL poured in, less..........mL that passed through the sample, equals..........mL held in the soil
Clay ..........mL poured in, less..........mL that passed through the sample, equals..........mL held in the soil
Inverted soft drink bottles
Gravel
Receptacle for collecting water
Pantyhose
Sand
Fine Clay
Activity

Activity Activity
Support information Salinity in the Classroom
Page 28
Support information Salinity in the Classroom
Page 29
This activity will reinforce concepts of evaporation, condensation and precipitation and introduce the concepts of run-off, transpiration and groundwater.
Materials One litre cartons (e.g. milk containers, approximately one for each student) Label with the words Evaporation, Condensation, Precipitation, Transpiration and Groundwater
Preparation 1 Arrange the classroom (or another open space) to provide four separate areas which will represent a part of the water cycle: (a) a dam or a lake whose boundaries should be outlined using chalk or other suitable means (b) clouds which should be based on an elevated position, i.e. desks, tables, a platform (c) a forest, bush or crop (d) a river.2 Students play various roles in the simulated water cycle: (a) ‘Water carriers’ whose role is to take water from the lake and deliver it to the clouds. This role represents the process of evaporation. (b) The ‘clouds ’which take delivery of the water from the water carriers. Here the process of condensation can be explained. Precipitation can be demonstrated with the clouds becoming ‘water drops’ by leaving the raised area to deliver water to the rivers and vegetation. (c) the ‘river’ and ‘trees’ receive the water from the water drops and then return some to the clouds (transpiration).
Procedure 1 Place all water containers in the lake or dam.2 Allocate roles to all students. About one-third of the class should be water carriers; one- third clouds/water drops; and the remaining one-third should be divided between the rivers and trees.3 Run through the following sequence three times with each process being discussed and the appropriate label presented.
Discuss: What is happening to the water? Present the label ‘Evaporation’.A Water carriers each collect a water container from the lake and travel to the cloud areaB The clouds receive the water containers from the water carriers who then return to the lake areas.
Discuss: How cold is it up in the clouds? What effect does the cold have on the waterheld by the clouds? Present the label ‘Condensation’. Ask the clouds what they are goingto do with the water they are holding.
15MCActing out the water cycle
2.3, 2.3.1, 2.4.1, 2.6.2
Activity

Activity Activity
Support information Salinity in the Classroom
Page 30
Support information Salinity in the Classroom
Page 31
Acting out the water cycle
C Clouds can then become water drops and leave the elevated platform.Discuss: What is happening to the water? Where is the water going? What do we call thiswater? Present the label ‘Precipitation’.NOTE: To further demonstrate the different forms of precipitation, students in this role could wear labels stating ‘rain’, ‘hail ’, ‘snow’ and ‘sleet ’.
D The water drops deliver the water containers to the trees and river and then returnto the clouds. The tree and river people keep the water at this stage. After three cycles,the lake area should become depleted of water containers while the trees and river arebecoming overloaded.
Discuss: What should the river be doing with the water? Introduce the term ‘Run-off ’.
E Continue the activity for two more cycles with the ‘river ’passing some of the watercontainers on to the lake. The trees will now be overloaded with water containers.Discuss: How do trees use water? Do trees store all of their water? Do trees lose someof their water?Introduce the term ‘Transpiration’ with the appropriate label.Run through the cycle with the trees giving some water containers back to the clouds.
Questions1 Why is the water cycle called a ‘cycle’? (Think about the movement of water containers.)
.............................................................................................................................................................................
.............................................................................................................................................................................
2 (a) Where else could water go besides transpiration and run-off?
.............................................................................................................................................................................
(b) Water can run over the top of the soil, but what else can it do?
3 What is groundwater?
.............................................................................................................................................................................
.............................................................................................................................................................................
.............................................................................................................................................................................
Further activityYou can demonstrate groundwater in the activity by positioning some students under cover (e.g. under desks or blankets).The ‘water drops’ then deliver some water containers to the groundwater. Some water can be stored and some passed along to the lake. By reducing the number of ‘trees’ and passing their water to the groundwater, you can demonstrate that clearing increases the groundwater level.
15 cont.MC
2.3, 2.3.1, 2.4.1, 2.6.2
Activity
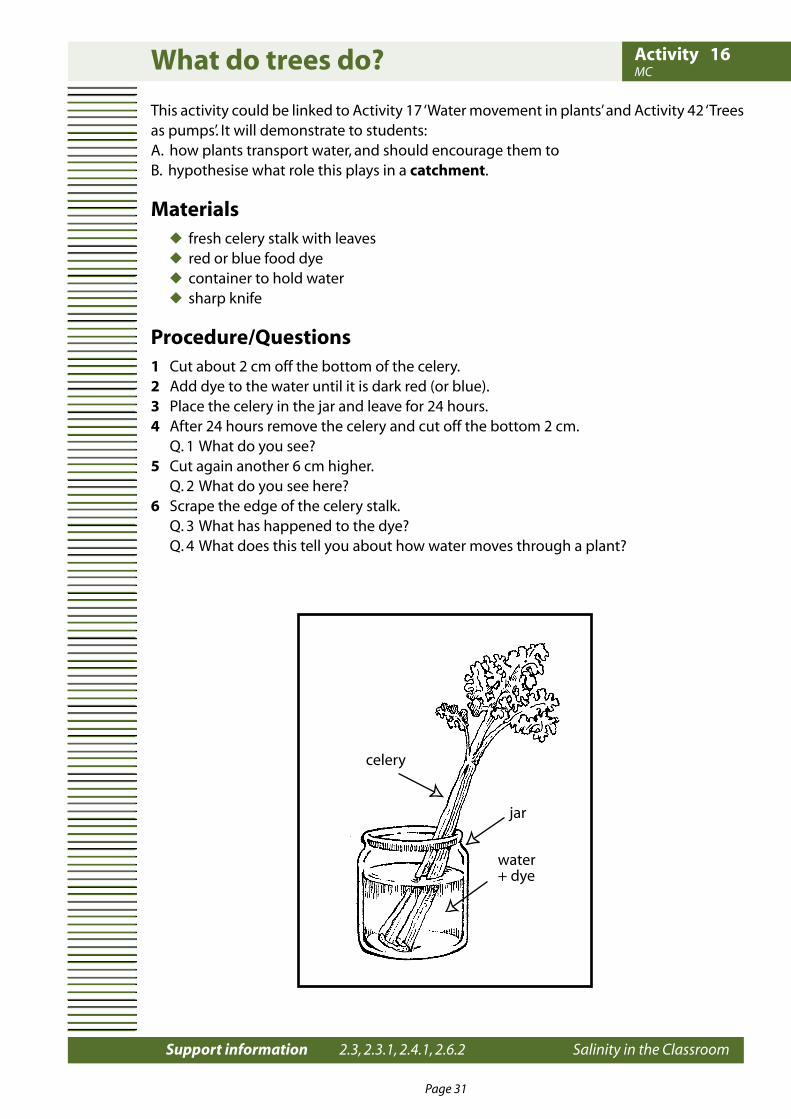
Activity Activity
Support information Salinity in the Classroom
Page 30
Support information Salinity in the Classroom
Page 31
What do trees do?
This activity could be linked to Activity 17 ‘Water movement in plants’ and Activity 42 ‘Trees as pumps’. It will demonstrate to students:A. how plants transport water, and should encourage them toB. hypothesise what role this plays in a catchment.
Materials fresh celery stalk with leaves red or blue food dye container to hold water sharp knife
Procedure/Questions 1 Cut about 2 cm off the bottom of the celery.2 Add dye to the water until it is dark red (or blue).3 Place the celery in the jar and leave for 24 hours.4 After 24 hours remove the celery and cut off the bottom 2 cm. Q. 1 What do you see? 5 Cut again another 6 cm higher. Q. 2 What do you see here? 6 Scrape the edge of the celery stalk. Q. 3 What has happened to the dye? Q. 4 What does this tell you about how water moves through a plant?
������
���
������ ���
16MC
2.3, 2.3.1, 2.4.1, 2.6.2
Activity
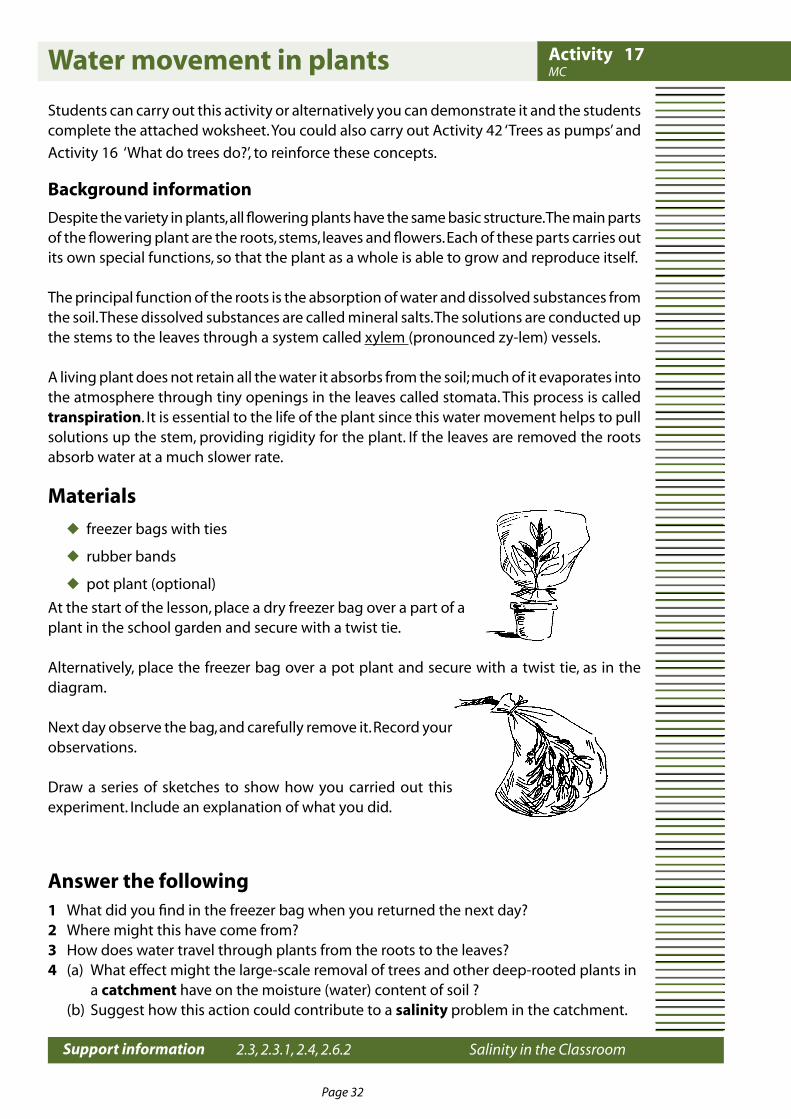
Activity Activity
Support information Salinity in the Classroom
Page 32
Support information Salinity in the Classroom
Page 33
Water movement in plants
Students can carry out this activity or alternatively you can demonstrate it and the students complete the attached woksheet. You could also carry out Activity 42 ‘Trees as pumps’ and
Activity 16 ‘What do trees do?’, to reinforce these concepts.
Background information
Despite the variety in plants, all flowering plants have the same basic structure. The main parts of the flowering plant are the roots, stems, leaves and flowers. Each of these parts carries out its own special functions, so that the plant as a whole is able to grow and reproduce itself.
The principal function of the roots is the absorption of water and dissolved substances from the soil. These dissolved substances are called mineral salts. The solutions are conducted up the stems to the leaves through a system called xylem (pronounced zy-lem) vessels.
A living plant does not retain all the water it absorbs from the soil; much of it evaporates into the atmosphere through tiny openings in the leaves called stomata. This process is called transpiration. It is essential to the life of the plant since this water movement helps to pull solutions up the stem, providing rigidity for the plant. If the leaves are removed the roots absorb water at a much slower rate.
Materials
freezer bags with ties
rubber bands
pot plant (optional)
At the start of the lesson, place a dry freezer bag over a part of a plant in the school garden and secure with a twist tie.
Alternatively, place the freezer bag over a pot plant and secure with a twist tie, as in the diagram.
Next day observe the bag, and carefully remove it. Record your observations.
Draw a series of sketches to show how you carried out this experiment. Include an explanation of what you did.
Answer the following1 What did you find in the freezer bag when you returned the next day?2 Where might this have come from?3 How does water travel through plants from the roots to the leaves?4 (a) What effect might the large-scale removal of trees and other deep-rooted plants in a catchment have on the moisture (water) content of soil ? (b) Suggest how this action could contribute to a salinity problem in the catchment.
17MC
2.3, 2.3.1, 2.4, 2.6.2
Activity

Activity Activity
Support information Salinity in the Classroom
Page 32
Support information Salinity in the Classroom
Page 33
18MC • EA
2.8, 2.8.1, 2.8.2
Salinity levels
This activity is designed so that students will attempt to describe the origin and extent of the salinity problem affecting Western Australia’s water resources.This activity can include the use of a salinity meter. Contact the Ribbons of Blue/Waterwatch WA Coordinator in your region should you require assistance to develop a teaching program or to provide advice. Visit (www.wrc.wa.gov.au/ribbons) for further details and contacts.
Background informationA good supply of clean drinking water is one of our most basic needs. Just to stay alive we need about two litres of water per day and that doesn’t include water for washing, cooking and other purposes.In Western Australia, on average, a family of four people uses around 200,000 litres of water annually. That’s a lot of water; in fact Australians are the highest water users in the world. Yet Australia is one of the driest continents on earth, with Western Australia one of its driest regions.Invisible forces are at work to spoil our water resources. This force is called salinity; that is, water containing dissolved salt. We can’t see the salt itself in the water but we can see its results. One way to tell whether water contains salt is by tasting.In this activity, students compare different salt concentrations by tasting. Students should set up one solution per group. Distilled or de-ionised water should be used.An unknown sample of the same salt concentration as a local creek source could be used to show students that salinity is a problem that affects all Western Australians, both rural and urban.
Discuss with students how water gets into rivers and lakes and what happens if salty water sits in a dam, pond or creek for a long time with no fresh water entering.
Materials distilled water 5 large bottles (e.g. plastic milk bottles) salt strips of filter paper
Procedure1 The class will set up two sets of salt water concentrations.2 Measure out your allotted amount of salt: 0.15 g, 1.00 g, 3.00 g or 35.00 g.3 Prepare your salt solution by adding the salt to 1 L of water. Label your solution.
Discussion questions: How does salt get into rivers and lakes? When a glass of salty water is put outside in summer, the salinity increases. Why? What happens if salty water sits in a dam, pond or creek for a long time with no
fresh water entering? Measure the salinity of the two water samples. Explain that conductivity in water is
measured using a salinity meter, in units called milliSiemens per metre. Using the information in Section Two 2.8.1, discuss the results.
Activity
Activity Activity
Support information Salinity in the Classroom
Page 34
Support information Salinity in the Classroom
Page 35
Salinity levels
Activity Taste test the salinity of water.
Ask students to compare their sample with others by looking, smelling and finally tasting (they may spit out the salty water). Provide students with a cup for spitting or carry out this activity out of doors.
Alternatively you could ask students to taste each of the solutions by dipping a strip of paper into the solutions and placing it on their tongues. Use a fresh strip of paper for each sample they taste.
Students can then compare the taste of the five known solutions with the taste of the unknown solution.
Further activities Make saline solutions at different concentrations. Students taste the samples and
rank them from saltiest to least salty.
Conversion of salinity units
Salinity Conversion factor Salinity Electrical conductivity (mS/m) x 5.5 = Total soluble salts (mg/L) Total soluble salts (mg/L) x 0.18 = Electrical conductivity (mS/m) Electrical conductivity (mS/m) x 10 = Electrical conductivity (uS/cm) Total soluble salts (mg/L) x 1 = Total soluble salts (ppm)
mS/m = milliSiemens per metre mg/L = milligrams per litre uS/cm = microSiemens per centimetre ppm = parts per million
18 cont.MC • EA
2.8, 2.8.1, 2.8.2
Activity
Activity Activity
Support information Salinity in the Classroom
Page 34
Support information Salinity in the Classroom
Page 35
Salinity and density
Students investigate the use of density as a method of rating salt solutions.
Materials hydrometers
salt solutions
measuring cylinders
Procedure1 Place the hydrometers in each of three measuring cylinders filled with different strength salt solutions.
2 Rank the solutions in order of increasing salinity from your hydrometer readings.
Solution Hydrometer reading
A
B
C
Compare and contrast1 Measure each solution with your ‘home made’ salinity meter (Activity 20) and an EC meter. 2 Can you define the relationships between the different measurements?3 What happens to the density of the water when more salt is added?4 Why does your hydrometer work? Explain why the hydrometer is able to tell us the density of the water.5 Use the library or the internet to find out about Archimedes. Why is the Archimedes principle important in understanding how a hydrometer works?6 Explain why you float better in the ocean than in a fresh-water lake.
19EA
2.1, 2.8.1, 2.8.2
Activity
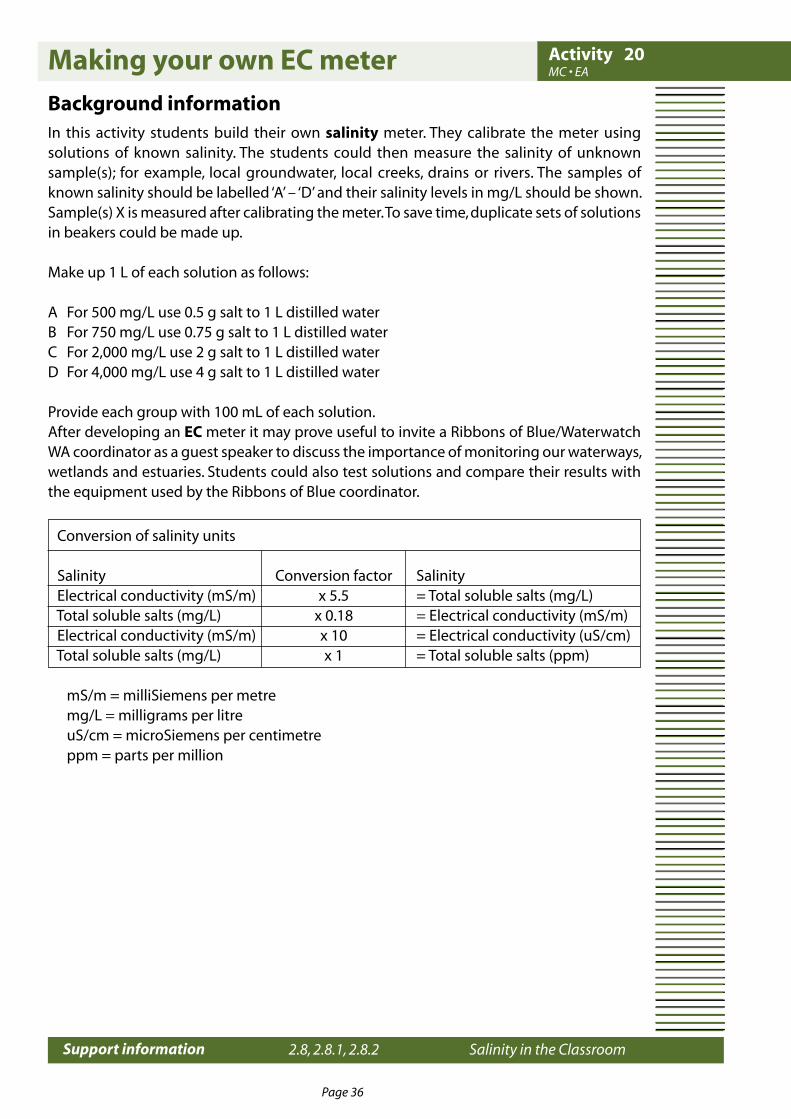
Activity Activity
Support information Salinity in the Classroom
Page 36
Support information Salinity in the Classroom
Page 37
Background informationIn this activity students build their own salinity meter. They calibrate the meter using solutions of known salinity. The students could then measure the salinity of unknown sample(s); for example, local groundwater, local creeks, drains or rivers. The samples of known salinity should be labelled ‘A’ – ‘D’ and their salinity levels in mg/L should be shown. Sample(s) X is measured after calibrating the meter. To save time, duplicate sets of solutions in beakers could be made up.
Make up 1 L of each solution as follows:
A For 500 mg/L use 0.5 g salt to 1 L distilled water B For 750 mg/L use 0.75 g salt to 1 L distilled waterC For 2,000 mg/L use 2 g salt to 1 L distilled waterD For 4,000 mg/L use 4 g salt to 1 L distilled water
Provide each group with 100 mL of each solution.After developing an EC meter it may prove useful to invite a Ribbons of Blue/Waterwatch WA coordinator as a guest speaker to discuss the importance of monitoring our waterways, wetlands and estuaries. Students could also test solutions and compare their results with the equipment used by the Ribbons of Blue coordinator.
MC • EA
2.8, 2.8.1, 2.8.2
Making your own EC meter 20
Conversion of salinity units
Salinity Conversion factor Salinity Electrical conductivity (mS/m) x 5.5 = Total soluble salts (mg/L) Total soluble salts (mg/L) x 0.18 = Electrical conductivity (mS/m) Electrical conductivity (mS/m) x 10 = Electrical conductivity (uS/cm) Total soluble salts (mg/L) x 1 = Total soluble salts (ppm)
mS/m = milliSiemens per metre mg/L = milligrams per litre uS/cm = microSiemens per centimetre ppm = parts per million
Activity

Activity Activity
Support information Salinity in the Classroom
Page 36
Support information Salinity in the Classroom
Page 37
Making your own EC meter
Student handout and worksheetYour goal is to construct a simple circuit that can be used to measure electrical conductivity and to calibrate the meter using solutions of known salinity.
Materials (necessary care should be taken when using these materials)
DC power supply Ammeter (O-5A) 2 copper electrodes switchwires alligator clips distilled water beakers 5 solutions of different salinity (labelled A - D, X)
Procedure1 Connect the parts of the circuit as per the following diagram:
N.B. Wire the negative terminal of the ammeter to the negative terminal of the power supply.
2 Clean the electrodes and place them in a beaker containing one of the salt solutions (only use 100 mL of solution). Close the switch and record the reading on the ammeter. Be sure to keep the electrodes at a constant and specified distance apart, to enable comparison of results.
20 cont.MC • EA
2.8, 2.8.1, 2.8.2
Activity

Activity Activity
Support information Salinity in the Classroom
Page 38
Support information Salinity in the Classroom
Page 39
Making your own EC meter
SOLUTION AMMETER RANK EC READING READING (1 = most salty)
A
B
C
D
3 Repeat the exercise for the other salt solutions (clean the electrodes in distilled water each time).
4 Arrange the solutions A to D in order of increasing salinity.
5 Verify your results with an EC meter.
6 Graph the results.
7 Using the ‘home made’ salinity meter, and your graph, predict the salinity of solution X.
8 Verify your prediction with an EC meter.
Predicted value of solution X using ammeter (mg/L): ...................................................................
EC value of solution X using EC meter (mg/L):..................................................................................
��������������������
�������� ������
20 cont.MC • EA
2.8, 2.8.1, 2.8.2
Activity
Activity Activity
Support information Salinity in the Classroom
Page 38
Support information Salinity in the Classroom
Page 39
Testing for soil salinity
Students could make an EC meter (see Activity 20) to determine the approximate salt content of the soil samples.
Materials EC meter
dry soil samples (e.g. oven-dried)
100 mL beaker
distilled water
stirring rod
standard salt solution
NB: Three or four samples should be collected from the site area and thoroughly mixed together, to provide a representative sample. The soil can then be dried in an oven (approximately one hour at 150˚C).
Procedure1 Weigh out 10 grams of dry soil.2 Grind the soil sample with a mortar and pestle or a rolling pin until all of the lumps are gone. Remove any gravel.3 Put the 10 g of soil into a 100 mL beaker and add 50 mL of distilled water. (Soil salinity is conventionally determined by a 1:5 ratio.)4 Stir thoroughly then let stand for at least 5 minutes.5 Calibrate the EC meter using a standard solution.6 Stir the soil/water mixture again.7 Test the salinity of the soil/water mixture and record the result.
21EA
2.8, 2.8.1, 2.8.2
Activity

Activity Activity
Support information Salinity in the Classroom
Page 40
Support information Salinity in the Classroom
Page 41
Effect of salination on crop germination
Students investigate the effect of salinity on crop germination.
Background informationThis experiment is best run over a period of one to two weeks, in order to give the seeds adequate time to germinate. Bean and sunflower seeds are suggested, however, seeds of barley, alfalfa (lucerne), wheat, oats, mung beans and millet are equally worth investigation. Students may compare results for different seeds.
Materials seeds of sunflowers and beans (or whatever is chosen)
10 petri dishes
filter papers
distilled water
5 salt solutions at the following concentrations in plastic squash (‘squirt’) bottles: 1) distilled water 2) 2.5 grams salt per litre distilled water 3) 5 g/L 4) 10 g/L 5) 15 g/L
plastic film (‘glad wrap’)
Note: by conventional standards salinity is measured in mg/L or milli Siemens. (G/L have been used in this instance for ease of measurement per litre.)
Procedure1 Place filter paper in the bottom of each petri dish.
2 Label two dishes ‘A’, two dishes ‘B’ etc. until all are labelled (‘A’ to ‘E’).
3 Spread bean seeds (not too thickly) across the filter paper on one dish ‘A’. Do the same with sunflower seeds in the other dish ‘A’. (Other seeds, as listed above in ‘Background’, can be used.)
4 Repeat step 3 for each of the remaining dishes ‘B’ - ‘E’. There should be five bean dishes and five sunflower dishes, making ten in all.
5 Add distilled water to each dish ‘A’. Add sufficient only to moisten the seeds - excess water is not necessary.
6 Repeat for each of the remaining dishes, using the salt solutions, solution ‘B’ on dishes ’B’, solution ‘C’ on dishes ‘C’, etc.
7 Cover each dish with plastic film to prevent it drying out. Place the dishes on a bench in a safe place (need not be in direct sunlight).
8 Check every two days and add solution as necessary to keep the seeds moist. At each check, count the number of germinated seeds.
9 Continue checking and recording over a period of one to two weeks.
22MC • EA
2.4, 2.4.2, 2.6, 2.6.3, 2.7.2
Activity

Activity Activity
Support information Salinity in the Classroom
Page 40
Support information Salinity in the Classroom
Page 41
Worksheet1 Record the results in a table (one table for each seed type):
Seed type:
Salt concentration No. of germinated seeds 1st count 2nd etc. final class total
A
B
C
D
E
2 Draw bar graphs of the results, showing the bars for beans in one colour and sunflowers in another.
3 What effect does salt appear to have on seed germination? Explain.
4 How did the two kinds of seed respond to the salt solutions? Point out any differences between them. Discuss.
5 What are the implications for farmers in salt-affected areas?
Effect of salination on crop germination 22 cont.MC • EA
2.4, 2.4.2, 2.6, 2.6.3, 2.7.2
Activity
Activity Activity
Support information Salinity in the Classroom
Page 42
Support information Salinity in the Classroom
Page 43
The effect of salt on seed germination
Background informationSalt in the topsoil causes many problems on farmland. In this activity students investigate the effect of various salt concentrations on the germination of seeds.
Plants have two ways of coping with salt ions: they either take them in or they exclude them. The salt-excluding are less salt-tolerant than plants that take in salt ions.
Saltbush seeds could be compared with cereals and are available from Kimseed, 42 Sarich Court, Osborne Park, Western Australia, (telephone (08) 9446 4377). www.kimseed.com.au or [email protected].
Prior to carrrying out this activity ask students to infer reasons why a particular organism is adapted to a particular environment and to cite examples of structural, behavioural and physiological adaptations.
Some discussion on some of Western Australia’s environmental problems would also be useful.
Materials (per group) access to seeds (select from: wheat, barley, oats, saltbush, alfalfa (lucerne), mung
beans and sunflowers) 5 petri dishes sticky labels filter paper distilled water salt solutions: 2.5 g/L (grams of salt per litre) 5.0 g/L, 10 g/L, 15 g/L (note: 2.5g/L =
approx. 1⁄2 level tspn per litre.)
Note: by conventional standards salinity is measured in mg/L or milliSiemens. Grams have been used in this instance for ease of measurement.
Conversion of salinity units
Salinity Conversion factor Salinity Electrical conductivity (mS/m) x 5.5 = Total soluble salts (mg/L) Total soluble salts (mg/L) x 0.18 = Electrical conductivity (mS/m) Electrical conductivity (mS/m) x 10 = Electrical conductivity (uS/cm) Total soluble salts (mg/L) x 1 = Total soluble salts (ppm)
mS/m = milliSiemens per metre mg/L = milligrams per litre uS/cm = microSiemens per centimetre ppm = parts per million
22a MC • EA
2.4, 2.4.2, 2.6, 2.6.3, 2.7.2
Activity

Activity Activity
Support information Salinity in the Classroom
Page 42
Support information Salinity in the Classroom
Page 43
Effect of salt on seed germination
Worksheet ASalinity is one of Australia’s most serious environmental problems. Many thousands of hectares of farmland are lost each year to salinity. What is the effect of salinity on the germination of plants grown by farmers?
Materials (per group) access to seeds (same variety as Activity 22) 5 petri dishes sticky labels filter paper distilled water salt solutions: 2.5 g/L (grams of salt per litre) 5.0 g/L, 10 g/L, 15 g/L
Procedure1 Label the lid of the first petri dishes ‘A’, the next one ‘B’, and so on to ‘E’. To each label add the date and your group name or number.
2 Place filter paper in each of the petri dishes.
3 Count out 50 seeds in five lots of 10.
4 Moisten Dish ‘A’ with distilled water and spread 10 seeds on the filter paper. Place
the lid on the dish.
5 Moisten Dish ‘B’ with 2.5 g/L salt solution and spread 10 seeds on the filter paper.
Place the lid on the dish.
6 Complete the remaining dishes using 5 g/L on Dish C’, 10 g/L on Dish ‘D’ and 15 g/L on dish ‘E’.
7 For two weeks, check the seeds for signs of germination every time you return to class. Record your observations in a table like the one below. (Keep seeds moist over
the germination period.)
22a cont.MC • EA
2.4, 2.4.2, 2.6, 2.6.3, 2.7.2
Number of germinated seeds
Dish A Dish B Dish C Dish D Dish E Date (0 g/L) (2.5 g/L) (5 g/L) (10 g/L) (15 g/L)
Activity
Activity Activity
Support information Salinity in the Classroom
Page 44
Support information Salinity in the Classroom
Page 45
Effect of salt on seed germination
Worksheet B
Alternative activity
1 What effect does salt have on seed germination?
The following materials will assist you in carrying out an investigation to enable you to
answer this question.
Materials (per group)
access to 5 different seeds
5 petri dishes
sticky labels
filter paper
distilled water
salt solutions (2.5 g/L (grams of salt per litre) 5.0 g/L, 10 g/L, 15 g/L)
2 Write a procedure for carrying out this investigation.
3 Show your procedure to your teacher.
4 Carry out your investigation and complete the questions on Worksheet C.
22a cont.MC • EA
2.4, 2.4.2, 2.6, 2.6.3, 2.7.2
Activity

Activity Activity
Support information Salinity in the Classroom
Page 44
Support information Salinity in the Classroom
Page 45
Effect of salt on seed germination
Worksheet CMake a prediction about the outcome of this experiment. Which dish will have the worst germination? Which dish will have the best? Explain why.
..................................................................................................................................................................................
..................................................................................................................................................................................
..................................................................................................................................................................................
..................................................................................................................................................................................
Looking at your results1 Display your results in a graph. (Your choice e.g. bar, column or pie.)
2 What effect does salt have on seed germination?
..................................................................................................................................................................................
..................................................................................................................................................................................
..................................................................................................................................................................................3 What effects do you think salt has on the crops farmers grow?
..................................................................................................................................................................................
..................................................................................................................................................................................
..................................................................................................................................................................................
Try this1 Compare the effect of saline water on the germination of cereal crops such as wheat, oats and barley. These are the main cereal crops grown in Western Australia. Are there differences?
2 Saltbush is often grown on saline soils. You could investigate how well it germinates using different salt concentrations.
3 Other seeds worth investigating are those of alfalfa (lucerne), mung beans and sunflowers.
4 Do all salts have the same effect on germination?
22a cont.MC • EA
2.4, 2.4.2, 2.6, 2.6.3, 2.7.2
Activity
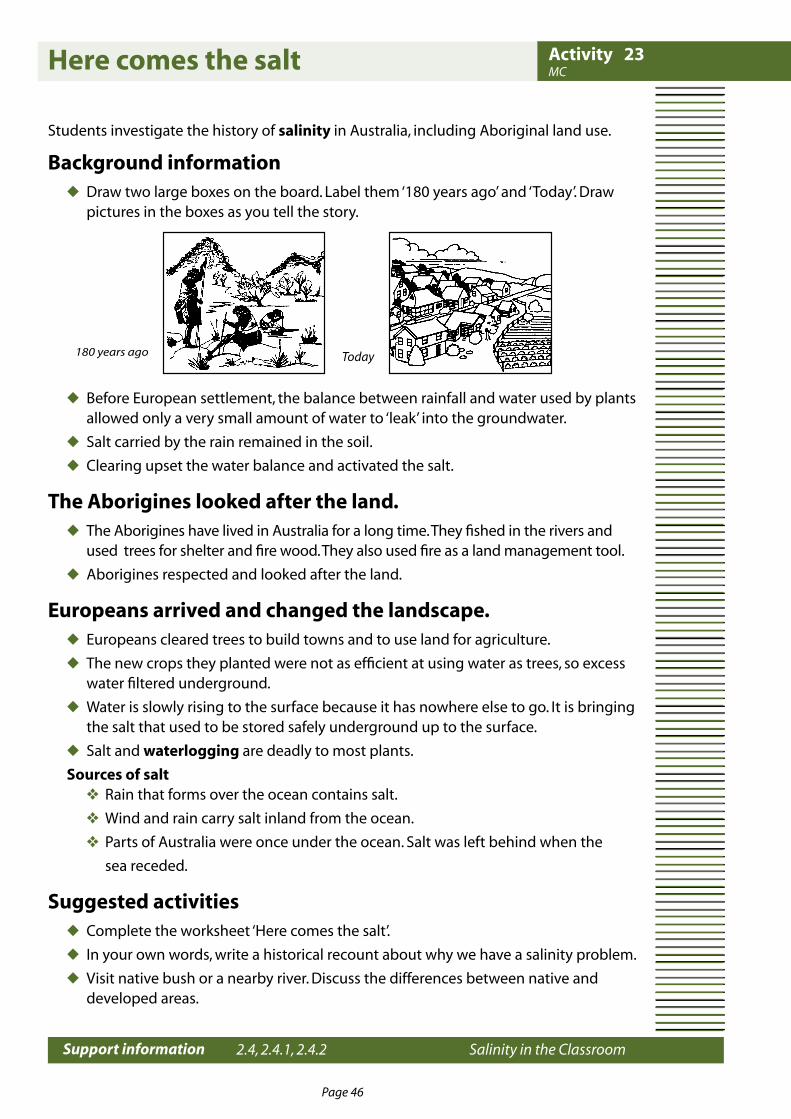
Activity Activity
Support information Salinity in the Classroom
Page 46
Support information Salinity in the Classroom
Page 47
Here comes the salt
Students investigate the history of salinity in Australia, including Aboriginal land use.
Background information Draw two large boxes on the board. Label them ‘180 years ago’ and ‘Today’. Draw pictures in the boxes as you tell the story.
Before European settlement, the balance between rainfall and water used by plants allowed only a very small amount of water to ‘leak’ into the groundwater.
Salt carried by the rain remained in the soil.
Clearing upset the water balance and activated the salt.
The Aborigines looked after the land. The Aborigines have lived in Australia for a long time. They fished in the rivers and used trees for shelter and fire wood. They also used fire as a land management tool.
Aborigines respected and looked after the land.
Europeans arrived and changed the landscape. Europeans cleared trees to build towns and to use land for agriculture.
The new crops they planted were not as efficient at using water as trees, so excess water filtered underground.
Water is slowly rising to the surface because it has nowhere else to go. It is bringing the salt that used to be stored safely underground up to the surface.
Salt and waterlogging are deadly to most plants.
Sources of salt Rain that forms over the ocean contains salt.
Wind and rain carry salt inland from the ocean.
Parts of Australia were once under the ocean. Salt was left behind when the
sea receded.
Suggested activities Complete the worksheet ‘Here comes the salt’.
In your own words, write a historical recount about why we have a salinity problem.
Visit native bush or a nearby river. Discuss the differences between native and developed areas.
Today180 years ago
2.4, 2.4.1, 2.4.2
23MC
Activity
Activity Activity
Support information Salinity in the Classroom
Page 46
Support information Salinity in the Classroom
Page 47
Here comes the salt
Worksheet trees farming Aboriginals river dying years underground crops food salt trees
Australian soils are naturally high in . For millions of most of the salt was stored safely underground where it could not harm plants and animals.
When European settlers arrived they did not understand the Australian environment, unlike the who had lived here for thousands of years. The Aborigines looked after the bushland and rivers. They used the for fishing and canoeing and the for shelter and firewood.
The European settlers needed water, , shelter and clothing. The only way they knew to produce it was by the European way. The settlers cleared the forest and scrub to create open spaces for pasture and .
The new crops did not use as much water as the they replaced. The excess water had nowhere to go except to soak downwards. This undergroundwater is slowly moving to the surface, bringing with it the salt that was deep underground. Now trees and plants are because the soil and water is too salty.
Draw or find two pictures showing your local area
180 years ago Today
23 cont.MC
2.4, 2.4.1, 2.4.2
Activity

Activity Activity
Support information Salinity in the Classroom
Page 48
Support information Salinity in the Classroom
Page 49
The watertable
Students compare how different land uses affect the watertable.
Background informationGroundwater is water that is found underground, in the saturated zone. The watertable is the upper level of the groundwater. Watertable depth is the distance from ground level to the top of the groundwater. A watertable at 2 metres means that the groundwater is 2 metres below the surface. In many parts of Western Australia the watertable is rising. This means that groundwater is moving closer to the surface. It is a problem when the watertable is less than 2 metres from the surface, as this can cause waterlogging and bring salts into the plant root zone.
Replacing big thirsty trees that have deep roots with shallow-rooted crops (e.g. wheat, lupins and most grasses) means that less groundwater is used. The ground is like a bath that is slowly filling up with water. The water has nowhere to go except to slowly move up to the surface, bringing the salt with it. This makes the soil and water salty (for further information on this topic refer to Section Two).
Extension activities Investigate what is happening to the watertable in your area.
Invite a guest speaker to your class to talk about this topic. Contact the Department of Agriculture’s Rural Towns Program (9368 3333).
24MC
2.4, 2.4.1, 2.4.2
Activity

Activity Activity
Support information Salinity in the Classroom
Page 48
Support information Salinity in the Classroom
Page 49
The watertable
Worksheet Colour the area below the watertable blue.
Salt is often found in undergroundwater. Colour the spots yellow to show that salt occurs within the watertable.
Answer the following questions
1 Why is the watertable closer to the surface after clearing the trees?
2 What problems can be caused when the watertable is near the surface?
3 Examine the diagrams below and suggest/list four things that we can do to stop
the watertabie rising. (For further information refer to Section Two of this resource.)
4 Why are farmers concerned about the watertable rising?
24 cont.MC
2.4, 2.4.1, 2.4.2
������ ��������
����������
����� ��������
����������
Activity

Activity Activity
Support information Salinity in the Classroom
Page 50
Support information Salinity in the Classroom
Page 51
Raining tennis balls
Background informationDeep-rooted trees (as opposed to shallow-rooted crops and pastures) are able to use the majority of rainfall that falls on them. Only a small amount of discharge or run-off flows to the bottom of the catchment or valley floor. With less discharge there is a corresponding lower amount of groundwater. Less run-off reduces water levels, reduces the impact of water erosion and reduces salinity levels (particularly in valley floors).
Materials 20+ tennis balls (painted or dyed blue if possible). Any open area with a slope (to represent a catchment) A group of people (10+ will suffice, although 20 is a good number)
Procedure
Part 1Place the participants around the sloped area, preferably towards the top and around the sides. Make sure that you leave 1 to 3 participants out, as they will be required for other duties.
Question: Ask the group “What do we call the area that we are standing in?”
Answer: We are standing in a catchment (a natural drainage area, bounded by sloping ground, hills or mountains, from which all run-off water flows to a low point which may be a creek, river, lake etc. Use a shower as an analogy. Shower screen and walls are the higher area that flows into the drain hole. Fremantle is the ‘drain hole’ for the Swan-Avon catchment.
Tell the members of the group that are standing in the mini-catchment that they are representing trees. As they are trees they are not allowed to move their feet (trunks/roots) but they are allowed to bend over and move their arms (branches). The other members of the group not standing in the catchment are given as many tennis balls as they can hold.
Question: What do you think the tennis balls represent?
Answer: Rain or raindrops.
Instruct the members of the group with the tennis balls that, on the count of three, they have to throw the balls up in the air above the group standing in the catchment.
The members of the group in the catchment have to catch as many tennis balls as they can when the rest of the group throws them in the air.
25MC • EA
2.4, 2.4.1, 2.4.2, 2.6.3
Activity

Activity Activity
Support information Salinity in the Classroom
Page 50
Support information Salinity in the Classroom
Page 51
Raining tennis balls
Question: What is another name for the rainfall entering the system?
Answer: Recharge.
Question: What do we call the ‘rain’ (tennis balls) that hasn’t been caught?
Answer: Run-off. This part of the activity should result in only a small number of tennis balls not being caught; therefore there should be little ‘run-off’.
Part 2The idea of the next part of the activity is to simulate the clearing of woodlands throughout the agricultural regions of the State. Approximately 18.5 million ha of land has been cleared in WA since 1826. In the wheatbelt there is only 2 million ha of remnant bush remaining. The Shire of Tammin is one of the most cleared shires in the State, with approximately 2% remnant woodland remaining.
Question: Why have all the trees and bush in the wheatbelt (and other agricultural regions) been cleared?
Answer: To enable farmers to grow crops such as wheat, barley etc. and allow pasture to grow for livestock.
Note: New landowners were encouraged to clear the land that they were taking up. This was particularly so of the Brand Government of the 1950s. If the land was not cleared, the owner would lose their property (conditional purchase). Earlier this century landowners were paid money for the number of acres of trees that they cleared.
Question: How many people would have to be removed from the catchment to leave behind 5% (of participants)?
Answer: In a group of 20, one person would equate to 5%.
Ask all but the 5% (i.e. 1 person in 20) to leave the mini catchment.Question: What does this part of the activity represent?
Answer: Clearing of trees in the wheatbelt/agricultural regions.
The visual impact of removing all but one person from the mini-catchment is quite profound. The mini catchment goes from being crowded with people to having just one person. This is a significant part of the activity that should be related to students at this stage.
The Shire of Tammin has 2% remnant woodland remaining. To try and simulate this figure ask the remaining person (‘tree’) to place one hand behind their back. Distribute the tennis balls (same number as for the first part of the activity) to the remainder of the group and ask them to spread themselves around the edge of the catchment.
Instruct the members of the group with the tennis balls that, on the count of three, they have to throw the balls up in the air above the person (‘tree’) standing in the catchment. The ‘tree’ has to try and catch as many balls as possible (difficult with only one hand).
25 cont.MC • EA
2.4, 2.4.1, 2.4.2, 2.6.3
Activity

Activity Activity
Support information Salinity in the Classroom
Page 52
Support information Salinity in the Classroom
Page 53
Raining tennis balls
Question: Was there more or less discharge than in the previous part of the activity?
Answer: More (should be).
This part of the activity should result in a large number of tennis balls (‘rain’) rolling down the catchment as run-off (discharge). The loss of deep-rooted trees, replaced by shallow- rooted crops or pastures results in less recharge (rainfall) water being used in the system. This increases groundwater levels, water erosion and, ultimately, salinity levels.
ConclusionDiscuss with the participants some of the consequences that over-clearing can create. Be sure to identify the social aspects of this problem (e.g. landowners were required to clear their land, or lose it), as well as the scientific component. This discussion should then lead to possible answers to the problem - ways in which water usage can be increased e.g. tree planting, changing agricultural practices, interceptor and contour banks (see Section Two for more detail).
With student groups ask them how they could help fix a problem like this. Ask them what are the consequences of some of their actions that might be related to this or similar problems. The idea of this line of questioning is to get students to question their values about the environment and about being a member of the wider community.
Other activitiesOther activities that are related to this and involve simulations in a mini catchment include: Have all members of the group stand at the top of a number of mini catchments that are
alongside each other. Then have them all run down to the bottom of their catchments. What should happen is that all of the groups that were at the top of each catchment will end up all together at the bottom of the catchment. This shows that adjacent mini- (or sub) catchments are linked to each other to form larger catchments (e.g. number of catchments that make up the Swan-Avon catchment).
Have the members of the group stand around the top of a catchment with a number of different types of balls (e.g. tennis balls, golf balls, cricket balls, basket balls etc.) and have them roll them down the sides of the catchment. All (or the majority) of the balls should accumulate at the bottom of the catchment (the valley floor). The different types of balls can represent different materials entering the system e.g. rain, salt, nutrients, pollutants, soil etc. The aim of this activity is to show that what happens at the top of the catchment has an effect (usually magnified) on the bottom of the catchment. This idea is particularly useful in explaining why landowners work in catchment groups to address the land degradation problems that are affecting their districts.
Have all students draw a series of cartoons depicting the actions that took place in the activity. Replace people with trees, balls with raindrops etc.Ask students to write a caption under each drawing explaining the activities and outcomes.
MC • EA25 cont.
2.4, 2.4.1, 2.4.2, 2.6.3
Activity

Activity Activity
Support information Salinity in the Classroom
Page 52
Support information Salinity in the Classroom
Page 53
Salt’s on the rise
Background informationIn this demonstration students examine the ways in which humans can affect the water cycle. Students look at the interaction between groundwater and rainfall and how plants and humans affect this relationship.
Prior to carrying out this demonstration discuss with students the origin and extent of the salinity problem affecting Western Australia’s water resources and the ways in which people can affect the water cycle. (For further information on the water cycle refer to Section Two).
Materials (per group) a small aquarium aquarium gravel or blue metal plastic drinking straw model trees and shrubs food dye or salt a length of clear plastic tubing carton
Procedure1 Place the plastic tubing in the aquarium with one end in the bottom and the other end (with the funnel) hanging over the edge of the aquarium.2 Place a layer of gravel in the aquarium.3 Sprinkle salt or food dye over the top of the layer.4 Place the remainder of the gravel in the aquarium and shape into a bowl.5 Place model trees and shrubs in the gravel. You now have a much simplified model catchment. Discuss its features: deep subsoil layer containing much salt, originally brought in by the rain and left behind after vegetation has used the water;
plants (and animals); and
water falling in the catchment will flow to a common drain.
6 Introduce water through the clear plastic tubing until the level is just below the layer of salt/food dye. (The use of the tube gives you control over the moment of mixing of water and salt or food dye.) You now have ‘groundwater’ and a watertable.7 Push the straw into the ‘groundwater’ and observe the watertable when suction is applied to the straw. This can serve as a model for the pumping action of deep-rooted vegetation.8 Remove the trees and shrubs as would happen in the process of clearing for agriculture.9 Insufficient rainfall is used by crops and pastures on farms and some rainfall will reach the watertable; hence, groundwater rises. Add more water to the aquarium; this is the process of groundwater recharge.10 After years of recharge the watertable is close to the surface. It is now salty, because it has dissolved the salt in the process
26 EA
2.4, 2.4.1, 2.4.2, 2.6.3
Activity

Activity Activity
Support information Salinity in the Classroom
Page 54
Support information Salinity in the Classroom
Page 55
Salt’s on the rise
Ask students to:11 Taste or observe the colour of the water at the surface.
12 Consider what they would do to lower the watertable. Possible answers would be:
maintain native vegetation,
plant trees and high water-use crops high in the catchment which would prevent recharge;
lower the watertable on the lowlands by planting salt-tolerant trees and shrubs, or
if water can be discharged safely, dig drains.
26 cont.EA
2.4, 2.4.1, 2.4.2, 2.6.3
Activity

Activity Activity
Support information Salinity in the Classroom
Page 54
Support information Salinity in the Classroom
Page 55
Detective Crow discovers the Salt Monster
Background informationApproximately 90% of the vegetation in the Western Australian wheatbelt has been cleared, leading to rising watertables, salinisation of land and rising salinity levels in the waterway.
Discussion Discuss with students the water cycle, and that as part of the water cycle, seawater
evaporates carrying with it small amounts of salt into the air and that when it rains, salt is deposited onto the land and some seeps down through the soil to be stored in the groundwater.
Discuss with students the role of native trees and shrubs in achieving a hydrological balance between the rainfall and the water used by plants. Discuss how this hydrological balance prevents the groundwater levels from rising and bringing salt to the surface.
Brainstorm the ways in which this balance can be upset e.g. roads buildings shallow-rooted annual crops and pastures.
Discuss with students what happens when the hydrological balance is upset, and the watertable begins to rise, bringing the salt to the surface so that many existing plants will find the soil too salty and die.
Activities Read the cartoon. Discuss the following:
What product is grown on farms and produces the bread we eat? If the groundwater rises it brings with it salt from deep within the earth. What will happen to the wheat crops?
If the farmland is turning salty does it affect people in urban areas? In the cartoon, the salt monster represents salinity. What damage is it doing along
its trail of destruction?
Briefly answer the following questions In frame 1 Detective Crow says that many farmers are worried about salt. Why is this? Briefly explain the reasons why the groundwater rises to the surface of the ground. In frames 3/4 plants and animals are dying. List them and explain why this is so. (See
if you can find out what the salt levels are that some of these animals can tolerate.)
Extension In small groups develop your own cartoon which shows a balanced and healthy
catchment.
27MC • EA
2.4, 2.4.1, 2.4.2, 2.6.3
Activity

Activity Activity
Support information Salinity in the Classroom
Page 56
Support information Salinity in the Classroom
Page 57
Notes relating to the cartoon
Frame I (top left) - The Salt Monster is a Growing Menace. The Salt Monster is a watery beast. The particles within its body represent dissolved
salts. The trail of salinity will be in the valleys of landscapes. As the saline groundwater
rises, it is the low areas that are generally affected first. The native trees and shrubs as well as our crops and pastures will suffer. (Seen here
by the tree trying to avoid the increasingly salty groundwater).
Frame 2 (top right) - It’s a problem of rising groundwater. The Salt Monster is dissolving salt that is stored in the soil (the Salt Monster
reaching out to grab salt crystals in the soil). As the groundwater rises more salt can be dissolved.
The groundwater is rising because we have upset the natural water balance by removing deep-rooted native vegetation.
The problem is hidden below the soil surface. Often it is not until trees and shrubs begin to die that we become aware of a problem. The farmer on the left is drilling down to test the water.
Frame 3 (bottom left) - Salinity is a catchment issue. The small patch of saline soil (on the left) will often indicate a far bigger problem
is looming. Fresh groundwater that is used to water stock (windmill) often becomes saline,
making it useless for the farmer. Saline groundwater enters natural streams and rivers increasing their salinity levels.
Many of the wetlands in Western Australia’s farming areas are now saline (cows) which has dramatically impacted on the life within the wetland (frog on the stretcher).
Frame 4 (bottom right) - Salinity in the catchment affects us all Some country towns are also suffering from salinity. Rising saline groundwater is
damaging sections of our country roads, water pipes, public and private buildings, railways, fences and dams, costing our community many millions of dollars in repairs.
Many rivers and streams are now too salty to be used for drinking water (children tasting the tap water).
Rising salinity is threatening the viability of salt sensitive fruits and vegetables. Even salt resistant irrigated pastures on dairy farms are less productive.
Unfortunately, although we know the salinity is principally caused by the removal of deep-rooted native vegetation we are still removing trees (bulldozer).
Often increased drainage is used to halt the spread of salt. However, this saline water can create a host of environmental issues (duck leaving town) if it not disposed of safely.
27 cont.MC • EA
2.4, 2.4.1, 2.4.2, 2.6.3
Detective Crow discovers the Salt Monster Activity
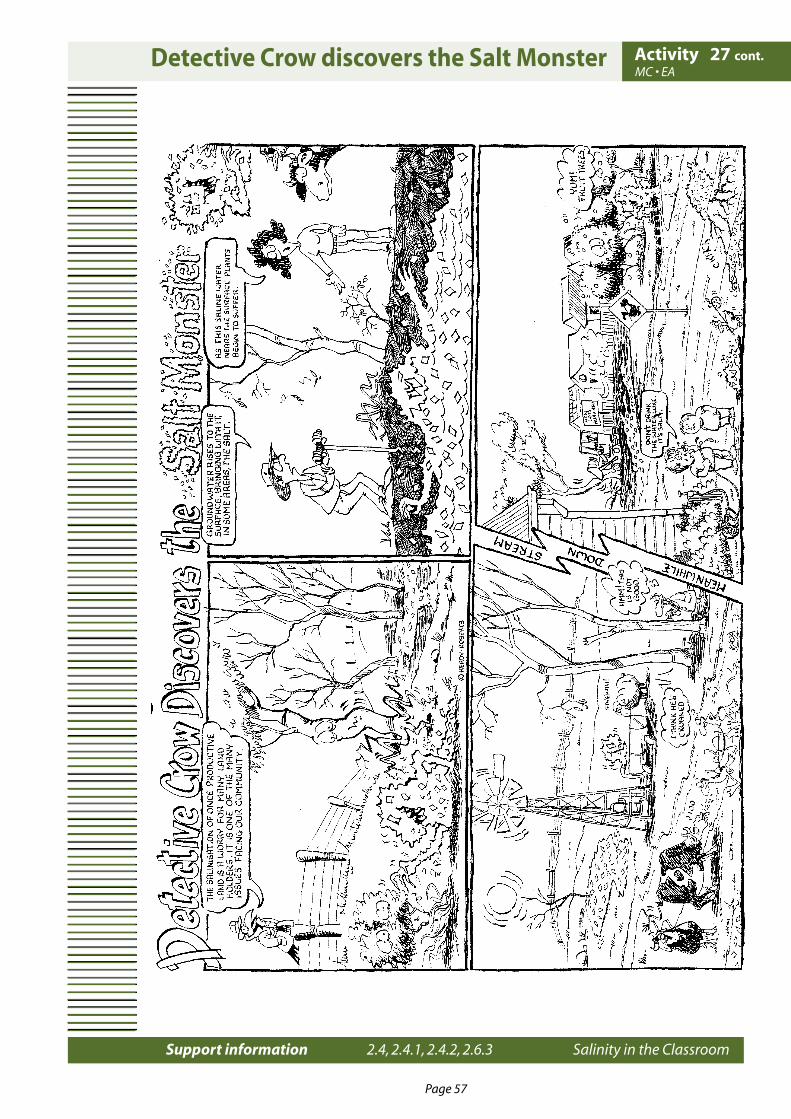
Activity Activity
Support information Salinity in the Classroom
Page 56
Support information Salinity in the Classroom
Page 57
Detective Crow discovers the Salt Monster 27 cont.MC • EA
2.4, 2.4.1, 2.4.2, 2.6.3
Activity
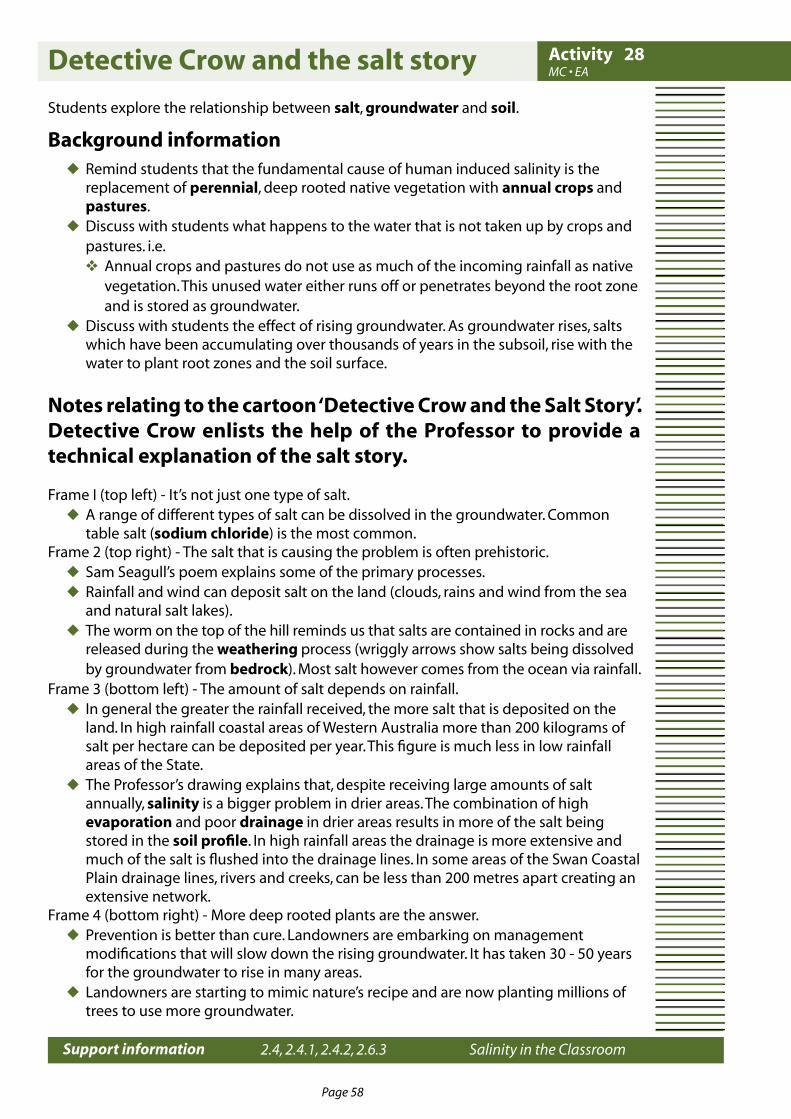
Activity Activity
Support information Salinity in the Classroom
Page 58
Support information Salinity in the Classroom
Page 59
Detective Crow and the salt story
Students explore the relationship between salt, groundwater and soil.
Background information Remind students that the fundamental cause of human induced salinity is the
replacement of perennial, deep rooted native vegetation with annual crops and pastures.
Discuss with students what happens to the water that is not taken up by crops and pastures. i.e. Annual crops and pastures do not use as much of the incoming rainfall as native
vegetation. This unused water either runs off or penetrates beyond the root zone and is stored as groundwater.
Discuss with students the effect of rising groundwater. As groundwater rises, salts which have been accumulating over thousands of years in the subsoil, rise with the water to plant root zones and the soil surface.
Notes relating to the cartoon ‘Detective Crow and the Salt Story’. Detective Crow enlists the help of the Professor to provide a technical explanation of the salt story.
Frame I (top left) - It’s not just one type of salt. A range of different types of salt can be dissolved in the groundwater. Common
table salt (sodium chloride) is the most common.Frame 2 (top right) - The salt that is causing the problem is often prehistoric.
Sam Seagull’s poem explains some of the primary processes. Rainfall and wind can deposit salt on the land (clouds, rains and wind from the sea
and natural salt lakes). The worm on the top of the hill reminds us that salts are contained in rocks and are
released during the weathering process (wriggly arrows show salts being dissolved by groundwater from bedrock). Most salt however comes from the ocean via rainfall.
Frame 3 (bottom left) - The amount of salt depends on rainfall. In general the greater the rainfall received, the more salt that is deposited on the
land. In high rainfall coastal areas of Western Australia more than 200 kilograms of salt per hectare can be deposited per year. This figure is much less in low rainfall areas of the State.
The Professor’s drawing explains that, despite receiving large amounts of salt annually, salinity is a bigger problem in drier areas. The combination of high evaporation and poor drainage in drier areas results in more of the salt being stored in the soil profile. In high rainfall areas the drainage is more extensive and much of the salt is flushed into the drainage lines. In some areas of the Swan Coastal Plain drainage lines, rivers and creeks, can be less than 200 metres apart creating an extensive network.
Frame 4 (bottom right) - More deep rooted plants are the answer. Prevention is better than cure. Landowners are embarking on management
modifications that will slow down the rising groundwater. It has taken 30 - 50 years for the groundwater to rise in many areas.
Landowners are starting to mimic nature’s recipe and are now planting millions of trees to use more groundwater.
MC • EA28
2.4, 2.4.1, 2.4.2, 2.6.3
Activity
Activity Activity
Support information Salinity in the Classroom
Page 58
Support information Salinity in the Classroom
Page 59
Detective Crow and the salt story
WorksheetIn this cartoon Detective Crow enlists the help of a Professor to provide a technical explanation of the salt story.Read the cartoon and then examine each frame closely and answer the following questions:
In frame 1 what is the Professor explaining to Detective Crow?
............................................................................................................................................................................
............................................................................................................................................................................ What types of salt do you know of?
............................................................................................................................................................................ In frame 2 Sam the Seagull is reciting a poem. What is Sam describing?
............................................................................................................................................................................
............................................................................................................................................................................ What is the worm on top of the hill telling us?
............................................................................................................................................................................ In frame 3 the Professor is holding up a drawing. Explain what the drawing is telling us.
............................................................................................................................................................................
............................................................................................................................................................................ Explain what process happens in high rainfall areas.
............................................................................................................................................................................
............................................................................................................................................................................ By referring to frame 4 suggest ways in which we can manage our salt problem?
............................................................................................................................................................................ If salt has kept deep down under the soil for millions of years, why is it a problem now?
............................................................................................................................................................................
............................................................................................................................................................................ Where does the salt come from?
............................................................................................................................................................................
............................................................................................................................................................................ Why do you think clay based soils accumulate more salt?
............................................................................................................................................................................
............................................................................................................................................................................ Do you know of any areas that have sandy or clay soils? If so where?
............................................................................................................................................................................ What is the problem with areas of high evaporation and poor drainage?
............................................................................................................................................................................
............................................................................................................................................................................
MC • EA28 cont.
2.4, 2.4.1, 2.4.2, 2.6.3
Activity

Activity Activity
Support information Salinity in the Classroom
Page 60
Support information Salinity in the Classroom
Page 61
Detective Crow and the salt story MC • EA28 cont.
2.4, 2.4.1, 2.4.2, 2.6.3
Activity
Activity Activity
Support information Salinity in the Classroom
Page 60
Support information Salinity in the Classroom
Page 61
Conditions before clearing
Background informationThe native trees and shrubs that used to cover most of our wheatbelt have roots that grow deep into the earth in their search for water. Furthermore, being perennial plants, they use water all year round. Because of deep roots and year-round activity, the native vegetation dries out the soil to a greater degree and to a much greater depth than the annual plants used in agriculture. The native vegetation produces a mulch of organic material on the soil. Roots, micro-organisms, and animals digging into the soil keep the topsoil crumbly and open. Roots grow deep into the soil in their search for water.
How clearing affects the water balance in the water cycleThese conditions affect the water balance in the following manner:
The crumbly (permeable) topsoil allows rainfall to soak in readily. Because the subsoil has been dried out by the vegetation, the infiltrating water moves down readily into the deeper soil layers. As a result, very little water runs off.
Most of the water that enters the subsoil is within reach of the deep root systems of the perennial trees and shrubs. The vegetation uses most of the rainfall, leaving very little to trickle past the roots and into the groundwater.
The rainfall contains some salt and this soaks into the root zone. The native vegetation uses the water but leaves the salt to build up in the subsoil.
Because many of our wheatbelt subsoils are naturally saline, the water which percolates deep into the landscape and forms groundwater is often saline.
People often refer to trees and shrubs as nature’s ‘pumps’. They transpire a large amount of water and in this way keep the watertable at bay. When they are removed, dramatic changes occur.Soils in uncleared land are higher in organic matter and air spaces than soils that are being worked by farmers. When soils are cleared, important changes take place in the topsoil and the subsoil where old roots have been left to rot away:
Ploughing and working of the soil (along with the pressure of vehicle tyres and treading by stock) reduces the amount of organic matter and air space in the soil. The soil becomes less crumbly and open, allowing less water to infiltrate. As a result, more rain runs off in cleared areas.
The crops and pastures planted by farmers are annual plants. These plants use less water than the native vegetation they replace. Annual plants draw water mainly from the top 2 metres of soil and then die at the end of the season.
Water not used by crops moves downwards in the soil. Remember that these soils are often saline; hence, the percolating water will dissolve the stored salts and take them into the groundwater.
Water that percolates down can lead to the development of perched watertables and seepages where a soil layer is less permeable and hinders drainage.
Increased water pressure in the layer causes water to leak upwards through cracks and old root channels in the subsoil.
29EA
2.3.1, 2.3.2, 2.3.3, 2.4
Activity

Activity Activity
Support information Salinity in the Classroom
Page 62
Support information Salinity in the Classroom
Page 63
Conditions before clearing
The figure below shows the movement of water and salt before and after clearing:
Salinisation threatens not only the livelihood of many farmers but also the health of the land itself. Already some 400 square kilometres of once productive land are affected by salinity and most of the rivers in the South-West of our State have become salty.
ActivityIn small groups read and discuss the attached background information ‘Conditions before clearing’.
1 Is salinity something that should concern city people or is it a problem only for
country people?
2 How does salinity affect people in large cities, such as Perth?
3 What do you think could be done to solve the salinity problem?
4 How can high school students help solve the salinity problem?
5 Present your findings to the class.
Communities, including people from the city, are starting to fight back against salinity. One thing that helps stem the rising tide of salt is the planting of trees and shrubs. Their ‘pumping’ action lowers the watertable and keeps salt at bay. In addition, tree planting gives protection against the wind and water erosion that often accompanies salinity. The great thing about planting trees is that young and old, country and city people, can get involved.
Farmers are forming groups to combat salinity on their properties. These catchment groups help farmers to change the way they farm in order to manage salinity.
29 cont.EA
2.3.1, 2.3.2, 2.3.3, 2.4
Activity

Activity Activity
Support information Salinity in the Classroom
Page 62
Support information Salinity in the Classroom
Page 63
Salt? What salt?This cartoon series presents a very simplified version of Europeans’ effect on the Australian landscape. The series could perhaps be used as:1 a basis for discussion2 an essay prompt3 an outline of a play or4 a colouring-in exercise.
30MC • EA
2.3.1, 2.3.2, 2.3.3, 2.4
Activity

Activity Activity
Support information Salinity in the Classroom
Page 64
Support information Salinity in the Classroom
Page 65
Salt? What salt? 30 cont.MC • EA
2.3.1, 2.3.2, 2.3.3, 2.4
Activity
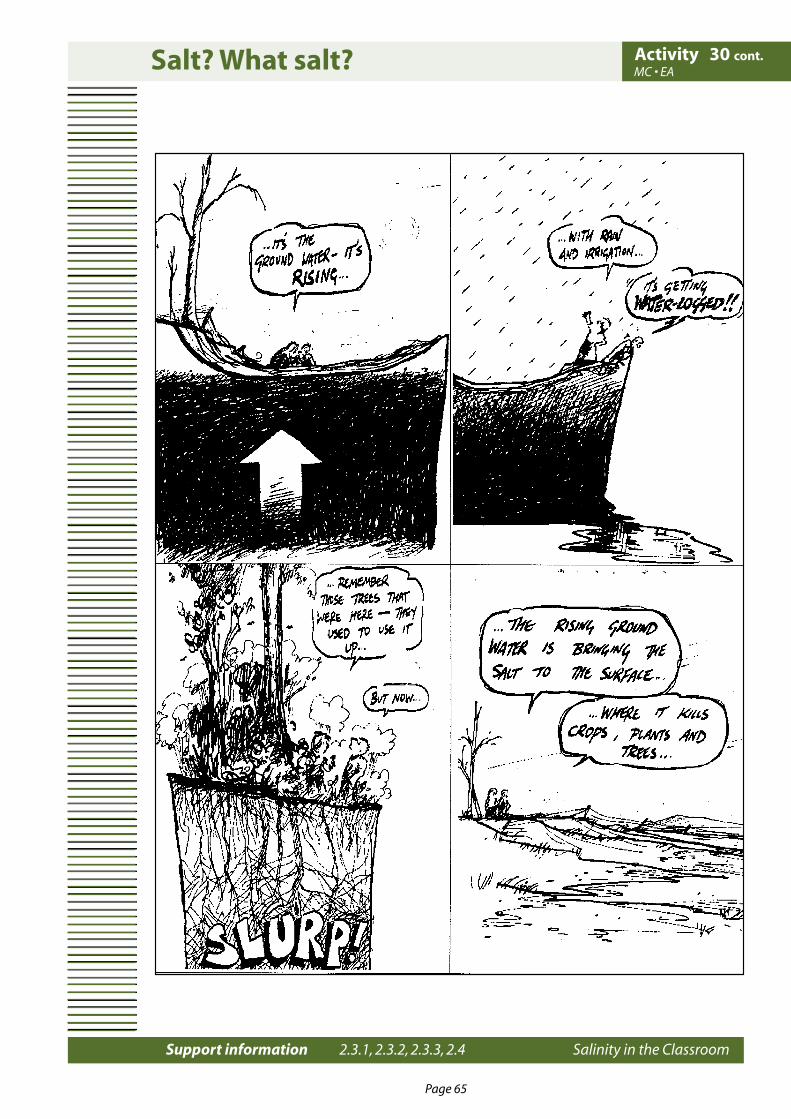
Activity Activity
Support information Salinity in the Classroom
Page 64
Support information Salinity in the Classroom
Page 65
Salt? What salt? 30 cont.MC • EA
2.3.1, 2.3.2, 2.3.3, 2.4
Activity

Activity Activity
Support information Salinity in the Classroom
Page 66
Support information Salinity in the Classroom
Page 67
Salt? What salt? 30 cont.MC • EA
2.3.1, 2.3.2, 2.3.3, 2.4
Activity
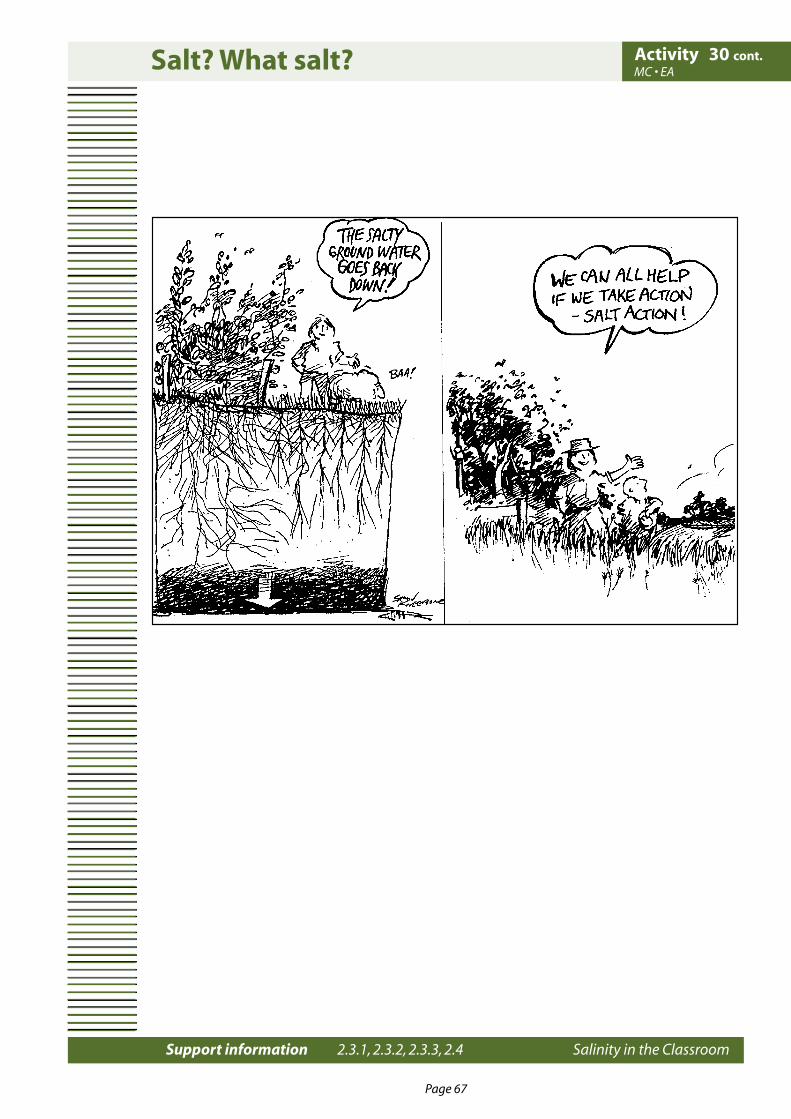
Activity Activity
Support information Salinity in the Classroom
Page 66
Support information Salinity in the Classroom
Page 67
Salt? What salt? 30 cont.MC • EA
2.3.1, 2.3.2, 2.3.3, 2.4
Activity
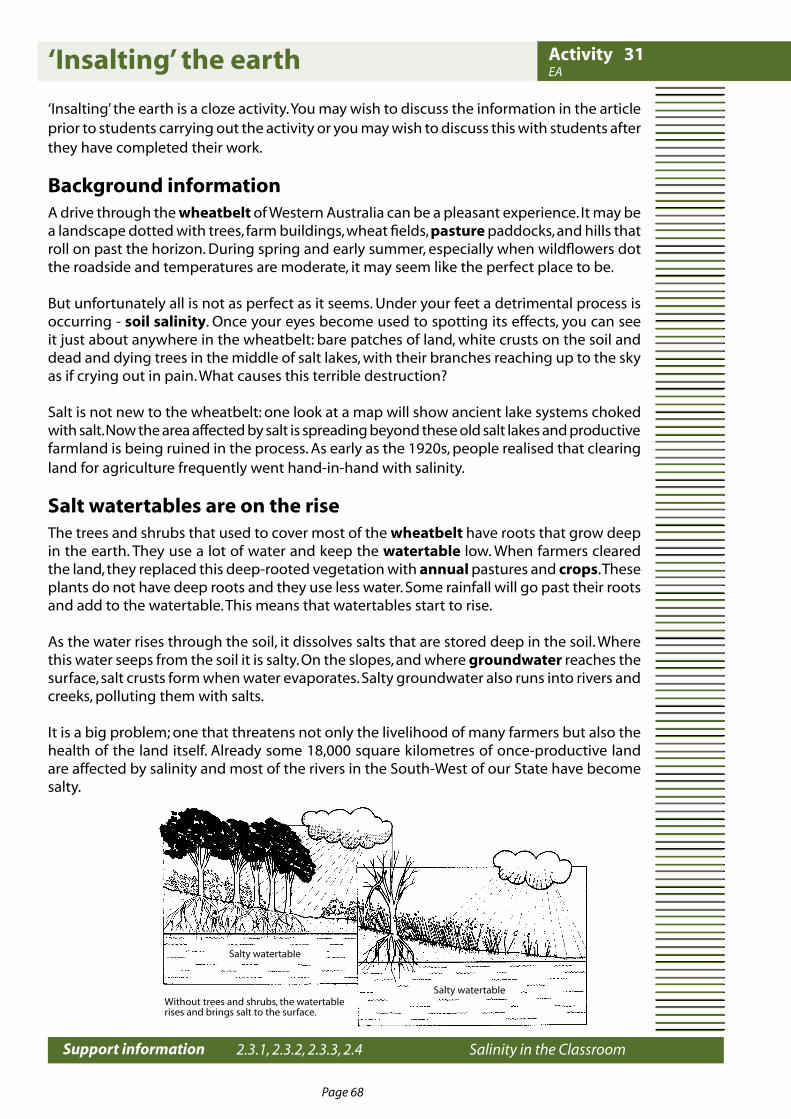
Activity Activity
Support information Salinity in the Classroom
Page 68
Support information Salinity in the Classroom
Page 69
‘Insalting’ the earth
‘Insalting’ the earth is a cloze activity. You may wish to discuss the information in the article prior to students carrying out the activity or you may wish to discuss this with students after they have completed their work.
Background informationA drive through the wheatbelt of Western Australia can be a pleasant experience. It may be a landscape dotted with trees, farm buildings, wheat fields, pasture paddocks, and hills that roll on past the horizon. During spring and early summer, especially when wildflowers dot the roadside and temperatures are moderate, it may seem like the perfect place to be.
But unfortunately all is not as perfect as it seems. Under your feet a detrimental process is occurring - soil salinity. Once your eyes become used to spotting its effects, you can see it just about anywhere in the wheatbelt: bare patches of land, white crusts on the soil and dead and dying trees in the middle of salt lakes, with their branches reaching up to the sky as if crying out in pain. What causes this terrible destruction?
Salt is not new to the wheatbelt: one look at a map will show ancient lake systems choked with salt. Now the area affected by salt is spreading beyond these old salt lakes and productive farmland is being ruined in the process. As early as the 1920s, people realised that clearing land for agriculture frequently went hand-in-hand with salinity.
Salt watertables are on the riseThe trees and shrubs that used to cover most of the wheatbelt have roots that grow deep in the earth. They use a lot of water and keep the watertable low. When farmers cleared the land, they replaced this deep-rooted vegetation with annual pastures and crops. These plants do not have deep roots and they use less water. Some rainfall will go past their roots and add to the watertable. This means that watertables start to rise.
As the water rises through the soil, it dissolves salts that are stored deep in the soil. Where this water seeps from the soil it is salty. On the slopes, and where groundwater reaches the surface, salt crusts form when water evaporates. Salty groundwater also runs into rivers and creeks, polluting them with salts.
It is a big problem; one that threatens not only the livelihood of many farmers but also the health of the land itself. Already some 18,000 square kilometres of once-productive land are affected by salinity and most of the rivers in the South-West of our State have become salty.
����� ����������
����� ����������������� ����� ��� ������� ��� ��������������� ��� ������ ���� �� ��� ��������
31 EA
2.3.1, 2.3.2, 2.3.3, 2.4
Activity

Activity Activity
Support information Salinity in the Classroom
Page 68
Support information Salinity in the Classroom
Page 69
Reading cloze: ’Insalting’ the earth
WorksheetUse the words in the list to complete the sentences in the following passage. Note there are more words than you need to complete the sentences.
health dissolves watertable farmland rise land salt soil low less trees rain ancient salinity
A drive through the wheatbelt of Western Australia can be a pleasant experience. It may be landscape dotted with trees, farm buildings, wheat fields and pasture paddocks, and hills that roll on past the horizon. Especially during spring and early summer, when wildflowers dot the roadside and temperatures are moderate it may seem like the perfect place to be.
But unfortunately all is not as perfect as it seems. Under your feet a detrimental process is occurring - soil 1_____________ . Once your eyes become used to spotting its effects, you can see it just about anywhere in the wheatbelt: bare patches of 2_____________ white crusts on the 3_____________ and dead and dying trees in the middle of 4_____________ lakes, with their branches reaching up to the sky as if crying out in pain. What causes this terrible destruction?
Salt is not new to the wheatbelt: one look at a map will show 5____________lake systems choked with salt. Now the area affected by salt is spreading beyond these old salt lakes and killing productive 6____________ in the process of being ruined. As early as the 1920s people realised that clearing land for agriculture frequently went hand in hand with salinity.
Salt watertables are on the riseThe native trees and shrubs that used to cover most of the wheatbelt have roots that grow deep in the earth. They use a lot of water and keep the watertable 7 ____________. When farmers cleared the land they replaced this deep-rooted vegetation with annual pastures and crops. These plants do not have deep roots and they use 8 ______________ water. Some rainfall will go past their roots and add to the watertable. This means that watertables start to 9 _______________.
As the water rises through the soil, it 10_______________ salts stored deep in the soil. Where this water seeps from the soil it is salty. On the slopes, and where groundwater reaches the surface, salt crusts form when water evaporates. Salty groundwater also runs into rivers and creeks polluting them.
It is a big problem; one that threatens not only the livelihood of many farmers but also the 11 ________________ of the land itself. Already thousands of square kilometres of once-productive land are affected by salinity and most of the rivers in the South-West of our State have become salty.
EA 31 cont.
2.3.1, 2.3.2, 2.3.3, 2.4
Activity
Activity Activity
Support information Salinity in the Classroom
Page 70
Support information Salinity in the Classroom
Page 71
A Quiz for saltwatchers
This activity is designed to introduce and encourage students to use the correct terminology when researching, discussing, writing about salinity and environmental problems.
1 Can you sort out these jumbled words? A TRAWE B ILOS C NISYTLAI D VRREI
2 How is the salt content of water measured? (Circle the correct answer) A by smelling it B by using an EC meter C by looking at the colour of the water
3 What does the unit of measurement ‘EC’ stand for? A Energy cells B ET’s cousin C Electrical conductivity
4 What is the watertable? A the name given to the bedside table of someone who sleeps in a waterbed B the upper surface of the groundwater C a special table used in laboratories for examining water
5 What is groundwater? A water found below the earth’s surface in a wet zone of the soil or rock B water which has been crushed very finely C water which is salty
6 What is a bore? A a type of tractor B a male pig C a hole drilled into the ground to reach the groundwater
7 What is a catchment? A a type of raincoat B an area of land in which water drains to the lowest point (creek, river, lake etc.) C an area of salt-affected land
8 Underline the odd word out in each of the following: A soil / water / dairy / forest / river B green / salt / salinity / groundwater / watertable C catchment / paddock / farm / lucerne / field
32MC • EA
2.6
Activity
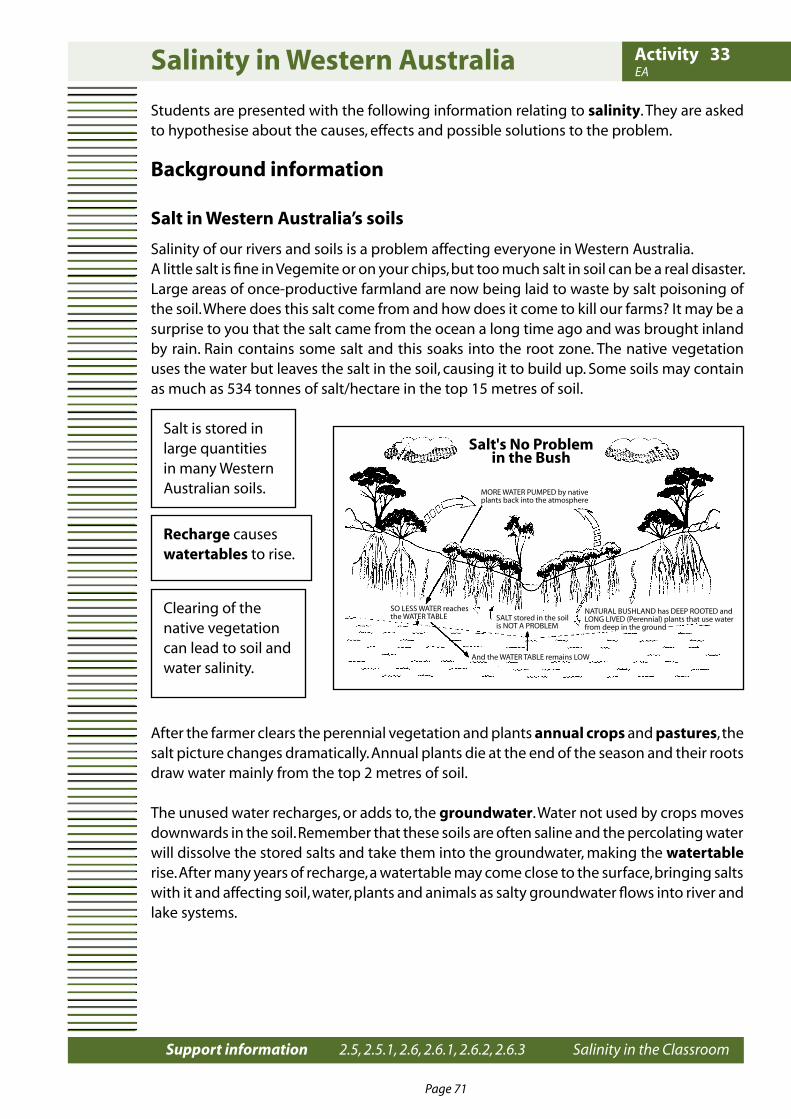
Activity Activity
Support information Salinity in the Classroom
Page 70
Support information Salinity in the Classroom
Page 71
Salinity in Western Australia
Students are presented with the following information relating to salinity. They are asked to hypothesise about the causes, effects and possible solutions to the problem.
Background information
Salt in Western Australia’s soils
Salinity of our rivers and soils is a problem affecting everyone in Western Australia.A little salt is fine in Vegemite or on your chips, but too much salt in soil can be a real disaster. Large areas of once-productive farmland are now being laid to waste by salt poisoning of the soil. Where does this salt come from and how does it come to kill our farms? It may be a surprise to you that the salt came from the ocean a long time ago and was brought inland by rain. Rain contains some salt and this soaks into the root zone. The native vegetation uses the water but leaves the salt in the soil, causing it to build up. Some soils may contain as much as 534 tonnes of salt/hectare in the top 15 metres of soil.
After the farmer clears the perennial vegetation and plants annual crops and pastures, the salt picture changes dramatically. Annual plants die at the end of the season and their roots draw water mainly from the top 2 metres of soil.
The unused water recharges, or adds to, the groundwater. Water not used by crops moves downwards in the soil. Remember that these soils are often saline and the percolating water will dissolve the stored salts and take them into the groundwater, making the watertable rise. After many years of recharge, a watertable may come close to the surface, bringing salts with it and affecting soil, water, plants and animals as salty groundwater flows into river and lake systems.
������ �� ��������� ��� ����
���� ����� ������ �� ������������ ���� ���� ��� ����������
���� ������ �� ��� ������ ��� � �������
�� ���� ����� ���������� ����� �����
��� ��� ����� ����� ������� ���
������� �������� ��� ���� ������ ������� ����� ����������� ������ ���� ��� ��������� ���� �� ��� ������
Salt is stored in large quantities in many Western Australian soils.
Clearing of the native vegetation can lead to soil and water salinity.
Recharge causes watertables to rise.
33EA
2.5, 2.5.1, 2.6, 2.6.1, 2.6.2, 2.6.3
Activity
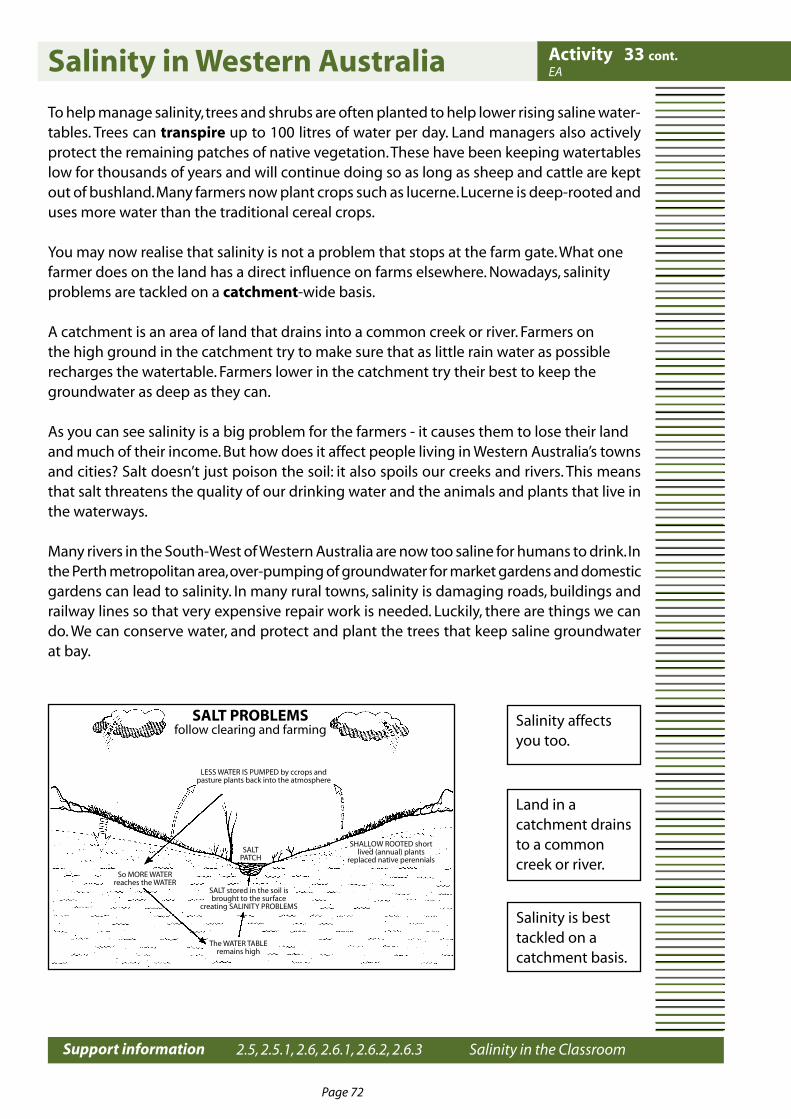
Activity Activity
Support information Salinity in the Classroom
Page 72
Support information Salinity in the Classroom
Page 73
Salinity in Western Australia
To help manage salinity, trees and shrubs are often planted to help lower rising saline water-tables. Trees can transpire up to 100 litres of water per day. Land managers also actively protect the remaining patches of native vegetation. These have been keeping watertables low for thousands of years and will continue doing so as long as sheep and cattle are kept out of bushland. Many farmers now plant crops such as lucerne. Lucerne is deep-rooted and uses more water than the traditional cereal crops.
You may now realise that salinity is not a problem that stops at the farm gate. What onefarmer does on the land has a direct influence on farms elsewhere. Nowadays, salinityproblems are tackled on a catchment-wide basis.
A catchment is an area of land that drains into a common creek or river. Farmers onthe high ground in the catchment try to make sure that as little rain water as possiblerecharges the watertable. Farmers lower in the catchment try their best to keep thegroundwater as deep as they can.
As you can see salinity is a big problem for the farmers - it causes them to lose their landand much of their income. But how does it affect people living in Western Australia’s towns and cities? Salt doesn’t just poison the soil: it also spoils our creeks and rivers. This means that salt threatens the quality of our drinking water and the animals and plants that live in the waterways.
Many rivers in the South-West of Western Australia are now too saline for humans to drink. In the Perth metropolitan area, over-pumping of groundwater for market gardens and domestic gardens can lead to salinity. In many rural towns, salinity is damaging roads, buildings and railway lines so that very expensive repair work is needed. Luckily, there are things we can do. We can conserve water, and protect and plant the trees that keep saline groundwater at bay.
���� �������������� �������� ��� �������
���� ����� �� ������ �� ������ ���������� ������ ���� ���� ��� ����������
���������
�� ���� ������������ ��� �����
���� ������ �� ��� ���� ��������� �� ��� �������
�������� �������� ��������
��� ����� ������������ ����
������� ������ ���������� �������� ������
�������� ������ ����������
Salinity is best tackled on a catchment basis.
Salinity affects you too.
Land in a catchment drains to a common creek or river.
33 cont.EA
2.5, 2.5.1, 2.6, 2.6.1, 2.6.2, 2.6.3
Activity
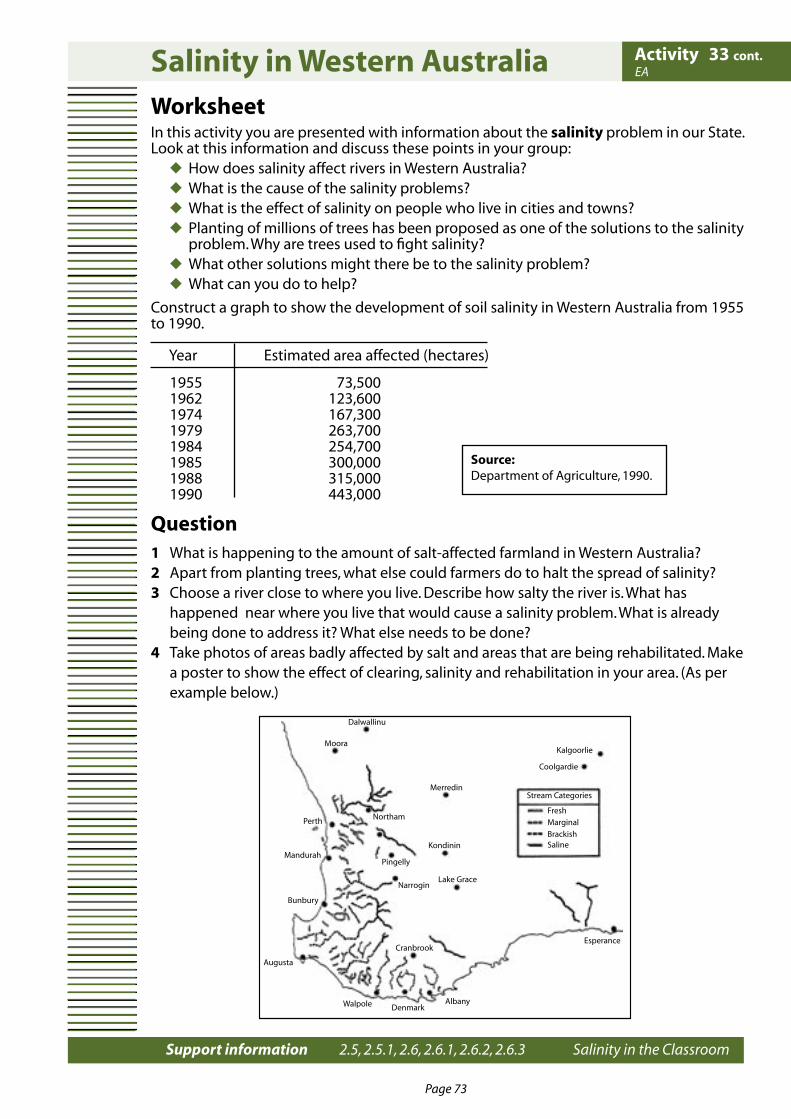
Activity Activity
Support information Salinity in the Classroom
Page 72
Support information Salinity in the Classroom
Page 73
Salinity in Western Australia WorksheetIn this activity you are presented with information about the salinity problem in our State. Look at this information and discuss these points in your group:
How does salinity affect rivers in Western Australia? What is the cause of the salinity problems? What is the effect of salinity on people who live in cities and towns? Planting of millions of trees has been proposed as one of the solutions to the salinity
problem. Why are trees used to fight salinity? What other solutions might there be to the salinity problem? What can you do to help?
Construct a graph to show the development of soil salinity in Western Australia from 1955 to 1990.
Year Estimated area affected (hectares)
1955 73,500 1962 123,600 1974 167,300 1979 263,700 1984 254,700 1985 300,000 1988 315,000 1990 443,000
Question1 What is happening to the amount of salt-affected farmland in Western Australia?2 Apart from planting trees, what else could farmers do to halt the spread of salinity?3 Choose a river close to where you live. Describe how salty the river is. What has happened near where you live that would cause a salinity problem. What is already being done to address it? What else needs to be done?4 Take photos of areas badly affected by salt and areas that are being rehabilitated. Make a poster to show the effect of clearing, salinity and rehabilitation in your area. (As per example below.)
Source: Department of Agriculture, 1990.
����������
��������
�����
��������
�������
���� �����
��������
��������
�������
��������
�����
�������
�������
���������
�������������
���������
����������
����������
������ ����������
�����
��������
��������������
33 cont.EA
2.5, 2.5.1, 2.6, 2.6.1, 2.6.2, 2.6.3
Activity
Activity Activity
Support information Salinity in the Classroom
Page 74
Support information Salinity in the Classroom
Page 75
The Salty Licorice Test
This activity will encourage students to appreciate the effect of salinity on species diversity, realise that plants have different levels of tolerance to salinity and understand the damage salinity does to plant communities.
Background informationA basic understanding of salinity (what it is, area affected, how it is caused) makes this exercise more valuable, but is not crucial.
The four or five types of licorice should be distributed to each student. The students are told that they are no longer humans. For the duration of this exercise they are all plants. Together, as a class, they make up a plant community, and the idea of this exercise is to see how the plant community reacts to increases in salt levels.
Students are asked to take the English licorice and place it in their mouths. This level of salt represents the natural, non-saline environment. From this point on, any person who pulls a face when they put the next piece of licorice into their mouth must put their hand on their head. These students (plants) are under stress from salinity. Their growth is slowed, their leaves fall off (drought stress), and they don’t reproduce well. Anyone who spits out the piece of licorice must stand up and move to the back of the room. These students (plants) have died and the species have become extinct.
Students are then asked to place the ‘coins’ licorice into their mouth. Those who pull a face - hand on head, those who spit it out - move to the back of the room.
Students are then asked to place the ‘DZ’ licorice into their mouth (the small round disks). Those who pull a face put a hand on their head, those who spit it out, move to the back of the room.
At this point, a fairly large percentage of the participants would have moved to the back of the room. It can then be explained that there is a high level of extinction in the plant community, and biological diversity is reduced.
Of those still seated, most will have their hands on their heads. It can then be explained that different plants have different levels of tolerance to salinity. Those at the back of the room were plants that are sensitive to salinity (such as banksias).
Those that are seated (jams, bottle brushes, river red gums) with their hands on their head have a higher tolerance than those that have become extinct, but are still under stress because of the increase in salinity. Those who are seated and do not have their hands on their heads have a high tolerance to salinity. Representative species include saltbush and samphire.
You will also notice that students will want to drink water after completing the exercise. This is representative of the drought stress experiences by non-tolerant plants when exposed to saline conditions.
34MC • EA
2.6, 2.6.3
Activity

Activity Activity
Support information Salinity in the Classroom
Page 74
Support information Salinity in the Classroom
Page 75
The Salty Licorice Test
Materials small snap lock freezer bags. You will need enough for each student plastic cups with water. To wash away the taste. Again you will need enough for
each student spit bowls/plate Minties, Tic-Tacs etc. to take away the taste. Also it may be advisable to cut the
pieces of licorice in half
Suggested activities Introduce students to the cause and effect of salinity. Hand out the licorice and cups, making sure each student is close to a plastic-lined
bowl. Explain that the participants are all different plant species, and as a group, they form
a biologically diverse plant community. Explain that each piece of licorice represents a different level of salinity, and that
the plant community they represent will be exposed to increasing salinity. The way the participants respond will determine the next step:
If they put the licorice in their mouth and they pull a face then they must put their hand on their head;
If they put the licorice in their mouth, and they spit it out, then they must stand and move to the back of the room.
Those who have not got their hands on their head and are still seated represent plants that are tolerant of that level of salinity. Those who have their hands on their head represent species that are under some stress but are still alive. They would experience reduced production. The plants represented by those that spit out the licorice are extinct.
By the third round of licorice (DZ) most plants will be extinct. Explain that there has been a reduction in biodiversity and that most of the plants remaining are under stress, and only the very salt-tolerant species remain.
Licorice suppliersThe Pantry Man is a reliable source of the three base Dutch Salty Licorice. Outlets are based in Forrestfield 9359 4090; Maddington 9459 4744 and Warnbro 9593 0252.Miriam’s Australian & International Fine Foods. All four types of salty licorice can be bought here. Outlet is in Kalamunda 9293 4874.Thuys - Homemade Pies and Cakes. The three basic types of salty licorice can be bought here. Outlet is in Geraldton 9921 3947.Note: Dutch Licorice is becoming increasingly available. Many European Fine Foods vendors stock it, as do some specialty confectionery outlets.Licorice needs to be kept dry. Moisture will make the licorice sticky and messy. Place dry white rice in a microwave on high for 2 minutes. Place the rice in the bottom of an airtight container lined with a paper towel. Place the licorice on top and seal the container. The micro -waved rice takes the moisture out of the air, and you can store the licorice for some time.
2.6, 2.6.3
34 cont.MC • EAActivity

Activity Activity
Support information Salinity in the Classroom
Page 76
Support information Salinity in the Classroom
Page 77
34 cont.
2.6, 2.6.3
Activity

Activity Activity
Support information Salinity in the Classroom
Page 76
Support information Salinity in the Classroom
Page 77
Salinity questionnaire
Background informationThis activity provides an opportunity to develop group skills and to develop questions that will provide specific knowledge on the issue of salination in a local or regional context. Students will gain an understanding about the nature of salinity and the ways in which this problem is affecting their environment.
Notes Surveys/questionnaires are samples only. If one is to be sent to the wider
community it must be facilitated by the classroom teacher.
Procedure1 Form a group of up to six students.
2 Set the task:
Your job will be to write a survey or questionnaire that could be sent to local farmers and to the wider community to gain knowledge about the environmental problem of
salinity, its causes, its effect on the natural and social environments, and remedies.
Ensure that the question asked will supply the information you need.
3 After each group has completed this task, facilitate group presentations to the whole class.4 Provide students with the attached framework to assist them in developing their questions.
Extension activities1 Pool all surveys/questionnaires and collate a survey that could be sent to the wider
community.2 In small groups students write a cover letter to send out with their surveys, explaining
their intentions/needs.3 Send out the survey.4 Using the information from the survey results each group could write up a Salinity Report outlining the extent of salinity, the effect on the environment and farm
production and the ways in which it is managed.5 Make a flyer that explains what salinity is, how it is formed, how to recognise its presence,
what effect it has and how it can be managed.6 Ask a representative from a local landcare group, catchment coordinator, or farmer to
visit the class to discuss their findings.
35MC• EA
2.6, 2.7, 2.7.1, 2.7.2
Activity
Activity Activity
Support information Salinity in the Classroom
Page 78
Support information Salinity in the Classroom
Page 79
Salinity questionnaire
Worksheet
Framework
1 What questions do you want to know the answer to?
2 What information do you already have?
3 What questions will you include in your survey? (Note: It is better to use open-ended questions with a 1 to 5 scale rather than yes/no responses). For example ‘How much of a problem is salinity on your property?’, Rather than ‘Is salinity a problem?’
4 How will you analyse your results?
5 How will you communicate your information to a wider audience?
35 cont.MC• EA
2.6, 2.7, 2.7.1, 2.7.2
Activity

Activity Activity
Support information Salinity in the Classroom
Page 78
Support information Salinity in the Classroom
Page 79
Salinity - It’s a catchment problem
Background information Salinity is largely a water-catchment problem and farmers are trying to deal with it on a catchment-wide basis. A catchment is an area that drains into a common creek or river.Rainwater reaches the groundwater most rapidly in ‘recharge ’areas. These are usually areas higher up in the landscape which have sandy and gravelly soils. The overall aim of salinity management strategies is to use as much of the rainfall as possible. Trees and perennial pastures planted on these areas intercept and pump rainwater back into the atmosphere and in so doing minimise recharge. Other measures include replacing annual pastures with high water-use crops such as oats, barley, lupins and canola.In discharge areas where saline groundwater is affecting the surface, farmers try to continue producing crops and pastures while stabilising and reducing the area affected by salinity.Land already affected by salinity can be revegetated by using salt-tolerant trees, pastures and forage shrubs. Forage shrubs are those that can be fed to stock. These also use excess groundwater and can be grazed as pasture, keeping the land in production. Trees planted above salt areas dry out these salty trouble spots.In some areas it may be possible to dig drains that divert the extra rainwater into a creek or river so it does not contribute to salinity problems further down in the catchment. As you can see, salinity is often a problem that is too big to be tackled on a farm scale. Farmers realise this and have formed groups to deal with land conservation issues such as salinity. You can find out how these groups are formed and what they do in the background section of this manual.As early as 1924, clearing of the native vegetation was identified as the salinity culprit. Yet massive amounts of land clearing took place in the 1960s and these areas are now feeling the brunt of the salinity scourge. How would you explain why people in those days didn’t take the link between clearing and salinity to heart? (For further information refer to Section Two.)The table below shows the increase in the amount of salinity-affected land since 1955.
Year Area affected (hectares) 1955 73,500 1962 123,600 1974 167,300 1979 263,700 1984 254,700 1985 300,000 1988 315,000 1990 443,000
(Source: Department of Agriculture, 1990)
36EA
2.6, 2.7, 2.7.1, 2.7.2
Activity

Activity Activity
Support information Salinity in the Classroom
Page 80
Support information Salinity in the Classroom
Page 81
Salinity - It’s a catchment problem
Worksheet1 Use the information in the table to construct a graph. You will need to decide for
yourself which type of graph is best suited to display this information.
2 Describe what the graph tells us about salinity in WA.
3 Use your graph to estimate the area affected by salt in 2020.
4 What is happening to the amount of salt-affected land in our State?
5 Is the rate of salinisation of land increasing or decreasing? Can you think of historical reasons why this may be happening?
6 A select committee of the Parliament of Western Australia recently reported that the potential for salinity in the State is about ten times the current amount. What effects would such an increase in salt-affected land have on:
the Western Australian wheatbelt;
the economy of Western Australia; and
people in towns and cities?
7 What could you do to make sure that such an increase does not happen?
8 Present your findings to the class.
36 cont.EA
2.6, 2.7, 2.7.1, 2.7.2
Activity
Activity Activity
Support information Salinity in the Classroom
Page 80
Support information Salinity in the Classroom
Page 81
Nursery rhymes & fairy stories
This activity will enable students to imaginatively explore the effects of salinity, and to produce a play which will persuade others of the damage it can cause.
Suggested approach1 Discuss how most nursery rhymes and fairy stories would have to be re-written if the
worlds in which they took place were afflicted by salinity. What would happen to Baa Baa Black Sheep? And would Jack’s Beanstalk have grown so vigorously?
2 In groups of four or five, the students are to choose an appropriate nursery rhyme or a fairy story, and consider all the ways in which salinity would affect the storyline.
3 They should then dramatise their modified story, weaving specific references to salinity into the dialogue.
Variations1 Once the students have created their play, they may like to add a commentator or narrator, who presents the moral of the tale at appropriate intervals.
2 The students may find that salinity so affects the story-line, that they need other characters. They should feel free to invent these, as bringing in well-known characters from other nursery rhymes or fairy stories may well help to convey the image of the general disorder of the natural world which salinity causes.
37MC • EA
2.6
Activity

Activity Activity
Support information Salinity in the Classroom
Page 82
Support information Salinity in the Classroom
Page 83
The fight against salt
Students compare the extent and severity of salinity in Australia and globally and find out about various saline areas in the world.
Background information
Salt in ancient times Salinity is not a new problem. Over 4,500 years ago the Sumerian civilisation recorded that their land (now Iraq) was becoming saline. Sumerians irrigated their crops with water from the nearby rivers. The river water contained salt, which remained in the soil when the water evaporated. Over the centuries the salt accumulated in the soil and reduced the productivity of the area.
Records show that the Sumerian diet changed from wheat to barley. This supports the theory that salinity was a problem, as barley grows better than wheat in salty soil. The Sumerians did not win the battle; evidence for this is that much of their land was abandoned a few hundred years later. (Note: the Sumerians used irrigation and thus had a problem with irrigation salinity. There is some irrigation salinity in WA (coastal plain around Harvey) but
most is dryland salinity).
Activities Ask students if they know of any places with salinity problems. Read and discuss the case studies. These illustrate different types of salinity and
various ways in which the problem can be controlled. Discuss the importance of everyone working together to control salinity. In small groups read the case studies on salinity (following). Complete the table for
these two cases. Visit the library or use the internet to investigate other places in the world with
salinity problems. e.g. Dead Sea, Jordan River, Imperial Valley in America, Indus River where it flows into Pakistan, Nile Valley in Egypt, Steppes in Russia, Murray-Darling Basin in Queensland, NSW, Victoria and South Australia.
Complete the table for these places and compare the information you have collected.
38MC
2.6, 2.7, 2.8
Activity
Activity Activity
Support information Salinity in the Classroom
Page 82
Support information Salinity in the Classroom
Page 83
The fight against salt
Worksheet
Location
Causes of saIinity
Problems
Ways to control salinity
The future
(What do you thinkwill happen next?)
38 cont.MC
2.6, 2.7, 2.8
Activity
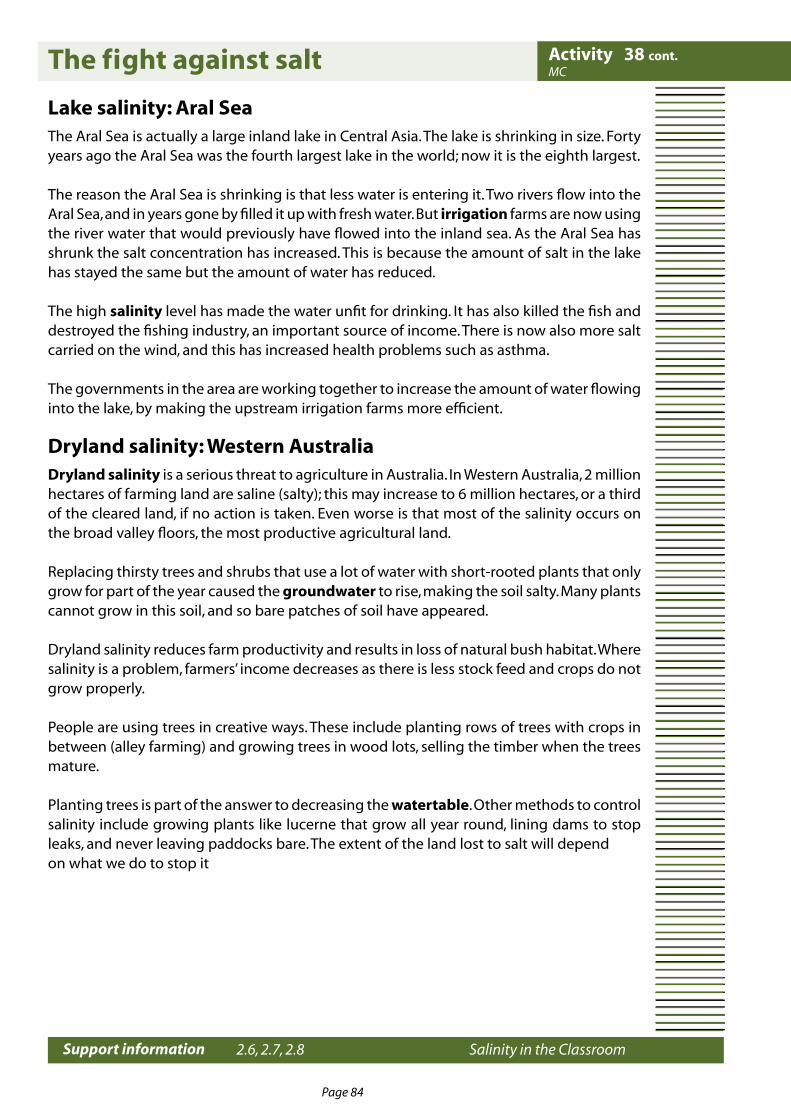
Activity Activity
Support information Salinity in the Classroom
Page 84
Support information Salinity in the Classroom
Page 85
The fight against salt
Lake salinity: Aral SeaThe Aral Sea is actually a large inland lake in Central Asia. The lake is shrinking in size. Forty years ago the Aral Sea was the fourth largest lake in the world; now it is the eighth largest.
The reason the Aral Sea is shrinking is that less water is entering it. Two rivers flow into the Aral Sea, and in years gone by filled it up with fresh water. But irrigation farms are now using the river water that would previously have flowed into the inland sea. As the Aral Sea has shrunk the salt concentration has increased. This is because the amount of salt in the lake has stayed the same but the amount of water has reduced.
The high salinity level has made the water unfit for drinking. It has also killed the fish and destroyed the fishing industry, an important source of income. There is now also more salt carried on the wind, and this has increased health problems such as asthma.
The governments in the area are working together to increase the amount of water flowing into the lake, by making the upstream irrigation farms more efficient.
Dryland salinity: Western AustraliaDryland salinity is a serious threat to agriculture in Australia. In Western Australia, 2 million hectares of farming land are saline (salty); this may increase to 6 million hectares, or a third of the cleared land, if no action is taken. Even worse is that most of the salinity occurs on the broad valley floors, the most productive agricultural land.
Replacing thirsty trees and shrubs that use a lot of water with short-rooted plants that only grow for part of the year caused the groundwater to rise, making the soil salty. Many plants cannot grow in this soil, and so bare patches of soil have appeared.
Dryland salinity reduces farm productivity and results in loss of natural bush habitat. Where salinity is a problem, farmers’ income decreases as there is less stock feed and crops do not grow properly.
People are using trees in creative ways. These include planting rows of trees with crops in between (alley farming) and growing trees in wood lots, selling the timber when the trees mature.
Planting trees is part of the answer to decreasing the watertable. Other methods to control salinity include growing plants like lucerne that grow all year round, lining dams to stop leaks, and never leaving paddocks bare. The extent of the land lost to salt will dependon what we do to stop it
38 cont.MC
2.6, 2.7, 2.8
Activity

Activity Activity
Support information Salinity in the Classroom
Page 84
Support information Salinity in the Classroom
Page 85
Good vs. poor catchment management
Students work together in a group to discuss and decide on good and poor catchment management practices.
Background informationIn the past, landholders and government bodies generally carried out their activities independently and without realising the effects their actions were having on natural resources.
When problems arose, organisations were established to deal with specific issues, and integration of effort rarely occurred. The objective of catchment coordination is to promote and coordinate the effective planning and management of catchments to achieve the sustainable and balanced use of our resources and aims to integrate the efforts of landholders, community organisations and government agencies.
Catchment groups are community-led: working together to improve our environment by solving problems in each catchment. A catchment could include a small groups of houses with a common problem; or you might recognise a problem in a local creek that involves a larger catchment.
Whatever the problem, large or small, solving it will contribute to the betterment of the whole environment. We can all take an active role in making our environment a better place to live in the future.
39EA
2.7, 2.7.1, 2.7.2, 2.7.3
Activity
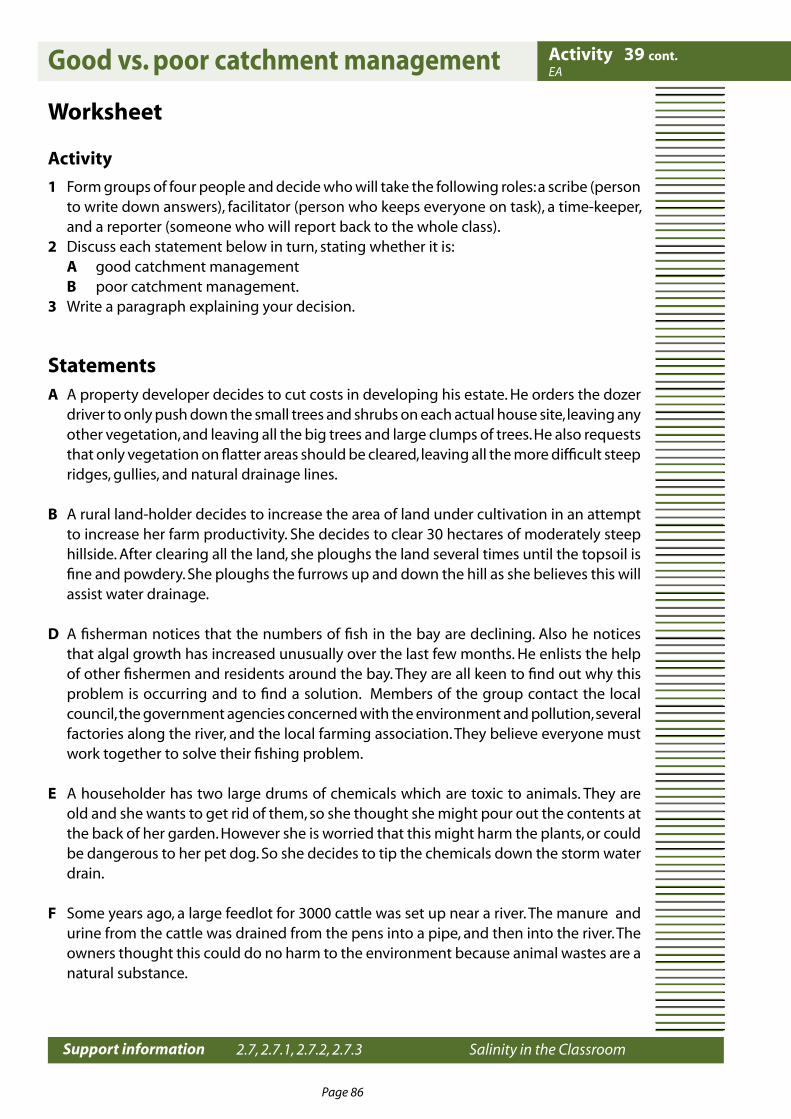
Activity Activity
Support information Salinity in the Classroom
Page 86
Support information Salinity in the Classroom
Page 87
Good vs. poor catchment management
Worksheet
Activity
1 Form groups of four people and decide who will take the following roles: a scribe (person to write down answers), facilitator (person who keeps everyone on task), a time-keeper, and a reporter (someone who will report back to the whole class).
2 Discuss each statement below in turn, stating whether it is: A good catchment management B poor catchment management.3 Write a paragraph explaining your decision.
StatementsA A property developer decides to cut costs in developing his estate. He orders the dozer
driver to only push down the small trees and shrubs on each actual house site, leaving any other vegetation, and leaving all the big trees and large clumps of trees. He also requests that only vegetation on flatter areas should be cleared, leaving all the more difficult steep ridges, gullies, and natural drainage lines.
B A rural land-holder decides to increase the area of land under cultivation in an attempt to increase her farm productivity. She decides to clear 30 hectares of moderately steep hillside. After clearing all the land, she ploughs the land several times until the topsoil is fine and powdery. She ploughs the furrows up and down the hill as she believes this will assist water drainage.
D A fisherman notices that the numbers of fish in the bay are declining. Also he notices that algal growth has increased unusually over the last few months. He enlists the help of other fishermen and residents around the bay. They are all keen to find out why this problem is occurring and to find a solution. Members of the group contact the local council, the government agencies concerned with the environment and pollution, several factories along the river, and the local farming association. They believe everyone must work together to solve their fishing problem.
E A householder has two large drums of chemicals which are toxic to animals. They are old and she wants to get rid of them, so she thought she might pour out the contents at the back of her garden. However she is worried that this might harm the plants, or could be dangerous to her pet dog. So she decides to tip the chemicals down the storm water drain.
F Some years ago, a large feedlot for 3000 cattle was set up near a river. The manure and urine from the cattle was drained from the pens into a pipe, and then into the river. The owners thought this could do no harm to the environment because animal wastes are a natural substance.
39 cont.EA
2.7, 2.7.1, 2.7.2, 2.7.3
Activity
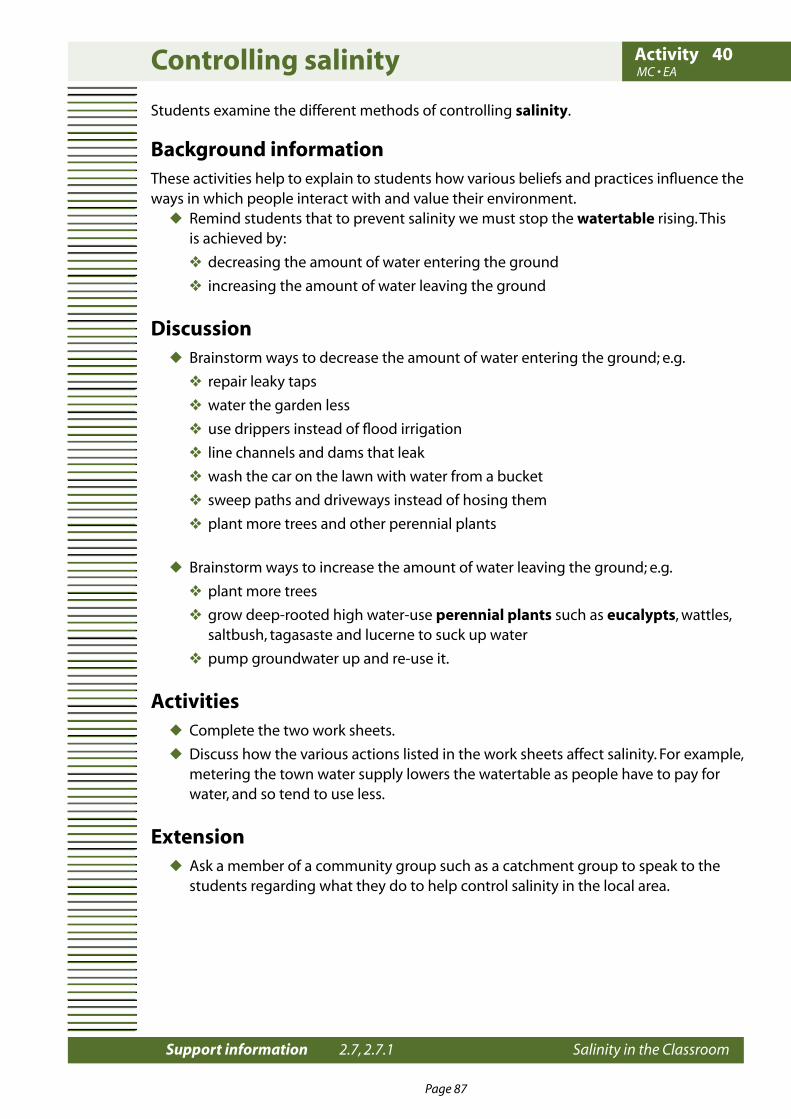
Activity Activity
Support information Salinity in the Classroom
Page 86
Support information Salinity in the Classroom
Page 87
Controlling salinity
Students examine the different methods of controlling salinity.
Background informationThese activities help to explain to students how various beliefs and practices influence the ways in which people interact with and value their environment.
Remind students that to prevent salinity we must stop the watertable rising. This is achieved by:
decreasing the amount of water entering the ground
increasing the amount of water leaving the ground
Discussion Brainstorm ways to decrease the amount of water entering the ground; e.g.
repair leaky taps
water the garden less
use drippers instead of flood irrigation
line channels and dams that leak
wash the car on the lawn with water from a bucket
sweep paths and driveways instead of hosing them
plant more trees and other perennial plants
Brainstorm ways to increase the amount of water leaving the ground; e.g.
plant more trees
grow deep-rooted high water-use perennial plants such as eucalypts, wattles, saltbush, tagasaste and lucerne to suck up water
pump groundwater up and re-use it.
Activities Complete the two work sheets.
Discuss how the various actions listed in the work sheets affect salinity. For example, metering the town water supply lowers the watertable as people have to pay for water, and so tend to use less.
Extension Ask a member of a community group such as a catchment group to speak to the students regarding what they do to help control salinity in the local area.
40MC • EA
2.7, 2.7.1
Activity

Activity Activity
Support information Salinity in the Classroom
Page 88
Support information Salinity in the Classroom
Page 89
Controlling salinityWorksheet
Look at the picture and mark with aRed cross activities that Green tick activities that Blue circleincrease salinity help reduce salinity wind surfer person hosing footpath trees on hills cyclist Ieaking channel meter on water supply person wearing a scarf bulldozer clearing trees drip irrigation in orchard cows sheep grazing on bare paddock people fencing trees people fishing sprinkler man washing car on lawn cup soil erosion people planting trees cat pool overflowing pipe from dam to trough pram dead trees rainwater tank farm plan trough leaking people learning about salinity by: tractor bare hills --- using test wells person with walking stick --- attending field days
40 cont.MC • EA
2.7, 2.7.1
Activity
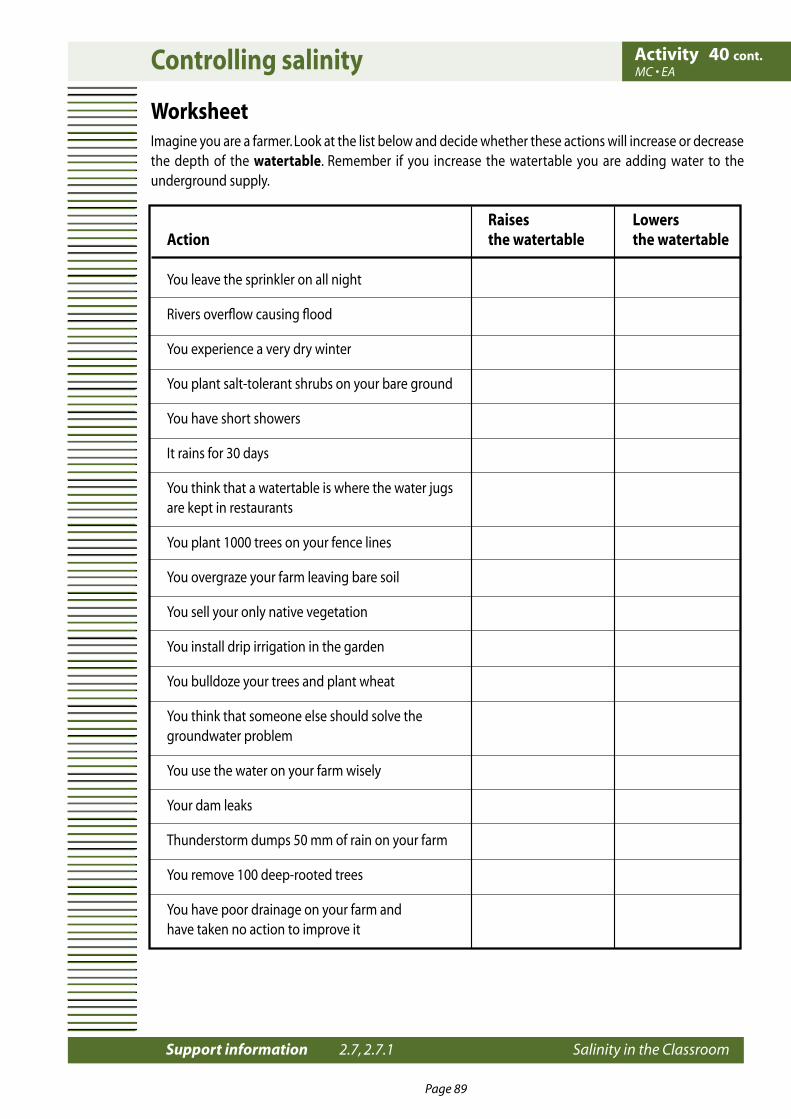
Activity Activity
Support information Salinity in the Classroom
Page 88
Support information Salinity in the Classroom
Page 89
Controlling salinity
WorksheetImagine you are a farmer. Look at the list below and decide whether these actions will increase or decrease the depth of the watertable. Remember if you increase the watertable you are adding water to the underground supply.
Raises LowersAction the watertable the watertable
You leave the sprinkler on all night
Rivers overflow causing flood
You experience a very dry winter
You plant salt-tolerant shrubs on your bare ground
You have short showers
It rains for 30 days
You think that a watertable is where the water jugsare kept in restaurants
You plant 1000 trees on your fence lines
You overgraze your farm leaving bare soil
You sell your only native vegetation
You install drip irrigation in the garden
You bulldoze your trees and plant wheat
You think that someone else should solve the groundwater problem
You use the water on your farm wisely
Your dam leaks
Thunderstorm dumps 50 mm of rain on your farm
You remove 100 deep-rooted trees
You have poor drainage on your farm andhave taken no action to improve it
40 cont.MC • EA
2.7, 2.7.1
Activity

Activity Activity
Support information Salinity in the Classroom
Page 90
Support information Salinity in the Classroom
Page 91
Reducing salinity
Background informationDiscuss with students the why and how of controlling salinity. (Refer to Section Two Background Information). Encourage students to examine what they can do either as a class or individuals to fight the battle against this issue. Use these discussions to develop a flow chart.
Activities Choose one way of reducing salinity, and use it as the basis for writing an
explanation (use the worksheet ‘Reducing salinity’ as a guide.) In groups or as individuals, design a poster encouraging the community to reduce
salinity. In groups or as individuals, design a poster to teach young children about how to
reduce salinity.
41MC • EA
2.7
Activity
Activity Activity
Support information Salinity in the Classroom
Page 90
Support information Salinity in the Classroom
Page 91
Reducing salinity
Worksheet
IntroductionOne way to reduce salinity is to
ExplanationThis will help because
Conclusion (A final statement about your writing)
Visual (for example drawing, graph, diagram)
41 cont.MC • EA
2.7
Activity
Activity Activity
Support information Salinity in the Classroom
Page 92
Support information Salinity in the Classroom
Page 93
Trees as pumps
You could also use Activity 17 ‘Water movement in plants ’and Activity 16 ‘What do trees do?’, to reinforce these concepts.
Background informationExcess groundwater recharge is the primary cause of dryland salinity. To control salinity we need to reduce recharge by using more rainfall. Trees are being used as pumps to do just this.
ActivityStudents complete the worksheet: Trees as pumps.In your workbook answer the following:
1 Find definitions for the terms: recharge, evaporation, transpiration, groundwater, tree crown.
2 The amount of water used by vegetation depends on its ability to use water from the soil. Plants with large crowns and deep root systems will use more water than shallow rooted annual species.
List these plants in order of their potential water use (from least to highest): one year old tree seedling, full grown gum tree, annual pasture grass, bushy shrub.
3 The amount of water used by a plant will depend on the available soil moisture, sunlight and leaf area. In three short paragraphs explain how these three factors could affect plant water use.
4 John Brown has a sheep and cropping farm near Katanning. The district rainfall is about 400 mm per year. John has identified a recharge area on his farm which is contributing to the dryland salinity problem in his district. He plans to fence out an area of 5 ha and plant eucalypts. Using Tables 1 and 2 and the equation below, calculate for John how many trees he would need to plant per hectare (round this figure up to the closest 100)and in total to achieve recharge control within six years ? How far apart should the trees be planted?
5 Daily water use varies considerably throughout the year. Table 1 shows the variation in water use over a year by eucalypts on recharge zones. The lower figures are during rainy days in winter and the higher figures are in early summer before the soil moisture is depleted. Age (due to growing leaf area and root system) also has a significant effect on the ability of trees to use water.
What is the average annual rainfall in your area?
6 Using the equation below, how many litres per day (L/day) would each tree (in a high density planting) have to use to achieve recharge control in your area?
7 Look at plants as groundwater pumps and design a poster for John Brown that shows him where to plant his trees. Attach information for John about why he should plant where you have suggested.
42EA
2.4, 2.7
Activity

Activity Activity
Support information Salinity in the Classroom
Page 92
Support information Salinity in the Classroom
Page 93
Trees as pumps
Equation No. trees per hectare = water use required (mm per year X 25 Water use (litres/day)
Table 1 Water use by eucalypt trees
Location Rainfall Age Tree water use (mm) (in years) (litres per day average)
Borden 450 6 10 - 100 (30)
Albany 800 20 0 - 160 (50)
Southern Cross 300 >100 10 - 450 (140)
The density of tree cover is also a significant factor, in terms of total water use over an area. For example, a stand of young trees (with a relatively low water use per day) planted at a high density (at least 500 trees per hectare) will use more water than an old stand of low tree density (see Table 2).
Table 2 Stand density and water use
Location Tree age Average water use Stand density Stand water use (years) (litres per day) (trees per hectare) (mm)
Borden 6 30 200 200
Albany 20 50 20 35
Southern Cross 100 + 140 20 105
42 cont.EA
2.4, 2.7
Activity
Activity Activity
Support information Salinity in the Classroom
Page 94
Support information Salinity in the Classroom
Page 95
Trees as pumps
Answers to the Worksheet 2 Annual pasture grass One-year-old tree seedling Bushy shrub Full grown gum tree.
3 Soil moisture - a plant can only use as much water as it has access to in the soil. Soil moisture varies throughout the year (lowest during late summer/early autumn). The maximum water use by a stand of trees will be the annual rainfall. Surface run-off and recharge that occurs between trees reduces the potential water use.
Sunlight - the energy for transpiration comes mainly from the sun. In most parts of Western Australia there is a potential to transpire 1500 mm of water per year. During winter, the shorter days and number of rainy days reduce the energy available for transpiration.
Leaf area - most transpiration takes place through the leaves. As plants grow, their leaf area increases and so does their water use.
4 No. trees = water use required (mm per year) X 25 per hectare Water use (L/ day)
6 No. trees = 450 mm X 25 per hectare water use (L/day)
= 375 trees/ha = 400 trees/ha [rounded up] 400 trees/ha X 5 ha = 2,000 trees would be required in total. 1 ha = 10,000 m² therefore 10,000 m² = 25 m²/tree 400 trees/ha
The square root of 25 is 5. Therefore trees would be spaced on a 5 m by 5 m grid.
42 cont.EA
2.4, 2.7
Activity

Activity Activity
Support information Salinity in the Classroom
Page 94
Support information Salinity in the Classroom
Page 95
Desalination
Background informationAlthough 97% of the world’s water is held in the oceans, it is of very little use to people except for recreation, waste disposal and for transportation. We cannot drink it because the taste is unpleasant and, if consumed in sufficient quantities it will make us sick. It cannot be used for washing, since most soaps will not lather in it. Machines and metals rust and decompose very quickly in salt water, so it cannot be used for cooling or in industry.
It is possible however, to obtain fresh water from the oceans or other salty water. The process is called desalination. It is possible to construct a simple experiment which illustrates the process.
Materials (per group) a large beaker which does not have a pouring lip
a small beaker (which will fit with a lot of room to spare in the large beaker)
a concave dish which will fit over the top of the large beaker
some table salt
Procedure1 Dissolve some salt (e.g. three tablespoons) in a litre of water in the large beaker.
2 The students may care to place a little of the water on their tongues to determine how salty the water is. If not very salty, add a little more salt.
3 Sit the small beaker in the large one, ensuring that none of the saline water gets into the small beaker. The small beaker may start to float. Perhaps a lead sinker in the bottom of the small beaker will overcome the problem.
4 Place the concave dish, face up over the large beaker.
5 Place in a sunny spot. Observe what happens over several days.
ActivityWhen the experiment has finished discuss with your group what has happened. Write a report describing what you have observed and attempt to explain what has occurred.
Research1 Which countries in the world are using desalination plants to obtain fresh water
for use?
2 How is a large scale desalination plant constructed and how does it operate?
3 Where are the best sites around the world to locate a desalination plant?
4 Why are desalination plants not used more widely?
43EA
2.8
Activity
Activity Activity
Support information Salinity in the Classroom
Page 96
Support information Salinity in the Classroom
Page 97
To clear or not to clear, that is the question
In this activity students look at how to minimise human influence on the environment.
Background informationMeet Joy and John Citizen, who have just bought a bush block a few kilometres outside the city. They have become tired of the hustle and bustle of city living and are planning to enjoy the quiet country life.
The block is five hectares in size (an area roughly equal to 80 suburban housing blocks) and hilly, with many rocky outcrops. A creek flows through the property in winter and its waters are brackish (slightly salty). The soils are a grey sand with patches of gravelly soils along the creek line. There are stands of tall eucalyptus trees (jarrah and marri) and some areas of low scrub.
The area receives about 800 mm of rainfall annually, most of it in the form of heavy downpours. In summer, temperatures regularly reach the high thirties and occasionally reach 40oC. Winds are from the west in winter and hot, strong easterlies blow in summer.
Joy and John are planning to build a house, shed and garage. They want to grow as much of their own food as possible and would like to keep some goats and maybe a horse or two.
A similar block was sold to city people ten years ago. Most of the block was cleared by the owners to make room for a house, other buildings and paddocks for grazing some horses. This property is now infested with rabbits, while the creek has washed away large amounts of soil, making deep gullies in the process. The owners of this property are trying to sell it and move back to the city.
Joy and John are talking to as many people as possible to get advice. Among the people they will see are:
a shire councillor;
a local agricultural adviser;
a local native vegetation/biodiversity adviser
a builder; and
a farmer on the local catchment group.
(Perhaps there are other people whom you think they should talk to.)
44EA
2.3, 2.4, 2.5, 2.7
Activity
Activity Activity
Support information Salinity in the Classroom
Page 96
Support information Salinity in the Classroom
Page 97
To clear or not to clear, that is the question
WorksheetBelow are some suggestions for roles you may like to adopt.
1 Each group will be given one role. Your group has to decide how the person will advise Joy and John.
2 Write a speech that gives Joy and John advice about what to do.3 You may also choose to develop this activity as a cartoon series.
Suggestions for the roles you may want to play
Shire councillorThe shire wants to encourage more people to live in the area. More people means that more rates can be collected and better services can be provided. At the same time, the shire is worried about its creeks and other drainage lines. Most have become severely degraded and are eroding their banks.
Agricultural adviserHypothesise that clearing of more than one hectare of land is illegal without permission from the Comimissioner for Soil and Land Conservation. How will you convince Joy and John that they should leave as much of the natural vegetation as possible? This will prevent erosion and keep the saline watertable deep under the surface (remember that the creek is already brackish). You could also think about how their actions might affect the value of the land. How could they earn money on their property while protecting it?
Native vegetation/biodiversity adviserSome of the plants and animals on Joy and John’s block are quite rare and will lose their habitat if the vegetation is cleared. How will you convince Joy and John that these organisms‘ habitat should be conserved?
BuilderThere are many ways in which Joy and John could make their house energy and water- efficient. Can you give them advice on how to make an energy-efficient house, how to use as little water as possible and how to safely dispose of waste water?
FarmerYou are a member of the local catchment group that is trying to overcome common land degradation problems. Erosion and salinity are serious problems on the farms in your district and you have seen what horses and goats can do to the land; they cause a lot of erosion because they kill the trees and shrubs, leaving the soil exposed.
44 cont.EA
2.3, 2.4, 2.5, 2.7
Activity

Activity Activity
Support information Salinity in the Classroom
Page 98
Support information Salinity in the Classroom
Page 99
Salty facts
Background informationDiscuss the uses and importance of salt. List items that contain salt.
The word ‘salary’ is derived from the word ‘salt’. Ancient Roman soldiers were given a block of salt as a reward for their work.
A person weighing 35 kg contains 75 g of salt, or about 13 level teaspoons. To demonstrate, ask a student to hold a glass jar and add 13 teaspoons of salt. Add an extra teaspoon of salt, and discuss what health problems they may experience from eating too much salt (e.g. dehydration, high blood pressure).
Many superstitions include salt. e.g. If salt was spilt, the person threw a pinch of salt over the left shoulder three times in
an effort to avoid bad luck.
A box of coal and a plate of salt used to be the first things carried into a new house in the English midlands.
When a person in Wales died, someone sent for the ‘Sin-Eater’. He placed a plate of salt and a piece of bread on the chest of the deceased. After making an incantation over the bread, he ate it. The Welsh believed he was eating the sins of the deceased that had been drawn up from the body by the salt.
Demonstrations Red cordial, cloth and salt - to demonstrate that salt absorbs stains.
Glass, teaspoon and salt - to demonstrate the amount of salt in the human body
(See above).
Activities Complete the worksheet ‘Salty facts’.
Collect pictures of things that contain salt.
Brainstorm facts about salt.
Discuss uses of salt. The list may include:
to make soap
for first aid - salt acts as a mild antiseptic for mouth ulcers and minor cuts
to kill germs and bacteria in pools
to remove red wine or cordial stains - salt poured on a stain absorbs the red wine or cordial so that it does not soak into the fabric. (You could demonstrate this.)
blocks of salt are given to cattle and sheep if their diets are low in salt
to preserve food (e.g. Christmas ham)
45MC
Activity

Activity Activity
Support information Salinity in the Classroom
Page 98
Support information Salinity in the Classroom
Page 99
Salty facts
Worksheet
Solve the code to complete these salty facts
A person weighing 35 kilograms contains 13 (20, 5, 1, 19, 16, 15, 15, 14, 19) of salt. Our tears, sweat and blood contain salt.
When a person in Wales died the (19, 9, 14-, 5, 1, 20, 5, 18) was sent for. He placed a plate of salt and a piece of bread on the chest of the deceased. After whispering magical words over the bread he (1, 20, 5) it. It was believed he was eating the sins of the deceased.
According to one superstition, if salt is spilt bad (12, 21, 3, 11)is avoided by throwing a pinch of salt over the shoulder three times.
The majority of salt is found in the (15, 3, 5, 1, 14). The salt makes the water more dense, enabling things to (6, 12, 15, 1, 20) better.
Salt is an antiseptic- it kills (7, 5, 18, 13, 19), making it very useful for cleaning sores, preserving (6, 15, 15, 4), and in swimming pools.
(19, 1, 12, 1, 18, 25) is derived from the word salt - ancient Roman soldiers were given a block of salt as a reward for their work. They exchanged the salt for other goods they wanted.
A B C D E F G H I J K l M
1 2 3 4 5 6 7 8 9 10 11 12 13
N O P Q R S T U V W X Y Z
14 15 16 17 18 19 20 21 22 23 24 25 26
45 cont.MC Activity
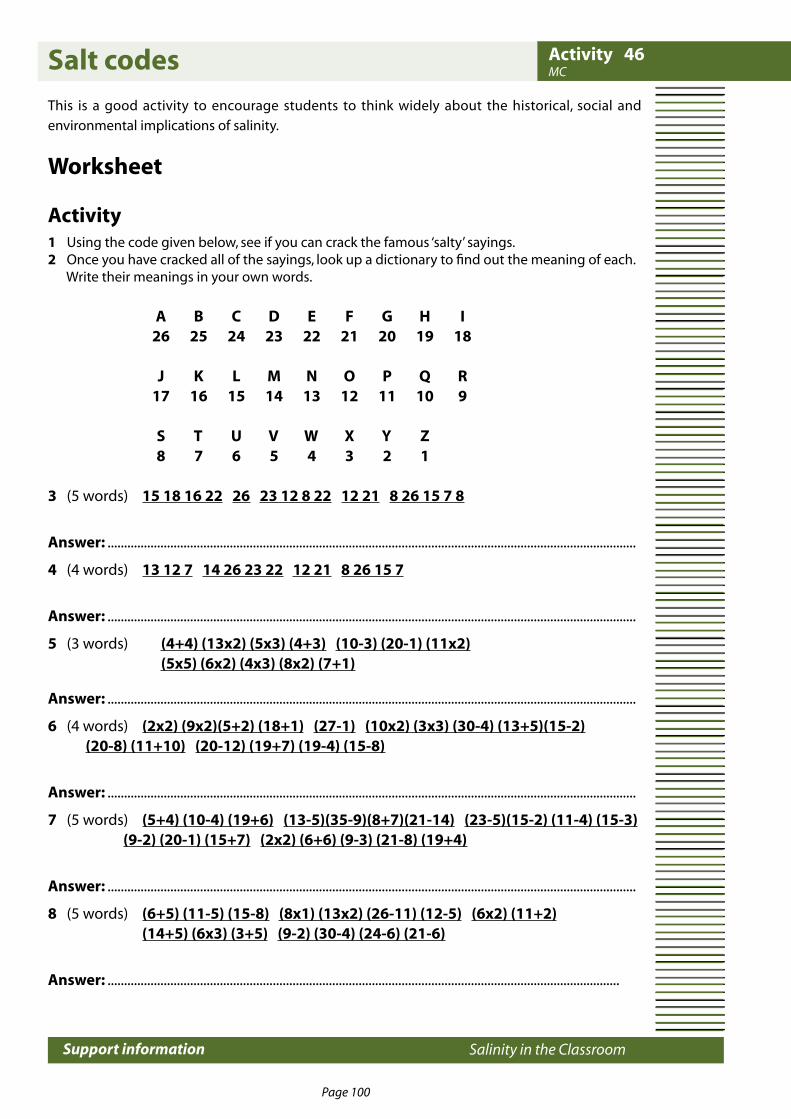
Activity Activity
Support information Salinity in the Classroom
Page 100
Support information Salinity in the Classroom
Page 101
Salt codes
This is a good activity to encourage students to think widely about the historical, social and
environmental implications of salinity.
Worksheet
Activity1 Using the code given below, see if you can crack the famous ‘salty’ sayings. 2 Once you have cracked all of the sayings, look up a dictionary to find out the meaning of each. Write their meanings in your own words.
A B C D E F G H I 26 25 24 23 22 21 20 19 18
J K L M N O P Q R 17 16 15 14 13 12 11 10 9
S T U V W X Y Z 8 7 6 5 4 3 2 1
3 (5 words) 15 18 16 22 26 23 12 8 22 12 21 8 26 15 7 8
Answer: ................................................................................................................................................................
4 (4 words) 13 12 7 14 26 23 22 12 21 8 26 15 7
Answer: ................................................................................................................................................................
5 (3 words) (4+4) (13x2) (5x3) (4+3) (10-3) (20-1) (11x2) (5x5) (6x2) (4x3) (8x2) (7+1)
Answer: ................................................................................................................................................................
6 (4 words) (2x2) (9x2)(5+2) (18+1) (27-1) (10x2) (3x3) (30-4) (13+5)(15-2) (20-8) (11+10) (20-12) (19+7) (19-4) (15-8)
Answer: ................................................................................................................................................................
7 (5 words) (5+4) (10-4) (19+6) (13-5)(35-9)(8+7)(21-14) (23-5)(15-2) (11-4) (15-3) (9-2) (20-1) (15+7) (2x2) (6+6) (9-3) (21-8) (19+4)
Answer: ................................................................................................................................................................
8 (5 words) (6+5) (11-5) (15-8) (8x1) (13x2) (26-11) (12-5) (6x2) (11+2) (14+5) (6x3) (3+5) (9-2) (30-4) (24-6) (21-6)
Answer: ...........................................................................................................................................................
46MC
Activity
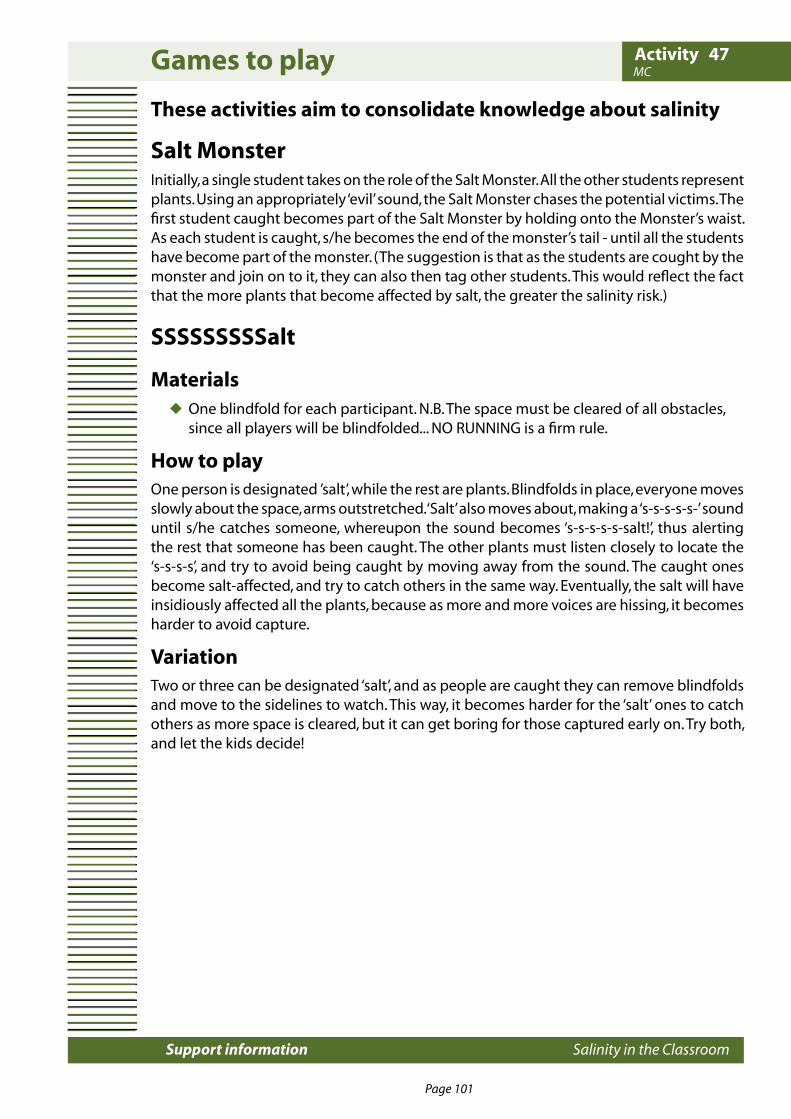
Activity Activity
Support information Salinity in the Classroom
Page 100
Support information Salinity in the Classroom
Page 101
Games to play
These activities aim to consolidate knowledge about salinity
Salt MonsterInitially, a single student takes on the role of the Salt Monster. All the other students represent plants. Using an appropriately ‘evil’ sound, the Salt Monster chases the potential victims. The first student caught becomes part of the Salt Monster by holding onto the Monster’s waist. As each student is caught, s/he becomes the end of the monster’s tail - until all the students have become part of the monster. (The suggestion is that as the students are cought by the monster and join on to it, they can also then tag other students. This would reflect the fact that the more plants that become affected by salt, the greater the salinity risk.)
SSSSSSSSSalt
Materials One blindfold for each participant. N.B. The space must be cleared of all obstacles, since all players will be blindfolded... NO RUNNING is a firm rule.
How to play One person is designated ’salt’, while the rest are plants. Blindfolds in place, everyone moves slowly about the space, arms outstretched. ‘Salt’ also moves about, making a ‘s-s-s-s-s-’ sound until s/he catches someone, whereupon the sound becomes ‘s-s-s-s-s-salt!’, thus alerting the rest that someone has been caught. The other plants must listen closely to locate the ‘s-s-s-s’, and try to avoid being caught by moving away from the sound. The caught ones become salt-affected, and try to catch others in the same way. Eventually, the salt will have insidiously affected all the plants, because as more and more voices are hissing, it becomes harder to avoid capture.
VariationTwo or three can be designated ‘salt’, and as people are caught they can remove blindfolds and move to the sidelines to watch. This way, it becomes harder for the ‘salt’ ones to catch others as more space is cleared, but it can get boring for those captured early on. Try both, and let the kids decide!
47MC Activity
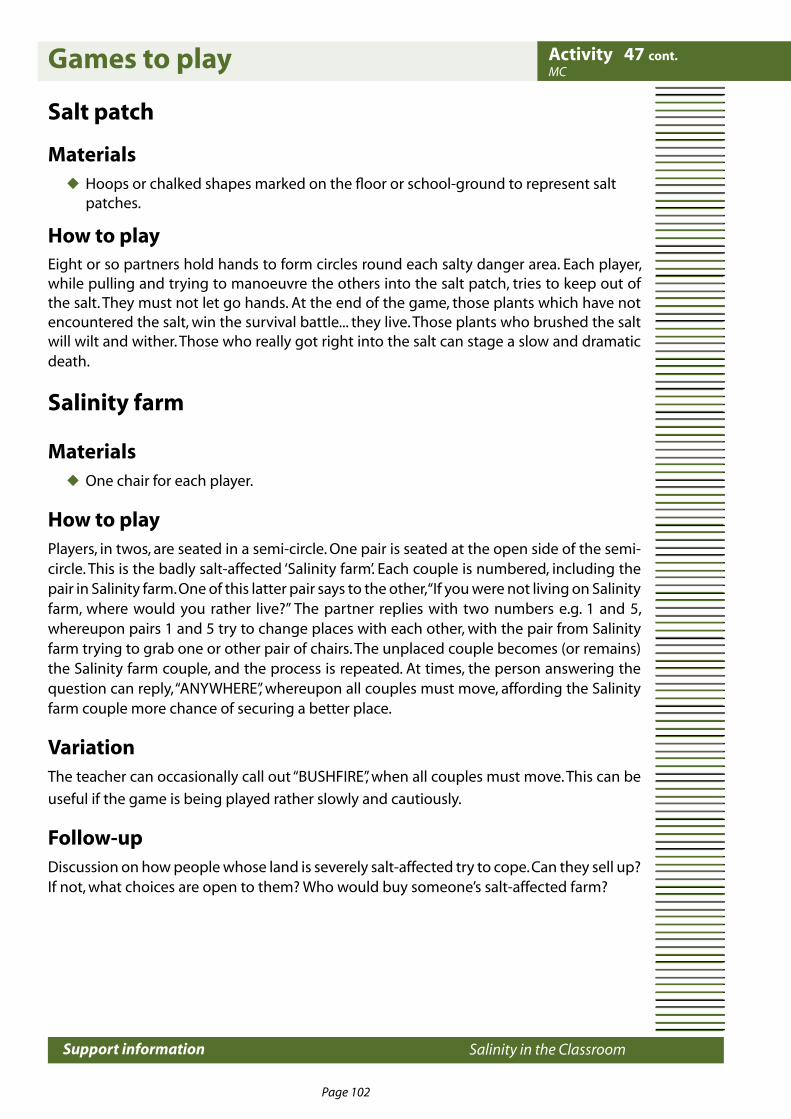
Activity Activity
Support information Salinity in the Classroom
Page 102
Support information Salinity in the Classroom
Page 103
Games to play
Salt patch
Materials Hoops or chalked shapes marked on the floor or school-ground to represent salt patches.
How to playEight or so partners hold hands to form circles round each salty danger area. Each player, while pulling and trying to manoeuvre the others into the salt patch, tries to keep out of the salt. They must not let go hands. At the end of the game, those plants which have not encountered the salt, win the survival battle... they live. Those plants who brushed the salt will wilt and wither. Those who really got right into the salt can stage a slow and dramatic death.
Salinity farm
Materials One chair for each player.
How to playPlayers, in twos, are seated in a semi-circle. One pair is seated at the open side of the semi-circle. This is the badly salt-affected ‘Salinity farm’. Each couple is numbered, including the pair in Salinity farm. One of this latter pair says to the other, “If you were not living on Salinity farm, where would you rather live?” The partner replies with two numbers e.g. 1 and 5, whereupon pairs 1 and 5 try to change places with each other, with the pair from Salinity farm trying to grab one or other pair of chairs. The unplaced couple becomes (or remains) the Salinity farm couple, and the process is repeated. At times, the person answering the question can reply, “ANYWHERE”, whereupon all couples must move, affording the Salinity farm couple more chance of securing a better place.
VariationThe teacher can occasionally call out “BUSHFIRE”, when all couples must move. This can be
useful if the game is being played rather slowly and cautiously.
Follow-upDiscussion on how people whose land is severely salt-affected try to cope. Can they sell up? If not, what choices are open to them? Who would buy someone’s salt-affected farm?
47 cont.MC
Activity
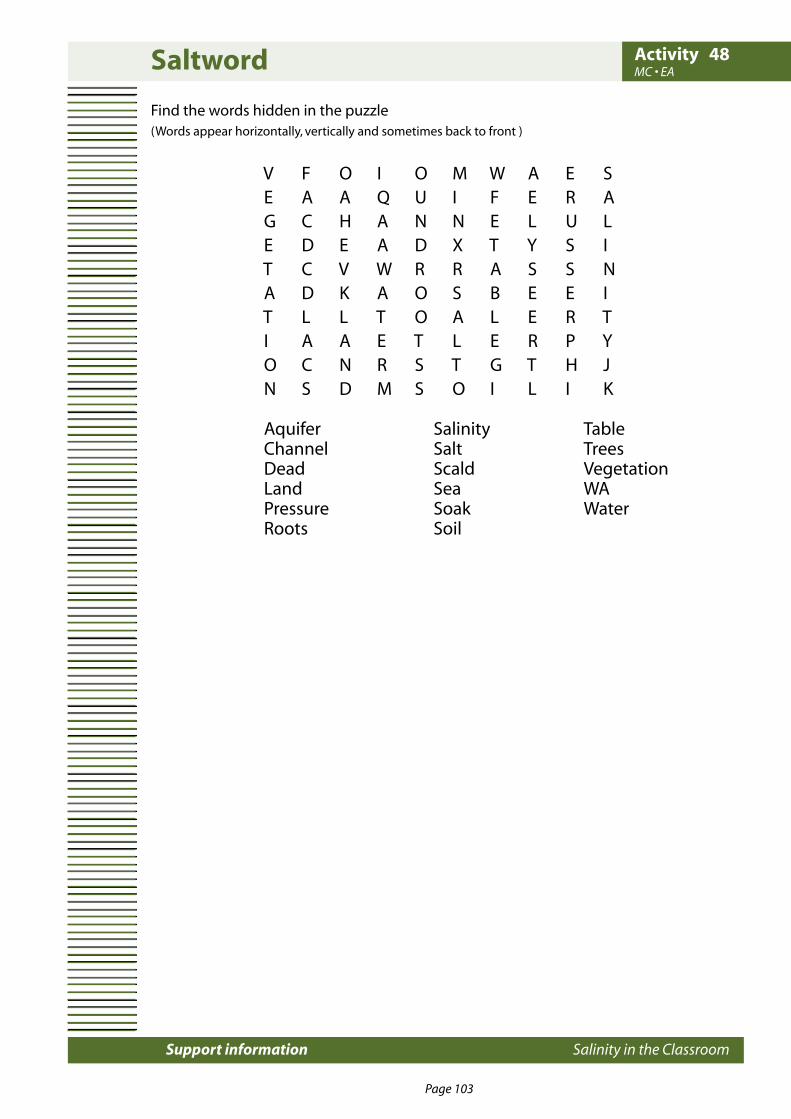
Activity Activity
Support information Salinity in the Classroom
Page 102
Support information Salinity in the Classroom
Page 103
Saltword
Find the words hidden in the puzzle (Words appear horizontally, vertically and sometimes back to front )
V F O I O M W A E S E A A Q U I F E R A G C H A N N E L U L E D E A D X T Y S I T C V W R R A S S N A D K A O S B E E I T L L T O A L E R T I A A E T L E R P Y O C N R S T G T H J N S D M S O I L I K
Aquifer Salinity Table Channel Salt Trees Dead Scald Vegetation Land Sea WA Pressure Soak Water Roots Soil
48MC • EAActivity
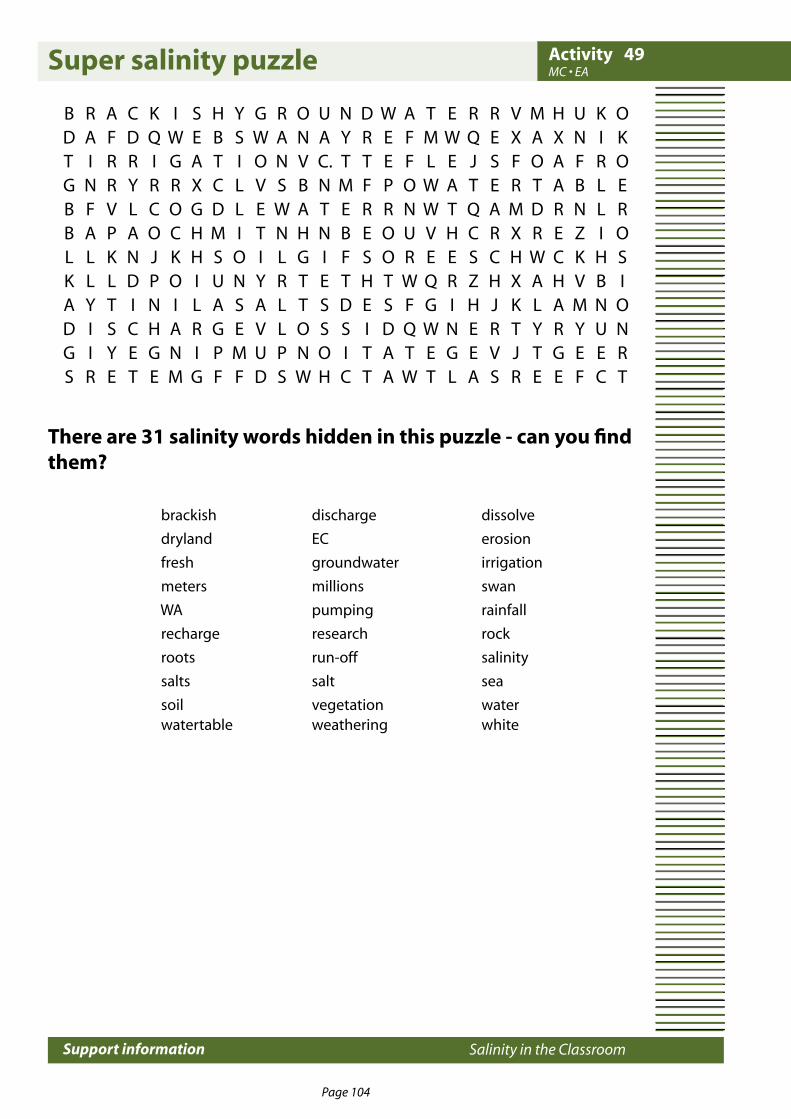
Activity Activity
Support information Salinity in the Classroom
Page 104
Support information Salinity in the Classroom
Page 105
Super salinity puzzle
B R A C K I S H Y G R O U N D W A T E R R V M H U K O D A F D Q W E B S W A N A Y R E F M W Q E X A X N I K T I R R I G A T I O N V C. T T E F L E J S F O A F R O G N R Y R R X C L V S B N M F P O W A T E R T A B L E B F V L C O G D L E W A T E R R N W T Q A M D R N L R B A P A O C H M I T N H N B E O U V H C R X R E Z I O L L K N J K H S O I L G I F S O R E E S C H W C K H S K L L D P O I U N Y R T E T H T W Q R Z H X A H V B I A Y T I N I L A S A L T S D E S F G I H J K L A M N O D I S C H A R G E V L O S S I D Q W N E R T Y R Y U N G I Y E G N I P M U P N O I T A T E G E V J T G E E R S R E T E M G F F D S W H C T A W T L A S R E E F C T
There are 31 salinity words hidden in this puzzle - can you find them?
brackish discharge dissolve
dryland EC erosion
fresh groundwater irrigation
meters millions swan
WA pumping rainfall
recharge research rock
roots run-off salinity
salts salt sea
soil vegetation water watertable weathering white
49MC • EA
Activity
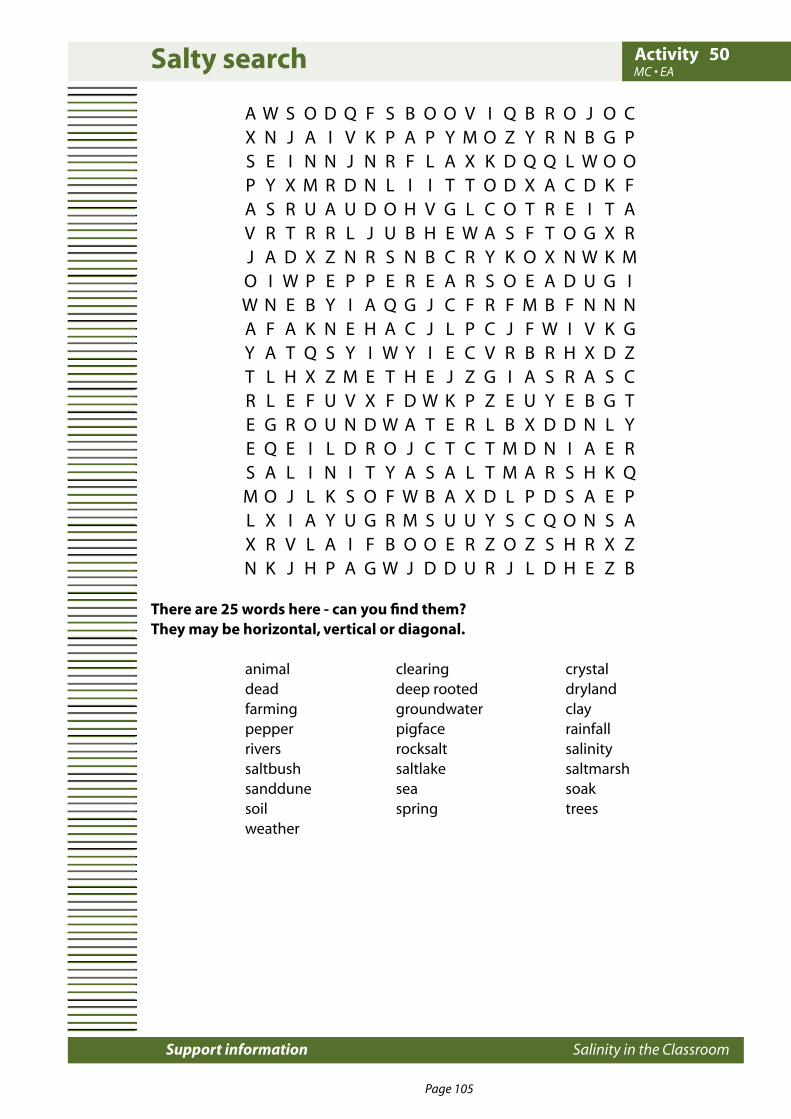
Activity Activity
Support information Salinity in the Classroom
Page 104
Support information Salinity in the Classroom
Page 105
Salty search
A W S O D Q F S B O O V I Q B R O J O C X N J A I V K P A P Y M O Z Y R N B G P S E I N N J N R F L A X K D Q Q L W O O P Y X M R D N L I I T T O D X A C D K F A S R U A U D O H V G L C O T R E I T A V R T R R L J U B H E W A S F T O G X R J A D X Z N R S N B C R Y K O X N W K M O I W P E P P E R E A R S O E A D U G I W N E B Y I A Q G J C F R F M B F N N N A F A K N E H A C J L P C J F W I V K G Y A T Q S Y I W Y I E C V R B R H X D Z T L H X Z M E T H E J Z G I A S R A S C R L E F U V X F D W K P Z E U Y E B G T E G R O U N D W A T E R L B X D D N L Y E Q E I L D R O J C T C T M D N I A E R S A L I N I T Y A S A L T M A R S H K Q M O J L K S O F W B A X D L P D S A E P L X I A Y U G R M S U U Y S C Q O N S A X R V L A I F B O O E R Z O Z S H R X Z N K J H P A G W J D D U R J L D H E Z B
There are 25 words here - can you find them? They may be horizontal, vertical or diagonal.
animal clearing crystal dead deep rooted dryland farming groundwater clay pepper pigface rainfall rivers rocksalt salinity saltbush saltlake saltmarsh sanddune sea soak soil spring trees weather
50MC • EAActivity

Activity Activity
Support information Salinity in the Classroom
Page 106
Support information Salinity in the Classroom
Page 107
� � � � � �
�
��
�
�
��
�
��
��
�� �� �� ��
��
��
��
��
��
��
Cross-salt 51MC • EA
Activity
Activity Activity
Support information Salinity in the Classroom
Page 106
Support information Salinity in the Classroom
Page 107
Cross-salt
CLUES ACROSS
1 .................................... allows water to flow away
5 Liquid ice
7 Sodium chloride
9 A hole drilled through the soil for the purpose of viewing groundwater
11 What water does down hills
12 Capable
13 Ocean
15 Salt ........................: an area in which a naturally salty subsoil has been exposed as a result of erosion of the topsoil
20 Australian Capital Territory
22 An underground water-bearing layer of permeable rock
23 Tall woody plants
CLUES DOWN1 Areas are those in which there is upward movement and/or escape of
groundwater
2 Sicken
3 Not yes
4 The sum of water loss from soil due to evaporation and transpiration by plants
5 Not dry
6 Granite is a type of
8 An area in WA where grazing with sheep is the main agricultural activity
9 What salt takes away from farmers
10 Type of salting that occurs in non-irrigation areas
14 ............................. areas are ones in which surface water is added to the groundwater
16 An area of land that drains into a common creek or river
17 Harvesting of trees
19 The content of salt in water or soil
21 The Swan
51 cont.EAActivity
Activity Activity
Support information Salinity in the Classroom
Page 108
Support information Salinity in the Classroom
Page 109
� �
� � � �
�
�
�
��
�� ��
�� ��
��
�� ��
��
�� ��
��
��
��
��
��
��
����
��
��
��
��
��
��
Super salinity crossword 52MC • EA
32
Activity

Activity Activity
Support information Salinity in the Classroom
Page 108
Support information Salinity in the Classroom
Page 109
Super salinity crosswordCLUES ACROSS
3 Type of salinity which occurs in non-irrigation areas
6 The State of Excitement
8 A cover of this is important to reduce erosion
9 Water can make its way down to the groundwater through ........................... in the rock
11 A river near Albany, which has a salinity problem
12 ....................... areas are ones in which surface water (e.g. from rainfall), is added to
the groundwater
15 Another name for rock salt
16 All free water found below the surface in the layers of the earth’s crust
17 The colour of table salt (NaCl)
18 Salinity occurs in areas where the ............................ cycle has been upset
21 Water can ............................... through the soil and down to the groundwater
22 The process in which water flows across the soil surface and into streams, rivers etc.
24 Able to be dissolved
26 Not alive
27 Ways of reducing water logging in paddocks
28 Abbreviation of State east of WA (also has a salinity problem)
30 Solar energy can be used to ............................. salty water, leaving salt crystals behind
31 Animal with nippers found in WA dams
32 An underground layer of permeable rock, sand or gravel, which holds water
CLUES DOWN
1 The upper surface of the zone of soil saturation by groundwater
2 One example of precipitation
4 Granite is a type of ...................................
5 Expanse of salt water which covers most of the earth’s surface
7 ................................. areas when there is upward movement and/or escape
of groundwater
10 The process by which extra water is added to the soil surface for agriculture and horticulture
13 Material made from the weathering of rocks over many years
14 These crystals cause the salinity problem
15 An area of land that drains into a common creek or river
16 If salt is mixed with water, it will .......................................
19 Process by which the earth’s surface wears away
20 The greatest environmental threat in WA
29 A special type of sand dune, often found near salt lakes (rhymes with ‘pet’)
52 cont.EAActivity
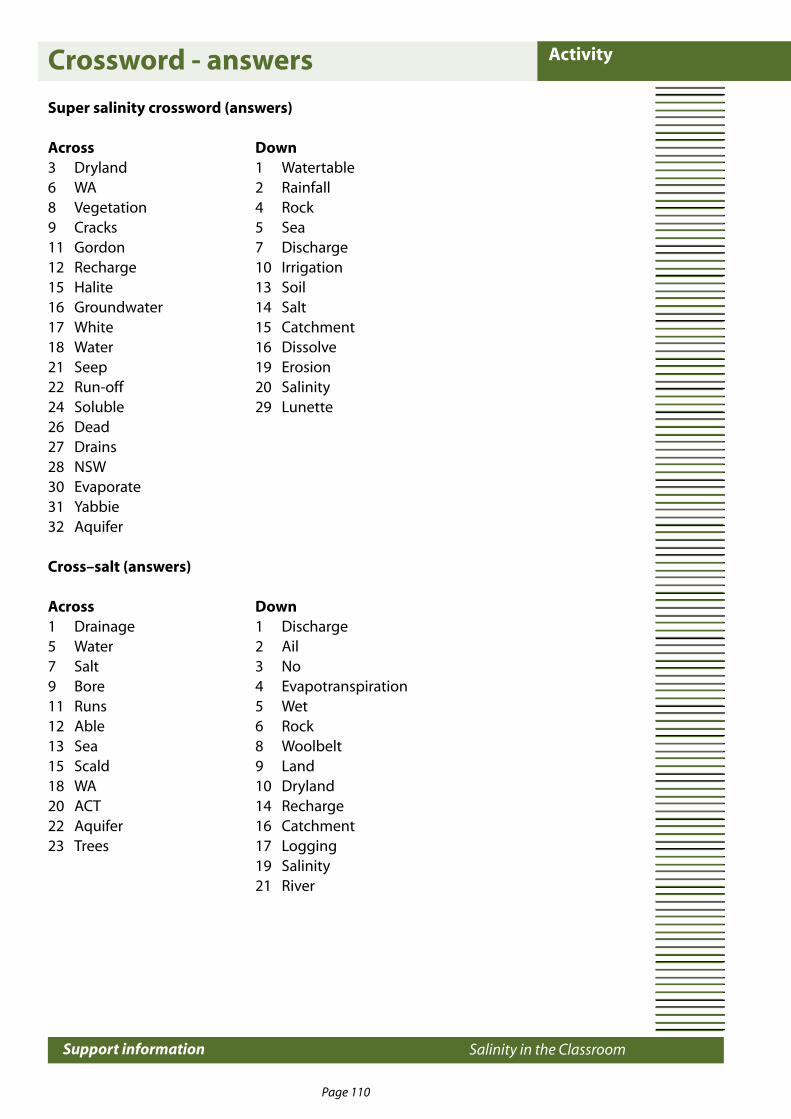
Activity Activity
Support information Salinity in the Classroom
Page 110
Salinity in the Classroom
Page 111
Super salinity crossword (answers)
Across Down3 Dryland 1 Watertable6 WA 2 Rainfall8 Vegetation 4 Rock9 Cracks 5 Sea11 Gordon 7 Discharge12 Recharge 10 Irrigation15 Halite 13 Soil16 Groundwater 14 Salt17 White 15 Catchment18 Water 16 Dissolve21 Seep 19 Erosion22 Run-off 20 Salinity24 Soluble 29 Lunette26 Dead27 Drains28 NSW30 Evaporate31 Yabbie32 Aquifer
Cross–salt (answers)
Across Down1 Drainage 1 Discharge5 Water 2 Ail7 Salt 3 No9 Bore 4 Evapotranspiration11 Runs 5 Wet12 Able 6 Rock13 Sea 8 Woolbelt15 Scald 9 Land18 WA 10 Dryland20 ACT 14 Recharge22 Aquifer 16 Catchment23 Trees 17 Logging 19 Salinity 21 River
Crossword - answers
Activity Activity
Support information Salinity in the Classroom
Page 110
Salinity in the Classroom
Page 111
BIBLIOGRAPHY
These resources are a good source of further activities.
A Taste of Salt. Rivers, Catchments & Salinity. Salt Action. NSW Agriculture. Orange NSW, 1999.
Caring For Our Country.Landcare Australia Ltd. NSW, 1989.
Landcare In Your Hands. Frits Droge. Department of Agriculture, Western Australia, 1991.
Investigating the Catchment with Detective Crow. Garry Heady and Terry Roberts. Fairbridge Eco Project. Pinjarra WA.
Our Land. LandCare Activities for Upper Primary. National Soil Conservation Program. Department of Conservation, Forests and Lands, Victoria, 1989.
Saltwatch. Involve me and I’ll Understand. Saltwatch Curriculum Package Salt Action. Victoria, 1991.
Soil Magic. LandCare Activities for Middle Primary. National Soil Conservation Program. Department of Conservation, Forests and Lands, Victoria, 1989.
Websites
Useful References
WA Support Projects
Glossary
Section 5
Section 5
Page 1
Further information Salinity in the Classroom
WebsitesThe following websites have been selected because they have information specifically about salinity in Western Australia and Australia. They may be of use to you and your students when searching for additional or new information on salinity and salinity related topics .A very large number of other sites can be found by using the internet search engines, and using ‘salinity’ as the key word.
Australian Broadcasting Corporation (www.abc.net.au) Water Pressure. Four Corners. A very valuable resource on water management
and salinity issues. Good links, graphics and review of the issues. Search for salinity in the other program and news items by entering ‘salinity’ into
the search section of the home page Australian Bureau of Statistics (www.abs.gov.au) - Environment Theme
A very worthwhile site to visit, with papers on sustainability indicators for Australia, key environmental statistics, and environmental statistics glossary.
Australian Academy of Science: Soil salinity in Australia (www.science.org.au/nova/032/032key.htm) Useful sites. An Australian Academy of Science project, supported by the Science
and Technology Awareness Program of the Commonwealth Department of Industry, Science and Resources and the Australian Foundation for Science. This topic is sponsored by the Land Monitor Project and the Commonwealth Department of Industry, Science and Resources. Easy to navigate and a range of resources and on-site information. Limited bibliography and web links. No date given on the site.
Avon Catchment Network: Natural Resource Information. (www.avonicm.org.au/avoncn/natural.html) One of the developing Western Australian Regional Information Centres. Is largely a
portal to other information sources, but is being developed to deliver specifically to the Avon catchment community.
ACF: Australian Conservation Foundation (www.acfonline.org.au/index.htm)A national non-profit organisation with a strong environmental ethic. Has good navigation and reasonable content. Publications and policy documents worth browsing. Also has some children’s level material.
Australian Conservation Foundation: Salinity (www.au/asp/pages/intro.asp?idTopic=15) The ACF has collated a lot of background information on salinity and provides
suggestions on what you can DO. Good introductory level to the major community level issues about salinity.
Centre for Water Resources Dryland Salinity in Western Australia. Good information regarding salinity. i.e. How it
works, the extent of the problem, Environmental and Economic Impacts, Solutions and some very good related links.
Conservation and Land Management Western Australia (CALM) (www.calm.wa.gov.au/index.html)Good site, worth visiting regularly. Home page slow to load with all the graphics. Very good range of content. Good schools site. This site contains several items on salinity, including CALM’s review of programs under the State Salinity Action Plan 1996 to June 2000. To find these items, use the ‘Quick Search’ button, and type ‘salinity’.

Page 2
Further information Salinity in the Classroom
Page 3
Further information Salinity in the Classroom
Cooperative Research Centre Program Directory - Australia (www.dist.gov.au/crc/index.html)
The CRC Program is funded by the Australian Commonwealth Government, to strengthen collaborative links between industry, research organisations, educational institutions and government agencies.This is the best entry site to all the CRCs, current and past: 15 Environment CRCs; 13 Agricultural and Rural Based Manufacturing CRCs.
CRC For Plant-Based Management of Dryland Salinity (www.general.uwa.edu.au/u/dpannell/crcsalt.htm) Through an improved understanding of the way natural and agricultural
ecosystems work, provide new plant-based land use systems that lessen the economic and social impacts of dryland salinity and thereby help to sustain rural communities. This interim site provides links to contacts for the CRC, participants, newsletters, the business plan and forms for project proposals.
CRC for Catchment Hydrology (www.catchment.crc.org.au/)“The CRC for Catchment Hydrology aims to deliver the capability to manage catchments in a totally new way. Our central goal is to produce a decision support system able to predict the movement of water, particulates, and solutes from land to rivers, linking the impact of climate variability, vegetation, soil, and water management together in an integrated package.”
CRC for Coastal Zone, Estuary and Waterway Management - Australia(www.coastal.crc.org.au/)
“The Coastal CRC provides decision-making tools and knowledge necessary for the effective management and ecosystem health of Australia’s coastal zone, estuaries and waterways.”
CRC for Freshwater Ecology (http://enterprise.canberra.edu.au/www/www-crcfe.nsf )
“The CRC for Freshwater Ecology exists to improve the condition of Australia’s inland waters.” There are a number of good reports on-line in the publications section.
CSIRO Land and Water (www.csiro.au/index.asp) Has an interesting summary, and links to other sites and documents. Department of Agriculture, Western Australia: (www.agric.wa.gov.au) For Western Australian land managers. The information on management options for
water management (Drainwise) and salinity is very good. Salinity Home Page Water Management (Drainwise) Home Page
Department of Environmental Protection (www.environ.wa.gov.au) State of the Environment 1998 (Western Australia): Land Covers land salinisation State of the Environment 1997 (New South Wales) Good Teachers/Student links
providing information on various environmental topics such as Air, Chemicals, Hazardous materials, Land, Lead safe, Noise, Pesticides, Radiation, Waste and Recycling, Water, Sustainability, Biodiversity and Human settlement.
Department of Land & Water Conservation. NSW. Salinity in NSW (www.dlwc.nsw.gov.au) Good generic information with good photographs. Department of Natural Resources and Environment. Reading the Land (www.nre.vic.gov.au) Excellent information on soil erosion, salinity, deterioration of soil structure, soil
fertility decline, pests, plants and animals and tree and bushland decline.

Page 2
Further information Salinity in the Classroom
Page 3
Further information Salinity in the Classroom
Department of Natural Resources Queensland: Salinity Fact Sheets (www.nrm.qld.gov.au/resourcenet/fact_sheets/landfacts.html) All the Factsheets are downloadable pdf, which slows viewing considerably, but
gives good printouts if required. All Factsheets are limited to two pages. Department of Primary Industries, Water and Environment Tasmania (www.dpiwe.tas.gov.au/inter.nsf/) The Tasmanian Salinity Audit. Limited application to Western Australia. Grains Research and Development Corporation (GRDC) (www.grdc.com.au) GRDC is funding a large number of projects that consider sustainability and salinity
in relation to cropping. Find all the items on this site by entering ‘salinity’ in the Search system. There were 270 items when last visited.
Greening Australia Western Australia Environmental Issues (www.greeningaustralia-wa.org/nature/nature.htm) A good summary of the influence of salinity on loss of biodiversity.
Education resources: Activities, professional development for teachers, kits. These are not specifically on salinity, but cover salinity as one of the environmental threats.
Institute of Foresters of Australia (WA Branch). Forests & Salinity (www.ifa.unimelb.edu.au/)
In Western Australia, forest hydrology and salinity has been studied as intensively as any forest in the world. Many surveys of hydrology and salinity have been undertaken, and many catchment experiments have been established and monitored over the last three decades. This scientific research has clearly established the hydrologic patterns over the region, the effects of land management practices on salinity and sedimentation, and provided the basis for improvements to forest management practices.
Land Monitor (www.landmonitor.wa.gov.au/) A project of the Western Australian Salinity Action Plan, supported by the Natural
Heritage Trust. The formal part of this project has finished, but is likely to be maintained to support the outcomes of the State Salinity Strategy. Spatial products from this project are the basis of Western Australia’s salinity risk maps.
Land & Water Australia (www.lwa.gov.au/)Was known as the LWRRDC. A lot of information for project funding applicants and users of the project outputs. Navigation and design need updating.
Murray-Darling Basin Home (www.mdbc.gov.au/) MDBC Draft Basin Salinity Management Strategy 2001-2015 The MDBC salinity
pages are extensive, and linked to the National Dryland Salinity Program site for the Salinity Information Package and The Tools Salinity Extension Framework. Most of the pages are ‘about’ salinity technical and other issues rather than ‘how to’ implement salinity management. Easy to navigate, but you may end up on other sites.
MDBC: Land and Water Salinity A very good introduction to land and water degradation (including salinity) in the Murray-Darling Basin - history and processes. Good reference list.
MDBC Salinity Tools Information Package. NDSP. A large range of material for assessing and managing salinity, mostly relevant only to the MDB, but generic material can be applied elsewhere.
MDBC Salinity Audit The Murray-Darling Basin Salinity audit and other related publications are available for downloading as pdf files.

Page 4
Further information Salinity in the Classroom
Page 5
Further information Salinity in the Classroom
National Action Plan for Salinity and Water Quality (www.affa.gov.au/content/publications.cfm) “The National Action Plan represents the first concerted and targeted national
strategy to address salinity and water quality problems, two of the most significant issues confronting Australia’s rural industries, regional communities and our environment.” This AFFA site includes the Action Plan, latest information on implementation of the Plan, information on NRM trading and market-based instruments, and “The Evolution of a National Natural Resource Management Policy framework”.
National Dryland Salinity Program Australia (NDSP) (www.ndsp.gov.au) A large if sometimes confusing resource on dryland salinity. As with most salinity
resources on the web, most of this is ‘about’ rather than ‘how to’. The Publications section is worth browsing. NDSP Focus on Salt Newsletter The Newsletter is available as pdf files, which
makes it slow to view. The issues are listed by No. and date only, without an indication of content. This makes them hard to search for particular topics, but the content is good.
NDSP - OPUS: Options for the Productive Use of Salinity. Many good starting points for networks in salinity.
NDSP SALTLIST email forum This email forum is pretty active at times, and worth keeping an eye on. The level of debate is variable, as membership ranges from leading-edge researchers to (apparently!) complete novices.
Natural Resources and Environment Victoria (www.nre.vic.gov.au/catchment/salinity/index.htm) Salinity An easy to read site. Good iinformation on salinity indicator plants, which
has a very good list of species and good information on each. NRE Vic: Land & Water: Salinity Management in Victoria: Future Directions. A
multi-part web presentation of the new NRE salinity strategy. The site also asks for input in response to the material presented, for development of Salinity Management Plans at the catchment level.
National Land & Water Resources Audit (NLWRA) (www.nlwra.gov.au) Now a very valuable site, with good level of technical and other information for
Australia and each State in the Audit. NSW Department of Land and Water Conservation: Salinity in NSW
(www.dlwc.nsw.gov.au/care/salinity/) A good site with plenty of pages on salinity. New South Wales Environment Protection Authority: State of the Environment 2000
(www.epa.nsw.gov.au/soe2000/) Chapter 4 on Land is the most relevant, but Chapter 5 on Water and 6 on
Biodiversity are also interesting. Office of the Min. for Environment and Heritage, Government of Western Australia
(www. ministers.wa.gov.au/edwards/Features/salinity.htm) Release of the Report of the Salinity Taskforce: Salinity - A New Balance. The report
of the Salinity Taskforce established to review salinity management in Western Australia.
Primary Industries and Resources South Australia (www.pir.sa.gov.au/)Well designed site with good navigation. Farm forestry and revegetation, land, water and other ‘environmental’ issues are in the ‘Sustainable Resources’ section. Quite good coverage of material, with moderate depth.
Page 4
Further information Salinity in the Classroom
Page 5
Further information Salinity in the Classroom
Queensland Forestry Research Institute: Tackling salinity with trees (www.forests.qld.gov.au/)
A new book produced by the Queensland Forestry Research Institute (QFRI) will assist landholders deal with the problem of salinity. Tree planting plays an important role in addressing soil salinity which is often caused by tree clearing for agriculture. Selecting trees for the rehabilitation of saline sites in south-east Queensland is the culmination of the institute’s nine years of research into tree species suitable for growth on saline sites. Rather than publish the results in a scientific journal, QFRI chose to present the findings in a book written in plain English so those dealing with the problem of salinity could use the information.
Salinity Classification, Mapping and Management in Alberta, Canada (www.agric.gov.ab.ca/sustain/soil/salinity)
Definitely not Australia, but “Dryland salinity is a major soil degradation problem on the Canadian Prairies (Acton, 1995). In Alberta, approximately 1.6 million acres (or 647 485 ha) of dryland are affected by secondary salinity with an average crop yield reduction of 25 per cent (Alberta Agriculture, 1991). The problem is caused by groundwater redistributing salts and accumulating these at the surface.” The site has some very familiar information and explanations, worth a visit.
Salinity Council (www.salinity.org.au/) Western Australia: a new site providing a good entry point to a wide range
of salinity resources in Western Australia and across Australia. Also provides a downloadable PDF of the State Salinity Strategy
Salt Control SA (www//saltcontrol/sa.com/index.html) A clearing house for salinity in South Australia. Potentially a very valuable site. Social Communication & Journalism (journalism.uts.edu.au/) Bitter Harvest. Dryland Salinity in Australia. Scientists have declared salinity to be
the most threatening environmental problem this country is facing. It is eating away at the land that produces the food on our tables, the rivers where we source our water, the roads that we travel, the homes where we live, the sewers that carry away our waste and the cemeteries where we are to be buried. What is being done to curb this menace? Jenny Goldie, Kate MacDonald and Fran Molloy put this question to scientists, bureaucrats, farmers, and politicians. Bitter Harvest outlines their response. Kate MacDonald’s Salinity in Australia Website displays original research from a UTS Investigative Journalism team into the Salinity crisis in Regional Australia.
Sustainability and Economics in Agriculture (www.general.uwa.edu.au/u/dpannell/sustecon.htm) University of Western Australia. Access to important research and discussion
papers, and all articles in the SEA News. Research and policy oriented, and highly recommended if that is your interest.
Dryland Salinity: Inevitable, Inequitable, Intractable? (www.general.uwa.edu.au u/aares/dpap0101.htm) David J Pannell, Agricultural Resource Economics, UWA. This paper reviews a broad range of information relevant to the salinity problem
in order to critically evaluate existing and prospective policy responses. It brings together issues of hydrogeology, farmer perceptions and preferences, farm-level economics of salinity management practices, external benefits and costs from salinity management, and politics.

Page 6
Further information Salinity in the Classroom
Page 7
Further information Salinity in the Classroom
Water and Rivers Commission, Western Australia: Salinity (www.warc.wa.gov.au/protect/Salinity/ index.htm) Content of this section is drawn from the Salinity Action Plan 1996.
Ribbons of Blue is an environmental water quality monitoring network which through environmental education, raises awareness, develops skills and understandings about water quality in a whole of catchment context leading to on-ground action for a better environment.
In Western Australia, the effects of salinity erosion and excess nutrients threaten the health of our surface water and groundwater. By sampling and monitoring local waterbodies, school and community groups become aware of and involved in environmental management issues and responisibilities.
Ribbons of Blue Regional Coordinators support school and community involvement in the program. They provide learning opportunities through a range of curriculum framework linked programs, public forums and liason with waterways management and landcare professionals.
In keeping with the Ribbons of Blue emphasis on local water quality, each of the regions has a focus on issues that are specific to its catchments.
Ribbons of Blue is part of the national Waterwatch network. Water terms defined: An on-line database of definitions Water Fact Sheets: “ provide information on topics of educational and general
interest. They are resource materials for teachers and secondary students, and for other with a particular interest in issues such as pollution.”
Water Notes: “to provide basic information in an easy to read format targeted at community and local agencies regarding river and wetland ecology, restoration and management.”
Waterwatch Victoria (www.vic.waterwatch.org.au/)A good looking site, easy to navigate. Contact and links sections are good.
Page 6
Further information Salinity in the Classroom
Page 7
Further information Salinity in the Classroom
Useful references
Teaching aids
NSW Agriculture and Salt Action. A Taste of Salt. Rivers, Catchments & Salinity. NSW, 1999.
National Soil Conservation Program. Our Land. LandCare Activities for Upper Primary. Victoria, 1989.
South Australian Department of Environment and Natural Resources. Watercare. A Curriculum Resource for Schools. Years 6 – 10 SA, 1996.
Water & Rivers Commission. Swan River Education Kit. Curriculum support activities and resources for schools. WA, 1999.
National Soil Conservation Program. Soil Magic. LandCare Activities for Middle Primary. Victoria, 1989.
Department of Natural Resources and Environment. Catchment Education Resource Book. An Educational Resource for Primary and Secondary Schools. Victoria, 1986.
Waterwatch Victoria. Waterwatch Education Kit. Victoria, 1997.
Department of Environment and Natural Resources. Waterwatch Manual. Catchment care and water quality monitoring in South Australia. South Australia, 1998.

Page 8
Further information Salinity in the Classroom
Page 9
Glossary Salinity in the Classroom
CALM Bush RangersCommunity Education OfficerLocked Bag 104Bentley Delivery Centre WA 6983Ph: (08) 9334 0333Email: CALM Bush Rangers
EnviroKidsGreening Australia, Western AustraliaEducation Manager10-12 The TerraceFremantle WA 6160Ph: (08) 9335 8933Email: [email protected]
Exploring the Hills Forest ProgramCALMThe Hills ForestMundaring WeirMundaring WA 6073Ph: (08) 9295 6144Email: [email protected]
Grow Us a HomeGreening Australia, Western AustraliaEducation Manager10-12 The TerraceFremantle WA 6160Ph: (08) 9335 8933Email: [email protected]
Western Australian educational support programsRibbons of Blue/Waterwatch WAWater & Rivers CommissionLevel 23 Plain StreetEast Perth WA 6004Ph: (08) 9278 [email protected]
South Coast Education ProjectDepartment of AgricultureAlbany WA 6330Ph: (08) 9892 8444
Tammin Alcoa Landcare Education CentrePO Box 53Tammin WA 6409Northam District Education OfficeNortham WAPh: (08) 9637 1194
Perth ZooPO Box 489South Perth WA 6951Ph: (08) 9367 7988Email: [email protected]

Page 8
Further information Salinity in the Classroom
Page 9
Glossary Salinity in the Classroom
Actual salinity (sampling) The amount of salt present in the sample determined by chemical analysis.
Adaptation An approach to tackling salinity whereby the options implemented are able to use or survive with the salt.
Agricultural Area (or South-West Agricultural Area)
The South West region of Western Australia from Northampton in the north to east of Esperance; characterised by mainly mixed broadacre farming with some horticulture and viticulture in the areas south and east of Perth.
Agricultural practices Practices or ways of doing things associated with using the land for agricultural purposes.
Agroforestry Managing land for the cultivation of trees in addition to other agricultural practices.
Airborne geophysics Involves low flying aircraft collecting magnetic, radiometric or electromagnetic data.
Alley farming Strips of crops or pastures in between belts of fodder shrubs with or without trees.
Alluvium A fine-grained fertile soil consisting of mud, silt and sand deposited by flowing water on flood plains in rivers bed, and in estuaries.
Annual (plant) A plant that completes its life cycle within 12 months. Examples are wheat, sub. clover, and barley grass.
Aquaculture The farming or culture of aquatic animals and plants in an artificial environment (in captivity).
Glossary of Salinity TermsAquifer
A layer of soil or rock that can hold and transmit water (groundwater). Aquifers are usually described by whether they consist of sedimentary deposits (sand and gravel) or fractured rock. An aquifer can be unconfined or confined:
• a confined aquifer is when there is a layer of impermeable or restricting material above the aquifer. This causes the groundwater in the aquifer to be under pressure.
• an unconfined aquifer is one that doesn’t have a restricting layer.
Bedrock A general term for the solid rock that lies underneath the soil and other unconsolidated material (see ‘Regolith’). When exposed at the surface it is referred to as a rock outcrop.
Biodiversity The variety of life forms, the different plants, animals and micro-organisms, the genes they contain and the ecosystems they form.
Biosphere Regions of the earth’s crust and atmosphere in which living matter is found.
Blue gum (Tasmanian blue gum)Eucalyptus globulus is grown for pulpwood in deep soils above 700 mm rainfall.
Bore A hole drilled through soil, regolith or rock, typically for the purpose of observing or extracting groundwater.
Brackish A term referring to water of moderate salinity (technically, having a salinity of between 1,500 and 5,000 mg/L of dissolved salts).
Page 10
Glossary Salinity in the Classroom
Page 11
Further information Salinity in the Classroom
Capillary movement (or capillary action or capillary rise)
The movement of water through fine pore spaces between soil particles and as films on soil particles as a result of surface tension. This effect leads to water moving upward from the groundwater to form moist, unsaturated soil above the watertable.
Catchment An area of land bounded by hills or ridges which direct the flow of water into a waterway.
Catchment water management plan A plan for a natural catchment that describes surface and groundwater movement in a catchment and the best way to use and manage it to avoid water related degradation issues.
Common salt Sodium chloride or NaCl.
Community Landcare Coordinators (CLCs)
Professionals employed by agencies, shires or community groups to assist the community in landcare work.
Community Support Officers (CSOs) The term represents a range of community-based natural resource management support people including Community Landcare Coordinators, Bushcare Support Officers, Rivercare Officers, Land for Wildlife Officers, Indigeneous Land Management Facilitators.
Condensation The conversion of a gas into a liquid.
Containment (of salinity) An approach to tackling salinity whereby the options implemented do not allow the saline areas to spread, but do not reduce the amount of area affected.
Contour line All points at the same elevation in the landscape.
Crop Any plant that is cultivated and has harvested components. An example of an annual crop is wheat: and an example of a perennial crop is apples.
Cultivation The preparation and turning of topsoil.
Cyclic salt Salt deposited over tens of thousands of years by rainfall.
Degradation Damage, disintegration or destruction. (see Land Degradation).
Desalination The process of removing salt from saline water to make it less salty and to enable it to be used for drinking or other purposes.
Discharge The water that moves from the groundwater to the ground surface or above. This includes water that seeps onto the ground surface, evaporation from unsaturated soil, and water extracted from groundwater by plants (see Evapotranspiration) or Engineering works (see Groundwater pumping, Drain etc).
Discharge enhancement Water is drained from the groundwater storage.
Divertible water resources The average annual volume of water which, using current practice, could be removed from developed or potential surface water or groundwater sources on a sustained basis at rates capable of serving urban, irrigation, industrial or extensive stock uses.
Drain A channel or tunnel constructed to intercept and remove water. Referred to as an open drain if open to the atmosphere or a closed drain if constructed from pipe or tyres and covered with soil. Deep drains refer to drains usually constructed to 1 to 3 m depth to intercept the watertable.
Page 10
Glossary Salinity in the Classroom
Page 11
Further information Salinity in the Classroom
Drainage The removal of surface water or groundwater from a site or soil profile. The term ‘drainage’ is also used to describe systems that are artificially constructed to improve site or soil drainage.
Drawdown The lowering of a watertable resulting from the removal of water from an aquifer or reduction in hydraulic pressure.
Drought proofing Measures taken to ensure water is available in some quantities to enable the farm to survive through dry periods.
Dryland salinity The salinisation of land that is not irrigated. The term does not imply that the land is dry, as these areas are often waterlogged during winter or affected by rising watertables. Dryland Salinity occurs where native vegetation has been replaced with a land use that does not use all the rainfall, which results in “leakage” to the groundwater and causes the watertable to rise and bring the soluble salts upwards towards the ground surface.
Ecologically sustainable development (ESD)
Defined as using, conserving and enhancing the community’s resources so that ecological processes, on which life depends, are maintained, and the total quality of life, now and in the future, can be increased (from the National Strategy on ESD 1992).
EcosystemA term used to describe a specific environment, eg. lake, to include all the biological, chemical and physical resources and the interrelationships and dependencies that occur between those resources.
Electrical conductivity (EC) A measure of the ability of a medium to conduct electricity. EC is used often as a surrogate measure of salinity levels in water or soil as the conductivity of a solution generally increases in proportion with its salt content.
Electromagnetic Induction Meter A portable instrument that provides reliable estimates of soil salinity without intensive soil sampling and analysis (e.g. EM38 or EM31).
Eucalypts Refers to species of the genus Eucalyptus, which are woody flowering plants dominating much of the southern Australian bush. They are distinguished by aromatic leaves, and a cap on the bud that is dropped in one piece when flowering occurs. Examples in Western Australia are jarrah, wandoo, and salmon gum.
Evaporation The conversion of a liquid into a gas. For example the drying of water from a moist soil surface, or drying of water from a dam.
Evapotranspiration The process of water vapour transfer into the atmosphere from a vegetated land surface. It includes water evaporated from the soil surface and water transpired by plants.
Fallow Extended period between cultivation and sowing of seed.
Farm enterprise The different discrete business components that make up the total farm business e.g. sheep, aquaculture, olives etc.
Farm forestry See agroforestry.
Fauna All the animal life of a given place or time.

Page 12
Glossary Salinity in the Classroom
Page 13
Glossary Salinity in the Classroom
Flooding The situation where large volumes of water flow across the ground surface. It usually occurs along drainage lines and on valley floors. Differs from inundation where water on surface is stationary.
Flora All the plant life of a given place or time.
Flushing Cleansing or dissolving and removing by the flow of water.
Fodder shrubs Shrubs that can be eaten by animals for food.
Groundwater Subsurface water contained in the saturated zone of soil or geological strata and capable of moving in response to gravity and hydraulic pressure gradients.
Groundwater pumpingExtraction of water from saturated soil (groundwater) using an electric, wind powered or compressed air pump and bore hole.
Horticulture The growing of vegetables or fruits as a farm enterprise.
Humidity The measure of water vapour in the atmosphere.
Hydrogeology The study of the relationship between the movement of water and the occurrence of geological strata.
Hydrology The study of water and water movement in relation to the land. Deals with the properties, laws, geographical distribution and movement of water on the land or under the earth’s surface.
Hypersaline Very saline, usually greater than the salt concentration of sea water.
Inferred salinity (sampling) The salt content based on measures of electrical conductivity (EC). See Electrical conductivity.
Infiltration The downward movement of water into the soil profile.
Infrastructure Services constructed to support human activities. For example water supplies, rail system, road network, buildings etc.
Interception The process where rain hits vegetation and evaporates back into the atmosphere.
Inundation Occurs when surface water moves onto an area and sits on the ground surface for extended periods.
Ions An electrically charged atom or group of atoms formed by the loss or gain of one or more electrons.
Irrigated agriculture Agriculture where the crop is watered regularly by some man made system rather than relying on rainfall only.
Irrigation salinity Salinity that occurs where poorly drained soils are subject to flood irrigation, possibly high salinity reservoir supplies and winter waterlogging (in the South West) thus allowing naturally occurring soluble salts to rise and affect plant growth.
Land degradation A decline in the overall quality of soil, water or vegetation condition commonly caused by human activities. (see Degradation).
Land management practices Ways of managing and using the land.
Land Monitor Project A project that will produce information products for land management for the South-West from satellite imagery taken over a number of years.
Landcare The community movement where land managers perform works and adopt farming and environmental practices leading to sustainability in farming and the environment.
Page 12
Glossary Salinity in the Classroom
Page 13
Glossary Salinity in the Classroom
Landscape A collection of related, natural landforms; usually the land surface which the eye can comprehend in a single view.
Leach To wash material from the soil, both in solution and suspension. The process by which nutrients, chemicals or contaminants are dissolved and carried away by water, or are moved into a lower layer of soil.
Legume Usually refers to a long dry pod with one or more seeds in it. Generally from a large family of flowering plants that have pods as fruits and nitrogen fixing nodules on the roots. Examples are peas and beans.
Natural diversity recovery catchments Catchments where high priority natural diversity assets are at risk and warrant significant, ongoing investment in their recovery and protection.
Natural Resource Management (NRM)Defined as the ecologically sustainable management of the land, water and biodiversity resources of the State for the benefit of existing and future generations, and for the maintenance of the life support capability of the biosphere. It does not include mineral or marine resources in the context in which it is commonly used in WA.
No till(age) farming Planting crops with minimal soil disturbance.
Observation well/bore A bore that measures unrestricted groundwater levels in an unconfined aquifer.
Off-site Removed from the property or location where the water originated.
Pasture A mix of plant species that provide livestock with grazing food. Can be of herbaceous (non-woody) perennial and/or annual plants.
Perched water or groundwater Groundwater in an unconfined aquifer (in a saturated condition) sitting above (perched on top of ) an impermeable rock or soil structure near the land surface and separated from deeper groundwater by unsaturated materials. Perched groundwater is typically shallow, thin and ephemeral (i.e. temporary or seasonal).
Perennial (plant) A plant whose life cycle continues for more than one season. Includes trees and shrubs and many species of grasses.
Permeable formation A soil or rock structure in the landscape that allows water to move through it easily.
Piezometer A bore that measures groundwater under pressure (in a confined aquifer).
Plantation A collection of growing trees planted by people and usually grown for some commercial gain.
Pore A space in a soil material not filled by solid particles. Pores are holes filled with air or water.
Precipitation The deposition of water in a solid (hail, snow) or liquid (rain) form on the earth’s surface from atmospheric sources.
Primary (or natural) salinity The situation where soils are saline as a result of natural processes over thousand of years. This is not the result of man’s influence. See ‘Secondary salinity’.
Rangelands An area in Western Australia where grazing with cattle and sheep has traditionally been the dominant agricultural activity. It lies east and north of the South-West Agricultural Area. Rainfall is termed ‘low’ and is below 250 mm per year.

Page 14
Glossary Salinity in the Classroom
Page 15
Glossary Salinity in the Classroom
Rapid Catchment Appraisal A project designed to give all communities in the agricultural areas access to the best available information on salinity management by 2005.
Recharge Water that infiltrates into the soil and increases the groundwater volume.
Recharge reduction Water is caught or used before it reaches the watertable.
Recovery (from salinity)An approach to tackling salinity whereby the options implemented reduce the area that is affected by salinity.
Regolith The material that sits between the land surface and bedrock and which includes soil and unconsolidated rock material.
Relief wellA bore drilled to bedrock that allows groundwater under pressure to discharge to the surface and be drained away.
Remote sensing Monitoring the landscape through techniques that are distant from that landscape, such using satellite technology.
Respire To breathe air.
Revegetation The process of returning perennial plants to land that was cleared. Land can be revegetated with native or introduced species.
River salinity River salinity involves the increase of ‘natural’ salinity levels within rivers and wetlands as a result of inflows of highly saline water. These inflows may occur as a result of irrigation tailwater discharge, surface saline seepage to creeks and by changes to groundwater levels resulting in direct discharge to waterbodies. River
salinity impacts upon the vista of rivers and wetlands and increases costs to the community, particularly agricultural, domestic and industrial users.
Root zoneDepth of the upper soil in which the majority of rooting activity occurs. Commonly down to 1.2 m.
Run-off Water that flows on the ground surface to lower points. This water results from the rate of precipitation being greater than the rate of infiltration.
Rural Towns Program A community-managed program under the State Salinity Strategy and Department of Agriculture to address salinity in rural towns.
Salinity The problem that occurs when the concentration of soluble salts in the groundwater near the soil surface is sufficient to affect plant growth.
Salinity Action Plan A document released by the Government in November 1996 with a 30 year vision to address dryland salinity in WA.
Salt scald A bare patch of earth where the surface soil has been removed by erosion or damaged by salinity, making it hard to revegetate. Salt may form crystals on the surface.
Salt-tolerant A term used to describe plants and animals that are capable of living in saline soil or water.
Satellite imagery Images of parts of the earth taken from satellites and used to make useful maps and information products.
Saturated The condition whereby effectively all of the pores and voids in a soil or aquifer are filled with water which has a pressure equal to, or greater than, atmospheric pressure.
Page 14
Glossary Salinity in the Classroom
Page 15
Glossary Salinity in the Classroom
Secondary salinity The situation where salinity levels have increased as a result of human activities changing the water balance. Secondary salinity often occurs as a result of clearing native vegetation and replacing it with shallow-rooted crops and pastures that use less water.
Seep Groundwater discharge downslope from a recharge area. Seeps can be continuous or intermittent. A seep can occur in the upper, mid or lower slopes of the landscape.
Slumping The collapse of the earth side walls of a drain when referring to excavated drains.
Sodium chlorideCommon salt.
Soil A natural medium for the growth of plants. Soil consists of a mix of mineral and organic materials, and is not consolidated.
Soil profile A term used to give the aspect of a side view or cross section of the soil between ground level and bedrock.
Soil water/moisture Term applied to subsurface water in soil or regolith in an unsaturated condition (that is, above the watertable).
State Salinity Council A representative community based group established in early 1997 by Government to advise it, and to coordinate and integrate activity in addressing salinity.
State Salinity Strategy A document printed in March 2000 to update the Salinity Action Plan 1996 and to involve the community in producing a blueprint to address salinity.
Subsurface drainage Taking excess water away from the ground through flexible slotted plastic pipes laid under the ground in rows across the paddock.
Subsoil The layers of soil below the topsoil.
Syphon A pipe that allows water to be withdrawn from an aquifer through the process of syphoning.
Topsoil The upper part of the soil profile that is immediately below the soil surface. Usually higher in organic matter and lower in clay than the subsoil. This is where plants have most of their roots.
Toxicity Ability to cause poisoning.
Transpiration The process by which water is absorbed from the soil by plant roots, is transported through the plant and is removed from the leaf surfaces by evaporation.
Unsaturated Opposite to saturated (see Saturated).
Warm season cropping Sometimes known as summer cropping or opportunistic cropping. The planting of deep-rooted crops such as sorghum, millet, sunflower, maize over the drier season to use residual moisture in the soil or rain from irregular summer rainfall events.
Water balance The relationship between input, storage and output within a hydrological system. If the amount of water entering the system is the same as the amount leaving, then storage remains constant and the system can be considered to be in equilibrium. Where input exceeds output, the water balance becomes altered and the amount of water stored in the system increases. Conversely, the balance can be altered as storage decreases in response to output exceeding input.
Water cycle The term used to describe the cycling of water between the ocean, atmosphere and land.
Page 16
Glossary Salinity in the Classroom
Water resource recovery catchment Catchments classified as important for future water supply purposes and where extensive rehabilitation work may be required and will be performed.
Water vapour Water in the gaseous phase.
Water course See ‘Waterway’.
Waterlogging The condition whereby soil becomes saturated with water to the extent that most or all of the soil air is replaced.
Watertable The upper surface of the groundwater and below which the soil or rock pores are saturated.
Waterway Term covering a stream, creek, river, estuary, coastal lagoon, inlet or harbour.
Weathering The natural process where rocks and other materials break down through the natural forces of the elements or plant action.
Wheatbelt An area in Western Australia where cropping with wheat (and other annual crops in rotations with wheat) has traditionally been the dominant agricultural activity. It lies to the east of the ‘woolbelt’, and to the west of the ‘rangelands’ and arid zone. Rainfall is termed ‘medium to low’, and is about 250 to 450 mm per year.
Woolbelt An area in Western Australia where grazing with sheep has traditionally been the dominant agricultural activity. It lies between the wheatbelt in the east, and the forest areas of the west. Rainfall is termed ‘medium’, and is about 450 to 800 mm per year.