Embed Size (px)
Citation preview
Salinity Tolerances for the Major Biotic Components
within the Anclote River and Anchorage and Nearby Coastal Waters
October 2003
Prepared for: Tampa Bay Water
2535 Landmark Drive, Suite 211 Clearwater, Florida 33761
Prepared by: Janicki Environmental, Inc.
1155 Eden Isle Dr. N.E. St. Petersburg, Florida 33704
For Information Regarding this Document Please Contact Tampa Bay Water - 2535 Landmark Drive - Clearwater, Florida

Anclote Salinity Tolerances October 2003
i
FOREWORD
This report was completed under a subcontract to PB Water and funded by Tampa Bay Water.

Anclote Salinity Tolerances October 2003
ii
ACKNOWLEDGEMENTS The comments and direction of Mike Coates, Tampa Bay Water, and Donna Hoke, PB Water, were vital to the completion of this effort. The authors would like to acknowledge the following persons who contributed to this work: Anthony J. Janicki, Raymond Pribble, and Heidi L. Crevison, Janicki Environmental, Inc.
Anclote Salinity Tolerances October 2003
iii
EXECUTIVE SUMMARY Seawater desalination plays a major role in Tampa Bay Water’s Master Water Plan. At this time, two seawater desalination plants are envisioned. One is currently in operation producing up to 25 MGD near Big Bend on Tampa Bay. A second plant is conceptualized near the mouth of the Anclote River in Pasco County, with a 9 to 25 MGD capacity, and is currently in the design phase. The Tampa Bay Water desalination plant at Big Bend on Tampa Bay utilizes a reverse osmosis process to remove salt from seawater, yielding drinking water. That same process is under consideration for the facilities Tampa Bay Water has under design near the Anclote River. Estuaries are semi-enclosed coastal bodies of water that receive fresh water runoff from the land and salt water from the sea, producing a mixing zone with highly variable salinity. Salinity has traditionally been regarded as a central parameter for estuarine analysis, especially as an indicator of hydrography and habitat potential. There are several reasons to study estuarine salinity: a) salinity is a direct measure of the relative influence of marine and freshwater sources; b) salinity is an outstanding hydrographic tracer, as it is a conservative property and illustrates the movement and exchange of water masses; and c) salinity dominates the density structure of an estuary and thus exerts significant controls on currents and turbulence. The desalination concentrate that is generated by the reverse osmosis (RO) process is a hypersaline solution, i.e., it has a higher salinity than the source water. An understanding of salinity characteristics of the receiving water body and of the RO concentrate is a critical component of the assessment of the potential effects of the discharge of this concentrate on the receiving water body. The potential effects of concentrate discharge also depend on the ability of the plants and animals that normally inhabit the receiving water body to respond to any salinity change resulting from the discharge. This report describes the spatial and temporal variation of salinity within estuarine and offshore environments, and provides a review of information regarding the tolerance of the vegetation, invertebrates, fish, and marine mammals commonly found in the Anclote Anchorage and offshore areas to withstand changes in salinity. Organisms most likely found in the offshore areas require relatively higher, more constant salinity waters. Organisms found in the nearshore area typically tolerate a wider range of salinity. In particular, turtle grass, the predominant seagrass found in the Anclote Anchorage, is typically found in waters that range in salinity from 20-40 ppt, and is typically limited by lower salinities.
Anclote Salinity Tolerances October 2003
iv
TABLE OF CONTENTS Foreword.............................................................................................................................. .. i Acknowledgments ................................................................................................................ . ii Executive Summary .............................................................................................................. iii Table of Contents ................................................................................................................. iv List of Tables ........................................................................................................................ v List of Figures ....................................................................................................................... . vi Glossaey............................................................................................................................... . vii 1. Introduction..................................................................................................................... 1-1 1.1 Background ............................................................................................................. 1-2 1.2 Objectives ............................................................................................................... 1-2 2. Salinity ............................................................................................................................ 2-1 2.1 What is Salinity? ...................................................................................................... 2-1 2.2 What Factors Affect Salinity in Coastal Waters? ....................................................... 2-1 2.3 How Does Salinity Vary Spatially in Coastal Waters?............................................... 2-2 2.4 How Does Salinity Vary Temporally in Coastal Waters? .......................................... 2-5 2.5 Classification of Environments According to Their Salinity....................................... 2-6 2.6 Influence of Desalination Concentrate Discharge on Salinity................................... 2-6 3. Influence of Salinity on Fish, Invertebrates, Vegetation, and Marine Mammals.............................................................................................................................. 3-1 3.1 How Do Organisms Respond to Salinity and Changes in Salinity?........................... 3-1 3.2 Classification of Organisms According to Their Ability to Tolerate Salinity and Salinity Change................................................................. 3-6 3.3 Salinity Tolerance Studies........................................................................................ 3-6 4. Salinity in the Anclote Anchorage and Nearby Coastal Waters ........................................ 4-1 5. Conclusions..................................................................................................................... 5-1 6. References....................................................................................................................... 6-1 Appendix A Fish: Salinity Tolerance and Salinity Range Information .................................. A-1 Appendix B Invertebrates: Tolerance and Salinity Range Information ................................. B-1 Appendix C Vegetation: Tolerance and Salinity Range Information .................................... C-1 Appendix D Mammals: Tolerance and Salinity Range Information ..................................... D-1

Anclote Salinity Tolerances October 2003
v
LIST OF TABLES Table 3.1. Summary of survival results of juvenile lesser blue crabs.
Anclote Salinity Tolerances October 2003
vi
LIST OF FIGURES Figure 2.1. Schematic drawings of (A) a salt wedge or highly-stratified estuary, (B) a well-mixed estuary, and (C) a partially-mixed estuary. Figure 2.2. (A) The process of osmosis; (B) the process of reverse osmosis. Figure 4.1. Map of the Anclote Anchorage area showing the location of the Progress Energy power station.
Anclote Salinity Tolerances October 2003
vii
GLOSSARY byssus=a tuft of strong filaments used by some mollusks to attach to a surface desalination=removal of dissolved salts, especially from seawater to produce drinking water
diffusion=movement of molecules along a gradient, from high concentrations to low concentrations euryhaline=term used to describe aquatic organisms that can tolerate wide ranges in salinity freshet= a freshwater stream that empties into a body of saltwater geomorphology=the study of landforms, including classification, origin and relationship to underlying structures genera (plural for genus)= the hierarchical taxonomic classification above species and below family; a group of closely related species hyperosmotic=describes a cell or membrane which has a higher concentration of dissolved solids than the surrounding medium monocot=a plant with one seed leaf (as opposed to a dicot which has two seed leaves) osmoregulation=process of controlling the concentration of dissolved substances (particulary salt) within the cells and body fluids of an organism osmosis=movement of water (or fluid) through a semi-permiable membrane, across a gradient from high to low solute concentrations, until solute concentrations are equal on both sides of the membrane renal=of or relating to the kidneys reverse osmosis (RO)=forcing a solvent from a region of high solute concentration, through a membrane, to a region of low solute concentration by applying pressure
solute=the dissolved substance in solution solvent= the fluid in which a substance (solute) is dissolved in somatic=relating to the body, or body wall, as opposed to internal organs and reproductive structures

Anclote Salinity Tolerances October 2003
viii
stenohaline= term used to describe aquatic organisms that tolerate only narrow ranges in salinity taxa (plural for taxon)=a hierarchical category representing a group of genetically similar organisms that are classified together as species, genus, family, etc.
Anclote Salinity Tolerances October 2003
1-1
1. INTRODUCTION Seawater desalination plays a major role in Tampa Bay Water’s Master Water Plan, which includes two desalination plants that will each contribute up to 25 million gallons a day (MGD) to the region’s drinking water supply. Overall, the Master Water Plan calls for the creation of 91 MGD of new water sources by 2008 and additional supplies will be needed to meet growing demand. Alternative water sources, such as desalination, are an important part of the plan. Alternative sources in our area are those other than groundwater and are needed to help reduce stress on long-producing regional well fields, as well as meet the water supply needs of a growing population. Seawater desalination helps address the need for alternative water sources because it is:
• an alternative to groundwater, • a drought-proof supply capable of yielding large volumes of high-quality drinking
water, and • an environmentally sound and sustainable way to produce drinking water.
Tampa Bay Water’s first seawater desalination project, Tampa Bay Seawater Desalination, is a 25-MGD, reverse osmosis seawater desalination plant on Tampa Bay in southern Hillsborough County. The Tampa Bay Seawater Desalination plant began operation in March 2003. The second seawater desalination plant, Gulf Coast Desalination, is proposed to be developed in Pasco County near the border of northern Pinellas County near the mouth of the Anclote River and in the Anclote Anchorage area of southwestern Florida. Gulf Coast Desalination will likely use reverse osmosis desalination technology. Tampa Bay Water is currently considering several alternatives for siting and design of a Gulf Coast Desalination facility. These alternatives include consideration of concentrate discharge at a nearshore location and an offshore location in the Gulf of Mexico. The discharge of the concentrate may cause changes in salinity in the immediate vicinity of the discharge. The degree and extent of the change depends upon the location of the discharge, the amount, nature, and method of discharge. A hydrodynamic model is being used to predict the degree and extent of the change in salinity (Janicki Environmental, 2003). The results of this hydrodynamic model will be presented in a separate report. The purpose of this report is to review information regarding the ability of the vegetation, invertebrates, fish, and marine mammals commonly found in the Anclote Anchorage area to cope with changes in salinity. This information will be used to evaluate the expected effects of any salinity changes, considering the ability of the major biotic components of the Anclote area to tolerate these changes.
Anclote Salinity Tolerances October 2003
1-2
1.1 Background Estuaries are semi-enclosed coastal bodies of water that receive fresh water runoff from the land and salt water from the sea, producing a mixing zone with highly variable salinity. Salinity has traditionally been regarded as a central parameter for estuarine analysis, especially as an indicator of hydrography and habitat potential. There are several reasons to study estuarine salinity:
• salinity is a direct measure of the relative influence of marine and freshwater sources,
• salinity is an outstanding hydrographic tracer, as it is a conservative property and illustrates the movement and exchange of water masses, and
• salinity dominates the density structure of an estuary and thus exerts significant controls on currents and turbulence.
Although stressful to many organisms because of salinity variations, estuaries are also highly productive areas that can support large populations of fish and wildlife, and contribute substantially to the economy of coastal areas. As spawning, nursery, and feeding grounds, estuaries provide important habitats for a number of economically important fish and shellfish species (Barnes and Hughes, 1993). Estuarine-dependent species constitute more than 95% of the commercial fishery harvests from the Gulf of Mexico with many important recreational fishery species dependent on estuaries during some part of their life cycle. Desalination concentrate generated by the RO process is a hypersaline solution, i.e., has a higher salinity than the water to which the process is applied. An understanding of salinity characteristics of the receiving water body and of the RO concentrate is a critical component of the assessment of the potential effects of the discharge of this concentrate on the receiving water body. The potential effects of concentrate discharge also depend on the ability of the plants and animals that normally inhabit the receiving water body to respond to any salinity change resulting from the discharge. 1.2 Objectives The specific objectives of this report were:
• to review salinity as an environmental variable; where it comes from, how it varies spatially and temporally, and how it affects the biota and their distribution in the environment, and
• to review the research that has examined the salinity tolerances and preferences for the biota of the study area.
Anclote Salinity Tolerances October 2003
2-1
2. SALINITY The answers to the following questions will lead to an understanding of the salinity characteristics of an estuary:
• What is salinity? • What factors affect salinity in coastal waters? • How does salinity vary spatially in coastal waters? • How does salinity vary temporally in coastal waters?
Answers to these questions and an examination of the potential influence of desalination concentrate discharge on the salinity of the receiving water body comprise the remainder of this section of the report. 2.1 What Is Salinity? Seawater consists of a dilute solution of a mixture of dissolved salts. The major constituents of seawater that comprise more than 99% of the dissolved salts (Thurman, 1993) include:
• Chloride – 55.04% • Sodium – 30.61%, • Sulfate – 7.68%, • Magnesium – 3.59%, • Calcium – 1.16%, and • Potassium – 1.10%.
Erosion and transport of minerals from the land surfaces that drain to coastal waters is the ultimate source of these dissolved salts. Salinity is defined as the total amount of dissolved materials in seawater. Salinity can be determined by a number of methods, including a conductivity meter, a hydrometer, and a refractometer. The most common method employs the use of a conductivity meter, which measures the electrical conductance of a solution. Electrical conductance is directly related to the amount of dissolved salts present in the solution. Salinity estimates are then calculated from the conductivity measurements. 2.2 What Factors Affect Salinity In Coastal Waters? The salinity of coastal waters varies significantly along a gradient from freshwater to seawater. Salinity varies within a narrow range over much of the ocean, with the total salinity range of 75% of the ocean between 34.5 and 35 parts per thousand (ppt) (Knauss,
Anclote Salinity Tolerances October 2003
2-2
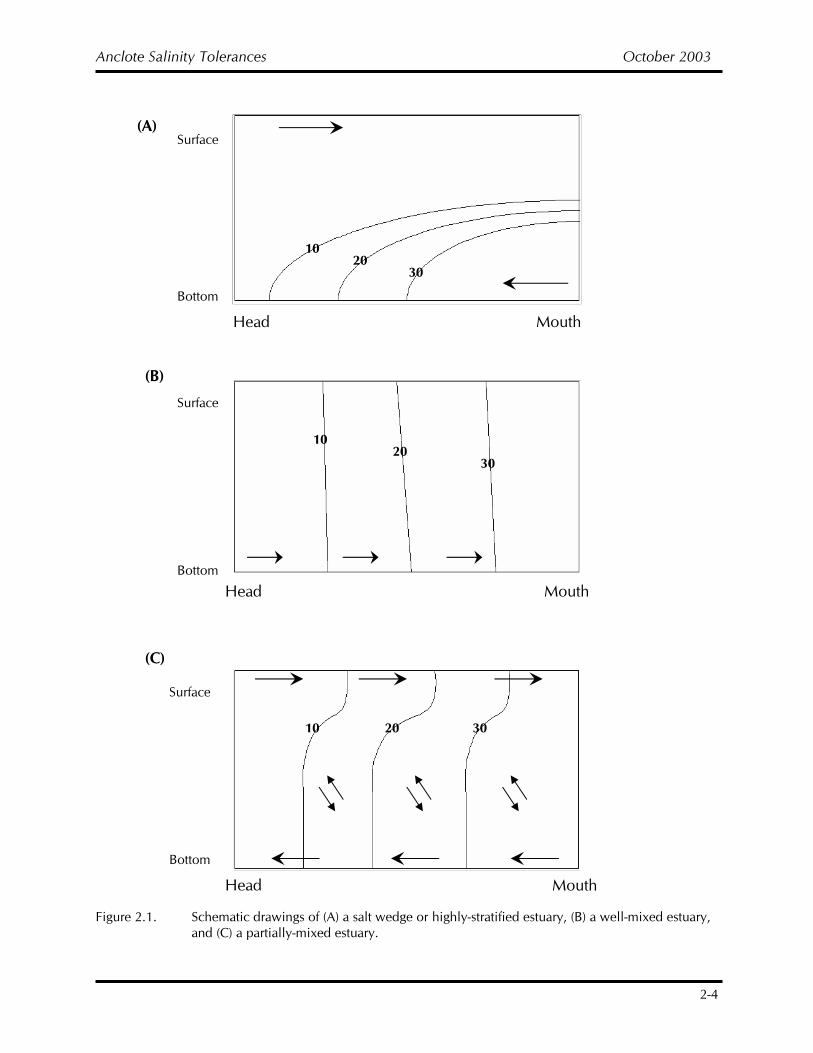
1997). In contrast, salinity in shallow coastal waters can vary significantly both spatially and temporally. There are several factors that affect the salinity of coastal waters. The amount of freshwater inflow is the prime determinant since the salinity of coastal waters is ultimately the result of the mixing of freshwater with seawater. As the supply of freshwater increases the salinity of coastal waters decreases. The density of seawater is greater than freshwater and varies with both salinity and temperature. The resultant salinity of coastal waters also depends upon the degree of mixing of freshwater and seawater. In general, freshwater runoff flowing into an estuary moves as an upper layer of relatively low-density water across the estuary towards the open ocean. Inflow from the ocean takes place below the upper layer and mixing occurs at the contact between these water masses (Thurman, 1993). However, the effects of the earth’s rotation cannot be ignored. In broad estuaries, there is a tendency for the outflow to hug the right side of the estuary (facing seaward) in the Northern Hemisphere. Consequently, there is often a horizontal salinity gradient, with fresh water on the right side of the estuary (Knauss, 1997). Freshwater runoff has the direct effect of reducing salinity of the surface layer in areas where mixing is not significant. Such waters are highly stratified with warm, fresh water overlying cool, salty water. Estuaries where such conditions are prevalent are referred to as salt wedge or highly stratified estuaries. Water movement in such estuaries is characterized by outgoing, less dense surface water flowing over denser incoming water along the bottom. Movement of water within an estuary depends upon the range of tidal action and the effects of winds. When the turbulence caused by the movement of water reaches a critical level, vertical mixing of waters tends to breakdown or even precludes stratified conditions, resulting in a well-mixed estuary. This estuarine type is characterized by relatively uniform salinity from surface to bottom, and a longitudinal salinity gradient with fresher waters located upstream and higher salinity waters on the seaward end of the gradient. In contrast to highly stratified estuaries, water movement in well-mixed estuaries is seaward from both surface and deeper waters. Well-mixed estuaries also tend to be shallower than salt wedge estuaries. Partially-mixed estuaries are transitional between well-mixed and highly-stratified salt wedge estuaries. In these estuaries mixing is driven by freshwater flow and tidal action. 2.3 How Does Salinity Vary Spatially In Coastal Waters? Spatial variation in salinity differs among the three estuary types described above. In salt wedge or highly-stratified estuaries (Figure 2.1), horizontal salinity gradients are minimized whereas vertical gradients are well developed. Horizontal salinity gradients are best developed at the nose of the wedge with salinity increasing from land toward the open sea. Moving seaward, horizontal variations lessen while vertical gradients intensify, with salinity increasing with depth. Well-mixed estuaries (Figure 2.1) show well developed horizontal gradients with salinity increasing from land towards the mouth of the estuary. However, vertical gradients are not well developed. Finally, partially-mixed estuaries (Figure 2.1)
Anclote Salinity Tolerances October 2003
2-3
have both moderately well developed horizontal and vertical gradients. Salinity increases horizontally from land toward the mouth of the estuary and vertically with depth. The shape and size of the landforms, and the underlying structural elements within an estuary, also affect mixing and spatial variations in salinity. There are three general classifications of estuaries based on geomorphology:
• lagoonal—i.e., Sarasota Bay and Apalachicola Bay, • tidal river—i.e., Anclote River and Suwannee River, and • drowned river valley—i.e., Tampa Bay and Pensacola Bay.
Lagoonal estuaries tend to have the greatest water movement at passes where currents and tidal influences are strongest, such as Sarasota Bay. In Sarasota Bay, tidal flows at major passages govern circulation patterns although winds cause significant short-term fluctuations in salinity. Tidal river estuaries are characterized by openness to the open sea and significant saltwater propagation upstream with the tides. The Anclote River has a tidally affected reach of about 13 miles. Vertical and longitudinal salinity distributions are well mixed to partially mixed, except for localized anomalies related to unusual bathymetry. The position of the saltwater-freshwater interface extends more than six miles upstream 90% of the time and is determined by stream flow and high tide (Fernandez, 1990). The Suwannee River Estuary consists of Suwannee Sound, the Suwannee River delta, and extensive tidal wetlands, with the tidally affected reach approximately 53 miles upstream. Salinity variability is most apparent within Suwannee Sound during high inflow periods, but this zone of variability moves toward the river delta during low-inflow conditions. Drowned river valleys differ from tidal rivers because rivers empty into an embayment instead of the open sea. Tampa Bay has its geologic origins in a drowned river valley system, which was flooded about 8,000 years ago. Salinity patterns are such that higher salinities are in areas that interact strongly with the Gulf of Mexico, and lower salinities in regions affected by fresh water inflow and regions farthest away from the Gulf. Surface salinities are generally 1-2 ppt less than those near the bottom. Minimum salinities occur in September with maximum salinities in June. Physical alterations of the bay, especially the shipping channel network, strongly influence bay salinities, with a tongue of high salinity extending up the center of the bay along the main channel.
Anclote Salinity Tolerances October 2003
2-4
Figure 2.1. Schematic drawings of (A) a salt wedge or highly-stratified estuary, (B) a well-mixed estuary, and (C) a partially-mixed estuary.
Head Mouth
30 20
10
Surface
Bottom
(A)
10 20
30
Head Mouth
(B)
Bottom
Surface
10 20 30
Mouth
Head
Bottom
Surface
(C)
Anclote Salinity Tolerances October 2003
2-5
Circulation in Escambia Bay is dominated by a counterclockwise flow during both high- and low-inflow periods, resulting from the movement of freshwater along the western shoreline and saline bottom water intrusion along the eastern shoreline. 2.4 How Does Salinity Vary Temporally In Coastal Waters? The temporal variation of salinity in coastal waters is multifaceted. As stated above, the mixing characteristics of estuaries are not constant over time. Mixing patterns cannot be applied to estuaries as a whole because mixing can change depending on the tides, river flow, winds, and major meteorological events. Dominant and secondary influences on salinity variability are time-scale dependent. For instance, daily to weekly freshwater inflow to Tampa Bay is a secondary influence on salinity variability, particularly near the mouths of principal freshwater sources. Freshets, streams of freshwater that empty into a body of saltwater, may temporarily produce weak to moderate vertical stratification. However, on a yearly or episodic timescale, freshwater inflow exerts dominant influence throughout the estuary. In fact, hurricanes and tropical storms produce significantly greater than normal rainfall potentially reducing salinities to nearly freshwater values. The salinity structure in estuaries is primarily determined by seasonal patterns of precipitation, evaporation, or a combination of the two. The highest salinities in the above mentioned estuaries generally occur in the spring, coinciding with periods of low precipitation and high evaporation. In contrast, lower salinities coincide with the summer wet season. In some cases, wet season salinities are affected by freshwater diversions from flood control canals. Because of the shallowness of coastal waters, tides, river flow, winds, and major meteorological events have significant impacts on the nature of both offshore and inshore environments. Tides can have a wide range of effects on estuarine salinity and mixing. In Sarasota Bay, tides have only a minor influence on salinity variability but are important forcing mechanisms for circulation. However, in Apalachicola Bay, tides exert a dominant influence on salinity variability, causing modest salinity increases and destratification of the water column. If the tidal range is high relative to the depth of the estuary, a large portion of water can be displaced significantly offshore in a single outgoing tide. Freshwater runoff has the direct effect of reducing salinity of the surface layer in areas where mixing is not significant and throughout the water column where mixing does occur. On the contrary, the presence of offshore winds that have lost their moisture over the land can greatly counteract the effect of runoff because these winds evaporate considerable quantities of water as they move across coastal waters (Thurman, 1993). Furthermore, winds directly affect turbulence and establish long-shore current direction and velocity, all of which impact the horizontal and vertical distribution of salinity. Major meteorological events can affect the distribution of salinity because of significant freshwater input and intense mixing due to wind and wave action. This can be especially important in Florida because of hurricane season and the potential for many storms in a relatively short period of time.
Anclote Salinity Tolerances October 2003
2-6
2.5 Classification Of Environments According To Their Salinity Salinity is an important determinant of the distribution of estuarine organisms. The vital role that estuaries play in maintaining populations of marine fishes, shellfishes, and other organisms has long been recognized (Bulgar et al., 1993). Efforts to subdivide estuaries as a function of salinity have traditionally been based on the observation that estuarine species are not evenly distributed across estuarine salinity gradients. Descriptions of estuarine species have yielded more than a dozen salinity classification schemes with recurring patterns across taxa and geographic zones. One of the most well known zonation schemes is the Venice System (Anonymous, 1959), which has largely superseded earlier classification schemes. The empirical basis for the zonation of the Venice System was not reported in the original document and is mostly descriptive. Nevertheless, the descriptive purpose is and will continue to be very valuable. The Venice System breaks down estuarine salinity ranges into five zones:
• limnetic: 0 - 0.5 ppt, • oligohaline: 0.5 - 5 ppt, • mesohaline: 5 - 18 ppt, • polyhaline: 18 - 30 ppt, and • euhaline: > 30 ppt.
A more recent classification scheme (Bulgar et al., 1993) derives biologically-based estuarine salinity zones from multivariate analysis. Principal Component Analysis (PCA) was used to derive estuarine salinity zones based on field data of the salinity ranges for 316 species/life stages in the mid-Atlantic region. Application of PCA to the data matrix showed that the structure underlying a diversity of salinity distributions could be represented by only five Principal Components corresponding to the following five overlapping salinity zones:
• Freshwater – 4 ppt, • 2 – 14 ppt, • 11 – 18 ppt, • 16 – 27 ppt, and • 24 ppt – marine.
The derived salinity zonations showed both differences and similarities to the Venice System. However, unlike the descriptive Venice System, the newer method allows researchers to establish biologically-relevant local salinity zones and develop hypotheses about the processes that give rise to the resulting patterns (Bulgar et al., 1993). 2.6 Influence of Desalination Concentrate Discharge on Salinity Desalination of sea water has been practiced regularly for over 50 years. Two main processes survived the crucial evolution of desalination technology, namely evaporation
Anclote Salinity Tolerances October 2003
2-7
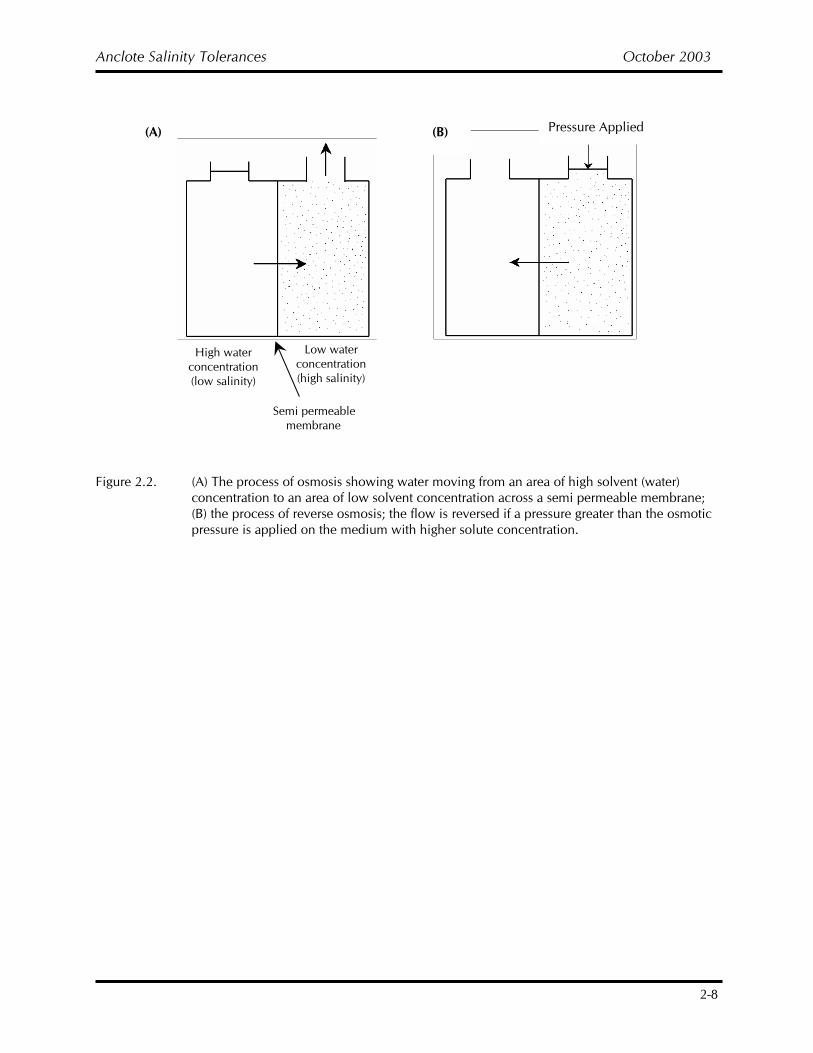
(thermal) and membrane techniques. Reverse osmosis (RO) is a membrane technique and is the fastest growing desalination method today (Semiat, 2000). Osmosis is the diffusion flow between two solutions (solvent plus solute) separated by a semi-permeable membrane that allows the solvent to pass through but acts as a barrier for the solute. The solvent flows from the area of higher solvent concentration toward the area of lower solvent concentration (Figure 2.2). The pressure gradient between the two solutions is called the osmotic pressure difference and varies according to the concentrations of the solute and the type of solvent present in the two solutions. Reverse osmosis is when a pressure gradient greater than the osmotic pressure difference is applied on the medium of high concentration. Consequently, the flow is reversed and the solvent travels from areas of low solvent concentration to areas of high solvent concentration and the separation of water from solute becomes possible (Figure 2.2) (Vanhems, 2002). For desalination plants located on or near the ocean, the most common and least expensive concentrate disposal method is ocean discharge. Seawater RO discharges consist of the concentrate and the anti-scalant and biocide process chemicals with no temperature elevation. Chemicals used in pretreatment break down or are biodegradable. Therefore, RO discharges can be classified as conventional or non-conventional (and not toxic) according the USEPA Clean Water Act of 1977. USEPA, California, and Florida ocean discharge regulations do not specifically identify concentrate as a pollutant. However, extremely high salinities can impact ocean biota if the biota is exposed for long periods of time (Del Bene et al., 1994). Resultant salinities depend on factors such as the use of diffusers, combining the brine with other types of wastewater, and position of the outfall. A regulatory mixing zone (RMZ) is an “allocated impact zone” and is used in many effluent discharge situations to identify impact regions (Del Bene et al., 1994). The desalination plant at Key West uses diffusers to turbulently mix discharge with ambient seawater. The combined density is usually greater than ambient and stratification occurs. In well-mixed, open marine environments, noticeable impacts are typically restricted to areas directly near the outfall. However, environments that are semi-enclosed, or inhabited by sensitive or economically important organisms, should be avoided if possible (Chesher, 1971).
Anclote Salinity Tolerances October 2003
2-8
Figure 2.2. (A) The process of osmosis showing water moving from an area of high solvent (water) concentration to an area of low solvent concentration across a semi permeable membrane; (B) the process of reverse osmosis; the flow is reversed if a pressure greater than the osmotic pressure is applied on the medium with higher solute concentration.
Low water
concentration (high salinity)
High water
concentration (low salinity)
(A) (B) Pressure Applied
Semi permeable membrane
Anclote Salinity Tolerances October 2003
3-1
3. INFLUENCE OF SALINITY ON FISH, INVERTEBRATES, VEGETATION, AND MARINE MAMMALS
Diffusion and osmosis are processes involving the movement of molecules along a concentration gradient, from high to low concentrations, until equilibrium is reached. These processes, in conjunction with kinetic energy allow molecules to pass across the cell membrane. Diffusion and osmosis are of prime importance in the lives of estuarine organisms because the external aqueous environment often varies considerably from that which exists within their bodies. This results in the movement of various substances, such as water and salts, in and out of the organism by osmosis and diffusion. All estuarine organisms have a problem with osmosis. Many species have soft parts to their body allowing the uptake of water from the dilute medium into the more concentrated blood. This would dilute the blood and eventually prove fatal to many estuarine organisms. Therefore estuarine organisms need to maintain the ionic balance of body fluids against the fluctuating external salinities. This is known as osmoregulation and all estuarine organisms, from mammals to plants, do it (Delbeek, 2002). 3.1 How Do Organisms Respond To Salinity And Changes In Salinity? Sub-optimal changes in salinity can elicit both physiological and behavioral responses in estuarine organisms. The first responses to salinity changes are physiological because ion and water concentrations in the cells must be regulated based on diffusion and osmosis rates relative to the environment. If salinity fluctuations are so extreme that osmoregulation becomes too costly, some organisms can respond behaviorally, such as simply moving to an area with optimal salinity. The following sections describe many of the physiological and behavioral responses estuarine organisms employ to cope with changes in salinity. Physiological Responses Salinity variation lies at the core of estuarine biology, serving as a physiologically limiting factor for species that lack the necessary adaptive mechanisms. Salinity extremes, particularly severe reductions resulting from massive influx of fresh water, may lead to severe population decline in some species. Alternatively, salinity extremes may eliminate less tolerant competitors and predators, permitting proliferation of specific taxa including economically important species such as the blue crab Callinectes sapidus (Towle, 1997). In fish there are basically four different strategies of regulation of internal water and total solute concentrations. These strategies depend, in part, on the environment in which they live. The first osmoregulatory strategy is that used by the hagfishes (Agnatha, Myxiniformes). This very simple method allows their body fluids to have about the same total salt concentration as sea water. In other words, they are isotonic (equal concentrations) with their environment and there is no osmotic gradient by which fluids or salts can be lost (Delbeek, 2002).
Anclote Salinity Tolerances October 2003
3-2
The second strategy is that employed by marine elasmobranchs (sharks, skates and rays). Their body fluid has a lower concentration (hypo-osmotic) of salt than sea water (about 1/3 of sea water). So instead of passing urea (which is mostly composed of organic salts) out of their bodies, it is put into their blood stream, effectively raising the salt concentration of their blood to that of sea water. However, they must still eliminate excess sodium and chloride ions. A special gland known as the rectal gland concentrates sodium and chloride ions into a solution that is passed out of the body. Other marine fish have the same problem encountered by sharks, skates and rays. Their body fluids, again, contain 1/3 the salt of sea water. Therefore, they tend to lose water by osmosis to the environment through their skin and gills. Consequently, they have developed mechanisms and behavior to compensate for this water loss. First, the kidneys of marine fishes are modified in such a way that very little water is extracted from the blood. This minimizes the loss of water by urine production. However, water is still lost by the gills. Therefore, marine fishes must drink a large quantity of water. Drinking water by itself cannot alone solve the problem, so a complex series of events must first occur in the digestive tract. These events are not yet well understood but it is known that most of the water and monovalent ions (sodium and chloride) are absorbed while the divalent ions (magnesium and sulfates) are excreted by the kidneys. Sodium and chloride also move by diffusion into the body through the gills. To prevent accumulation of these ions in the body of the fish they are eliminated by cells in the gills (called chloride cells), which move these ions out of the body by active transport (Delbeek, 2002). Freshwater fishes have the opposite problem of marine fishes and elasmobranches because their body fluids have a greater concentration of salts than their surrounding environment (hyper-osmotic). As a result they are constantly taking on water by diffusion through their skin and to a much larger extent, through the thin membranes of their gills. Therefore, to maintain the high concentration of salts in their body fluids, they must continuously excrete the excess water they have absorbed. Highly efficient kidneys that produce very dilute urine accomplish this. Salts, mostly sodium and chloride, are also lost by diffusion through gill membranes. Although these ions can be replaced by food, they are usually replaced when the fish “swaps” one type of ion from its body for another ion from the environment. Fish can move a substance against an osmotic gradient through the use of energy, and in the case of freshwater fish, sodium ions from the water are exchanged for ammonia ions from the body of the fish. This effectively rids the fish of ammonia. Chloride ions are exchanged for carbonate ions, which help in maintaining the pH of the body fluids (Delbeek, 2002). Euryhaline invertebrates demonstrate many patterns of physiological adaptation to salinity change, which is what allows euryhaline organisms to occur within a wide range of salinities. Generally, invertebrates use regulation of blood osmotic concentration, regulation of cell volume, or a combination of the two. For example, the green shore crab (Carcinus maenas) and the blue crab (Callinectes sapidus) employ both regulatory measures. At salinities above 25 ppt, both species permit the blood osmotic concentration
Anclote Salinity Tolerances October 2003
3-3
to track that of ambient water, employing volume regulation in response to increasing salinity. In salinities less than 25 ppt, these species activate physiological mechanisms that facilitate regulation of blood osmolality. The major contributor to blood osmolality in euryhaline crabs is sodium chloride, thus the regulation of fluxes and permeabilities of these two ions is key to the animals’ ability to withstand changes in salinity. Ion regulatory mechanisms in the green shore crab respond quickly to salinity change, with Na+ levels reaching new steady state within six hours after a decrease in salinity. Blue crabs also exhibits rapid response to tidal fluctuations in salinity, maintaining a nearly constant blood osmotic concentration under such circumstances (Towle, 1997). In marine mollusks (eg. oysters, snails), the most common physiological response to changing salinity is the decrease of functional activity. When salinity changes, respiration rates decrease and stay at relatively low levels, normally no longer than 1-2 days. But after acclimation, the intensity of respiration gets restored to the original level or close to it. Furthermore, the ability of mollusks to restore functional activity under long-term exposure to water of changing salinity is also manifested in locomotion and byssus (filaments used by some mollusks to adhere to a surface) production rate (Berger and Kharazova, 1997). There are also a number of cellular mechanisms in marine mollusks involved in adaptation to salinity changes. In early stages of acclimation there are remarkable changes in protein and RNA synthesis (bulk synthetic processes and amplitude of hourly oscillations of protein synthesis) in molluskan tissue. Electron microscopy has shown that changes in synthetic activity of mussel gill cells are accompanied by swelling of the cell and membrane organelles. During long term acclimation (days to weeks) synthetic activity returns to normal (Berger and Kharazova, 1997). Euryhaline plants also exhibit physiological adaptations to changing salinity. Mangrove forests are part of the intertidal wetlands and play an important role in estuarine ecology. Mangroves have a variety of mechanisms to counterbalance salinity extremes in water and soil. Physiological responses to saline and hypersaline conditions include salt exclusion and salt secretion. Salt exclusion, a mechanism used by red mangroves (Rhixophora mangle), relies on the ability of the plant’s roots to absorb only freshwater in a saltwater environment. The root cell membranes are able to exclude salt ions, and negative pressure in the xylem (produced as a result of transpiration by the plant’s leaves) draws water into the root through the membrane by reverse osmosis (Odum and McIvor, 1990). Salt secretion, a mechanism used by black mangroves (Avicennia germinans) and white mangroves (Laguncularia racemosa), is carried out by salt-secreting glands on the leaves that pump excess salts from the plant tissue. In practice most species of mangroves probably use a combination of salt exclusion and salt excretion together with other biochemical mechanisms of salt tolerance, including stomatal responses, enzyme activation, protein synthesis, and other ways to manage osmotic relationships across cell membranes (Odum and McIvor, 1990). Sea grasses are another type of coastal vegetation that have adapted to changing salinity. Sea grasses are marine monocots that have very important ecological roles in the shallow
Anclote Salinity Tolerances October 2003
3-4
waters of temperate and tropical coasts (Dawes, 1981). They have inconspicuous flowers, and true roots, stems and leaves that contain vascular tissue (Littler and Littler, 1989). The various genera of sea grasses are not closely related to one another and are not actually grasses at all. They are relatives of the lily family that have adapted to submerged conditions (Dawes, 1981). Many accounts of seagrass biology and ecology include descriptions of the salinity tolerance of major species of subtropical sea grasses (Montague and Ley, 1993). In almost all of these accounts, interpretations of salinity tolerance are based on anecdotal observations and on limited experimental studies. The general conclusions are that Halodule wrightii (shoal grass) is broadly euryhaline; Thalassia testudinum (turtle grass) thrives only in intermediate ranges of salinity (about 20 – 40 ppt); and Syringodium filiforme (manatee grass) tolerates only a narrow range of salinity near that of full strength sea water. As salinity changes, populations of some taxa may decline or disappear while others begin to flourish. Frequent salinity changes may result in reduced species presence. Therefore, changes in salinity in an area could affect the distribution, composition, and total abundance of benthic vegetation. Sea grasses have physiological adaptations that allow them to live in a saline environment. In 1973, Jagels studied the structure of osmoregulatory leaf cells in Thalassia testudinum. Thalassia testudinum was chosen for this study because it is somewhat stenohaline (occurring in a very narrow range if salinity), it is one of the most successful tropical sea grasses, and it does not tolerate even brief exposure to air at low tides. Unlike their terrestrial relatives, sea grasses do not have stomata (tiny pores in the leaves where gas exchange takes place) and they contain no specialized organs for salt excretion like other intertidal or halophytic angiosperms. Alternatively, evidence suggests that all of the epidermal leaf cells are capable of osmoregulation, as they appear somewhat analogous to the basal cells of salt glands in Spartina and osmoregulatory cells of the brine shrimp Artemia salina. The precise physiological mode for secretion cannot be deduced from existing information. However, structural and physiological evidence suggests that salt secretion in Thalassia occurs directly through the cell membrane and is not regulated through microvacuoles or vesicles. Changes in salinity can be an important factor in local distribution of algae. Salinity-dependent distributions of algae have been documented (Munda 1978). Physiological and structural tolerance mechanisms that allow algae to cope with changing salinity are variable. The red alga Porphyra has an increase in the size and number of cell vacuoles in hyper and hypotonic seawater. Amino acid content is also important in controlling osmotic balances in salt marsh angiosperms, in the red alga Porphyridium, and in Black Sea algae. Osmoregulation can occur in a number of ways, utilizing both carbohydrates and amino acids. When an alga is exposed to lower salinities, free amino acids are removed from the cell sap, resulting in lower cell osmolarity. But as salinity rises, more amino acids are released. Furthermore, in a study of 17 species of red, green, and brown algae, it was found that maintenance of turgor pressure over a wide range of osmotic
Anclote Salinity Tolerances October 2003
3-5
concentrations (470-1860 mOsm/kg) was achieved by changing concentrations of sodium, potassium, and chloride (Dawes, 1981). Marine mammals, particularly West Indian manatees and Atlantic bottlenose dolphins, are important to Florida’s ecosystems. They too are capable of osmoregulation. Marine vertebrates possess renal structures and endocrine mechanisms necessary to tolerate a hyperosmostic habitat. Except for manatees, marine mammals have lobulate kidneys, which allow them to drink salt water and to concentrate their urine while maintaining water balance and a constant plasma osmolality. However, manatees and dugongs do possess renal structures that indicate their ability to conserve water via urine concentration, which suggests these animals have the ability to inhabit marine environments. West Indian manatees are primarily found in freshwater but can inhabit regions with salinities as high as 35 ppt (Ortiz et al., 1998). In 1998, Ortiz et al. studied osmoregulation in wild and captive West Indian manatees (Trichechus manatus). Blood samples were analyzed from manatees held in fresh and salt water and from wild animals captured in fresh-, brackish, and salt water for concentrations of aldosterone, arginine, vasopressin, plasma renin activity, sodium, potassium, chloride, and osmolality. Two separate experiments were also conducted on captive animals to evaluate osmoregulatory response to acute saltwater exposure and freshwater deprivation. Generally, plasma electrolytes and osmolalities were constant over a broad range of salinities, suggesting that West Indian manatees are good osmoregulators regardless of the environment. Behavioral Responses Behavioral responses to salinity or other environmental stresses fall into three basic categories:
• Burrowing: organisms utilize the less variable interstitial fluids, • Closing up: mollusks can enclose the soft tissue to prevent contact with low salinity,
and • Migration: daily feeding migrations, moving in and out with tide to gain access to
higher concentrations of food sources. In marine mollusks burrowing and closing occur in response to the activity of peripheral detectors located on head tentacles, mantle ridges, and siphon surfaces. Exposure to extreme salinities initiates isolating reflexes. These behavioral responses do not come without penalties. For instance, when mollusks close up, they have shorter feeding times and build up of oxygen debt due to respiration in a confined space. Furthermore, species that migrate may be tolerant to salinity changes as adults but not as juveniles, so they need to return to the sea in order to breed (Berger and Kharazova, 1997).
Anclote Salinity Tolerances October 2003
3-6
3.2 Classification of Organisms According to Their Ability to Tolerate Salinity and Salinity Change
Osmoregulatory capabilities in estuarine organisms are the most important factors in determining whether a particular organism occurs within a wide or narrow range of salinities. The term euryhaline describes an organism with a tolerance to withstand wide ranges in salinity. Many crab species, such as blue crabs and lesser blue crabs, as well as fish species, including mullet and snappers, are considered euryhaline species. The term stenohaline describes an organism that is restricted to narrow limits of variation in salinity. The sea grass Thalassia testudinum and freshwater Atlantic stingrays are considered stenohaline organisms. 3.3 Salinity Tolerance Studies Information regarding the salinity tolerances of estuarine organisms has been derived from laboratory, field, and correlative studies. The following section reviews literature which describes how changing salinity affects biological function in estuarine organisms and if upper and/or lower salinity tolerances could be established. Oxygen Consumption Estuarine organisms inhabit dynamic environments marked by changes that are either predictable, such and tidal and seasonal regimes, or unpredictable, such as storms. Although estuarine organisms have mechanisms to deal with predictable environmental variability, quick changes to the environment associated with unpredictable events can have serious implications for both flora and fauna. Storm induced salinity fluctuations can have a significant effect on estuarine invertebrate larvae. Survival, growth, activity and rate of development may decreased when larvae were exposed to a gradual reduction in salinity from 30 ppt to 10 or 15 ppt. Organisms experiencing physiological stress expend energy to cope with that stress resulting in sacrificed energy expenditure on other functions such as growth, reproduction, and developmental rate. Richmond and Wooden (1999) examined oxygen consumption during physiological stress and the associated changes in life-history parameters. Specifically, they investigated if there was a correlation between larval survival, growth, activity, and development rate and larval invertebrate respiration under conditions of reduced salinity. Two species of larval invertebrates, the marine polychaete Arenicola cristata and the mud snail Ilyanassa obsoleta, were exposed to salinity reduction of 10 or 15 ppt in experimental treatments whereas the control individuals were maintained at 30 ppt. Salinity was reduced for 3 days when larvae were between ages 1 and 4 days post hatch. Oxygen consumption of I. obsoleta larvae was the same among treatments during salinity reduction. However, at a salinity of 10 ppt oxygen consumption of A. cristata was significantly lower compared with controls and salinity reduction to 15 ppt. In fact, all of the A. cristata larvae eventually died. Also, after salinity reduction ceased, larvae exposed to a salinity of 15 ppt consumed more (A. cristata) or the same (I. obsolete) amount of oxygen as individuals maintained at 30 ppt. Also, Berger and Kharazova (1997) found that the transition of molluscs back to normal conditions after
Anclote Salinity Tolerances October 2003
3-7
being completely acclimated to a changed salinity results in a sharp increase of functional activities such as oxygen consumption. Reproduction and Development Estuaries are highly productive areas that act as spawning and nursery grounds for a multitude of fish and invertebrate species. The spotted seatrout Cynoscion nebulosus is abundant in the United States waters of the Gulf of Mexico from Florida to Texas and supports both recreational and commercial fisheries throughout the region (Brown-Peterson et al., 2002). Brown-Peterson et al. (2002) evaluated aspects of female spotted seatrout reproduction and made longitudinal comparisons across its range. Five estuaries ranging from Florida to Texas were chosen for comparison: Charlotte Harbor (CHFL) and Apalachicola Bay, Florida (AFL); Biloxi Bay and St. Louis Bay, Mississippi (MS); Barataria Bay, Louisiana (LA); and Redfish Bay, Texas (TX). Although seasonal temperature profiles were similar among all five estuaries, spring salinities were lower in AFL and MS (range 7.5-15 ppt) than in the other three estuaries (range 16.6-31.7 ppt). Overall, AFL and MS fish had the shortest reproductive season, fewer number of spawns, and appeared to reach sexual maturity at a slightly larger size. Although these differences could be explained by other factors, such as variations in time of sampling, habitat structure, and genetics, salinity profiles appear to be the most plausible explanation. Development is also affected by changes in salinity. Lee and Menu (1981) investigated the effects of changing salinity on egg development and hatching in the grey mullet Mugil cephalus L. The study examined survival of naturally spawned eggs over a wide range of salinities (5-70 ppt), the tolerance of fertilized eggs to salinity changes at two developmental stages, and the survival of the hatched larvae. Grey mullet were collected from ponds and induced to spawn with carp pituitary homogenate and human chorionic gonadotropin at 30 ppt salinity at 260C. About 100 fertilized eggs from four spawners were transferred from the 30 ppt incubation tank to sea water of different salinities in the range of 5-70 ppt, either at the 2-blastomere (the stage when a fertilized egg has cleaved into two daughter cells) or the gastrula stage (the stage where a fertilized egg has divided into thousands of cells which have begun to organize into a basic body plan) (Alberts et al., 1994). When fertilized eggs were transferred at the 2-blastomere stage to the test salinities, the best hatching rate and highest percent of well-shaped larvae were found in a salinity of 35 ppt. However, there were no well-shaped larvae at or below 15 ppt. For eggs transferred at the gastrula stage, the range of tolerable salinities became wider, between 20-45 ppt, with the percentage of well-shaped larvae being highest between 30-40 ppt. There were no larvae in good condition in salinities at or below 10 ppt. There was no significant effect on embryo formation in fertilized eggs incubating at salinities between 10-50 ppt, although embryo development percentage was lower in salinities above or below this range. Hatching rates of eggs with developed embryos were not significantly different within the 15-55 ppt salinity range. However, the percentage of well-shaped larvae increased as salinity increased to 35 ppt, but then decreased again as salinity increased further.
Anclote Salinity Tolerances October 2003
3-8
Hatching occurred in all salinities between 10-55 ppt, but no larvae survived below 10 or above 55 ppt salinity.
Metabolism and Bioenergetics Metabolism is an inclusive term for the chemical reactions by which the cells of an organism transform energy, maintain their identity, and reproduce. All life forms, from single-celled algae to mammals, are dependent on many hundreds of simultaneous and precisely regulated metabolic reactions to support them from conception through growth and maturity to the final stages of death. Each reaction is triggered, controlled, and terminated by specific cell enzymes or catalysts, and each reaction is coordinated with the numerous other reactions throughout the organism (Encarta website, 2002). Two metabolic processes are recognized: anabolism and catabolism. Anabolism, or constructive metabolism, is required for the growth of new cells and the maintenance of all tissues. Catabolism, or destructive metabolism, is a continuous process concerned with the production of the energy required for all external and internal physical activity. Catabolism also involves the maintenance of body temperature and the degradation of complex chemical units into simpler substances that can be removed as waste products from the body through the kidneys, intestines, lungs, and skin (Encarta website, 2002). Environmental conditions, such as salinity, can greatly affect metabolic processes of estuarine organisms. Organisms experiencing physiological stress expend energy to cope with that stress resulting in sacrificed energy expenditure on other functions such as growth, developmental rate, and reproduction. Moser and Miller (1994) evaluated the effects of salinity fluctuations on routine metabolism of juvenile spot, Leiostomus xanthurus, a key fish species in estuarine environments. Juvenile spot collected from the lower Newport River Estuary, North Carolina, were assigned to classes based on size (40-70 mm, 70-90 mm, and 90-120 mm) and placed in flow-through annular respiration chambers to measure routine oxygen consumption. All spot tested adapted quickly to rapid and extreme fluctuations in salinity. Although it was hypothesized that juvenile spot are unable to keep up physiologically with rapid rates of salinity change, Moser and Miller (1994) found that routine respiration of spot stabilized within 3 hours after acute salinity changes and that no fish had died during or after laboratory experiments. A euryhaline, intertidal fish, Blennius pholis L., displayed even more rapid response to salinity change, reaching new steady-state oxygen consumption immediately following large step changes in salinity. In contrast, Pomatoschistus microps Kroyer, a euryhaline goby that buries itself in sediments to exploit their salinity buffering capacity, required over 5 hours to adapt to rapid changes in salinity. It is not surprising that spot adaptation times were intermediate between those of taxa that encounter both greater and lesser degrees of salinity variation. Moser and Miller (1994) found that rate, rather than magnitude of salinity change, elicited transient stress responses in 40-70 mm spot. An oxygen consumption spike occurred after a large magnitude, rapid salinity change (going from 0 to 34 ppt salinity in 85 minutes). This response was not observed after a large salinity decrease at a much slower rate (going
Anclote Salinity Tolerances October 2003
3-9
from 34 to 0 ppt in 152 minutes). In addition, salinity changes at low mean salinity resulted in higher cost of osmoregulatory adjustment than salinity changes at higher mean salinity. When salinity was changed slowly from 15 to 0 ppt and then back to 15 ppt, steady state oxygen consumption was 12% higher than initial oxygen consumption. In contrast, routine oxygen consumption returned to initial levels when salinity was changed from 34 to 15 ppt then back to 34 ppt. Respiration responses in 70-90 mm spot differed significantly compared to the 40-70 mm and 90-120 mm size classes tested under the same salinity regime (rapidly changing from 34 to 0 ppt and then back to 34 ppt). The routine oxygen consumption of juvenile spot was positively correlated with salinity during recordings made in constant salinity, but spot in the 70-90 mm size class did not exhibit increased routine oxygen consumption in steady state salt water. Therefore, respiration rates did not vary greatly. Furthermore, freshwater challenge experiments proved that spot in this size class also survived 100% longer than other size classes. Increased salinity tolerance exhibited by the 70-90 mm size class may reflect adaptations for emigration to open water from estuarine environments because young spot move from estuarine environments to marine waters during autumn when they happen to be approximately 70 mm in length. Richmond and Wooden (1999) illustrated the effects of salinity reduction on oxygen consumption by the larval estuarine polychaetes Arenicola cristata and Ilyanassa obsoleta. Salinity was reduced to 10 or 15 ppt while control individuals were maintained at 30 ppt salinity. When larvae were between 1 and 4 days post hatch, salinity was reduced for 3 days. Even though the oxygen consumption of I. obsoleta remained the same during salinity reduction, oxygen consumption for A. cristata was significantly lower at 10 ppt salinity compared with controls and with salinity reduction to 15 ppt. In fact, all larvae died at 10 ppt salinity. After salinity reduction stopped, larvae exposed to 15 ppt salinity consumed more (A. cristata) or the same (I. obsoleta) amount of oxygen compared to controls, again indicating that low salinity is a problem. Guerin and Stickle (1997) investigated the effects of salinity on the survival and bioenergetics of another key estuarine organism, the lesser blue crab (Callinectes similes). The lesser blue crab is a congener of the common blue crab (Callinectes sapidus), both of which occupy an overlapping geographic range in the eastern United States, without interbreeding. Although there is some overlap within coastal ecosystems, the lesser blue crab tends to inhabit waters with higher salinity (≥ 15 ppt) than blue crab, meaning the lesser blue crab inhabits lower estuary and offshore environments. Adult blue crabs were thought to be a better osmoregulators than lesser blue crabs, but more recent evidence indicates that lesser blue crabs, particularly juveniles, may be more capable of surviving at lower salinities than previously thought. Even though adult lesser blue crabs rarely penetrate inshore marshes, juveniles do coexist with blue crabs in these areas. Physiological rates can be measured across salinity gradients and converted to energetic equivalents so that the effect salinity has on energy budget components can be determined.
Anclote Salinity Tolerances October 2003
3-10
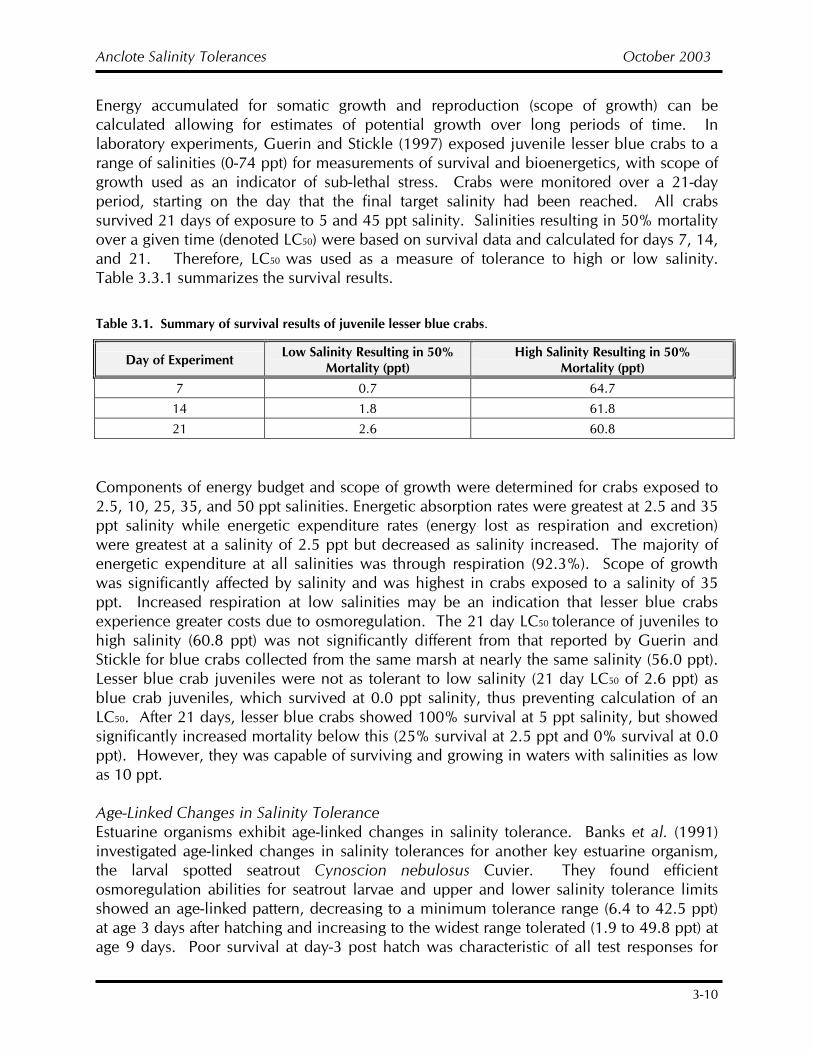
Energy accumulated for somatic growth and reproduction (scope of growth) can be calculated allowing for estimates of potential growth over long periods of time. In laboratory experiments, Guerin and Stickle (1997) exposed juvenile lesser blue crabs to a range of salinities (0-74 ppt) for measurements of survival and bioenergetics, with scope of growth used as an indicator of sub-lethal stress. Crabs were monitored over a 21-day period, starting on the day that the final target salinity had been reached. All crabs survived 21 days of exposure to 5 and 45 ppt salinity. Salinities resulting in 50% mortality over a given time (denoted LC50) were based on survival data and calculated for days 7, 14, and 21. Therefore, LC50 was used as a measure of tolerance to high or low salinity. Table 3.3.1 summarizes the survival results.
Table 3.1. Summary of survival results of juvenile lesser blue crabs.
Day of Experiment Low Salinity Resulting in 50% Mortality (ppt)
High Salinity Resulting in 50% Mortality (ppt)
7 0.7 64.7 14 1.8 61.8 21 2.6 60.8
Components of energy budget and scope of growth were determined for crabs exposed to 2.5, 10, 25, 35, and 50 ppt salinities. Energetic absorption rates were greatest at 2.5 and 35 ppt salinity while energetic expenditure rates (energy lost as respiration and excretion) were greatest at a salinity of 2.5 ppt but decreased as salinity increased. The majority of energetic expenditure at all salinities was through respiration (92.3%). Scope of growth was significantly affected by salinity and was highest in crabs exposed to a salinity of 35 ppt. Increased respiration at low salinities may be an indication that lesser blue crabs experience greater costs due to osmoregulation. The 21 day LC50 tolerance of juveniles to high salinity (60.8 ppt) was not significantly different from that reported by Guerin and Stickle for blue crabs collected from the same marsh at nearly the same salinity (56.0 ppt). Lesser blue crab juveniles were not as tolerant to low salinity (21 day LC50 of 2.6 ppt) as blue crab juveniles, which survived at 0.0 ppt salinity, thus preventing calculation of an LC50. After 21 days, lesser blue crabs showed 100% survival at 5 ppt salinity, but showed significantly increased mortality below this (25% survival at 2.5 ppt and 0% survival at 0.0 ppt). However, they was capable of surviving and growing in waters with salinities as low as 10 ppt. Age-Linked Changes in Salinity Tolerance Estuarine organisms exhibit age-linked changes in salinity tolerance. Banks et al. (1991) investigated age-linked changes in salinity tolerances for another key estuarine organism, the larval spotted seatrout Cynoscion nebulosus Cuvier. They found efficient osmoregulation abilities for seatrout larvae and upper and lower salinity tolerance limits showed an age-linked pattern, decreasing to a minimum tolerance range (6.4 to 42.5 ppt) at age 3 days after hatching and increasing to the widest range tolerated (1.9 to 49.8 ppt) at age 9 days. Poor survival at day-3 post hatch was characteristic of all test responses for
Anclote Salinity Tolerances October 2003
3-11
larval seatrout. At this age, mouth and eyes were functional, the yolk sac was completely absorbed, and exogenous feeding was beginning. High mortality due to salinity may be linked to developments related to first feeding. The renal-brachial-gut processes employed for osmoregulation by adult fish were in the course of development in larval seatrout, and were therefore not yet working to assist with osmoregulation. Other Effects of Salinity Change on Estuarine and Coastal Organisms There are a multitude of other effects that changing salinity can have on organisms that inhabit estuaries and the nearby coastal waters. All of the lower invertebrate groups, such as sponges and cnidarians (corals, sea anemones, jellyfish), can be significantly affected by changes in salinity because they are incapable of osmoregulation (Porter et al., 1999). Sponges are significant components of many hardbottom and softbottom communities, and are often very abundant in estuaries and other shallow coastal waters. Fell et al. (1989) looked at low salinity tolerance of the estuarine sponge Microciona prolifera under long-term laboratory culture. In estuarine environments, M. prolifera exists where salinity is ≈15 ppt or higher during warmer months. When temperature falls below ≈100C, the sponge regresses to an inactive (dormant) form lacking certain structural and physiological components. Tissue regression is reversed when water temperature rises. Reversible tissue regression, similar to that which occurs due to low temperature, was also induced in the estuarine sponge in response to low salinity. When explants were transferred from 30 ppt to 10 ppt seawater, numerous structural and physiological components of the sponge disappeared. When explants were transferred back to 20 ppt seawater, all of these components reappeared. Although the determination of high salinity tolerance is valuable information (Goldberg, 1973), until the development of desalination technology, high salinities were seldom independently assessed from high temperatures. Porter et al. (1999) illustrated the effect that salinity stress, either by itself or in conjunction with temperature stress, can have on scleractinian (hard) corals. In addition to increased mortality rates, longer-term stress can cause reduced growth and reproductive rates as well as decreased calcification. Short-term effects of salinity stress can cause changes in basal metabolic function, including effects on animal respiration and symbiont photosynthesis. Sublethal effects of salinity stress have been documented for the Floridian coral Siderastrea siderea, a coral known to be very euryhaline. Although an increase in salinity from 32 to 42 ppt caused no change in respiration for S. siderea, photosynthesis was greatly reduced. Further increased salinity of >10 ppt caused reductions in both respiration and photosynthesis after 6 days of exposure. Coles and Jokiel (1992) reported that the instantaneous gross P:R ratio for S. siderea falls in salinities in excess of 36 ppt. Furthermore, low salinity reduces the coral’s ability to survive short-term exposure to elevated temperatures (Porter et al., 1999). Photosynthetic rates of other algae are also influenced by salinity, as was demonstrated by comparisons of taxa from different salinity regimes within a population over a series of seasons. For example, the red alga Hypnea musciformis is common in Florida ecosystems (Littler and Littler, 1989), and has shown seasonal response to salinity with a lower, broader (5 - 35

Anclote Salinity Tolerances October 2003
3-12
ppt) photosynthetic response in the summer and sharper, stronger peak (20 ppt) in the winter (Dawes, 1981)
Anclote Salinity Tolerances October 2003
4-1
4. SALINITY IN THE ANCLOTE ANCHORAGE AND NEARBY COASTAL WATERS
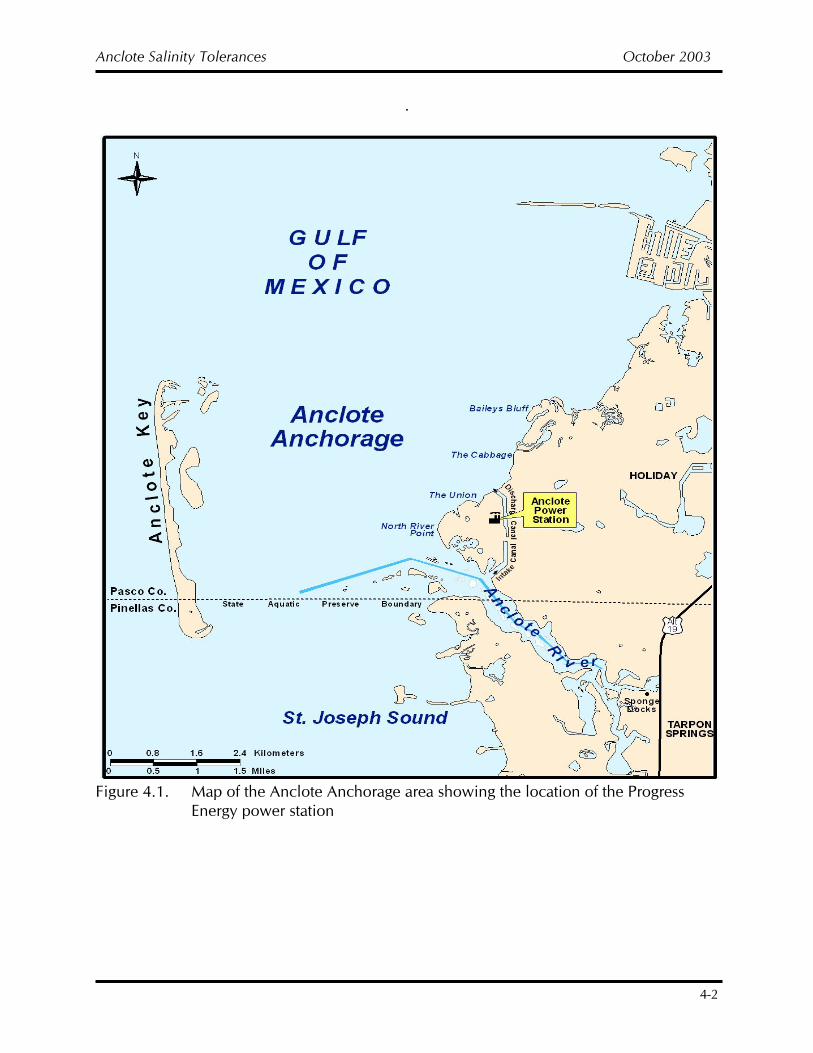
The lower Anclote River flows past the City of Tarpon Springs and enters the Anclote Anchorage from a southeasterly direction. The Progress Energy Anclote Power Station is located on the river’s northern shoreline, immediately upstream from the mouth (Figure 4.1). Near-surface salinities measured by Frazer et al. (2001) during 2000-2001 ranged between 23.0 and 38.5 ppt. The lowest median salinity (31.0 ppt) was observed at station 10, which is located immediately north of Bailey’s Bluff. Station 1, located at the mouth of the Anclote River, exhibited a slightly higher median value of 31.6 ppt. The highest median salinities were observed at stations 6, 7, and 8, located near the passes at the northern and southern ends of Anclote Key, which connect the Anclote Anchorage to the Gulf of Mexico. The median values observed at all sites (which ranged between 31 and 33 ppt) were indicative of a high salinity estuarine regime (Day et al. 1989). Ambient salinity levels in the immediate vicinity of the Anclote Power Station discharge canal have probably been lowered somewhat by the construction and operation of the plant due to the diversion of river water to the plant and its subsequent discharge via the canal (Mote Marine Laboratory 1991). During a normal rainy season, under conditions of high natural discharge in the river, the presence of the power station’s intake and discharge canals may actually reduce the likelihood of salinity shock in the area around the river mouth by diffusing the total discharge of the river over a broader area (Mote Marine Laboratory, 1991).
Anclote Salinity Tolerances October 2003
4-2
.
Figure 4.1. Map of the Anclote Anchorage area showing the location of the Progress Energy power station
Anclote Salinity Tolerances October 2003
5-1
5. CONCLUSIONS Seawater desalination plays a major role in Tampa Bay Water’s Master Water Plan. At this time, two seawater desalination plants are envisioned. One is currently in operation producing up to 25 MGD near Big Bend on Tampa Bay. A second plant is conceptualized near the mouth of the Anclote River in Pasco County, with a 9 to 25 MGD capacity, and is currently in the design phase. The Tampa Bay Water desalination plant at Big Bend on Tampa Bay utilizes a reverse osmosis process to remove salt from seawater, yielding drinking water. That same process is under consideration for the facilities Tampa Bay Water has under design near the Anclote River. Estuaries are semi-enclosed coastal bodies of water that receive fresh water runoff from the land and salt water from the sea, producing a mixing zone with highly variable salinity. Salinity has traditionally been regarded as a central parameter for estuarine analysis, especially as an indicator of hydrography and habitat potential. There are several reasons to study estuarine salinity: a) salinity is a direct measure of the relative influence of marine and freshwater sources; b) salinity is an outstanding hydrographic tracer, as it is a conservative property and illustrates the movement and exchange of water masses; and c) salinity dominates the density structure of an estuary and thus exerts significant controls on currents and turbulence. The desalination concentrate that is generated by the reverse osmosis (RO) process is a hypersaline solution, i.e., it has a higher salinity than the source water. An understanding of salinity characteristics of the receiving water body and of the RO concentrate is a critical component of the assessment of the potential effects of the discharge of this concentrate on the receiving water body. The potential effects of concentrate discharge also depend on the ability of the plants and animals that normally inhabit the receiving water body to respond to any salinity change resulting from the discharge. This report describes the spatial and temporal variation of salinity within estuarine and offshore environments, and provides a review of information regarding the tolerance of the vegetation, invertebrates, fish, and marine mammals commonly found in the Anclote Anchorage and offshore areas to withstand changes in salinity. Organisms most likely found in the offshore areas require relatively higher, more constant salinity waters. Organisms found in the nearshore area typically tolerate a wider range of salinity. In particular, turtle grass, the predominant seagrass found in the Anclote Anchorage, is typically found in waters that range in salinity from 20-40 ppt, and is typically limited by lower salinities.
Anclote Salinity Tolerances October 2003
6-1
6. LITERATURE CITED Adams, D. A. 1963. Factors influencing vascular plant zonation in North Carolina salt marshes. Ecology 44:445-456. Alberts, B., D. Bray, J. Lewis, M. Raff, K. Roberts, and J. D. Watson. 1994. Molecular Biology of the Cell. Garland Publishing Inc., New York, NY. Anderson, G. 1985. Species profiles: life histories and environmental equirements of coastal fishes and invertebrates (Gulf of Mexico) – grass shrimp. U. S. Fish Wildl. Ser. Biol. Rep. 82 (11.35) U. S. Army Corps of Engineers, TR EL-82-4. Barnes, R. S. K. and R. N. Hughes. 1993. An Introduction to Marine Ecology. Blackwell Scientific Publications, Cambridge, MA. Banks, M. A., G. J. Holt, and J. M. WakemaN. 1991. Age-linked changes in salinity tolerance of larval spotted seatrout (Cynoscion nebulosus, Cuvier). Journal of Fish Biology39:505-514. Beck, J. T. and B. C. Cowell. 1976. Life history and ecology of the freshwater caridean shrimp, Palaemonetes paludosus (Gibbes). Am. Midl. Nat. 96:52-65. Bell, S.S. and L.D. Coen. 1982. Investigations on epibenthic meiofauna I. Abundances on repopulation of the tube-caps of Diopatea cuprea (Polychaeta-Onophidae) in a subtropical system. Berger, V. J. and A. D. Kharazova. 1997. Mechanisms of salinity adaptations in marine molluscs. Hydobiologia 355:115-126. Bielsa, L. M., W. H. Murdich, and R. F. Labinsky. 1983. Species profiles: life histories and environmental requirements of coastal fishes and invertebrates (South Florida) – pink shrimp. U. S. Fish Wildl. Ser. FWS/OBS-82(11-17). U. S. Army Corps of Engineers, TR EL-82-4. Bloom, S. A. , J. L. Simon, and V. D. Hunter. 1972. Animal-sediment relations and community analysis of a Florida Estuary. Mar. Biol. 13:43-56. Bortone, S. A. and J. L. Williams. 1986. Species profiles: life histories and environmental requirements of coastal fishes and invertebrates (South Florida) – gray, lane, mutton, and yellowtail snappers. U. S. Fish Wildl. Ser. FWS/OBS-82(11.72). U. S. Army Corps of Engineers, TR EL-82-4.
Anclote Salinity Tolerances October 2003
6-2
Bowler, M. W. and A. J. Seidenberg. 1971. Salinity tolerance of the prawns,Palaemonetes vulgaris and P. pugio and its relationship to the distribution ofthese species in nature. Va. J. Sci. 22:1-94. Brown-Peterson, N. J., M. S. Peterson, D. L. Nieland, M. D. Murphy, R. G. Taylor,and J.R. Warren. 2002. Reproductive biology of female spotted seatrout, Cynoscion nebulosus, in the Gulf of Mexico: differences among estuaries? Environmental Biology of Fishes 63:405-415. Bulgar, A. J., B. P. Hayden, M. E. Monaco, D. M. Nelson, and M. G. Mccormick-Ray.1993. Biologically-based estuarine salinity zones derived from a multivariateanalysis. Estuaries16:311-322. Butler, P.A. 1954. Summary of our knowledge of the oyster in the Gulf of Mexico. U.S. Fish Wildl. Serv. Fish Bull. 55(89):479-489. Calabrese, A. and H.C. Davis. 1966. The pH tolerance of embryos and larvae of Mercenaria mercenaria and Crassostrea virginica. Biol. Bull. 131:427-436. Carriker, M.R. 1951. Ecological observations on the distribution of oyster larvae in New Jersey estuaries. Ecol. Monogr. 21(1): 19-38. Castagne, M. and P. Chanley. 1973. Salinity tolerance of some marine bivalves from inshore and estuarine environments in Virginian waters on the western mid-Atlantic coast. Malacologia 12:47-96. Chabreck, R. H. 1972. Vegetation, water, and soil characteristics of the Louisiana coastal region. La. Agric. Exp. Stn. Bull. #664. Chanley, P. 1958. Survival of some juvenile bivalves in water of low salinity. Proc. Natl. Shellfish. Assoc. 48:52-65. Chesher, R. H. 1971. Biological impact of a large scale desalination plant at Key West. Environmental Protection Agency Office of Research and Monitoring. Childress, R., E. Bradley, E. Hagen, and S. Williamson. 1975. The effects of freshwater inflows on hydrological and biological parameters in the San Antonio Bay system. Coastal Fisheries Branch, Texas Parks and Wildlife Department, Austin, TX. Christmas, J. Y. and W. Langly. 1973. Estuarine invertebrates, Mississippi In J. Y. Christmas (ed.). Cooperative Gulf of Mexico Estuarine Inventory Study, Mississippi. Ocean Springs, MS, Gulf Coast Res. Lab.
Anclote Salinity Tolerances October 2003
6-3
Collins, M. R. 1985. Species profiles: life histories and environmental requirements of coastal fishes and invertebrates (South Florida) -- striped mullet. U. S. Fish and Wildlife Service Biological Rpt. 82. Collins, M. R. 1981. The feeding periodicity of striped mullet Mugil cephalus L. in two Florida habitats. J. Fish Biol. 19:307-315 Darcy, G. H. 1985. Synopsis of biological data on the pinfish, Lagodon rhomboids (Pisces: Sparidae). NOAA Tec. Rep. NMFS23, FAO Fisheries Synopsis No. 141. Davis, H. C. 1958. Survival and growth of clam and oyster larvae at different salinities. Biol. Bull. (Woods Hole) 114:296-307 Davis. 1958. As cited in : Killam K. A., R. J. Hochberg, and E. C. Rzemian, 1992. Synthesis of basic life histories of Tampa Bay species. Technical Publication #10-92. Prepared for Tampa Bay National Estuary Program. St. Petersburg, FL. Dawes, C. 1981. Marine Botany. John Wiley and Sons Publishers, New York. Dawes, C. J., S.A. Earle, and F.C. Croley. 1967. The offshore benthic flora of the southwest coast of Florida. Bull. Mar. Sci. 17(1):212-231. Dawson, C. E. Jr. 1953. A survey of the Tampa Bay area. Fla. State Board Conserv. Mar. Lab. Tech. Ser. 8. 39pp. Day, J.W., Jr., C.A.S Hall, W.M Kemp, and A. Yáñez-Arancibia. 1989. Estuarine Ecology. Wiley Interscience. New York, NY. Delbeek, J. C. 2002. Fish biology osmoregulation: please give me a drink! Website http://www2.hawaii.edu/~delbeek/delb11.html Del Bene, J. V., G. Jirka, and J. Largier. 1994. Ocean brine disposal. Desalination 97:365. Eldred, B., J. Williams, G. T. Martin, and E. A. Joyce, Jr. 1965. Seasonal distribution of penaeid larvae and postlarvae of the Tampa Bay area, Florida. Fla. Board Conserv. Mar. Lab. Tech. Ser. 44:1-47. Eleuterius, L. N. 1984. Autecology of the black needlerush, Jancus roemerianus. Gulf Research Repts. 7:339-350. Encarta website encyclopedia, 2002.http://encarta.msn.com/find/ concise.asp?mod=1&ti=04583000
Anclote Salinity Tolerances October 2003
6-4
Eversole, A. G. 1987. Species profiles: life histories and environmentalrequirements of coastal fishes and invertebrates (South Atlantic) – hard clam. U.S. Fish Wildl. Ser. Biol. Rep 82(11.75). U. S. Army Corps of Engineers, TR EL-82-4. Farrell, D. 1992. Personal communication from D. Farrell, Florida Department of Environmental Regulation, Tampa, FL to R. Hochberg, March 1992. Fell, P. E., P.A. Knight, And W. Rieder. 1989. Low-salinity tolerance of and salinity-induced dormancy in the estuarine sponge Microciona prolifera (Ellis etSolander) under long-term laboratory culture. Marine Biology and Ecology133:195-211. Fernandez, M. 1990. Surface-Water Hydrology and Salinity of the Anclote River Estuary, Florida. U. S. Geological Survey Water Resources Investigations Reports89-4046. Florida Department Of Environmental Protection (Fdep). 1998. Anclote KeyState Preserve Unit Management Plan. FDEP/Division of Recreation and Parks. Tallahassee, FL. Florida Fisheries Independent Monitoring Program (Fimp). Unpublished Data. obtained from Bob McMichael, FDNR-FMRI. St. Petersburg, FL. Florida Fisheries Independent Monitoring Program 1990 (Fimp). 1990 Annual report. Compiled by Florida Dept. of Nat. Res., Florida Mar. Res. Inst., Juvenile fish group, St. Petersburg, FL. Florida Fisheries Independent Monitoring Program 1989 (Fimp). 1989 Annual Report. Compiled by Florida Dept. of Nat. Res., Florida Mar. Res. Inst., Juvenile fish group, St. Petersburg, FL. Floyd, W. R. 1977. Effects of temperature and salinity on the larval development of the grass shrimp Palaemonetes pugio reared in the laboratory. Va. J. Sci. 28:92. Fonseca, M. 1992. Unpublished data obtained form M. Fonseca, Nation MarineFisheries Service, Beauford, NC to K. Killam. Frazer, T.K., S.K. Notestein, J.A. Hale, M.V. Hoyer, and D.E. Canfield, Jr. 2001. Water quality characteristics of the nearshore gulf coast waters adjacent to Pasco County: Project COAST 2000. Southwest Florida Water Management District. Tampa, FL Funderbburk, S. L, S. J. Jordan, J. A. Mihursky and D. Riley, Eds. 1991. Habitat Requirements for Chesapeake Bay Living Resources. 2nd ed. Prepared for Living Res. Subcommittee Ches. Bay Program by Habitat Objectives Workgroup Living Res. Sub. And Ches. Res. Cons. Ins. Solomons, MD.
Anclote Salinity Tolerances October 2003
6-5
Galtsoff, P.S. 1964. The American oyster Crassostrea virginica Gmelin. U.S. Fish Wildl. Serv. Fish. Bull. 64. 480 pp. Gilbert, C. 1986a. Species profiles: life histories and environmental requirements of coastal fishes and invertebrates (South Florida) – Florida pompano. U. S. Fish Wildl. Ser. FWS/OBS-82(11.42). U. S. Army Corps of Engineers, TR EL-82-4. Gilbert, C. 1986b. Species profiles: life histories and environmental requirements of coastal fishes and invertebrates (South Florida) – southern, gulf, and summer flounders. U. S. Fish Wildl. Ser. FWS/OBS-82(11.54). U. S. Army Corps of Engineers, TR EL-82-4. Godcharles, M. F. and M. D. Murphy. 1986. Species profiles: life histories and environmental requirements (South Florida) – Spanish mackerel and king mackerel. U. S. Fish Wildl. Serv. FWS/OBS-82(11.58). U. S. Army Corps of Engineers, TR EL-82-4. Goldberg, W. 1973. Ecological aspects of salinity and temperature tolerances of some reef-dweling gorgonians from Florida. Journal of Caribbean Science 13:173-177. Grabe, S. A., C. M. Courtney, Z. Lin, D. Alberdi, H. T. Wilson, Jr., and G. Blanchard. Environmental Monitoring and Assessment Program – Estuaries West Indian Province1993 Sampling, vol. 3. Executive Summary: A Synoptic Survey of the Benthic Macroinvertebrates and Demersal Fishes of the Tampa Bay Estuarine System. Tampa Bay National Estuary Program Technical Publication #95 – 12. Guerin, J. L. and Stickle, W. B. 1997. Effect of salinity on survival and bioenergetics of juvenile lesser blue crabs, Callinectes similis. Marine Biology 129:63-69. Gunter, G. 1945. Studies on Marine Fishes of Texas. Publ. Inst. Mar. Sci. Univ. Tex. 1:1-190. Gunter, G. 1956. Principles of shrimp fishery management. Proc. Gulf Caribb. Fish. Inst.6:99-106. Haddad, K. D., G. Mcgarry, F. Sargent, R. Matheson, Jr., D. A. Rydene, K. M.Peters, C. Friel, H. A. Norris, and T. LearY. 1992. Marine Resources GIS and Fisher Resources.Final Report. FDNR, Nat. Res. FL. Marine Research Institute, St.Petersburg, FL. Harper, D. E., JR. 1973. The distribution of benthic and nektonic organisms in undredged control areas of San Antonio Bay In Environmental Impact Assessment of Shell Dredging in San Antonio Bay, Texas. ,Appendix B-10-A. Texas A&M University, College Station, TX. 3:1-157. Hedgepath, J. W. 1967. Ecological aspects of the Laguna Madre, a hypersaline estuary. In G. H. Lauff ed. Estuaries. American Assoc. for the Advancement of Science Publ. No. 83.
Anclote Salinity Tolerances October 2003
6-6
Hildebrand, H. H. 1958. Estudios biologicos preliminares sobre la Laguna Madre de Tamaulipas, Ciencia (Mexico) 17:151-173. Holland, J. S. And D. V. Aldrich, And K. Strawn. 1971. Effects of temperature and salinity on growth food conversion, survival and temperature resistance of juvenile blue crabs, Callinectes sapidus Rathbun. Texas A&M Univ. Sea Grant Publ. TAMU-SG-71-222. Holt, J., R. Godbout, and C. ArnolD, 1981. Effects of temperature and salinity on egg hatching and larval survival of red drum, Sciaenops ocellata. U. S. Natl. Mar. Fish. Ser. Fish. Bull. 79:569-573. Jagels, R. 1973. Studies of a marine grass, Thalassia testudinum. Ultrastructure of the osmoregulatory leaf cells. American Journal of Bontany 60:1003-1009. Jennings, C. A. 1985. Species profiles: life histories and environmental requirements of coastal fishes and invertebrates (Gulf of Mexico) – sheepshead. U. S. Fish Wildl. Ser. FWS/OBS-82(11.29). U. S. Army Corps of Engineers, TR EL-82-4. Janicki Environmental, Inc. 2003. A hydrodynamic model of the Nearshore and Offshore Waters Adjacent to the Proposed Tampa Bay Water Gulf Coast Desalination Facility. Prepared for: Tampa Bay Water, Clearwater, FL. Jokiel, P. L. and Coles, S. L. 1977. Effects of temperature on the mortality and growth Of Hawaiian reef corals. Marine Biology 43:201-208. Johnson, G. D. 1978. Deveopment of fishes in the Mid-Atlantic Bight. Vol. IV. Carangidae through Ephippidae. U. S. Fish Wildl. Serv. Bio. Serv. Program FWS/OBS-78/12. Josselyn, M. 1983. The ecology of San Francisco Bay tidal marshes: a community profile. U. S. Fish Wildl. Serv, Biol. Serv. Profam FWS/OBS-83/23. Kilby, J. D. 1955. The fishes of two Gulf coastal marsh areas of Florida. Tulane Stud. Zool. 2:173-247. Killam, K., R. J. Hochberg, and E. C. Rzemien. 1992. Distribution of selected fish species in Tampa Bay. Technical Report #05-92. Prepared for the Tampa Bay Estuary Program. St. Petersburg, FL. Kirby, D. F. and R. E. Knowlton. 1976. Salinity tolerance and sodium balance in the prawn Palaemonetes pugio Holthius. Am. Zool. 16:240. Knauss, J. A. 1997. Introduction to Physical Oceanography. Second Edition, Prentice Hall, Upper Saddle River, NJ.
Anclote Salinity Tolerances October 2003
6-7
Knowlton, R. E. and D. F. Kirby. 1984. Salinity tolerance and sodium balance in the prawn Palaemonetes pugio Holthius, in relation to other Palaemonetes spp. Comp. Biochem. Physiol. 77A:425-430. Kostecki, P.T. 1984. Habitat Suitability Index Models: Spotted Seatrout. USFWS FWS/OBS-82/10.75. Lassuy, D. R. 1983a. Species profiles: life histories and environmental requirements (Gulf of Mexico) – spotted seatrout. U. S. Fish Wildl. Serv. FWS/OBS-82(11.4). U. S. Army Corp of Engineers, TR EL-82-4. Lassuy, D. R. 1983b. Species profiles: life histories and environmental requirements (Gulf of Mexico) – Atlantic croaker. U. S. Fish Wildl. Serv. FWS/OBS-82(11.3.) U. S. Army Corp of Engineers, TR EL-82-4. Latham, P.J., L.G. Pearlstine, and W.M. Kitchens. 1994. Species association changes across a gradient of freshwater, oligohaline and mesohaline tidal marshes along the lower Savannah River. Wetlands 14: 174-183. Lee, C. and Menu, B. 1981. Effects of salinity on egg development and hatching in grey mullet Mugil cephalus L. Journal of Fish Biology 19:179-188. Lewis, R. R., Iii And E. D. Estevez. 1988. The ecology of Tampa Bay, Florida: an estuarine profile. U. S. Fish. Wildl. Ser. Biol. Rep. 85 (7-18). Lindberg, W. J. And M. J. Marshall. 1984. Species profiles: life histories and environmental requirements (South Florida) – stone crab. U. S. Fish Wildl. Serv. FWS/OBS-82(11.21). U. S. Army Corp of Engineers, TR EL-82-4. Littler, D. S., M. M. Littler, K. E. Bucher, and J. N. Norris. 1998. Marine Plants of the Caribbean, a Field Guide from Florida to Brazil. Smithsonian Institution Press, Washington D. C. Longly, W. L. 1994. Freshwater inflows to Texas bays and estuaries: ecological relationships and methods for determination needs. Texas Water Development Board and Texas Parks and Wildlife Department, Austin, TX. 386 pp. Loosenoff, V. L. and H. C. Davis. 1963. Rearing of bivalve mollusks. Adv. Mar. Biol. 1:1-136. Mahall, B. E. and R. B. Park. 1976. The ecotone between Spartina foliosa Trin. and Salicornia virginica L. in salt marshes of northern San Francisco Bay. II. Soil, water, and salinity. J. Ecology 64:793-810
Anclote Salinity Tolerances October 2003
6-8
Matthews, G. A., C. A. Marcin, and G. L. Clements. 1974. A plankton and benthos survey of the San Antonio Bay system. Report to Texas Water Development Board, by Texas Parks and Wildlife Department, Austin, TX. Mckenney C. L. and J. M. Neff. 1979. Individual effects and interactions of salinity, temperature, and zinc on larval development of the grass shrimp Palaemonetes pugio. 1. Survival and development duration through metamorphosis. Mar. Biol. 52:177-188. McMichael, R.H. Jr., and K.M. Peters. 1989. Early life history of spotted seatrout Cynoscion nebulosus (Pisces:Scianenidae), in Tampa Bay, Florida. Estuaries 12(2):98-110. McMillan, C. 1974. Salt tolerance of mangroves and submerged aquatic plants. In R. J. Reimold and W. H. Queens (eds.). Ecology of halophytes. Academic Press, New York, NY. Mcmillan, C. and F. N. Moseley. 1967. Salinity tolerances of five marine spermatophytes of Redfish Bay, Texas. Ecology 48:503-506. Montagne, P. A. and R. D. Kalke. 1989a. A synoptic comparison of benthic communities and processes in the Guadalupe and Lavaca-Tres Palacios estuaries, Texas. Report to Texas Water Development Board, by Marine Science Institute, University of Texas at Austin, Port Aransas, TX. Montagne, P. A. And R. D. Kalke. 1989b. The effect of freshwater inflow to meiofaunal and macrofaunal populations in San Antonio, Nueces, and Corpus Christi Bays, Texas. Report to Texas Water Development Board, by Marine Science Institute, University of Texas at Austin, Port Aransas, TX. Montague, C. and J. A. Ley. 1993. A possible effect of salinity fluctuation on abundance of benthic vegetation and associated fauna in northeastern Florida Bay. Estuaries 16:703-717. Mooring, M. T., A. W. Cooper, And E. D. Seneca. 1971. Seed germination response and evidence for high ecophenes in Spartina alterniflora from North Carolina. Am. J. Bot. 58:48-55. Moran, D. 1988. Species profiles: life histories and environmental requirementsof coastal fishes and invertebrates (Gulf of Mexico) – red snapper. U. S. Fish Wildl. Ser. FWS/OBS-82(11.83). U. S. Army Corps of Engineers, TR EL-82-4. Morgan, M. D. 1980. Grazing and predation of the grass shrimp Palaemonetes pugio. Limnol. And Oceanogr. 25:896-902.

Anclote Salinity Tolerances October 2003
6-9
Moser, M. L. and Miler, J. M. 1994. Effects of salinity fluctuation on routine metabolism of juvenile spot, Leiostomus xanthurus. Journal of Fish Biology 45:335- 340. Mote Marine Laboratory. 1991. Anclote Power Plant Monitoring Studies. Prepared for: Florida Power Corporation, St. Petersburg, FL. Muncy, R. J. 1984. Species profiles: life histories and environmental requirements of coastal fishes and invertebrates (Gulf of Mexico) – white shrimp. U. S. Fish Wildl. Ser. FWS/OBS-82/11.20. U. S. Army Corps of Engineers, TR EL-82-4. Muthiga, N.A. and A. M Szmant. 1987. The effects of salinity stress on the rates of aerobic respiration and photosynthesis in the hermatypic coral Siderastrea siderea. Biol. Bull. 173:539-551. Newcombe, C. L. 1945. The biology and conservation of the blue crab, Callinectes sapidus Rathbun. Virginia Fisheries Laboratory. Educational Series 4:1-39. Odum, W. E., T. J. Smith III, J. K. Hoover, C. C. and Mcivor. 1990. The ecology of tidal freshwater marshes of the United States East Coast: a community profile. U. S. Fish and Wildlife Service, FWS/OBS-87/17, Washington D. C. Odum, W. E. and Mcivor, C. C. 1990. Mangroves. In Ecosystems of Florida, R. L. Myers and J. L. Ewel eds. University of Central Florida Press, Orlando. Characteristics of the Gulf of Mexico Estuaries. Silver Spring, MD: Nation Oceanic and Atmospheric Administration, Office of Ocean Resources Conservation and Assessment. Ortiz, R., G. A. J. Worthy, and D. S. Mackenzie. 1998. Osmoregulation in wild and captive West Indian manatees (Trichechus manatus). Physiological Zoology 71:449-457. Ortiz, R., D. S. Mackenzie, and G. A. J. Worthy. 2000. Thyroid hormone concentrations in captive and free-ranging West Indian manatees (Trichechus manatus). J. Exp. Biol. 203:3631-3637. Peebles, E. B., M. S. Flannery, R. E. Matheson, Jr., and J. P. Rast. 1992. Fish nursery utilization of the Little Manatee River estuary: relationship to physiochemical gradients and the distribution of food resource. In S. F. Treat and P. A. Clarke (eds.). Proceedings, Tampa Bay Area Scientific Symposium 2, 341-368. Peebles, E. B. and S. E. Davis. 1989. Riverine discharge and estuarine fishnurseries: first annual report for the ichthyoplankton survey of the Little Manatee River, Florida. Prepared for the Florida Department of Environmental Protection and the Southwest Florida Water Management District.
Anclote Salinity Tolerances October 2003
6-10
Perry, H. M. and T. D. Mcilwain. 1986. Species profiles: life histories and environmental requirements of coastal fishes and invertebrates (Gulf of Mexico)—blue crab. U. S Fish and Wildl. Serv. Biol. Rep. 82(11.55). U. S. Army Corps of Engineers. TR EL-82-4. Peters, K. and R. Mcmichael, Jr. Unpublished manuscript. Early life history notes on silver perch (Bairdiella chrysoura), sand seatrout (Cynoscion arenarius), spot (Leisostomus xanthurus) and three kingfish (Menticirrhus americanus, M. littoralis, and M. saxatilis) from Tampa Bay, Florida, FDNR, FMRI. Peters, K. and R. Mcmichael, Jr. 1987. Early life History of the red drum, Sciaenops ocellatus (Pisces: Sciaenidae), in Tampa Bay, Florida. Estuaries 10:92-107. Phillips, R. C. 1960. Observations on the ecology and distribution of the Florida seagrasses. Fla. Board Conserv. Mar. Lab. Prof. Pap. Ser. 2:1-72. Pierce D. J. and B. Mahmoudi. 2001. Nearshore fish assemblages along the central west coast of Florida. Bul. Mar. Sci. 68: 243-270. Porter, J. W., Lewis, S. K., and Porter, K. 1999. The effect of multiple stressors on the Florida Keys coral reef ecosystem: a landscape hypothesis and a physiological test. Limnology and Oceanography 44:941-949. Pulich, W. M., JR. 1990. Effects of freshwater inflows on estuarine vascular plants of Texas Bay systems. I. San Antonio Bay. Report to Texas Water Development Board, by Resource Protection Division, Texas Parks and Wildlife Department, Austin, TX. Pulich, W. M., JR. 1985. Seasonal growth dynamics of Ruppia maritime L. and Halodule wrightii Aschers in southern Texas and elevation of sediment fertility status. Aquat. Ecol. 23:53-66. Reagan, R. 1985. Species profiles: Life histories and environmental requirementsof coastal fishes and invertebrates (Gulf of Mexico)—red drum. U. S. Fish Wildl.Serv. Biol. Rpt. 82(11:36). U. S. Army Corps of Engineers, TR EL--82--4. Reid, G. K., Jr. 1954. An ecological study of the Gulf of Mexico fishes in the vicinity of Cedar Key, Florida. Bul. Mar. Sci. Gulf Caribb. 4:1-94. Richmond, C. E. and Woodin, S. A. 1999. Effect of salinity reduction on oxygen consumption by larval estuarine invertebrates. Marine biology 134: 259-267. Robinette. H. R. 1983. Species profiles: life histories and environmental requirements of coastal fishes and invertebrates (Gulf of Mexico)—bay anchovy and striped anchovy. USFWS/OBS—82/11.14.
Anclote Salinity Tolerances October 2003
6-11
Rutherford, E. S., T. Schmidt, and J. Tilman. 1986. The early life history of spotted seatrout, red drum, grey snapper, and snook in Everglades National Park, Florida. South Florida Research Center Report. SFRC—86/07. Sandifer, P. A. 1973. Effects of temperature and salinity on larval developmentof grass shrimp Palaemonetes vulgaris (Decapoda, Caridea). U. S. Natl. Mar.Fish. Ser. Fish. Bull. 71:115-123. Seaman, W., Jr. and M. Collins. 1983. Species profiles: life histories and environmental requirements of coastal fishes and invertebrates (South Florida)—snook. U. S. Fish and Wildl. Serv. FWS/OBS-82/11.16. U. S. Army Corps of Engineers, TR EL-82-4. Semiat, R. 2000. Desalination: present and future. Desalination 25:54-65. Seneca, E. D. 1974. Germination and seedling response of Atlantic and Gulf coast populations of Spartina alterniflora. Am J. Bot. 61:987. Simmons, E. G. 1957. Ecological survey of the upper Laguna Madre of Texas. Publ. Inst. Mar. Sci. Univ. Texas 4:156-200. Simon,J. L. and D. M. Dauer. 1977. Reestablishment of a benthic communityfollowing natural defaunation. In: Ecology of Marine Benthos, 139-154. University of South Carolina Press. Simpson, D. G. And G. Gunter. 1956. Notes on habitats, systematic characteristics and life histories of Texas salt water cyprinodonts. Tulane Stud. Zool. 4:115-134. Springer, V. G. and K. D. Woodburn. 1960. An ecological study of the fishes of the Tampa Bay area. St. Petersburg, Florida. Florida State Board. Conserv. Mar. Res. Lab. Prof.Paper Ser. 1:1-104. Stenzel, H.B. 1971. Oysters. In: Treatise on invertebrate paleontology. Part N, Vol. 3. Mollusca 6. K.C. Moore,ed. Geol. Soc. Am., Boulder, Colo. and University of Kansas, Lawrence. Strawn, K. 1961. Factors influencing the zonation of submerged cotyledons at Cedar Key, Florida. J. Wildl. Manage. 25(2) 178-189. Sutter, F. C. And T. D. Mcilwain. 1987a. Species profiles: life histories and environmental requirements of coastal fishes and invertebrates (Gulf of Mexico)– sand seatrout and silver seatrout. U. S. Fish Wildl. Ser. FWS/OBS-82(11.72). U. S. Army Corps of Engineers, TR EL-82-4.
Anclote Salinity Tolerances October 2003
6-12
Sutter, F. C. And T. D. Mcilwain. 1987b. Species profiles: life histories and environmental requirements of coastal fishes and invertebrates (Gulf of Mexico) – pigfish. U. S. Fish Wildl. Ser. FWS/OBS-82(11.71). U. S. Army Corps of Engineers, TR EL-82-4. Swingle, H. A. 1971. Biology of Alabama estuarine areas – cooperative Gulf of Mexico estuarine inventory. Ala. Mar. Res. Bull. 5:1-123. Sylvester, J., C. Nash, and C. Emmerson. 1975. Salinity and oxygen tolerances of eggs and larvae of Hawaiian striped mullet, Mugil cephalus L. Journal of Fish Biology 65:369-379. Tabb, D. C., D. L. Dubrow, and A. E. Jones. 1962. Studies on the biology of the pink shrimp, Penaeus duorarum Burkenroad, in Everglades National Park, Florida. Fla. State Board Conserv. Mar. Res. Lab. Tech. Ser. 37:1-32. Taniguchi, A. K. 1980. Effects of salinity, temperature, and food abundance upon survival of spotted seatrout eggs and larvae. Proceedings of the Colliquim on the Biology and Management of Red Drum and Seatrout. Gulf States Mar. Fish. Comm. Rep. 5:16 (Abstract). Taylor, J. L. and C. H. Saloman. 1970. Benthic Project In J. E. Sykes (ed.) Report of the Bureau of Commercial Fisheries Biological Laboratory, St. Petersburg Beach, Florida, Fiscal Year 1969. U. S. Fish Wildl. Serv. Circ, 3-10. Texas Parks and Wildlife Department (Tpwd). 1990a. Marine resource monitoring manual: 1990. Coastal Fisheries Branch, Austin, TX. Thue, F.B., E. S. Rutherford, D. G. Buker. 1982. Age, growth and mortality of the common snook, Centropomis undecimalis, in Everglades National Park, S. Florida Res. Center. Thurman, H. V. 1993. Essentials of Oceanography. 4th ed. McMillan Publishing Co., New York, NY. Towle, D. W. 1997. Molecular approaches to understanding salinity adaptation or estuarine animals. American Zoologist 37:575-584. Turner, H. J. 1953. A review of the biology of some commercial molluscs of the east coast of North America In 6th Report on Investigations of shellfisheries of Massachusetts DNR. Div. Mar. Res. Commonw. Mass. Boston. Vanhems, C. 2002. Critical Review of Desalination Concentrate Disposal to Surface Water Website, http://www.geocities.com/cvanhems/intro.html
Anclote Salinity Tolerances October 2003
6-13
Water and Air Research (War) and SDI Environmental Services. 1995. Second interpretive report: Tampa Bypass Canal and Hillsborough River hydrobiological monitoring program. vol. 1 of 3. Prepared for WCRWSA, Tampa, FL. Document No. 93-5300. Weinstein, M. P., C. M. Courtney, and J. C. Kinch. 1977. The Marco Island estuary: a summary of physiochemical and biological parameters. Florida Scientist 40:197-224. White, W. A., T. R. Calnan, R. A. Morton, R. S. Kimble, T. G. Littleton, J. H. Mcgowan, and H. S. Nance. 1989. Submerged lands of Texas, Port Lavaca area: sediments, geochemistry, benthic macroinvertebrates, and associated wetlands. Bureau of Economic Geology, University of Texas at Austin, Austin, TX. Special Publication. Wood, C. E. 1967. Physioecology of the grass shrimp Palaemonetes pugio, in the Galveston Bay estuarine system. Contrib. Mar. Sci. Univ. Tex. 12:54-79. Wohlschlag, D. E. 1977. Analysis of freshwater inflow effects on metabolic stresss of south Texas Bay and estuarine fishes: continuation and extension. Report to Texas Water Development Board, by Marine Science Institute, University of Texas at Austin, Port Aransas, TX. Wolfe, S. H. and R. D. Drew. 1990. An ecological characterization of the Tampa Bay watershed. U. S. Fish and Wildl. Ser. Biol. Rep, 90(20). Zale, A. V. and S. G. Merrifield. 1989. Species profiles: life histories and environmental requirements of coastal fishes and invertebrates (South Florida) – ladyfish and tarpon. Fish and Wildl. Ser. Biol. Rep. 82(11.104). Zedler, J. B. and P. A. Beare. 1986. Temporal variability of saltmarsh vegetation: the role of low salinity gaps and environmental stress. In D. Wolfe (ed.). Estuarine Variability. Academic Press, New York, NY.
Anclote Salinity Tolerances October 2003
A-1
APPENDIX A
FISH: Salinity Tolerance and Salinity Range Information
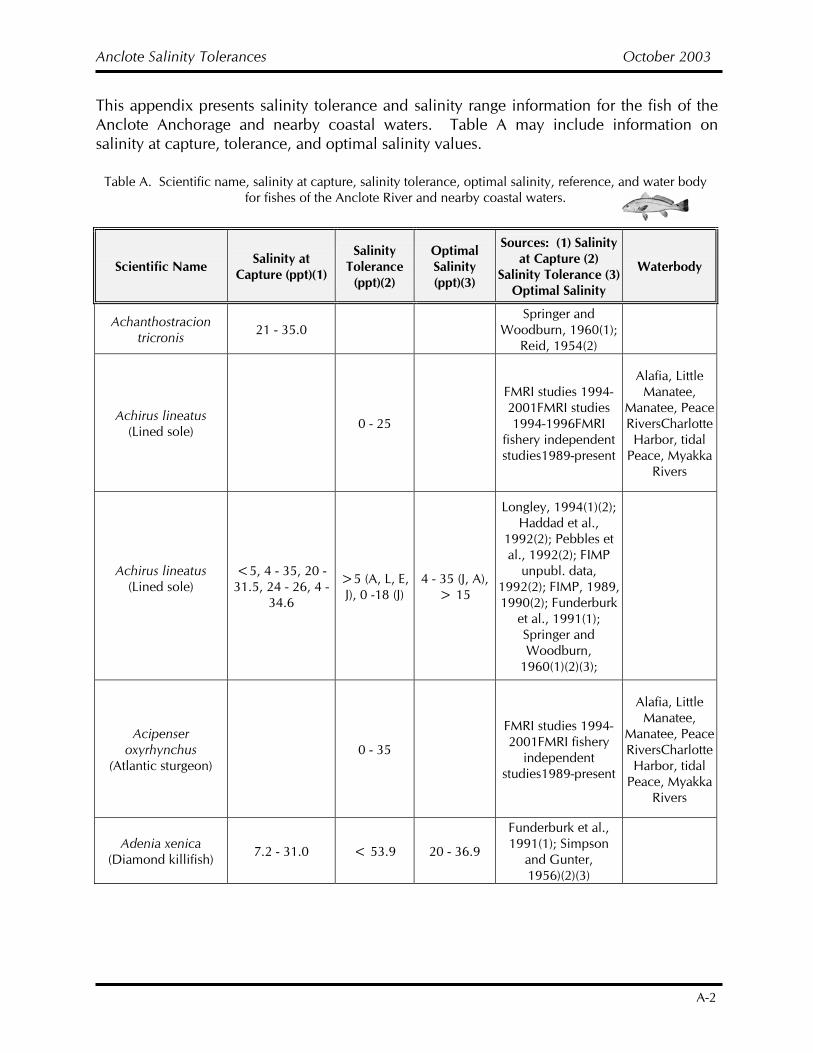
Anclote Salinity Tolerances October 2003
A-2
This appendix presents salinity tolerance and salinity range information for the fish of the Anclote Anchorage and nearby coastal waters. Table A may include information on salinity at capture, tolerance, and optimal salinity values.
Table A. Scientific name, salinity at capture, salinity tolerance, optimal salinity, reference, and water body for fishes of the Anclote River and nearby coastal waters.
Scientific Name Salinity at Capture (ppt)(1)
Salinity Tolerance
(ppt)(2)
Optimal Salinity (ppt)(3)
Sources: (1) Salinity at Capture (2)
Salinity Tolerance (3) Optimal Salinity
Waterbody
Achanthostracion tricronis 21 - 35.0
Springer and Woodburn, 1960(1);
Reid, 1954(2)
Achirus lineatus (Lined sole) 0 - 25
FMRI studies 1994-2001FMRI studies 1994-1996FMRI
fishery independent studies1989-present
Alafia, Little Manatee,
Manatee, Peace RiversCharlotte Harbor, tidal
Peace, Myakka Rivers
Achirus lineatus (Lined sole)
<5, 4 - 35, 20 - 31.5, 24 - 26, 4 -
34.6
>5 (A, L, E, J), 0 -18 (J)
4 - 35 (J, A), > 15
Longley, 1994(1)(2); Haddad et al.,
1992(2); Pebbles et al., 1992(2); FIMP
unpubl. data, 1992(2); FIMP, 1989, 1990(2); Funderburk
et al., 1991(1); Springer and Woodburn,
1960(1)(2)(3);
Acipenser oxyrhynchus
(Atlantic sturgeon) 0 - 35
FMRI studies 1994-2001FMRI fishery
independent studies1989-present
Alafia, Little Manatee,
Manatee, Peace RiversCharlotte Harbor, tidal
Peace, Myakka Rivers
Adenia xenica (Diamond killifish) 7.2 - 31.0 < 53.9 20 - 36.9
Funderburk et al., 1991(1); Simpson
and Gunter, 1956)(2)(3)
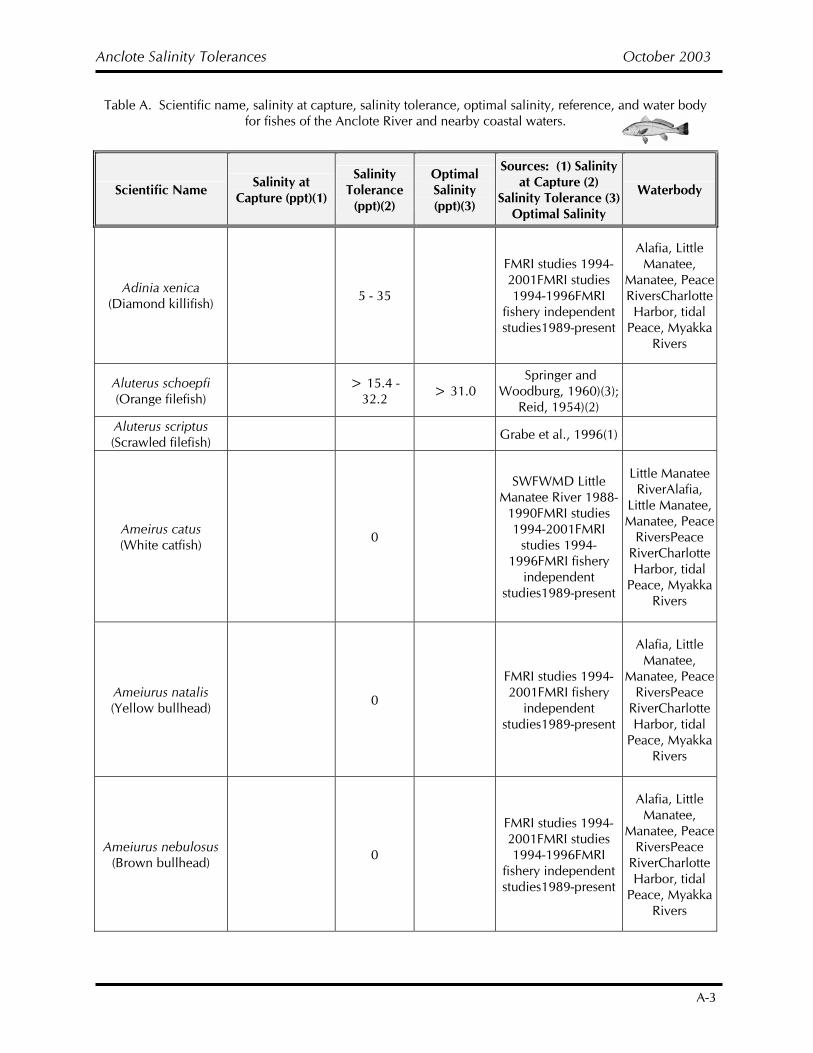
Anclote Salinity Tolerances October 2003
A-3
Table A. Scientific name, salinity at capture, salinity tolerance, optimal salinity, reference, and water body for fishes of the Anclote River and nearby coastal waters.
Scientific Name Salinity at Capture (ppt)(1)
Salinity Tolerance
(ppt)(2)
Optimal Salinity (ppt)(3)
Sources: (1) Salinity at Capture (2)
Salinity Tolerance (3) Optimal Salinity
Waterbody
Adinia xenica (Diamond killifish) 5 - 35
FMRI studies 1994-2001FMRI studies 1994-1996FMRI
fishery independent studies1989-present
Alafia, Little Manatee,
Manatee, Peace RiversCharlotte Harbor, tidal
Peace, Myakka Rivers
Aluterus schoepfi (Orange filefish) > 15.4 -
32.2 > 31.0 Springer and
Woodburg, 1960)(3); Reid, 1954)(2)
Aluterus scriptus (Scrawled filefish) Grabe et al., 1996(1)
Ameirus catus (White catfish) 0
SWFWMD Little Manatee River 1988-
1990FMRI studies 1994-2001FMRI
studies 1994-1996FMRI fishery
independent studies1989-present
Little Manatee RiverAlafia,
Little Manatee, Manatee, Peace
RiversPeace RiverCharlotte Harbor, tidal
Peace, Myakka Rivers
Ameiurus natalis (Yellow bullhead) 0
FMRI studies 1994-2001FMRI fishery
independent studies1989-present
Alafia, Little Manatee,
Manatee, Peace RiversPeace
RiverCharlotte Harbor, tidal
Peace, Myakka Rivers
Ameiurus nebulosus (Brown bullhead) 0
FMRI studies 1994-2001FMRI studies 1994-1996FMRI
fishery independent studies1989-present
Alafia, Little Manatee,
Manatee, Peace RiversPeace
RiverCharlotte Harbor, tidal
Peace, Myakka Rivers
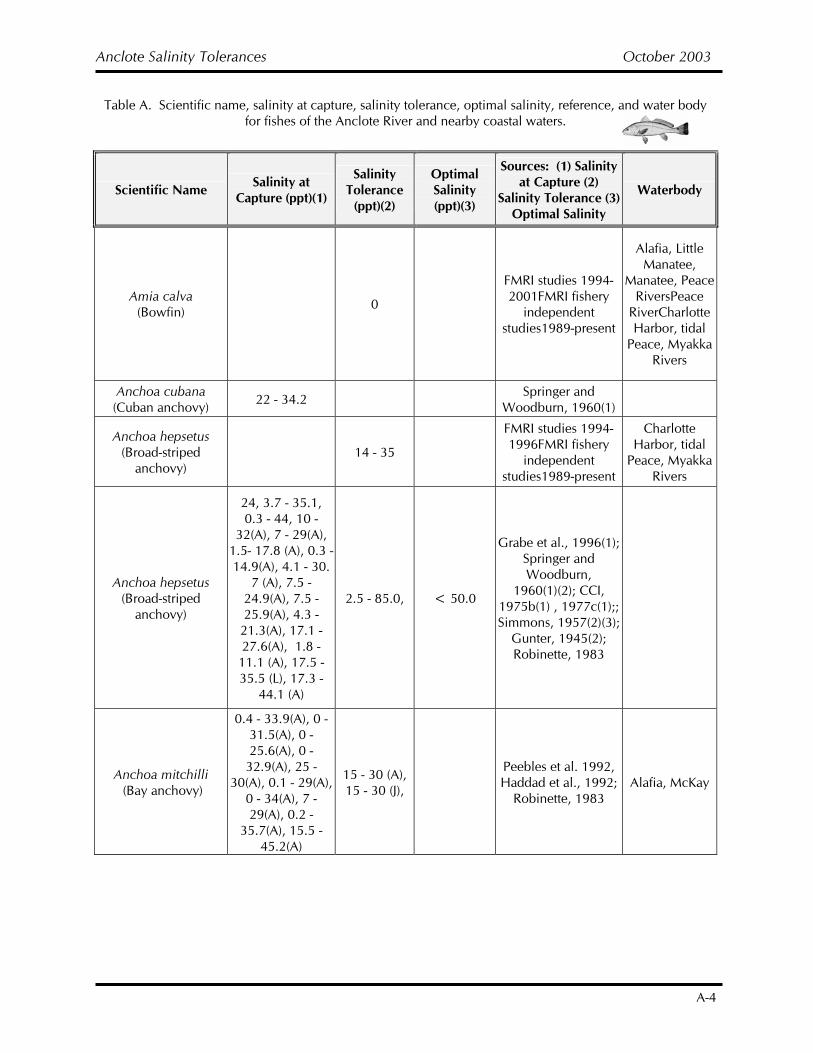
Anclote Salinity Tolerances October 2003
A-4
Table A. Scientific name, salinity at capture, salinity tolerance, optimal salinity, reference, and water body for fishes of the Anclote River and nearby coastal waters.
Scientific Name Salinity at Capture (ppt)(1)
Salinity Tolerance
(ppt)(2)
Optimal Salinity (ppt)(3)
Sources: (1) Salinity at Capture (2)
Salinity Tolerance (3) Optimal Salinity
Waterbody
Amia calva (Bowfin) 0
FMRI studies 1994-2001FMRI fishery
independent studies1989-present
Alafia, Little Manatee,
Manatee, Peace RiversPeace
RiverCharlotte Harbor, tidal
Peace, Myakka Rivers
Anchoa cubana (Cuban anchovy) 22 - 34.2 Springer and
Woodburn, 1960(1)
Anchoa hepsetus (Broad-striped
anchovy) 14 - 35
FMRI studies 1994-1996FMRI fishery
independent studies1989-present
Charlotte Harbor, tidal
Peace, Myakka Rivers
Anchoa hepsetus (Broad-striped
anchovy)
24, 3.7 - 35.1, 0.3 - 44, 10 -
32(A), 7 - 29(A), 1.5- 17.8 (A), 0.3 - 14.9(A), 4.1 - 30.
7 (A), 7.5 - 24.9(A), 7.5 - 25.9(A), 4.3 -
21.3(A), 17.1 - 27.6(A), 1.8 - 11.1 (A), 17.5 - 35.5 (L), 17.3 -
44.1 (A)
2.5 - 85.0, < 50.0
Grabe et al., 1996(1); Springer and Woodburn,
1960(1)(2); CCI, 1975b(1) , 1977c(1);; Simmons, 1957(2)(3);
Gunter, 1945(2); Robinette, 1983
Anchoa mitchilli (Bay anchovy)
0.4 - 33.9(A), 0 - 31.5(A), 0 - 25.6(A), 0 - 32.9(A), 25 -
30(A), 0.1 - 29(A), 0 - 34(A), 7 - 29(A), 0.2 -
35.7(A), 15.5 - 45.2(A)
15 - 30 (A), 15 - 30 (J),
Peebles et al. 1992, Haddad et al., 1992;
Robinette, 1983 Alafia, McKay
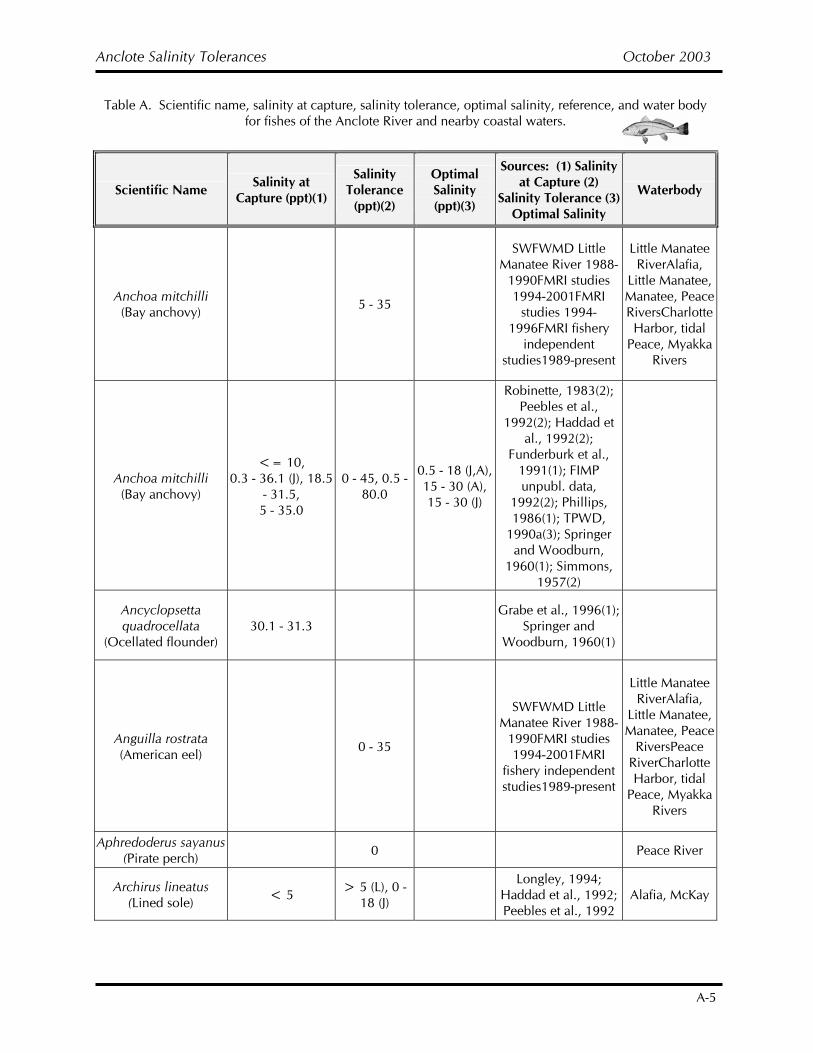
Anclote Salinity Tolerances October 2003
A-5
Table A. Scientific name, salinity at capture, salinity tolerance, optimal salinity, reference, and water body for fishes of the Anclote River and nearby coastal waters.
Scientific Name Salinity at Capture (ppt)(1)
Salinity Tolerance
(ppt)(2)
Optimal Salinity (ppt)(3)
Sources: (1) Salinity at Capture (2)
Salinity Tolerance (3) Optimal Salinity
Waterbody
Anchoa mitchilli (Bay anchovy) 5 - 35
SWFWMD Little Manatee River 1988-
1990FMRI studies 1994-2001FMRI
studies 1994-1996FMRI fishery
independent studies1989-present
Little Manatee RiverAlafia,
Little Manatee, Manatee, Peace RiversCharlotte Harbor, tidal
Peace, Myakka Rivers
Anchoa mitchilli (Bay anchovy)
<= 10, 0.3 - 36.1 (J), 18.5
- 31.5, 5 - 35.0
0 - 45, 0.5 - 80.0
0.5 - 18 (J,A), 15 - 30 (A), 15 - 30 (J)
Robinette, 1983(2); Peebles et al.,
1992(2); Haddad et al., 1992(2);
Funderburk et al., 1991(1); FIMP unpubl. data,
1992(2); Phillips, 1986(1); TPWD,
1990a(3); Springer and Woodburn,
1960(1); Simmons, 1957(2)
Ancyclopsetta quadrocellata
(Ocellated flounder) 30.1 - 31.3
Grabe et al., 1996(1); Springer and
Woodburn, 1960(1)
Anguilla rostrata (American eel) 0 - 35
SWFWMD Little Manatee River 1988-
1990FMRI studies 1994-2001FMRI
fishery independent studies1989-present
Little Manatee RiverAlafia,
Little Manatee, Manatee, Peace
RiversPeace RiverCharlotte Harbor, tidal
Peace, Myakka Rivers
Aphredoderus sayanus (Pirate perch) 0 Peace River
Archirus lineatus (Lined sole) < 5 > 5 (L), 0 -
18 (J) Longley, 1994;
Haddad et al., 1992; Peebles et al., 1992
Alafia, McKay
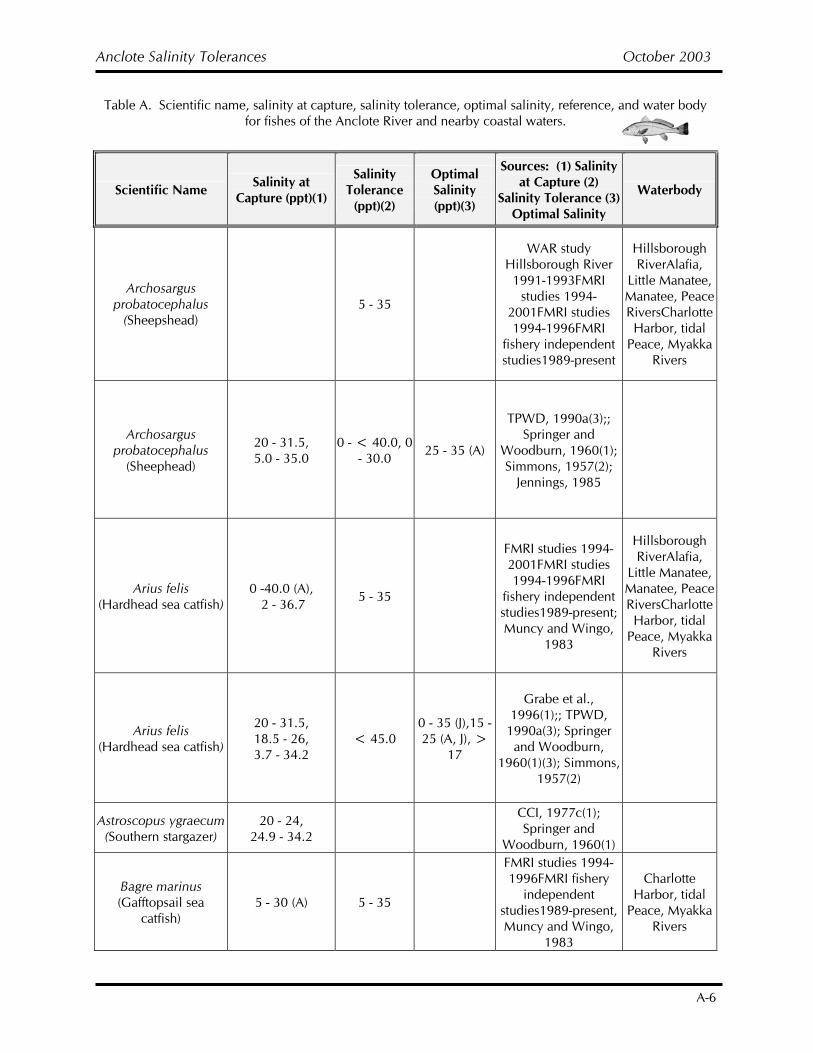
Anclote Salinity Tolerances October 2003
A-6
Table A. Scientific name, salinity at capture, salinity tolerance, optimal salinity, reference, and water body for fishes of the Anclote River and nearby coastal waters.
Scientific Name Salinity at Capture (ppt)(1)
Salinity Tolerance
(ppt)(2)
Optimal Salinity (ppt)(3)
Sources: (1) Salinity at Capture (2)
Salinity Tolerance (3) Optimal Salinity
Waterbody
Archosargus probatocephalus
(Sheepshead) 5 - 35
WAR study Hillsborough River 1991-1993FMRI
studies 1994-2001FMRI studies 1994-1996FMRI
fishery independent studies1989-present
Hillsborough RiverAlafia,
Little Manatee, Manatee, Peace RiversCharlotte Harbor, tidal
Peace, Myakka Rivers
Archosargus probatocephalus
(Sheephead)
20 - 31.5, 5.0 - 35.0
0 - < 40.0, 0 - 30.0 25 - 35 (A)
TPWD, 1990a(3);; Springer and
Woodburn, 1960(1); Simmons, 1957(2);
Jennings, 1985
Arius felis (Hardhead sea catfish)
0 -40.0 (A), 2 - 36.7 5 - 35
FMRI studies 1994-2001FMRI studies 1994-1996FMRI
fishery independent studies1989-present; Muncy and Wingo,
1983
Hillsborough RiverAlafia,
Little Manatee, Manatee, Peace RiversCharlotte Harbor, tidal
Peace, Myakka Rivers
Arius felis (Hardhead sea catfish)
20 - 31.5, 18.5 - 26, 3.7 - 34.2
< 45.0 0 - 35 (J),15 - 25 (A, J), >
17
Grabe et al., 1996(1);; TPWD,
1990a(3); Springer and Woodburn,
1960(1)(3); Simmons, 1957(2)
Astroscopus ygraecum (Southern stargazer)
20 - 24, 24.9 - 34.2
CCI, 1977c(1); Springer and
Woodburn, 1960(1)
Bagre marinus (Gafftopsail sea
catfish) 5 - 30 (A) 5 - 35
FMRI studies 1994-1996FMRI fishery
independent studies1989-present, Muncy and Wingo,
1983
Charlotte Harbor, tidal
Peace, Myakka Rivers
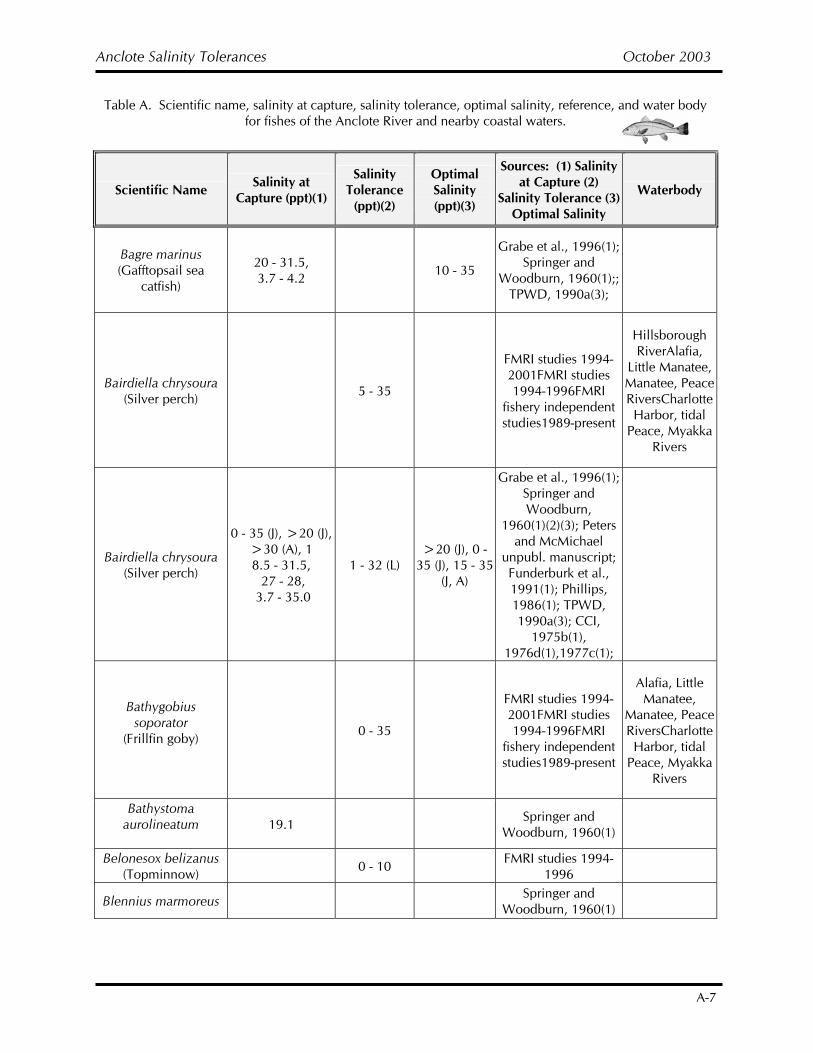
Anclote Salinity Tolerances October 2003
A-7
Table A. Scientific name, salinity at capture, salinity tolerance, optimal salinity, reference, and water body for fishes of the Anclote River and nearby coastal waters.
Scientific Name Salinity at Capture (ppt)(1)
Salinity Tolerance
(ppt)(2)
Optimal Salinity (ppt)(3)
Sources: (1) Salinity at Capture (2)
Salinity Tolerance (3) Optimal Salinity
Waterbody
Bagre marinus (Gafftopsail sea
catfish)
20 - 31.5, 3.7 - 4.2 10 - 35
Grabe et al., 1996(1); Springer and
Woodburn, 1960(1);; TPWD, 1990a(3);
Bairdiella chrysoura (Silver perch) 5 - 35
FMRI studies 1994-2001FMRI studies 1994-1996FMRI
fishery independent studies1989-present
Hillsborough RiverAlafia,
Little Manatee, Manatee, Peace RiversCharlotte Harbor, tidal
Peace, Myakka Rivers
Bairdiella chrysoura (Silver perch)
0 - 35 (J), >20 (J), >30 (A), 1 8.5 - 31.5, 27 - 28,
3.7 - 35.0
1 - 32 (L) >20 (J), 0 -
35 (J), 15 - 35 (J, A)
Grabe et al., 1996(1); Springer and Woodburn,
1960(1)(2)(3); Peters and McMichael
unpubl. manuscript; Funderburk et al., 1991(1); Phillips, 1986(1); TPWD, 1990a(3); CCI,
1975b(1), 1976d(1),1977c(1);
Bathygobius soporator
(Frillfin goby)
0 - 35
FMRI studies 1994-2001FMRI studies 1994-1996FMRI
fishery independent studies1989-present
Alafia, Little Manatee,
Manatee, Peace RiversCharlotte Harbor, tidal
Peace, Myakka Rivers
Bathystoma aurolineatum
19.1 Springer and
Woodburn, 1960(1)
Belonesox belizanus (Topminnow) 0 - 10 FMRI studies 1994-
1996
Blennius marmoreus Springer and Woodburn, 1960(1)
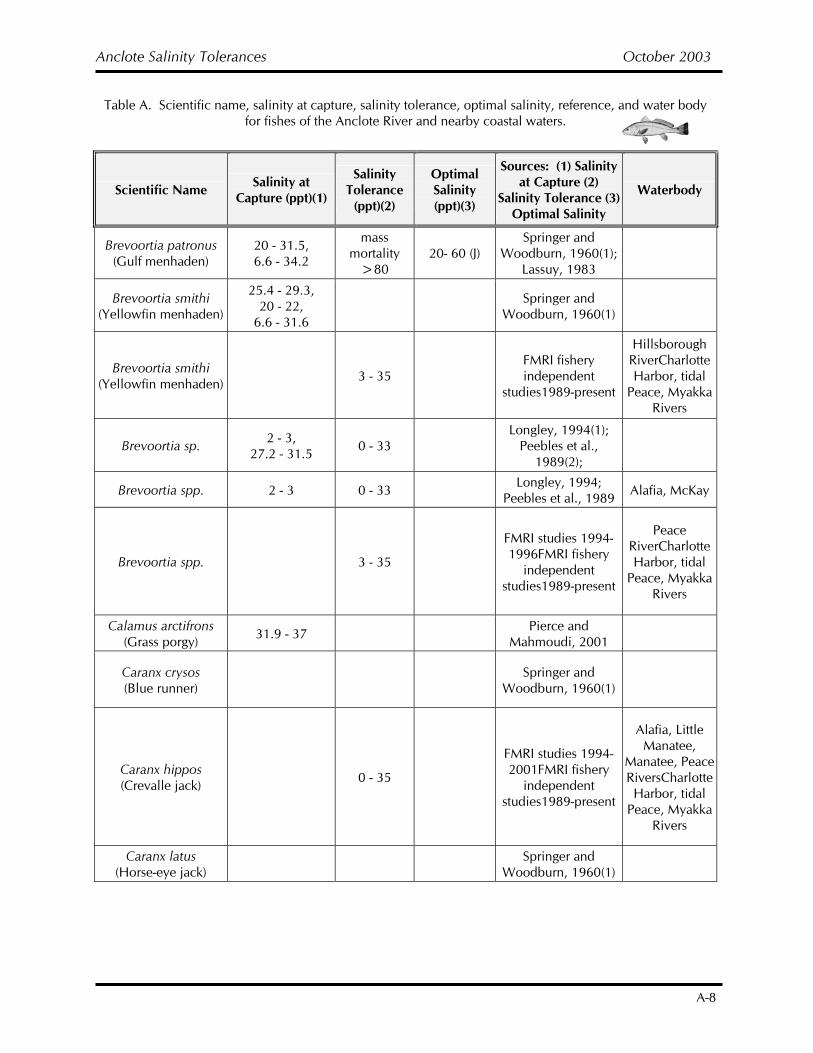
Anclote Salinity Tolerances October 2003
A-8
Table A. Scientific name, salinity at capture, salinity tolerance, optimal salinity, reference, and water body for fishes of the Anclote River and nearby coastal waters.
Scientific Name Salinity at Capture (ppt)(1)
Salinity Tolerance
(ppt)(2)
Optimal Salinity (ppt)(3)
Sources: (1) Salinity at Capture (2)
Salinity Tolerance (3) Optimal Salinity
Waterbody
Brevoortia patronus (Gulf menhaden)
20 - 31.5, 6.6 - 34.2
mass mortality
>80 20- 60 (J)
Springer and Woodburn, 1960(1);
Lassuy, 1983
Brevoortia smithi (Yellowfin menhaden)
25.4 - 29.3, 20 - 22,
6.6 - 31.6 Springer and
Woodburn, 1960(1)
Brevoortia smithi (Yellowfin menhaden) 3 - 35
FMRI fishery independent
studies1989-present
Hillsborough RiverCharlotte Harbor, tidal
Peace, Myakka Rivers
Brevoortia sp. 2 - 3, 27.2 - 31.5 0 - 33
Longley, 1994(1); Peebles et al.,
1989(2);
Brevoortia spp. 2 - 3 0 - 33 Longley, 1994; Peebles et al., 1989 Alafia, McKay
Brevoortia spp. 3 - 35
FMRI studies 1994-1996FMRI fishery
independent studies1989-present
Peace RiverCharlotte Harbor, tidal
Peace, Myakka Rivers
Calamus arctifrons (Grass porgy) 31.9 - 37 Pierce and
Mahmoudi, 2001
Caranx crysos (Blue runner) Springer and
Woodburn, 1960(1)
Caranx hippos (Crevalle jack) 0 - 35
FMRI studies 1994-2001FMRI fishery
independent studies1989-present
Alafia, Little Manatee,
Manatee, Peace RiversCharlotte Harbor, tidal
Peace, Myakka Rivers
Caranx latus (Horse-eye jack) Springer and
Woodburn, 1960(1)
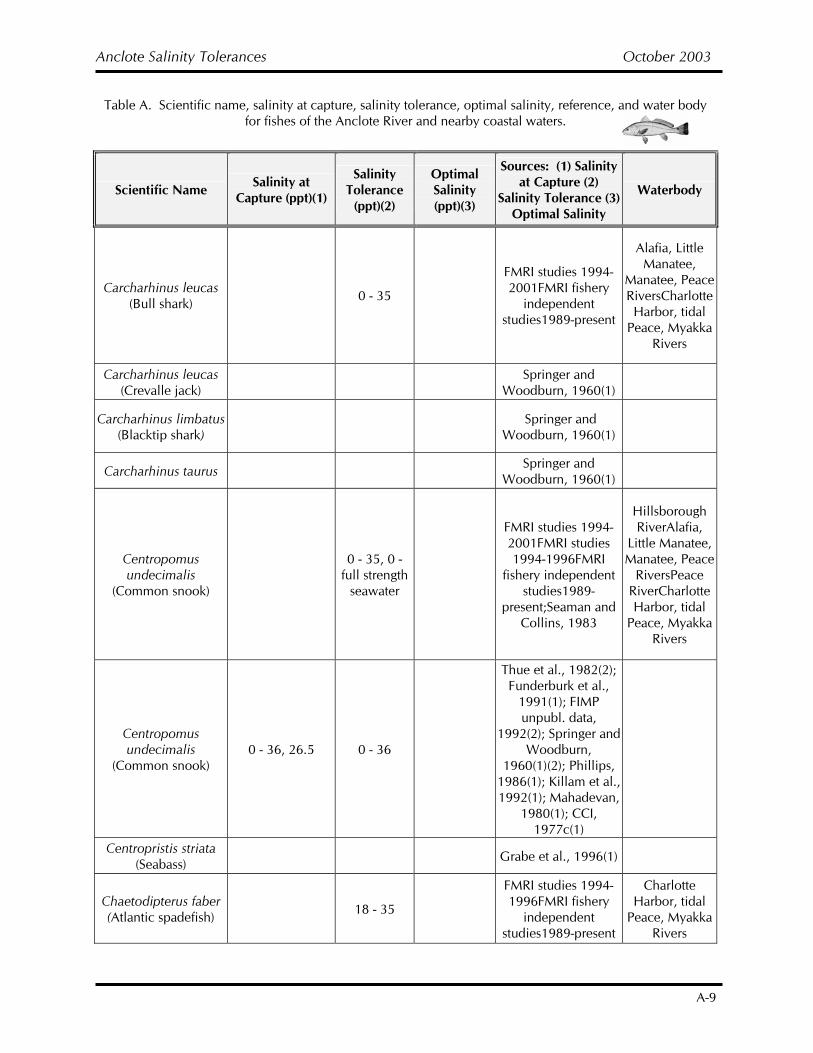
Anclote Salinity Tolerances October 2003
A-9
Table A. Scientific name, salinity at capture, salinity tolerance, optimal salinity, reference, and water body for fishes of the Anclote River and nearby coastal waters.
Scientific Name Salinity at Capture (ppt)(1)
Salinity Tolerance
(ppt)(2)
Optimal Salinity (ppt)(3)
Sources: (1) Salinity at Capture (2)
Salinity Tolerance (3) Optimal Salinity
Waterbody
Carcharhinus leucas (Bull shark) 0 - 35
FMRI studies 1994-2001FMRI fishery
independent studies1989-present
Alafia, Little Manatee,
Manatee, Peace RiversCharlotte Harbor, tidal
Peace, Myakka Rivers
Carcharhinus leucas (Crevalle jack) Springer and
Woodburn, 1960(1)
Carcharhinus limbatus (Blacktip shark) Springer and
Woodburn, 1960(1)
Carcharhinus taurus Springer and Woodburn, 1960(1)
Centropomus undecimalis
(Common snook)
0 - 35, 0 - full strength
seawater
FMRI studies 1994-2001FMRI studies 1994-1996FMRI
fishery independent studies1989-
present;Seaman and Collins, 1983
Hillsborough RiverAlafia,
Little Manatee, Manatee, Peace
RiversPeace RiverCharlotte Harbor, tidal
Peace, Myakka Rivers
Centropomus undecimalis
(Common snook) 0 - 36, 26.5 0 - 36
Thue et al., 1982(2); Funderburk et al.,
1991(1); FIMP unpubl. data,
1992(2); Springer and Woodburn,
1960(1)(2); Phillips, 1986(1); Killam et al., 1992(1); Mahadevan,
1980(1); CCI, 1977c(1)
Centropristis striata (Seabass) Grabe et al., 1996(1)
Chaetodipterus faber (Atlantic spadefish) 18 - 35
FMRI studies 1994-1996FMRI fishery
independent studies1989-present
Charlotte Harbor, tidal
Peace, Myakka Rivers
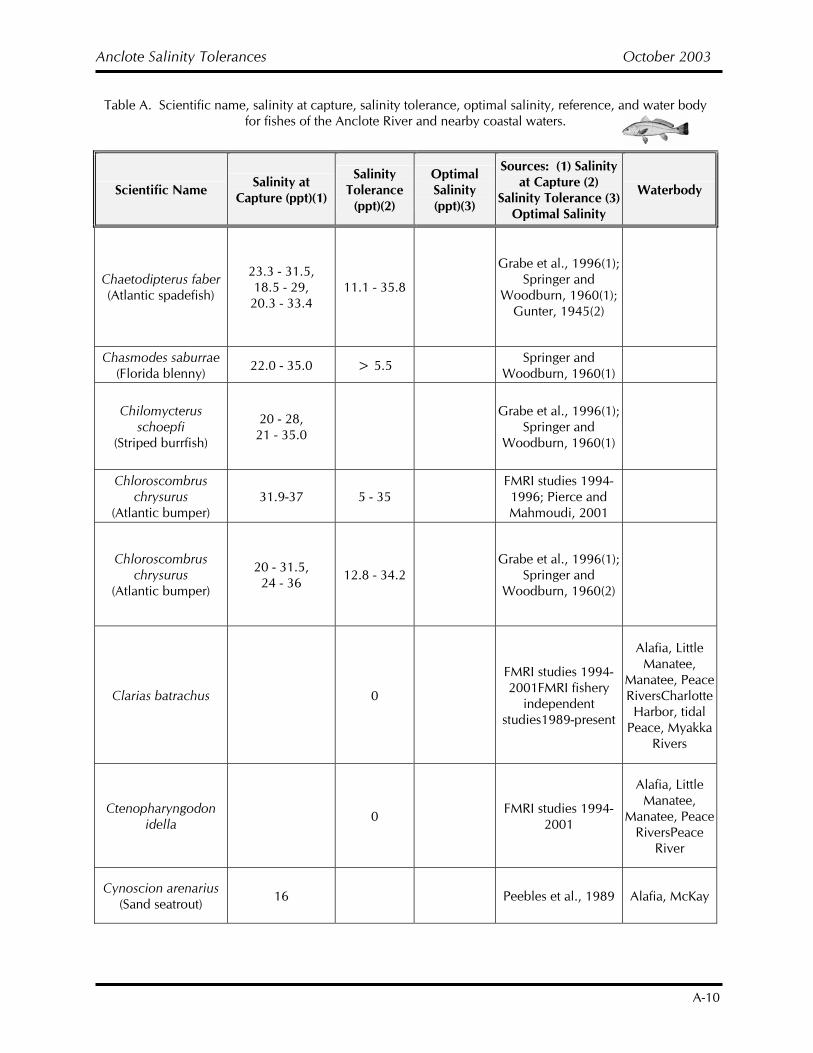
Anclote Salinity Tolerances October 2003
A-10
Table A. Scientific name, salinity at capture, salinity tolerance, optimal salinity, reference, and water body for fishes of the Anclote River and nearby coastal waters.
Scientific Name Salinity at Capture (ppt)(1)
Salinity Tolerance
(ppt)(2)
Optimal Salinity (ppt)(3)
Sources: (1) Salinity at Capture (2)
Salinity Tolerance (3) Optimal Salinity
Waterbody
Chaetodipterus faber (Atlantic spadefish)
23.3 - 31.5, 18.5 - 29, 20.3 - 33.4
11.1 - 35.8
Grabe et al., 1996(1); Springer and
Woodburn, 1960(1); Gunter, 1945(2)
Chasmodes saburrae (Florida blenny) 22.0 - 35.0 > 5.5 Springer and
Woodburn, 1960(1)
Chilomycterus schoepfi
(Striped burrfish)
20 - 28, 21 - 35.0
Grabe et al., 1996(1); Springer and
Woodburn, 1960(1)
Chloroscombrus chrysurus
(Atlantic bumper) 31.9-37 5 - 35
FMRI studies 1994-1996; Pierce and Mahmoudi, 2001
Chloroscombrus chrysurus
(Atlantic bumper)
20 - 31.5, 24 - 36 12.8 - 34.2
Grabe et al., 1996(1); Springer and
Woodburn, 1960(2)
Clarias batrachus 0
FMRI studies 1994-2001FMRI fishery
independent studies1989-present
Alafia, Little Manatee,
Manatee, Peace RiversCharlotte Harbor, tidal
Peace, Myakka Rivers
Ctenopharyngodon idella 0 FMRI studies 1994-
2001
Alafia, Little Manatee,
Manatee, Peace RiversPeace
River
Cynoscion arenarius (Sand seatrout) 16 Peebles et al., 1989 Alafia, McKay
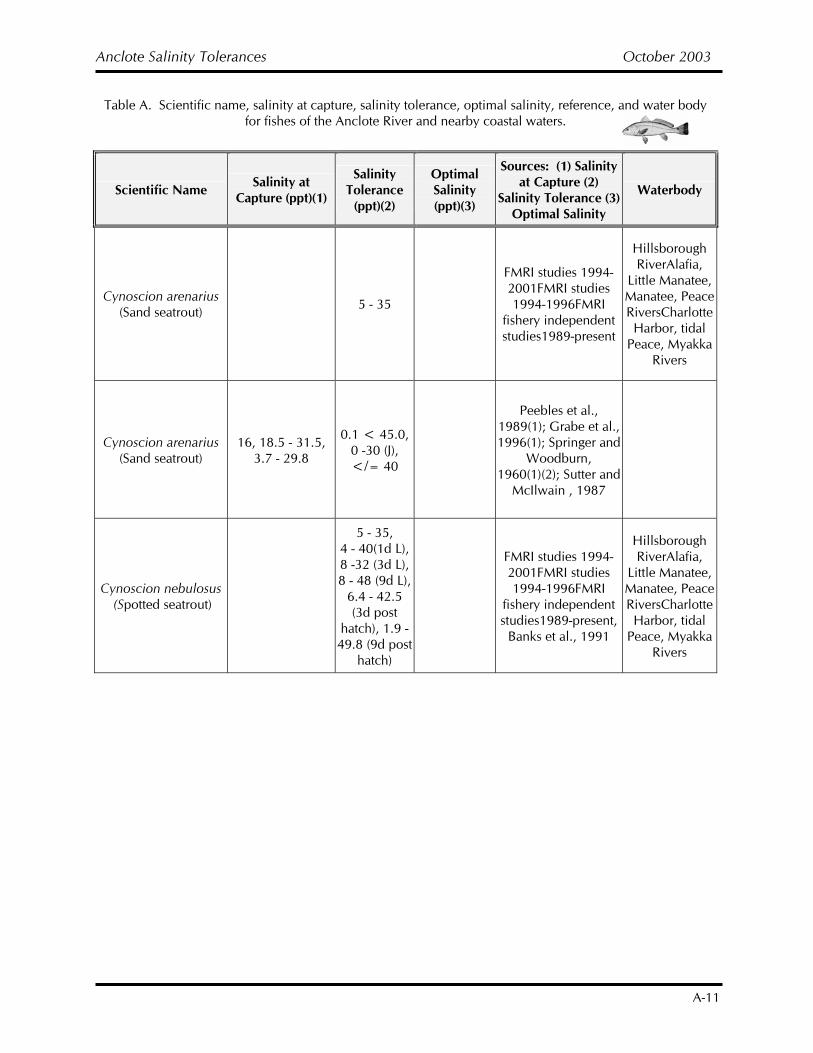
Anclote Salinity Tolerances October 2003
A-11
Table A. Scientific name, salinity at capture, salinity tolerance, optimal salinity, reference, and water body for fishes of the Anclote River and nearby coastal waters.
Scientific Name Salinity at Capture (ppt)(1)
Salinity Tolerance
(ppt)(2)
Optimal Salinity (ppt)(3)
Sources: (1) Salinity at Capture (2)
Salinity Tolerance (3) Optimal Salinity
Waterbody
Cynoscion arenarius (Sand seatrout) 5 - 35
FMRI studies 1994-2001FMRI studies 1994-1996FMRI
fishery independent studies1989-present
Hillsborough RiverAlafia,
Little Manatee, Manatee, Peace RiversCharlotte Harbor, tidal
Peace, Myakka Rivers
Cynoscion arenarius (Sand seatrout)
16, 18.5 - 31.5, 3.7 - 29.8
0.1 < 45.0, 0 -30 (J), </= 40
Peebles et al., 1989(1); Grabe et al., 1996(1); Springer and
Woodburn, 1960(1)(2); Sutter and
McIlwain , 1987
Cynoscion nebulosus (Spotted seatrout)
5 - 35, 4 - 40(1d L), 8 -32 (3d L), 8 - 48 (9d L),
6.4 - 42.5 (3d post
hatch), 1.9 - 49.8 (9d post
hatch)
FMRI studies 1994-2001FMRI studies 1994-1996FMRI
fishery independent studies1989-present,
Banks et al., 1991
Hillsborough RiverAlafia,
Little Manatee, Manatee, Peace RiversCharlotte Harbor, tidal
Peace, Myakka Rivers
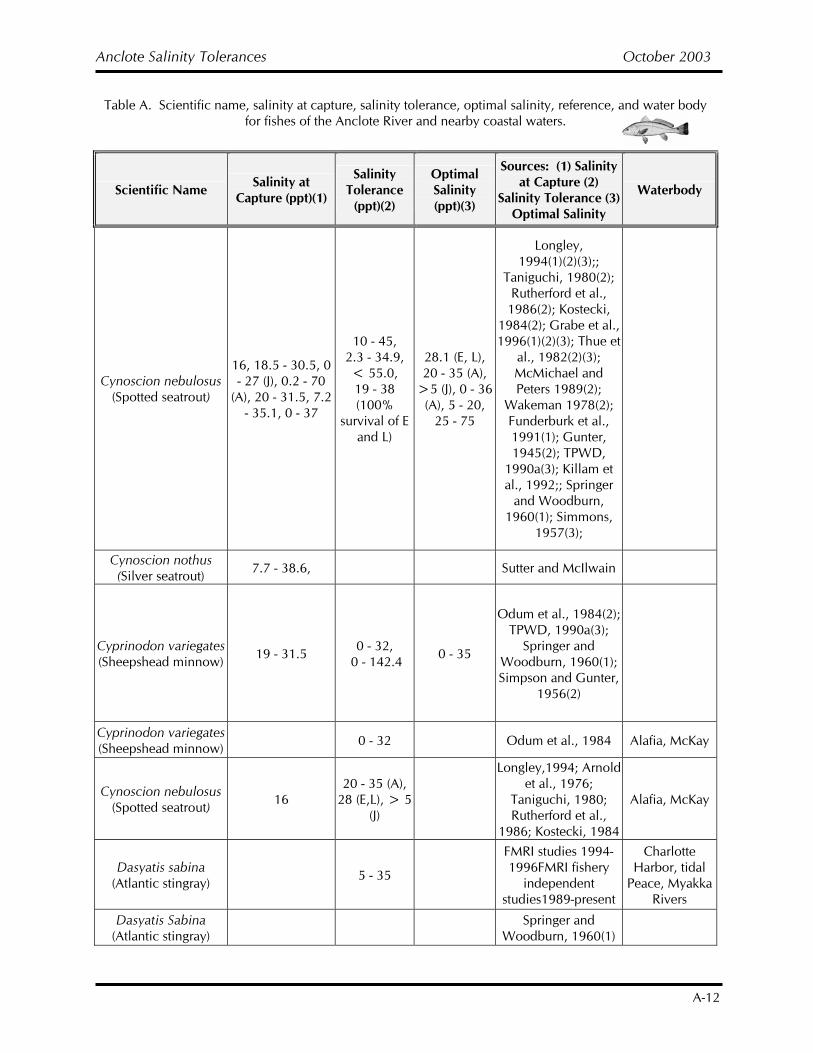
Anclote Salinity Tolerances October 2003
A-12
Table A. Scientific name, salinity at capture, salinity tolerance, optimal salinity, reference, and water body for fishes of the Anclote River and nearby coastal waters.
Scientific Name Salinity at Capture (ppt)(1)
Salinity Tolerance
(ppt)(2)
Optimal Salinity (ppt)(3)
Sources: (1) Salinity at Capture (2)
Salinity Tolerance (3) Optimal Salinity
Waterbody
Cynoscion nebulosus (Spotted seatrout)
16, 18.5 - 30.5, 0 - 27 (J), 0.2 - 70
(A), 20 - 31.5, 7.2 - 35.1, 0 - 37
10 - 45, 2.3 - 34.9, < 55.0, 19 - 38 (100%
survival of E and L)
28.1 (E, L), 20 - 35 (A),
>5 (J), 0 - 36 (A), 5 - 20,
25 - 75
Longley, 1994(1)(2)(3);;
Taniguchi, 1980(2); Rutherford et al., 1986(2); Kostecki,
1984(2); Grabe et al., 1996(1)(2)(3); Thue et
al., 1982(2)(3); McMichael and Peters 1989(2);
Wakeman 1978(2); Funderburk et al., 1991(1); Gunter, 1945(2); TPWD,
1990a(3); Killam et al., 1992;; Springer
and Woodburn, 1960(1); Simmons,
1957(3);
Cynoscion nothus (Silver seatrout) 7.7 - 38.6, Sutter and McIlwain
Cyprinodon variegates (Sheepshead minnow) 19 - 31.5 0 - 32,
0 - 142.4 0 - 35
Odum et al., 1984(2); TPWD, 1990a(3);
Springer and Woodburn, 1960(1); Simpson and Gunter,
1956(2)
Cyprinodon variegates (Sheepshead minnow) 0 - 32 Odum et al., 1984 Alafia, McKay
Cynoscion nebulosus (Spotted seatrout) 16
20 - 35 (A), 28 (E,L), > 5
(J)
Longley,1994; Arnoldet al., 1976;
Taniguchi, 1980; Rutherford et al.,
1986; Kostecki, 1984
Alafia, McKay
Dasyatis sabina (Atlantic stingray) 5 - 35
FMRI studies 1994-1996FMRI fishery
independent studies1989-present
Charlotte Harbor, tidal
Peace, Myakka Rivers
Dasyatis Sabina (Atlantic stingray) Springer and
Woodburn, 1960(1)
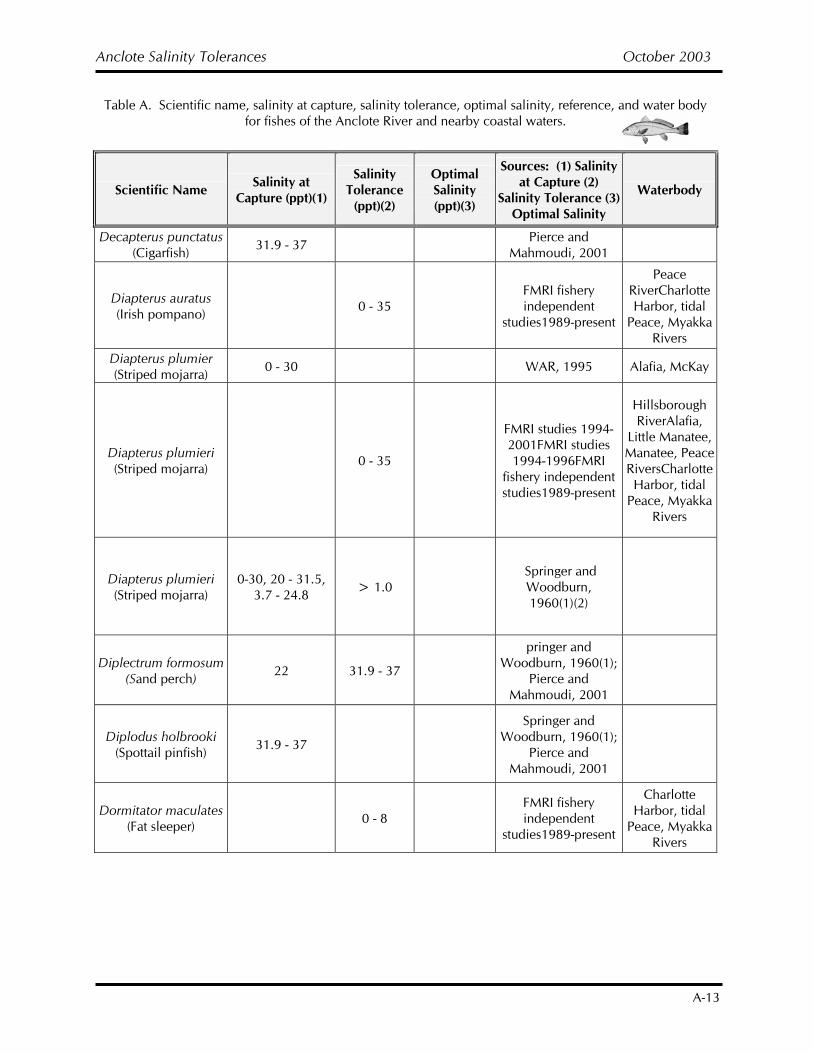
Anclote Salinity Tolerances October 2003
A-13
Table A. Scientific name, salinity at capture, salinity tolerance, optimal salinity, reference, and water body for fishes of the Anclote River and nearby coastal waters.
Scientific Name Salinity at Capture (ppt)(1)
Salinity Tolerance
(ppt)(2)
Optimal Salinity (ppt)(3)
Sources: (1) Salinity at Capture (2)
Salinity Tolerance (3) Optimal Salinity
Waterbody
Decapterus punctatus (Cigarfish) 31.9 - 37 Pierce and
Mahmoudi, 2001
Diapterus auratus (Irish pompano) 0 - 35
FMRI fishery independent
studies1989-present
Peace RiverCharlotte Harbor, tidal
Peace, Myakka Rivers
Diapterus plumier (Striped mojarra) 0 - 30 WAR, 1995 Alafia, McKay
Diapterus plumieri (Striped mojarra) 0 - 35
FMRI studies 1994-2001FMRI studies 1994-1996FMRI
fishery independent studies1989-present
Hillsborough RiverAlafia,
Little Manatee, Manatee, Peace RiversCharlotte Harbor, tidal
Peace, Myakka Rivers
Diapterus plumieri (Striped mojarra)
0-30, 20 - 31.5, 3.7 - 24.8 > 1.0
Springer and Woodburn, 1960(1)(2)
Diplectrum formosum (Sand perch) 22 31.9 - 37
pringer and Woodburn, 1960(1);
Pierce and Mahmoudi, 2001
Diplodus holbrooki (Spottail pinfish) 31.9 - 37
Springer and Woodburn, 1960(1);
Pierce and Mahmoudi, 2001
Dormitator maculates (Fat sleeper) 0 - 8
FMRI fishery independent
studies1989-present
Charlotte Harbor, tidal
Peace, Myakka Rivers
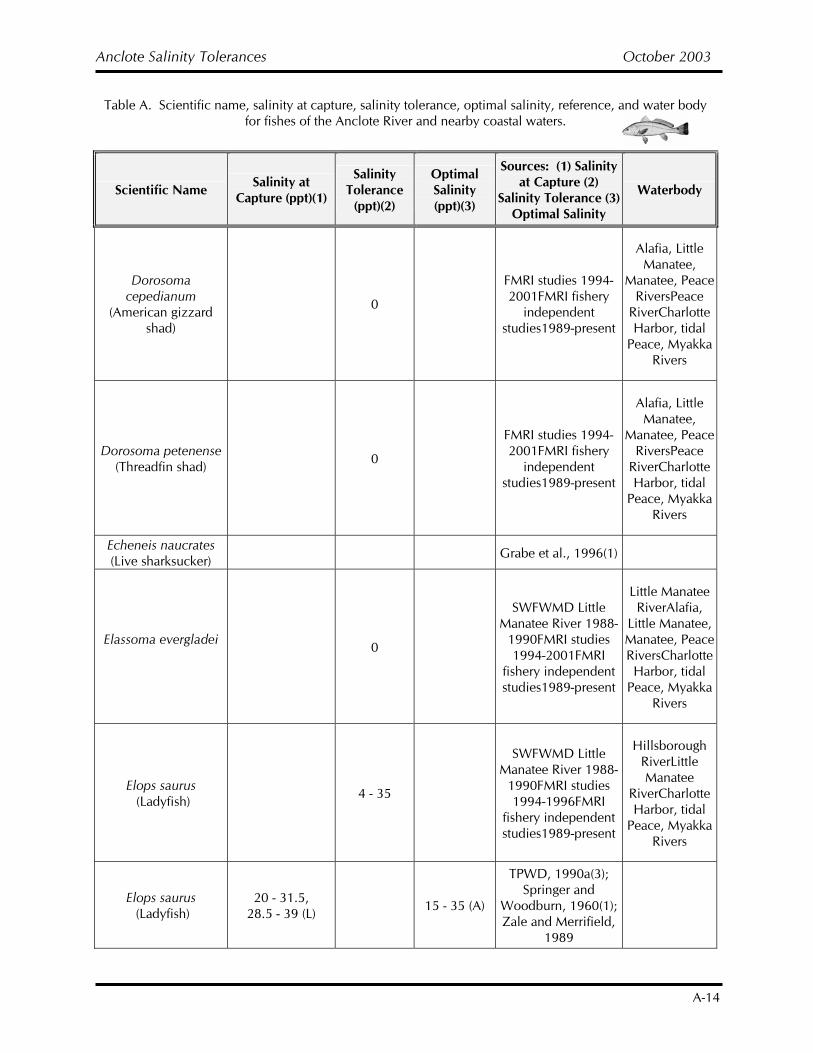
Anclote Salinity Tolerances October 2003
A-14
Table A. Scientific name, salinity at capture, salinity tolerance, optimal salinity, reference, and water body for fishes of the Anclote River and nearby coastal waters.
Scientific Name Salinity at Capture (ppt)(1)
Salinity Tolerance
(ppt)(2)
Optimal Salinity (ppt)(3)
Sources: (1) Salinity at Capture (2)
Salinity Tolerance (3) Optimal Salinity
Waterbody
Dorosoma cepedianum
(American gizzard shad)
0
FMRI studies 1994-2001FMRI fishery
independent studies1989-present
Alafia, Little Manatee,
Manatee, Peace RiversPeace
RiverCharlotte Harbor, tidal
Peace, Myakka Rivers
Dorosoma petenense (Threadfin shad) 0
FMRI studies 1994-2001FMRI fishery
independent studies1989-present
Alafia, Little Manatee,
Manatee, Peace RiversPeace
RiverCharlotte Harbor, tidal
Peace, Myakka Rivers
Echeneis naucrates (Live sharksucker) Grabe et al., 1996(1)
Elassoma evergladei 0
SWFWMD Little Manatee River 1988-
1990FMRI studies 1994-2001FMRI
fishery independent studies1989-present
Little Manatee RiverAlafia,
Little Manatee, Manatee, Peace RiversCharlotte Harbor, tidal
Peace, Myakka Rivers
Elops saurus (Ladyfish) 4 - 35
SWFWMD Little Manatee River 1988-
1990FMRI studies 1994-1996FMRI
fishery independent studies1989-present
Hillsborough RiverLittle Manatee
RiverCharlotte Harbor, tidal
Peace, Myakka Rivers
Elops saurus (Ladyfish)
20 - 31.5, 28.5 - 39 (L) 15 - 35 (A)
TPWD, 1990a(3); Springer and
Woodburn, 1960(1); Zale and Merrifield,
1989
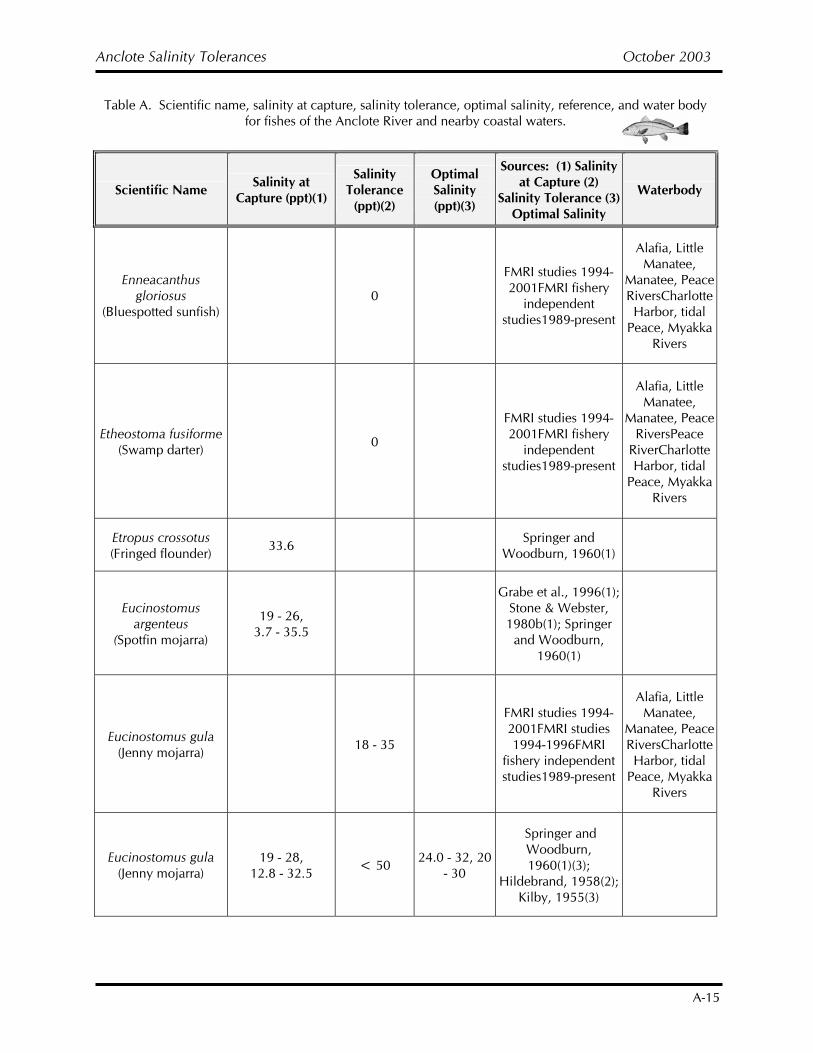
Anclote Salinity Tolerances October 2003
A-15
Table A. Scientific name, salinity at capture, salinity tolerance, optimal salinity, reference, and water body for fishes of the Anclote River and nearby coastal waters.
Scientific Name Salinity at Capture (ppt)(1)
Salinity Tolerance
(ppt)(2)
Optimal Salinity (ppt)(3)
Sources: (1) Salinity at Capture (2)
Salinity Tolerance (3) Optimal Salinity
Waterbody
Enneacanthus gloriosus
(Bluespotted sunfish) 0
FMRI studies 1994-2001FMRI fishery
independent studies1989-present
Alafia, Little Manatee,
Manatee, Peace RiversCharlotte Harbor, tidal
Peace, Myakka Rivers
Etheostoma fusiforme (Swamp darter) 0
FMRI studies 1994-2001FMRI fishery
independent studies1989-present
Alafia, Little Manatee,
Manatee, Peace RiversPeace
RiverCharlotte Harbor, tidal
Peace, Myakka Rivers
Etropus crossotus (Fringed flounder) 33.6 Springer and
Woodburn, 1960(1)
Eucinostomus argenteus
(Spotfin mojarra)
19 - 26, 3.7 - 35.5
Grabe et al., 1996(1); Stone & Webster, 1980b(1); Springer
and Woodburn, 1960(1)
Eucinostomus gula (Jenny mojarra) 18 - 35
FMRI studies 1994-2001FMRI studies 1994-1996FMRI
fishery independent studies1989-present
Alafia, Little Manatee,
Manatee, Peace RiversCharlotte Harbor, tidal
Peace, Myakka Rivers
Eucinostomus gula (Jenny mojarra)
19 - 28, 12.8 - 32.5 < 50 24.0 - 32, 20
- 30
Springer and Woodburn, 1960(1)(3);
Hildebrand, 1958(2); Kilby, 1955(3)
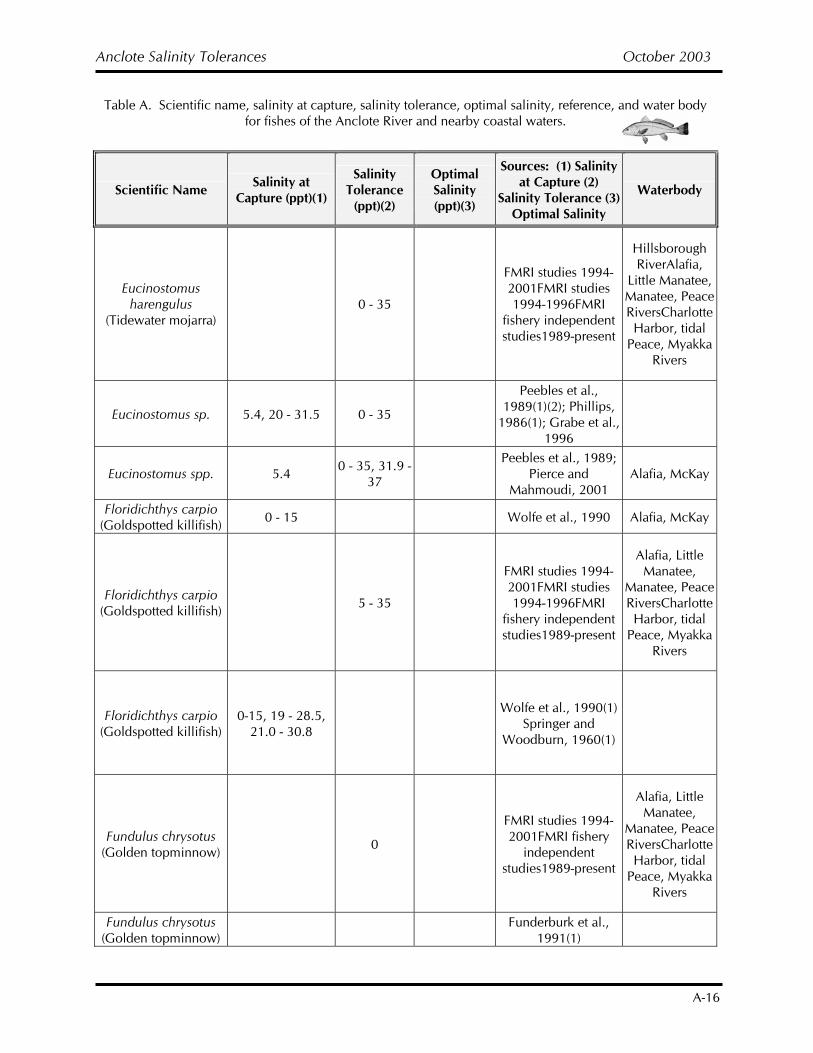
Anclote Salinity Tolerances October 2003
A-16
Table A. Scientific name, salinity at capture, salinity tolerance, optimal salinity, reference, and water body for fishes of the Anclote River and nearby coastal waters.
Scientific Name Salinity at Capture (ppt)(1)
Salinity Tolerance
(ppt)(2)
Optimal Salinity (ppt)(3)
Sources: (1) Salinity at Capture (2)
Salinity Tolerance (3) Optimal Salinity
Waterbody
Eucinostomus harengulus
(Tidewater mojarra) 0 - 35
FMRI studies 1994-2001FMRI studies 1994-1996FMRI
fishery independent studies1989-present
Hillsborough RiverAlafia,
Little Manatee, Manatee, Peace RiversCharlotte Harbor, tidal
Peace, Myakka Rivers
Eucinostomus sp. 5.4, 20 - 31.5 0 - 35
Peebles et al., 1989(1)(2); Phillips,
1986(1); Grabe et al., 1996
Eucinostomus spp. 5.4 0 - 35, 31.9 - 37
Peebles et al., 1989; Pierce and
Mahmoudi, 2001 Alafia, McKay
Floridichthys carpio (Goldspotted killifish) 0 - 15 Wolfe et al., 1990 Alafia, McKay
Floridichthys carpio (Goldspotted killifish) 5 - 35
FMRI studies 1994-2001FMRI studies 1994-1996FMRI
fishery independent studies1989-present
Alafia, Little Manatee,
Manatee, Peace RiversCharlotte Harbor, tidal
Peace, Myakka Rivers
Floridichthys carpio (Goldspotted killifish)
0-15, 19 - 28.5, 21.0 - 30.8
Wolfe et al., 1990(1) Springer and
Woodburn, 1960(1)
Fundulus chrysotus (Golden topminnow) 0
FMRI studies 1994-2001FMRI fishery
independent studies1989-present
Alafia, Little Manatee,
Manatee, Peace RiversCharlotte Harbor, tidal
Peace, Myakka Rivers
Fundulus chrysotus (Golden topminnow) Funderburk et al.,
1991(1)
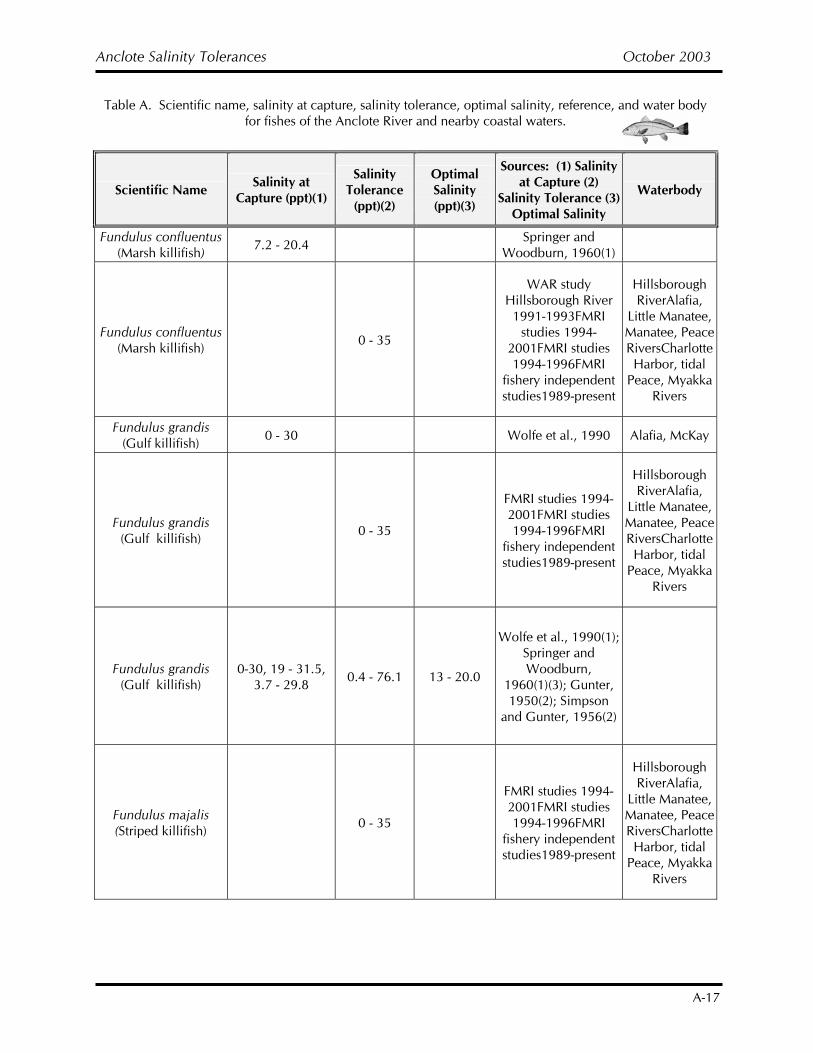
Anclote Salinity Tolerances October 2003
A-17
Table A. Scientific name, salinity at capture, salinity tolerance, optimal salinity, reference, and water body for fishes of the Anclote River and nearby coastal waters.
Scientific Name Salinity at Capture (ppt)(1)
Salinity Tolerance
(ppt)(2)
Optimal Salinity (ppt)(3)
Sources: (1) Salinity at Capture (2)
Salinity Tolerance (3) Optimal Salinity
Waterbody
Fundulus confluentus (Marsh killifish) 7.2 - 20.4 Springer and
Woodburn, 1960(1)
Fundulus confluentus (Marsh killifish) 0 - 35
WAR study Hillsborough River 1991-1993FMRI
studies 1994-2001FMRI studies 1994-1996FMRI
fishery independent studies1989-present
Hillsborough RiverAlafia,
Little Manatee, Manatee, Peace RiversCharlotte Harbor, tidal
Peace, Myakka Rivers
Fundulus grandis (Gulf killifish) 0 - 30 Wolfe et al., 1990 Alafia, McKay
Fundulus grandis (Gulf killifish) 0 - 35
FMRI studies 1994-2001FMRI studies 1994-1996FMRI
fishery independent studies1989-present
Hillsborough RiverAlafia,
Little Manatee, Manatee, Peace RiversCharlotte Harbor, tidal
Peace, Myakka Rivers
Fundulus grandis (Gulf killifish)
0-30, 19 - 31.5, 3.7 - 29.8 0.4 - 76.1 13 - 20.0
Wolfe et al., 1990(1); Springer and Woodburn,
1960(1)(3); Gunter, 1950(2); Simpson
and Gunter, 1956(2)
Fundulus majalis (Striped killifish) 0 - 35
FMRI studies 1994-2001FMRI studies 1994-1996FMRI
fishery independent studies1989-present
Hillsborough RiverAlafia,
Little Manatee, Manatee, Peace RiversCharlotte Harbor, tidal
Peace, Myakka Rivers
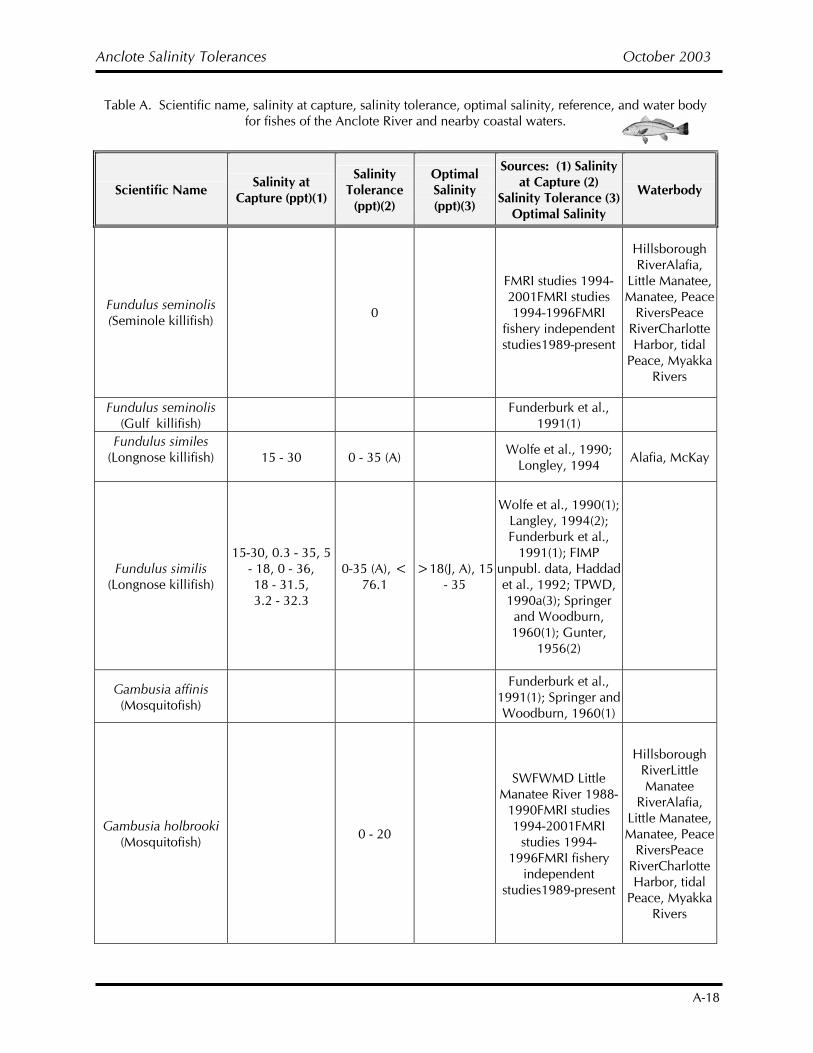
Anclote Salinity Tolerances October 2003
A-18
Table A. Scientific name, salinity at capture, salinity tolerance, optimal salinity, reference, and water body for fishes of the Anclote River and nearby coastal waters.
Scientific Name Salinity at Capture (ppt)(1)
Salinity Tolerance
(ppt)(2)
Optimal Salinity (ppt)(3)
Sources: (1) Salinity at Capture (2)
Salinity Tolerance (3) Optimal Salinity
Waterbody
Fundulus seminolis (Seminole killifish) 0
FMRI studies 1994-2001FMRI studies 1994-1996FMRI
fishery independent studies1989-present
Hillsborough RiverAlafia,
Little Manatee, Manatee, Peace
RiversPeace RiverCharlotte Harbor, tidal
Peace, Myakka Rivers
Fundulus seminolis (Gulf killifish) Funderburk et al.,
1991(1)
Fundulus similes (Longnose killifish)
15 - 30 0 - 35 (A) Wolfe et al., 1990;
Longley, 1994 Alafia, McKay
Fundulus similis (Longnose killifish)
15-30, 0.3 - 35, 5 - 18, 0 - 36, 18 - 31.5, 3.2 - 32.3
0-35 (A), < 76.1
>18(J, A), 15 - 35
Wolfe et al., 1990(1); Langley, 1994(2); Funderburk et al.,
1991(1); FIMP unpubl. data, Haddad et al., 1992; TPWD, 1990a(3); Springer and Woodburn, 1960(1); Gunter,
1956(2)
Gambusia affinis (Mosquitofish)
Funderburk et al., 1991(1); Springer and Woodburn, 1960(1)
Gambusia holbrooki (Mosquitofish) 0 - 20
SWFWMD Little Manatee River 1988-
1990FMRI studies 1994-2001FMRI
studies 1994-1996FMRI fishery
independent studies1989-present
Hillsborough RiverLittle Manatee
RiverAlafia, Little Manatee, Manatee, Peace
RiversPeace RiverCharlotte Harbor, tidal
Peace, Myakka Rivers
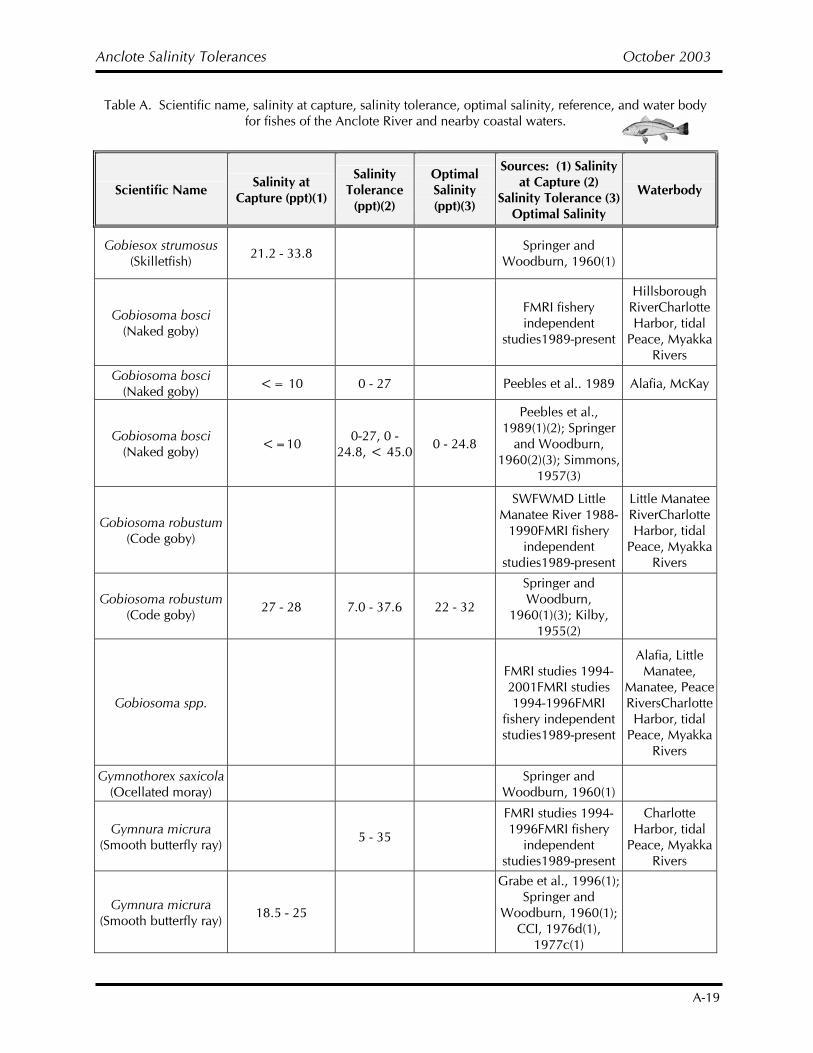
Anclote Salinity Tolerances October 2003
A-19
Table A. Scientific name, salinity at capture, salinity tolerance, optimal salinity, reference, and water body for fishes of the Anclote River and nearby coastal waters.
Scientific Name Salinity at Capture (ppt)(1)
Salinity Tolerance
(ppt)(2)
Optimal Salinity (ppt)(3)
Sources: (1) Salinity at Capture (2)
Salinity Tolerance (3) Optimal Salinity
Waterbody
Gobiesox strumosus (Skilletfish) 21.2 - 33.8 Springer and
Woodburn, 1960(1)
Gobiosoma bosci (Naked goby)
FMRI fishery independent
studies1989-present
Hillsborough RiverCharlotte Harbor, tidal
Peace, Myakka Rivers
Gobiosoma bosci (Naked goby) <= 10 0 - 27 Peebles et al.. 1989 Alafia, McKay
Gobiosoma bosci (Naked goby) <=10 0-27, 0 -
24.8, < 45.0 0 - 24.8
Peebles et al., 1989(1)(2); Springer
and Woodburn, 1960(2)(3); Simmons,
1957(3)
Gobiosoma robustum (Code goby)
SWFWMD Little Manatee River 1988-
1990FMRI fishery independent
studies1989-present
Little Manatee RiverCharlotte Harbor, tidal
Peace, Myakka Rivers
Gobiosoma robustum (Code goby) 27 - 28 7.0 - 37.6 22 - 32
Springer and Woodburn,
1960(1)(3); Kilby, 1955(2)
Gobiosoma spp.
FMRI studies 1994-2001FMRI studies 1994-1996FMRI
fishery independent studies1989-present
Alafia, Little Manatee,
Manatee, Peace RiversCharlotte Harbor, tidal
Peace, Myakka Rivers
Gymnothorex saxicola (Ocellated moray) Springer and
Woodburn, 1960(1)
Gymnura micrura (Smooth butterfly ray) 5 - 35
FMRI studies 1994-1996FMRI fishery
independent studies1989-present
Charlotte Harbor, tidal
Peace, Myakka Rivers
Gymnura micrura (Smooth butterfly ray) 18.5 - 25
Grabe et al., 1996(1); Springer and
Woodburn, 1960(1); CCI, 1976d(1),
1977c(1)
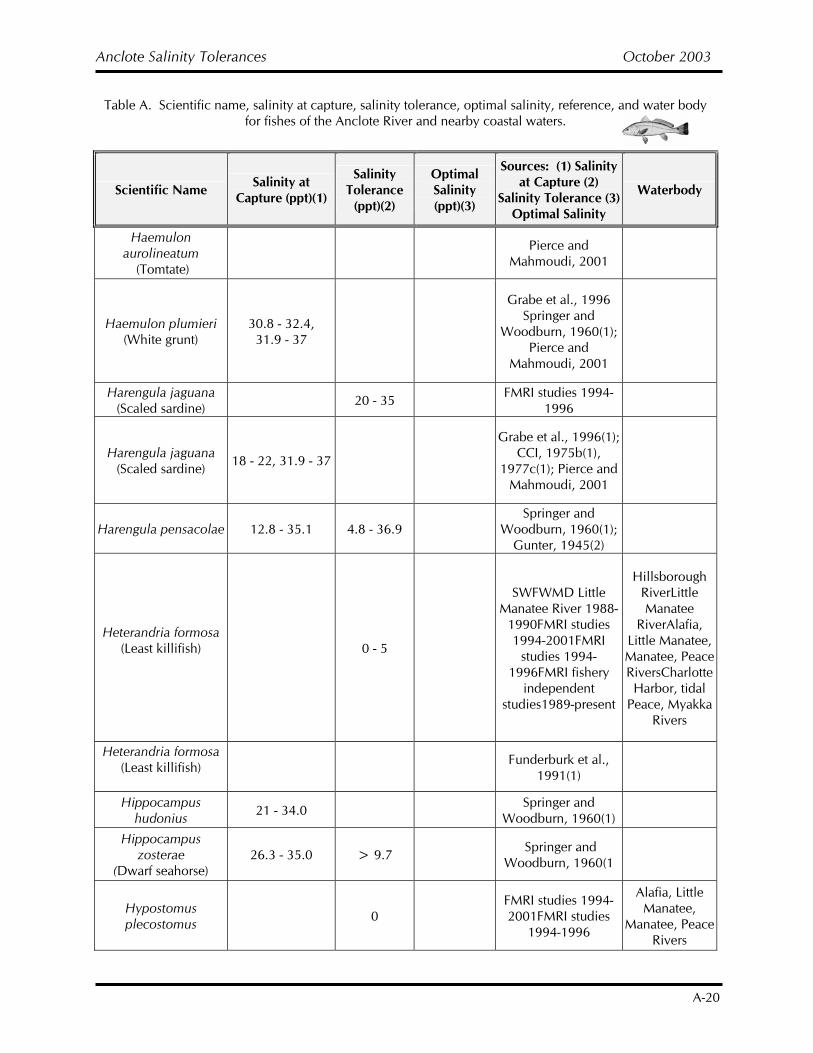
Anclote Salinity Tolerances October 2003
A-20
Table A. Scientific name, salinity at capture, salinity tolerance, optimal salinity, reference, and water body for fishes of the Anclote River and nearby coastal waters.
Scientific Name Salinity at Capture (ppt)(1)
Salinity Tolerance
(ppt)(2)
Optimal Salinity (ppt)(3)
Sources: (1) Salinity at Capture (2)
Salinity Tolerance (3) Optimal Salinity
Waterbody
Haemulon aurolineatum
(Tomtate) Pierce and
Mahmoudi, 2001
Haemulon plumieri (White grunt)
30.8 - 32.4, 31.9 - 37
Grabe et al., 1996 Springer and
Woodburn, 1960(1); Pierce and
Mahmoudi, 2001
Harengula jaguana (Scaled sardine) 20 - 35 FMRI studies 1994-
1996
Harengula jaguana (Scaled sardine) 18 - 22, 31.9 - 37
Grabe et al., 1996(1); CCI, 1975b(1),
1977c(1); Pierce and Mahmoudi, 2001
Harengula pensacolae 12.8 - 35.1 4.8 - 36.9 Springer and
Woodburn, 1960(1); Gunter, 1945(2)
Heterandria formosa (Least killifish)
0 - 5
SWFWMD Little Manatee River 1988-
1990FMRI studies 1994-2001FMRI
studies 1994-1996FMRI fishery
independent studies1989-present
Hillsborough RiverLittle Manatee
RiverAlafia, Little Manatee, Manatee, Peace RiversCharlotte Harbor, tidal
Peace, Myakka Rivers
Heterandria formosa (Least killifish)
Funderburk et al.,
1991(1)
Hippocampus hudonius 21 - 34.0 Springer and
Woodburn, 1960(1)
Hippocampus zosterae
(Dwarf seahorse) 26.3 - 35.0 > 9.7 Springer and
Woodburn, 1960(1
Hypostomus plecostomus 0
FMRI studies 1994-2001FMRI studies
1994-1996
Alafia, Little Manatee,
Manatee, Peace Rivers
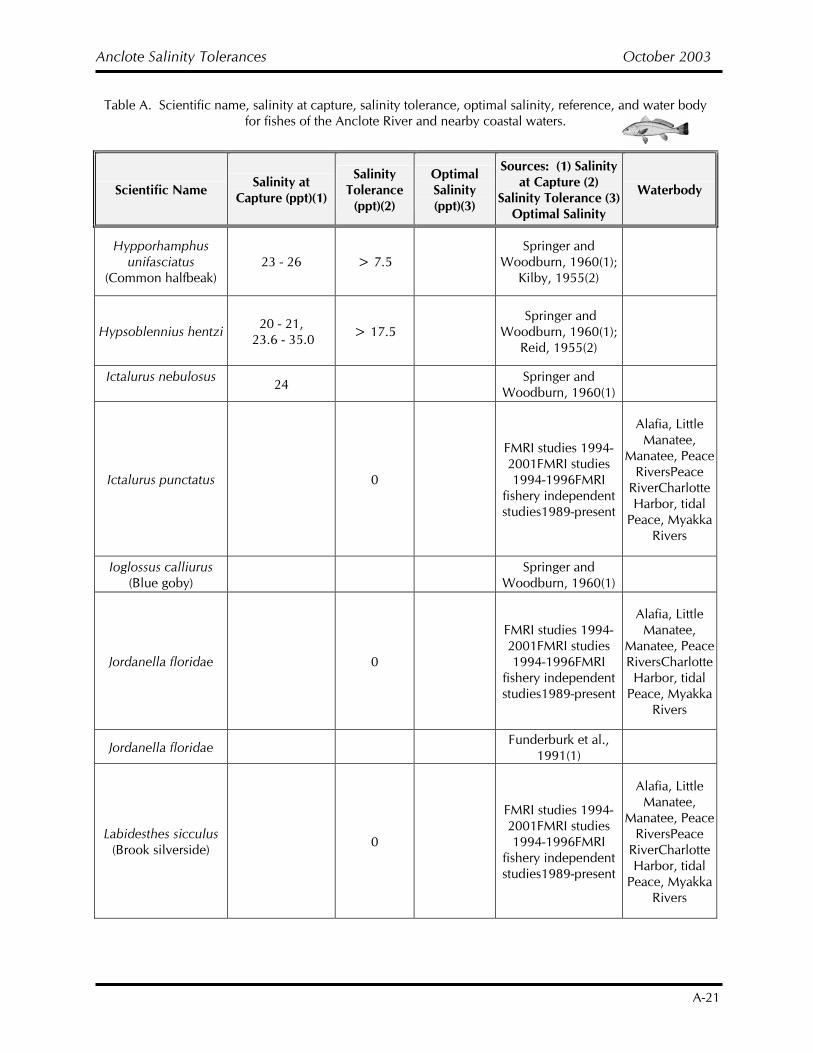
Anclote Salinity Tolerances October 2003
A-21
Table A. Scientific name, salinity at capture, salinity tolerance, optimal salinity, reference, and water body for fishes of the Anclote River and nearby coastal waters.
Scientific Name Salinity at Capture (ppt)(1)
Salinity Tolerance
(ppt)(2)
Optimal Salinity (ppt)(3)
Sources: (1) Salinity at Capture (2)
Salinity Tolerance (3) Optimal Salinity
Waterbody
Hypporhamphus unifasciatus
(Common halfbeak) 23 - 26 > 7.5
Springer and Woodburn, 1960(1);
Kilby, 1955(2)
Hypsoblennius hentzi 20 - 21, 23.6 - 35.0 > 17.5
Springer and Woodburn, 1960(1);
Reid, 1955(2)
Ictalurus nebulosus 24 Springer and
Woodburn, 1960(1)
Ictalurus punctatus 0
FMRI studies 1994-2001FMRI studies 1994-1996FMRI
fishery independent studies1989-present
Alafia, Little Manatee,
Manatee, Peace RiversPeace
RiverCharlotte Harbor, tidal
Peace, Myakka Rivers
Ioglossus calliurus (Blue goby) Springer and
Woodburn, 1960(1)
Jordanella floridae 0
FMRI studies 1994-2001FMRI studies 1994-1996FMRI
fishery independent studies1989-present
Alafia, Little Manatee,
Manatee, Peace RiversCharlotte Harbor, tidal
Peace, Myakka Rivers
Jordanella floridae Funderburk et al., 1991(1)
Labidesthes sicculus (Brook silverside) 0
FMRI studies 1994-2001FMRI studies 1994-1996FMRI
fishery independent studies1989-present
Alafia, Little Manatee,
Manatee, Peace RiversPeace
RiverCharlotte Harbor, tidal
Peace, Myakka Rivers
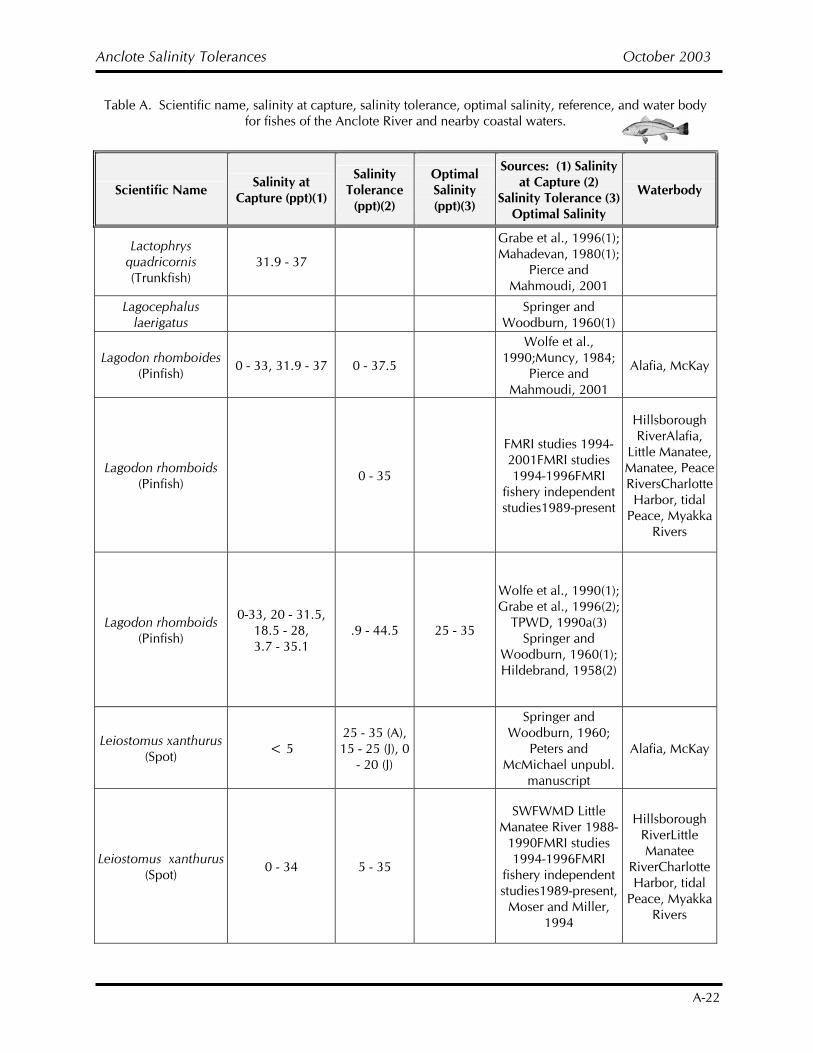
Anclote Salinity Tolerances October 2003
A-22
Table A. Scientific name, salinity at capture, salinity tolerance, optimal salinity, reference, and water body for fishes of the Anclote River and nearby coastal waters.
Scientific Name Salinity at Capture (ppt)(1)
Salinity Tolerance
(ppt)(2)
Optimal Salinity (ppt)(3)
Sources: (1) Salinity at Capture (2)
Salinity Tolerance (3) Optimal Salinity
Waterbody
Lactophrys quadricornis (Trunkfish)
31.9 - 37
Grabe et al., 1996(1); Mahadevan, 1980(1);
Pierce and Mahmoudi, 2001
Lagocephalus laerigatus Springer and
Woodburn, 1960(1)
Lagodon rhomboides (Pinfish) 0 - 33, 31.9 - 37 0 - 37.5
Wolfe et al., 1990;Muncy, 1984;
Pierce and Mahmoudi, 2001
Alafia, McKay
Lagodon rhomboids (Pinfish) 0 - 35
FMRI studies 1994-2001FMRI studies 1994-1996FMRI
fishery independent studies1989-present
Hillsborough RiverAlafia,
Little Manatee, Manatee, Peace RiversCharlotte Harbor, tidal
Peace, Myakka Rivers
Lagodon rhomboids (Pinfish)
0-33, 20 - 31.5, 18.5 - 28, 3.7 - 35.1
.9 - 44.5 25 - 35
Wolfe et al., 1990(1); Grabe et al., 1996(2);
TPWD, 1990a(3) Springer and
Woodburn, 1960(1); Hildebrand, 1958(2)
Leiostomus xanthurus (Spot) < 5
25 - 35 (A), 15 - 25 (J), 0
- 20 (J)
Springer and Woodburn, 1960;
Peters and McMichael unpubl.
manuscript
Alafia, McKay
Leiostomus xanthurus (Spot) 0 - 34 5 - 35
SWFWMD Little Manatee River 1988-
1990FMRI studies 1994-1996FMRI
fishery independent studies1989-present,
Moser and Miller, 1994
Hillsborough RiverLittle Manatee
RiverCharlotte Harbor, tidal
Peace, Myakka Rivers
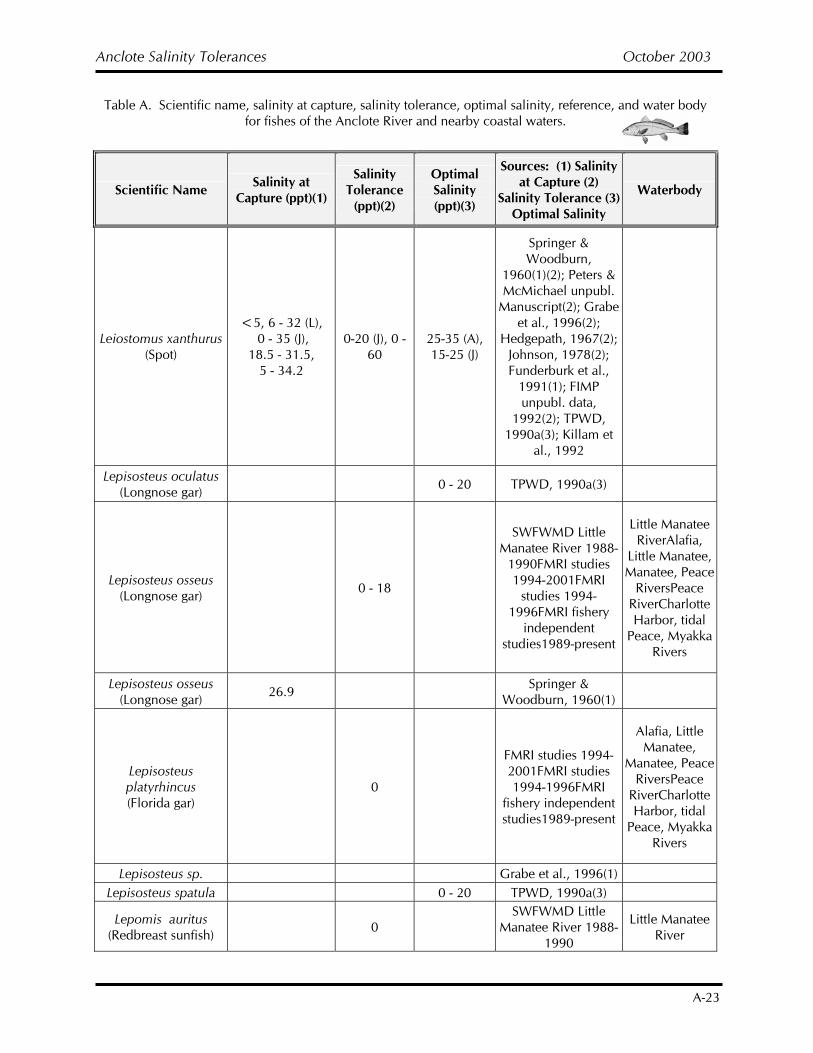
Anclote Salinity Tolerances October 2003
A-23
Table A. Scientific name, salinity at capture, salinity tolerance, optimal salinity, reference, and water body for fishes of the Anclote River and nearby coastal waters.
Scientific Name Salinity at Capture (ppt)(1)
Salinity Tolerance
(ppt)(2)
Optimal Salinity (ppt)(3)
Sources: (1) Salinity at Capture (2)
Salinity Tolerance (3) Optimal Salinity
Waterbody
Leiostomus xanthurus (Spot)
<5, 6 - 32 (L), 0 - 35 (J),
18.5 - 31.5, 5 - 34.2
0-20 (J), 0 - 60
25-35 (A), 15-25 (J)
Springer & Woodburn,
1960(1)(2); Peters & McMichael unpubl.
Manuscript(2); Grabe et al., 1996(2);
Hedgepath, 1967(2); Johnson, 1978(2); Funderburk et al.,
1991(1); FIMP unpubl. data,
1992(2); TPWD, 1990a(3); Killam et
al., 1992
Lepisosteus oculatus (Longnose gar) 0 - 20 TPWD, 1990a(3)
Lepisosteus osseus (Longnose gar) 0 - 18
SWFWMD Little Manatee River 1988-
1990FMRI studies 1994-2001FMRI
studies 1994-1996FMRI fishery
independent studies1989-present
Little Manatee RiverAlafia,
Little Manatee, Manatee, Peace
RiversPeace RiverCharlotte Harbor, tidal
Peace, Myakka Rivers
Lepisosteus osseus (Longnose gar) 26.9 Springer &
Woodburn, 1960(1)
Lepisosteus platyrhincus (Florida gar)
0
FMRI studies 1994-2001FMRI studies 1994-1996FMRI
fishery independent studies1989-present
Alafia, Little Manatee,
Manatee, Peace RiversPeace
RiverCharlotte Harbor, tidal
Peace, Myakka Rivers
Lepisosteus sp. Grabe et al., 1996(1) Lepisosteus spatula 0 - 20 TPWD, 1990a(3)
Lepomis auritus (Redbreast sunfish) 0
SWFWMD Little Manatee River 1988-
1990
Little Manatee River
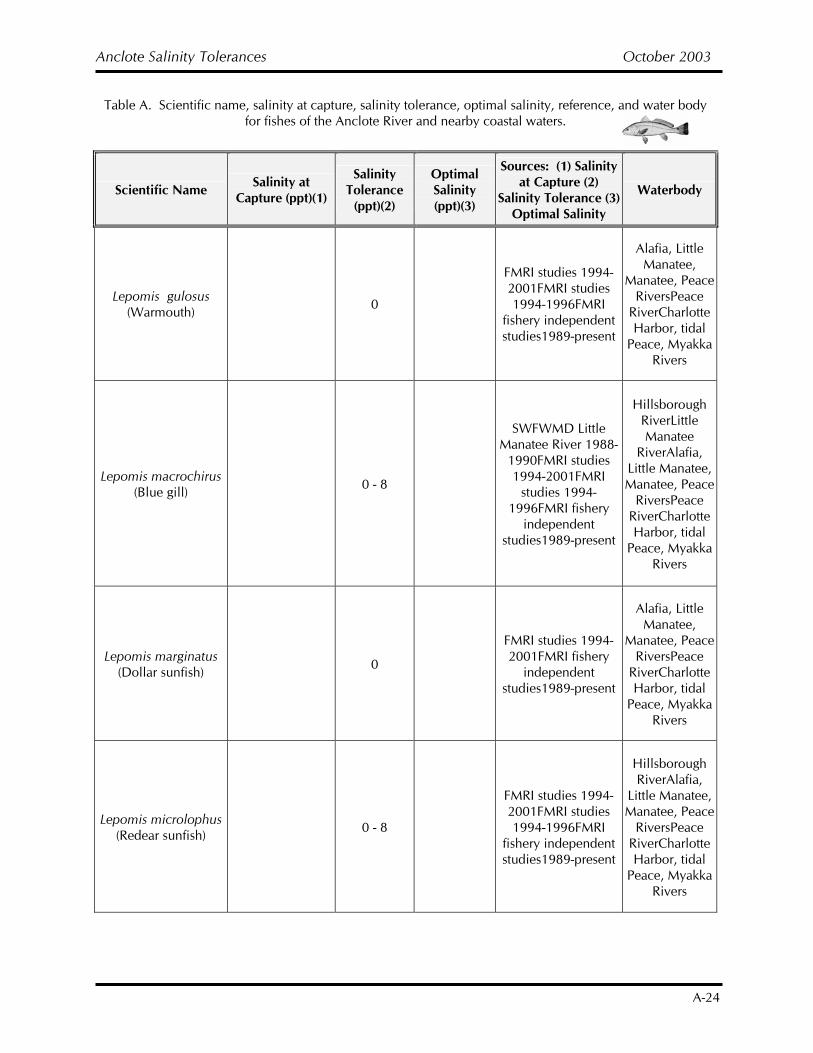
Anclote Salinity Tolerances October 2003
A-24
Table A. Scientific name, salinity at capture, salinity tolerance, optimal salinity, reference, and water body for fishes of the Anclote River and nearby coastal waters.
Scientific Name Salinity at Capture (ppt)(1)
Salinity Tolerance
(ppt)(2)
Optimal Salinity (ppt)(3)
Sources: (1) Salinity at Capture (2)
Salinity Tolerance (3) Optimal Salinity
Waterbody
Lepomis gulosus (Warmouth) 0
FMRI studies 1994-2001FMRI studies 1994-1996FMRI
fishery independent studies1989-present
Alafia, Little Manatee,
Manatee, Peace RiversPeace
RiverCharlotte Harbor, tidal
Peace, Myakka Rivers
Lepomis macrochirus (Blue gill) 0 - 8
SWFWMD Little Manatee River 1988-
1990FMRI studies 1994-2001FMRI
studies 1994-1996FMRI fishery
independent studies1989-present
Hillsborough RiverLittle Manatee
RiverAlafia, Little Manatee, Manatee, Peace
RiversPeace RiverCharlotte Harbor, tidal
Peace, Myakka Rivers
Lepomis marginatus (Dollar sunfish) 0
FMRI studies 1994-2001FMRI fishery
independent studies1989-present
Alafia, Little Manatee,
Manatee, Peace RiversPeace
RiverCharlotte Harbor, tidal
Peace, Myakka Rivers
Lepomis microlophus (Redear sunfish) 0 - 8
FMRI studies 1994-2001FMRI studies 1994-1996FMRI
fishery independent studies1989-present
Hillsborough RiverAlafia,
Little Manatee, Manatee, Peace
RiversPeace RiverCharlotte Harbor, tidal
Peace, Myakka Rivers
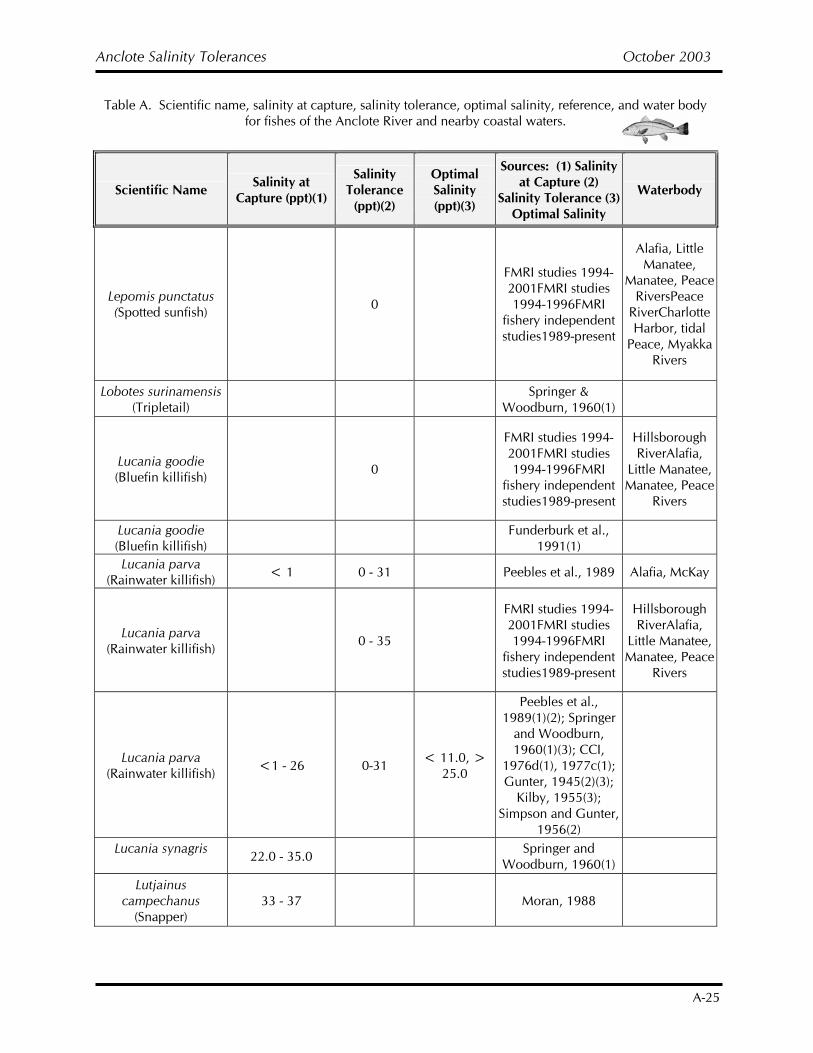
Anclote Salinity Tolerances October 2003
A-25
Table A. Scientific name, salinity at capture, salinity tolerance, optimal salinity, reference, and water body for fishes of the Anclote River and nearby coastal waters.
Scientific Name Salinity at Capture (ppt)(1)
Salinity Tolerance
(ppt)(2)
Optimal Salinity (ppt)(3)
Sources: (1) Salinity at Capture (2)
Salinity Tolerance (3) Optimal Salinity
Waterbody
Lepomis punctatus (Spotted sunfish) 0
FMRI studies 1994-2001FMRI studies 1994-1996FMRI
fishery independent studies1989-present
Alafia, Little Manatee,
Manatee, Peace RiversPeace
RiverCharlotte Harbor, tidal
Peace, Myakka Rivers
Lobotes surinamensis (Tripletail) Springer &
Woodburn, 1960(1)
Lucania goodie (Bluefin killifish) 0
FMRI studies 1994-2001FMRI studies 1994-1996FMRI
fishery independent studies1989-present
Hillsborough RiverAlafia,
Little Manatee, Manatee, Peace
Rivers
Lucania goodie (Bluefin killifish) Funderburk et al.,
1991(1)
Lucania parva (Rainwater killifish) < 1 0 - 31 Peebles et al., 1989 Alafia, McKay
Lucania parva (Rainwater killifish) 0 - 35
FMRI studies 1994-2001FMRI studies 1994-1996FMRI
fishery independent studies1989-present
Hillsborough RiverAlafia,
Little Manatee, Manatee, Peace
Rivers
Lucania parva (Rainwater killifish) <1 - 26 0-31 < 11.0, >
25.0
Peebles et al., 1989(1)(2); Springer
and Woodburn, 1960(1)(3); CCI,
1976d(1), 1977c(1); Gunter, 1945(2)(3);
Kilby, 1955(3); Simpson and Gunter,
1956(2)
Lucania synagris 22.0 - 35.0 Springer and
Woodburn, 1960(1)
Lutjainus campechanus
(Snapper) 33 - 37 Moran, 1988
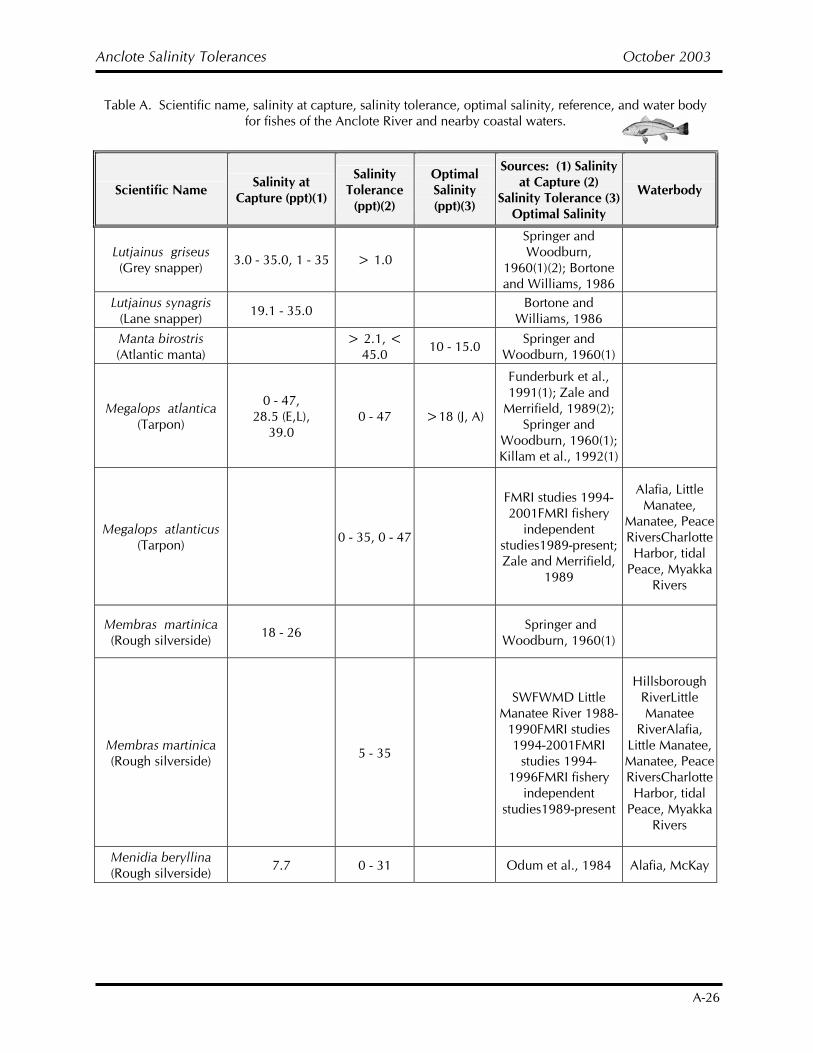
Anclote Salinity Tolerances October 2003
A-26
Table A. Scientific name, salinity at capture, salinity tolerance, optimal salinity, reference, and water body for fishes of the Anclote River and nearby coastal waters.
Scientific Name Salinity at Capture (ppt)(1)
Salinity Tolerance
(ppt)(2)
Optimal Salinity (ppt)(3)
Sources: (1) Salinity at Capture (2)
Salinity Tolerance (3) Optimal Salinity
Waterbody
Lutjainus griseus (Grey snapper) 3.0 - 35.0, 1 - 35 > 1.0
Springer and Woodburn,
1960(1)(2); Bortone and Williams, 1986
Lutjainus synagris (Lane snapper) 19.1 - 35.0 Bortone and
Williams, 1986
Manta birostris (Atlantic manta) > 2.1, <
45.0 10 - 15.0 Springer and Woodburn, 1960(1)
Megalops atlantica (Tarpon)
0 - 47, 28.5 (E,L),
39.0 0 - 47 >18 (J, A)
Funderburk et al., 1991(1); Zale and
Merrifield, 1989(2); Springer and
Woodburn, 1960(1); Killam et al., 1992(1)
Megalops atlanticus (Tarpon) 0 - 35, 0 - 47
FMRI studies 1994-2001FMRI fishery
independent studies1989-present; Zale and Merrifield,
1989
Alafia, Little Manatee,
Manatee, Peace RiversCharlotte Harbor, tidal
Peace, Myakka Rivers
Membras martinica (Rough silverside) 18 - 26 Springer and
Woodburn, 1960(1)
Membras martinica (Rough silverside) 5 - 35
SWFWMD Little Manatee River 1988-
1990FMRI studies 1994-2001FMRI
studies 1994-1996FMRI fishery
independent studies1989-present
Hillsborough RiverLittle Manatee
RiverAlafia, Little Manatee, Manatee, Peace RiversCharlotte Harbor, tidal
Peace, Myakka Rivers
Menidia beryllina (Rough silverside) 7.7 0 - 31 Odum et al., 1984 Alafia, McKay
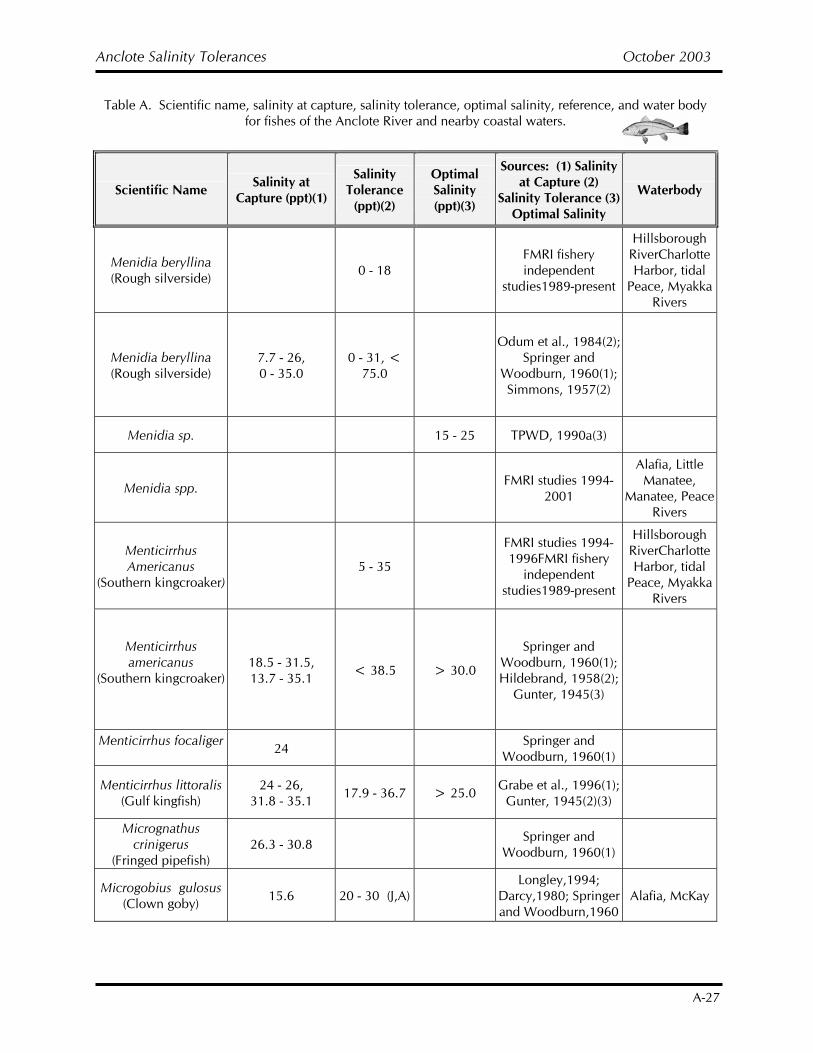
Anclote Salinity Tolerances October 2003
A-27
Table A. Scientific name, salinity at capture, salinity tolerance, optimal salinity, reference, and water body for fishes of the Anclote River and nearby coastal waters.
Scientific Name Salinity at Capture (ppt)(1)
Salinity Tolerance
(ppt)(2)
Optimal Salinity (ppt)(3)
Sources: (1) Salinity at Capture (2)
Salinity Tolerance (3) Optimal Salinity
Waterbody
Menidia beryllina (Rough silverside) 0 - 18
FMRI fishery independent
studies1989-present
Hillsborough RiverCharlotte Harbor, tidal
Peace, Myakka Rivers
Menidia beryllina (Rough silverside)
7.7 - 26, 0 - 35.0
0 - 31, < 75.0
Odum et al., 1984(2); Springer and
Woodburn, 1960(1); Simmons, 1957(2)
Menidia sp. 15 - 25 TPWD, 1990a(3)
Menidia spp. FMRI studies 1994-2001
Alafia, Little Manatee,
Manatee, Peace Rivers
Menticirrhus Americanus
(Southern kingcroaker) 5 - 35
FMRI studies 1994-1996FMRI fishery
independent studies1989-present
Hillsborough RiverCharlotte Harbor, tidal
Peace, Myakka Rivers
Menticirrhus americanus
(Southern kingcroaker)
18.5 - 31.5, 13.7 - 35.1 < 38.5 > 30.0
Springer and Woodburn, 1960(1); Hildebrand, 1958(2);
Gunter, 1945(3)
Menticirrhus focaliger 24 Springer and
Woodburn, 1960(1)
Menticirrhus littoralis (Gulf kingfish)
24 - 26, 31.8 - 35.1 17.9 - 36.7 > 25.0 Grabe et al., 1996(1);
Gunter, 1945(2)(3)
Micrognathus crinigerus
(Fringed pipefish) 26.3 - 30.8 Springer and
Woodburn, 1960(1)
Microgobius gulosus (Clown goby) 15.6 20 - 30 (J,A)
Longley,1994; Darcy,1980; Springer and Woodburn,1960
Alafia, McKay
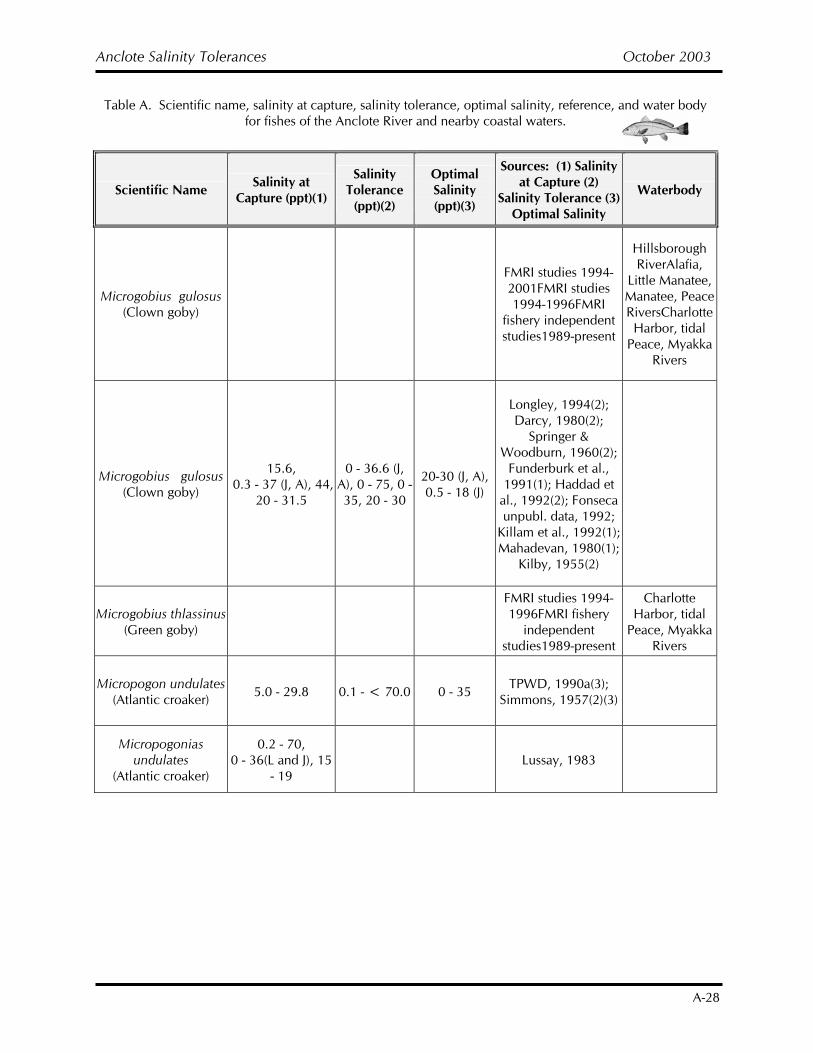
Anclote Salinity Tolerances October 2003
A-28
Table A. Scientific name, salinity at capture, salinity tolerance, optimal salinity, reference, and water body for fishes of the Anclote River and nearby coastal waters.
Scientific Name Salinity at Capture (ppt)(1)
Salinity Tolerance
(ppt)(2)
Optimal Salinity (ppt)(3)
Sources: (1) Salinity at Capture (2)
Salinity Tolerance (3) Optimal Salinity
Waterbody
Microgobius gulosus (Clown goby)
FMRI studies 1994-2001FMRI studies 1994-1996FMRI
fishery independent studies1989-present
Hillsborough RiverAlafia,
Little Manatee, Manatee, Peace RiversCharlotte Harbor, tidal
Peace, Myakka Rivers
Microgobius gulosus (Clown goby)
15.6, 0.3 - 37 (J, A), 44,
20 - 31.5
0 - 36.6 (J, A), 0 - 75, 0 - 35, 20 - 30
20-30 (J, A), 0.5 - 18 (J)
Longley, 1994(2); Darcy, 1980(2);
Springer & Woodburn, 1960(2);
Funderburk et al., 1991(1); Haddad et
al., 1992(2); Fonseca unpubl. data, 1992;
Killam et al., 1992(1); Mahadevan, 1980(1);
Kilby, 1955(2)
Microgobius thlassinus (Green goby)
FMRI studies 1994-1996FMRI fishery
independent studies1989-present
Charlotte Harbor, tidal
Peace, Myakka Rivers
Micropogon undulates (Atlantic croaker) 5.0 - 29.8 0.1 - < 70.0 0 - 35 TPWD, 1990a(3);
Simmons, 1957(2)(3)
Micropogonias undulates
(Atlantic croaker)
0.2 - 70, 0 - 36(L and J), 15
- 19 Lussay, 1983
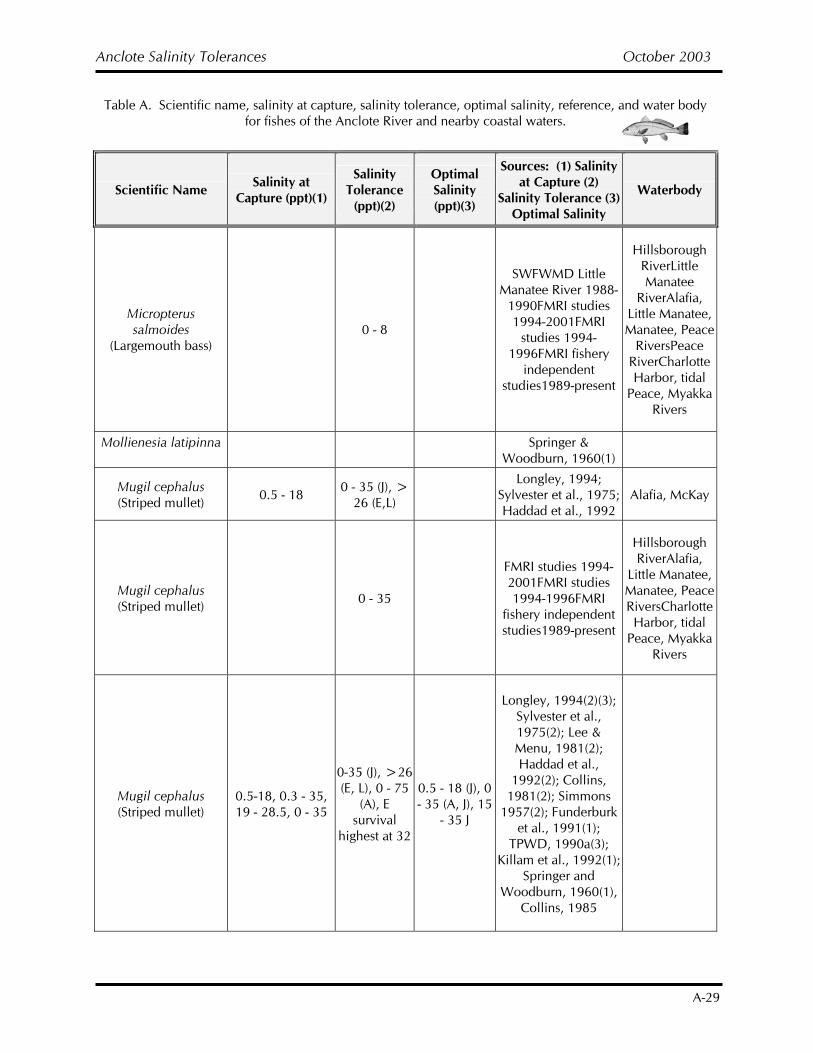
Anclote Salinity Tolerances October 2003
A-29
Table A. Scientific name, salinity at capture, salinity tolerance, optimal salinity, reference, and water body for fishes of the Anclote River and nearby coastal waters.
Scientific Name Salinity at Capture (ppt)(1)
Salinity Tolerance
(ppt)(2)
Optimal Salinity (ppt)(3)
Sources: (1) Salinity at Capture (2)
Salinity Tolerance (3) Optimal Salinity
Waterbody
Micropterus salmoides
(Largemouth bass) 0 - 8
SWFWMD Little Manatee River 1988-
1990FMRI studies 1994-2001FMRI
studies 1994-1996FMRI fishery
independent studies1989-present
Hillsborough RiverLittle Manatee
RiverAlafia, Little Manatee, Manatee, Peace
RiversPeace RiverCharlotte Harbor, tidal
Peace, Myakka Rivers
Mollienesia latipinna Springer &
Woodburn, 1960(1)
Mugil cephalus (Striped mullet) 0.5 - 18 0 - 35 (J), >
26 (E,L) Longley, 1994;
Sylvester et al., 1975; Haddad et al., 1992
Alafia, McKay
Mugil cephalus (Striped mullet) 0 - 35
FMRI studies 1994-2001FMRI studies 1994-1996FMRI
fishery independent studies1989-present
Hillsborough RiverAlafia,
Little Manatee, Manatee, Peace RiversCharlotte Harbor, tidal
Peace, Myakka Rivers
Mugil cephalus (Striped mullet)
0.5-18, 0.3 - 35, 19 - 28.5, 0 - 35
0-35 (J), >26 (E, L), 0 - 75
(A), E survival
highest at 32
0.5 - 18 (J), 0 - 35 (A, J), 15
- 35 J
Longley, 1994(2)(3); Sylvester et al., 1975(2); Lee & Menu, 1981(2); Haddad et al.,
1992(2); Collins, 1981(2); Simmons
1957(2); Funderburk et al., 1991(1);
TPWD, 1990a(3); Killam et al., 1992(1);
Springer and Woodburn, 1960(1),
Collins, 1985
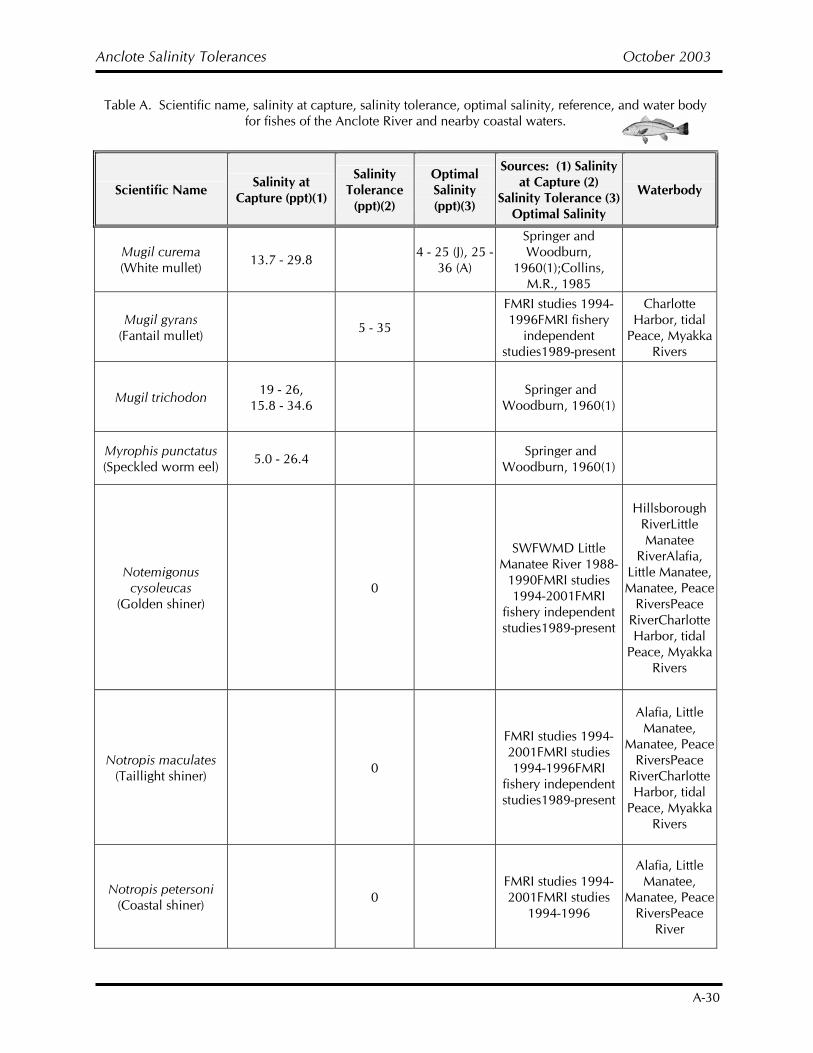
Anclote Salinity Tolerances October 2003
A-30
Table A. Scientific name, salinity at capture, salinity tolerance, optimal salinity, reference, and water body for fishes of the Anclote River and nearby coastal waters.
Scientific Name Salinity at Capture (ppt)(1)
Salinity Tolerance
(ppt)(2)
Optimal Salinity (ppt)(3)
Sources: (1) Salinity at Capture (2)
Salinity Tolerance (3) Optimal Salinity
Waterbody
Mugil curema (White mullet) 13.7 - 29.8 4 - 25 (J), 25 -
36 (A)
Springer and Woodburn,
1960(1);Collins, M.R., 1985
Mugil gyrans (Fantail mullet) 5 - 35
FMRI studies 1994-1996FMRI fishery
independent studies1989-present
Charlotte Harbor, tidal
Peace, Myakka Rivers
Mugil trichodon 19 - 26, 15.8 - 34.6 Springer and
Woodburn, 1960(1)
Myrophis punctatus (Speckled worm eel) 5.0 - 26.4 Springer and
Woodburn, 1960(1)
Notemigonus cysoleucas
(Golden shiner) 0
SWFWMD Little Manatee River 1988-
1990FMRI studies 1994-2001FMRI
fishery independent studies1989-present
Hillsborough RiverLittle Manatee
RiverAlafia, Little Manatee, Manatee, Peace
RiversPeace RiverCharlotte Harbor, tidal
Peace, Myakka Rivers
Notropis maculates (Taillight shiner) 0
FMRI studies 1994-2001FMRI studies 1994-1996FMRI
fishery independent studies1989-present
Alafia, Little Manatee,
Manatee, Peace RiversPeace
RiverCharlotte Harbor, tidal
Peace, Myakka Rivers
Notropis petersoni (Coastal shiner) 0
FMRI studies 1994-2001FMRI studies
1994-1996
Alafia, Little Manatee,
Manatee, Peace RiversPeace
River
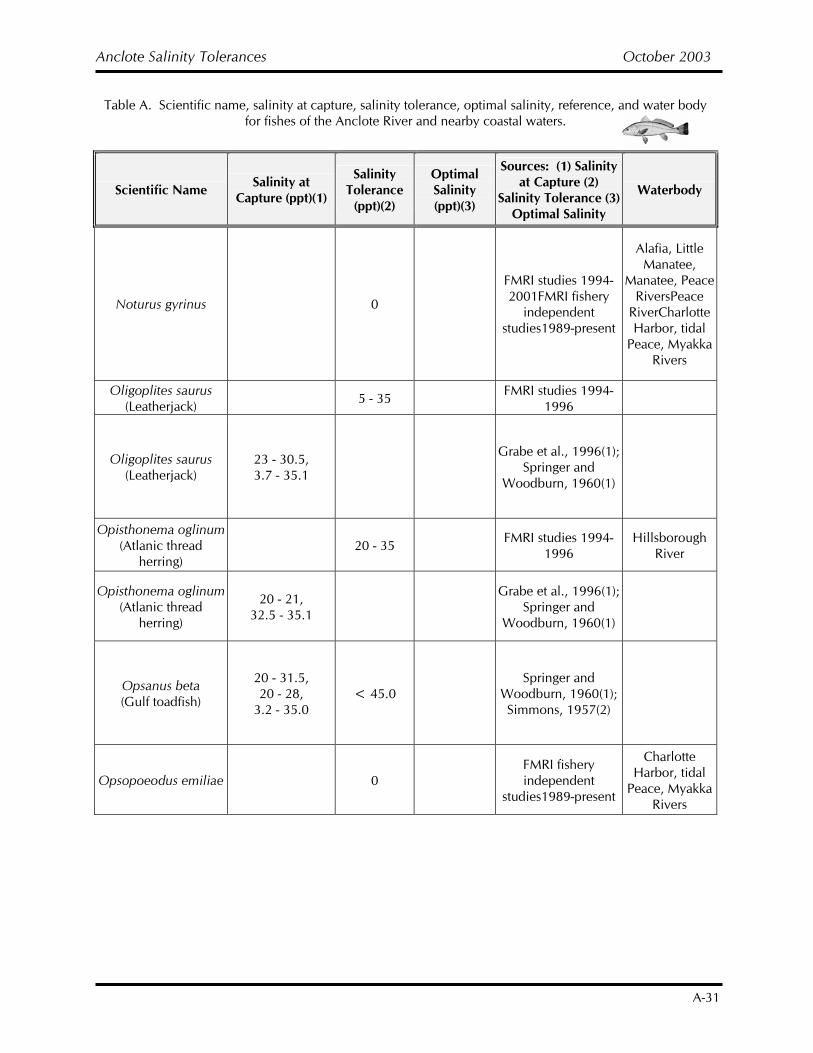
Anclote Salinity Tolerances October 2003
A-31
Table A. Scientific name, salinity at capture, salinity tolerance, optimal salinity, reference, and water body for fishes of the Anclote River and nearby coastal waters.
Scientific Name Salinity at Capture (ppt)(1)
Salinity Tolerance
(ppt)(2)
Optimal Salinity (ppt)(3)
Sources: (1) Salinity at Capture (2)
Salinity Tolerance (3) Optimal Salinity
Waterbody
Noturus gyrinus 0
FMRI studies 1994-2001FMRI fishery
independent studies1989-present
Alafia, Little Manatee,
Manatee, Peace RiversPeace
RiverCharlotte Harbor, tidal
Peace, Myakka Rivers
Oligoplites saurus (Leatherjack) 5 - 35 FMRI studies 1994-
1996
Oligoplites saurus (Leatherjack)
23 - 30.5, 3.7 - 35.1
Grabe et al., 1996(1); Springer and
Woodburn, 1960(1)
Opisthonema oglinum (Atlanic thread
herring) 20 - 35 FMRI studies 1994-
1996 Hillsborough
River
Opisthonema oglinum (Atlanic thread
herring)
20 - 21, 32.5 - 35.1
Grabe et al., 1996(1); Springer and
Woodburn, 1960(1)
Opsanus beta (Gulf toadfish)
20 - 31.5, 20 - 28,
3.2 - 35.0 < 45.0
Springer and Woodburn, 1960(1); Simmons, 1957(2)
Opsopoeodus emiliae 0 FMRI fishery independent
studies1989-present
Charlotte Harbor, tidal
Peace, Myakka Rivers
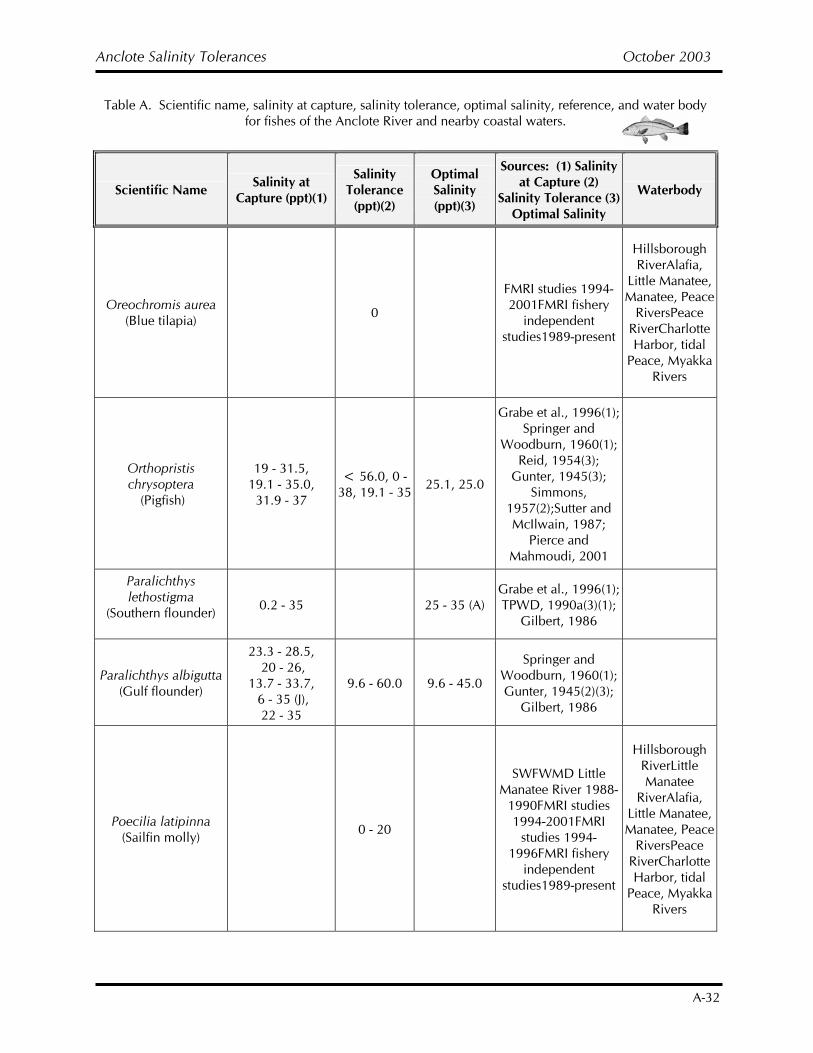
Anclote Salinity Tolerances October 2003
A-32
Table A. Scientific name, salinity at capture, salinity tolerance, optimal salinity, reference, and water body for fishes of the Anclote River and nearby coastal waters.
Scientific Name Salinity at Capture (ppt)(1)
Salinity Tolerance
(ppt)(2)
Optimal Salinity (ppt)(3)
Sources: (1) Salinity at Capture (2)
Salinity Tolerance (3) Optimal Salinity
Waterbody
Oreochromis aurea (Blue tilapia) 0
FMRI studies 1994-2001FMRI fishery
independent studies1989-present
Hillsborough RiverAlafia,
Little Manatee, Manatee, Peace
RiversPeace RiverCharlotte Harbor, tidal
Peace, Myakka Rivers
Orthopristis chrysoptera
(Pigfish)
19 - 31.5, 19.1 - 35.0, 31.9 - 37
< 56.0, 0 - 38, 19.1 - 35 25.1, 25.0
Grabe et al., 1996(1); Springer and
Woodburn, 1960(1); Reid, 1954(3);
Gunter, 1945(3); Simmons,
1957(2);Sutter and McIlwain, 1987;
Pierce and Mahmoudi, 2001
Paralichthys lethostigma
(Southern flounder)
0.2 - 35 25 - 35 (A) Grabe et al., 1996(1); TPWD, 1990a(3)(1);
Gilbert, 1986
Paralichthys albigutta (Gulf flounder)
23.3 - 28.5, 20 - 26,
13.7 - 33.7, 6 - 35 (J), 22 - 35
9.6 - 60.0 9.6 - 45.0
Springer and Woodburn, 1960(1); Gunter, 1945(2)(3);
Gilbert, 1986
Poecilia latipinna (Sailfin molly) 0 - 20
SWFWMD Little Manatee River 1988-
1990FMRI studies 1994-2001FMRI
studies 1994-1996FMRI fishery
independent studies1989-present
Hillsborough RiverLittle Manatee
RiverAlafia, Little Manatee, Manatee, Peace
RiversPeace RiverCharlotte Harbor, tidal
Peace, Myakka Rivers
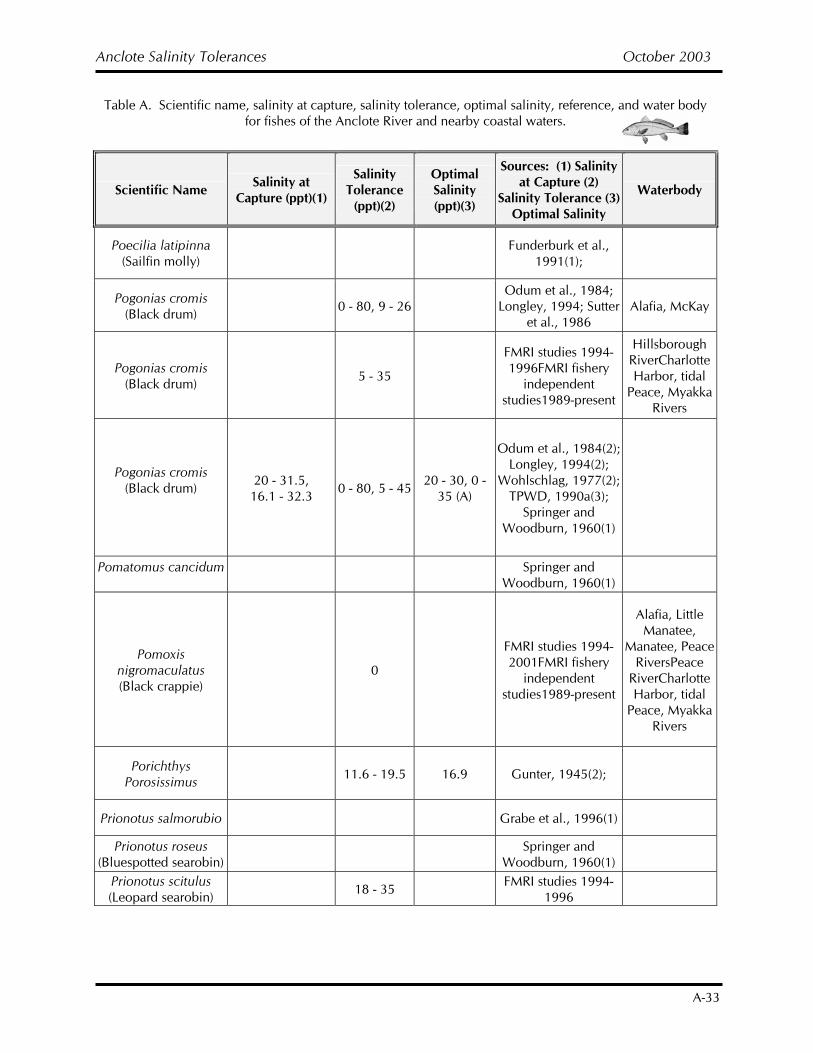
Anclote Salinity Tolerances October 2003
A-33
Table A. Scientific name, salinity at capture, salinity tolerance, optimal salinity, reference, and water body for fishes of the Anclote River and nearby coastal waters.
Scientific Name Salinity at Capture (ppt)(1)
Salinity Tolerance
(ppt)(2)
Optimal Salinity (ppt)(3)
Sources: (1) Salinity at Capture (2)
Salinity Tolerance (3) Optimal Salinity
Waterbody
Poecilia latipinna (Sailfin molly) Funderburk et al.,
1991(1);
Pogonias cromis (Black drum) 0 - 80, 9 - 26
Odum et al., 1984; Longley, 1994; Sutter
et al., 1986 Alafia, McKay
Pogonias cromis (Black drum) 5 - 35
FMRI studies 1994-1996FMRI fishery
independent studies1989-present
Hillsborough RiverCharlotte Harbor, tidal
Peace, Myakka Rivers
Pogonias cromis (Black drum)
20 - 31.5, 16.1 - 32.3 0 - 80, 5 - 45 20 - 30, 0 -
35 (A)
Odum et al., 1984(2); Longley, 1994(2);
Wohlschlag, 1977(2); TPWD, 1990a(3);
Springer and Woodburn, 1960(1)
Pomatomus cancidum Springer and
Woodburn, 1960(1)
Pomoxis nigromaculatus (Black crappie)
0
FMRI studies 1994-2001FMRI fishery
independent studies1989-present
Alafia, Little Manatee,
Manatee, Peace RiversPeace
RiverCharlotte Harbor, tidal
Peace, Myakka Rivers
Porichthys Porosissimus 11.6 - 19.5 16.9 Gunter, 1945(2);
Prionotus salmorubio Grabe et al., 1996(1)
Prionotus roseus (Bluespotted searobin) Springer and
Woodburn, 1960(1)
Prionotus scitulus (Leopard searobin) 18 - 35 FMRI studies 1994-
1996
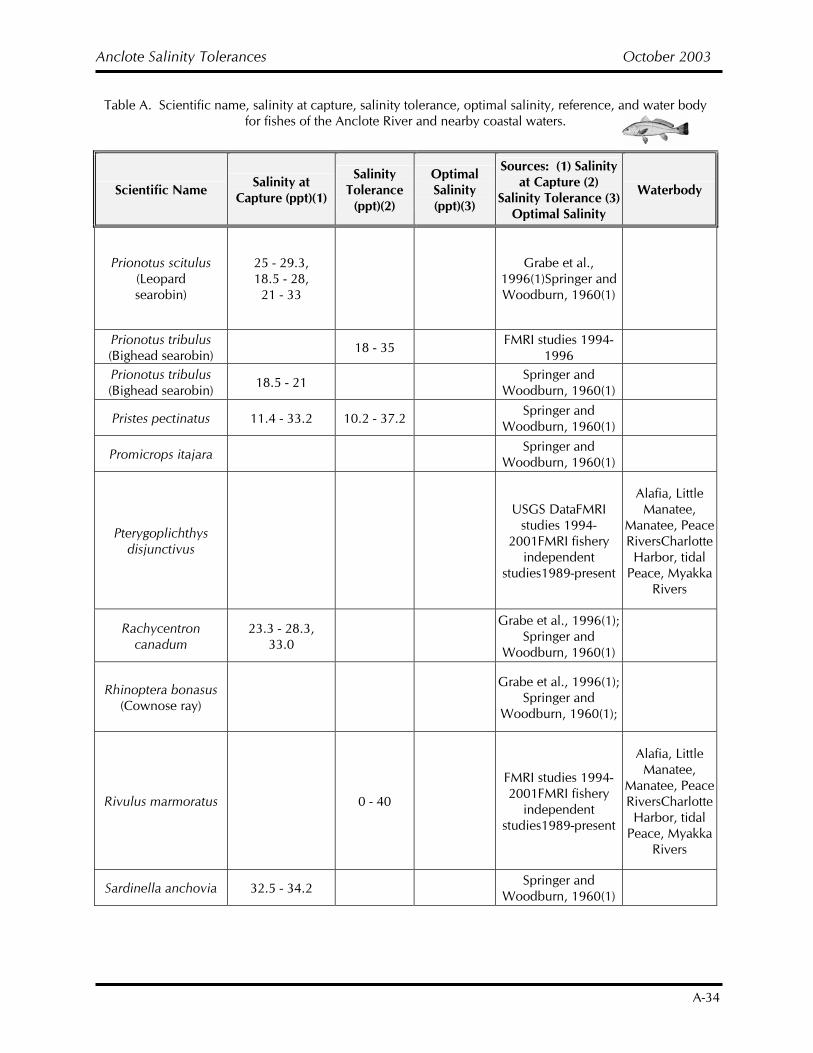
Anclote Salinity Tolerances October 2003
A-34
Table A. Scientific name, salinity at capture, salinity tolerance, optimal salinity, reference, and water body for fishes of the Anclote River and nearby coastal waters.
Scientific Name Salinity at Capture (ppt)(1)
Salinity Tolerance
(ppt)(2)
Optimal Salinity (ppt)(3)
Sources: (1) Salinity at Capture (2)
Salinity Tolerance (3) Optimal Salinity
Waterbody
Prionotus scitulus (Leopard searobin)
25 - 29.3, 18.5 - 28, 21 - 33
Grabe et al.,
1996(1)Springer and Woodburn, 1960(1)
Prionotus tribulus (Bighead searobin) 18 - 35 FMRI studies 1994-
1996
Prionotus tribulus (Bighead searobin) 18.5 - 21 Springer and
Woodburn, 1960(1)
Pristes pectinatus 11.4 - 33.2 10.2 - 37.2 Springer and Woodburn, 1960(1)
Promicrops itajara Springer and Woodburn, 1960(1)
Pterygoplichthys disjunctivus
USGS DataFMRI studies 1994-
2001FMRI fishery independent
studies1989-present
Alafia, Little Manatee,
Manatee, Peace RiversCharlotte Harbor, tidal
Peace, Myakka Rivers
Rachycentron canadum
23.3 - 28.3, 33.0
Grabe et al., 1996(1); Springer and
Woodburn, 1960(1)
Rhinoptera bonasus (Cownose ray)
Grabe et al., 1996(1); Springer and
Woodburn, 1960(1);
Rivulus marmoratus 0 - 40
FMRI studies 1994-2001FMRI fishery
independent studies1989-present
Alafia, Little Manatee,
Manatee, Peace RiversCharlotte Harbor, tidal
Peace, Myakka Rivers
Sardinella anchovia 32.5 - 34.2 Springer and Woodburn, 1960(1)
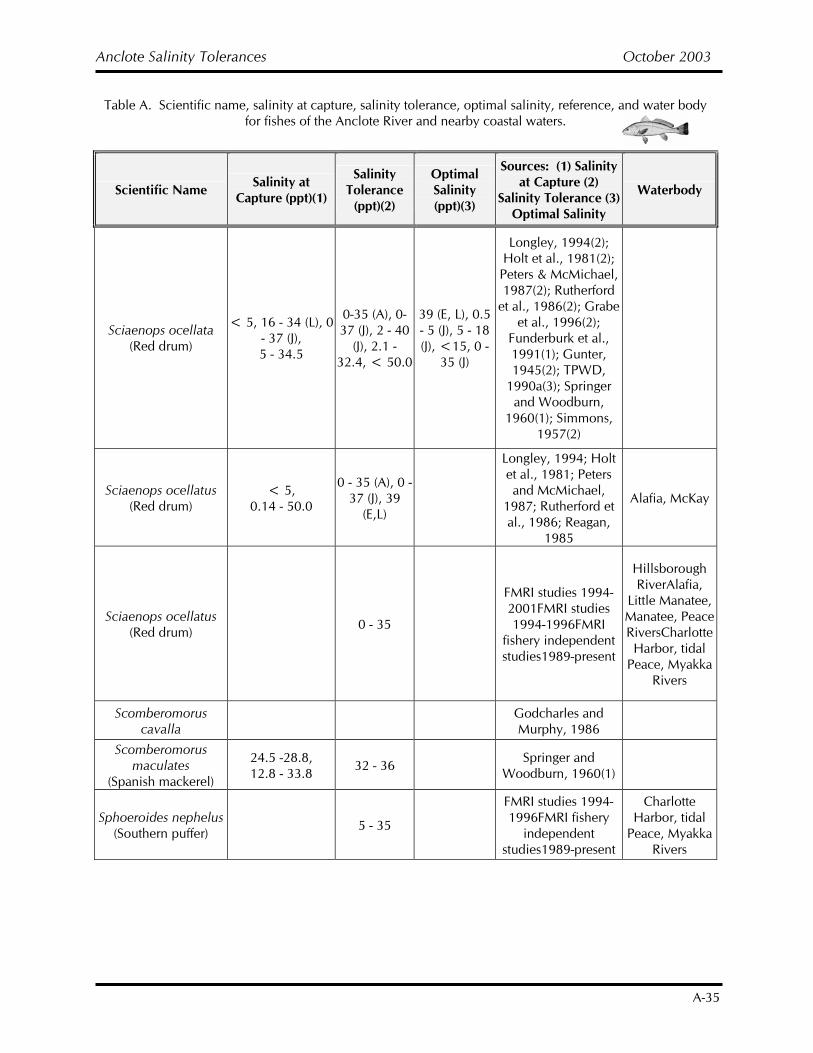
Anclote Salinity Tolerances October 2003
A-35
Table A. Scientific name, salinity at capture, salinity tolerance, optimal salinity, reference, and water body for fishes of the Anclote River and nearby coastal waters.
Scientific Name Salinity at Capture (ppt)(1)
Salinity Tolerance
(ppt)(2)
Optimal Salinity (ppt)(3)
Sources: (1) Salinity at Capture (2)
Salinity Tolerance (3) Optimal Salinity
Waterbody
Sciaenops ocellata (Red drum)
< 5, 16 - 34 (L), 0 - 37 (J), 5 - 34.5
0-35 (A), 0-37 (J), 2 - 40
(J), 2.1 - 32.4, < 50.0
39 (E, L), 0.5 - 5 (J), 5 - 18 (J), <15, 0 -
35 (J)
Longley, 1994(2); Holt et al., 1981(2); Peters & McMichael, 1987(2); Rutherford
et al., 1986(2); Grabe et al., 1996(2);
Funderburk et al., 1991(1); Gunter, 1945(2); TPWD,
1990a(3); Springer and Woodburn,
1960(1); Simmons, 1957(2)
Sciaenops ocellatus (Red drum)
< 5, 0.14 - 50.0
0 - 35 (A), 0 - 37 (J), 39
(E,L)
Longley, 1994; Holt et al., 1981; Peters and McMichael,
1987; Rutherford et al., 1986; Reagan,
1985
Alafia, McKay
Sciaenops ocellatus (Red drum) 0 - 35
FMRI studies 1994-2001FMRI studies 1994-1996FMRI
fishery independent studies1989-present
Hillsborough RiverAlafia,
Little Manatee, Manatee, Peace RiversCharlotte Harbor, tidal
Peace, Myakka Rivers
Scomberomorus cavalla Godcharles and
Murphy, 1986
Scomberomorus maculates
(Spanish mackerel)
24.5 -28.8, 12.8 - 33.8 32 - 36 Springer and
Woodburn, 1960(1)
Sphoeroides nephelus (Southern puffer) 5 - 35
FMRI studies 1994-1996FMRI fishery
independent studies1989-present
Charlotte Harbor, tidal
Peace, Myakka Rivers
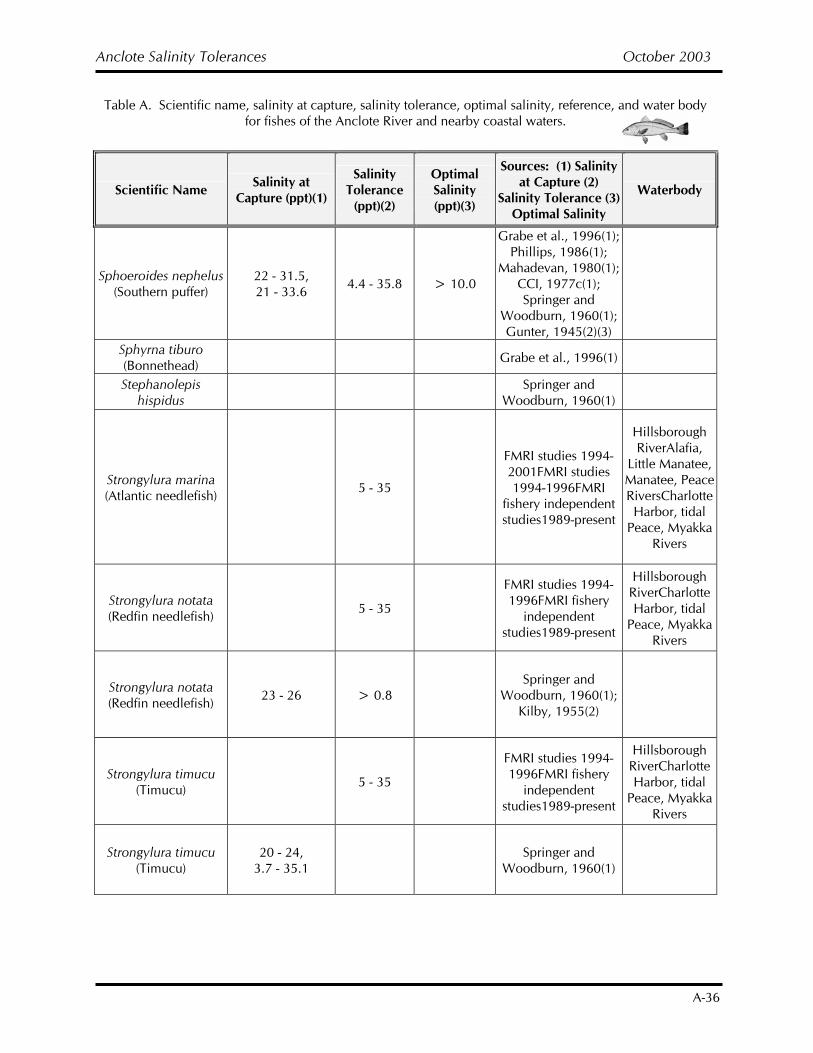
Anclote Salinity Tolerances October 2003
A-36
Table A. Scientific name, salinity at capture, salinity tolerance, optimal salinity, reference, and water body for fishes of the Anclote River and nearby coastal waters.
Scientific Name Salinity at Capture (ppt)(1)
Salinity Tolerance
(ppt)(2)
Optimal Salinity (ppt)(3)
Sources: (1) Salinity at Capture (2)
Salinity Tolerance (3) Optimal Salinity
Waterbody
Sphoeroides nephelus (Southern puffer)
22 - 31.5, 21 - 33.6 4.4 - 35.8 > 10.0
Grabe et al., 1996(1); Phillips, 1986(1);
Mahadevan, 1980(1); CCI, 1977c(1); Springer and
Woodburn, 1960(1); Gunter, 1945(2)(3)
Sphyrna tiburo (Bonnethead) Grabe et al., 1996(1)
Stephanolepis hispidus Springer and
Woodburn, 1960(1)
Strongylura marina (Atlantic needlefish) 5 - 35
FMRI studies 1994-2001FMRI studies 1994-1996FMRI
fishery independent studies1989-present
Hillsborough RiverAlafia,
Little Manatee, Manatee, Peace RiversCharlotte Harbor, tidal
Peace, Myakka Rivers
Strongylura notata (Redfin needlefish) 5 - 35
FMRI studies 1994-1996FMRI fishery
independent studies1989-present
Hillsborough RiverCharlotte Harbor, tidal
Peace, Myakka Rivers
Strongylura notata (Redfin needlefish) 23 - 26 > 0.8
Springer and Woodburn, 1960(1);
Kilby, 1955(2)
Strongylura timucu (Timucu) 5 - 35
FMRI studies 1994-1996FMRI fishery
independent studies1989-present
Hillsborough RiverCharlotte Harbor, tidal
Peace, Myakka Rivers
Strongylura timucu (Timucu)
20 - 24, 3.7 - 35.1 Springer and
Woodburn, 1960(1)
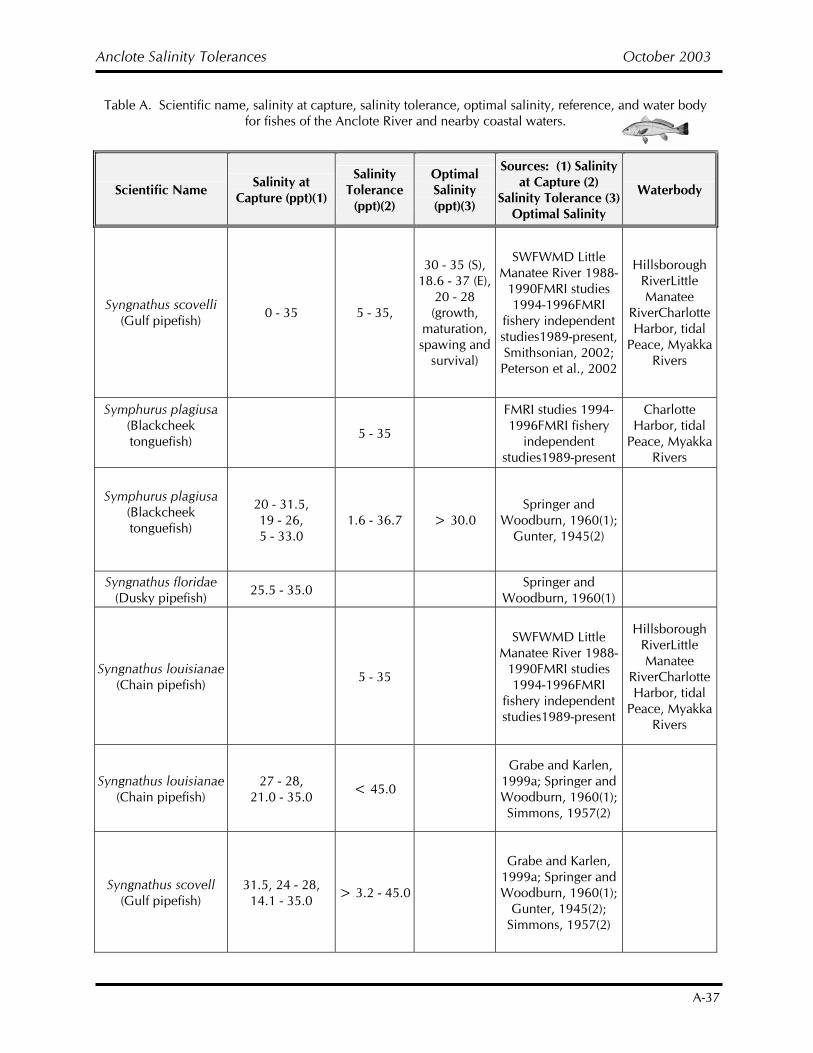
Anclote Salinity Tolerances October 2003
A-37
Table A. Scientific name, salinity at capture, salinity tolerance, optimal salinity, reference, and water body for fishes of the Anclote River and nearby coastal waters.
Scientific Name Salinity at Capture (ppt)(1)
Salinity Tolerance
(ppt)(2)
Optimal Salinity (ppt)(3)
Sources: (1) Salinity at Capture (2)
Salinity Tolerance (3) Optimal Salinity
Waterbody
Syngnathus scovelli (Gulf pipefish) 0 - 35 5 - 35,
30 - 35 (S), 18.6 - 37 (E),
20 - 28 (growth,
maturation, spawing and
survival)
SWFWMD Little Manatee River 1988-
1990FMRI studies 1994-1996FMRI
fishery independent studies1989-present, Smithsonian, 2002; Peterson et al., 2002
Hillsborough RiverLittle Manatee
RiverCharlotte Harbor, tidal
Peace, Myakka Rivers
Symphurus plagiusa (Blackcheek tonguefish)
5 - 35
FMRI studies 1994-1996FMRI fishery
independent studies1989-present
Charlotte Harbor, tidal
Peace, Myakka Rivers
Symphurus plagiusa (Blackcheek tonguefish)
20 - 31.5, 19 - 26, 5 - 33.0
1.6 - 36.7 > 30.0 Springer and
Woodburn, 1960(1); Gunter, 1945(2)
Syngnathus floridae (Dusky pipefish) 25.5 - 35.0 Springer and
Woodburn, 1960(1)
Syngnathus louisianae (Chain pipefish) 5 - 35
SWFWMD Little Manatee River 1988-
1990FMRI studies 1994-1996FMRI
fishery independent studies1989-present
Hillsborough RiverLittle Manatee
RiverCharlotte Harbor, tidal
Peace, Myakka Rivers
Syngnathus louisianae (Chain pipefish)
27 - 28, 21.0 - 35.0 < 45.0
Grabe and Karlen, 1999a; Springer and Woodburn, 1960(1); Simmons, 1957(2)
Syngnathus scovell (Gulf pipefish)
31.5, 24 - 28, 14.1 - 35.0 > 3.2 - 45.0
Grabe and Karlen, 1999a; Springer and Woodburn, 1960(1);
Gunter, 1945(2); Simmons, 1957(2)
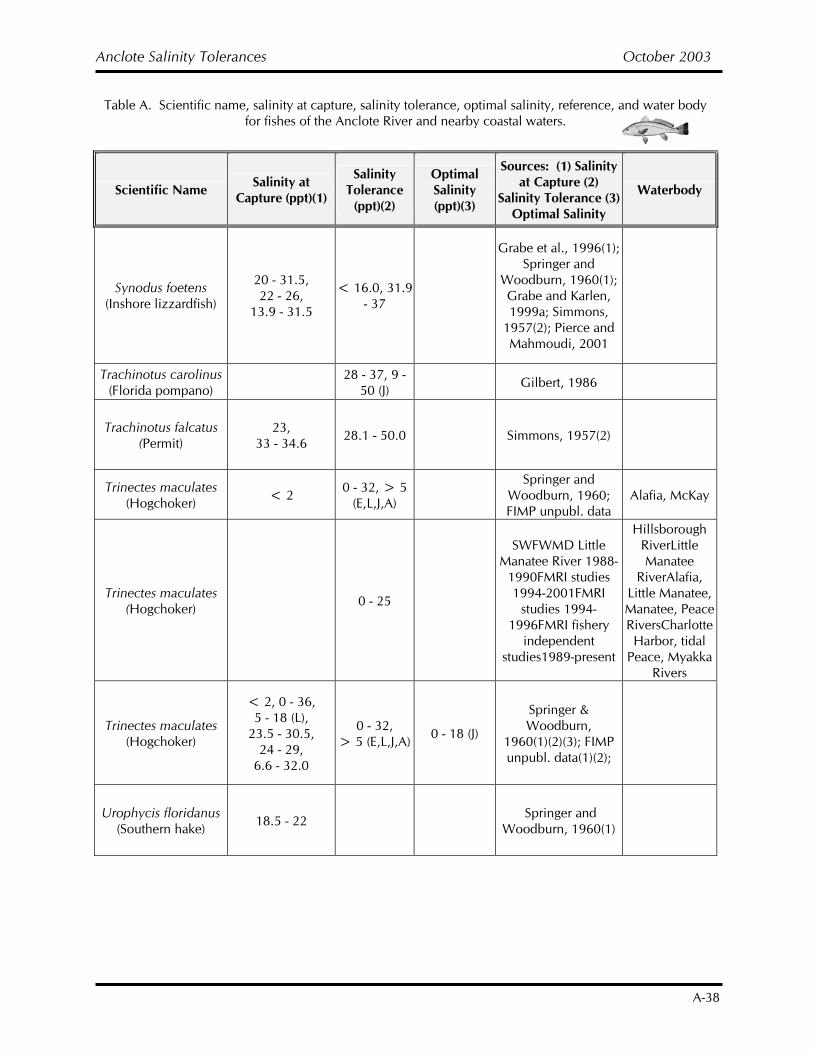
Anclote Salinity Tolerances October 2003
A-38
Table A. Scientific name, salinity at capture, salinity tolerance, optimal salinity, reference, and water body for fishes of the Anclote River and nearby coastal waters.
Scientific Name Salinity at Capture (ppt)(1)
Salinity Tolerance
(ppt)(2)
Optimal Salinity (ppt)(3)
Sources: (1) Salinity at Capture (2)
Salinity Tolerance (3) Optimal Salinity
Waterbody
Synodus foetens (Inshore lizzardfish)
20 - 31.5, 22 - 26,
13.9 - 31.5
< 16.0, 31.9 - 37
Grabe et al., 1996(1); Springer and
Woodburn, 1960(1); Grabe and Karlen, 1999a; Simmons,
1957(2); Pierce and Mahmoudi, 2001
Trachinotus carolinus (Florida pompano) 28 - 37, 9 -
50 (J) Gilbert, 1986
Trachinotus falcatus (Permit)
23, 33 - 34.6 28.1 - 50.0 Simmons, 1957(2)
Trinectes maculates (Hogchoker) < 2 0 - 32, > 5
(E,L,J,A) Springer and
Woodburn, 1960; FIMP unpubl. data
Alafia, McKay
Trinectes maculates (Hogchoker) 0 - 25
SWFWMD Little Manatee River 1988-
1990FMRI studies 1994-2001FMRI
studies 1994-1996FMRI fishery
independent studies1989-present
Hillsborough RiverLittle Manatee
RiverAlafia, Little Manatee, Manatee, Peace RiversCharlotte Harbor, tidal
Peace, Myakka Rivers
Trinectes maculates (Hogchoker)
< 2, 0 - 36, 5 - 18 (L),
23.5 - 30.5, 24 - 29,
6.6 - 32.0
0 - 32, > 5 (E,L,J,A) 0 - 18 (J)
Springer & Woodburn,
1960(1)(2)(3); FIMP unpubl. data(1)(2);
Urophycis floridanus (Southern hake) 18.5 - 22 Springer and
Woodburn, 1960(1)
Anclote Salinity Tolerances October 2003
B-1
APPENDIX B
INVERTEBRATES: Salinity Tolerance and Salinity Range Information
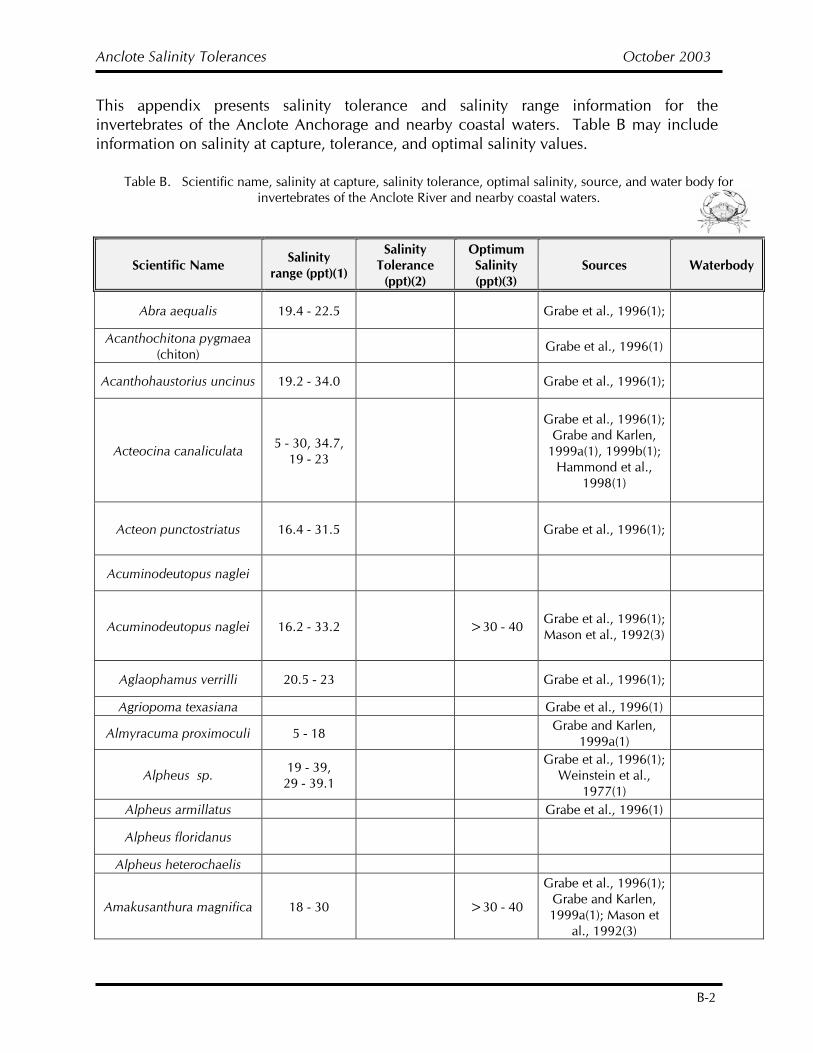
Anclote Salinity Tolerances October 2003
B-2
This appendix presents salinity tolerance and salinity range information for the invertebrates of the Anclote Anchorage and nearby coastal waters. Table B may include information on salinity at capture, tolerance, and optimal salinity values.
Table B. Scientific name, salinity at capture, salinity tolerance, optimal salinity, source, and water body for invertebrates of the Anclote River and nearby coastal waters.
Scientific Name Salinity range (ppt)(1)
Salinity Tolerance
(ppt)(2)
Optimum Salinity (ppt)(3)
Sources Waterbody
Abra aequalis 19.4 - 22.5 Grabe et al., 1996(1);
Acanthochitona pygmaea (chiton) Grabe et al., 1996(1)
Acanthohaustorius uncinus 19.2 - 34.0 Grabe et al., 1996(1);
Acteocina canaliculata 5 - 30, 34.7, 19 - 23
Grabe et al., 1996(1); Grabe and Karlen,
1999a(1), 1999b(1); Hammond et al.,
1998(1)
Acteon punctostriatus 16.4 - 31.5 Grabe et al., 1996(1);
Acuminodeutopus naglei
Acuminodeutopus naglei 16.2 - 33.2 >30 - 40 Grabe et al., 1996(1); Mason et al., 1992(3)
Aglaophamus verrilli 20.5 - 23 Grabe et al., 1996(1);
Agriopoma texasiana Grabe et al., 1996(1)
Almyracuma proximoculi 5 - 18 Grabe and Karlen, 1999a(1)
Alpheus sp. 19 - 39, 29 - 39.1
Grabe et al., 1996(1); Weinstein et al.,
1977(1)
Alpheus armillatus Grabe et al., 1996(1)
Alpheus floridanus
Alpheus heterochaelis
Amakusanthura magnifica 18 - 30 >30 - 40
Grabe et al., 1996(1); Grabe and Karlen, 1999a(1); Mason et
al., 1992(3)
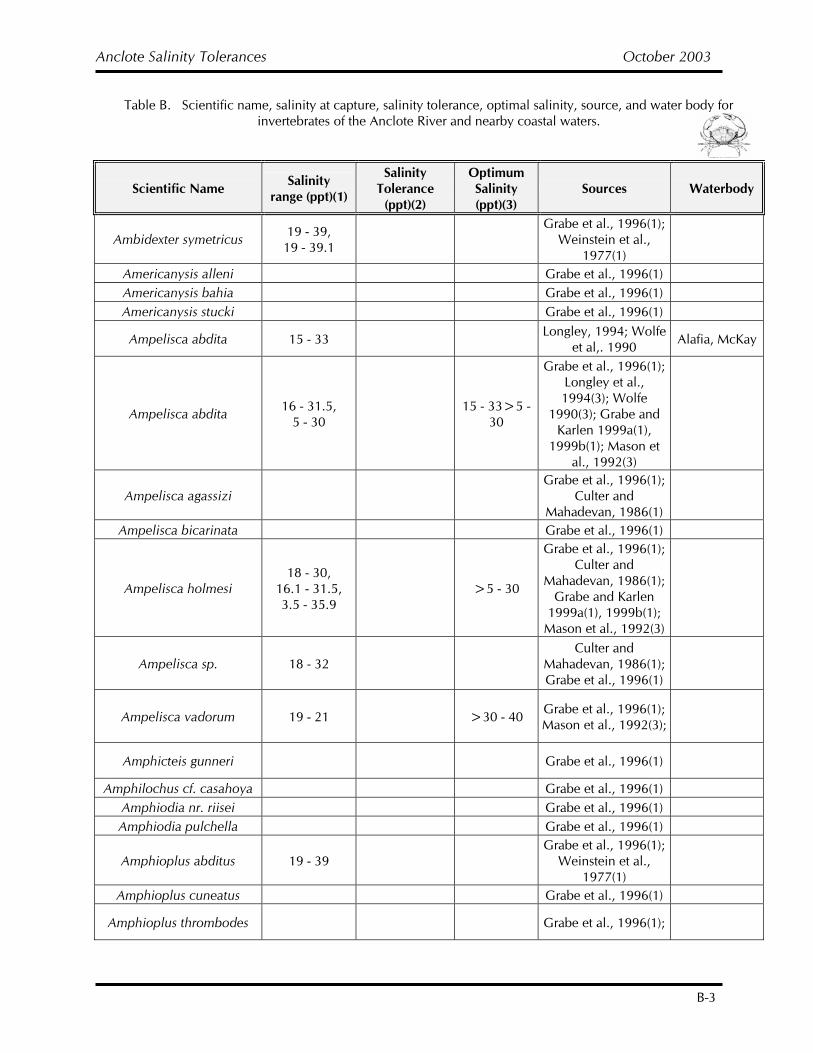
Anclote Salinity Tolerances October 2003
B-3
Table B. Scientific name, salinity at capture, salinity tolerance, optimal salinity, source, and water body for invertebrates of the Anclote River and nearby coastal waters.
Scientific Name Salinity range (ppt)(1)
Salinity Tolerance
(ppt)(2)
Optimum Salinity (ppt)(3)
Sources Waterbody
Ambidexter symetricus 19 - 39, 19 - 39.1
Grabe et al., 1996(1); Weinstein et al.,
1977(1)
Americanysis alleni Grabe et al., 1996(1) Americanysis bahia Grabe et al., 1996(1) Americanysis stucki Grabe et al., 1996(1)
Ampelisca abdita 15 - 33 Longley, 1994; Wolfe et al,. 1990 Alafia, McKay
Ampelisca abdita 16 - 31.5, 5 - 30 15 - 33>5 -
30
Grabe et al., 1996(1); Longley et al., 1994(3); Wolfe
1990(3); Grabe and Karlen 1999a(1),
1999b(1); Mason et al., 1992(3)
Ampelisca agassizi Grabe et al., 1996(1);
Culter and Mahadevan, 1986(1)
Ampelisca bicarinata Grabe et al., 1996(1)
Ampelisca holmesi 18 - 30,
16.1 - 31.5, 3.5 - 35.9
>5 - 30
Grabe et al., 1996(1); Culter and
Mahadevan, 1986(1); Grabe and Karlen
1999a(1), 1999b(1); Mason et al., 1992(3)
Ampelisca sp. 18 - 32 Culter and
Mahadevan, 1986(1); Grabe et al., 1996(1)
Ampelisca vadorum 19 - 21 >30 - 40 Grabe et al., 1996(1); Mason et al., 1992(3);
Amphicteis gunneri Grabe et al., 1996(1)
Amphilochus cf. casahoya Grabe et al., 1996(1) Amphiodia nr. riisei Grabe et al., 1996(1) Amphiodia pulchella Grabe et al., 1996(1)
Amphioplus abditus 19 - 39 Grabe et al., 1996(1);
Weinstein et al., 1977(1)
Amphioplus cuneatus Grabe et al., 1996(1)
Amphioplus thrombodes Grabe et al., 1996(1);
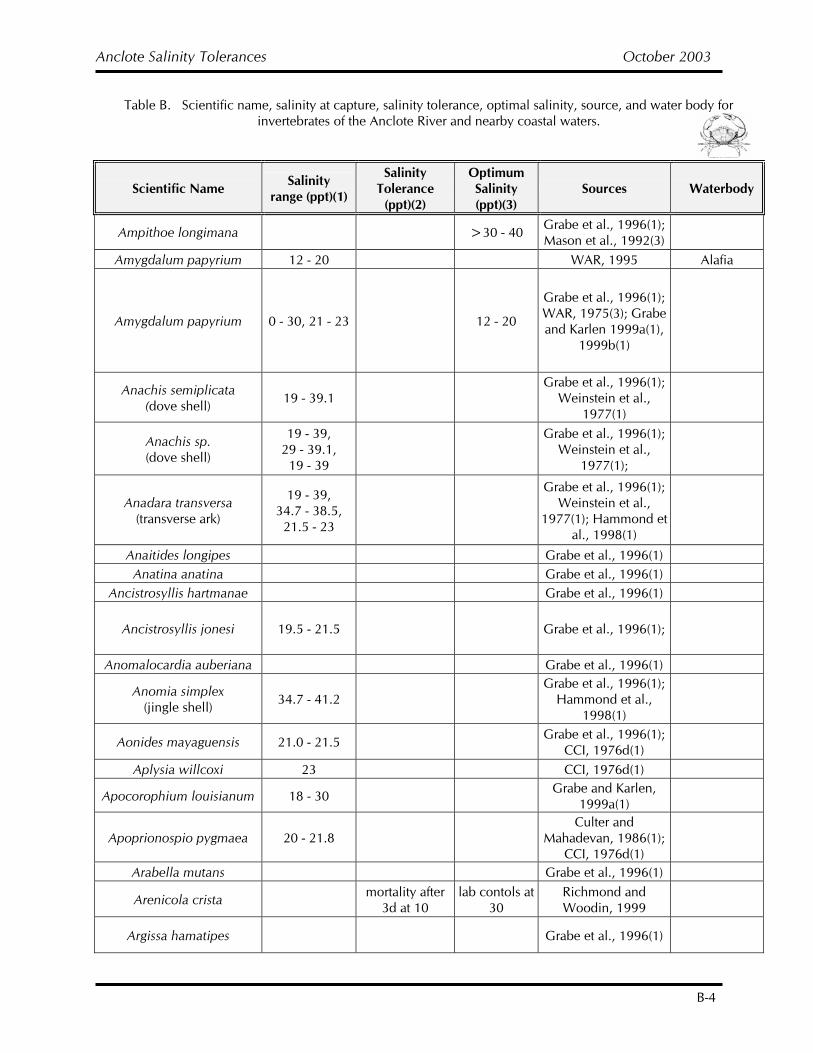
Anclote Salinity Tolerances October 2003
B-4
Table B. Scientific name, salinity at capture, salinity tolerance, optimal salinity, source, and water body for invertebrates of the Anclote River and nearby coastal waters.
Scientific Name Salinity range (ppt)(1)
Salinity Tolerance
(ppt)(2)
Optimum Salinity (ppt)(3)
Sources Waterbody
Ampithoe longimana >30 - 40 Grabe et al., 1996(1); Mason et al., 1992(3)
Amygdalum papyrium 12 - 20 WAR, 1995 Alafia
Amygdalum papyrium 0 - 30, 21 - 23 12 - 20
Grabe et al., 1996(1); WAR, 1975(3); Grabe and Karlen 1999a(1),
1999b(1)
Anachis semiplicata (dove shell) 19 - 39.1
Grabe et al., 1996(1); Weinstein et al.,
1977(1)
Anachis sp. (dove shell)
19 - 39, 29 - 39.1, 19 - 39
Grabe et al., 1996(1);
Weinstein et al., 1977(1);
Anadara transversa (transverse ark)
19 - 39, 34.7 - 38.5,
21.5 - 23
Grabe et al., 1996(1); Weinstein et al.,
1977(1); Hammond et al., 1998(1)
Anaitides longipes Grabe et al., 1996(1) Anatina anatina Grabe et al., 1996(1)
Ancistrosyllis hartmanae Grabe et al., 1996(1)
Ancistrosyllis jonesi 19.5 - 21.5 Grabe et al., 1996(1);
Anomalocardia auberiana Grabe et al., 1996(1)
Anomia simplex (jingle shell) 34.7 - 41.2
Grabe et al., 1996(1); Hammond et al.,
1998(1)
Aonides mayaguensis 21.0 - 21.5 Grabe et al., 1996(1); CCI, 1976d(1)
Aplysia willcoxi 23 CCI, 1976d(1)
Apocorophium louisianum 18 - 30 Grabe and Karlen, 1999a(1)
Apoprionospio pygmaea 20 - 21.8 Culter and
Mahadevan, 1986(1); CCI, 1976d(1)
Arabella mutans Grabe et al., 1996(1)
Arenicola crista mortality after 3d at 10
lab contols at 30
Richmond and Woodin, 1999
Argissa hamatipes Grabe et al., 1996(1)
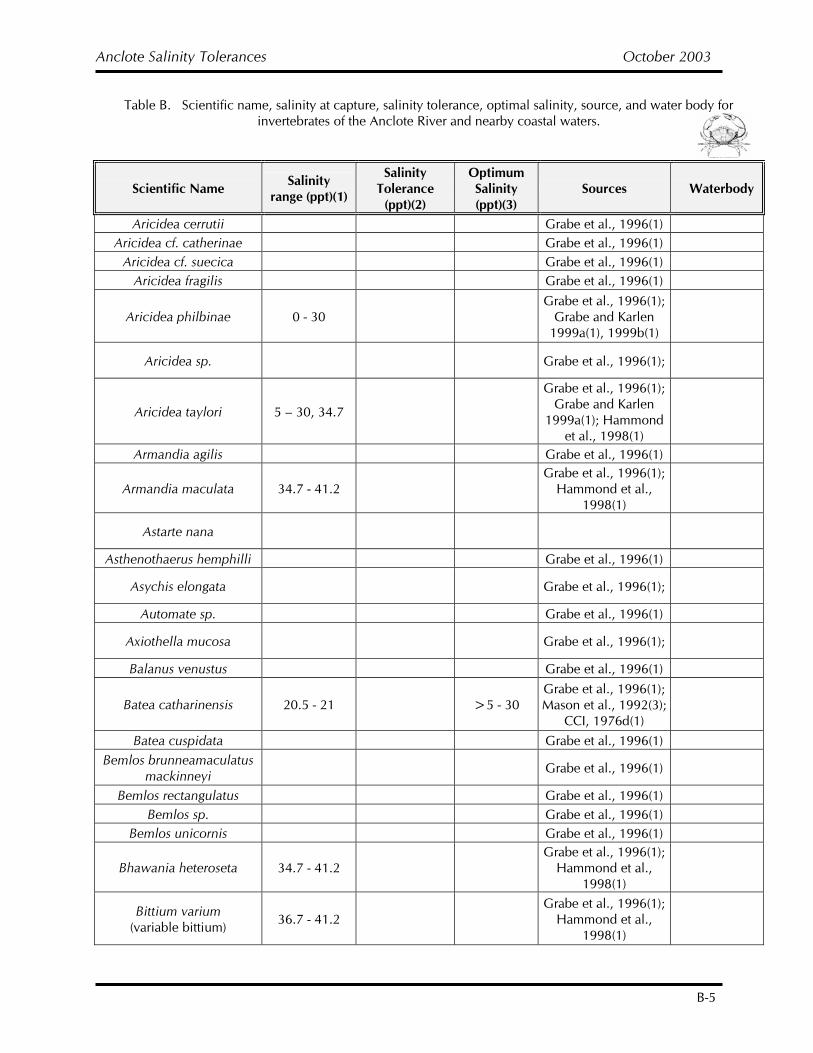
Anclote Salinity Tolerances October 2003
B-5
Table B. Scientific name, salinity at capture, salinity tolerance, optimal salinity, source, and water body for invertebrates of the Anclote River and nearby coastal waters.
Scientific Name Salinity range (ppt)(1)
Salinity Tolerance
(ppt)(2)
Optimum Salinity (ppt)(3)
Sources Waterbody
Aricidea cerrutii Grabe et al., 1996(1) Aricidea cf. catherinae Grabe et al., 1996(1)
Aricidea cf. suecica Grabe et al., 1996(1) Aricidea fragilis Grabe et al., 1996(1)
Aricidea philbinae 0 - 30 Grabe et al., 1996(1);
Grabe and Karlen 1999a(1), 1999b(1)
Aricidea sp. Grabe et al., 1996(1);
Aricidea taylori 5 – 30, 34.7
Grabe et al., 1996(1); Grabe and Karlen
1999a(1); Hammond et al., 1998(1)
Armandia agilis Grabe et al., 1996(1)
Armandia maculata 34.7 - 41.2 Grabe et al., 1996(1);
Hammond et al., 1998(1)
Astarte nana
Asthenothaerus hemphilli Grabe et al., 1996(1)
Asychis elongata Grabe et al., 1996(1);
Automate sp. Grabe et al., 1996(1)
Axiothella mucosa Grabe et al., 1996(1);
Balanus venustus Grabe et al., 1996(1)
Batea catharinensis 20.5 - 21 >5 - 30 Grabe et al., 1996(1); Mason et al., 1992(3);
CCI, 1976d(1)
Batea cuspidata Grabe et al., 1996(1) Bemlos brunneamaculatus
mackinneyi Grabe et al., 1996(1)
Bemlos rectangulatus Grabe et al., 1996(1) Bemlos sp. Grabe et al., 1996(1)
Bemlos unicornis Grabe et al., 1996(1)
Bhawania heteroseta 34.7 - 41.2 Grabe et al., 1996(1);
Hammond et al., 1998(1)
Bittium varium (variable bittium) 36.7 - 41.2
Grabe et al., 1996(1); Hammond et al.,
1998(1)
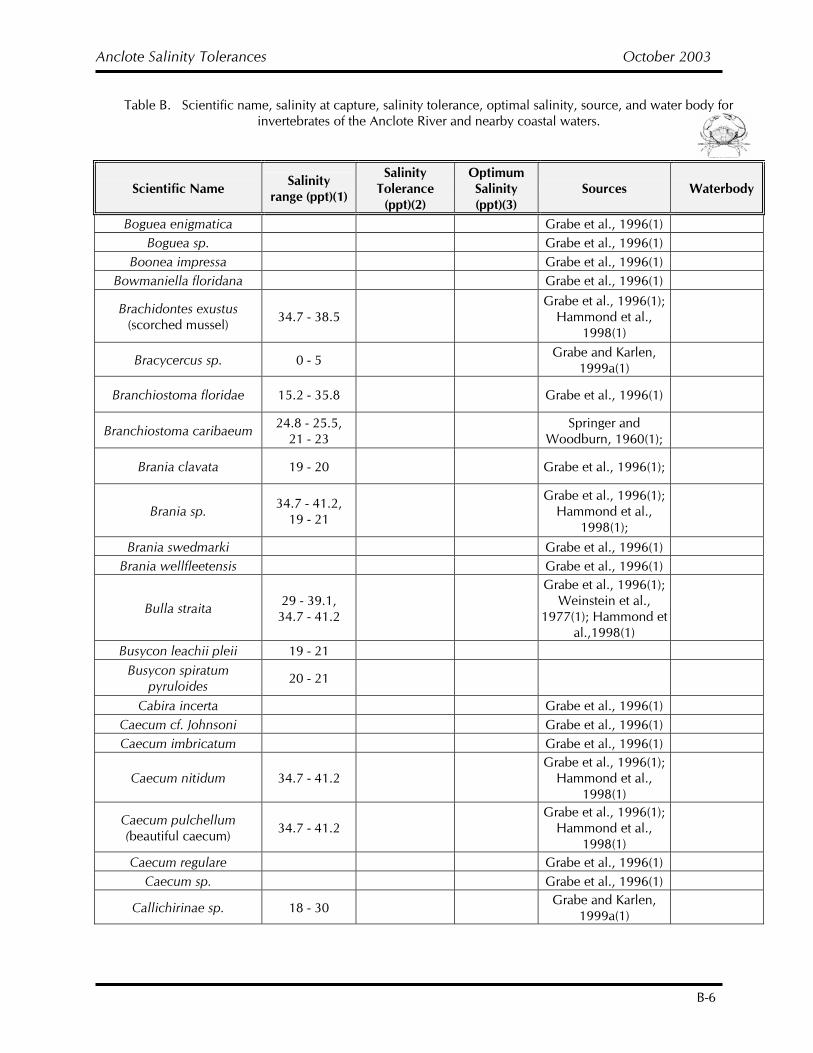
Anclote Salinity Tolerances October 2003
B-6
Table B. Scientific name, salinity at capture, salinity tolerance, optimal salinity, source, and water body for invertebrates of the Anclote River and nearby coastal waters.
Scientific Name Salinity range (ppt)(1)
Salinity Tolerance
(ppt)(2)
Optimum Salinity (ppt)(3)
Sources Waterbody
Boguea enigmatica Grabe et al., 1996(1) Boguea sp. Grabe et al., 1996(1)
Boonea impressa Grabe et al., 1996(1) Bowmaniella floridana Grabe et al., 1996(1)
Brachidontes exustus (scorched mussel) 34.7 - 38.5
Grabe et al., 1996(1); Hammond et al.,
1998(1)
Bracycercus sp. 0 - 5 Grabe and Karlen, 1999a(1)
Branchiostoma floridae 15.2 - 35.8 Grabe et al., 1996(1)
Branchiostoma caribaeum 24.8 - 25.5, 21 - 23 Springer and
Woodburn, 1960(1);
Brania clavata 19 - 20 Grabe et al., 1996(1);
Brania sp. 34.7 - 41.2, 19 - 21
Grabe et al., 1996(1); Hammond et al.,
1998(1);
Brania swedmarki Grabe et al., 1996(1) Brania wellfleetensis Grabe et al., 1996(1)
Bulla straita 29 - 39.1, 34.7 - 41.2
Grabe et al., 1996(1); Weinstein et al.,
1977(1); Hammond et al.,1998(1)
Busycon leachii pleii 19 - 21 Busycon spiratum
pyruloides 20 - 21
Cabira incerta Grabe et al., 1996(1) Caecum cf. Johnsoni Grabe et al., 1996(1) Caecum imbricatum Grabe et al., 1996(1)
Caecum nitidum 34.7 - 41.2 Grabe et al., 1996(1);
Hammond et al., 1998(1)
Caecum pulchellum (beautiful caecum) 34.7 - 41.2
Grabe et al., 1996(1); Hammond et al.,
1998(1)
Caecum regulare Grabe et al., 1996(1) Caecum sp. Grabe et al., 1996(1)
Callichirinae sp. 18 - 30 Grabe and Karlen, 1999a(1)
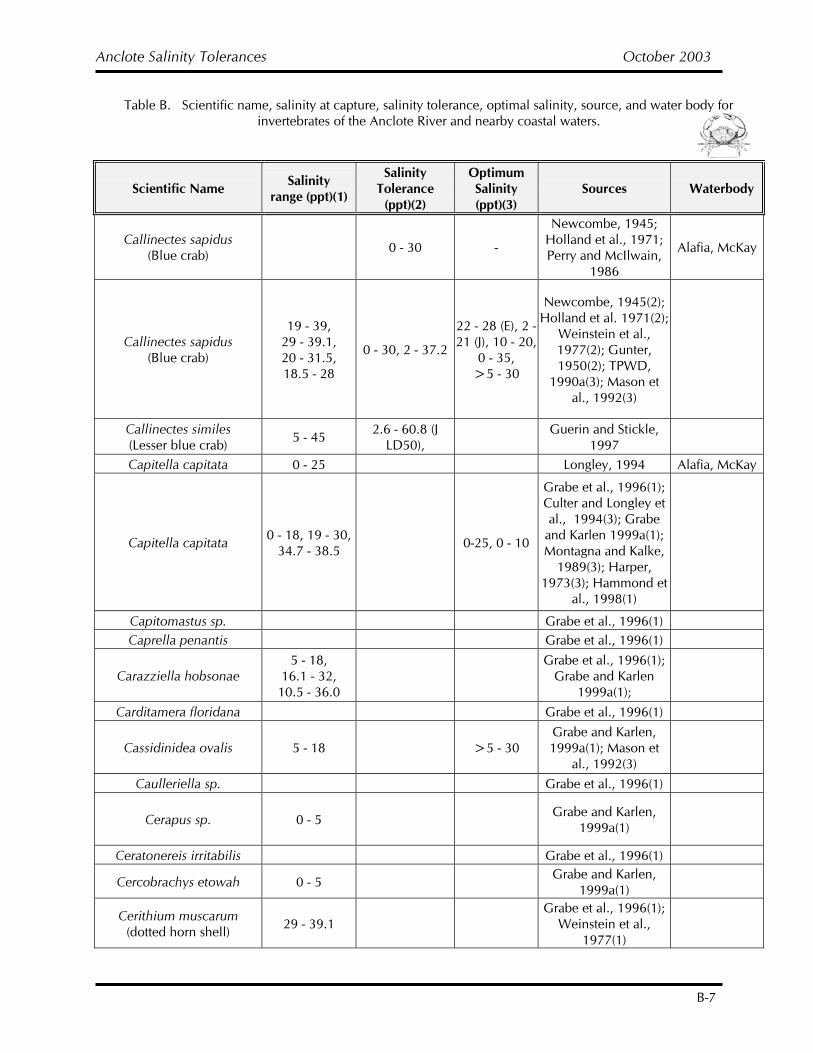
Anclote Salinity Tolerances October 2003
B-7
Table B. Scientific name, salinity at capture, salinity tolerance, optimal salinity, source, and water body for invertebrates of the Anclote River and nearby coastal waters.
Scientific Name Salinity range (ppt)(1)
Salinity Tolerance
(ppt)(2)
Optimum Salinity (ppt)(3)
Sources Waterbody
Callinectes sapidus (Blue crab) 0 - 30 -
Newcombe, 1945; Holland et al., 1971; Perry and McIlwain,
1986
Alafia, McKay
Callinectes sapidus (Blue crab)
19 - 39, 29 - 39.1, 20 - 31.5, 18.5 - 28
0 - 30, 2 - 37.2
22 - 28 (E), 2 - 21 (J), 10 - 20,
0 - 35, >5 - 30
Newcombe, 1945(2); Holland et al. 1971(2);
Weinstein et al., 1977(2); Gunter, 1950(2); TPWD,
1990a(3); Mason et al., 1992(3)
Callinectes similes (Lesser blue crab) 5 - 45 2.6 - 60.8 (J
LD50), Guerin and Stickle, 1997
Capitella capitata 0 - 25 Longley, 1994 Alafia, McKay
Capitella capitata 0 - 18, 19 - 30, 34.7 - 38.5 0-25, 0 - 10
Grabe et al., 1996(1); Culter and Longley et al., 1994(3); Grabe
and Karlen 1999a(1); Montagna and Kalke,
1989(3); Harper, 1973(3); Hammond et
al., 1998(1)
Capitomastus sp. Grabe et al., 1996(1) Caprella penantis Grabe et al., 1996(1)
Carazziella hobsonae 5 - 18,
16.1 - 32, 10.5 - 36.0
Grabe et al., 1996(1);
Grabe and Karlen 1999a(1);
Carditamera floridana Grabe et al., 1996(1)
Cassidinidea ovalis 5 - 18 >5 - 30 Grabe and Karlen, 1999a(1); Mason et
al., 1992(3)
Caulleriella sp. Grabe et al., 1996(1)
Cerapus sp. 0 - 5 Grabe and Karlen, 1999a(1)
Ceratonereis irritabilis Grabe et al., 1996(1)
Cercobrachys etowah 0 - 5 Grabe and Karlen, 1999a(1)
Cerithium muscarum (dotted horn shell) 29 - 39.1
Grabe et al., 1996(1); Weinstein et al.,
1977(1)
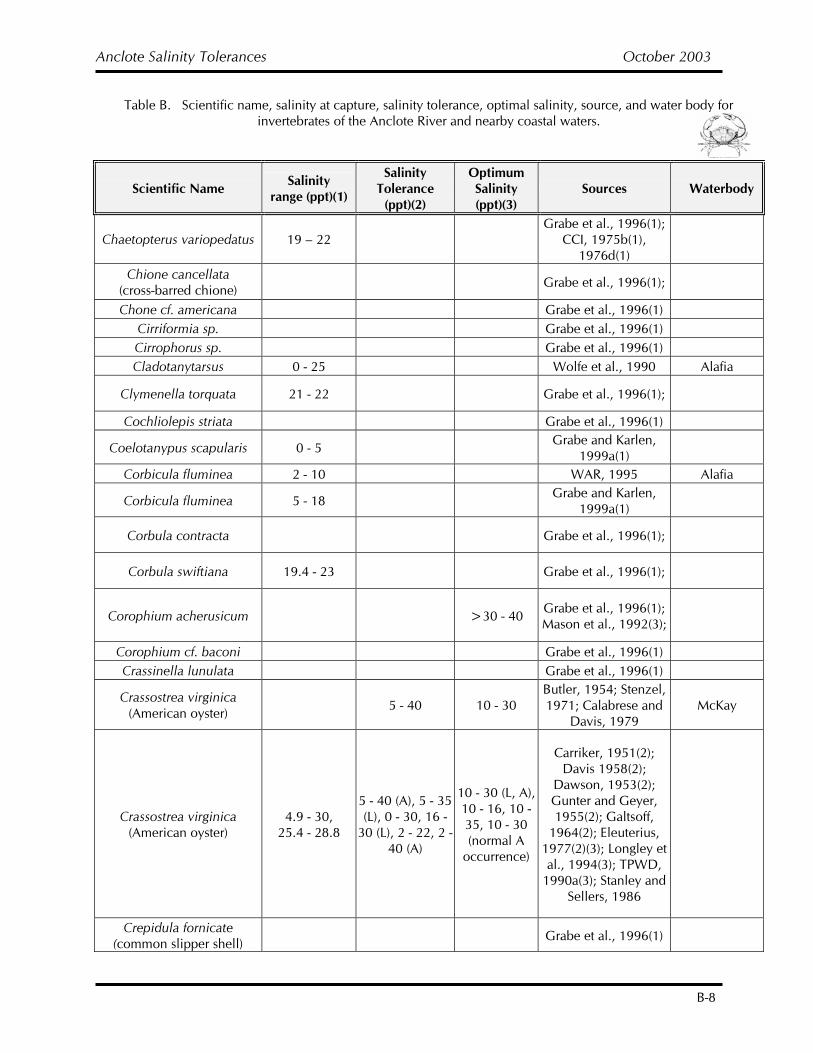
Anclote Salinity Tolerances October 2003
B-8
Table B. Scientific name, salinity at capture, salinity tolerance, optimal salinity, source, and water body for invertebrates of the Anclote River and nearby coastal waters.
Scientific Name Salinity range (ppt)(1)
Salinity Tolerance
(ppt)(2)
Optimum Salinity (ppt)(3)
Sources Waterbody
Chaetopterus variopedatus 19 – 22 Grabe et al., 1996(1);
CCI, 1975b(1), 1976d(1)
Chione cancellata (cross-barred chione) Grabe et al., 1996(1);
Chone cf. americana Grabe et al., 1996(1) Cirriformia sp. Grabe et al., 1996(1) Cirrophorus sp. Grabe et al., 1996(1) Cladotanytarsus 0 - 25 Wolfe et al., 1990 Alafia
Clymenella torquata 21 - 22 Grabe et al., 1996(1);
Cochliolepis striata Grabe et al., 1996(1)
Coelotanypus scapularis 0 - 5 Grabe and Karlen, 1999a(1)
Corbicula fluminea 2 - 10 WAR, 1995 Alafia
Corbicula fluminea 5 - 18 Grabe and Karlen, 1999a(1)
Corbula contracta Grabe et al., 1996(1);
Corbula swiftiana 19.4 - 23 Grabe et al., 1996(1);
Corophium acherusicum >30 - 40 Grabe et al., 1996(1); Mason et al., 1992(3);
Corophium cf. baconi Grabe et al., 1996(1) Crassinella lunulata Grabe et al., 1996(1)
Crassostrea virginica (American oyster) 5 - 40 10 - 30
Butler, 1954; Stenzel, 1971; Calabrese and
Davis, 1979 McKay
Crassostrea virginica (American oyster)
4.9 - 30, 25.4 - 28.8
5 - 40 (A), 5 - 35 (L), 0 - 30, 16 -
30 (L), 2 - 22, 2 - 40 (A)
10 - 30 (L, A), 10 - 16, 10 - 35, 10 - 30 (normal A
occurrence)
Carriker, 1951(2); Davis 1958(2);
Dawson, 1953(2); Gunter and Geyer, 1955(2); Galtsoff,
1964(2); Eleuterius, 1977(2)(3); Longley et al., 1994(3); TPWD,
1990a(3); Stanley and Sellers, 1986
Crepidula fornicate (common slipper shell) Grabe et al., 1996(1)
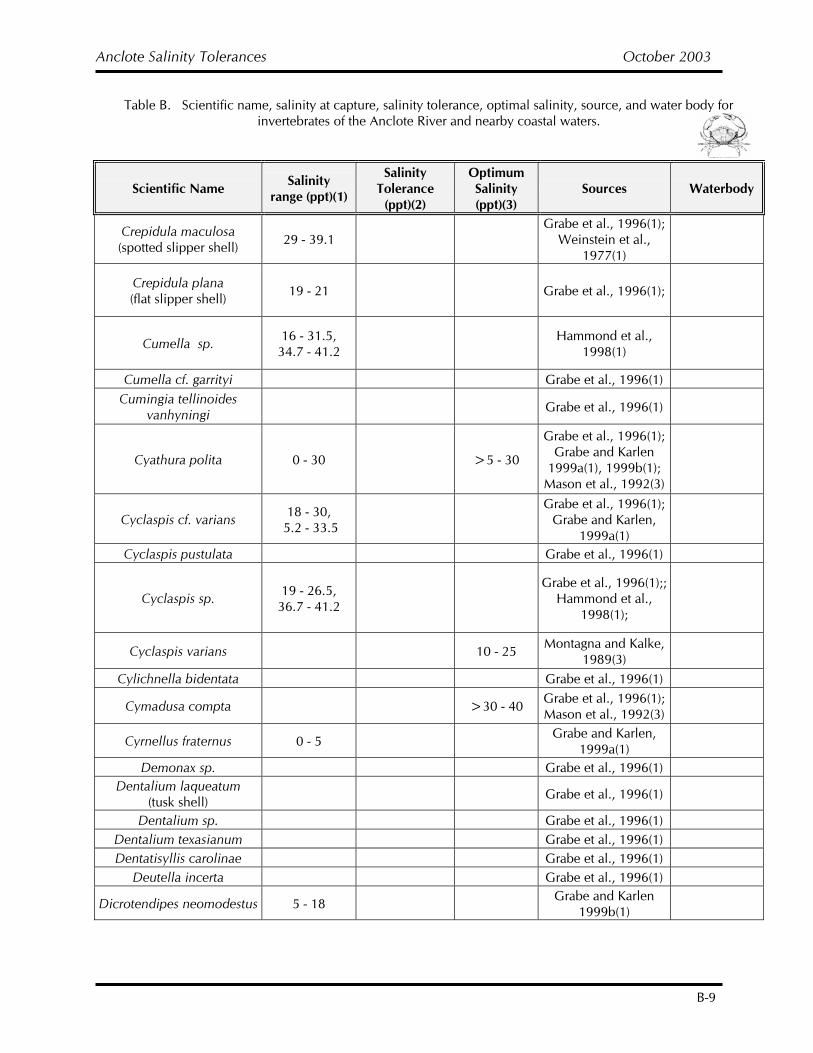
Anclote Salinity Tolerances October 2003
B-9
Table B. Scientific name, salinity at capture, salinity tolerance, optimal salinity, source, and water body for invertebrates of the Anclote River and nearby coastal waters.
Scientific Name Salinity range (ppt)(1)
Salinity Tolerance
(ppt)(2)
Optimum Salinity (ppt)(3)
Sources Waterbody
Crepidula maculosa (spotted slipper shell) 29 - 39.1
Grabe et al., 1996(1); Weinstein et al.,
1977(1)
Crepidula plana (flat slipper shell) 19 - 21 Grabe et al., 1996(1);
Cumella sp. 16 - 31.5, 34.7 - 41.2 Hammond et al.,
1998(1)
Cumella cf. garrityi Grabe et al., 1996(1) Cumingia tellinoides
vanhyningi Grabe et al., 1996(1)
Cyathura polita 0 - 30 >5 - 30
Grabe et al., 1996(1); Grabe and Karlen
1999a(1), 1999b(1); Mason et al., 1992(3)
Cyclaspis cf. varians 18 - 30, 5.2 - 33.5
Grabe et al., 1996(1); Grabe and Karlen,
1999a(1)
Cyclaspis pustulata Grabe et al., 1996(1)
Cyclaspis sp. 19 - 26.5, 36.7 - 41.2
Grabe et al., 1996(1);; Hammond et al.,
1998(1);
Cyclaspis varians 10 - 25 Montagna and Kalke, 1989(3)
Cylichnella bidentata Grabe et al., 1996(1)
Cymadusa compta >30 - 40 Grabe et al., 1996(1); Mason et al., 1992(3)
Cyrnellus fraternus 0 - 5 Grabe and Karlen, 1999a(1)
Demonax sp. Grabe et al., 1996(1) Dentalium laqueatum
(tusk shell) Grabe et al., 1996(1)
Dentalium sp. Grabe et al., 1996(1) Dentalium texasianum Grabe et al., 1996(1) Dentatisyllis carolinae Grabe et al., 1996(1)
Deutella incerta Grabe et al., 1996(1)
Dicrotendipes neomodestus 5 - 18 Grabe and Karlen 1999b(1)
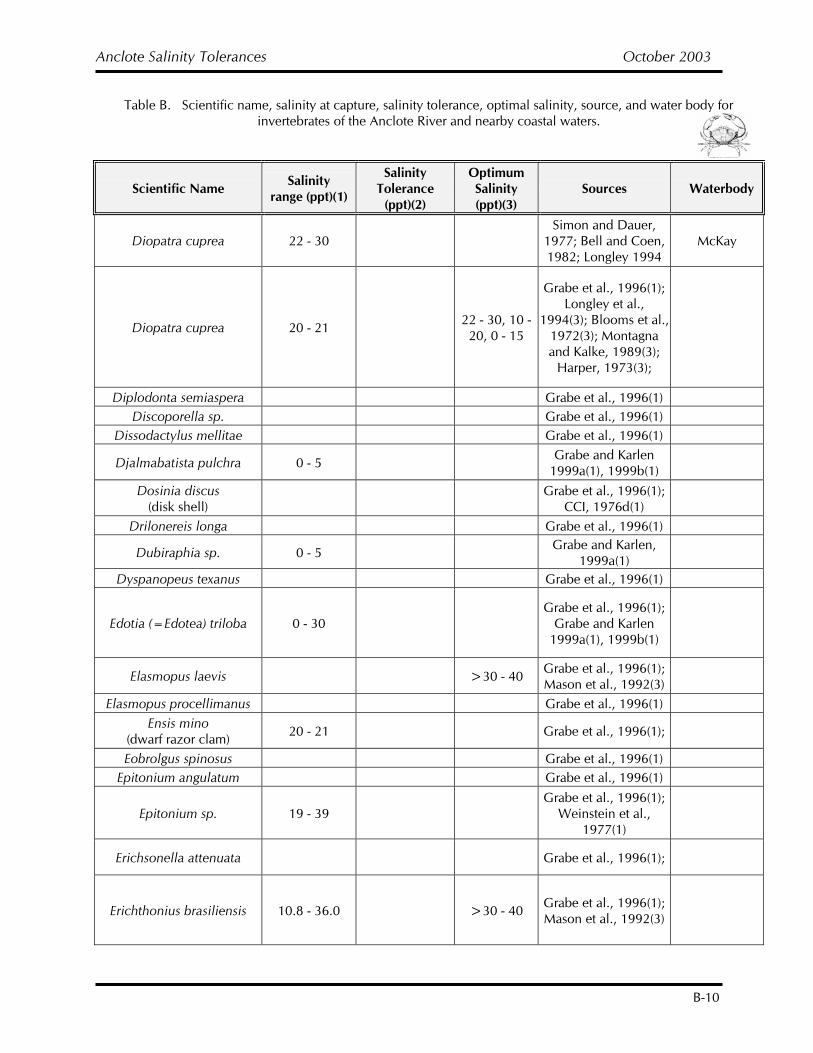
Anclote Salinity Tolerances October 2003
B-10
Table B. Scientific name, salinity at capture, salinity tolerance, optimal salinity, source, and water body for invertebrates of the Anclote River and nearby coastal waters.
Scientific Name Salinity range (ppt)(1)
Salinity Tolerance
(ppt)(2)
Optimum Salinity (ppt)(3)
Sources Waterbody
Diopatra cuprea 22 - 30 Simon and Dauer,
1977; Bell and Coen, 1982; Longley 1994
McKay
Diopatra cuprea 20 - 21 22 - 30, 10 - 20, 0 - 15
Grabe et al., 1996(1); Longley et al.,
1994(3); Blooms et al., 1972(3); Montagna and Kalke, 1989(3);
Harper, 1973(3);
Diplodonta semiaspera Grabe et al., 1996(1) Discoporella sp. Grabe et al., 1996(1)
Dissodactylus mellitae Grabe et al., 1996(1)
Djalmabatista pulchra 0 - 5 Grabe and Karlen 1999a(1), 1999b(1)
Dosinia discus (disk shell) Grabe et al., 1996(1);
CCI, 1976d(1)
Drilonereis longa Grabe et al., 1996(1)
Dubiraphia sp. 0 - 5 Grabe and Karlen, 1999a(1)
Dyspanopeus texanus Grabe et al., 1996(1)
Edotia (=Edotea) triloba 0 - 30 Grabe et al., 1996(1);
Grabe and Karlen 1999a(1), 1999b(1)
Elasmopus laevis >30 - 40 Grabe et al., 1996(1); Mason et al., 1992(3)
Elasmopus procellimanus Grabe et al., 1996(1) Ensis mino
(dwarf razor clam) 20 - 21 Grabe et al., 1996(1);
Eobrolgus spinosus Grabe et al., 1996(1) Epitonium angulatum Grabe et al., 1996(1)
Epitonium sp. 19 - 39 Grabe et al., 1996(1);
Weinstein et al., 1977(1)
Erichsonella attenuata Grabe et al., 1996(1);
Erichthonius brasiliensis 10.8 - 36.0 >30 - 40 Grabe et al., 1996(1); Mason et al., 1992(3)
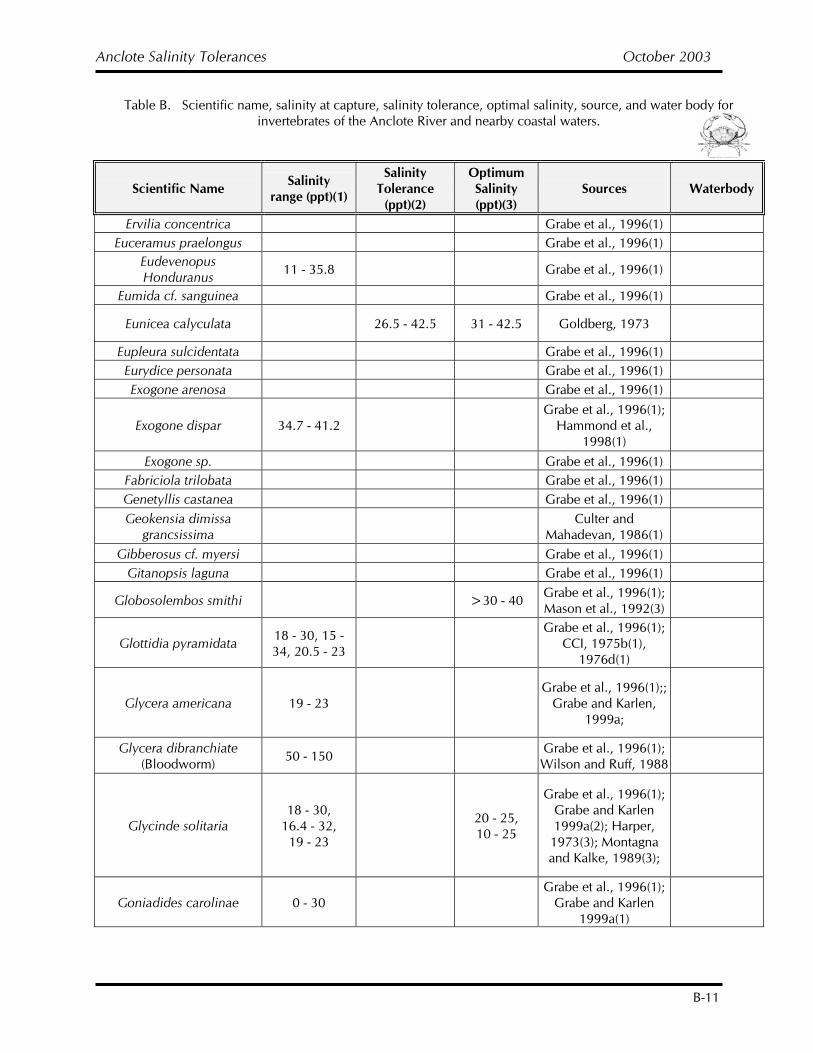
Anclote Salinity Tolerances October 2003
B-11
Table B. Scientific name, salinity at capture, salinity tolerance, optimal salinity, source, and water body for invertebrates of the Anclote River and nearby coastal waters.
Scientific Name Salinity range (ppt)(1)
Salinity Tolerance
(ppt)(2)
Optimum Salinity (ppt)(3)
Sources Waterbody
Ervilia concentrica Grabe et al., 1996(1) Euceramus praelongus Grabe et al., 1996(1)
Eudevenopus Honduranus 11 - 35.8 Grabe et al., 1996(1)
Eumida cf. sanguinea Grabe et al., 1996(1)
Eunicea calyculata 26.5 - 42.5 31 - 42.5 Goldberg, 1973
Eupleura sulcidentata Grabe et al., 1996(1) Eurydice personata Grabe et al., 1996(1) Exogone arenosa Grabe et al., 1996(1)
Exogone dispar 34.7 - 41.2 Grabe et al., 1996(1);
Hammond et al., 1998(1)
Exogone sp. Grabe et al., 1996(1) Fabriciola trilobata Grabe et al., 1996(1) Genetyllis castanea Grabe et al., 1996(1) Geokensia dimissa
grancsissima Culter and Mahadevan, 1986(1)
Gibberosus cf. myersi Grabe et al., 1996(1) Gitanopsis laguna Grabe et al., 1996(1)
Globosolembos smithi >30 - 40 Grabe et al., 1996(1); Mason et al., 1992(3)
Glottidia pyramidata 18 - 30, 15 - 34, 20.5 - 23
Grabe et al., 1996(1); CCI, 1975b(1),
1976d(1)
Glycera americana 19 - 23 Grabe et al., 1996(1);;
Grabe and Karlen, 1999a;
Glycera dibranchiate (Bloodworm) 50 - 150 Grabe et al., 1996(1);
Wilson and Ruff, 1988
Glycinde solitaria 18 - 30,
16.4 - 32, 19 - 23
20 - 25, 10 - 25
Grabe et al., 1996(1); Grabe and Karlen 1999a(2); Harper, 1973(3); Montagna and Kalke, 1989(3);
Goniadides carolinae 0 - 30 Grabe et al., 1996(1);
Grabe and Karlen 1999a(1)
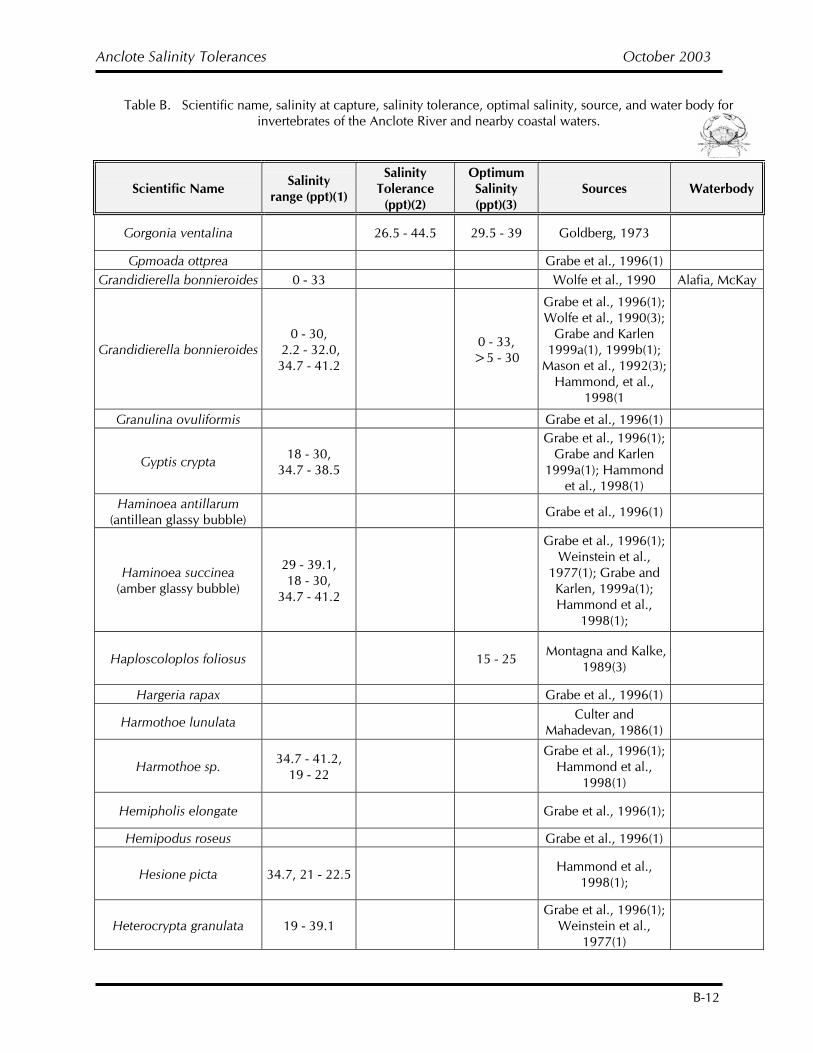
Anclote Salinity Tolerances October 2003
B-12
Table B. Scientific name, salinity at capture, salinity tolerance, optimal salinity, source, and water body for invertebrates of the Anclote River and nearby coastal waters.
Scientific Name Salinity range (ppt)(1)
Salinity Tolerance
(ppt)(2)
Optimum Salinity (ppt)(3)
Sources Waterbody
Gorgonia ventalina 26.5 - 44.5 29.5 - 39 Goldberg, 1973
Gpmoada ottprea Grabe et al., 1996(1) Grandidierella bonnieroides 0 - 33 Wolfe et al., 1990 Alafia, McKay
Grandidierella bonnieroides 0 - 30,
2.2 - 32.0, 34.7 - 41.2
0 - 33, >5 - 30
Grabe et al., 1996(1); Wolfe et al., 1990(3);
Grabe and Karlen 1999a(1), 1999b(1);
Mason et al., 1992(3); Hammond, et al.,
1998(1
Granulina ovuliformis Grabe et al., 1996(1)
Gyptis crypta 18 - 30, 34.7 - 38.5
Grabe et al., 1996(1); Grabe and Karlen
1999a(1); Hammond et al., 1998(1)
Haminoea antillarum (antillean glassy bubble) Grabe et al., 1996(1)
Haminoea succinea (amber glassy bubble)
29 - 39.1, 18 - 30,
34.7 - 41.2
Grabe et al., 1996(1); Weinstein et al.,
1977(1); Grabe and Karlen, 1999a(1); Hammond et al.,
1998(1);
Haploscoloplos foliosus 15 - 25 Montagna and Kalke, 1989(3)
Hargeria rapax Grabe et al., 1996(1)
Harmothoe lunulata Culter and Mahadevan, 1986(1)
Harmothoe sp. 34.7 - 41.2, 19 - 22
Grabe et al., 1996(1); Hammond et al.,
1998(1)
Hemipholis elongate Grabe et al., 1996(1);
Hemipodus roseus Grabe et al., 1996(1)
Hesione picta 34.7, 21 - 22.5 Hammond et al., 1998(1);
Heterocrypta granulata 19 - 39.1 Grabe et al., 1996(1);
Weinstein et al., 1977(1)
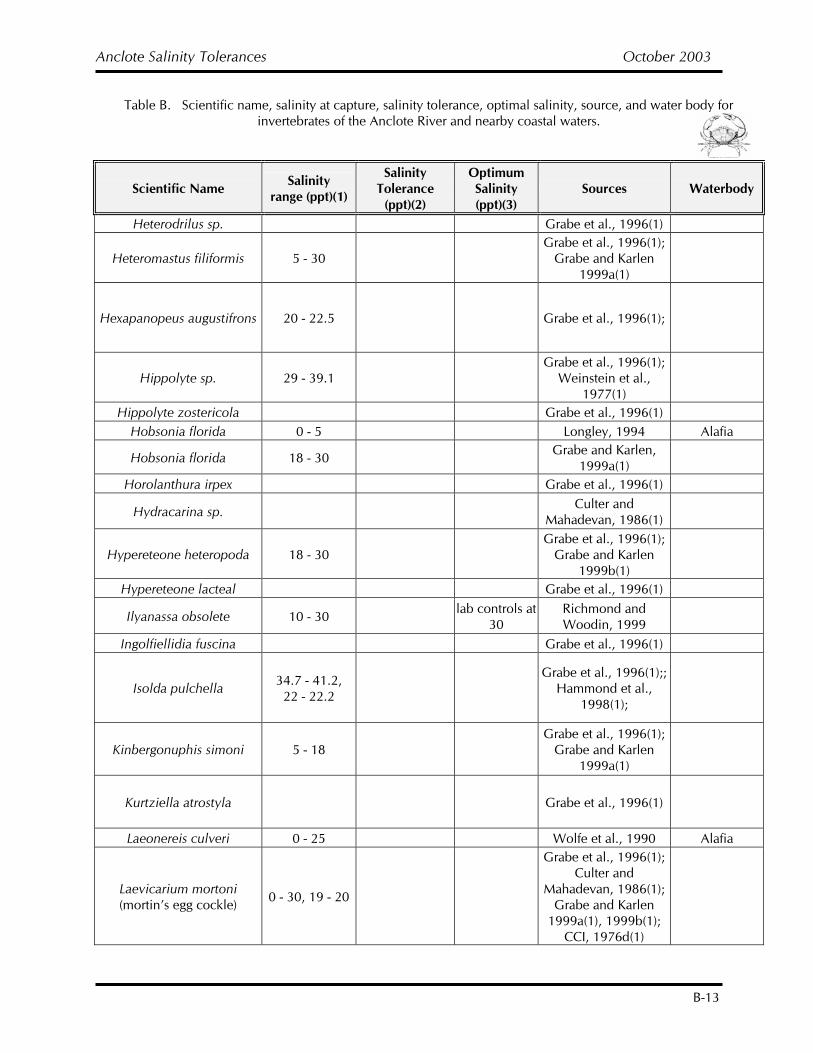
Anclote Salinity Tolerances October 2003
B-13
Table B. Scientific name, salinity at capture, salinity tolerance, optimal salinity, source, and water body for invertebrates of the Anclote River and nearby coastal waters.
Scientific Name Salinity range (ppt)(1)
Salinity Tolerance
(ppt)(2)
Optimum Salinity (ppt)(3)
Sources Waterbody
Heterodrilus sp. Grabe et al., 1996(1)
Heteromastus filiformis 5 - 30 Grabe et al., 1996(1);
Grabe and Karlen 1999a(1)
Hexapanopeus augustifrons 20 - 22.5 Grabe et al., 1996(1);
Hippolyte sp. 29 - 39.1 Grabe et al., 1996(1);
Weinstein et al., 1977(1)
Hippolyte zostericola Grabe et al., 1996(1) Hobsonia florida 0 - 5 Longley, 1994 Alafia
Hobsonia florida 18 - 30 Grabe and Karlen, 1999a(1)
Horolanthura irpex Grabe et al., 1996(1)
Hydracarina sp. Culter and Mahadevan, 1986(1)
Hypereteone heteropoda 18 - 30 Grabe et al., 1996(1);
Grabe and Karlen 1999b(1)
Hypereteone lacteal Grabe et al., 1996(1)
Ilyanassa obsolete 10 - 30 lab controls at 30
Richmond and Woodin, 1999
Ingolfiellidia fuscina Grabe et al., 1996(1)
Isolda pulchella 34.7 - 41.2, 22 - 22.2
Grabe et al., 1996(1);; Hammond et al.,
1998(1);
Kinbergonuphis simoni 5 - 18 Grabe et al., 1996(1);
Grabe and Karlen 1999a(1)
Kurtziella atrostyla Grabe et al., 1996(1)
Laeonereis culveri 0 - 25 Wolfe et al., 1990 Alafia
Laevicarium mortoni (mortin’s egg cockle) 0 - 30, 19 - 20
Grabe et al., 1996(1); Culter and
Mahadevan, 1986(1); Grabe and Karlen
1999a(1), 1999b(1); CCI, 1976d(1)
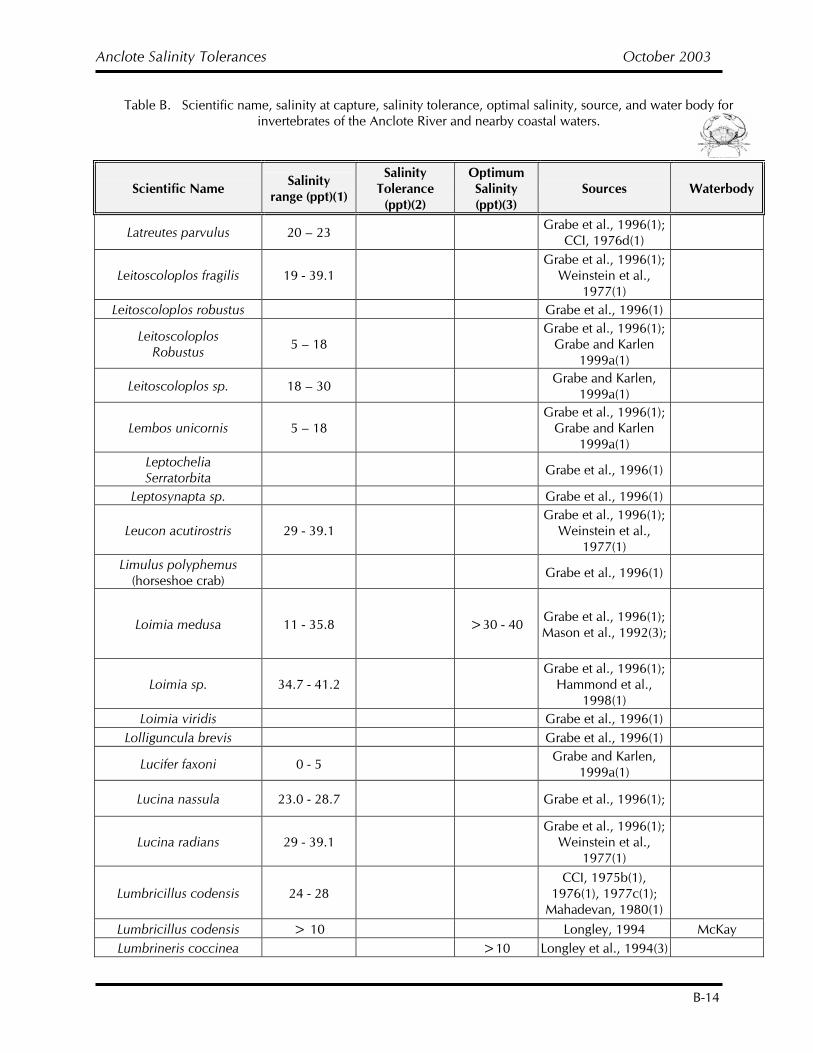
Anclote Salinity Tolerances October 2003
B-14
Table B. Scientific name, salinity at capture, salinity tolerance, optimal salinity, source, and water body for invertebrates of the Anclote River and nearby coastal waters.
Scientific Name Salinity range (ppt)(1)
Salinity Tolerance
(ppt)(2)
Optimum Salinity (ppt)(3)
Sources Waterbody
Latreutes parvulus 20 – 23 Grabe et al., 1996(1); CCI, 1976d(1)
Leitoscoloplos fragilis 19 - 39.1 Grabe et al., 1996(1);
Weinstein et al., 1977(1)
Leitoscoloplos robustus Grabe et al., 1996(1)
Leitoscoloplos Robustus 5 – 18
Grabe et al., 1996(1); Grabe and Karlen
1999a(1)
Leitoscoloplos sp. 18 – 30 Grabe and Karlen, 1999a(1)
Lembos unicornis 5 – 18 Grabe et al., 1996(1);
Grabe and Karlen 1999a(1)
Leptochelia Serratorbita Grabe et al., 1996(1)
Leptosynapta sp. Grabe et al., 1996(1)
Leucon acutirostris 29 - 39.1 Grabe et al., 1996(1);
Weinstein et al., 1977(1)
Limulus polyphemus (horseshoe crab) Grabe et al., 1996(1)
Loimia medusa 11 - 35.8 >30 - 40 Grabe et al., 1996(1); Mason et al., 1992(3);
Loimia sp. 34.7 - 41.2 Grabe et al., 1996(1);
Hammond et al., 1998(1)
Loimia viridis Grabe et al., 1996(1) Lolliguncula brevis Grabe et al., 1996(1)
Lucifer faxoni 0 - 5 Grabe and Karlen, 1999a(1)
Lucina nassula 23.0 - 28.7 Grabe et al., 1996(1);
Lucina radians 29 - 39.1 Grabe et al., 1996(1);
Weinstein et al., 1977(1)
Lumbricillus codensis 24 - 28 CCI, 1975b(1),
1976(1), 1977c(1); Mahadevan, 1980(1)
Lumbricillus codensis > 10 Longley, 1994 McKay Lumbrineris coccinea >10 Longley et al., 1994(3)
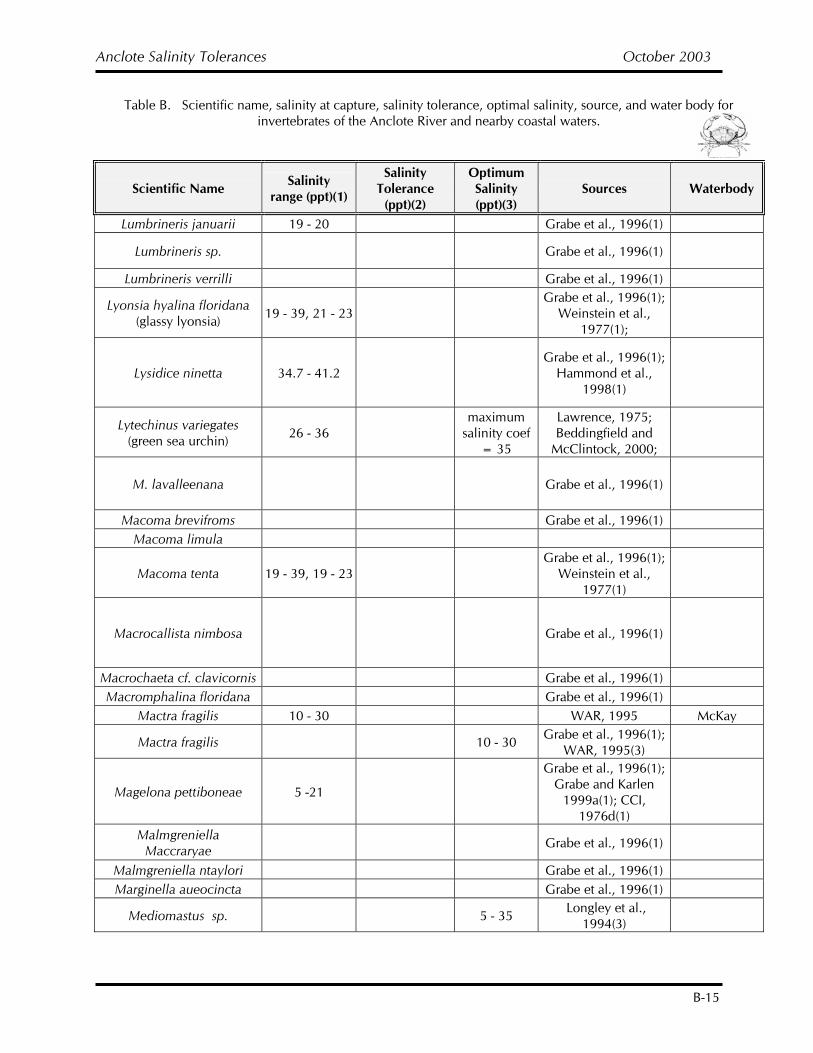
Anclote Salinity Tolerances October 2003
B-15
Table B. Scientific name, salinity at capture, salinity tolerance, optimal salinity, source, and water body for invertebrates of the Anclote River and nearby coastal waters.
Scientific Name Salinity range (ppt)(1)
Salinity Tolerance
(ppt)(2)
Optimum Salinity (ppt)(3)
Sources Waterbody
Lumbrineris januarii 19 - 20 Grabe et al., 1996(1)
Lumbrineris sp. Grabe et al., 1996(1)
Lumbrineris verrilli Grabe et al., 1996(1)
Lyonsia hyalina floridana (glassy lyonsia) 19 - 39, 21 - 23
Grabe et al., 1996(1); Weinstein et al.,
1977(1);
Lysidice ninetta 34.7 - 41.2 Grabe et al., 1996(1);
Hammond et al., 1998(1)
Lytechinus variegates (green sea urchin) 26 - 36
maximum salinity coef
= 35
Lawrence, 1975; Beddingfield and
McClintock, 2000;
M. lavalleenana Grabe et al., 1996(1)
Macoma brevifroms Grabe et al., 1996(1) Macoma limula
Macoma tenta 19 - 39, 19 - 23 Grabe et al., 1996(1);
Weinstein et al., 1977(1)
Macrocallista nimbosa Grabe et al., 1996(1)
Macrochaeta cf. clavicornis Grabe et al., 1996(1) Macromphalina floridana Grabe et al., 1996(1)
Mactra fragilis 10 - 30 WAR, 1995 McKay
Mactra fragilis 10 - 30 Grabe et al., 1996(1); WAR, 1995(3)
Magelona pettiboneae 5 -21
Grabe et al., 1996(1); Grabe and Karlen
1999a(1); CCI, 1976d(1)
Malmgreniella Maccraryae Grabe et al., 1996(1)
Malmgreniella ntaylori Grabe et al., 1996(1) Marginella aueocincta Grabe et al., 1996(1)
Mediomastus sp. 5 - 35 Longley et al., 1994(3)
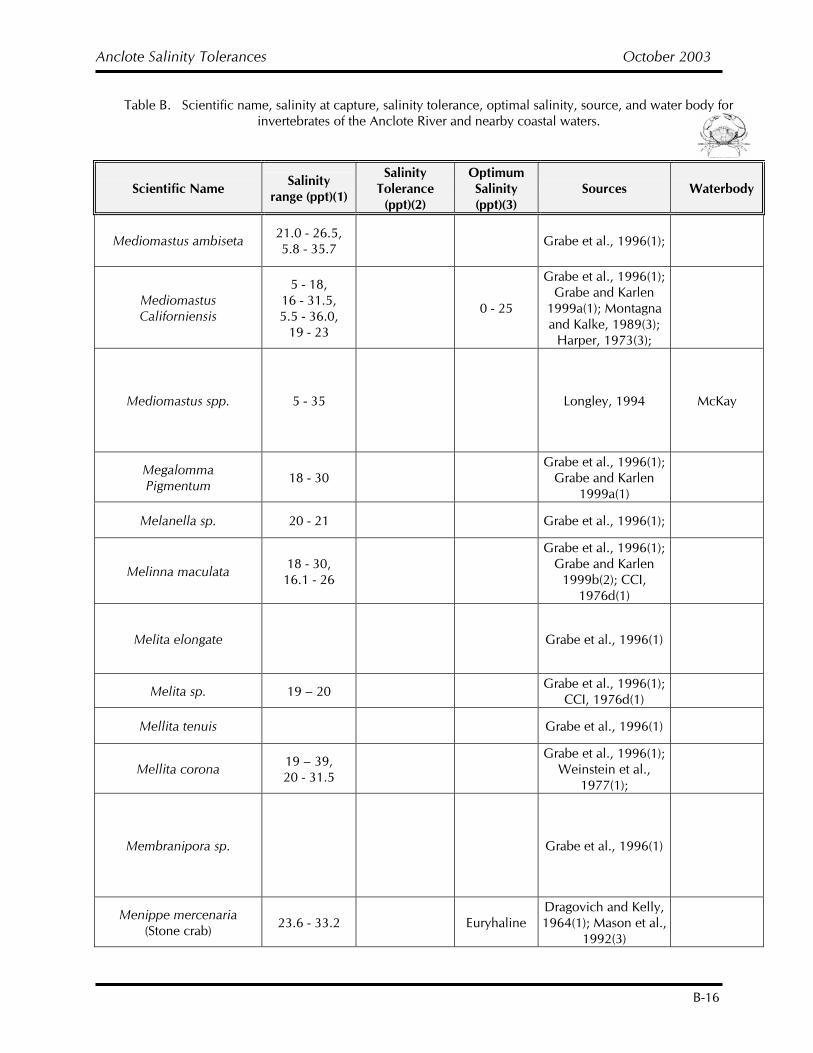
Anclote Salinity Tolerances October 2003
B-16
Table B. Scientific name, salinity at capture, salinity tolerance, optimal salinity, source, and water body for invertebrates of the Anclote River and nearby coastal waters.
Scientific Name Salinity range (ppt)(1)
Salinity Tolerance
(ppt)(2)
Optimum Salinity (ppt)(3)
Sources Waterbody
Mediomastus ambiseta 21.0 - 26.5, 5.8 - 35.7 Grabe et al., 1996(1);
Mediomastus Californiensis
5 - 18, 16 - 31.5, 5.5 - 36.0,
19 - 23
0 - 25
Grabe et al., 1996(1); Grabe and Karlen
1999a(1); Montagna and Kalke, 1989(3);
Harper, 1973(3);
Mediomastus spp. 5 - 35 Longley, 1994 McKay
Megalomma Pigmentum 18 - 30
Grabe et al., 1996(1); Grabe and Karlen
1999a(1)
Melanella sp. 20 - 21 Grabe et al., 1996(1);
Melinna maculata 18 - 30, 16.1 - 26
Grabe et al., 1996(1); Grabe and Karlen
1999b(2); CCI, 1976d(1)
Melita elongate Grabe et al., 1996(1)
Melita sp. 19 – 20 Grabe et al., 1996(1); CCI, 1976d(1)
Mellita tenuis Grabe et al., 1996(1)
Mellita corona 19 – 39, 20 - 31.5
Grabe et al., 1996(1); Weinstein et al.,
1977(1);
Membranipora sp. Grabe et al., 1996(1)
Menippe mercenaria (Stone crab) 23.6 - 33.2 Euryhaline
Dragovich and Kelly, 1964(1); Mason et al.,
1992(3)
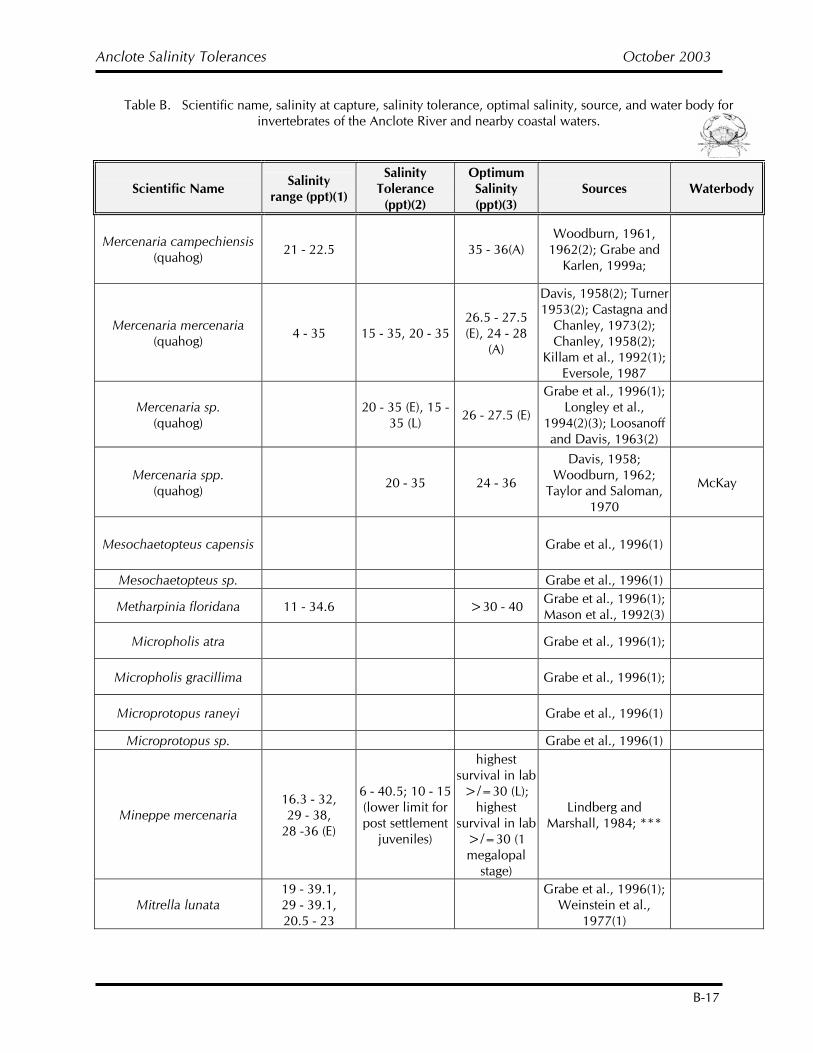
Anclote Salinity Tolerances October 2003
B-17
Table B. Scientific name, salinity at capture, salinity tolerance, optimal salinity, source, and water body for invertebrates of the Anclote River and nearby coastal waters.
Scientific Name Salinity range (ppt)(1)
Salinity Tolerance
(ppt)(2)
Optimum Salinity (ppt)(3)
Sources Waterbody
Mercenaria campechiensis (quahog) 21 - 22.5 35 - 36(A)
Woodburn, 1961, 1962(2); Grabe and
Karlen, 1999a;
Mercenaria mercenaria (quahog) 4 - 35 15 - 35, 20 - 35
26.5 - 27.5 (E), 24 - 28
(A)
Davis, 1958(2); Turner 1953(2); Castagna and
Chanley, 1973(2); Chanley, 1958(2);
Killam et al., 1992(1); Eversole, 1987
Mercenaria sp. (quahog) 20 - 35 (E), 15 -
35 (L) 26 - 27.5 (E)
Grabe et al., 1996(1); Longley et al.,
1994(2)(3); Loosanoff and Davis, 1963(2)
Mercenaria spp. (quahog) 20 - 35 24 - 36
Davis, 1958; Woodburn, 1962;
Taylor and Saloman, 1970
McKay
Mesochaetopteus capensis Grabe et al., 1996(1)
Mesochaetopteus sp. Grabe et al., 1996(1)
Metharpinia floridana 11 - 34.6 >30 - 40 Grabe et al., 1996(1); Mason et al., 1992(3)
Micropholis atra Grabe et al., 1996(1);
Micropholis gracillima Grabe et al., 1996(1);
Microprotopus raneyi Grabe et al., 1996(1)
Microprotopus sp. Grabe et al., 1996(1)
Mineppe mercenaria 16.3 - 32, 29 - 38,
28 -36 (E)
6 - 40.5; 10 - 15 (lower limit for post settlement
juveniles)
highest survival in lab
>/=30 (L); highest
survival in lab >/=30 (1 megalopal
stage)
Lindberg and Marshall, 1984; ***
Mitrella lunata 19 - 39.1, 29 - 39.1, 20.5 - 23
Grabe et al., 1996(1);
Weinstein et al., 1977(1)
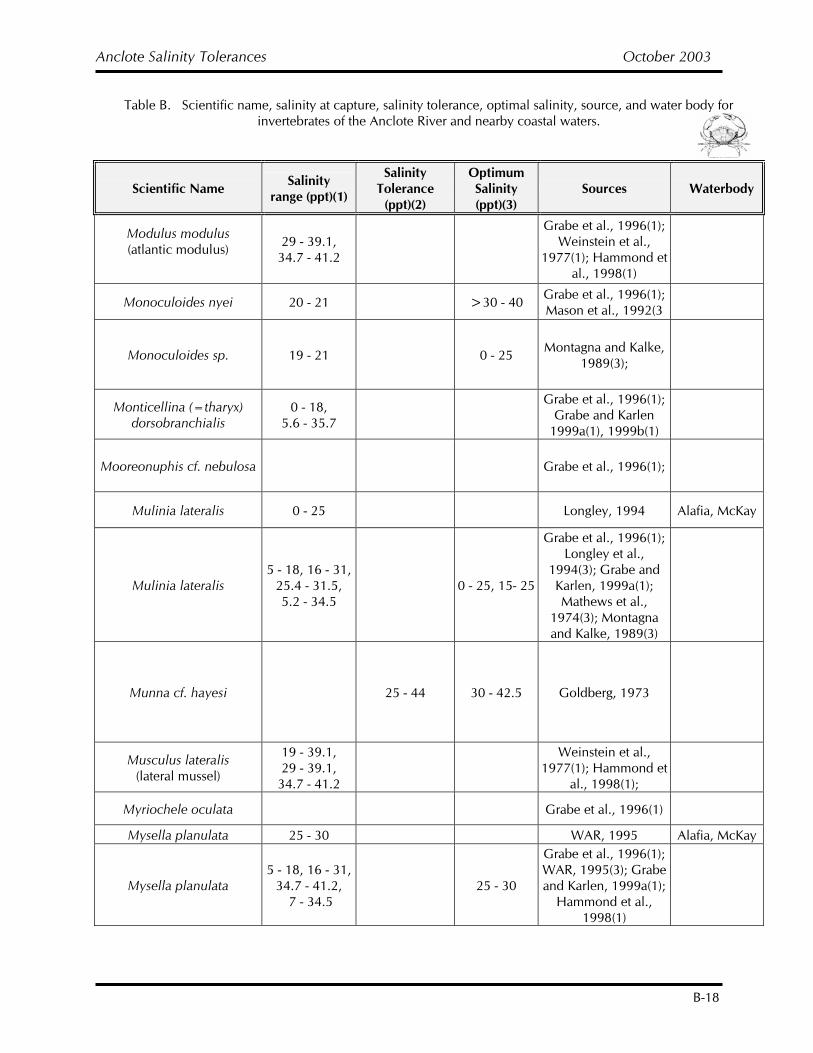
Anclote Salinity Tolerances October 2003
B-18
Table B. Scientific name, salinity at capture, salinity tolerance, optimal salinity, source, and water body for invertebrates of the Anclote River and nearby coastal waters.
Scientific Name Salinity range (ppt)(1)
Salinity Tolerance
(ppt)(2)
Optimum Salinity (ppt)(3)
Sources Waterbody
Modulus modulus (atlantic modulus)
29 - 39.1, 34.7 - 41.2
Grabe et al., 1996(1); Weinstein et al.,
1977(1); Hammond et al., 1998(1)
Monoculoides nyei 20 - 21 >30 - 40 Grabe et al., 1996(1); Mason et al., 1992(3
Monoculoides sp. 19 - 21 0 - 25 Montagna and Kalke, 1989(3);
Monticellina (=tharyx) dorsobranchialis
0 - 18, 5.6 - 35.7
Grabe et al., 1996(1); Grabe and Karlen
1999a(1), 1999b(1)
Mooreonuphis cf. nebulosa Grabe et al., 1996(1);
Mulinia lateralis 0 - 25 Longley, 1994 Alafia, McKay
Mulinia lateralis 5 - 18, 16 - 31,
25.4 - 31.5, 5.2 - 34.5
0 - 25, 15- 25
Grabe et al., 1996(1); Longley et al.,
1994(3); Grabe and Karlen, 1999a(1); Mathews et al.,
1974(3); Montagna and Kalke, 1989(3)
Munna cf. hayesi 25 - 44 30 - 42.5 Goldberg, 1973
Musculus lateralis (lateral mussel)
19 - 39.1, 29 - 39.1, 34.7 - 41.2
Weinstein et al.,
1977(1); Hammond et al., 1998(1);
Myriochele oculata Grabe et al., 1996(1)
Mysella planulata 25 - 30 WAR, 1995 Alafia, McKay
Mysella planulata 5 - 18, 16 - 31,
34.7 - 41.2, 7 - 34.5
25 - 30
Grabe et al., 1996(1); WAR, 1995(3); Grabe and Karlen, 1999a(1);
Hammond et al., 1998(1)
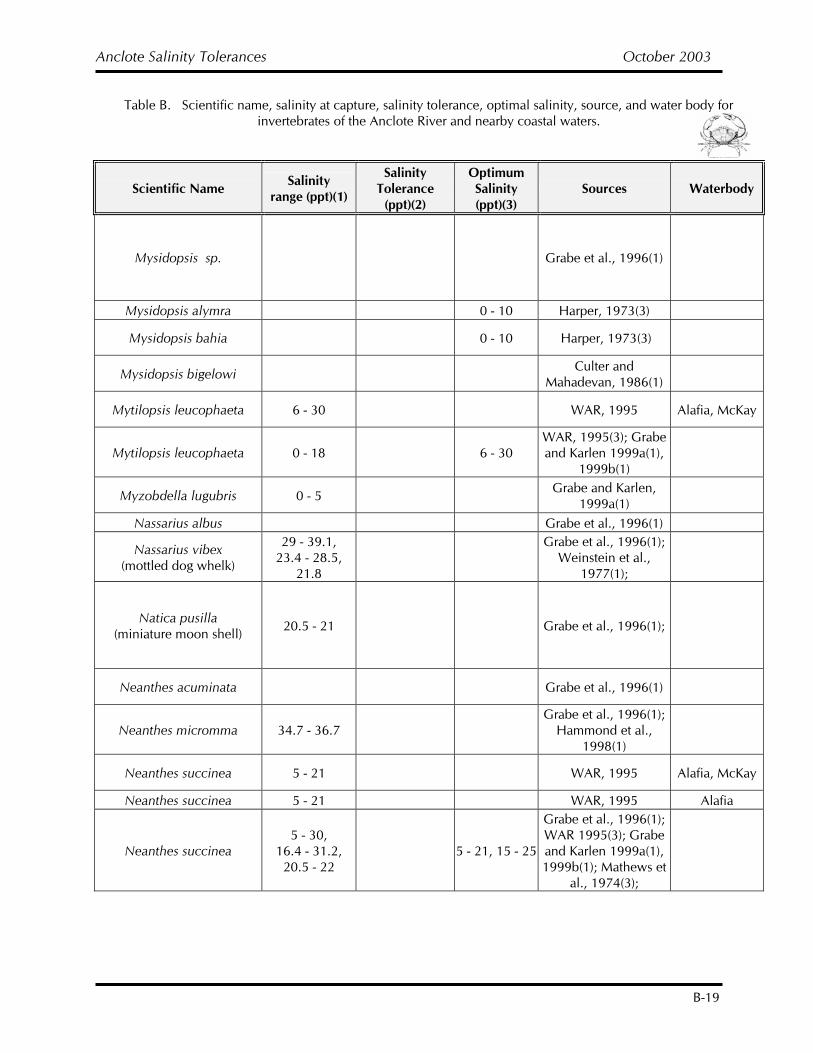
Anclote Salinity Tolerances October 2003
B-19
Table B. Scientific name, salinity at capture, salinity tolerance, optimal salinity, source, and water body for invertebrates of the Anclote River and nearby coastal waters.
Scientific Name Salinity range (ppt)(1)
Salinity Tolerance
(ppt)(2)
Optimum Salinity (ppt)(3)
Sources Waterbody
Mysidopsis sp. Grabe et al., 1996(1)
Mysidopsis alymra 0 - 10 Harper, 1973(3)
Mysidopsis bahia 0 - 10 Harper, 1973(3)
Mysidopsis bigelowi Culter and Mahadevan, 1986(1)
Mytilopsis leucophaeta 6 - 30 WAR, 1995 Alafia, McKay
Mytilopsis leucophaeta 0 - 18 6 - 30 WAR, 1995(3); Grabe and Karlen 1999a(1),
1999b(1)
Myzobdella lugubris 0 - 5 Grabe and Karlen, 1999a(1)
Nassarius albus Grabe et al., 1996(1)
Nassarius vibex (mottled dog whelk)
29 - 39.1, 23.4 - 28.5,
21.8
Grabe et al., 1996(1); Weinstein et al.,
1977(1);
Natica pusilla (miniature moon shell) 20.5 - 21 Grabe et al., 1996(1);
Neanthes acuminata Grabe et al., 1996(1)
Neanthes micromma 34.7 - 36.7 Grabe et al., 1996(1);
Hammond et al., 1998(1)
Neanthes succinea 5 - 21 WAR, 1995 Alafia, McKay
Neanthes succinea 5 - 21 WAR, 1995 Alafia
Neanthes succinea 5 - 30,
16.4 - 31.2, 20.5 - 22
5 - 21, 15 - 25
Grabe et al., 1996(1); WAR 1995(3); Grabe and Karlen 1999a(1), 1999b(1); Mathews et
al., 1974(3);
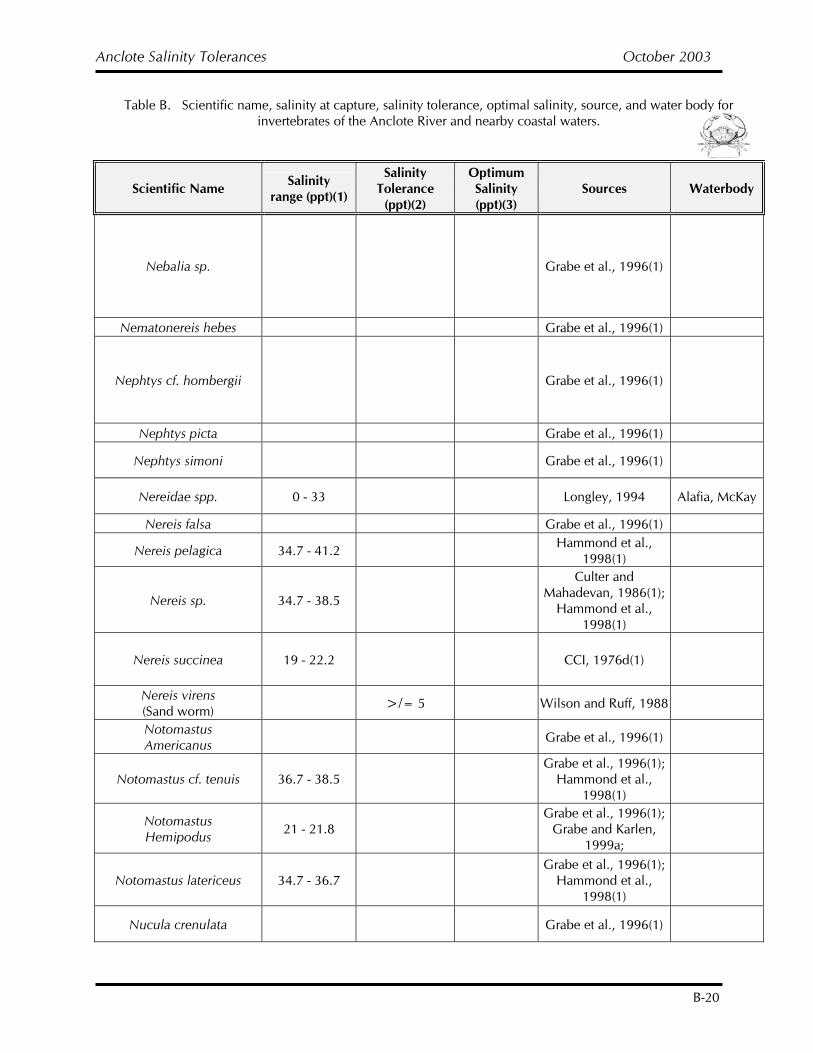
Anclote Salinity Tolerances October 2003
B-20
Table B. Scientific name, salinity at capture, salinity tolerance, optimal salinity, source, and water body for invertebrates of the Anclote River and nearby coastal waters.
Scientific Name Salinity range (ppt)(1)
Salinity Tolerance
(ppt)(2)
Optimum Salinity (ppt)(3)
Sources Waterbody
Nebalia sp. Grabe et al., 1996(1)
Nematonereis hebes Grabe et al., 1996(1)
Nephtys cf. hombergii Grabe et al., 1996(1)
Nephtys picta Grabe et al., 1996(1)
Nephtys simoni Grabe et al., 1996(1)
Nereidae spp. 0 - 33 Longley, 1994 Alafia, McKay
Nereis falsa Grabe et al., 1996(1)
Nereis pelagica 34.7 - 41.2 Hammond et al., 1998(1)
Nereis sp. 34.7 - 38.5
Culter and Mahadevan, 1986(1);
Hammond et al., 1998(1)
Nereis succinea 19 - 22.2 CCI, 1976d(1)
Nereis virens (Sand worm) >/= 5 Wilson and Ruff, 1988
Notomastus Americanus Grabe et al., 1996(1)
Notomastus cf. tenuis 36.7 - 38.5 Grabe et al., 1996(1);
Hammond et al., 1998(1)
Notomastus Hemipodus 21 - 21.8
Grabe et al., 1996(1); Grabe and Karlen,
1999a;
Notomastus latericeus 34.7 - 36.7 Grabe et al., 1996(1);
Hammond et al., 1998(1)
Nucula crenulata Grabe et al., 1996(1)
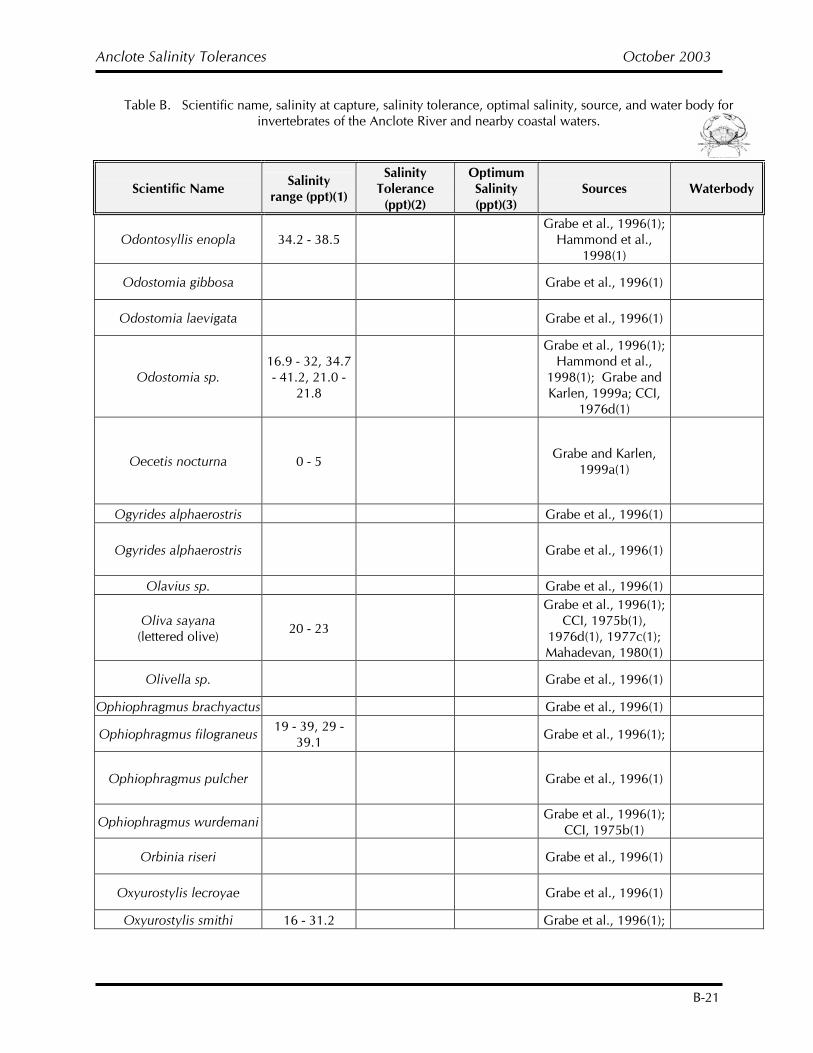
Anclote Salinity Tolerances October 2003
B-21
Table B. Scientific name, salinity at capture, salinity tolerance, optimal salinity, source, and water body for invertebrates of the Anclote River and nearby coastal waters.
Scientific Name Salinity range (ppt)(1)
Salinity Tolerance
(ppt)(2)
Optimum Salinity (ppt)(3)
Sources Waterbody
Odontosyllis enopla 34.2 - 38.5 Grabe et al., 1996(1);
Hammond et al., 1998(1)
Odostomia gibbosa Grabe et al., 1996(1)
Odostomia laevigata Grabe et al., 1996(1)
Odostomia sp. 16.9 - 32, 34.7 - 41.2, 21.0 -
21.8
Grabe et al., 1996(1); Hammond et al.,
1998(1); Grabe and Karlen, 1999a; CCI,
1976d(1)
Oecetis nocturna 0 - 5 Grabe and Karlen, 1999a(1)
Ogyrides alphaerostris Grabe et al., 1996(1)
Ogyrides alphaerostris Grabe et al., 1996(1)
Olavius sp. Grabe et al., 1996(1)
Oliva sayana (lettered olive) 20 - 23
Grabe et al., 1996(1); CCI, 1975b(1),
1976d(1), 1977c(1); Mahadevan, 1980(1)
Olivella sp. Grabe et al., 1996(1)
Ophiophragmus brachyactus Grabe et al., 1996(1)
Ophiophragmus filograneus 19 - 39, 29 - 39.1 Grabe et al., 1996(1);
Ophiophragmus pulcher Grabe et al., 1996(1)
Ophiophragmus wurdemani Grabe et al., 1996(1); CCI, 1975b(1)
Orbinia riseri Grabe et al., 1996(1)
Oxyurostylis lecroyae Grabe et al., 1996(1)
Oxyurostylis smithi 16 - 31.2 Grabe et al., 1996(1);
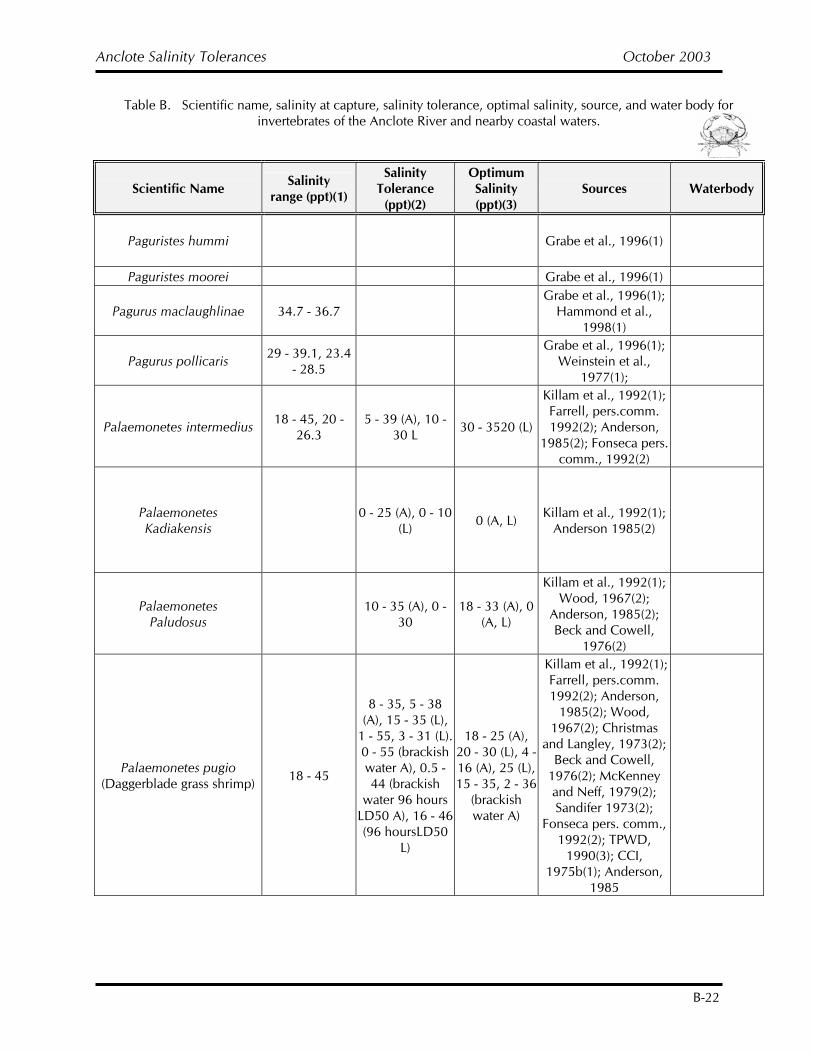
Anclote Salinity Tolerances October 2003
B-22
Table B. Scientific name, salinity at capture, salinity tolerance, optimal salinity, source, and water body for invertebrates of the Anclote River and nearby coastal waters.
Scientific Name Salinity range (ppt)(1)
Salinity Tolerance
(ppt)(2)
Optimum Salinity (ppt)(3)
Sources Waterbody
Paguristes hummi Grabe et al., 1996(1)
Paguristes moorei Grabe et al., 1996(1)
Pagurus maclaughlinae 34.7 - 36.7 Grabe et al., 1996(1);
Hammond et al., 1998(1)
Pagurus pollicaris 29 - 39.1, 23.4 - 28.5
Grabe et al., 1996(1); Weinstein et al.,
1977(1);
Palaemonetes intermedius 18 - 45, 20 - 26.3
5 - 39 (A), 10 - 30 L 30 - 3520 (L)
Killam et al., 1992(1); Farrell, pers.comm. 1992(2); Anderson,
1985(2); Fonseca pers. comm., 1992(2)
Palaemonetes Kadiakensis 0 - 25 (A), 0 - 10
(L) 0 (A, L) Killam et al., 1992(1); Anderson 1985(2)
Palaemonetes Paludosus 10 - 35 (A), 0 -
30 18 - 33 (A), 0
(A, L)
Killam et al., 1992(1); Wood, 1967(2);
Anderson, 1985(2); Beck and Cowell,
1976(2)
Palaemonetes pugio (Daggerblade grass shrimp) 18 - 45
8 - 35, 5 - 38 (A), 15 - 35 (L),
1 - 55, 3 - 31 (L). 0 - 55 (brackish water A), 0.5 - 44 (brackish
water 96 hours LD50 A), 16 - 46(96 hoursLD50
L)
18 - 25 (A), 20 - 30 (L), 4 - 16 (A), 25 (L), 15 - 35, 2 - 36
(brackish water A)
Killam et al., 1992(1); Farrell, pers.comm. 1992(2); Anderson,
1985(2); Wood, 1967(2); Christmas
and Langley, 1973(2); Beck and Cowell,
1976(2); McKenney and Neff, 1979(2); Sandifer 1973(2);
Fonseca pers. comm., 1992(2); TPWD,
1990(3); CCI, 1975b(1); Anderson,
1985
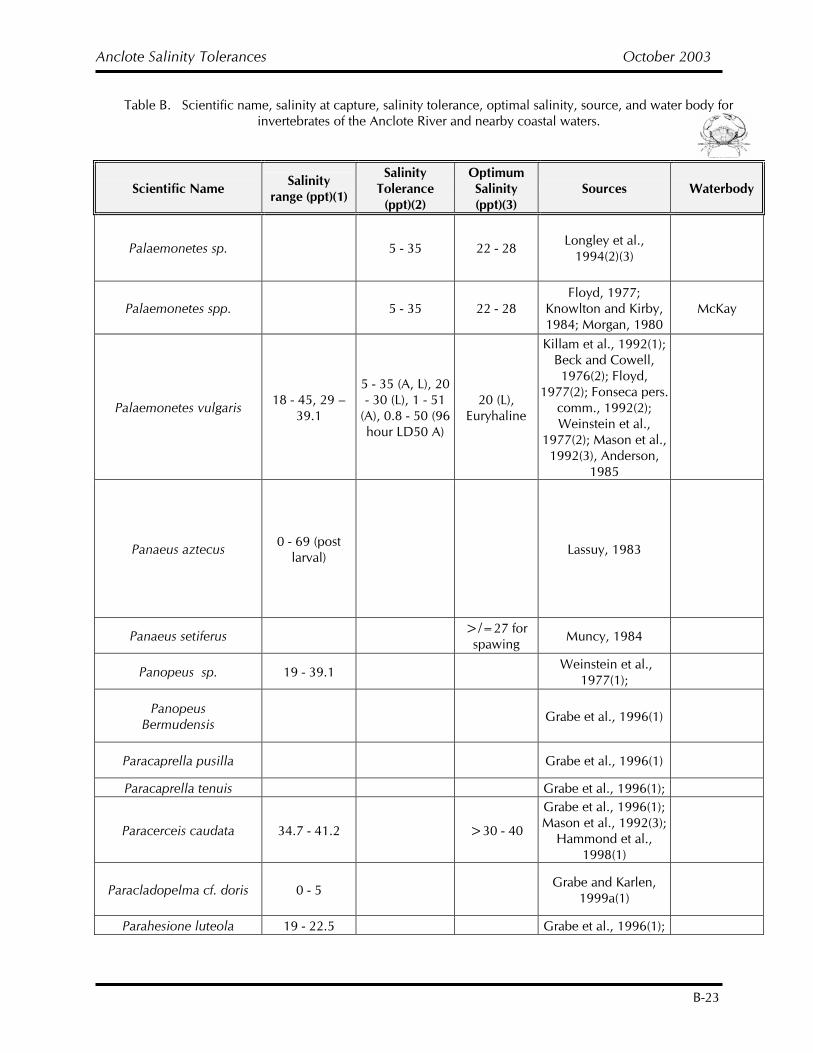
Anclote Salinity Tolerances October 2003
B-23
Table B. Scientific name, salinity at capture, salinity tolerance, optimal salinity, source, and water body for invertebrates of the Anclote River and nearby coastal waters.
Scientific Name Salinity range (ppt)(1)
Salinity Tolerance
(ppt)(2)
Optimum Salinity (ppt)(3)
Sources Waterbody
Palaemonetes sp. 5 - 35 22 - 28 Longley et al., 1994(2)(3)
Palaemonetes spp. 5 - 35 22 - 28 Floyd, 1977;
Knowlton and Kirby, 1984; Morgan, 1980
McKay
Palaemonetes vulgaris 18 - 45, 29 – 39.1
5 - 35 (A, L), 20 - 30 (L), 1 - 51
(A), 0.8 - 50 (96 hour LD50 A)
20 (L), Euryhaline
Killam et al., 1992(1); Beck and Cowell, 1976(2); Floyd,
1977(2); Fonseca pers. comm., 1992(2); Weinstein et al.,
1977(2); Mason et al., 1992(3), Anderson,
1985
Panaeus aztecus 0 - 69 (post larval) Lassuy, 1983
Panaeus setiferus >/=27 for spawing Muncy, 1984
Panopeus sp. 19 - 39.1 Weinstein et al., 1977(1);
Panopeus Bermudensis Grabe et al., 1996(1)
Paracaprella pusilla Grabe et al., 1996(1)
Paracaprella tenuis Grabe et al., 1996(1);
Paracerceis caudata 34.7 - 41.2 >30 - 40
Grabe et al., 1996(1); Mason et al., 1992(3);
Hammond et al., 1998(1)
Paracladopelma cf. doris 0 - 5 Grabe and Karlen, 1999a(1)
Parahesione luteola 19 - 22.5 Grabe et al., 1996(1);
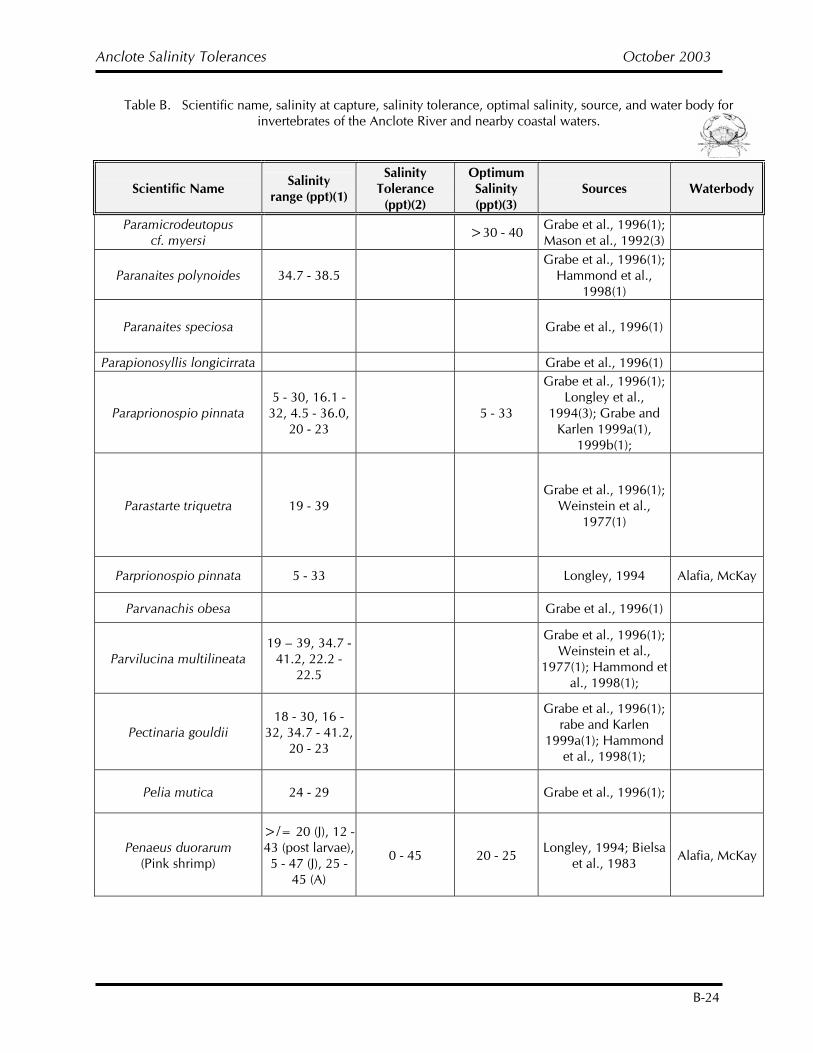
Anclote Salinity Tolerances October 2003
B-24
Table B. Scientific name, salinity at capture, salinity tolerance, optimal salinity, source, and water body for invertebrates of the Anclote River and nearby coastal waters.
Scientific Name Salinity range (ppt)(1)
Salinity Tolerance
(ppt)(2)
Optimum Salinity (ppt)(3)
Sources Waterbody
Paramicrodeutopus cf. myersi >30 - 40 Grabe et al., 1996(1);
Mason et al., 1992(3)
Paranaites polynoides 34.7 - 38.5 Grabe et al., 1996(1);
Hammond et al., 1998(1)
Paranaites speciosa Grabe et al., 1996(1)
Parapionosyllis longicirrata Grabe et al., 1996(1)
Paraprionospio pinnata 5 - 30, 16.1 - 32, 4.5 - 36.0,
20 - 23 5 - 33
Grabe et al., 1996(1); Longley et al.,
1994(3); Grabe and Karlen 1999a(1),
1999b(1);
Parastarte triquetra 19 - 39 Grabe et al., 1996(1);
Weinstein et al., 1977(1)
Parprionospio pinnata 5 - 33 Longley, 1994 Alafia, McKay
Parvanachis obesa Grabe et al., 1996(1)
Parvilucina multilineata 19 – 39, 34.7 -
41.2, 22.2 - 22.5
Grabe et al., 1996(1); Weinstein et al.,
1977(1); Hammond et al., 1998(1);
Pectinaria gouldii 18 - 30, 16 -
32, 34.7 - 41.2, 20 - 23
Grabe et al., 1996(1); rabe and Karlen
1999a(1); Hammond et al., 1998(1);
Pelia mutica 24 - 29 Grabe et al., 1996(1);
Penaeus duorarum (Pink shrimp)
>/= 20 (J), 12 - 43 (post larvae), 5 - 47 (J), 25 -
45 (A)
0 - 45 20 - 25 Longley, 1994; Bielsa et al., 1983 Alafia, McKay
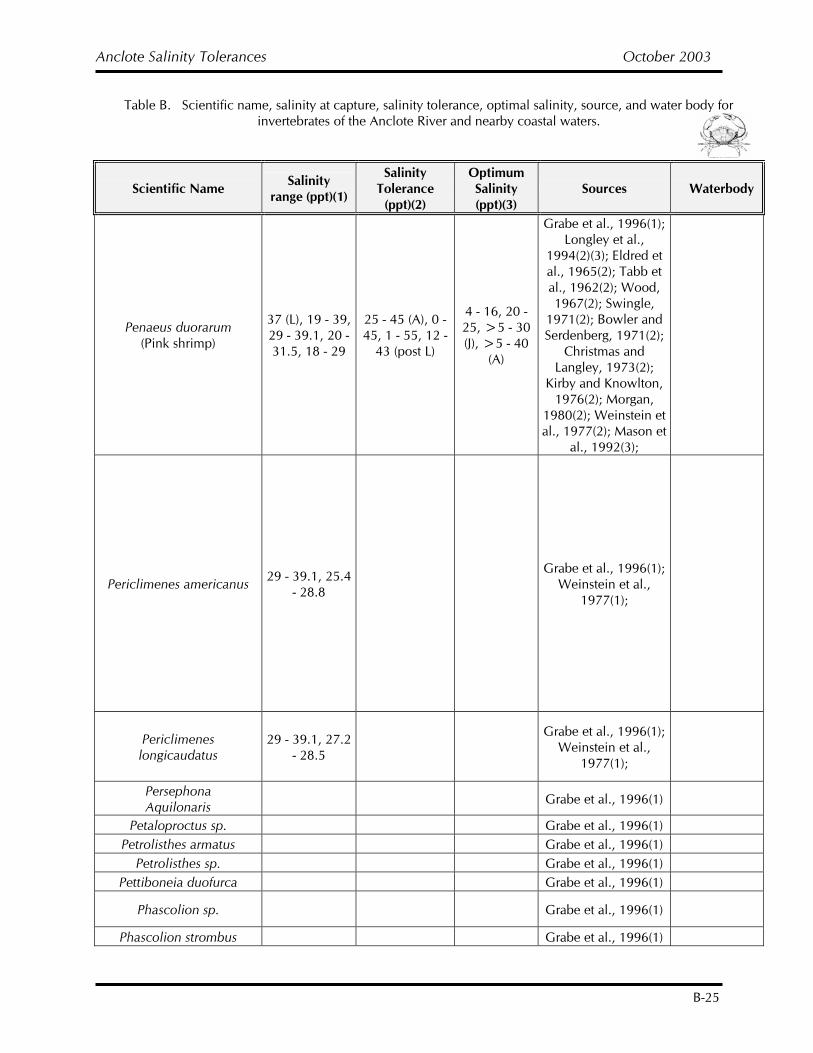
Anclote Salinity Tolerances October 2003
B-25
Table B. Scientific name, salinity at capture, salinity tolerance, optimal salinity, source, and water body for invertebrates of the Anclote River and nearby coastal waters.
Scientific Name Salinity range (ppt)(1)
Salinity Tolerance
(ppt)(2)
Optimum Salinity (ppt)(3)
Sources Waterbody
Penaeus duorarum (Pink shrimp)
37 (L), 19 - 39, 29 - 39.1, 20 - 31.5, 18 - 29
25 - 45 (A), 0 - 45, 1 - 55, 12 -
43 (post L)
4 - 16, 20 - 25, >5 - 30 (J), >5 - 40
(A)
Grabe et al., 1996(1); Longley et al.,
1994(2)(3); Eldred et al., 1965(2); Tabb et al., 1962(2); Wood, 1967(2); Swingle,
1971(2); Bowler and Serdenberg, 1971(2);
Christmas and Langley, 1973(2);
Kirby and Knowlton, 1976(2); Morgan,
1980(2); Weinstein et al., 1977(2); Mason et
al., 1992(3);
Periclimenes americanus 29 - 39.1, 25.4 - 28.8
Grabe et al., 1996(1); Weinstein et al.,
1977(1);
Periclimenes longicaudatus
29 - 39.1, 27.2 - 28.5
Grabe et al., 1996(1); Weinstein et al.,
1977(1);
Persephona Aquilonaris Grabe et al., 1996(1)
Petaloproctus sp. Grabe et al., 1996(1) Petrolisthes armatus Grabe et al., 1996(1)
Petrolisthes sp. Grabe et al., 1996(1) Pettiboneia duofurca Grabe et al., 1996(1)
Phascolion sp. Grabe et al., 1996(1)
Phascolion strombus Grabe et al., 1996(1)
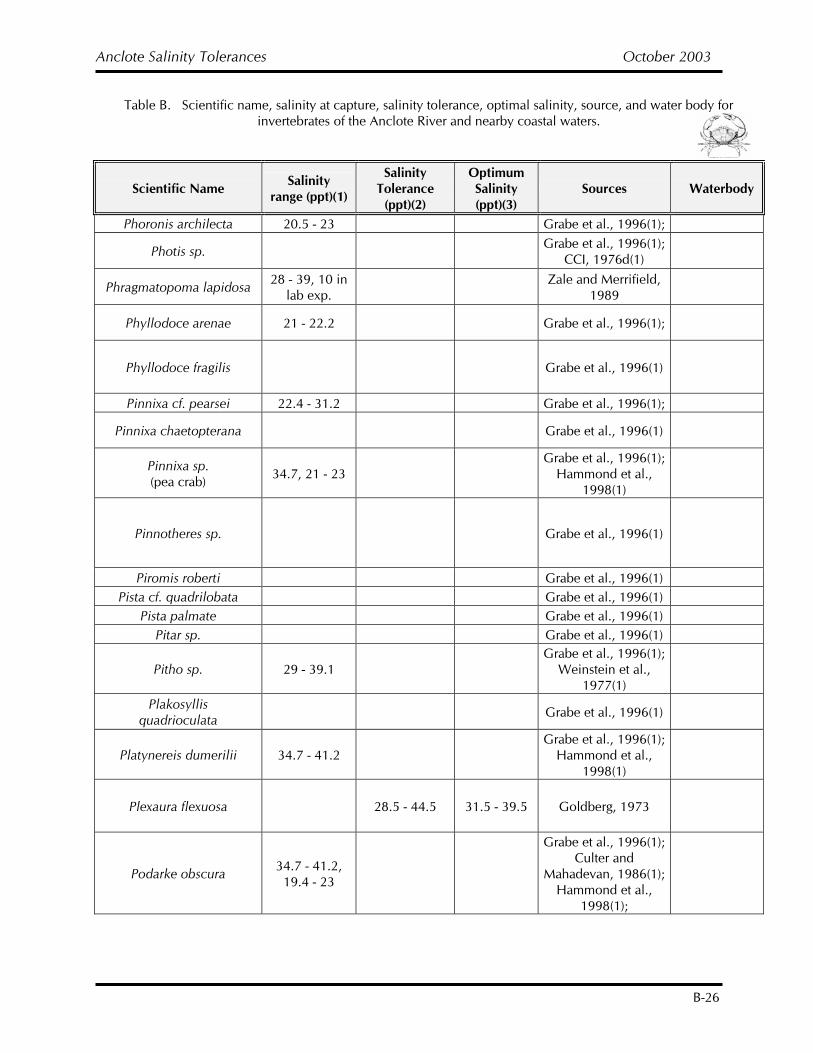
Anclote Salinity Tolerances October 2003
B-26
Table B. Scientific name, salinity at capture, salinity tolerance, optimal salinity, source, and water body for invertebrates of the Anclote River and nearby coastal waters.
Scientific Name Salinity range (ppt)(1)
Salinity Tolerance
(ppt)(2)
Optimum Salinity (ppt)(3)
Sources Waterbody
Phoronis archilecta 20.5 - 23 Grabe et al., 1996(1);
Photis sp. Grabe et al., 1996(1); CCI, 1976d(1)
Phragmatopoma lapidosa 28 - 39, 10 in lab exp. Zale and Merrifield,
1989
Phyllodoce arenae 21 - 22.2 Grabe et al., 1996(1);
Phyllodoce fragilis Grabe et al., 1996(1)
Pinnixa cf. pearsei 22.4 - 31.2 Grabe et al., 1996(1);
Pinnixa chaetopterana Grabe et al., 1996(1)
Pinnixa sp. (pea crab) 34.7, 21 - 23
Grabe et al., 1996(1); Hammond et al.,
1998(1)
Pinnotheres sp. Grabe et al., 1996(1)
Piromis roberti Grabe et al., 1996(1) Pista cf. quadrilobata Grabe et al., 1996(1)
Pista palmate Grabe et al., 1996(1) Pitar sp. Grabe et al., 1996(1)
Pitho sp. 29 - 39.1 Grabe et al., 1996(1);
Weinstein et al., 1977(1)
Plakosyllis quadrioculata Grabe et al., 1996(1)
Platynereis dumerilii 34.7 - 41.2 Grabe et al., 1996(1);
Hammond et al., 1998(1)
Plexaura flexuosa 28.5 - 44.5 31.5 - 39.5 Goldberg, 1973
Podarke obscura 34.7 - 41.2, 19.4 - 23
Grabe et al., 1996(1); Culter and
Mahadevan, 1986(1); Hammond et al.,
1998(1);
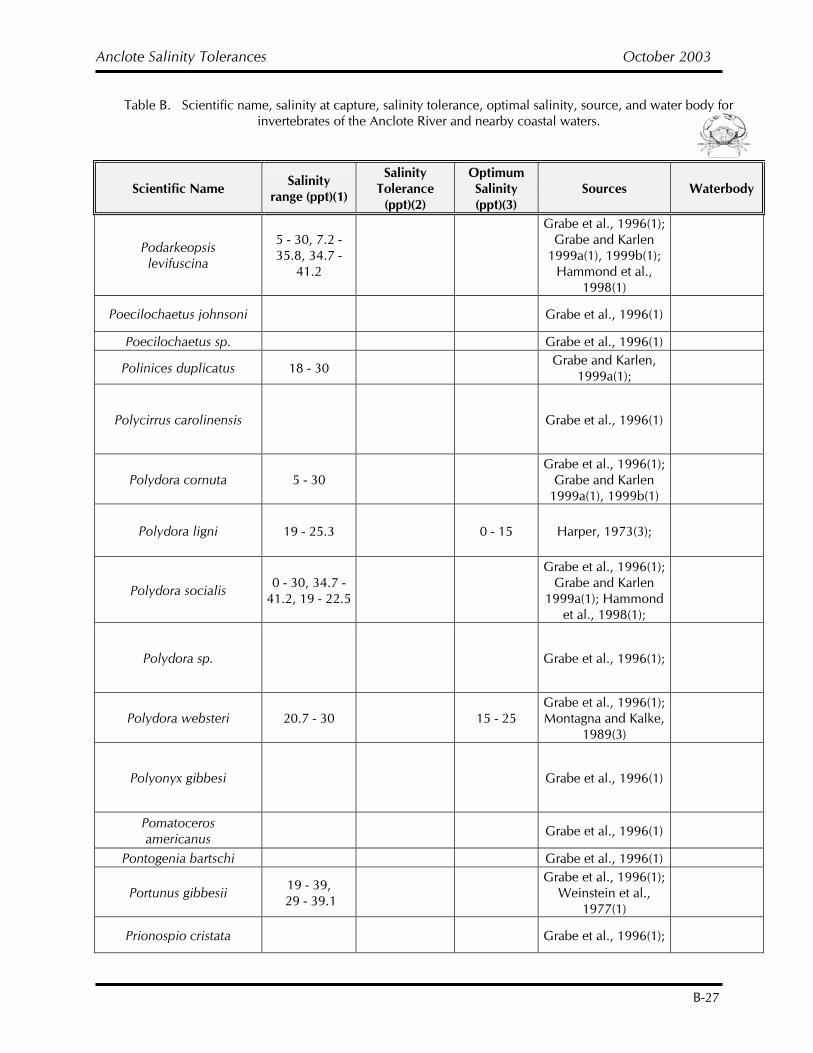
Anclote Salinity Tolerances October 2003
B-27
Table B. Scientific name, salinity at capture, salinity tolerance, optimal salinity, source, and water body for invertebrates of the Anclote River and nearby coastal waters.
Scientific Name Salinity range (ppt)(1)
Salinity Tolerance
(ppt)(2)
Optimum Salinity (ppt)(3)
Sources Waterbody
Podarkeopsis levifuscina
5 - 30, 7.2 - 35.8, 34.7 -
41.2
Grabe et al., 1996(1); Grabe and Karlen
1999a(1), 1999b(1); Hammond et al.,
1998(1)
Poecilochaetus johnsoni Grabe et al., 1996(1)
Poecilochaetus sp. Grabe et al., 1996(1)
Polinices duplicatus 18 - 30 Grabe and Karlen, 1999a(1);
Polycirrus carolinensis Grabe et al., 1996(1)
Polydora cornuta 5 - 30 Grabe et al., 1996(1);
Grabe and Karlen 1999a(1), 1999b(1)
Polydora ligni 19 - 25.3 0 - 15 Harper, 1973(3);
Polydora socialis 0 - 30, 34.7 - 41.2, 19 - 22.5
Grabe et al., 1996(1); Grabe and Karlen
1999a(1); Hammond et al., 1998(1);
Polydora sp. Grabe et al., 1996(1);
Polydora websteri 20.7 - 30 15 - 25 Grabe et al., 1996(1); Montagna and Kalke,
1989(3)
Polyonyx gibbesi Grabe et al., 1996(1)
Pomatoceros americanus Grabe et al., 1996(1)
Pontogenia bartschi Grabe et al., 1996(1)
Portunus gibbesii 19 - 39, 29 - 39.1
Grabe et al., 1996(1); Weinstein et al.,
1977(1)
Prionospio cristata Grabe et al., 1996(1);
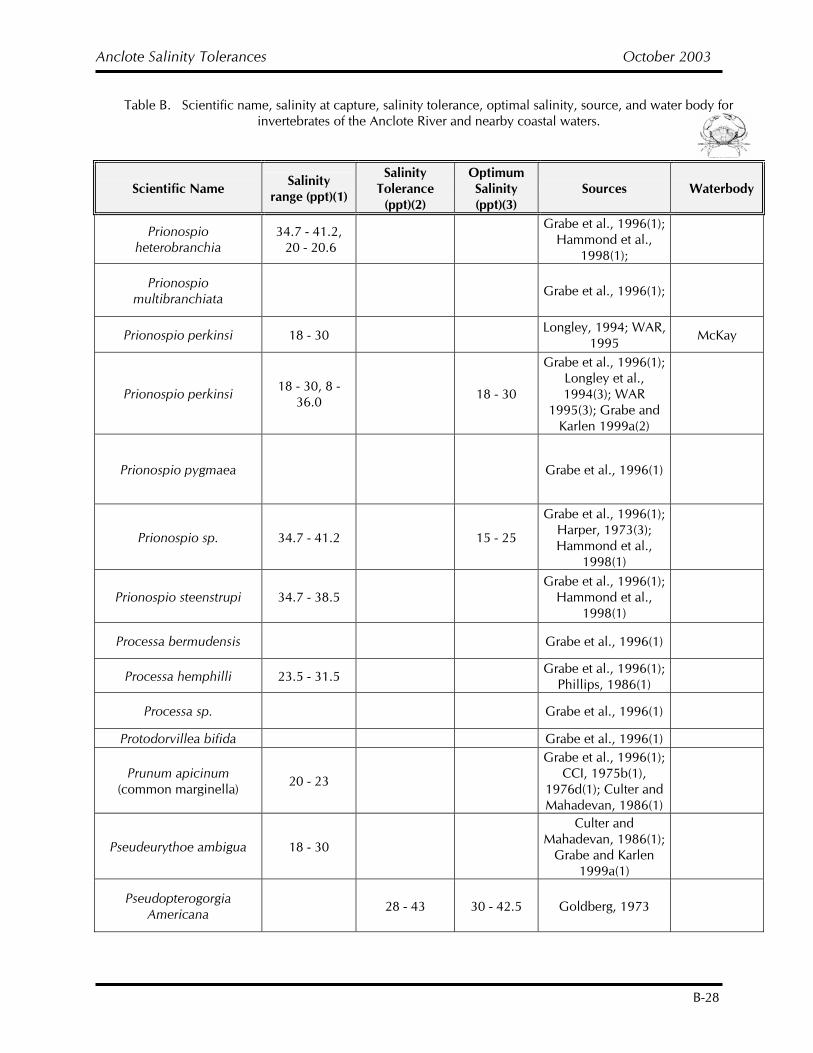
Anclote Salinity Tolerances October 2003
B-28
Table B. Scientific name, salinity at capture, salinity tolerance, optimal salinity, source, and water body for invertebrates of the Anclote River and nearby coastal waters.
Scientific Name Salinity range (ppt)(1)
Salinity Tolerance
(ppt)(2)
Optimum Salinity (ppt)(3)
Sources Waterbody
Prionospio heterobranchia
34.7 - 41.2, 20 - 20.6
Grabe et al., 1996(1); Hammond et al.,
1998(1);
Prionospio multibranchiata Grabe et al., 1996(1);
Prionospio perkinsi 18 - 30 Longley, 1994; WAR, 1995 McKay
Prionospio perkinsi 18 - 30, 8 - 36.0 18 - 30
Grabe et al., 1996(1); Longley et al., 1994(3); WAR
1995(3); Grabe and Karlen 1999a(2)
Prionospio pygmaea Grabe et al., 1996(1)
Prionospio sp. 34.7 - 41.2 15 - 25
Grabe et al., 1996(1); Harper, 1973(3); Hammond et al.,
1998(1)
Prionospio steenstrupi 34.7 - 38.5 Grabe et al., 1996(1);
Hammond et al., 1998(1)
Processa bermudensis Grabe et al., 1996(1)
Processa hemphilli 23.5 - 31.5 Grabe et al., 1996(1); Phillips, 1986(1)
Processa sp. Grabe et al., 1996(1)
Protodorvillea bifida Grabe et al., 1996(1)
Prunum apicinum (common marginella) 20 - 23
Grabe et al., 1996(1); CCI, 1975b(1),
1976d(1); Culter and Mahadevan, 1986(1)
Pseudeurythoe ambigua 18 - 30
Culter and Mahadevan, 1986(1);
Grabe and Karlen 1999a(1)
Pseudopterogorgia Americana 28 - 43 30 - 42.5 Goldberg, 1973
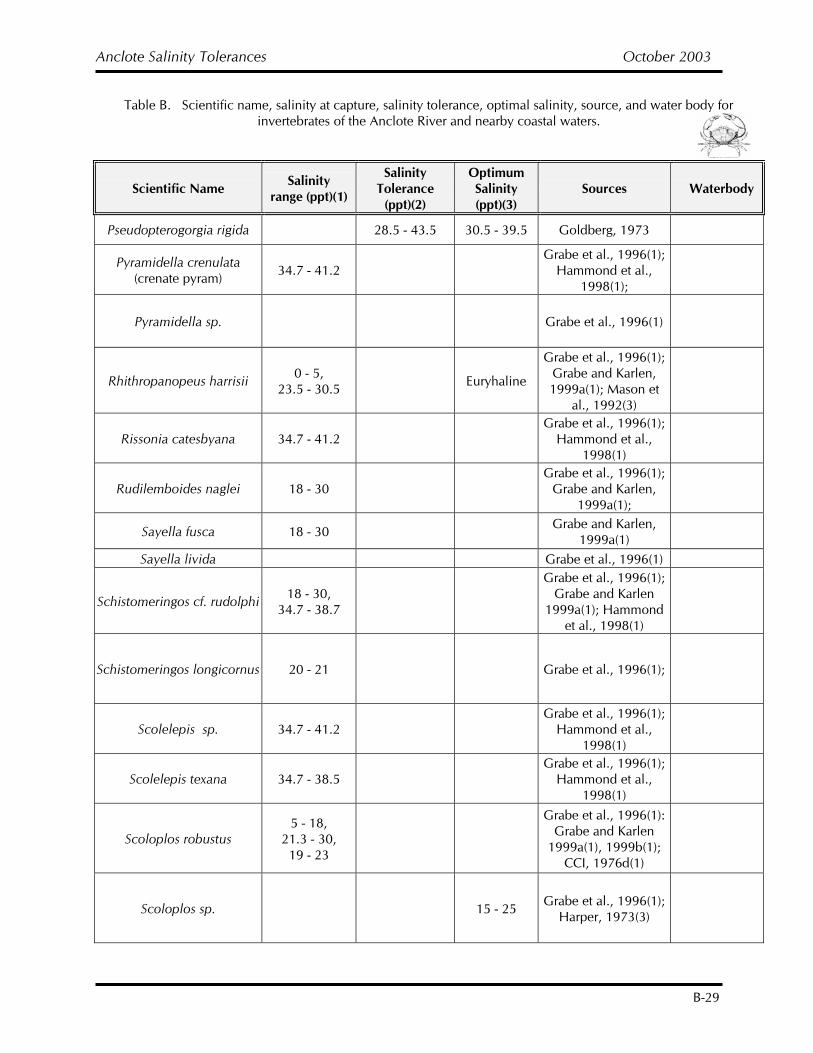
Anclote Salinity Tolerances October 2003
B-29
Table B. Scientific name, salinity at capture, salinity tolerance, optimal salinity, source, and water body for invertebrates of the Anclote River and nearby coastal waters.
Scientific Name Salinity range (ppt)(1)
Salinity Tolerance
(ppt)(2)
Optimum Salinity (ppt)(3)
Sources Waterbody
Pseudopterogorgia rigida 28.5 - 43.5 30.5 - 39.5 Goldberg, 1973
Pyramidella crenulata (crenate pyram) 34.7 - 41.2
Grabe et al., 1996(1); Hammond et al.,
1998(1);
Pyramidella sp. Grabe et al., 1996(1)
Rhithropanopeus harrisii 0 - 5, 23.5 - 30.5 Euryhaline
Grabe et al., 1996(1); Grabe and Karlen, 1999a(1); Mason et
al., 1992(3)
Rissonia catesbyana 34.7 - 41.2 Grabe et al., 1996(1);
Hammond et al., 1998(1)
Rudilemboides naglei 18 - 30 Grabe et al., 1996(1);
Grabe and Karlen, 1999a(1);
Sayella fusca 18 - 30 Grabe and Karlen, 1999a(1)
Sayella livida Grabe et al., 1996(1)
Schistomeringos cf. rudolphi 18 - 30, 34.7 - 38.7
Grabe et al., 1996(1); Grabe and Karlen
1999a(1); Hammond et al., 1998(1)
Schistomeringos longicornus 20 - 21 Grabe et al., 1996(1);
Scolelepis sp. 34.7 - 41.2 Grabe et al., 1996(1);
Hammond et al., 1998(1)
Scolelepis texana 34.7 - 38.5 Grabe et al., 1996(1);
Hammond et al., 1998(1)
Scoloplos robustus 5 - 18,
21.3 - 30, 19 - 23
Grabe et al., 1996(1): Grabe and Karlen
1999a(1), 1999b(1); CCI, 1976d(1)
Scoloplos sp. 15 - 25 Grabe et al., 1996(1); Harper, 1973(3)
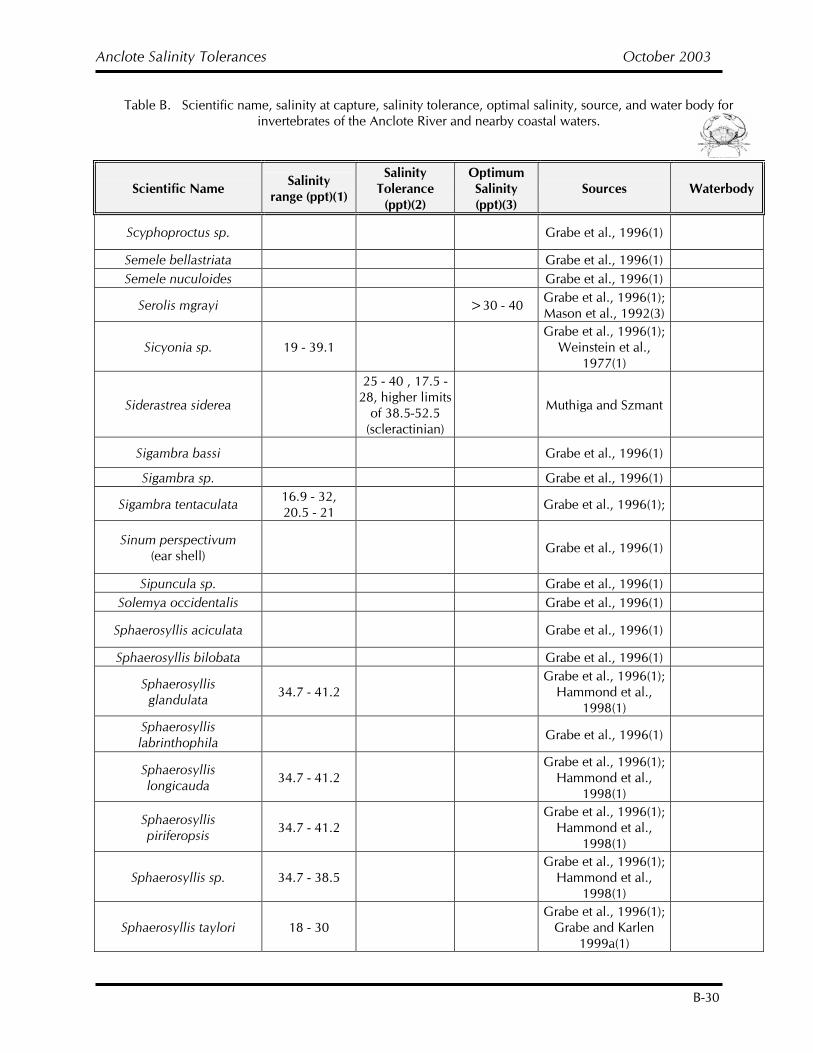
Anclote Salinity Tolerances October 2003
B-30
Table B. Scientific name, salinity at capture, salinity tolerance, optimal salinity, source, and water body for invertebrates of the Anclote River and nearby coastal waters.
Scientific Name Salinity range (ppt)(1)
Salinity Tolerance
(ppt)(2)
Optimum Salinity (ppt)(3)
Sources Waterbody
Scyphoproctus sp. Grabe et al., 1996(1)
Semele bellastriata Grabe et al., 1996(1) Semele nuculoides Grabe et al., 1996(1)
Serolis mgrayi >30 - 40 Grabe et al., 1996(1); Mason et al., 1992(3)
Sicyonia sp. 19 - 39.1 Grabe et al., 1996(1);
Weinstein et al., 1977(1)
Siderastrea siderea
25 - 40 , 17.5 - 28, higher limits
of 38.5-52.5 (scleractinian)
Muthiga and Szmant
Sigambra bassi Grabe et al., 1996(1)
Sigambra sp. Grabe et al., 1996(1)
Sigambra tentaculata 16.9 - 32, 20.5 - 21 Grabe et al., 1996(1);
Sinum perspectivum (ear shell) Grabe et al., 1996(1)
Sipuncula sp. Grabe et al., 1996(1) Solemya occidentalis Grabe et al., 1996(1)
Sphaerosyllis aciculata Grabe et al., 1996(1)
Sphaerosyllis bilobata Grabe et al., 1996(1)
Sphaerosyllis glandulata 34.7 - 41.2
Grabe et al., 1996(1); Hammond et al.,
1998(1)
Sphaerosyllis labrinthophila Grabe et al., 1996(1)
Sphaerosyllis longicauda 34.7 - 41.2
Grabe et al., 1996(1); Hammond et al.,
1998(1)
Sphaerosyllis piriferopsis 34.7 - 41.2
Grabe et al., 1996(1); Hammond et al.,
1998(1)
Sphaerosyllis sp. 34.7 - 38.5 Grabe et al., 1996(1);
Hammond et al., 1998(1)
Sphaerosyllis taylori 18 - 30 Grabe et al., 1996(1);
Grabe and Karlen 1999a(1)
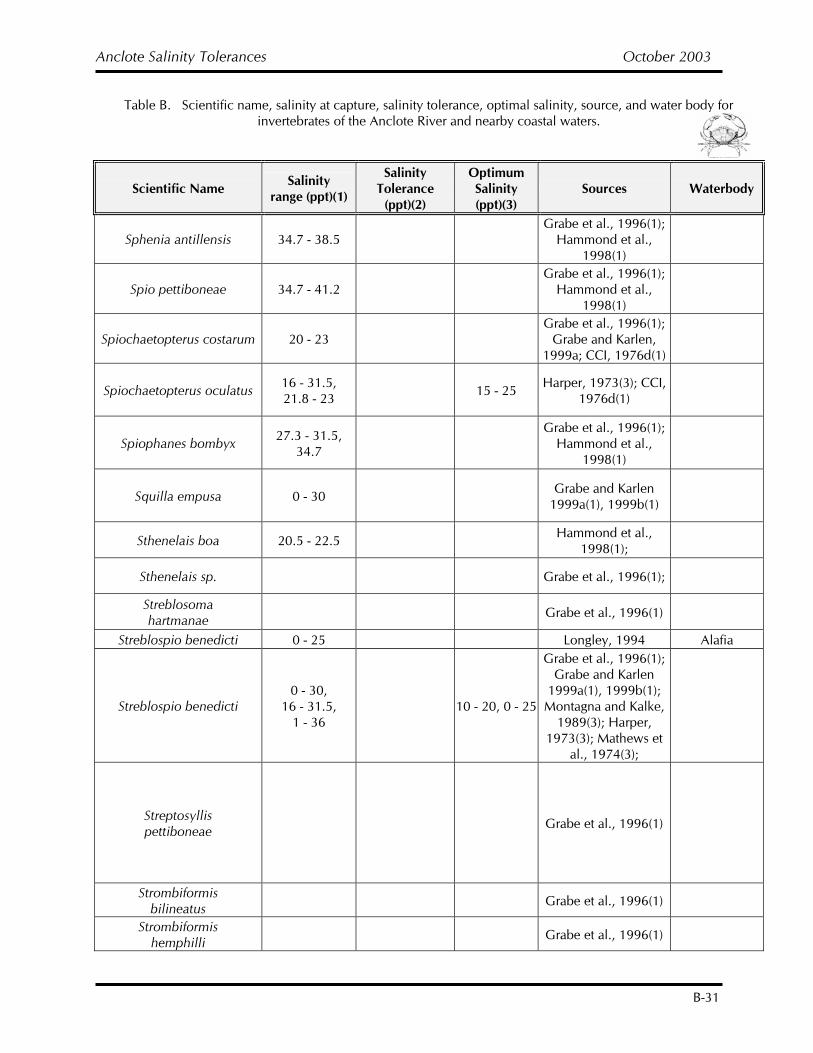
Anclote Salinity Tolerances October 2003
B-31
Table B. Scientific name, salinity at capture, salinity tolerance, optimal salinity, source, and water body for invertebrates of the Anclote River and nearby coastal waters.
Scientific Name Salinity range (ppt)(1)
Salinity Tolerance
(ppt)(2)
Optimum Salinity (ppt)(3)
Sources Waterbody
Sphenia antillensis 34.7 - 38.5 Grabe et al., 1996(1);
Hammond et al., 1998(1)
Spio pettiboneae 34.7 - 41.2 Grabe et al., 1996(1);
Hammond et al., 1998(1)
Spiochaetopterus costarum 20 - 23 Grabe et al., 1996(1);
Grabe and Karlen, 1999a; CCI, 1976d(1)
Spiochaetopterus oculatus 16 - 31.5, 21.8 - 23 15 - 25 Harper, 1973(3); CCI,
1976d(1)
Spiophanes bombyx 27.3 - 31.5, 34.7
Grabe et al., 1996(1); Hammond et al.,
1998(1)
Squilla empusa 0 - 30 Grabe and Karlen 1999a(1), 1999b(1)
Sthenelais boa 20.5 - 22.5 Hammond et al., 1998(1);
Sthenelais sp. Grabe et al., 1996(1);
Streblosoma hartmanae Grabe et al., 1996(1)
Streblospio benedicti 0 - 25 Longley, 1994 Alafia
Streblospio benedicti 0 - 30,
16 - 31.5, 1 - 36
10 - 20, 0 - 25
Grabe et al., 1996(1); Grabe and Karlen
1999a(1), 1999b(1); Montagna and Kalke,
1989(3); Harper, 1973(3); Mathews et
al., 1974(3);
Streptosyllis pettiboneae Grabe et al., 1996(1)
Strombiformis bilineatus Grabe et al., 1996(1)
Strombiformis hemphilli Grabe et al., 1996(1)
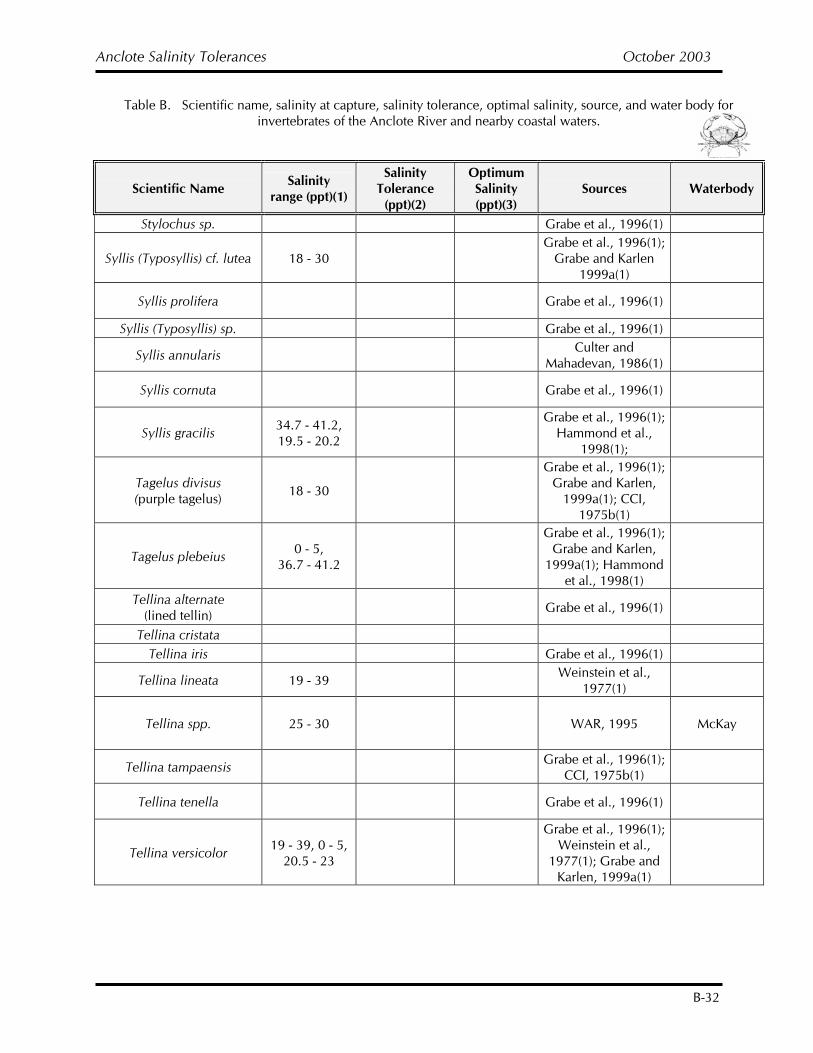
Anclote Salinity Tolerances October 2003
B-32
Table B. Scientific name, salinity at capture, salinity tolerance, optimal salinity, source, and water body for invertebrates of the Anclote River and nearby coastal waters.
Scientific Name Salinity range (ppt)(1)
Salinity Tolerance
(ppt)(2)
Optimum Salinity (ppt)(3)
Sources Waterbody
Stylochus sp. Grabe et al., 1996(1)
Syllis (Typosyllis) cf. lutea 18 - 30 Grabe et al., 1996(1);
Grabe and Karlen 1999a(1)
Syllis prolifera Grabe et al., 1996(1)
Syllis (Typosyllis) sp. Grabe et al., 1996(1)
Syllis annularis Culter and Mahadevan, 1986(1)
Syllis cornuta Grabe et al., 1996(1)
Syllis gracilis 34.7 - 41.2, 19.5 - 20.2
Grabe et al., 1996(1); Hammond et al.,
1998(1);
Tagelus divisus (purple tagelus) 18 - 30
Grabe et al., 1996(1); Grabe and Karlen,
1999a(1); CCI, 1975b(1)
Tagelus plebeius 0 - 5, 36.7 - 41.2
Grabe et al., 1996(1); Grabe and Karlen,
1999a(1); Hammond et al., 1998(1)
Tellina alternate (lined tellin) Grabe et al., 1996(1)
Tellina cristata Tellina iris Grabe et al., 1996(1)
Tellina lineata 19 - 39 Weinstein et al., 1977(1)
Tellina spp. 25 - 30 WAR, 1995 McKay
Tellina tampaensis Grabe et al., 1996(1); CCI, 1975b(1)
Tellina tenella Grabe et al., 1996(1)
Tellina versicolor 19 - 39, 0 - 5, 20.5 - 23
Grabe et al., 1996(1); Weinstein et al.,
1977(1); Grabe and Karlen, 1999a(1)

Anclote Salinity Tolerances October 2003
B-33
Table B. Scientific name, salinity at capture, salinity tolerance, optimal salinity, source, and water body for invertebrates of the Anclote River and nearby coastal waters.
Scientific Name Salinity range (ppt)(1)
Salinity Tolerance
(ppt)(2)
Optimum Salinity (ppt)(3)
Sources Waterbody
Terebella rubra Grabe et al., 1996(1); CCI, 1976d(1)
Terebellides stroemi Grabe et al., 1996(1)
Tharyx sp. 34.7 - 41.2, 19 - 23 Hammond et al.,
1998(1);
Tiron triocellatus Grabe et al., 1996(1)
Tornatina inconspicua Grabe et al., 1996(1)
Tozeuma carolinense 29 - 39.1 Grabe et al., 1996(1);
Weinstein et al., 1977(1)
Trachypenaeus constrictus (spotted shrimp)
19 - 39, 19 - 39.1, 18 - 29.3
Grabe et al., 1996(1);
Weinstein et al., 1977(1);
Transennella conradina Grabe et al., 1996(1)
Travisia hobsonae Grabe et al., 1996(1)
Trypanosyllis parvidentata Grabe et al., 1996(1)
Tubificids 0 - 33 WAR, 1995 Alafia, McKay
Tubificoides brownae 0 - 5 Grabe and Karlen 1999a(1), 1999b(1)
Turbonilla conradi 16.9 - 27.8 Grabe et al., 1996(1);)
Turbonilla interrupta Grabe et al., 1996(1)
Turbonilla sp. 29 - 39.1,
34.7 - 41.2, 20 - 21
Grabe et al., 1996(1); Weinstein et al.,
1977(1); Hammond et al., 1998(1);
Turbonilla viridaria Grabe et al., 1996(1)
Upogebia sp. Grabe et al., 1996(1)
Upogebia affinis 19 - 39 Grabe et al., 1996(1);
Weinstein et al., 1977(1)
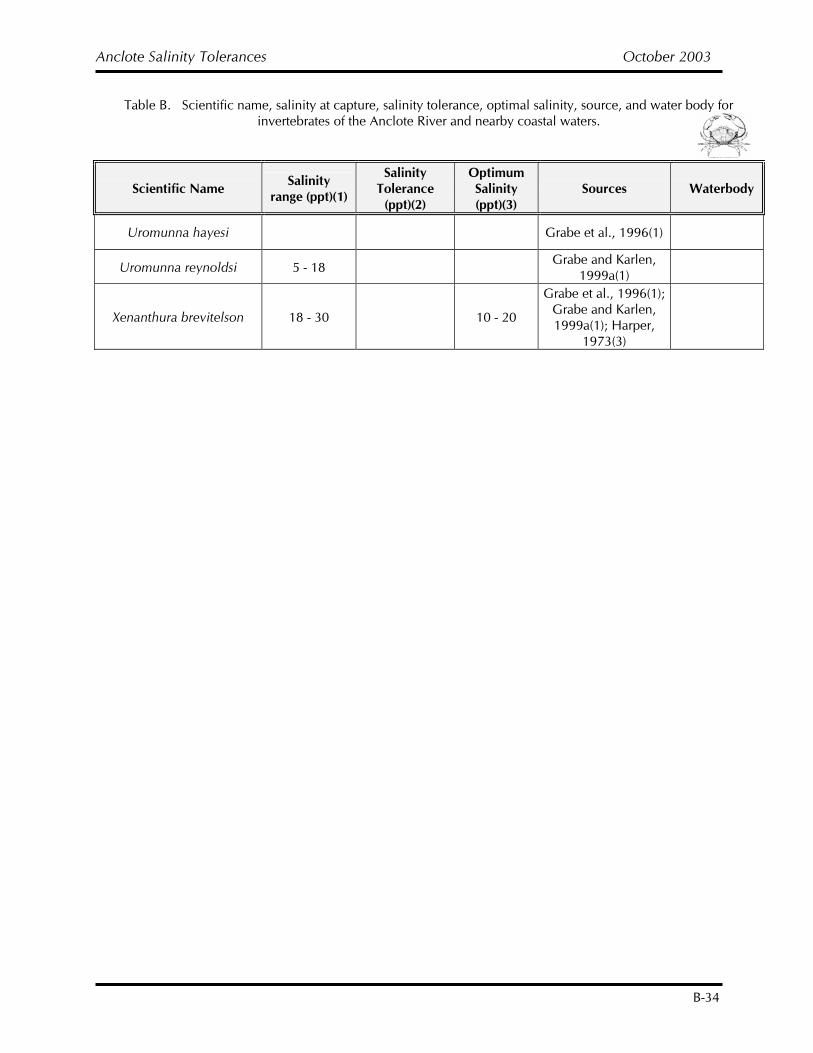
Anclote Salinity Tolerances October 2003
B-34
Table B. Scientific name, salinity at capture, salinity tolerance, optimal salinity, source, and water body for invertebrates of the Anclote River and nearby coastal waters.
Scientific Name Salinity range (ppt)(1)
Salinity Tolerance
(ppt)(2)
Optimum Salinity (ppt)(3)
Sources Waterbody
Uromunna hayesi Grabe et al., 1996(1)
Uromunna reynoldsi 5 - 18 Grabe and Karlen, 1999a(1)
Xenanthura brevitelson 18 - 30 10 - 20
Grabe et al., 1996(1); Grabe and Karlen, 1999a(1); Harper,
1973(3)
Anclote Salinity Tolerances October 2003
C-1
APPENDIX C
VEGETATION: Salinity Tolerance and Salinity Range Information
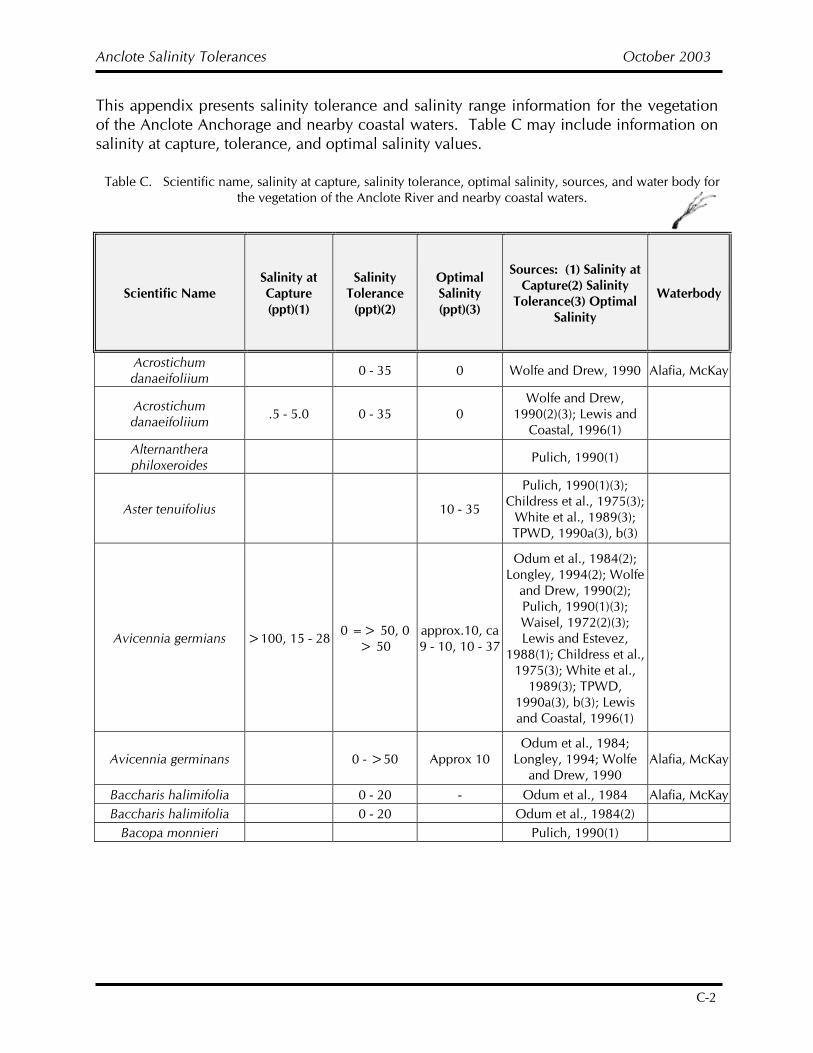
Anclote Salinity Tolerances October 2003
C-2
This appendix presents salinity tolerance and salinity range information for the vegetation of the Anclote Anchorage and nearby coastal waters. Table C may include information on salinity at capture, tolerance, and optimal salinity values.
Table C. Scientific name, salinity at capture, salinity tolerance, optimal salinity, sources, and water body for the vegetation of the Anclote River and nearby coastal waters.
Scientific Name Salinity at Capture (ppt)(1)
Salinity Tolerance
(ppt)(2)
Optimal Salinity (ppt)(3)
Sources: (1) Salinity at Capture(2) Salinity
Tolerance(3) Optimal Salinity
Waterbody
Acrostichum danaeifoliium 0 - 35 0 Wolfe and Drew, 1990 Alafia, McKay
Acrostichum danaeifoliium .5 - 5.0 0 - 35 0
Wolfe and Drew, 1990(2)(3); Lewis and
Coastal, 1996(1)
Alternanthera philoxeroides Pulich, 1990(1)
Aster tenuifolius 10 - 35
Pulich, 1990(1)(3); Childress et al., 1975(3);
White et al., 1989(3); TPWD, 1990a(3), b(3)
Avicennia germians >100, 15 - 28 0 => 50, 0 > 50
approx.10, ca 9 - 10, 10 - 37
Odum et al., 1984(2); Longley, 1994(2); Wolfe
and Drew, 1990(2); Pulich, 1990(1)(3); Waisel, 1972(2)(3); Lewis and Estevez,
1988(1); Childress et al., 1975(3); White et al.,
1989(3); TPWD, 1990a(3), b(3); Lewis and Coastal, 1996(1)
Avicennia germinans 0 - >50 Approx 10 Odum et al., 1984;
Longley, 1994; Wolfe and Drew, 1990
Alafia, McKay
Baccharis halimifolia 0 - 20 - Odum et al., 1984 Alafia, McKay Baccharis halimifolia 0 - 20 Odum et al., 1984(2)
Bacopa monnieri Pulich, 1990(1)
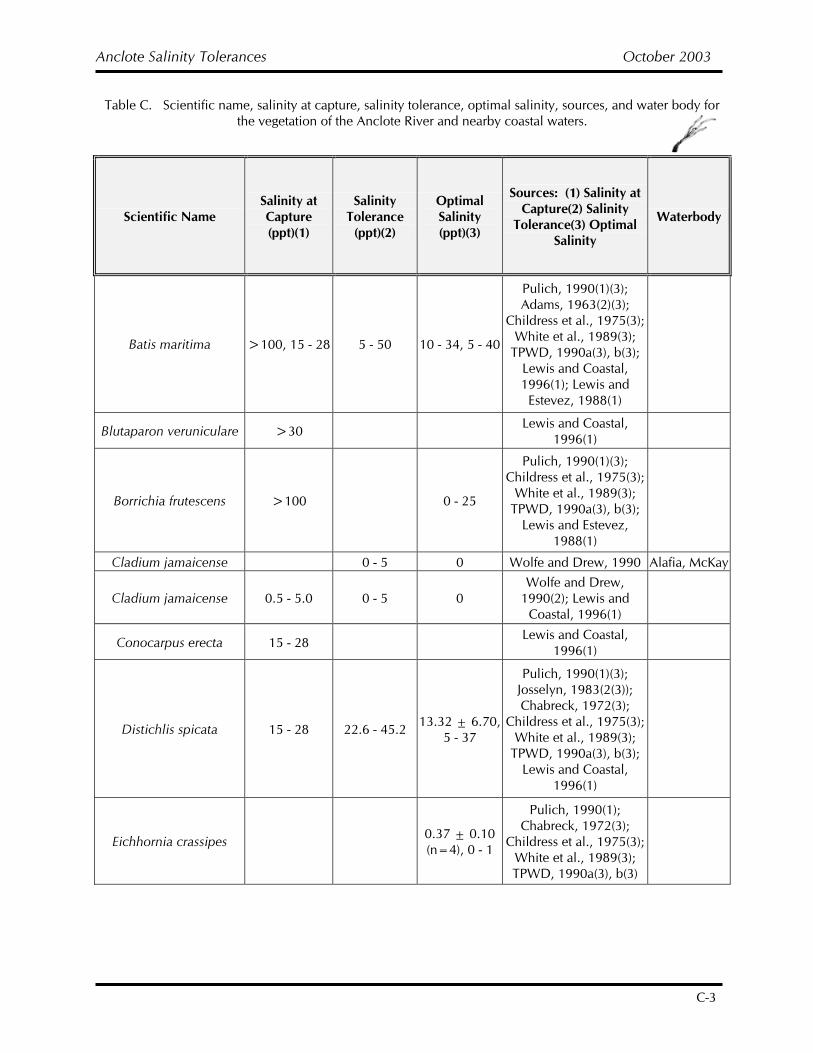
Anclote Salinity Tolerances October 2003
C-3
Table C. Scientific name, salinity at capture, salinity tolerance, optimal salinity, sources, and water body for the vegetation of the Anclote River and nearby coastal waters.
Scientific Name Salinity at Capture (ppt)(1)
Salinity Tolerance
(ppt)(2)
Optimal Salinity (ppt)(3)
Sources: (1) Salinity at Capture(2) Salinity
Tolerance(3) Optimal Salinity
Waterbody
Batis maritima >100, 15 - 28 5 - 50 10 - 34, 5 - 40
Pulich, 1990(1)(3); Adams, 1963(2)(3);
Childress et al., 1975(3); White et al., 1989(3);
TPWD, 1990a(3), b(3); Lewis and Coastal, 1996(1); Lewis and
Estevez, 1988(1)
Blutaparon veruniculare >30 Lewis and Coastal, 1996(1)
Borrichia frutescens >100 0 - 25
Pulich, 1990(1)(3); Childress et al., 1975(3);
White et al., 1989(3); TPWD, 1990a(3), b(3);
Lewis and Estevez, 1988(1)
Cladium jamaicense 0 - 5 0 Wolfe and Drew, 1990 Alafia, McKay
Cladium jamaicense 0.5 - 5.0 0 - 5 0 Wolfe and Drew,
1990(2); Lewis and Coastal, 1996(1)
Conocarpus erecta 15 - 28 Lewis and Coastal, 1996(1)
Distichlis spicata 15 - 28 22.6 - 45.2 13.32 ± 6.70, 5 - 37
Pulich, 1990(1)(3); Josselyn, 1983(2(3)); Chabreck, 1972(3);
Childress et al., 1975(3); White et al., 1989(3);
TPWD, 1990a(3), b(3); Lewis and Coastal,
1996(1)
Eichhornia crassipes 0.37 ± 0.10 (n=4), 0 - 1
Pulich, 1990(1); Chabreck, 1972(3);
Childress et al., 1975(3); White et al., 1989(3); TPWD, 1990a(3), b(3)
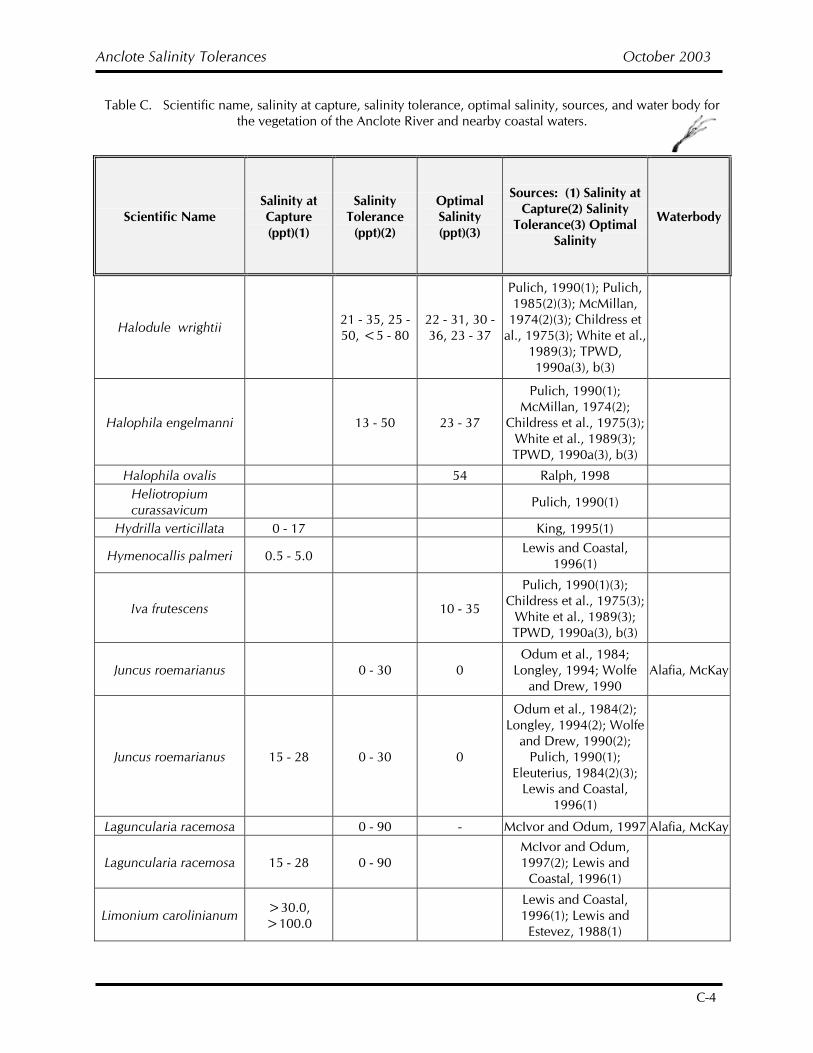
Anclote Salinity Tolerances October 2003
C-4
Table C. Scientific name, salinity at capture, salinity tolerance, optimal salinity, sources, and water body for the vegetation of the Anclote River and nearby coastal waters.
Scientific Name Salinity at Capture (ppt)(1)
Salinity Tolerance
(ppt)(2)
Optimal Salinity (ppt)(3)
Sources: (1) Salinity at Capture(2) Salinity
Tolerance(3) Optimal Salinity
Waterbody
Halodule wrightii 21 - 35, 25 - 50, <5 - 80
22 - 31, 30 - 36, 23 - 37
Pulich, 1990(1); Pulich, 1985(2)(3); McMillan,
1974(2)(3); Childress et al., 1975(3); White et al.,
1989(3); TPWD, 1990a(3), b(3)
Halophila engelmanni 13 - 50 23 - 37
Pulich, 1990(1); McMillan, 1974(2);
Childress et al., 1975(3); White et al., 1989(3); TPWD, 1990a(3), b(3)
Halophila ovalis 54 Ralph, 1998 Heliotropium curassavicum Pulich, 1990(1)
Hydrilla verticillata 0 - 17 King, 1995(1)
Hymenocallis palmeri 0.5 - 5.0 Lewis and Coastal, 1996(1)
Iva frutescens 10 - 35
Pulich, 1990(1)(3); Childress et al., 1975(3);
White et al., 1989(3); TPWD, 1990a(3), b(3)
Juncus roemarianus 0 - 30 0 Odum et al., 1984;
Longley, 1994; Wolfe and Drew, 1990
Alafia, McKay
Juncus roemarianus 15 - 28 0 - 30 0
Odum et al., 1984(2); Longley, 1994(2); Wolfe
and Drew, 1990(2); Pulich, 1990(1);
Eleuterius, 1984(2)(3); Lewis and Coastal,
1996(1)
Laguncularia racemosa 0 - 90 - McIvor and Odum, 1997 Alafia, McKay
Laguncularia racemosa 15 - 28 0 - 90 McIvor and Odum, 1997(2); Lewis and
Coastal, 1996(1)
Limonium carolinianum >30.0, >100.0
Lewis and Coastal, 1996(1); Lewis and
Estevez, 1988(1)
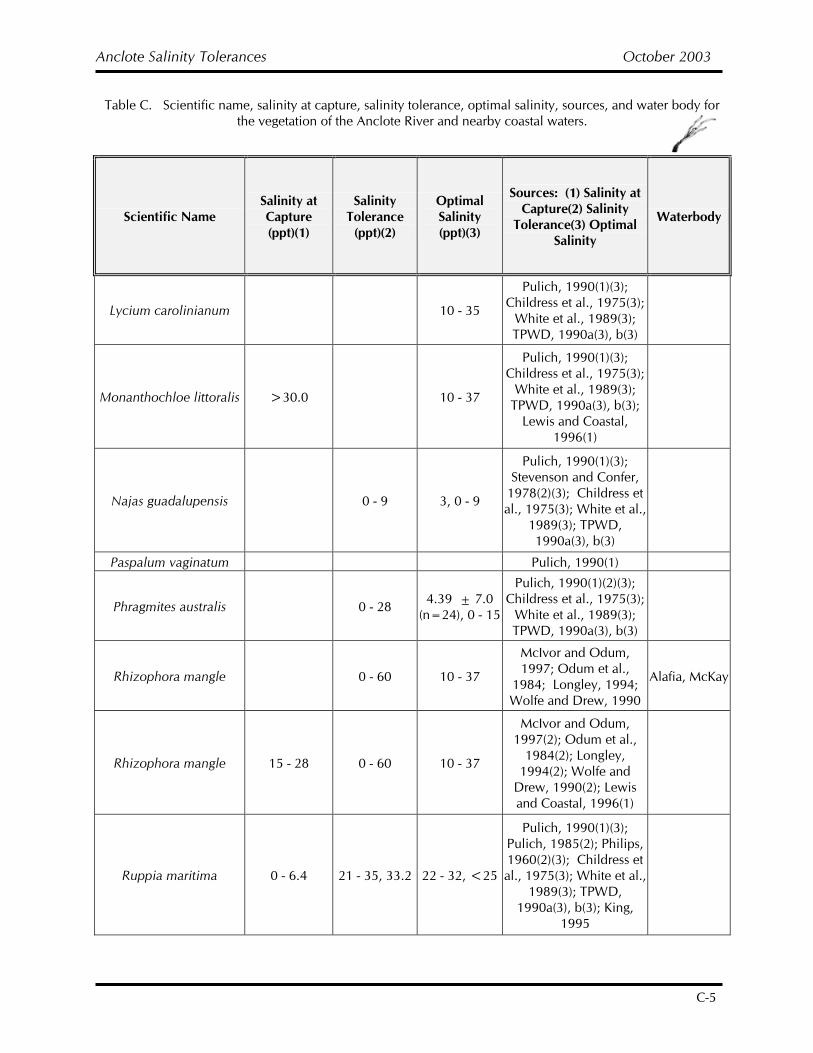
Anclote Salinity Tolerances October 2003
C-5
Table C. Scientific name, salinity at capture, salinity tolerance, optimal salinity, sources, and water body for the vegetation of the Anclote River and nearby coastal waters.
Scientific Name Salinity at Capture (ppt)(1)
Salinity Tolerance
(ppt)(2)
Optimal Salinity (ppt)(3)
Sources: (1) Salinity at Capture(2) Salinity
Tolerance(3) Optimal Salinity
Waterbody
Lycium carolinianum 10 - 35
Pulich, 1990(1)(3); Childress et al., 1975(3);
White et al., 1989(3); TPWD, 1990a(3), b(3)
Monanthochloe littoralis >30.0 10 - 37
Pulich, 1990(1)(3); Childress et al., 1975(3);
White et al., 1989(3); TPWD, 1990a(3), b(3);
Lewis and Coastal, 1996(1)
Najas guadalupensis 0 - 9 3, 0 - 9
Pulich, 1990(1)(3); Stevenson and Confer,
1978(2)(3); Childress et al., 1975(3); White et al.,
1989(3); TPWD, 1990a(3), b(3)
Paspalum vaginatum Pulich, 1990(1)
Phragmites australis 0 - 28 4.39 ± 7.0 (n=24), 0 - 15
Pulich, 1990(1)(2)(3); Childress et al., 1975(3);
White et al., 1989(3); TPWD, 1990a(3), b(3)
Rhizophora mangle 0 - 60 10 - 37
McIvor and Odum, 1997; Odum et al.,
1984; Longley, 1994; Wolfe and Drew, 1990
Alafia, McKay
Rhizophora mangle 15 - 28 0 - 60 10 - 37
McIvor and Odum, 1997(2); Odum et al.,
1984(2); Longley, 1994(2); Wolfe and
Drew, 1990(2); Lewis and Coastal, 1996(1)
Ruppia maritima 0 - 6.4 21 - 35, 33.2 22 - 32, <25
Pulich, 1990(1)(3); Pulich, 1985(2); Philips, 1960(2)(3); Childress et al., 1975(3); White et al.,
1989(3); TPWD, 1990a(3), b(3); King,
1995
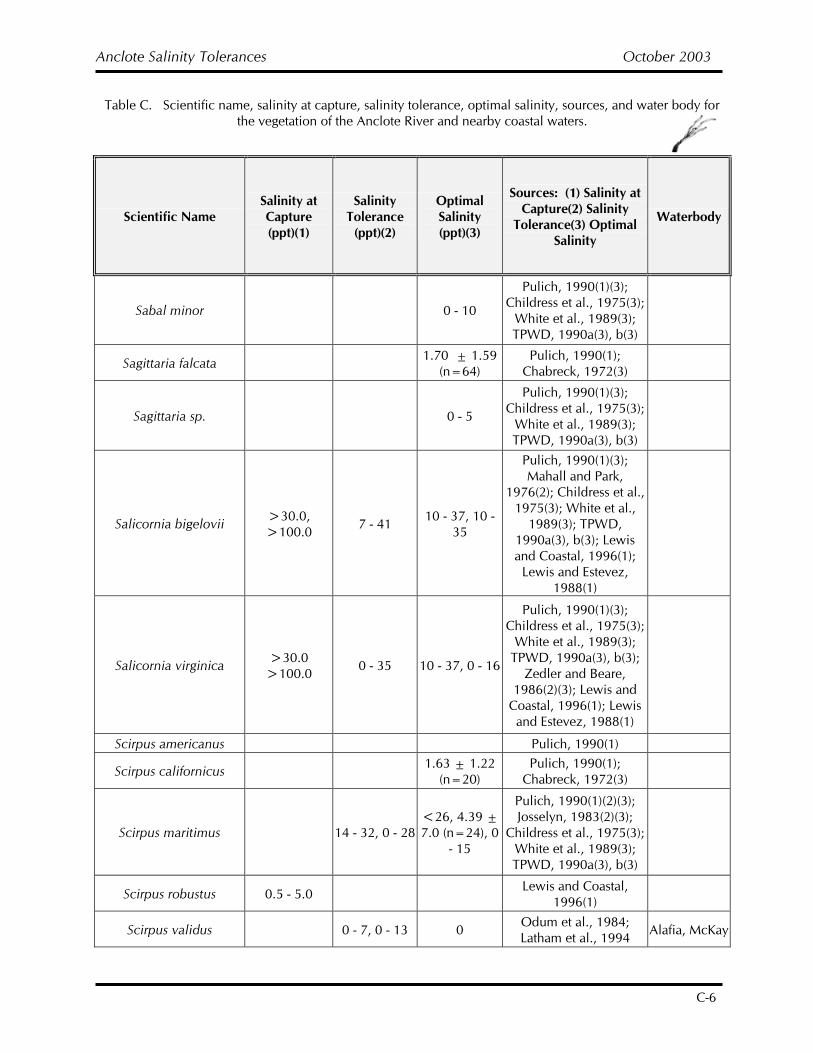
Anclote Salinity Tolerances October 2003
C-6
Table C. Scientific name, salinity at capture, salinity tolerance, optimal salinity, sources, and water body for the vegetation of the Anclote River and nearby coastal waters.
Scientific Name Salinity at Capture (ppt)(1)
Salinity Tolerance
(ppt)(2)
Optimal Salinity (ppt)(3)
Sources: (1) Salinity at Capture(2) Salinity
Tolerance(3) Optimal Salinity
Waterbody
Sabal minor 0 - 10
Pulich, 1990(1)(3); Childress et al., 1975(3);
White et al., 1989(3); TPWD, 1990a(3), b(3)
Sagittaria falcata 1.70 ± 1.59 (n=64)
Pulich, 1990(1); Chabreck, 1972(3)
Sagittaria sp. 0 - 5
Pulich, 1990(1)(3); Childress et al., 1975(3);
White et al., 1989(3); TPWD, 1990a(3), b(3)
Salicornia bigelovii >30.0, >100.0 7 - 41 10 - 37, 10 -
35
Pulich, 1990(1)(3); Mahall and Park,
1976(2); Childress et al., 1975(3); White et al.,
1989(3); TPWD, 1990a(3), b(3); Lewis and Coastal, 1996(1);
Lewis and Estevez, 1988(1)
Salicornia virginica >30.0 >100.0 0 - 35 10 - 37, 0 - 16
Pulich, 1990(1)(3); Childress et al., 1975(3);
White et al., 1989(3); TPWD, 1990a(3), b(3);
Zedler and Beare, 1986(2)(3); Lewis and
Coastal, 1996(1); Lewis and Estevez, 1988(1)
Scirpus americanus Pulich, 1990(1)
Scirpus californicus 1.63 ± 1.22 (n=20)
Pulich, 1990(1); Chabreck, 1972(3)
Scirpus maritimus 14 - 32, 0 - 28 <26, 4.39 ± 7.0 (n=24), 0
- 15
Pulich, 1990(1)(2)(3); Josselyn, 1983(2)(3);
Childress et al., 1975(3); White et al., 1989(3); TPWD, 1990a(3), b(3)
Scirpus robustus 0.5 - 5.0 Lewis and Coastal, 1996(1)
Scirpus validus 0 - 7, 0 - 13 0 Odum et al., 1984; Latham et al., 1994 Alafia, McKay
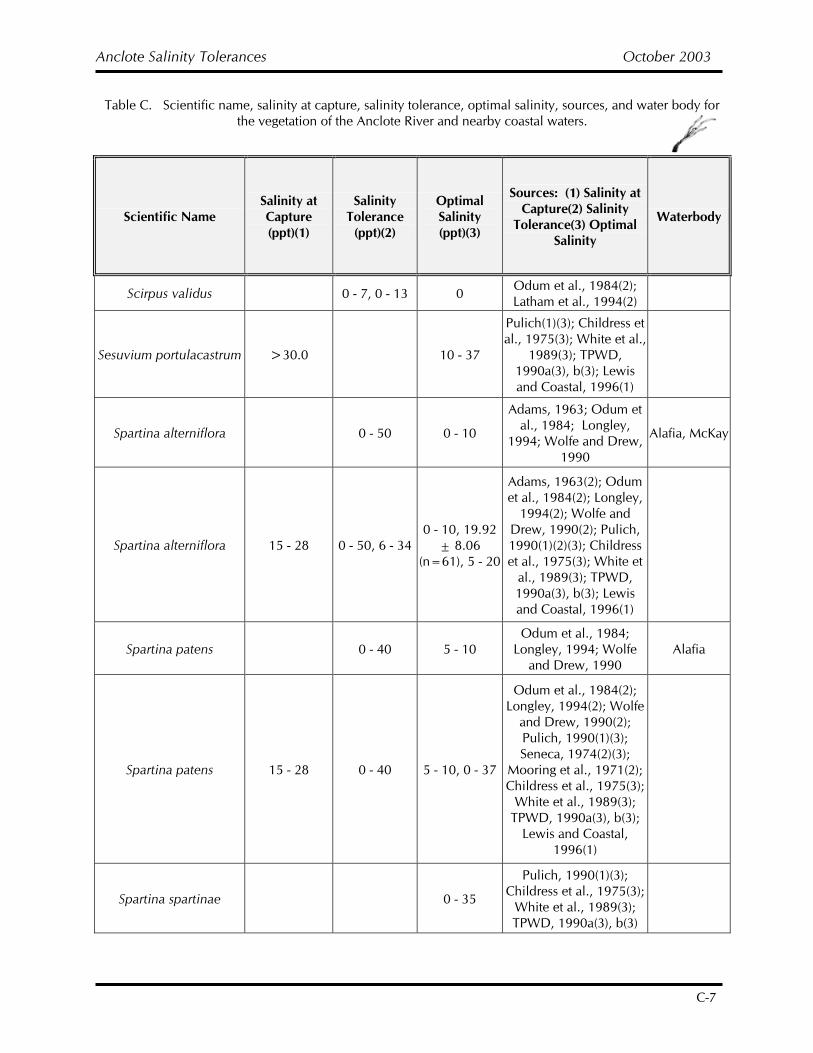
Anclote Salinity Tolerances October 2003
C-7
Table C. Scientific name, salinity at capture, salinity tolerance, optimal salinity, sources, and water body for the vegetation of the Anclote River and nearby coastal waters.
Scientific Name Salinity at Capture (ppt)(1)
Salinity Tolerance
(ppt)(2)
Optimal Salinity (ppt)(3)
Sources: (1) Salinity at Capture(2) Salinity
Tolerance(3) Optimal Salinity
Waterbody
Scirpus validus 0 - 7, 0 - 13 0 Odum et al., 1984(2); Latham et al., 1994(2)
Sesuvium portulacastrum >30.0 10 - 37
Pulich(1)(3); Childress et al., 1975(3); White et al.,
1989(3); TPWD, 1990a(3), b(3); Lewis and Coastal, 1996(1)
Spartina alterniflora 0 - 50 0 - 10
Adams, 1963; Odum et al., 1984; Longley,
1994; Wolfe and Drew, 1990
Alafia, McKay
Spartina alterniflora 15 - 28 0 - 50, 6 - 34 0 - 10, 19.92
± 8.06 (n=61), 5 - 20
Adams, 1963(2); Odum et al., 1984(2); Longley,
1994(2); Wolfe and Drew, 1990(2); Pulich, 1990(1)(2)(3); Childress et al., 1975(3); White et
al., 1989(3); TPWD, 1990a(3), b(3); Lewis and Coastal, 1996(1)
Spartina patens 0 - 40 5 - 10 Odum et al., 1984;
Longley, 1994; Wolfe and Drew, 1990
Alafia
Spartina patens 15 - 28 0 - 40 5 - 10, 0 - 37
Odum et al., 1984(2); Longley, 1994(2); Wolfe
and Drew, 1990(2); Pulich, 1990(1)(3); Seneca, 1974(2)(3);
Mooring et al., 1971(2); Childress et al., 1975(3);
White et al., 1989(3); TPWD, 1990a(3), b(3);
Lewis and Coastal, 1996(1)
Spartina spartinae 0 - 35
Pulich, 1990(1)(3); Childress et al., 1975(3);
White et al., 1989(3); TPWD, 1990a(3), b(3)
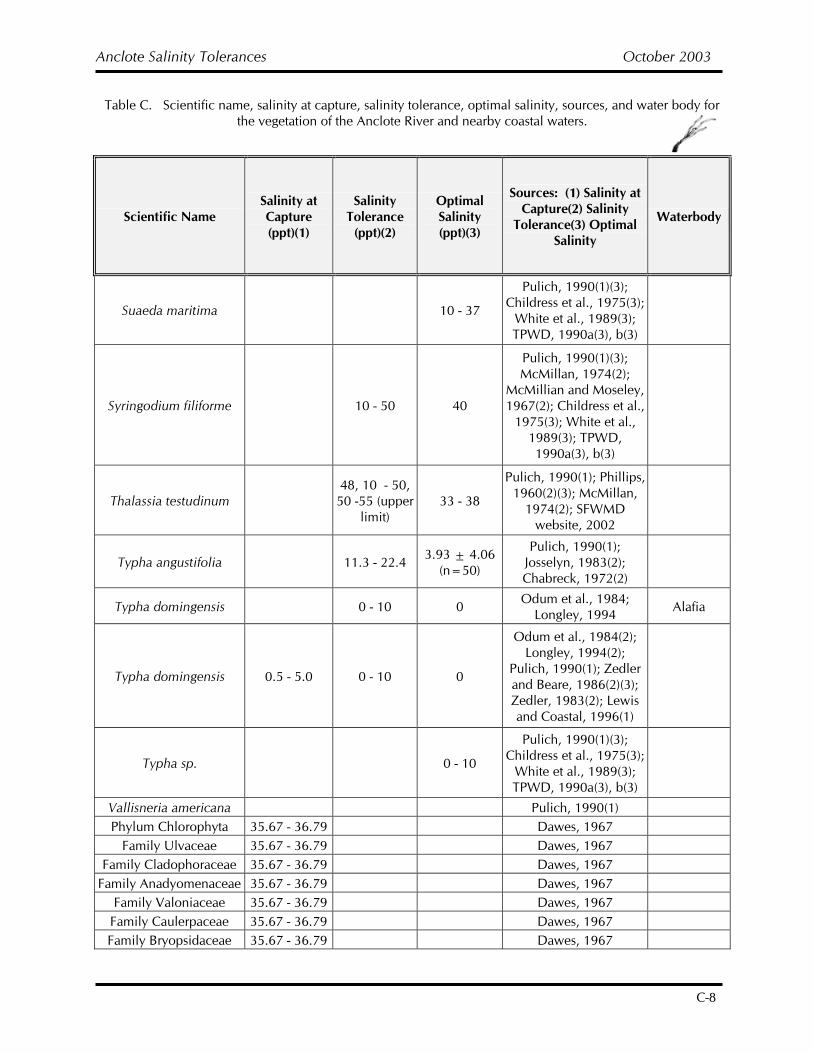
Anclote Salinity Tolerances October 2003
C-8
Table C. Scientific name, salinity at capture, salinity tolerance, optimal salinity, sources, and water body for the vegetation of the Anclote River and nearby coastal waters.
Scientific Name Salinity at Capture (ppt)(1)
Salinity Tolerance
(ppt)(2)
Optimal Salinity (ppt)(3)
Sources: (1) Salinity at Capture(2) Salinity
Tolerance(3) Optimal Salinity
Waterbody
Suaeda maritima 10 - 37
Pulich, 1990(1)(3); Childress et al., 1975(3);
White et al., 1989(3); TPWD, 1990a(3), b(3)
Syringodium filiforme 10 - 50 40
Pulich, 1990(1)(3); McMillan, 1974(2);
McMillian and Moseley, 1967(2); Childress et al.,
1975(3); White et al., 1989(3); TPWD, 1990a(3), b(3)
Thalassia testudinum 48, 10 - 50, 50 -55 (upper
limit) 33 - 38
Pulich, 1990(1); Phillips, 1960(2)(3); McMillan,
1974(2); SFWMD website, 2002
Typha angustifolia 11.3 - 22.4 3.93 ± 4.06 (n=50)
Pulich, 1990(1); Josselyn, 1983(2); Chabreck, 1972(2)
Typha domingensis 0 - 10 0 Odum et al., 1984; Longley, 1994 Alafia
Typha domingensis 0.5 - 5.0 0 - 10 0
Odum et al., 1984(2); Longley, 1994(2);
Pulich, 1990(1); Zedler and Beare, 1986(2)(3); Zedler, 1983(2); Lewis and Coastal, 1996(1)
Typha sp. 0 - 10
Pulich, 1990(1)(3); Childress et al., 1975(3);
White et al., 1989(3); TPWD, 1990a(3), b(3)
Vallisneria americana Pulich, 1990(1) Phylum Chlorophyta 35.67 - 36.79 Dawes, 1967
Family Ulvaceae 35.67 - 36.79 Dawes, 1967 Family Cladophoraceae 35.67 - 36.79 Dawes, 1967
Family Anadyomenaceae 35.67 - 36.79 Dawes, 1967 Family Valoniaceae 35.67 - 36.79 Dawes, 1967
Family Caulerpaceae 35.67 - 36.79 Dawes, 1967 Family Bryopsidaceae 35.67 - 36.79 Dawes, 1967
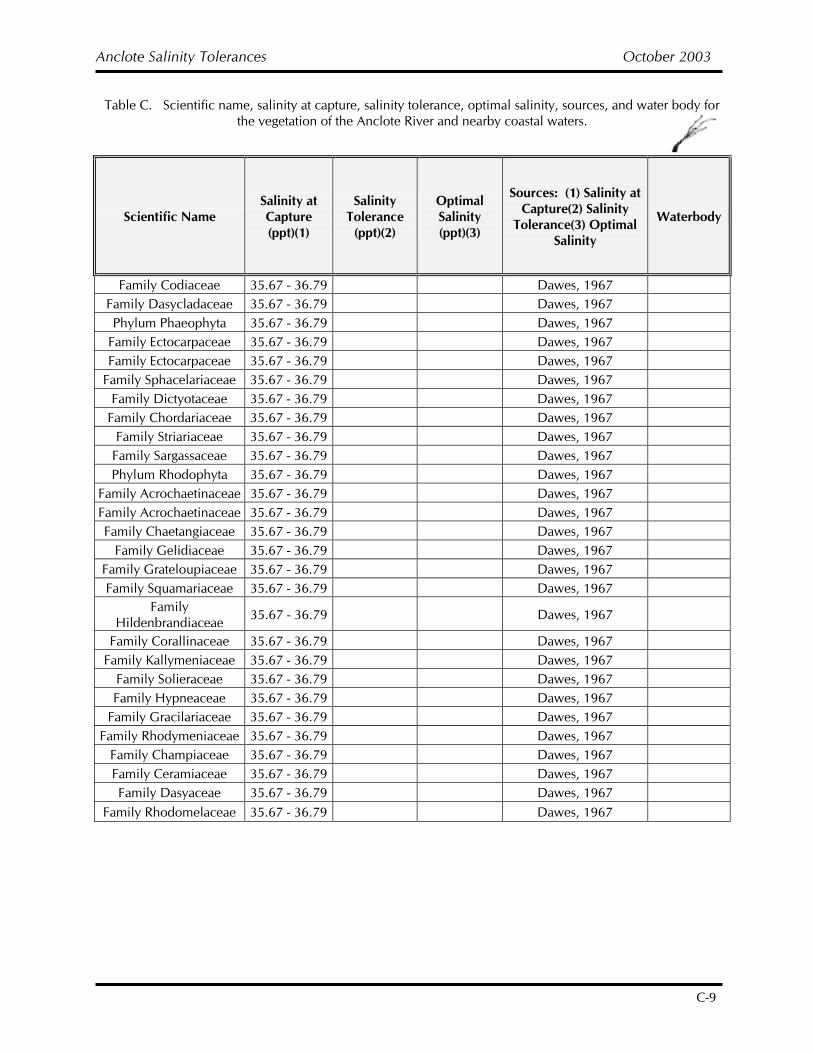
Anclote Salinity Tolerances October 2003
C-9
Table C. Scientific name, salinity at capture, salinity tolerance, optimal salinity, sources, and water body for the vegetation of the Anclote River and nearby coastal waters.
Scientific Name Salinity at Capture (ppt)(1)
Salinity Tolerance
(ppt)(2)
Optimal Salinity (ppt)(3)
Sources: (1) Salinity at Capture(2) Salinity
Tolerance(3) Optimal Salinity
Waterbody
Family Codiaceae 35.67 - 36.79 Dawes, 1967 Family Dasycladaceae 35.67 - 36.79 Dawes, 1967 Phylum Phaeophyta 35.67 - 36.79 Dawes, 1967
Family Ectocarpaceae 35.67 - 36.79 Dawes, 1967 Family Ectocarpaceae 35.67 - 36.79 Dawes, 1967
Family Sphacelariaceae 35.67 - 36.79 Dawes, 1967 Family Dictyotaceae 35.67 - 36.79 Dawes, 1967
Family Chordariaceae 35.67 - 36.79 Dawes, 1967 Family Striariaceae 35.67 - 36.79 Dawes, 1967
Family Sargassaceae 35.67 - 36.79 Dawes, 1967 Phylum Rhodophyta 35.67 - 36.79 Dawes, 1967
Family Acrochaetinaceae 35.67 - 36.79 Dawes, 1967 Family Acrochaetinaceae 35.67 - 36.79 Dawes, 1967 Family Chaetangiaceae 35.67 - 36.79 Dawes, 1967
Family Gelidiaceae 35.67 - 36.79 Dawes, 1967 Family Grateloupiaceae 35.67 - 36.79 Dawes, 1967 Family Squamariaceae 35.67 - 36.79 Dawes, 1967
Family Hildenbrandiaceae 35.67 - 36.79 Dawes, 1967
Family Corallinaceae 35.67 - 36.79 Dawes, 1967 Family Kallymeniaceae 35.67 - 36.79 Dawes, 1967
Family Solieraceae 35.67 - 36.79 Dawes, 1967 Family Hypneaceae 35.67 - 36.79 Dawes, 1967
Family Gracilariaceae 35.67 - 36.79 Dawes, 1967 Family Rhodymeniaceae 35.67 - 36.79 Dawes, 1967
Family Champiaceae 35.67 - 36.79 Dawes, 1967 Family Ceramiaceae 35.67 - 36.79 Dawes, 1967 Family Dasyaceae 35.67 - 36.79 Dawes, 1967
Family Rhodomelaceae 35.67 - 36.79 Dawes, 1967
Anclote Salinity Tolerances October 2003
D-1
APPENDIX D
MAMMALS: Salinity Tolerance and Salinity Range Information
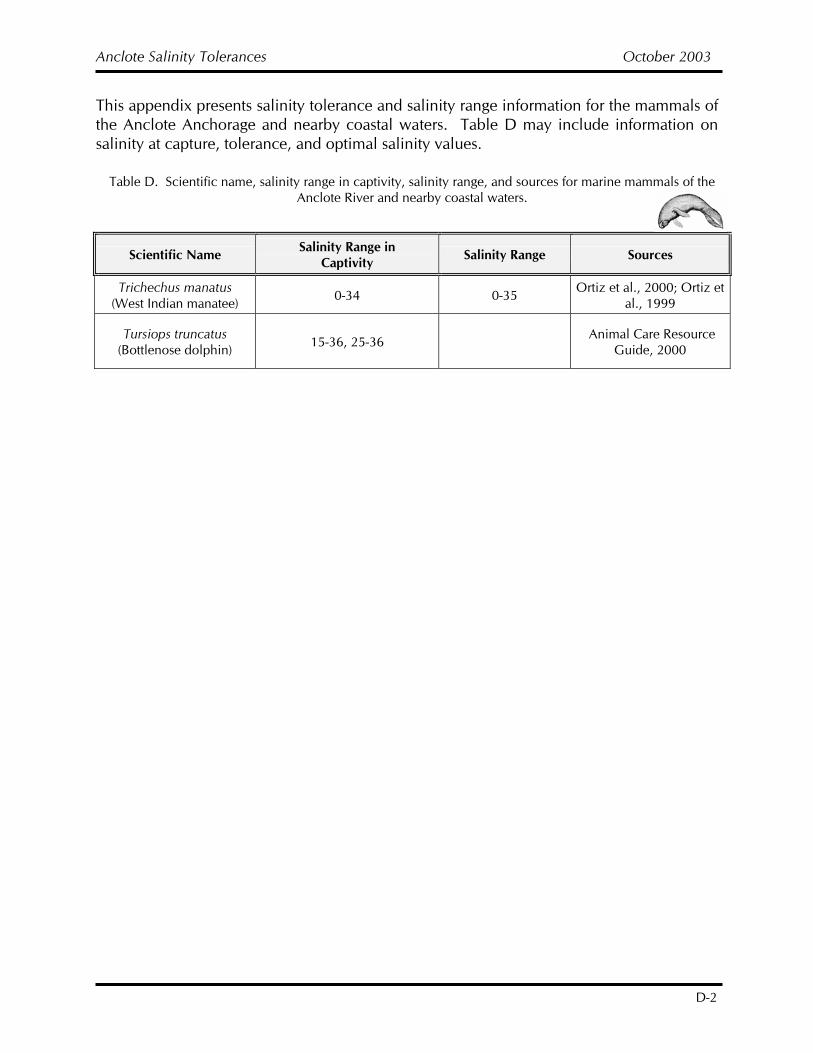
Anclote Salinity Tolerances October 2003
D-2
This appendix presents salinity tolerance and salinity range information for the mammals of the Anclote Anchorage and nearby coastal waters. Table D may include information on salinity at capture, tolerance, and optimal salinity values.
Table D. Scientific name, salinity range in captivity, salinity range, and sources for marine mammals of the Anclote River and nearby coastal waters.
Scientific Name Salinity Range in Captivity Salinity Range Sources
Trichechus manatus (West Indian manatee) 0-34 0-35 Ortiz et al., 2000; Ortiz et
al., 1999
Tursiops truncatus (Bottlenose dolphin) 15-36, 25-36 Animal Care Resource
Guide, 2000

DRAFT Salinity Tolerances Report for the Anclote Region Feb 28, 2003


![8[1].1 biotic & abiotic components](https://img.pdfslide.net/doc/110x75/5454c1ceaf79593f778b61fe/811-biotic-abiotic-components.jpg)