Embed Size (px)
Citation preview

FEEDING, AGGRESSION, AND GROWTH
IN JUVENILE STEELHEAD TROUT,
( SALMO GAI RDNERI )
Jeremy C. Abbott
B.Sc.(~ons) Simon Fraser University 1980
THESIS SUBMITTED IN PARTIAL FULFILLMENT OF
THE REQUIREMENTS FOR THE DEGREE OF
MASTER OF SCIENCE
in the Department
of
Biological Sciences
@ Jeremy C. Abbott 1985
SIMON FRASER UNIVERSITY
December 6, 1985
All rights reserved. This work may not be reproduced in whole or in part, by photocopy
or other means, without permission of the author.

r
Name :
Degree :
T i t l e of Thesis :
Examining Committee:
Chairman :
Approval
Jeremy C. Abbott
Master of Science
Feeding, aggression and growth i n juveni le Steelhead Trou t , , (Sa lmo g a i r d n e r i )
D r . R. Ydenberg
- - V "- \ / w v
D r . L. M. D i l l Senior ~ u ~ e r v r s o r
, - -, - D r . G. Geen, Professor
I," f w J I / - > - f&.9u - c.4 D r . f Slaney g i a o g l $ t , B.C: Fish and Wild l i fe Branch
D r . T.G. Northcote, Fo res t ry , U . B . C . External Examiner
Date Approved: <Sn +3#36

PARTIAL COPYRIGHT LICENSE
I hereby g ran t t o Simon Fraser U n i v e r s i t y the r i g h t t o lend
my thes is , proJect o r extended essay ( t h e t i t l e o f which i s shown below)
t o users o f t he Simon Fraser Un ive rs i t y L ib rary , and t o make p a r t i a l o r
s i n g l e copies on ly f o r such users o r i n response t o a request from the
l i b r a r y o f any o the r un ive rs i t y , o r o ther educational i n s t i t u t i o n , on
i t s own behalf o r f o r one o f i t s users. I f u r t h e r agree t h a t permission
f o r m u l t i p l e copying o f t h i s work f o r scho la r l y purposes may be granted
by me o r t h e Dean o f Graduate Studies. I t i s understood t h a t copying
o r p u b l l c a t i o n o f t h i s work f o r f i n a n c i a l ga in s h a l l not be allowed
wi thout my w r i t t e n permission.
T it I e o f Thes i s/Project/Extended Essay
Feeding, aggression and growth in juvenile Steelhead Trout. (Salmo gairdneri)
Author:
Jeremy C. Abbott
( name
ABSTRACT
Juvenile steelhead trout (Salmo gairdneri) compete for
access to space and/or food. The distribution of these
resources within a population affects the relative growth
and survival of individuals. ~ggression is a means of
competing for these limited resources. his thesis examines
the causes of aggression and growth depensation (size
divergence) in juvenile steelhead.
The sizes of socially isolated juveniles diverged less
with time than those of groups of interacting steelhead,
although average growth rates were equivalent, indicating
that the presence of competitors affects relative growth. A
behavioural mechanism resulting in unequal food acquisition
or growth efficiency is indicated, as rations were in
excess of requirements
Size-matched pairs of steelhead established
hierarchies in which dominants grew 12.3% faster than
subordinates although rations were equal. Therefore factors
other than access to food (possibly stress) play a role<'rai
growth depensation.
Groups of steelhead grew faster when the inter-feeding
interval was reduced, even though daily ration was
constant. Size divergence over time was unaffected at
intervals ranging from 0.5 to 24-h. Marked increases in
aggression were consistently observed following feeding.
The magnitude of post-feeding peaks was inversely

correlated with inter-feeding interval. Total daily
aggression and frequency of various behaviours were
unchanged.
Learning of feeding times and anticipatory aggression
were demonstrated by recording behaviour on the fifth day
of a feeding schedule and continuing to monitor behaviour
for one day after feeding was discontinued. Alpha and beta
hierarchy positions were stable over a one week period.
Underwater observation of steelhead in hatchery
production facilities confirmed the occurrence of
aggression. Various feeding regimes were presented to
groups of steelhead in these facilities. No differences in
growth, size divergence or fin damage were detected at four
regular feeding intervals. Randomly fed fish showed less
size divergence than regularly fed fish but had equivalent
growth rates. This reduced growth depensation could result
in a 6% increase in smolt production.
Trout fighting tactics varied depending on the
response of the opponent. Analysis of aggressive attacks
and patterns of fin damage indicate that agonistic
behaviour is the major cause of fin damage observed in
culture facilities. "Mouthfighting", a behaviour novel in
juvenile trout, is reported.
TABLE OF CONTENTS
............................................... Abstract iii
......................................... ~ i s t of Tables vii
~ i s t of Figures ....................................... viii . Acknowledgements ........................................ xi
I . INTRODUCTION ...................................... 1
I1 . PEN OBSERVATIONS ................................ 12
I11 . RELATIVE GROWTH RATES OF ISOLATED AND GROUPED ................. FISH FED AT DIFFERENT INTERVALS 17
INTRODUCTION .................................... 17
......................................... METHODS 19
......................................... RESULTS 27
. DISCUSSION ...................................... 36
IV . THE RELATIVE GROWTH OF DOMINANT AND SUBORDINATE FISH ON EQUAL RATIONS ........................... 47
INTRODUCTION .................................... 47
METHODS ......................................... 49
......................................... RESULTS 51
DISCUSSION ...................................... 5 3
V . THE EFFECT OF FEEDING FREQUENCY ON AGGRESSIVE BEHAVIOUR ....................................... 62
.................................... INTRODUCTION 62
......................................... METHODS 66
RESULTS ......................................... 69
DISCUSSION ...................................... 93
VI . PATTERNS OF AGGRESSIVE ATTACK IN JUVENILE STEELHEAD ...................................... 101

INTRODUCTION .................................... 101 METHODS ........................................ 103
RESULTS ......................................... 105 DISCUSSION ..................................... 1 1 1
VII . HIERARCHY STABILITY AND ANTICIPATORY ..................................... AGGRESSION 116
................................... INTRODUCTION 116
METHODS ........................................ 117 RESULTS ........................................ 119 DISCUSSION ..................................... 124
VIII . TESTS OF FEEDING REGIMES IN HATCHERY ..................................... FACILITIES 128
INTRODUCTION ................................... 128 METHODS ........................................ 131 RESULTS ........................................ 134 DISCUSSION ..................................... 141
IX . CONCLUSIONS .................................... 147 Literature Cited ....................................... 156

LIST OF TABLES
TABLE PAGE
1 SOURCE AND USE OF EXPERIMENTAL FISH ............. 20
2 ORDER OF PRESENTATION OF FEEDING REGIMES ........ 25
3 FOOD AVAILABILITY . . . . . . . . . . . . . . . . . . . . . . . . . . .e . . . 2 6
4 GROWTH INCREMENTS OF PAIRED JUVENILE STEELHEAD ................................... 52
.5 GROWTH RATES AND FINAL PERCENT DRY WEIGHTS OF PAIRED JUVENILE STEELHEAD ................... 54
6 AGGRESSIVE AND GENERAL ACTIVITY OF PAIRED JUVENILE STEELHEAD .......................... 55
7 INCREASES IN AGGRESSION FOLLOWING FEEDING ....... 92 8 GROWTH INCREMENTS AND HIERARCHY POSITION OF
JUVENILE STEELHEAD ......................... 122
v i i

7
F I GURE
LIST OF FIGURES
PAGE
FACTORS INFLUENCING GROWTH VARIATION ............ 10
SEQUENTIAL AVERAGE WET WEIGHTS OF ISOLATED JUVENILE STEELHEAD TROUT .................... 28
GROWTH OF GROUPED JUVENILE STEELHEAD TROUT ...... 30
SEQUENTIAL COEFFICIENTS OF VARIATION OF ISOLATED JUVENILE STEELHEAD ................. 31
CHANGE IN COEFFICIENTS OF VARIATION OF GROUPED JUVENILE STEELHEAD .................. 32
CHANGE IN SI ZE VARIATION RELATIVE TO GROWTH IN JUVENILE STEELHEAD ....................... 34
MORTALITY IN GROUPS OF JUVENILE STEELHEAD ....... 35
FIN DAMAGE OF PAIRED JUVENILE STEELHEAD ......... 56
FREQUENCY OF AGGRESSIVE ACTS OF GROUPED JUVENILE STEELHEAD UNDER VARIOUS FEEDING REGIMES ..................................... 71
PEW CENT TIME ENGAGED IN AGGRESSION SY GROUPED JUVENILE STEELHEAD UNDER VARIOUS FEEDING REGIMES ............................. 72
/
FREQUENCY OF NIPS IN GROUPED JWENILE STEELHEAD ................................... 73
FREQUENCY OF CHARGES IN GROUPED JWENILE STEELHEAD ................................... 74
FREQUENCY OF CHASES IN GROUPED JUVENILE STEELHEAD ................................... 75
FREQUENCY OF APPROACHES IN GROUPED JUVENILE STEELHEAD ................................... 76
NUMBER OF AGGRESSORS IN GROUPS OF STEELHEAD ..... 77
TIME COURSE OF AGGRESSION AT ONE FEEDING/DAY (A.M.) ...................................... 79
TIME COURSE OF AGGRESSION AT ONE FEEDING/DAY (P.M.) ...................................... 80
viii

TIME COURSE OF AGGRESSION AT ONE FEEDING/DAY (A.M). GROWTH TRIAL 2 ....................... 81
... TIME COURSE OF AGGRESSION AT TWO FEEDINGS/DAY 82
TIME COURSE OF AGGRESSION AT TWO ................ FEEDING~/DAY. GROWTH TRIAL 3 83
TIME COURSE OF AGGRESSION AT FOUR ................................ FEEDINGS/DAY 84
TIME COURSE OF AGGRESSION AT SEVEN FEEDINGS/DAY ................................ 85
TIME COURSE OF AGGRESSION AT SEVEN ................ FEEDINGS/DAY. GROWTH TRIAL 4 86
.... TIME COURSE OF AGGRESSION AT 14 FEEDINGS/DAY 87
.... TIME COURSE OF AGGRESSION AT 25 FEEDINGS/DAY 88
TIME COURSE OF AGGRESSION AT 25 FEEDINGS ........................ /DAY. GROWTH TRIAL 5 89
... TIME COURSE OF AGGRESSION WITH RANDOM FEEDING 90
TIME COURSE OF AGGRESSION AT 24 FEEDINGS/DAY . (1/HR) ...................................... 91
CHANGE IN AGGRESSION FOLLOWING FEEDING UNDER ..................... VARIOUS FEEDING REGIMES 9 4
... THE DISTRIBUTION OF RECIPROCAL AIMS AND NIPS 106
THE DISTRIBUTION OF NON-RECIPROCAL AIMS AND NIPS ....................................... 107
......................... PATTERNS OF FIN DAMAGE 108
........... MOUTH FIGHTING IN JUVENILE STEELHEAD 110
.......... RANKS OF JUVENILE STEELHEAD OVER TIME 120
TIME COURSE OF AGGRESSION IN FED AND UNFED ......................... JUVENILE STEELHEAD 123
................ WEIGHTS OF PEN REARED STEELHEAD 135
COEFFICIENTS OF VARIATION IN PEN REARED ......................... JUVENILE STEELHEAD 136
..... DORSAL FIN HEIGHTS IN PEN REARED STEELHEAD 138

39 WEIGHTS OF HATCHERY REARED STEELHEAD ........... 139 40 COEFFICIENTS OF VARIATION OF HATCHERY REARED
STEELHEAD .................................. 140 4 1 FIN HEIGHT OF HATCHERY REARED STEELHEAD ........ 142 42 PROJECTED SIZE DISTRIBUTIONS OF HATCHERY
REARED STEELHEAD ........................... 145 43 THE EFFECT OF DIFFERENT SIZE THRESHOLDS ON
SMOLT PRODUCTION ........................... 153

ACKNOWLEDGEMENTS
I would like to thank Dr. Larry Dill for his equally
rigorous attention to both general principles and detail,
his critical support and friendship over the last five
years. My committee members, Dr G.H. Geen and P.A. Slaney
provided useful advice, and Dr. R.M. Peterman commented on
the initial stages of the study. Drs. R.L. Dunbrack and
R.C. Orr discussed this project and its place in the
universe at great length and assisted with several facets.
All laboratory work was totally dependant upon the
expertise of Rich Hotson and especially Alex Fraser. Dr.
Des Mahon provided advice on the physiology of stress and
means of avoiding it. M.J. Abbott assisted with many phases
of the study.
I wish to thank all the Diiierians, present and past
for our discussions and their support: Drs. Louis Giguere
and Ron Ydenberg, Kate Puckett, Wayne Donnelly, Mark "H."
Abrahams, Peter Nonacs, Guy Martel, Ralf Carter, Rae Suttie
and P.E Bradshaw. '
This study would not have been possible without the
friendly and expert assistance of the B.C. Fish and
Wildlife Branch staff: Dr. Art Tautz, P.A. Slaney, Graeme
Lennie, Bob Land, Larry Mitchell, Bob Hooton, Lew Carswell,
and Bill Harrower.
~inancial support was provided a ~ritish Columbia
Government Research Engineering and Technology Award in

collaboration with the B.C. Fish and Wildlife Branch, a
Simon Fraser University Graduate Student Fellowship and a
President's Stipend. The S.F.U. Faculty of Science
Electronics and Machine Shops constructed the fish feeder
used in Chapter 111.
xii
I. INTRODUCTION
The survival and growth of stream-dwelling salmonids
is largely density dependent due to the effects of
territoriality and aggression (Chapman 1966, McFadden
1969). Young salmonids use aggressive displays and attacks
to obtain a feeding territory, or a share of a food supply
through membership in a hierarchy. Continued stream
residence may be dependent upon success' in behavioural
interaction and failure may result in decreased feeding and
growth opportunities, and increased physical damage and
exposure to predators (Chapman 1966). This intraspecific
competition is also of concern to the science of fish
culture. Juvenile steelhead (anadromous rainbow trout,
Salmo gairdneri) and other salmonids are cultured to smolt /
stage in high density tanks, ponds, raceways and net-pens
to supply food and sport fishing demands for returning
adults. It has been suggested that the problems of growth
depensation', physical damage, stress and disease may be
caused by aggressive behaviour (Chapman 1962, Yamagishi
1962, Fenderson and Carpenter 1971, Slaney and Harrower
1981) and may result in reduced production or in decreased
post-release survival of hatchery raised fish. Thus, an ------------------ 'the increase in variance of a size-frequency distribution with time due to differences in growth rates (Magnuson 1962)
understanding of the nature and determinants of aggression
is important to the management of both wild and hatchery
populations.
Aggression in animals is an adaptive behaviour which
may be considered to have 3 major ends:
- I . acquisition of object resources (food, nest material,
shells, hosts) (Chapman 1966),
2. acquisition of other organisms for reproduction
(mates), or labour (slaves) (~awkins 1 9 8 2 ) ~
3 . avoidance of predation by ensuring access to refugia
arid escape routes, or by spacing (e.g. Donnelly and
Dill 1984).
Alternatively, none of these items may be directly
contested, but the space which contains them may be. If
space or some requisite contained in that space, such as
food or cover, is a limiting factor, competition may be
operating. Ritualized displays may replace direct conflict
for the area containing a resource (Chapman 1 9 6 6 ) ~ or
position in a hierarchy may be contested (~arnard and Burk
1979). Thus, territorial or hierarchical aggression is an
intermediary economical convention preventing the
uneconomical contest of every food item regardless of

location.
Although cooperative behaviours such as schooling and
fright-huddling (Mason and Chapman 1965) are part of the
behavioural repertoire of juvenile salmonids, most social
interaction consists of agonistic, dominance-subordinance
relations (~oakes 1978). Rank is defined by the outcome of
- conflicts for space or a share of space. ~erritoriality is
defined here as strictly site-dependent dominance;
hierarchies as site-independent interactions. These
definitions are not exclusive and intermediate social
systems exist, such as partial territoriality, where a fish
defends a territory only against fish lower in the
hierarchy (~oakes 1978). Since territory is maintained,
delineated, and identified by the occurrence of aggression,
the level of aggression has been used as a measure of the
strength of territoriality o ill et al. 1981, McNicol and
Noakes 1984). However, because hierarchies are considered
to be a strong social mechanism for the reduction of
aggression (~arnard and Burk 19791, strength of the
hierarchy may not be reflected in overt aggression. The
theory of behavioural options and strategy in hierarchies
has not been elaborated to the degree that it has for
territorial systems.
The major factors governing the degree of
territoriality or hierarchy that develops appear to be
water current, density and size distribution of the fish.

observation of wild salmonids shows that territorial
systems tend to occur in riffles among fish of uniform
size. At a critical upper density, however, some
territories collapse and former territory holders live as
subordinates on or between other territories or are ejected
from the system (~alleberg 1958, Symons 1971, Slaney and
Northcote 1974). This may indicate the existence of a
minimum critical territory size. In pools, confined spaces
(e.g. aquaria), and among populations of different-aged
fish, hierarchies, despotism and partial territories occur
(~ewman 1956, Hartman 1965, Jenkins 1969).
The relationship of aggression and territoriality to
feeding in juvenile salmonids has been recognized and
investigated by a number of authors (e.g, Newman 1956,
Keenleyside and Yamamoto 1962, Mason and Chapman 1965,
Symons 1968, 1971, Slaney and Northcote 1974, Dill 1978a,
Dill et al. 1981, McNicol and Noakes 1 9 8 4 ) ~ but equivocal
results have been obtained. For example, some workers
(~ewman 1956, Kalleberg 1958, Keenleyside and Yamamoto
1962, McNicol and Noakes 1984) found increases in
aggression after feeding while others (e.g. Symons 1968)
found an overall decrease in aggression after feeding.
While the effect of ration has been investigated, the
timing of food presentation and the key question of how
fish assess their trophic environment have not been
considered.

Of the three causes of territoriality listed, juvenile
anadromous salmonids are mainly affected by numbers one and
three. The main function of stream rearing in the life
history is growth and survival to an appropriate size and
time for smelting. Acquiring territory or rank has been
demonstrated to be strongly associated with survival, and
- an individual's feeding success and growth is closely
related to its ability to hold a territory. Atlantic salmon
(Salmo salar) that do not hold a territory are attacked by
territory holders if they attempt to feed or hold against
the current (Kalleberg 1958). Brown trout (Salmo trutta)
that could not maintain territories and were artificially
prevented from emigrating lost weight and starved ( ~ e Cren
1965). Chapman (1962) and Mason and Chapman (1965) have
demonstrated that early downstream emigration in juvenile
coho (Oncorhynchus kisutch) is a result of failure to
acquire space through aggressive interactions. Although the
fate of these migrants is unknown it does not appear that
any return to the parent stream as adults. All returning
adult steelhead trout and coho salmon appear to have spent
at least one full year in freshwater, as indicated by scale
readings (~aher and Larkin 1955, Chapman 1958, Bilton
1978). Thus, early migrants may have a limited chance of
. contributing to the next generation's gene pool
In hierarchies the amount of food eaten and growth
rate are closely related to position in the dominance
order. Salmonids that hold low ranks exhibit less growth,
higher mortality and more fin damage than higher ranking
fish (~rown 1946, Yamagishi 1962). Growth depensation is
generally attributed to differential food intake due to
aggressive competition (~agnuson 1962, Yamagishi 1962) and
indeed in cultured populations is taken as symptomatic of
the occurrence of aggression (Jobling 1985). In addition,
indices of stress, including plasma cortisol concentration,
interrenal nuclear diameter and tailbeat frequency, are
more evident in subordinates in small laboratory
populations of coho parr (~jike and Schreck 1980).
~erritory holders and dominants may suffer less
predation. A refuge and use of habitual escape routes were
observed to be significant features of wild salmonid
territories (Newman 1956, Jenkins 1969, Bachman 1984).
~tlantic salmon parr that had established territories were
less susceptible to brook charr (Salvelinus fontinalis)
predation than parr which had not established territories
(Symons 1974).
The economic defendability theory (~rown 1964) states
that a territory should only be defended when the energetic
gains of territory ownership exceed the costs. This simple
statement is the basis of later, more elegant models
describing and predicting when territories should be held
and what size they should be. That animals are capable of
adjusting territory size in response to changes in food
availability and costs of defense is a fundamental concept
of modern territory theory (Dill 1978b, Ebersole 1980,
Hixon 1980, Schoener 1983). These authors have expanded
upon Brown's (1964) concept of economic defendability by
explicitly considering factors that influence territory
size such as body size, food density, competitor density
and travel costs. Hixon (1980) notes the different
territorial requirements of energy maximizers and time
minimizers and predicts that given an increased food
abundance an energy maximizer will contract its territory.
Dill (1978b) and McNicol and Noakes (1984) consider
juvenile coho salmon and brook charr, respectively, to be
energy maximizers. Juvenile rainbow trout and coho salmon
conformed to Hixon's prediction through decreased
aggression with increased food availability (Slaney and
Northcote 1974, Dill et al. 1981); however, these are the
only studies that showed complementary responses of reduced
territory size and decreased aggression. Other studies
leave confusion as to mechanism and the possibility of
alternative effects. To be capable of adjusting territory
size in response to changes in food density, animals must
be able to evaluate the status of their food supply.
Because juvenile salmonids rely largely on drift, and
hence, on allocthonous food sources (terrestrial or
upstream production) it is unlikely that they are able to
directly assess the production rate or standing crop of

their food supply. It is more likely that past feeding
history or present feeding status cue the behavioural
decisions of salmonids.
Conflicting results in studies of salmonid feeding and
aggression appear to stem from different measures of
aggression, feeding schedules, and densities. The effects
of competitors on growth, and whether through food
monopolization or other mechanisms have not been
determined. How aggressive damage occurs, and the risks and
costs of aggression, have not been determined either.
Research and hatchery feeding schedules and intruder
pressure are typically very different from those found in
nature. Other factors that affect energy budgets and
aggression, competitor density and predator occurrence are *
also altered. The ability to monitor food supply is a
requirement for optimal behaviour in a variable environment
(~rebs 1978) . Thus, timing of feeding may affect the
perception of environmental quality, and hence, aggression.
Steelhead trout are an important sport fish having
economic and aesthetic value. Due to heavy fishing pressure
and declining habitat they are cultured in hatcheries and,
more recently, in floating lake pens (S.E.P. Annual Report
1979) . Phenomena such as growth depensation, fin damage,
disease and general stress which may interfere with
production are likely to be aggression related (Slaney and
Harrower 1981) . In culture facilities the discrepancies in

growth rates arising from social behaviour result in high
growth depensation requiring labour-intensive grading
(Bardach et al. 1972, Gunnes 1976 ) . Almost no behavioural
investigations have been performed on net-pen stocks of
salmonids, yet there are potential benefits to be gained
from an understanding of aggression and its effects.
/
Goals:
The purpose of this study was to investigate aspects
of juvenile steelhead growth in relation to social
behaviour and food availability. Figure 1 displays a
conceptual model describing possible factors that could
influence growth variation.
Specifically t h e goals were:
1 . to confirm that aggressive behaviour occurs in pen-held
populations of juvenile steelhead (~hapt. 11);
2. to determine if the presence of conspecifics is a major
cause of growth depensation (Chapt. 111);
3 . to determine if reasons other than inequitable
distribution of food are responsible for growth
depensation (Chapt. IV);

Chapt v i _ PHYSICAL DAMAGE - 7-
AND REPAIR
s
EFFICIENCY FOOD INTAK'E A
A ; 7
I I
-- AGGRESSION
Chapt v &vi i
I
PERCEPTION OF TROPHIC STATUS
PRESENCE OF COMPETITORS *
FOOD AVAILABILITY 1
Figure 1 . A conceptual model illustrating some factors causing growth variability in fishes.
GENETIC &
DEVELOPMENTAL
DIFFERENCES
of the

4. to determine if different distributions of food over
time produce changes in aggression and corresponding
changes in growth'depensation (Chapts. I11 and V);
5. to determine the relationship between observed attack
patterns and observed fin damage (Chapt.VI);
6. to determine if juvenile steelhead are capable of
learning feeding times and if they exhibit anticipatory
aggression (Chapt. VII); and finally
7. to test a variety of feeding regimes in net-pen and
hatchery populations in an attempt to reduce growth
depensation and fin damage without a loss in growth
rate (Chapt. VIII).

I I . PEN OBSERVATIONS.
Methods
To gain a perspective of fish activity in floating
* net-pens and to verify the occurrence of aggression,
underwater observations were made in rearing pens at a B.C.
Fish and wildlife Branch facility at Cowichan Lake,
Vancouver Island. Initially I hoped to analyse the data
quantitatively, but a review of the material indicated that
the number of confounding factors (season, water
temperature, fish. size, age and density, dive time and
feeding regime) and the infrequency of behavioural acts,
rendered analysis meaningless. Therefore, only qualitative
descriptions and ranges are presented.
Observations were in four pens (3.66 m X 3.66 m X 3.66
m) suspended within a floating dock, covered with wire mesh
lids and surrounded underwater by a wire mesh predator
screen. Between Oct 28, 1980 and Dec 3, 1981, the site was
visited 5 times with 4-6, 20-40 min dives taking place on
each trip. Fish size ranged from 7 to 58 g, water
temperature from 5 to 18 C, density from 2200 to 4000 per
- pen (44 to 80/m3) and feeding interval from 20 min to 2
hours, with supplemental hand feeding during some dives.

Observations were made with SCUBA apparatus. A rope
sling supported the observer at a depth of 2 m without
bouyancy concerns. Because systematic observation and
recording was made difficult by the numbers and speed of
the fish, a reference point (clear plexiglass with a blue
circle) was suspended in the center of the pen with
monofilament. The first five min of each dive was spent
waiting for the disturbance to subside. Thereafter focal
animals (Altmann 1974) were selected by choosing the fish
nearest to a reference point (the disk or a corner of the
pen) and following it as long as possible. Records were
kept on a plexiglass slate with a grease pencil and time
intervals were signalled to the observer by an assistant
pulling on the support ropes every 2 min.
Observations:
Upon the diver's entry, juvenile steelhead exhibited a
fright response, dashing about and crowding on the far,
lower side of the pen. At this time especially the diver's
exhalations had an effect on the fish as they moved towards
and away from the diver in synchrony. In some cases it took
over 10 min for the fish to recover. The typical pattern of
fish distribution was characterized by having most of the
fish milling in the upper central region of the pen. No
characteristic clock-wise or counter clock-wise swimming

was seen. Most fish swam horizontally and following initial
disturbance came within 60 cm of the observer. Fish in the
lower central area appeared to be the largest fish in the
pen.
Fish were sparsely distributed around the perimeter of
the pen. These fish were mainly stationary and appeared to
be defending a territory. One fish recognisable by a scar
acted as if it were defending the diver's mask as reference
point for a territory on two successive dives. This
suggests that fish were only able to establish a territory
with a spatial reference point and low intruder pressure,
as observed in streams (~enkins 1969) . Conventional
aggressive acts such as displays, charges, and chases
(Mason and Chapman 1965) by territorial fish were observed,
but no nips were seen in this context, apparently because
intruders responded by fleeing.
Fish in the central area of the pen were densely
packed (approximately 2-3 body lengths separation or less)
and swam at relatively high speed. This inter-fish distance
seemed constant regardless of the absolute numbers and size
of fish. In contrast, the amount of open space about the
periphery of the pen varied.
The following behaviours were observed in the
centrally grouped fish:
1. Parallel swim: two fish would swim next to each other

(3-6 cm apart) at high speed for a distance of 1-2 m;
2. Chases: one fish would swim closely and rapidly behind
another, possibly attempting to nip its tail;
3. Charges: a high speed approach directed at another
fish;
4. Bites: one fish would charge towards another generally
from above and nip at the dorsum, usually at the dorsal
fin;
5. Fights: a series of return nips between two fish.
In addition, fish sometimes swam stiffly, with exaggerated
body motion and fins extended. Bites were normally made
downwards after a charge of 2-3 body lengths. Several such
vertical charge-bite sequences may occur in rapid
succession. Fish that gave and received nips were often
observed to turn sharply and rapidly downwards producing a
visible flash.
Eroded dorsal fins were clearly visible both
underwater and from above the surface. Fish in pens with
relatively little fin damage were inconspicuous when
observed from above the surface. In contrast damaged dorsal
fins were visible from above as white lines. During feeding

most fish swarmed towards the source to feed but the larger
fish at the bottom remained there where food appeared to
reach them. ~ctivity and biting appeared to increase after
feeding. Within a dive the number of acts recorded per 2
min observation period generally doubled for approximately
5 min following feeding.
Activity changed with season. Fish in winter were
distributed deeper and were more wary. Aggressive acts were
most frequent in late summer ( X = 1 0 acts/2 min) and were
negligible in January ( ? = I .8 acts/2 min). These changes may
have been related to changes in water temperature,
photoperiod, fish size or density.
These dives established that aggression does occur in
floating pens, and that nips occur and are directed towards
the dorsal fin, which is the primary site of fin damage in
hatchery steelhead. Few fish were conventionally
territorial, probably because of spatial uniformity and
high intruder numbers, but aggression occurred during all
months. Flashing observed from above the surface may be
evidence of aggressive activity but could be related to
zooplankton feeding. Some relationship between feeding and
aggressive activity appears to exist. However, the
effectiveness of SCUBA observation was limited by the
amount of time available due to air supply and temperature
considerations, disturbance of fish, and the difficulty of
observing large numbers of fish at this density.

111. RELATIVE GROWTH, RATES OF ISOLATED AND GROUPED FISH FED
AT DIFFERENT INTERVALS
INTRODUCTION
The occurrence of growth depensation in freshwater fish
populations has been observed among wild juvenile coho
salmon (Chapman 1962, Mason 19761, rainbow trout arki in et
al. 1950) and largemouth bass, Micropterus salmoides
(Shelton et al. 1979) and is common in hierarchies of
laboratory fish and in hatcheries (Jobling and Wandsvik
1983). In nature, and artificial propagation facil'ities,
growth depensation may result in significant losses of
production due to cannibalism or failure to achieve a
threshhold size for survival (i.e. "smolt size") and in the
case of hatcheries, in time costs of grading fish. Growth
depensation may arise from genetic variability and/or early
developmental differences, or from social causes such as
food monopolization by dominants, differential energy
expenditures, or social stress resulting from aggression.
Although high relative growth rates are exhibited by
behavioural dominants (~rown 1946, Yamagishi 1962, Li and
Brocksen 19771, the role and mechanism of different social
effects has not been determined.

Before considering social causes of growth depensation
some estimate of the genetic/early development component
should be obtained. Although growth depensation is commonly
ascribed to social interaction, the critical comparison of
the growth of individual fish, isolated from social
effects, with the growth of grouped fish has rarely been
made, and then only with small sample sizes.
In this study the growth variability of grouped
juvenile steelhead (assumed to represent the summed effects
of genetic, developmental and social factors) was compared
to the growth variability of a sample of isolated control
fish (assumed to be caused only by genetic and/or
developmental factors). If social interaction is a
significant cause of growth depensation, growth rates of
grouped fish should be more variable than those of isolated
controls.
In a second phase of this experiment, growth and
behavioural observations were made of grouped fish fed
equal daily rations, that were distributed differently over
time. This was done to determine the relationships between
food availability, aggression and growth. The growth of
these groups is considered in the present chapter and their
behaviour in Chapter V. Social interaction has been
considered to cause growth depensation by several authors
(~agnuson 1962, Yamagishi 1962, Jobling 1985), and several
studies have shown that food availablity affects aggression
and territorial defence (reviewed in Dill 1978b). This
chapter examines the effect of the temporal pattern of food
availability, as measured by inter-feed time interval, on
growth and growth variation. A range of regular feeding
intervals within a 14-h photoperiod was examined. In
addition a random feeding schedule, and one over a 24-h
period were presented.
Due to the practical application of growth knowledge
in stream and hatchery management, growth rates were
considered in conjunction with growth variability. An
optimal feeding regime would produce low growth depensation
and a high growth rate.
~uvenile steelhead trout (early winter-run Englishman River
stock) were obtained from the Fraser Valley Trout Hatchery
in 1981 and from the Big Qualicum Hatchery in 1982. All
experiments were carried out at Simon Fraser University.
Due to limited aquarium space it was not possible to run
all trials simultaneously. As a compromise, I attempted to
obtain fish as close to the initiation of feeding as
possible, but due to brood timing this was not always the
case. Table 1 gives the size and approximate age of fish .
used. The groups of steelhead usually hatched over a 7 day

TABLE 1. SOURCE AND USE OF EXPERIMENTAL FISH. ALL FISH WERE WINTER-RUN ENGLISHMAN R. STEELHEAD.
GROUP DATE OBTAINED USE APPROX. AGE AVG. SIZE (g) T(C)
1 May 29,1981 ISOLATED FEEDING .I814 8.0 CONTROL + 5 DAYS # 1
2 June 23 " GROWTH FEEDING .2082 8.0 TRIAL#1 + 24 DAYS
3 July 29 " GROWTH FEEDING .4279 9.0 TRIAL#2 + 53 DAYS
4 Aug 9 " GROWTH FEEDING 1.279 10.0 TRIAL#3 + 123 DAYS
5 June 1,1982 ISOLATED FEEDING .I422 9.0 CONTROL + 5 DAYS $2
6 July 3 " GROWTH FEEDING .2344 8.0 TRIAL#4 + 20 DAYS
7 July 27 " GROWTH FEED1 NG .2178 9.0 TRIAL#5 + 10 DAYS

period.
Fish were initially held in 136-1, flow-through,
aquaria until it was ascertained that they would feed, and
then starved for two days prior to weighing and sorting.
Water temperature throughout all experiments ranged from 8
to 1 1 C. A 14-h photoperiod (95 lx at the water surface)
was used in all growth experiments; otherwise a natural
photoperiod was generally maintained.
Fish were anaesthetized with methanesulfonate, and
weighed to the nearest 0.1 mg on a Sartorius electronic
balance after excess water had been removed with absorbant
paper. Length was measured to the nearest 0.5 mm. After
weighing, each fish was allowed to recover in an isolated
vessel.
Experiments were conducted in 2 banks of 5, 45.5-1,
flow-through aquaria for growth trials 1 and 2 and isolated
contra 1 ; a third bank of tanks was added for growth
trials 3, 4 and 5, and isolated controls 2 and 3. Each tank
had an exclusive dechlorinated water supply and an
adjustable volume feeder (described by O'Keefe et
a1.(1979)). Each bank of 5 feeders was powered by a 1/15-hp
electric motor. The feeders were controlled by a three
channel timer capable of independently activating the drive
motors at intervals from 1 to 999 min in 1-min increments.
The feeders could be also be activated at random intervals
read from an internal list of 3000 numbers between 1 and 60

min. Thus each bank of 5 aquaria could be fed independently
of the other 2, and each tank could be fed an independent
ration size. Overhead lighting, which was necessary for
videotaping was provided by 3, 75-watt incandescent
floodlight bulbs per bank of tanks (2250 lx at the water
surface).
Isolated controls:
Three controls were conducted in which fish were
socially isolated by black polyethylene on the back and
sides of the aquaria. Ten similar sized fish were selected
for isolated control 1 , and 15 for controls 2 and 3. Fish
mortalities in control 2 (5 fish) were replaced. Losses in
c o n t r o l i and 3 ii fish each) were not replaced. Tanks were
partitioned to allow equal swimming volume per length of
fish (22.75 1 for fish to 35 mm, 5.68 1 for each additional
5mm length increment to 55 mm). "Silvercup" feed in the
appropriate size was provided - ad libitum. his was
operationally defined as a condition in which food was
constantly available floating on the surface. Tank bottoms
were siphoned to remove debris every two days.
In controls 1 and 2 the fish were weighed at the
beginning and conclusion of the trial. In trial 3 fish were
weighed at two or three day intervals to determine the '
shape of the growth curve. Initially they were weighed by

he method outlined above, but after three weig hings a
technique that did not entail repeated anaesthetization was
adopted. Fish were captured in a dip net, excess water was
shaken off, and the fish placed in a pre-weighed vessel of
water. The vessel was covered to control evaporation.
Vessel and water weight were subtracted from the total
weight to give fish weight. Final weights in all trials
were obtained after two days of starvation to avoid
weighing food remains in the guts. Fish were then
sacrificed and dry weights obtained after oven drying for 3
days at 40 C.
Grouped growth trial:
Large groups sf fish ( i i 5 6 ) were starved 2 days,
anaesthetised, and weighed individually. Following
weighing, fish were sorted into groups of 8, on the basis
of similar weight. Cold branding (~verest and Edmondson
1967) was attempted to allow individual recognition but was
unsuccessful as the fish were generally too small to
withstand the technique. Groups were installed in the
45.5-1 aquaria previously described. Tanks were partitioned
to provide a constant volume of water per unit of fish
length as described for single fish. Some of the larger
fish in growth trial 3 exceeded this requirement ( 3 tanks).
Screens of 5 mm mesh were placed in each tank 1.5 mm above
the bottom. This allowed food and feces to pass through and
limited the period of availability of food to slightly more
than the time the ration would float, similar to a
pen-rearing situation. The tank ration was 10% of wet fish
weight per day ("Silvercup" feed in an appropriate size).
Food presentation schedules and the order in which the
- trials were run are given in Table 2. Food availability
(time which food floated) for each feeding regime was
approximately equal (Table 3 ) . Fish in growth trial 5 did
not feed well, and results from one tank in each feeding
regime were excluded due to high mortality.
After 5 days of feeding fish were starved for two
days. Wet weight, length, and dry weight were measured as
previously described. Fish that died during this final
starvation period were weighed as discovered.
Growth analysis
Instantaneous growth was treated as behaving as a
power of wet weight (w)
where K and x are constants (~arker and Larkin 1959) and
was calculated as
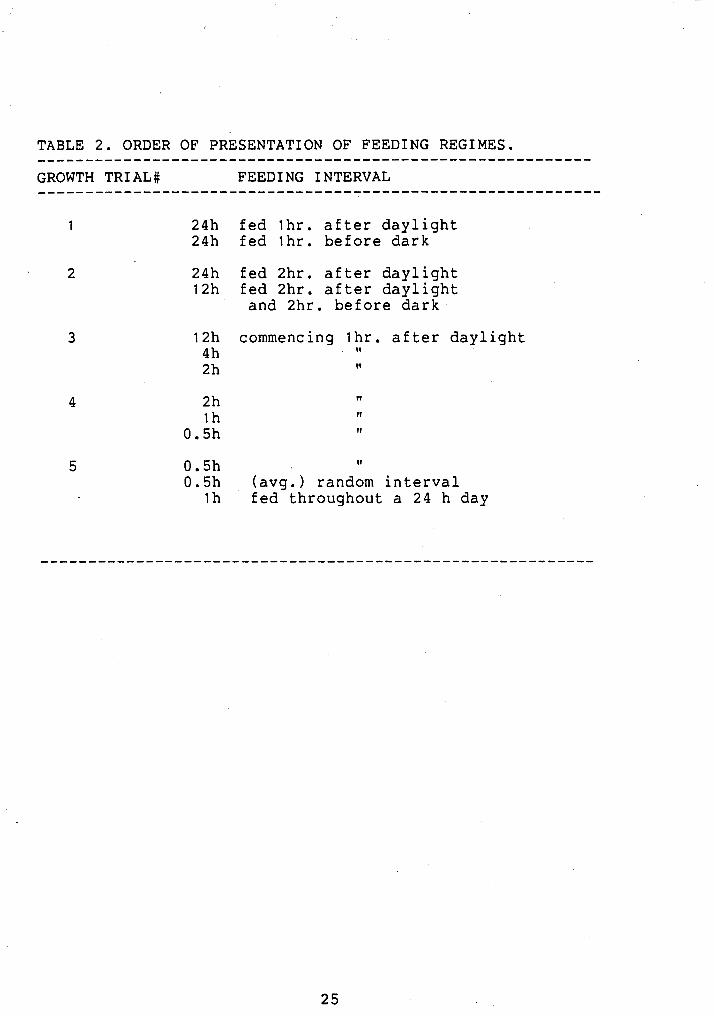
TABLE 2. ORDER OF PRESENTATION OF FEEDING REGIMES. .......................................................... GROWTH TRIAL# FEEDING INTERVAL
fed Ihr. after daylight fed lhr. before dark
fed 2hr. after daylight fed 2hr. after daylight and 2hr. before dark
commencing Ihr. after daylight I1
II
(avg.) random interval fed throughout a 24 h day

TABLE 3. FOOD AVAILABILITY-THE APPROXIMATE TIME THAT FOOD FLOATED IN EACH FEEDING REGIME ..........................................................
FEEDING INTERVAL TIME FLOAT~ NG/FEED TOTAL/DAY
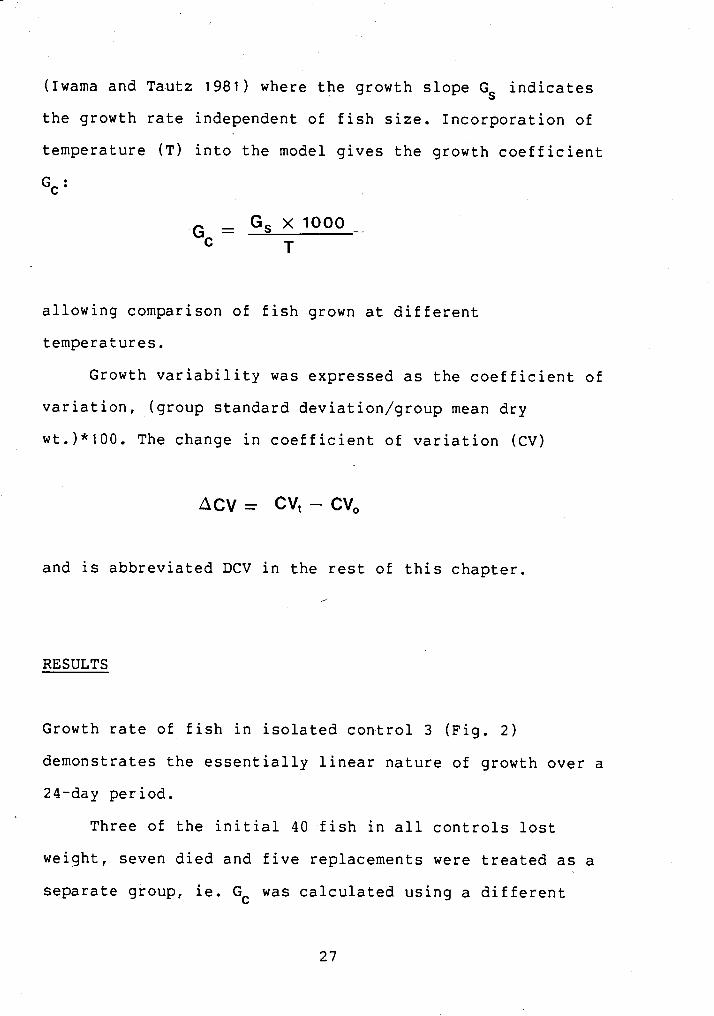
(~wama and Tautz 1981) where the growth slope GS indicates
the growth rate independent of fish size. Incorporation of
temperature (T) into the model gives the growth coefficient
allowing comparison of fish grown at different
temperatures.
Growth variability was expressed as the coefficient of
variation, (group standard deviation/group mean dry
wt.)*100. The change in coefficient of variation (CV)
Acv = cv, - cv,
and is abbreviated DCV in the rest of this chapter.
2
RESULTS
Growth rate of fish in isolated control 3 (Fig. 2)
demonstrates the essentially linear nature of growth over a
24-day period.
Three of the initial 40 fish in all controls lost
weight, seven died and five replacements were treated as a
separate group, ie. Gc was calculated using a different

TIME (days)
Figure 2. Sequential average wet weights of 14 isolated juvenile steelhead trout (isolated control 3 ) .
value of t. Some isolates did not feed at all and did not
appear to have learned to feed upon hatchery food. The
average growth coefficient of single fish in all controls
was 0.877, comparable to the fastest growth recorded in the
grouped fish treatments (Fig. 3). The average growth
coefficient of grouped fish was 0.347, significantly lower
- than from that of single fish (ANOVA, p<.001); Gc for
single tanks ranged from 0.1396 to 0.92. Grouped fish
exhibited a clear trend of higher growth rates at higher
feeding frequencies except at the 0.5-h interval (Fig. 3);
the feeding interval effect was significant (ANOVA,P<.OO~).
All regimes in growth trial 5 showed low growth rates in
comparison with regularly fed fish (Fig. 3).
The DCV/ 5 days of isolated controls (2.46%) was
significantly less than that of grouped fish (8.02%)
(F-test of squared coefficients of variation, p<.01,
Lewontin 1966). Figure 4 shows the small change of the
coefficient of variation over 24 days in isolated control
3. This was the oldest group of isolates and they appeared
most adapted to feeding. There was no effect of feeding
regime on DCV/~ days (Friedman's test, p>.05) in grouped
fish and no trend is obvious (Fig. 5).
The combination of a significant effect of feeding
. interval on growth rate and equivalence of DCV/ 5 days
suggests that, for any growth increment, feeding regimes
producing the fastest growth also produce the least growth
TRIAL 4
h.
FEEDING INTERVAL Figure 3. Average growth coefficient ( G c ) of groups of
. eight juvenile steelhead trout under various feedina regimes. N (number of tanks) for each interval bracceted: 24h(15), 12h(10), 4h(5), 2h(10), lh(5), 0.5h(9), random(41, lh~24(4). vertical lines represent standard errors. The, open part of the bar at 0.5 h represents the value for trial 4 alone.

10 15
TIME (days)
Figure 4. Sequential co-efficients of variation of 14 isolated juvenile steelhead trout (isolated control 3 ) . , ,

TRIAL 4.. r
FEEDING INTERVAL Figure 5. Average change in co-efficient of variation in groups of eight juvenile steelhead trout over 5 days. st as in Figure 3.

divergence. To demonstrate this the ratio DCV/~G, I was
plotted against feeding interval ( ~ i g , 6). There is a
marked, but insignificant trend (~riedmans test, p>.05) of
decreasing relative variation with shortened feeding
interval. Thus, although fish size did not diverge from the
mean differently over time, weights of fish fed more
frequently tended to diverge less relative to growth. In
other words the growth of frequently fed fish was less
variable than infrequently fed fish if compared over any
equal size increment. The DCV/IGcl ratios of groups in
growth trial 5 were high relative to those of the regular
regimes.
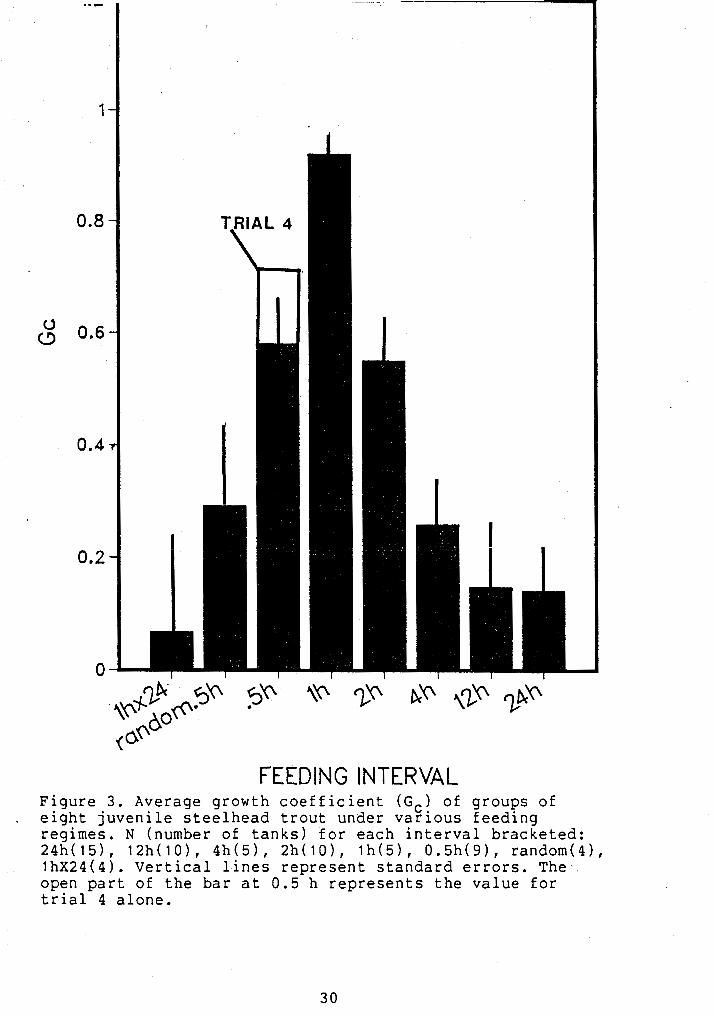
Mortality was generally low in all feeding regimes
except in growth trial 5 where 20% d.ied during the feeding
phase, and several more died during the 2-day starvation
phase of the experiment (Fig. 7 ) . Within a feeding regime
deaths usually occurred in tanks with the smallest and
occasionally the largest average size. id-size range tanks
rarely incurred mortality. ~ i g h mortality tended to
coincide with low growth rate and high DCV/IG,~ suggesting
that all three measures may be associated with a stressed
population, specifically in growth trial 5. Results for
growth trial 5 may therefore be confounded by this overall
pattern of stress.

TRIAL .-4 /
FEEDING INTERVAL
Figure 6. Change in co-efficient of variation relative to growth in groups of eight juvenile steelhead. N as in Figure 3.
FEEDING INTERVAL
, '
Figure 7.The occurrence of mortality in groups of eight juvenile steelhead. N as in Figure 3. The white bar at the 0.5represents the value for trial 4 alone.
DISCUSSION
Differences in growth performance were observed
between isolated single fish and groups of 8 fish. Growth
of single fish was comparable to that of fast growing
groups and the growth rates of isolates were less
divergent. Grouped fish generally grew faster with
increased frequency of feeding and sizes diverged less for
a given growth increment. The last growth trial, which
compared a feeding regime of 0.5-h intervals, a random
interval averaging 0.5-h, and a group fed every hour day
and night showed low growth and high mortality.
The growth and relative size of juvenile fish relative
to competitors is crucial to their future performance I
(Chapman 1962). In juvenile salmonids stream residence and
territory ownership are size dependent, and the rank order
of growth rate and access to resources often parallels that
of size (Brown 1946, Mason and Chapman 1965, Yamagishi
1962) due to the success of larger fish in competition
(~bbott et al. 1985). Survival during the stream-to-ocean
osmotic transition is dependent upon reaching a threshold
size (approximately 50 g in juvenile steelhead, Houston
1961). In fish culture facilities growth depensation means
that large fish may obtain a disproportionately large share
of resources, growing to an unnecessarily large size at the
expense of a number of smaller fish. The smaller fish may
be lost production if eventual production is limited by a

size threshold. Examples would include a legally imposed
size limit as in "put-and-take" stocking or a
physiologically imposed osmotic threshol'd. If size
gradients are large, "unexplained losses" (cannibalism)
(Shirahata 1964) and labour cost associated with grading
fish may be high. In addition, poor physical condition
(emaciation, scale loss, damaged fins and scales) and
elevated physiological stress indices are associated with
low hierarchy standing (Brown 1946, Ejike and Schreck
1980). Thus, particularly in fish culture situations, the
prevention of growth depensation may be as important as
achieving high average weights.
The source of variability in growth rates within
populations has been pursued along several lines of
investigation. Genetic studies of full- and half-sib
salmonids have assigned heritability values of 0.23-0.25 to
growth rates (Gall and\Gross 1978, Refstie and Steine
1978). These studies did not attempt to account for social
interaction by isolating fish. More frequently,
environmental and behavioural factors have been
investigated as causes of growth depensation. Competition
for food has been shown to influence levels of aggression
and growth depensation. Several studies have investigated
the energetic expenditures of fish involved in social
interaction and made inferences about growth (Carline and
Hall 1973, Li and Brocksen 1977, Puckett and Dill 1985).
The occurrence of growth depensation has commonly been
accepted as proof of the existence of energetically costly
social interaction (Jobling 1985). However, without
estimates of isolated individual fish growth, it can only
be indirect evidence. The large space requirements for
individual growth experiments generally prevent the rearing
of large sample sizes of isolated individuals.
Before detailed consideration can be given to the
present results and their implications, the methods and
underlying assumptions should be discussed. Growth models
used to analyse fish growth have been reviewed by Brett
(1979). The logistic model is often used to represent the
growth of organisms that initially grow quickly then slow
down or reach-an asymptote, as do determinate growers. The
growth of young, fast growing, non-reproductive,
indeterminate growers has often been analysed with the use
of the exponential model. Growth in both cases has been
measured with a confusing variety of units and methods
(1wama and Tautz 1981, Jobling 1983). The model of Parker
and Larkin (1959) accomodates the common observation in
salmonids of declining growth rate (relative to size) with
time (~helborri et al. 1973, Elliott 1975). While most
growth models are strictly empirical in that they describe
without necessarily providing a functional explanation of
the processes involved (~rett 1979, Peters 19831, Parker
and Larkin (1959) suggested that the model could be

partitioned into two major components -genetic and
physiological potential for growth, represented by X, and
ecological opportunities for growth, represented by K. K
might represent such factors as temperature or ration size.
Iwama and Tautz (1981) presented a method of comparing fish
growth at different sizes and temperatures.
Because of the physiological consequences of low rank
in a hierarchy (Ejike and Screck 1 9 8 0 ) ~ dry weight should
be a more accurate indicator of elaboration of tissue than
wet weight. Characteristic loss of gill ATP-ase efficiency
and impaired renal function in stressed fish impairs their
ability to maintain osmotic homeostasis, and in freshwater
fish results in an influx of water reducing percent dry
- matter (~azeaud et al. 1977). Thus, the use of wet weight
will cause an overestimate of the growth of subordinate
fish. Percent dry weight should also increase with size
independently of social rank due to increases in cell
number and size (Weatherly and Rodgers 1978) and deposition
of calcium as bone. All final dry weights obtained were
regressed against final wet weight in an attempt to be able
to predict initial dry weight on the basis of wet weight.
However, due to low coefficients of correlation (r=.41 in
growth trial # I ) and a reluctance to make assumptions
regarding relative stress levels in the experimental groups
of eight and the 1arger.source groups, wet weight was used
to express growth rates, in accordance with the model of

Iwama and Tautz ( 1 9 8 1 ) . Individual identification of fish
would have provided more information and required less
inference about growth rates, however, as noted in Methods,
cold branding failed and fin clipping might have altered
competitive capabilities.
The size variation of isolated fish, relative to their
-mean size, was low in comparison to that of grouped fish.
The average isolated growth rates were comparable to the
highest grouped growth rates. The measure of D C V / ~ days
among the isolates was influenced by the fact that many
isolated fish did not feed as extensively as grouped fish
and that some isolated fish did not feed at all. Thus the
measured DCV for isolates was probably an overestimate of
the variation to be found among feeding and growing
isolated fish. Non-feeding was probably due to one or both
of two causes. First, fish may not have learned to feed on
hatchery food prior to the start of the experiment. This
would only be the case for very young fish since
non-feeders would not survive to comprise part of the older
groups. Secondly, non-feeding may have been caused by
social and stress factors. Fish have been shown to exhibit
social facilitation in their feeding, learning faster,
feeding more vigorously, and growing faster when grouped
than when isolated (Landless 1976). Thus, isolating fish
that have had prior social experience cannot be said to
have removed all social factors. Rather, after experience,

isolation may be a condition of social deprivation that
could increase observed growth variability. The first two
groups of isolated fish were the smallest and youngest fish
used in the study and had a higher incidence of
non-feeders. The age and size of fish in control #3 was
more representative of fish used in group trials. These
fish showed minimal variability and I conclude that the
results of control # 3 are the most realistic. Data
regarding growth variation of isolated individual salmonids
have not appeared in the literature, but general statements
suggest that it is low (~amagishi 1962, Li and Brocksen
1977). The present study appears to be the first to give
sequential growth data on isolated salmonids. Koebele
(1985) found the growth variation.of isolated juvenile
Tilapia zillii to be lower than that of fish allowed to
interact.
An increase in the coefficient of variation in groups
of fish is generally considered evidence of social
interaction (Magnuson 1962, Rubenstein 1981, Jobling and
Wandsvik 1983) However, it is generally not stated that
this argument holds only in the case of an unlimited food
supply. Barnard and Burk (1979) have argued that any
difference in vigour of competing animals in small groups
- is magnified by continued success. Hence increasing
variability in growth or any other life history parameter
influenced by energy acquisition, such as survivorship or

reproductive output, is inevitable given unequal
capabilities and limited resources. An increase in relative
variability of growth in groups should indicate social
interaction if food is provided in excess. Either
behavioural dominants are excluding subordinates from food
or subordinates are getting a full ration of food but are
expending inordinate amounts of energy for maintenance or
activity. The daily ration in the present experiments was
twice that consumed in a single meal by other salmonids
(juvenile sockeye salmon, Oncorhynchus nerka), following up
to 22 h of starvation, and exceeds the satiation range for
most salmonids (~rett 1971). This confirms th,e importance
of social interactions in determining growth in these
groups of juvenile steelhead. There are numerous examples
of despotic social systems in salmonids where dominants
prevent subordinate feeding (~ewman 1956, Keenleyside and
Yamamoto 1962, ~amagishi 1962, Jenkins 1969, Symons 1971)~
and these observations were confirmed in this study.
That grouped fish grew faster at higher frequencies of
food presentation, even with constant total ration, can be
expected. Fish presented with excess food once per day were
only able to eat until their stomach was full. Fish
presented with food continually throughout the day, in the
absence of competitive interference, would theoretically be
able to fill their stomachs initially and then continue to
eat at a rate equal to the gastric evacuation rate.

Shelborn et al. (1973) found that continuous feeding for a
15-h day produced significantly greater growth in sockeye
juveniles than feeding to satiation 3 times per day.
Evidence of differing digestive efficiencies at maximum
stomach loading and during starvation (~obling 1982)
indicates that the relationship between food intake and
- growth is not linear.
Poor growth performance in some groups was due to
depressed growth rates relative to isolated fish. Fast
growing groups had growth rates that were equivalent to
isolates'. High variability in grouped fish was due to
depressed growth rates of individuals, even to the extent
of weight loss and death. Even in tanks whose populations
grew slowly or lost total weight, dominant individuals
achieved growth rates matching those of isolates and
dominants in fast growing groups. Although growth
depensation in crustaceans can result from increased growth
rates of larger individuals relative to isolates (Ra'anan
and Cohen 19841, the opposite is the common observation in
fish. Jobling (1985) argues that a positive relationship
between growth rate and size within a group is evidence of
competitive social interactions.
DCV/~ days was not significantly affected by feeding
regime. However, the growth differences discussed suggested
looking at growth depensation relative to the magnitude of
size change. In this case there was an obvious (although

frequent feeding provided statistically equivalent DCV/t in
conjunction with increasing growth rates, frequently fed
fish were actually diverging less in size over a given
growth increment, i.e. for an equal size increase, more
frequently fed fish would exhibit less growth divergence.
However, it will take the different groups different times
to grow that increment.
Growth depensation is usually measured relative to
time. This assumes that growth does not vary in the
populations being compared. Organisms adding biomass with
the same variance would be expected to produce differing
changes in the co-efficient of variation if grown at
different rates for an equal time period. Equivalent values
of DCV/~ only reflect equal divergence if referring to
normally distributed populations growing at the same rate.
Comparing rates of divergence for equal time periods
relative to the size change (DCV/IG~I) allows a more
comprehensive evaluation of the population growth. This
approach may be of more value to fish culturists where
growth divergence relative to growth (and feed expended)
may be more important than growth divergence relative to
time . Random and round-the-clock feeding gave poor
performance in both DCV and growth rate. This may in part
have been due to the entire group not getting a good start
on hatchery food or being generally stressed. The
concurrent 0.5-h regular feeding regime with fish from the
same group also performed poorly and mortality in this
trial was considerably higher than in other trials. Because
fish that were losing weight would be more likely to die
their loss would decrease the measured coefficient of
- variation. Randomly fed fish may have been less efficient
at utilising food due to being unable to learn the delivery
schedule. Results in Chapter VII indicate considerable
accuracy in learning feeding times, and studies of demand
feeding behaviour in rainbow trout show that only a short
time is required for learning andle less 1976). Regularly
fed fish exhibited anticipatory behaviour immediately prior
to feeding (Chapter VII) which may enable them to uti-lise
food more efficiently. It was not possible to determine
whether fish fed in the dark, but build up of uneaten food
in the tanks suggests they did not. This may explain part
of the poor performance of fish fed throughout a 24-h day,
since their effective total ration would be lower.
It is notable that high growth rates coincided with
low DCV/~G I and low mortality. This may indicate that all C
three parameters are general indicators of stress or health
in a growing population.
In conclusion, this section of the study has shown
that social interaction plays an important role in
determining the relative magnitude of growth rates and is

probably the major cause of growth depensation in juvenile
steelhead. Temporal distribution of food also plays a role
in determining growth rate and variability. The implication
of these results to fish culture is that growth should be
maximised by frequent feeding, at least once per hour.
Variability in relation to growth will also be minimised by
- frequent feeding. Controlling these variables
satisfactorily should also reduce mortality.

IV. THE RELATIVE GROWTH OF LOMINANT AND SUBORDINATE FISH ON
EQUAL RATIONS
INTRODUCTION
This experiment tests the hypothesis that relative
dominance status dictates the relative growth of fish fed
equal rations. Growth depensation due to differential
growth rates is a common feature of fish populations,
particularly in captivity (see Chapter III), and dominant
. fish.exhibit superior growth rates relative to subordinates
(Brown 1946, Yamagishi 1962, Li and Brocksen 1977, Carline
and Hall 1973). A significant portion of this variation can
be attributed to differential access to food. Dominants may I
defend point food sources or areas of high prey encounter
rate (~amagishi 1962, Wsnkowski and Thorpe 1979, Rubenstein
1981)~ thus interfering with the feeding of subordinates.
Increased rations reduce growth depensation (~agnuson 1962,
Koebele 1985)~ but high variation persists (~amagishi
1962). These studies found that increasing the spatial
dispersion of food, making it more difficult or costly to
defend and equalizing access, leads to decreased growth
variation.

An alternative cause of growth depensation is that
subordinates may convert food to biomass (gross growth
efficiency; Webb (1978)) less efficiently than dominants.
Newman (1956) and Kalleberg (1958) suggested that reduced
growth efficiency could be due to higher subordinate
activity levels. Carline and Hall (1973) suggested that
subordinates had higher metabolic rates, and Jobling and
Wandsvik (1983) postulated an "undefined psychological
stress" as a cause of growth depensation.
The complex of physiological conditions that occur in
fish challenged by sub-optimal environments is generally
referred to as the "stress syndrome" (~azeaud et al. 1977).
Some of these physiological parameters (e.g. increased
corticosteroid production and disturbed glucose metabolism)
have been correlated with position in a dominance hierarchy
rickson on 1967, Noakes and Leatherland 1977, Ejike and
Schreck 1980) and can be expected to influence metabolic
rate.
I hypothesize that the energetic costs of relatively
"stressed" subordinate fish should be higher than those of
the dominant. These added costs should result in reduced
growth relative to the dominant even if access to and
consumption of food is constant. As a result subordinates
should show a lower growth efficiency.
Access to food was controlled in size- and age-matched
pairs of juvenile steelhead by separating fish briefly at

feeding time, enabling them to consume equal rations. This
ensured that the dominant had no advantage in obtaining
food. It was predicted that dominants should grow faster
than subordinates; this difference should be a measure of
the metabolic cost of subordinance.
METHODS
Juvenile steelhead were obtained from the sources described
in Chapter 111. Fish for the present experiment were
selected concurrently with the weighing of large numbers of
fish as described in Methods, Chapter 111. During the
sorting process pairs most similar in size and length were
set aside for use in this experiment. The twelve pairs
obtained differed by no more than .0002 g (c.001%) and 1 mm
(usually within 0.5 mm).
Paired fish were placed in 45.5-1 aquaria equipped
with a removable, central, opaque divider. Dechlorinated
water entered and drained from opposite ends of the tank
and flowed through the tanks sequentially. Fish were
randomly placed on the inlet or outlet side of the divider.
Identifying characteristics of fish, such as fin and parr
. markings, were recorded during a 24-h acclimation period.
The barrier was then removed and the fish allowed to
interact. Dominance was assessed by the ability to deliver

unreciprocated nips, unrestricted use of both sides of the
tank, and typical rank coloration (Abbott et aL. 1985).
Fish that met all three criteria were considered dominant.
~ i s h were fed equal maintenance rations (2-3% wet weight,
live Tubifex spp.) during a short separation period until
dominance was determined, usually within 2 days.
The experimental feeding regime ensured that there was
no possibility of the dominant receiving a larger ration
than the subordinate. Food organisms (various sizes of
brine shrimp Artemia salina, fruit fly Drosophila
melanoqaster, and onion fly Hylemaya antiqua) were placed
in size-matched pairs. Fish were separated by lowering the
central divider and the subordinate was fed one prey item.
If that prey was eaten then the dominant was presented with
the matching prey. This was continued until either the
subordinate or the dominant refused a prey item. Thus, the
only possible disparity in ration level was that the
dominant could refuse one prey item after the subordinate
had fed. This occurred in 12 instances of a total of 798
feedings, with brine shrimp as the prey in each case. Fish
were separated for less than 5 min per feeding period.
Fish were usually fed twice per day at 1000 and 1400
h. Initially, behavioural observations were made for 10 rnin
immediately after the fish were reunited. After 1 1
observations of the first pair (these observations are not
included in the data set) this was changed to 10 rnin before

and after separation. When several pairs were run
concurrently only one tank was observed per feeding'. Nips,
charges, chases, displays, and crosses of the tank
centerline were recorded using a Datamyte 800 event
recorder. The last behaviour was assumed to be a measure of
ability to use tank space and search for food; it is also a
- crude index of activity level. Holding position and
presence or absence of typical salmonid subordinate
coloration were noted, and instances of fin damage were
recorded. Experiments were ended when three observers
independently identified the same fish as larger.
Fish were then separated, starved for two days to
eliminate gut contents, and final measurments taken as in
Chapter 111. For the calculation of dry weight increases,
paired fish were assumed to have equal percent dry weight
at the beginning of the experiment, i.e. both fish were
assigned the mean of their final percent dry weights.
RESULTS
Ten of twelve dominant fish grew faster than their paired
subordinate whether growth was measured as wet or "dry
weight increase (Table 4 1 , although the 10 fish with
greater wet weight increases were not the same 10 fish with
greater dry weight increases. The average daily growth of

TABLE 4.GROWTH INCREMENTS OF PAIRED JUVENILE STEELHEAD IN GRAMS ( * INDICATES PAIRS WHERE SUBORDINATES GREW FASTER THAN DOMINANTS) .....................................................
PAIR# WET WEIGHT INCREASE --------
DRY WE1 GHT DAYS OF INCREASE GROWTH --------
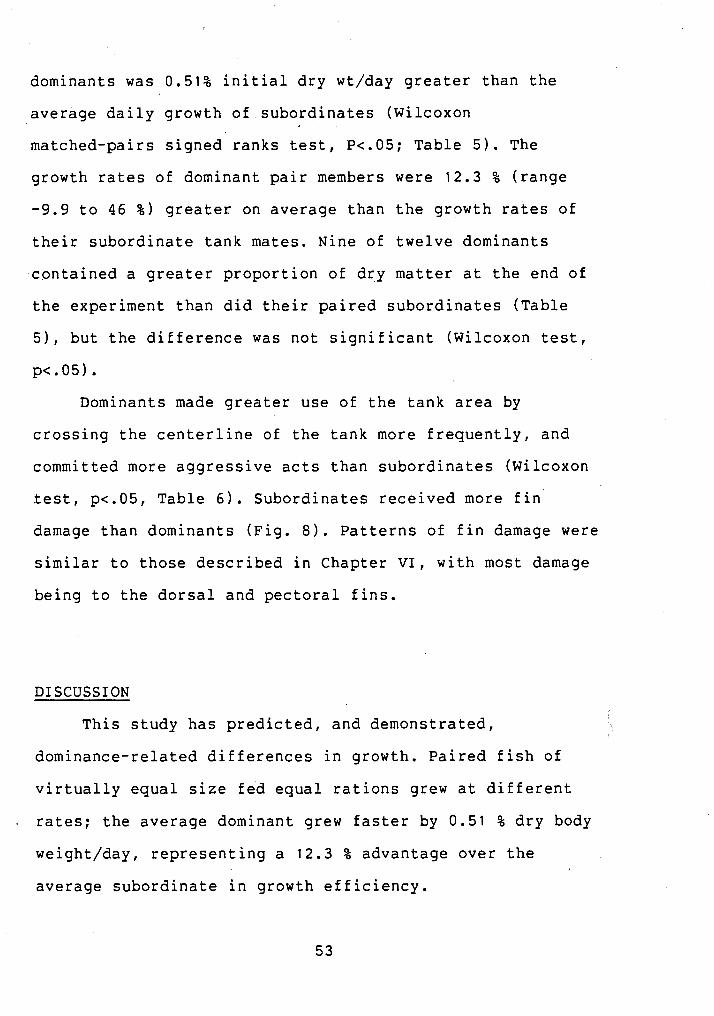
dominants was 0.51% initial dry wt/day greater than the
average daily growth of subordinates (Wilcoxon
matched-pairs signed ranks test, R.05; Table 5). The
growth rates of dominant pair members were 12.3 % (range
-9.9 to 46 % ) greater on average than the growth rates of
their subordinate tank mates. Nine of twelve dominants
-contained a greater proportion of dry matter at the end of
the experiment than did their paired subordinates able
5), but the difference was not significant (~ilcoxon test,
p<.O5).
omi in ants made greater use of the tank area by
crossing the centerline of the tank more frequently, and
committed more aggressive acts than subordinates (~ilcoxon
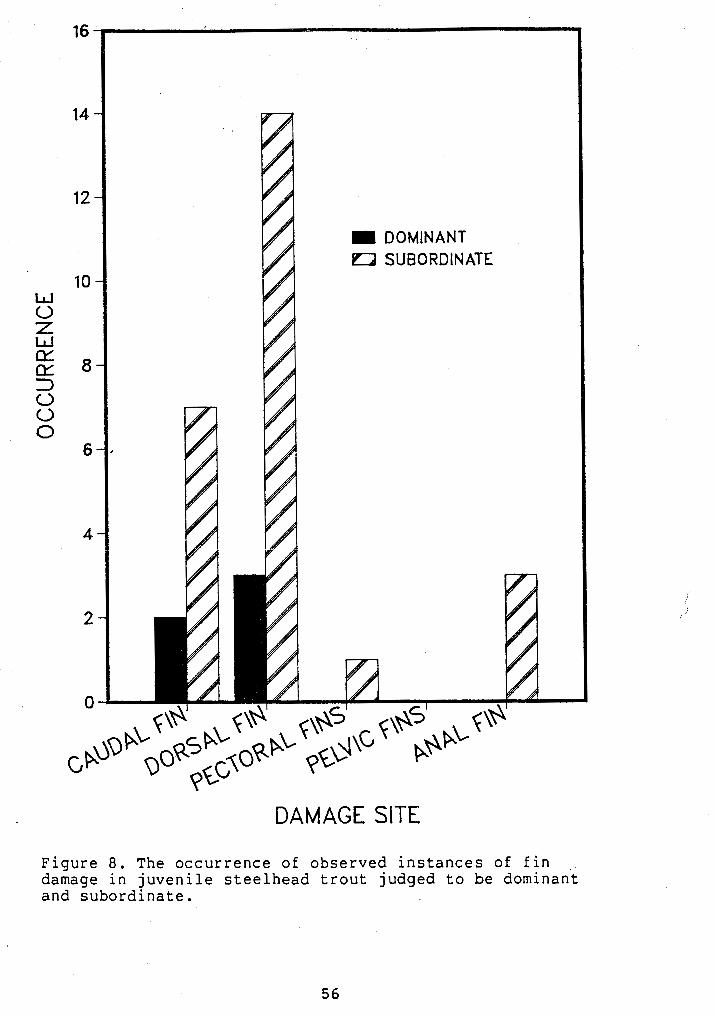
test, p<.05, Table 6). Subordinates received more fin
damage than dominants (~ig. 8). Patterns of fin damage were
similar to those described in Chapter VI, with most damage
being to the dorsal and pectoral fins.
DISCUSSION
This study has predicted, and demonstrated, \
dominance-related differences in growth. Paired fish of
virtually equal size fed equal rations grew at different
. rates: the average dominant grew faster by 0.51 % dry body
weight/day, representing a 12.3 % advantage over the
average subordinate in growth efficiency.

TABLE 5.GROWTH RATES AND FINAL PERCENT DRY WEIGHTS OF PA1 RED JUVENI LE STEELHEAD ( * I NDI CATES PA1 RS WHERE SUBORDINATES GREW FASTER THAN DOMINANTS OR HAD GREATER % DRY WEIGHTS) .....................................................
PAIR# GROWTH RATE % DRY WEIGHT %DRY WT./DAY ------------ -----------
DOM. SUB. DOM. SUB.

TABLE 6.AGGRESSIVE AND GENERAL ACTIVITY OF PAIRED JUVENILE STEELHEAD ..........................................................
PAIR # AGGRESSIVE ACTS --------------- CROSSES ------
DOMINANT vl SUBORDINATE
DAMAGE SITE
Figure 8. The occurrence of observed instances of fin , ,
damage in juvenile steelhead trout judged to be dominant and subordinate.

The similarity of size and age at the start of
experiments minimized any difference in growth potential
due to heredity or early developmental conditions, since
both members of a pair had achieved the same growth under
the same rearing conditions. As both members of a pair were
the same age (within 7 days) this also suggests similar
- initial metabolic efficienci.es. Previous social experience
may strongly affect future competitive performance ( ~ r e y
and Miller 1972, Francis 1983, Abbott et al. 1985), but
individual recognition and previous experience within these
pairs is unlikely due to the large hatchery source
populations. Differential foraging ability or direct
interference competition were not permitted to play a role
due to the method of separate food presentation.
Koebele (1985) reared trios of juvenile Tilapia zilli
which were fed equal rations while briefly separated. The
growth variance of trios was the same as that of socially
isolated individuals, but they displayed less variance than
grouped fish that were competing for food. However, no
predictions regarding relative growth and behavioural
status were tested and behavioural observations were not
reported.
Increased activity did not cause the low growth rates
- of subordinate steelhead. Behavioural observations of this
study and others (~alleberg 1958, Mason and Chapman 1965)
indicate that increased movement associated with aggression
and feeding are not generally correlated with subordinance.
In fact, unless forced to faster currents, subordinates
generally are less active than dominants. Li and Brocksen
(1977)~ Carline and Hall (1973) and Ejike and Schreck
(1980) found that high levels of activity and aggression
were correlated with high food intake and growth
- efficiency. Jobling and Wandsvik (1983) hypothized that
"psychological stress" might cause starvation or reduced
appetite. Highly stressed fish have been observed to cease
feeding (Chapt. V) and subordinate fish have been shown to
voluntarily reduce food intake (~bbott et al. 1985). In the
present study subordinates always maintained an appetite,
and consumed increasing amounts of food over the course of
the experiment; it could not be determined if voluntary
intake was lower than that of the dominant, however.
The most likely explanation for the results is that
dominant status is associated with reduced costs, or
conversely, that subordinate status is associated with
increased costs. Rowel1 (1974) argues that a dominant is in
a normal unstressed condition and that subordinate
behaviour represents the measurable result of dominance
interactions. Since dominant growth rates were comparable
to maximum salmonid growth rates recorded in the literature
- (Brett 1 9 7 1 ) ~ and those of grouped fish recorded in other
experiments (Chapt. 1111, depression of subordinate growth
rates appears to be the likely cause of size divergence.
Aggressive activity of dominants is reflected in the
greater amount of damage sustained by subordinates. Repair
of this damaged tissue should entail an added cost for
subordinates.
Several behavioural and physiological indicators of
stress are likely to be associated with higher energetic
costs. Higher gill ventilation and fin beat rates suggest a
higher rate of energy utilization or reduced energetic
efficiency (Ejike and Schreck 1980). Efficiency of gill and
renal osmotic functions is impaired as a result of
increased corticosteroid production (~azeaud et al. 1 9 7 7 ) ~
suggesting that more energy must be expended to maintain
homeostasis. The increased blood glucose levels resulting
from mobilization of liver glycogen indicate that more.
energy is being used (Mazeaud et al. 1 9 7 7 ) ~ and high
lactate levels indicate that glucose is being metabolised
by relatively inefficient anaerobic pathways eggs et al. 1980).
\
An attempt to indirectly monitor stress parameters in
this study was to measure percent dry weight. Due to
decreased osmotic efficiency stressed freshwater fish may
have a higher water content than non-stressed ones. For
example, Ejike and Schreck ( 1980) and ~agerlund et al.
. (1981) have shown that dominants have higher percent dry
matter content than subordinates. Most dominants in the
present study had higher percent dry weights as expected,

but the difference was not statistically significant.
How closely the stress levels of the experimental fish
correspond to those of fish in natural conditions is not
known. The fish did not appear to be stressed as severely
as fish in hierarchies (Chapts. I11 & V) where some
subordinates were observed to cease feeding and die. The
subordinates did not suffer great physical damage, and were
not held at high densities. Several studies of wild
stream-dwelling salmonids and fish in stream channels
suggest wild fish may be under stress. Subordinate juvenile
coho salmon or floaters (non-territorial) have less access
to food, may be forced to hold in disadvantageous
positions, and are continually at risk of attack (Puckett
and Dill 1985). Such situations and high density conditions
resulting from low stream flows and hierarchy formation in
pools may produce high levels of stress in the wild.
The advantage of territory ownership or primary
hierarchy position, both examples of dominance, have been
shown both theoretically and experimentally (reviewed by
Gauthreaux 1978). Increased success at food, space and mate
acquisition are examples of advantages of high social
position. Most studies have concentrated upon these
resource benefits that accrue to dominants, but dominant
juvenile salmonids will engage in aggressive activity even
when there is no apparent advantage in terms of resource
acquisition. Examples include satiated dominants preventing
subordinates access to food, and foregoing feeding to
engage in aggression (~alleberg 1958, Mason and Chapman
1965). The present results indicate that models based on
time or calories transacted in feeding or defense of
territories ill 1978b, Hixon 1980, Schoener 1983)
underestimate the advantage of territory ownership. These
models assume that costs rise with the size of territory
held. Changes in the net benefit of territoriality due to
relative stress levels of fish could influence territory
size and even the decision of whether or not to attempt to
hold territory. The importance of initial success in
competitive interactions (Mason and Chapman 1965, Abbott et
al. 1985) also justifies a bias towards territoriality.
These results offer some explanation of why animals will
spend apparently inordinate amounts of time and energy to
gain dominance.

V. THE EFFECT OF FEEDING FREQUENCY ON AGGRESSIVE BEHAVIOUR
INTRODUCTION
Brown (1964) established the conditions under which a
feeding territory should be defended: "If there is little
to be gained by aggression and much to be lost then
territorial behaviour will be selected against."
Territories should be defended only when the gains
(benefits) outweigh the losses (costs). This concept of
economic defendability has formed the basis of theory
predicting when a territory should be defended and what
size it should be. A l a r g e body ef evidence d e m n s t r a t i n g
the flexible space requirements of feeding territory
holders, including juvenile salmonids, has since
accumulated (reviewed by Dill 1978b), and several models
that detail more specific facets of territoriality have
been developed. A major contribution is that of Schoener
(1971) who distinguished between foragers that attempt to
maximize their rate of energy intake during foraging
(Energy maximizers) and those that attempt to minimize the 1'
amount of time required to obtain a finite amount of energy
(Time minimizers). Dill (1978b) considers juvenile coho
salmon to be energy maximizers and McNicol and Noakes

(1984) argue that juvenile brook charr are also energy
maximizers.
A simple, primary prediction of this theory is that as
energy maximisers juvenile salmonids that do not have full
stomachs should increase their aggressiveness or territory
size in response to a decrease in food availability.
However, confirmation of this prediction has been
surprisingly elusive. Dill (1978a) was able to demonstrate
only an increased charge speed in a detailed investigation
of several components of aggression, and Dill et al. (1981)
showed an increased reactive distance at low food levels.
The work of Slaney and Northcote (1974) and Mason (1976)
best suggests a long term decrease in aggression if food
availability increases under natural conditions. However,
aggression has been found to increase (~ewman 1956,
Kalleberg 1958, Keenleyside and Yamamoto 1962, McNicol and
Noakes 1984) or decrease (Symons 1968, Slaney and Northcote
1974) depending on the feeding ration, timing of feeding,
measure of aggression or time of measurement. The general
pattern of these results suggests a short term increase in
aggression (possibly proportional to meal size) and a long
term decrease in aggression in response to increased food
availability. These contradictory responses are probably
due to differing measures of aggression and food
availability and discrepancies in parameters that have been
altered with the intent of changing food availability.

If increased food availability results in decreased
total aggression and aggressive peaks that are proportional
to meal size, this suggests some consistent relationship
between the peaks and valleys of the time course of
aggression. How this time course responds to feeding has
not been detailed and doing so is a major goal of this
" chapter.
In attempting to modify aggression by changing aspects
of food presentation, investigators have used several
definitions of food availability, none of which are known
to be accepted by fish. Food availability for drift-feeding
salmonids is best expressed as a rate involving a quantity
per time or area. Previous research has involved time
periods varying from 1 feeding/w-eek (~eenleyside and
Yamamoto 1962) to 1 feeding/l5 min (Slaney and Northcote
1974). Depending on what time period fish use to assess
food availability, infrequent feedings could be perceived
as long periods of starvation. Thus when investigators have
altered ration, feeding interval can be a confounding
variable. Regular, infrequent feeding regimes are unlikely
to resemble the availability of food in the wild, where
irregular or clumped availability may be expected. Dill
(1978a) and McNicol and Noakes (1984) have both identified
the fish's assessment time period as crucial information
for further work.

In addition to the uncertainty of the time period used
by fish to assess their food supply, the sensory mechanism
by which fish assess the available food is unknown.
possibilities include memory of past feeding activity over
time, gut fullness or physiological measures such as blood
parameters (~eitelbaum 1966).
This study attempted to assess the time period and
mechanism of assessment by feeding a constant daily ration
of food and varying the frequency of feeding. If the
frequency of feeding activity is used to assess food
availability, then total daily aggression should vary with
the frequency of feeding bouts. If some other mechanism
monitors food availability over longer periods (i.e. one
day) total daily-aggression should remain constant under
constant daily rations. This does not exclude the
possibility that fish also monitor short-term food
availability. However, fine-scale measurement of the time
course of aggression following feeding should show these
other trends.
Behaviour under different feeding regimes was examined
concurrently with the growth experiments of Chapter 111.
The random and 1-h (X 24h) feeding regime were included as
possibly being more similar to availability patterns in the
natural environmentin certain aspects. Intensive
behavioural sampling was conducted to determine the exact
time course of aggression following feeding.

METHODS
All fish groups, treatments, and environmental variables
are as described in Chapter 111. On the fifth day of
feeding, black and white videotape recordings were made. A
large sheet of white plastic was suspended in front of the
the tanks on the morning of day 1 , and appropriately spaced
holes were cut to allow filming without disturbing the
fish.
Growth Trials 1&2:
In these trials only one camera mounted on a tripod
was available. By raising and lowering the camera a
vertical pair of tanks was filmed for one minute each and
then the tripod was moved laterally to film the next pair
of tanks. Movement between tanks required 15 to 30 s.
Samples were not evenly distributed over time, but were
clustered about feeding periods as activity changed most
quickly at this time. During the middle of the day when no
feedings occurred and the fish were relatively inactive,
several 2-min samples were taken for each tank. Thus, each
point in a time course of aggression for a feeding regime
represents the average of five tanks over a 12.5 to 15-min
period in the case of 1-min samples, and over a 22.5 to 25

min period in the less frequent case of 2-min samples.
Growth Trial 3:
A third bank of tanks was added for this trial.
Shelves were built on a wheeled cart to support the video
camera at the height of the banks of tanks. The camera was
moved to each shelf to film all tanks in a vertical row for
30 s each and then the apparatus was wheeled laterally to
cover the next vertical row. Movement between tanks
required approximately 5 to 10 s. Thus each point in a time
course of aggression represents the average of 5 tanks over
approximately 9 min.
Growth Trials 4&5:
In these trials three cameras were obtained and placed
on each shelf of the camera stand. All three tanks in a
vertical row could then be filmed and and lateral movement
required approximately 5-10 s. Each sample therefore
required approximately 3 min to obtain. Tanks were sampled
within the 5-min period before each feeding and the 5-min
period after feeding and at the mid-point between feeds.
The randomly fed tanks were sampled on the same regime as
the regular half hour regime. Results from one tank in each

regime in growth trial 5 were excluded due to high
mortality.
Videotapes were viewed and behavioural events recorded
on a Datamyte 800 event recorder. Each sample was viewed
several times with the use of slow motion and stop-action
to obtain the following measures:
1 .
2.
3 .
The
1 .
2.
The number of fish performing aggressive acts;
The number of fish receiving aggressive acts;
The percent of total sample time in which aggressive
acts occurred.
following aggressive behaviours were recorded:
Nip- either visible or probable jaw contact;
Charge- a very fast approach of greater than 1 body
length (if less than one body length it was ususally
included as a nip);

3. Approach- a slow movement directed towards another
fish;
4. Chase- a high speed continuation of a charge or
approach and in which the recipient flees.
Due to high variation in average daily aggression
between tanks within a feeding regime, for presentation of
time course data, each tank score was normalised to the
daily tank mean. These scores were then averaged.
RESULTS
General Observations:
All groups were observed feeding on the first day
following weighing. Usually a dominant fish was stationed
in the upper central portion of the tank and subordinates
held about the edges and corners of the tank. When more
than one fish was acting in an aggressive fashion (this
tended to occur after feeding) the tank appeared to be
divided vertically with the alpha fish above. Thus, it
appeared as if the dominant fish were maintaining
territories.
Subordinate fish sometimes swam under the mesh on the
bottom of the tank. This caused a certain amount of

disturbance as the mesh had to be lifted to retrieve the
fish. The fish involved were usually small relative to the
tank average and, by their colour and behaviour, often
appeared to be stressed.
Although fish in all tanks were observed to feed on
the first day of the experiment, the tanks containing the
smallest and largest fish of each feeding regime did not
appear to adapt to the experimental regime readily; fewer
fish were observed to feed and they exhibited more symptoms
of stress such as rapid gill ventilation and fin beat and
dark colouration. Fish did not appear to change their
behaviour in response to observer activity, or the brighter
lights used during filming. However, fish were observed to
respond to the sound of the fish feeder motor when other
tanks were fed.
Total daily behaviour:
There were few differences between regularly fed
regimes in their daily aggression measured as: aggressive
acts per fish per 30 s, per cent time engaged in
aggression, nips per fish per 30 s, charges per fish per 30
s, chases per fish per 30 s, approaches per fish per 30 s,
average number of aggressors (~igs. 9-15; p values are
given in the figure legends). No consistent trend is
apparent. Values for aggression rates in growth trial 5
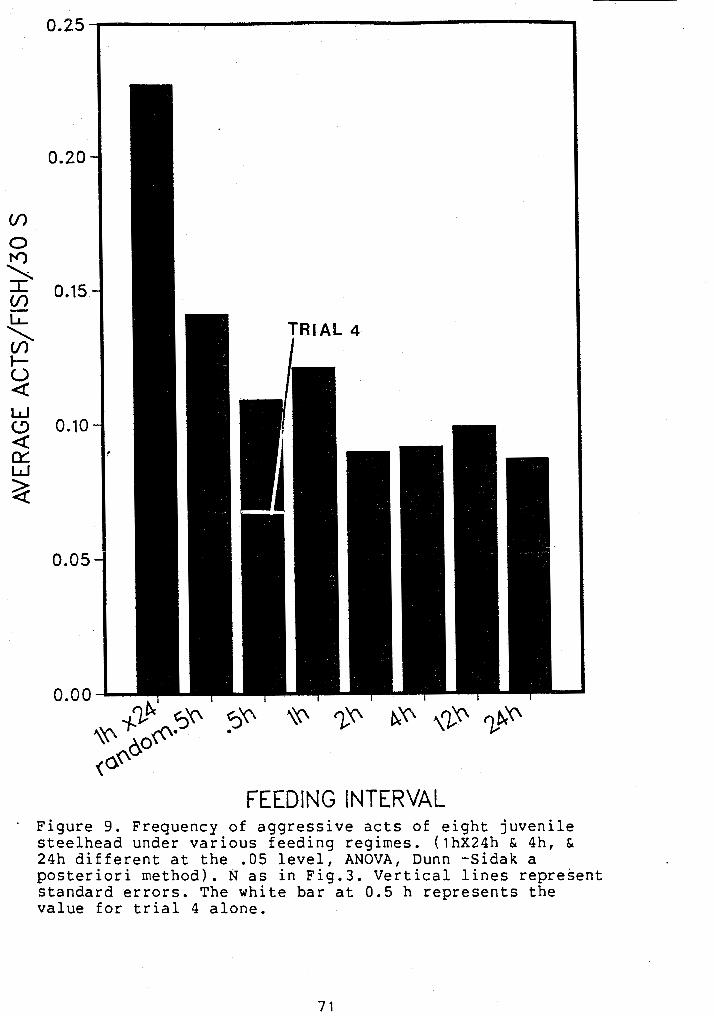
TRIAL
FEEDING INTERVAL Figure 9. Frequency of aggressive acts of eight juvenile steelhead under various feeding regimes. (lhX24h & 4h, & 24h different at the .05 level, ANOVA, Dunn -Sidak a posteriori method). N as in Fig.3. vertical lines represent standard errors. The white bar at 0.5 h represents the value for trial 4 alone.
cv 2Y\ $' ap ,- FEEDING INTERVAL
Figure 10. Per cent time engaged in aggression by groups eight juvenile steelhead under various feeding regimes. (24h & 12h, 4h, 2h, Ih, & lh(~24hr) different at the .05 level, ANOVA, ~ u n n - ~ i d a k method). N as in Fig. 3. Vertical lines represent standard errors.

FEEDING INTERVAL
Figure 1 1 . Frequency of nips in groups of juvenile steelhead. (lh(x24h) & Ih, 2h, 12h, & 24h; .5h & 4h; random & 24h) different at the .05 level, ANOVA, Dunn-Sidak method). N as in Fig. 3. Vertical lines represent standard errors.

IAL 4
FEEDING INTERVAL
Figure 12. Frequency of charges in groups of juvenile steelhead. ( l h ( ~ 2 4 h ) & Ih, 2h, 4h, 12h, & 24h different at the .05 level, ANOVA, ~unn-Sidak method). N as in Fig. 3. Vertical lines represents standard errors.

rju' *\u' zu\ ! ,zy' $iX'
FEEDING lNTERVAL
Figure 13. Frequency of chases in groups of eight steelhead. (No significant difference at the .05 level, ANOVA, Dunn-Sidak method). N as in Fig. 3. Vertical lines represent standard errors.
I TRIAL 4 I
FEEDING INTERVAL
Figure 14. Frequency of approaches in groups of eight steelhead. (Random, lh(~24h) & .5h all different from all other regimes at the .05 level, ANOVA, Dunn -Sidak method). N as in Fig. 3. vertical lines represent standard errors.
TRIAL I
FEEDING INTERVAL
Figure 15. Average number of aggressors observed per 30 s in groups of eight steelhead. (24h & 12h, 4h & 2h different at the .05 level, ANOVA, Dunn -Sidak method). N as in Fig. 3. Vertical lines represent standard errors.

were most frequently different from (higher than) those
associated with regular feedings.
Time courses:
In all feeding regimes (Figs. 16-28) there was a
significant increase in the number of aggressive acts
following a feeding. In 74 of 113 observed feedings the
number of aggressive acts at the sampling point immediately
post-feeding was higher than in the immediate pre-feeding
sample (sign test, p=.019, Table 7). Considering individual
feeding regimes only the 0.5-h interval and the I-h
interval (over 24 h) did not show increases in the number
of aggressive acts following feeding. The 2-, 4- and 24-h
interval feedings showed peaks after all feeds. The small
sample sizes for regimes that had 4 or less feedings per
day make statistical tests meaningless, but the coincidence
between aggressive peaks and feeding times is obvious
(Figs. 16 to 21). Per cent time engaged in aggression
increased following 73 of 113 feedings (sign test, p=.019),
but intensity, measured as the ratio of nips to all acts,
did not increase significantly following feeding (sign
test, p=.425). The number of aggressors increased following
feeding 75 times in 113 observed feedings (sign test,
p=.019). When feedings are infrequent, low scores .
immediately prior to feeding were recorded (i.e. ~igs. 16,
5 to TIME (hours)
Figure 16. Average time course of aggression in 5 groups of juvenile steelhead in Growth trial 1 , fed once/day (at ' vertical line). Normalised to tank means.

TIME (hours)
Figure 17. Average time course of aggression in 5 groups of juvenile steelhead in Growth trial 1 , fed once/day ( a t ' vertical line). ~ormalised to tank means.

5 .I 0
TIME (hours)
Figure 18. Average time course of aggression in 5 groups of juvenile steelhead in Growth trial 2, fed once/day (at ' vertical line). Normalised to tank means.

TIME (hours)
Figure 19. Average time course of aggression in 5 groups of juvenile steelhead in Growth trial 2, fed 2x/day (at vertical lines). Normalised to tank means.

TIME (hours)
Figure 20. Average time course of aggression in 5 groups of juvenile steelhead in Growth trial 3, fed 2x/day (at '
vertical lines). Normalised to tank means.

TIME (hours)
Figure 21. Average time course of aggression in 5 groups of juvenile steelhead in Growth trial 3, fed at 4-h intervals (at vertical lines). Normalised to tank means.

TIME (hours)
Figure 22. Average time course of aggression in 5 groups of juvenile steelhead in Growth trial 3, fed at 2-h interv'als (at vertical lines). Normalised to tank means.


rc coo
0 cdz


TABLE 7. THE FREQUENCY OF INCREASE OF VARIOUS MEASURES OF AGGRESSION FOLLOWING FEEDING UNDER DIFFERENT FEEDING REGIMES (OCCURRENCE OF INCREASE/TOTAL FEEDINGS OBSERVED). P VALUES FROM SIGN TEST IN PARENTHESES. .........................................................
ACTS % TIME NI ~ ~ / A C T S # OF FEED1 NG AGGRESSORS INTERVAL
random 11/13(.01) 10/13(.035) 9/13(.087) 11/13(.01)
24 hr, 7/12(.193) 7/12(.193) 6/12(.226) 6/12(.226) 1 /hr

17, and 18). This did not concur with subjective
impressions of the observers (3.C.A and R. Hotson); on a
finer time scale it appeared that aggression and overall
activity increased prior to feeding time. Daily and twice
daily feeding regimes were also characterised by high
levels of aggression just after the lights came on in the
- morning and just before they went off in the evening (Figs.
16 to 20). Some of the figures indicate that the sound of
fish feeders operating over adjacent rows of tanks may have
initiated aggression, as small peaks at these time are
observed (~igs. 21-22).
The average height of peaks of aggressive acts
following feeding, measured from the sample immediately
before feeding to the point where the sign of the slope
first becomes negative, showed a non-significant trend
(ANOVA, p=.171) of decreasing peak height with increasing
frequency of feeding (~ig. 29).
DISCUSSION
There were few differences in total daily aggression
attributable to feeding regime as measured by a variety of
aggressive indices. When differences occurred they most
frequently involved random and 24-h schedules. Within a day
there were marked variations in levels of aggression. Peaks

FEEDING INTERVAL Figure 29. The height of peaks of aggression (normalised units) in groups of steelhead under various feeding regimes. Units as in Figs. 16-28. The open bar at .05 h represents the value of trial 4 alone.
were temporally associated with feeding, and the size of
the peaks, measured by the number of aggressive acts,
tended to decrease as the frequency of feeding increased
and the amount of food present at each feeding decreased.
That total daily aggression is constant when daily
ration is constant does not contradict a hypothesis that
aggressive levels are based on an assessment of daily
ration. That fish did not alter their total levels of
aggression in response to temporal variation in
availability suggests that the stimulation of the presence
of food observed by Kalleberg (1958), Keenleyside and
Yamamoto (1962) and Mason (1966) is overruled by some
internal mechanism that assesses food availability over a
relatively long time period. If fish responded to sounds of
feeding in adjacent tanks this may blur differences between
adjacent regimes within the same trial, but differences
between separate trials should still be apparent.
In the 1-h(x24) regime it is not known if steelhead
were feeding at night or with the same efficiency as during
the day. The buildup of uneaten food observed below the
mesh on the bottom of the tank would indicate that less
feeding occurred at night. So also do the low growth, high
variability, and high mortality observed in these fish
. (Chapt. 111). The observed high levels of aggression are
therefore consistent with the hypothesis that aggressive
maintenance of feeding territories should increase with
decreasing levels of food availability (~laney and
Northcote 1974, Dill 1978b, Hixon 1980).
The short-term changes in the amount of aggression
observed indicate that juvenile steelhead also assess food
availability over shorter time periods. The observation of
these changes in the random feeding regime indicates that
. this is a response to the feeding itself and not simply 'due
to learning of feeding times (see Chapt. VII). Since
. changes occurred almost immediately after food
presentation, and in some cases before it, and since the
fish normally fed for several minutes, this fine-scale
mechanism is probably not an internal mechanism that
detects the amount of food eaten but rather a sensory
assessment of the presence of food in the environment.
Figure 29 suggests that the height of aggressive peaks may
be proportional to meal size, as observed by Mason (1966)
in coho salmon. The apparent breakdown of the pattern at
0.5-h intervals may indicate a minimum length to aggressive
periods.
Why juvenile steelhead should respond in opposite
fashions to long term and short term food availability is
unknown. The major discussion of short term increases in
aggression following feeding has centered on attempting to
explain post-feeding peaks as an artifact of experimental
method, rather than investigating any possible adaptive
significance (~eenleyside and Yamamoto 1962, Symons 1968).

While a perception of increased food availability may cause
a territory holder to maintain a smaller territory, the
same environmental change should influence a non-territory
holder to attempt to hold a territory. Within a closed
experimental system feeding should therefore result in at
least a temporary instability since more fish are active,
and hence more likely to come into proximity, and more fish
are provided with incentive to gain a territory.
Subordinate juvenile steelhead have been shown to have very
little chance of overthrowing dominant individuals (~bbott
et al. 1985). There should be very little incentive to
challenge a dominant when there is no additional food
available. A condition when there is more food available
than a dominant can use or defend may offer better chances
of success. The ability of these fish to learn a regular
feeding schedule with considerable accuracy may reinforce
this behaviour; the learning of the timing of presentation
of food is logically indistinguishable from the learning of
the time of no food, and there would be little incentive to
increase social standing if it is known that there are no
immediate rewards to be obtained.
From the point of view of the dominant it may be
relatively wasteful of energy to defend a feeding territory
when it known that there will be no food in it for a
considerable period of time. Alternatively, it may be more
efficient to defend a territory on a full stomach when the
resources are available and the perceived size of the
defender is larger (~bbott et al. 1985). If there is more
food present than can be eaten by a dominant, a dominant
can still increase its relative fitness by preventing
competitors from feeding after it is satiated (Wilson
1975). In both cases, the long periods of almost total
inactivity observed during the long inter-feed intervals of
the infrequent feeding regimes would suggest that some food
is necessary to make aggression a worthwhile expenditure of
energy by either dominants or subordinates.
Any discussion of strategies of aggression is hampered
by lack of knowledge of how aggression is initiated. In the
salmonid literature aggressive acts are implicitly scored
and reported as a characteristic of an interaction
initiated by the dominant. Ethologists have long realised
that social behaviours are often arranged in complicated
reaction sequences inbe berg en 1951) in which appropriate
responses are required for the full complement of
behaviours to be exhibited. In this respect it is presently
unknown to what extent the delivery of an aggressive act is
a result of the dominant's internal motivational state or
to what extent it is a response to an action committed by
the subordinate.
Rowell (1974) considered whether the dominant or
subordinate was the cause of aggression in primate
hierarchies. Reasoning that you "can't chase someone who

won't flee", she calls upon observations of "provocative
cringing" apparently eliciting attacks from otherwise
uninvolved dominants. Little is known of the ethological
function of salmonid subordinate behaviours such as
"hunching" (~bbott et al. 1985) and displaying dark
coloration. It has not been effectively shown that they
. fulfill the classic ethological function of deflecting or
reducing dominant aggression and it is possible that they
may identify subordinates as susceptible to attack;
hunching subordinates were attacked more frequently than
fish in a normal posture. Rowel1 also contends that
dominant behaviour is more similar to the normal behaviour
of individuals and that it is the subordinate which alters
its behaviour. A difficulty in this approach identified by
Wade (1978) is that the characteristics of a relationship
do not lie in either of the individuals alone (i.e. can you
flee if no one's chasing you?). However, Wade does -,
acknowledge that the subordinate may have some degree of
control over the interaction.
Another explanation of increased aggression following
feeding is provided by the theoretical and experimental
work of Ebersole (1980). Although an energy maximiser's
territory size is generally considered to decrease under
conditions of increased food availability (Dill 1978b,
Hixon 19801, a static, decreasing or increasing territory
size may result depending on the shape of the cost curve

relative to the benefit curve (Schoener 1983). An increase
is likely to be the case when the benefits of a larger
territory increase faster than costs, such as travel.
Depending on the decision rules used by subordinates in
attempting to acquire te.rritory, the artificial
predator-free confines of experimental facilities may meet
this criterion.

INTRODUCTION
As aggressive animals functioning within a dominance
system, juvenile steelhead require a mechanism by which
contests are decided and the dominance system mediated.
Animals may settle disputes by direct, possibly damaging
fighting (escalated fighting) or by more economical,
ritualised forms of aggression (conventional fighting)
(Maynard Smith and Parker 1976). Displays are used as means
of competing for a resource or dominance position in a
non-damaging manner, but these can, however, escalate into
direct physical combat (Parker 1974). Juvenile steelhead,
in common with most other juvenile salmonids, employ visual
displays of form, colour, and movement. In escalated
conflicts these displays are replaced by fighting in the
form of nips (Chapman 1962).
Since Hoar's (1951) comparative work on juvenile
Oncorhynchus spp., the behaviour of several species of
salmonids in both aquaria (~ewman 1956, Keenleyside and
'A version of this chapter is in press, Can. J. Fish. Aquat. Sci. 1985.
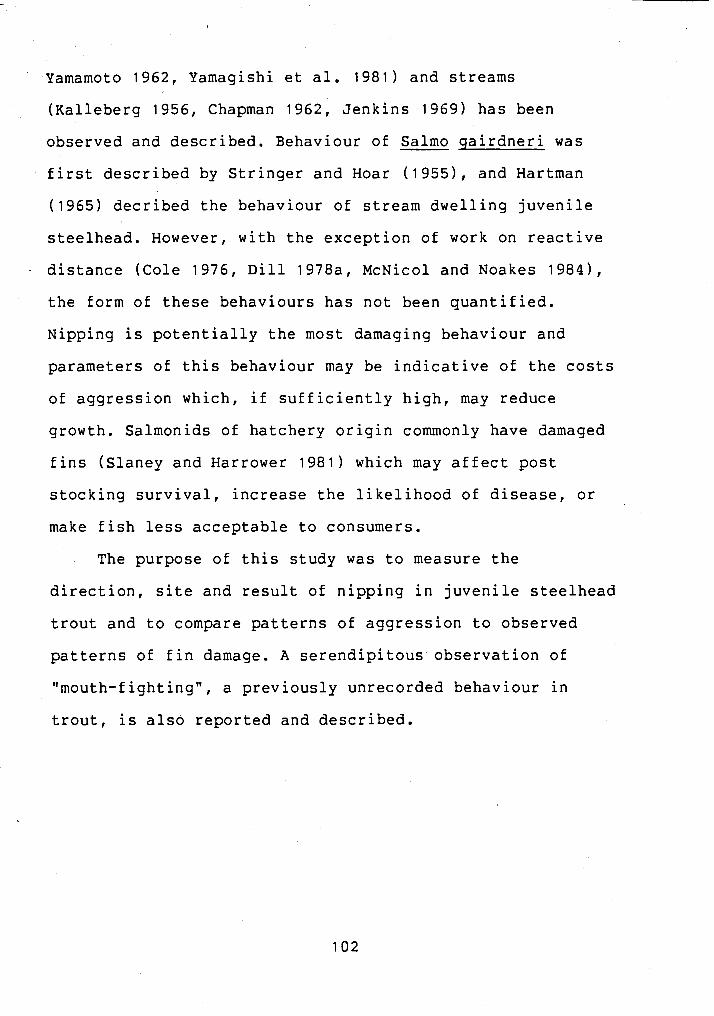
Yamamoto 1962, Yamagishi et al. 1981) and streams
(~alleberg 1956, Chapman 1962, ~enkins 1969) has been
observed and described. Behaviour of Salmo qairdneri was
first described by Stringer and Hoar ( 1 9 5 5 ) ~ and Hartman
(1965) decribed the behaviour of stream dwelling juvenile
steelhead. However, with the exception of work on reactive
- distance (Cole 1976, Dill 1978a, McNicol and Noakes 19841,
the form of these behaviours has not been quantified.
~ipping is potentially the most damaging behaviour and
parameters of this behaviour may be indicative of the costs
of aggression which, if sufficiently high, may reduce
growth. Salmonids of hatchery origin commonly have damaged
fins (Slaney and Harrower 1981) which may affect post
stocking survival, increase the likelihood of disease, or
make fish less acceptable to consumers.
The purpose of this study was to measure the
direction, site and result of nipping in juvenile steelhead
trout and to compare patterns of aggression to observed
patterns of fin damage. A serendipitous observation of
"mouth-fighting", a previously unrecorded behaviour in
trout, is also reported and described.

Observations were made of groups of 8 aquarium-held
juvenile steelhead. These fish comprised growth trials 1
and 2 of the growth experiment described in Chapter 111.
Videotaping of these groups is described in Chapter V. Data
- from the two groups were pooled for analysis.
One hundred random points on videotape were selected
and the tape monitored until an aggressive bout occurred. A
bout was characterized by the occurrence of a nip. If both
fish delivered nips the bout was classified as reciprocal,
and if only one of the pair delivered nips, non-reciprocal.
Bouts were considered to have ended when the fish ceased to
orient to each other.
Previous to administering a nip a fish would pause,
orient towards the recipient and then charge, generally in
a straight line. Slow motion and stop action were used to
isolate the point of initiation of a charge. A straight
line was then passed through the eye and tail of the
aggressor. The point where this line contacted the
recipient was recorded according to the diagram in ~ i g . 30
(inset) and assumed to be the point at which the aggressor
aimed it's nip. Slow motion and stop action were used to
. isolate the point of contact in each bout. The body section
on which a fish received a nip was recorded as with aim
site. Charges that missed actual contact were included if

part of a series of completed attacks. Eighty
non-reciprocal bouts comprising 175 aims and 157 nips, and
20 reciprocal bouts yielding 76 nips and 79 aims were
viewed.
The resulting distributions of aims or nips were
compared to a model distribution. For the model I assumed
that any point on the fish had a random, or equal, chance
of being scored. Thus, the relative area of each body
section in Fig. 30 (inset) equalled the expected relative
number of scores (aims or hits) for that body area.
The two dimensional nature of videotape analysis may
have introduced error into the results. While measurement
of attack contact area should be relatively unaffected,
variation of position in the third dimension-would affect
the accuracy of measurement of aim site. However, there
should not be any consistent directional bias. Aims that
occurred when the attacker was at an extreme angle towards
or away from the plane of the screen were disregarded.
Fin damage of fish in growth trials 1,2,4, and 5
(Chapter 111) was recorded at the conclusion of the growth
experiments by examining them under a dissecting
microscope. Growth trial 3 was omitted as these fish showed
obvious fin damage when they were obtained from the
hatchery. If fins were split or more than 1/3 of a fin was
estimated to be missing, damage was classed as minor. When
more than 1/3 of a fin was estimated to be missing damage

was classed as severe. Scale loss and damage to the head
(including jaws and gills) were scored for occurrence but
not for severity.
RESULTS
In reciprocal bouts both aims and nips were most
frequently directed at the dorsal fin and anterior area of
the body. The distribution of both aims and nips were
different from the random model (x2,~<.00i) but were not
significantly different from each other at the .05 level
(~ig.30). Non-reciprocal aims were most frequently directed
at the posterior areas of the body and at the dorsal fin
(Fig. 31). The distribution was significantly different
from random (X2,P<.001) and also different from the
distribution of aims in reciprocal bouts (~~,P<.001). Nips
in non-reciprocal bouts were primarily recorded at the
caudal fin and with decreasing frequency on the anterior
regions. This was significantly different from a random
distribution, the pattern of non-reciprocal aims, and of
reciprocal nips (X2,~<.001 in each case).
In both grouped growth experiments the dorsal fin
suffered the highest occurrence of minor damage. The
pectoral and caudal fin were the second and third most
damaged (Fig. 32). The occurrence of severe damage followed
AIM SITE C?l ATTACK SlTE
1 2 3 4 5
BODY AREA
Figure 30. The distribution of aims and attacks (nips) in reciprocal aggressive bouts in juvenile steelhead.

AIM SlTE 0 ATTACK SlTE
2 3 4
BODY AREA
Figure 31. The distribution of aims and attacks (nips) i n non-reciprocal aggressive bouts in juvenile steelhead. '
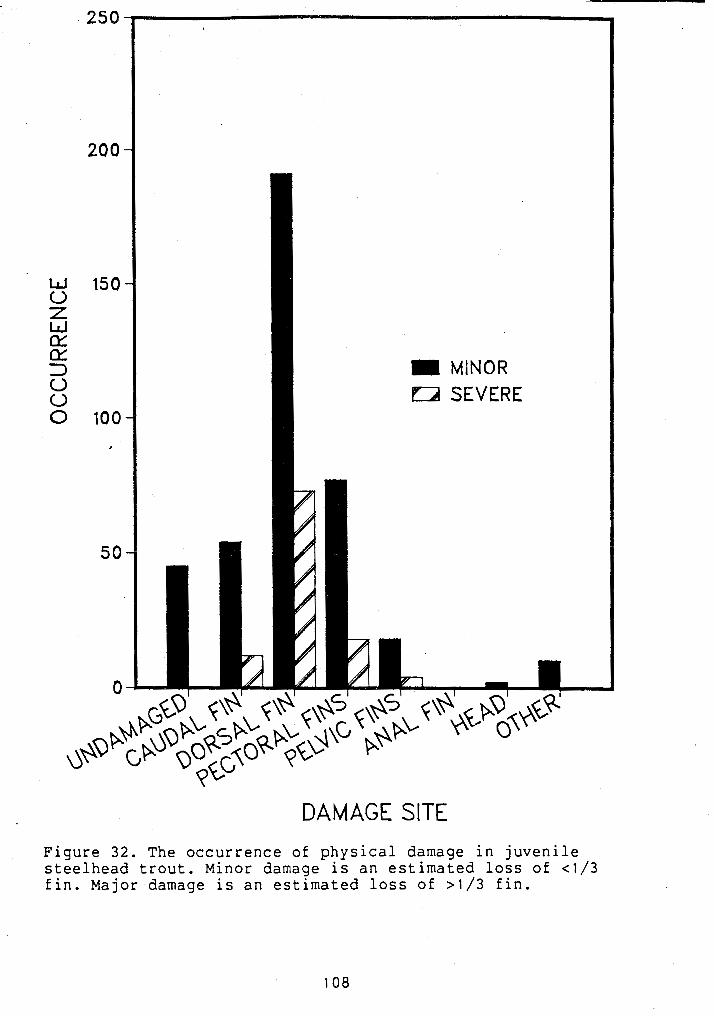
MINOR Bd SEVERE
DAMAGE SITE
Figure 32. The occurrence of physical damage in juvenile steelhead trout. Minor damage is an estimated loss of <1/3 fin. ~ a j o r damage is an estimated loss of >1/3 fin.

a similar pattern. No cases of damage to the anal fin were
recorded. In both cases the distribution was significantly
different from random (X2,~<.001).
Mouth fighting: In the course of videotaping growth
trials 1 and 2 as described in Chapter V, fish were
observed to exhibit a previously undescribed behaviour. On
- three occasions, two of which were on camera, fish ended a
prolonged, reciprocal conflict by grasping each other's
jaws and.then "wrestling" by pulling, pushing and twisting.
This was termed "mouth fighting1' (~ig. 33). These
interactions occurred between vigorous similar-sized fish
that appeared to have been contesting dominance of the
tank. Mouth fighting occurred after intense bouts of
fighting involving 37 and 77 nips/combatant (videotaped
bouts). These nips were directed mainly at the head and
pectoral fins as the fish circled. In two instances pairs
ceased nipping while facing one another and then closed and
locked jaws. This was done at a lower speed than when
charging. In a third case the mouth locking occurred
quickly in the course of a series of mouth-to-mouth nips.
Fish remained locked for 27, 53, and 63 s. After releasing,
one fish would swim away snapping its jaws and shaking its
head and assume a quiescent position near the surface of
the tank with other subordinates. In the course of analysis
of subsequent videotapes three more instances of mouth
fighting were observed; all followed a similar pattern.

Figure 33. Mouth fighting in juvenile steelhead. Outlines traced from video tape.

DISCUSSION
In reciprocal aggressive bouts juvenile steelhead aim and
nip sites corresponded closely and were concentrated on the
dorsal fin and anterior body regions. Non-reciprocal bouts
showed a pattern of aims directed at the dorsal and caudal
fins but nips were concentrated more towards the posterior
of the body.
The differences observed may simply be due to the
retreat of one fish in the non-reciprocal bouts. Swimming
away from the attack would cause the nip to contact behind
the aim site. Alternatively, juvenile steelhead may employ
-different fighting tactics depending on the response of the
opponent. The different reciprocal and non-reciprocal aim
sites suggest such a change in tactics as aim site should
be relatively unaffected by target movement. Recipients
rarely moved until the attack was initiated. It cannot be
determined absolutely whether head or tail nips are more
damaging but because nips to the head may cause damage to
the gills, eyes, and mouth parts, they may be more
dangerous and thus represent escalation. Fish were often
observed to shake their heads after receiving nips there.
Literature reports of juvenile salmonid fighting
behaviour generally describe nips as being directed at the
caudal area, e.g. by juvenile coho salmon (chapman 19621,

and by Atlantic salmon (~eenleyside and Yamamoto 1962).
Stringer and Hoar (1955) stated that nips usually occurred
close to the base of the tail in Kamloops (rainbow) trout
but acknowledged that this may be due to the rapid retreat
of the recipient. Gibson (1981) observed biting at the
flanks and caudal peduncle in four species of juvenile
- salmonid. Newman (1956) reported that fighting rainbow
trout and brook charr would attempt to grasp the pectoral
or dorsal fin of the opponent. It was noted that these fish
were held at high density and that return nips were common,
a situation corresponding to the reciprocal bouts of this
study.
Orientation and damage to the dorsal fin may be
expected if the dorsal fin is more conspicuous, more
accessible, easier to grasp or more delicate than other
fins. The juvenile steelhead dorsal fin may be spotted,
have a reddish hue and a white border at the tip, making it
conspicuous. As such it may function in conflict as an
aggressive releaser. Many juvenile salmonids show an erect
dorsal fin in aggressive displays and a depressed fin in
submissive postures (~ewman 1956, Keenleyside and Yamamoto
1962, Chapman 1962, Jenkins 1969).
The complete absence of damage to the anal fin may
- indicate. that it has little signal function or is for some
reason less susceptible to attack. Dominant fish tended to
hold in the center of the tank at mid-depth or higher.

Thus, many attacks were oriented downwards. Underwater
observation of pen-held juvenile steelhead showed the most
common attack to be a charge of two to three body lengths
to nip the dorsal fin of a deeper fish (Chapter 11). If
this is the common attack behaviour it would make contact
with the anal fin unlikely.
Several reciprocal bouts featured a previously
undescribed behaviour of juvenile trout. Mouth locking,
although a common aggressive and courtship behaviour in
centrarchids and cichlids (Greenberg 1947, Baerends and
Baerends-van Roon 19501, is not common in salmonids.
MacPhee (1961) reported that both juvenile coho salmon and
largemouth bass (Micropterus salmoides) locked jaws while
dominance was first being established, presumably when
intensity of aggression was high. R. Konopacky (Idaho
Cooperative Fishery Unit, University of Idaho, Moscow, ID,
pers.comm.) observed mouth-to-mouth contact of juvenile
chinook salmon Oncorhynchus tshawytscha as territories were
being estabished in a circular stream channel. Well
conditioned, dominant steelhead in the present study were
observed to have red lower jaws which may have a display
function. It is not known if this behaviour is relatively
damaging to the combatants, but it appeared to be effective
in ending the bout.
Fin damage in laboratory aquaria was concentrated on
the dorsal fins as would be expected from the observed

attack behaviour. This damage was similar to that observed
in floating pen rearing facilities (Chapters I1 and VIII).
Fin damage has been reported as a problem frequently
affecting the culture of fish intended for commercial sale
or for stocking in a sport fishery (~ovotny 1980, Moring
1982). Dorsal fin size has even been used to distinguish
'wild from hatchery steelhead (Washington State Dept. of
Game, 1984 sport fishing regulations). Fin damaged fish
have a low angler acceptance (Whitlock 1974), probably
display lower growth if stressed or if energy is being
expended on repair of damaged tissue, and have greater
susceptibility to bacterial fin disease (Schneider and
Nicholson 1980). Damaged dorsal fins on lake pen-held fish
were visible as white lines on their backs. Fish in pens
with little fin damage were relatively hard to detect. This
may lead to differential predation following stocking. In
addition the loss of fins may result in decreased
manoeuverability.
Fish culture literature has generally attributed
reduced fins to erosion or "rubbing" (Schneider and
Nicholson 1980, Gibson 1981, Moring 1982). While Boydstun
and Hopelain (1977) observed startled steelhead rubbing
their sides on net pens, it is hard to see how dorsal fins
would commonly contact abrasive surfaces. Given the
correspondence between attack sites and observed fin darnage
in aquaria and floating pens in this study, aggressive

interaction may be the major cause of fin damage in
hatchery salmonids.

VII. HIERARCHY STABILITY AND ANTICIPATORY AGGRESSION
INTRODUCTION
The postulate that social behaviour results in different
growth rates within a group due to an inequitable
distribution of resources requires that observed aggressive
behaviour be consistently non-randomly distributed amongst
individuals. This will result in dominants accruing
benefits and subordinates suffering losses. For aggression
to cause growth depensation in the week-long growth tests
of Chapter 11, it is necessary to assume that a fish with a
high aggressive output in a 30 s observation period would
be likely to show high aggression, relative to other fish,
in any other observation period, i.e., that position in the
hierarchy is constant over time. Constancy of social order
in juvenile salmonids has been shown in both experimental
and natural situations (~ewman 1956, ~amagishi 1962,
Jenkins 1969, Bachman 1984). However, due to my inability
to recognize individual fish, it was not possible to
establish in Chapter V that the same fish functioned as
dominants in each observation period, or that dominance
hierarchy coincided with size rank.

Implicit in the hypothesis that feeding causes
aggression is the assumption that aggression follows
feeding. Work by Adron et al. (1973) and Landless (1976)
shows that salmonids are capable of learning feeding times.
If this is the case in the present study, then some of the
observed aggression may have been due to the anticipation
- of feeding.
One purpose of this experiment was to investigate the
stability of dominance hierarchies of eight juvenile
steelhead (as used in Chapts. I11 and V) within a sampling
day and also on a day-to-day basis. More specifically, the
purpose was to determine the likelihood of a dominant in
one sample continuing as a dominant in other samples,
during the same day or week, and also to determine whether
they grew faster than the subordinates. A second purpose
was to establish whether food-linked aggression was due
solely to the presentation of food or if fish were behaving
aggressively in anticipation of a learned feeding time.
METHODS
Excess fish (approx. 100) of group 8 (Chapt. 111, Table 1 )
were maintained in a 136.2-1 flow-through aquarium for 30
days. Fish were fed Silvercup commercial food twice daily,
with occasional live food, under 96-1x illumination on a

natural photoperiod. The fish used were thus approximately
55 days old and socially experienced at the start of the
experiment. After a 2-day starvation period to eliminate
food from the gut, 50 fish were anaesthetised with MS 222
and their wet weights and lengths measured. Eight fish of
similar weight (.6564-.9368 g) were selected from isolated
- recovery vessels, and examined for identifying features.
Those that were not distinctively marked ( 3 ) were
re-anaesthetised and cold branded as described by Everest
and Edmondson (1967). To minimise damage, a number wll' was
applied at varying angles at the same location on one side
of the fish. After isolated recovery overnight, branded
fish did not appear to act differently from unbranded fish
(branded fish were subsequently ranked first and second in
the hierarchy). The eight experimental fish were installed
in a 45-1 flow-through aquarium at 10 C under a 11.5-h
photoperiod (96 1x1. Fish were fed twice daily at 1100 and
1500 h. Total ration of Silvercup was 10% of wet fish
weight. Fish were screened from movement in the room and
fed remotely.
On the first day after fish were placed in the
experimental tank they were observed for 20 minutes and
aggressive acts recorded for each fish individually on a
Batamyte 800 event recorder as in Chapter V. In addition,
it was possible to record lateral and frontal displays.
Recorded characteristic marks and brands were found

satisfactory for individual identification. On day 5
individual rates of aggression were recorded during 28,
5-min observation periods throughout the day. On day 6 the
fish were not fed but individual aggressiveness was again
recorded during 28, 5-min periods. Observation periods were
at irregular intervals throughout the day but clustered
- about the two feeding periods. Fish were then starved 2
additional days, anaesthetised and re-weighed. Although no
food was presented on day 6 the term "feeding time" will
still be used.
RESULTS
Summed ranks of each fish on days 5 and 6 are plotted
against rank on day 1 in Figure 34. Rank on day 1 is based
on the total number of aggressive acts given by each fish
in the 20-min observation period. On days 5 and 6, rank
within each 5 min interval was based on the number of
aggressive acts performed, and overall hierarchy position
for day 5 and day 6 was assigned according to the sum of
ranks attained during each day's 28 observation periods. A
comparison of ranks between sample periods on each of these
. days showed that individual fish were strongly associated
with characteristic hierarchy positions (Friedman 2-way
analysis of variance, P<.001) on both days.

RANK ON DAY 1
Figure 34. The relationship between the sum of ranks on days 5 & 6 and the rank on day 1 in a group of eight juvenile steelhead.

Although the overall distribution of rank was
different from day 5 to 6 (X~,P<.OI), positions 1 (alpha)
and 2 (beta) were held by the same fish. A similar
situation exists with regard to the changes from the
preliminary rank assessment on day 1: alpha and beta
positions were held by the same fish 4 and 5 days later,
- but otherwise only position 7 (on day 5) and 4 (day 6) were
again held by the same fish. The alpha and beta fish grew
faster than the other fish able 8).
Aggression on day 5 showed two peaks immediately
following feeding (~ig. 35A). Aggression appeared to
increase slightly before both feedings but decreased when
food was present. At this time fish were occupied searching
for and consuming pellets. Aggressi.on dropped to minimal
levels within 2 h following both peaks.
On day 6, major aggressive peaks occurred
approximately 0.5 h before "feeding" and major drops in
aggression coincided with the normal feeding times. At this
time the fish were nosing about on the bottom, yawning,
snapping, and holding near where food would arrive.
Aggression increased immediately following "feeding1' time
and then remained high throughout the day (total recorded
aggression for day 5 was 2174 acts and for day 6, 4827
. acts). The first "prefeed" aggressive peak resulted largely
from fighting between fish in hierarchy positions 5 and 3,
and between fish in positions 1 and 3. At one point the
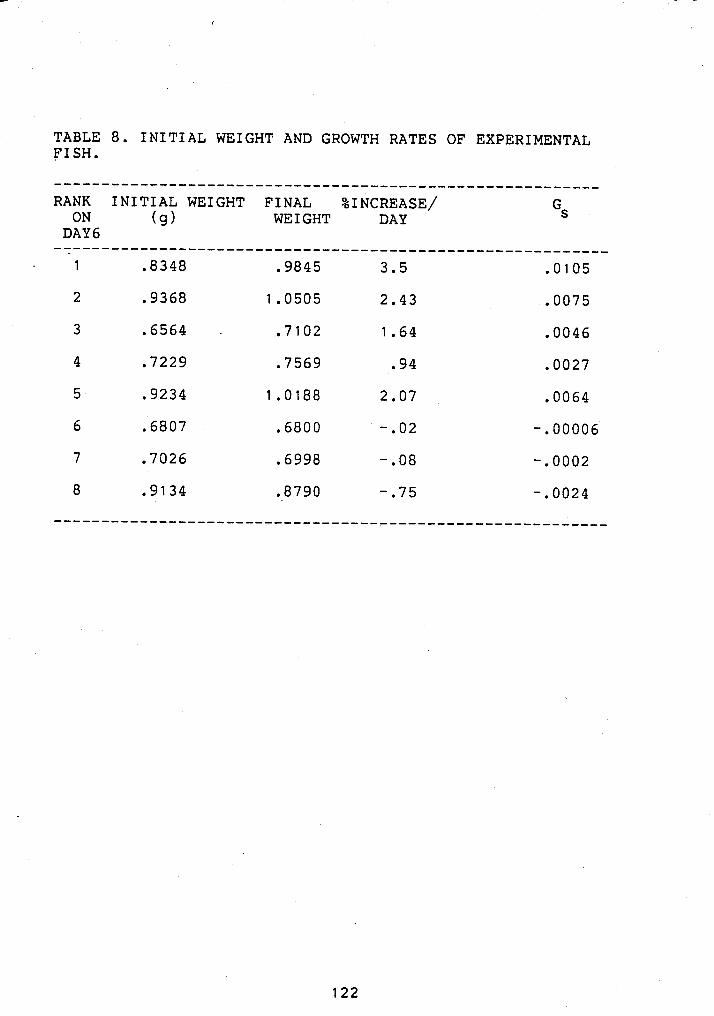
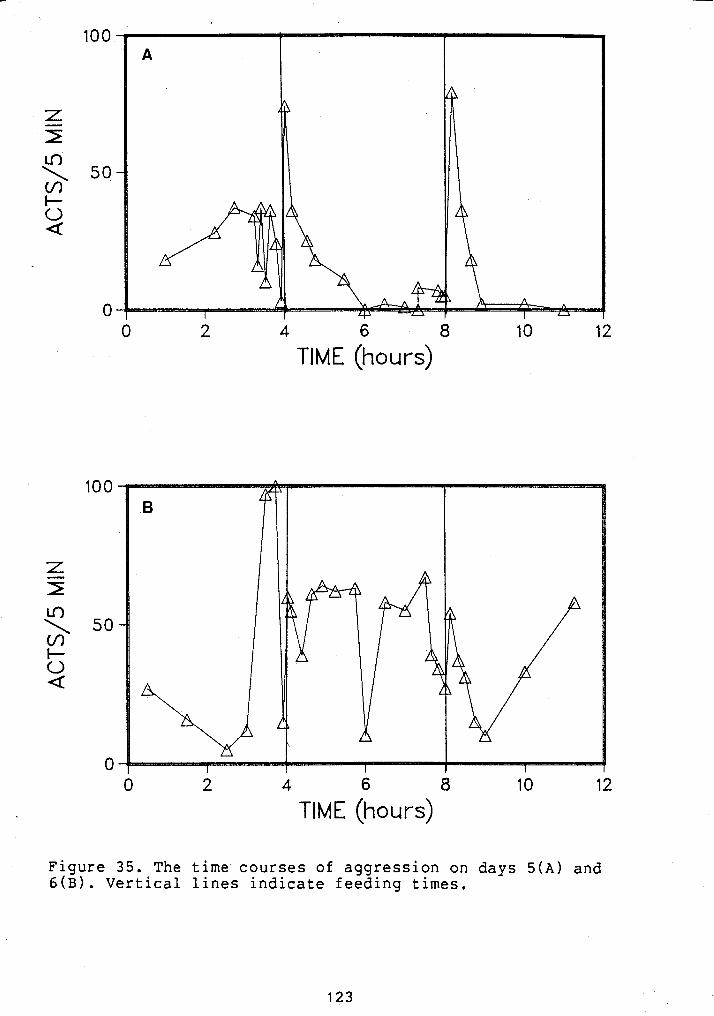
4 6 8
TlME (hours)
4 6 8
TIME (hours)
Figure 35. The time courses of aggression on days 5 ( A ) and 6 ( ~ ) . Vertical lines indicate feeding times.

latter two engaged in 4.61 min of continuous reciprocal
nipping, and the data point at time 3.75-h (~ig. 3 5 ~ )
underestimates the true number of acts. The second
"prefeed" peak represented the persecution of one fish by
several higher ranking fish.
DISCUSSION
The alpha and beta positions in a hierarchy of 8 fish were
found to be stable between sampling periods within one day
and from day-to-day over a period of 6 days. All positions
in the hierarchy were associated with particular fish on
each of the two days on which periodic sampling was
conducted. Several investigators have reported the
stability of observed hierarchies in salmonids and these
results support the conclusion that hierarchy positions,
especially alpha and beta, are persistent.
Newman's (1956) observations of a mixed species
population of wila salmonids showed hierarchy positions to
be unchanged over a period of 15 days. The outcome of
interactions between juvenile coho was found to be
predictable in groups of up to five fish (Chapman 1962).
Yamagishi ( 1962 ) recorded dominance position in 2 groups of
6 rainbow trout for 6 weeks during which only 4 and 9
position reversals occurred. Jenkins (1969) observed

manipulated and natural populations of trout (S. gairdneri - and - S. trutta) in streams and found rank, size, and spatial
position to be strongly associated and predictable for
individuals. In 3 groups observed over one month, 95%, 97%
and 98% of outcomes of encounters were predictable based on
the assigned ranks of each fish. Bachman (19841, although
rejecting conventional explanations of social interactions
based on territory or hierarchy formation, found success in
aggressive interactions and position fidelity to be
consistent for individuals.
Although hierarchy stability cannot really be
estimated over the short time scale analysed here, the
results generally agree with previous studies in showing
that the relationship between individuals is not random,
and that alpha and beta positions are extremely stable.
~elatively low stability in the lower ranks of this group
may have been affected by the choice of fish of similar
weights. This would be expected to reduce stability.
That growth advantages accrued to high ranking fish is
clearly illustrated in Table 8. This has also been a common
observation, with Yamagishi ( 1 9 6 2 ) ~ Carline and Hall (1973)
and ~i and Brocksen (1977) establishing close relationships
between dominance, food intake and weight gain in juvenile
salmonids. Because even slightly larger fish have a higher
probability of winning initial encounters (Abbott et al.
1985), weight ranking in Chapter I 1 1 probably reflected

behavioural rank.
Aggression rose prior to the regular feeding time on
both days 5 and 6 indicating that the fish were able to
monitor time and learn that some event (presumably the
introduction of food) was associated with a particular
time. Pre-feed levels of aggression on day 6 were extremely
high. The first of these peaks cannot be considered an
experimental result as no manipulation had taken place to
this point. The continuous nature of the aggression during
the first peak makes this point appear to be an anomaly.
During "feeding" time on both days there was a drop in
aggressive activity. On day 5 this was due to the fish
being pre-occupied with feeding. On day 6 the fish were
observed engaged in search behaviours normally associated
with feeding. The fishes' timing was exact within the
accuracy used in daily feeding.
Aggression rose following the normal "feeding" time
whether or not food was presented. This had a time course
similar to that of the 12-h feeding regimes shown in
Chapter V and generally similar to other time courses when
inter-feed intervals were greater than Ih. The major
difference between post-feeding aggression on days 5 and 6
was that the day 6 peaks were not as high and did not
extinguish; as a result total daily aggression was more
than twice as high. Although previous investigators have
differed on whether feeding causes overall aggression to

increase (~ewman 1956, Yamagishi 1962, Keenleyside and
Yamamoto 1962) or decrease (Symons 1968, 1971, Slaney and
Northcote 1974) , all authors working on the time course of
aggression have reported a post-feeding peak. Only Mason
(1966) working on coho salmon, reported an anticipatory
rise and an actual drop during feeding. Mason also reported
- that the level of post-feeding aggression was proportional
to the amount fed. Present observations of higher
aggressive peaks when fish were not fed do not support
Mason and are consistent with Slaney and Northcote's (1974)
findings.
This experiment established that fish observed as
dominants in successive samples in Chapter V were likely to
be the same fish, and that it was likely that the dominant
fish had been enjoying the material advantages of dominance
over the period of the growth experiment. In fact, all
positions in the hierarchy were stable from
sample-to-sample if not day-to-day, and alpha and beta
positions were stable over 6 days.

VIII. TESTS OF FEEDING REGIMES IN HATCHERY FACILITIES
I NTRODUCTI ON
The effect of fish behaviour on the production of
juvenile salmonids in hatcheries has received little
attention. The problems of size of facilities, numbers and
density of fish are compounded by the speed of movement and
difficulty of identifying and tracking individuals. The
science of ethology, excepting the study of colonial
insects, is generally practised upon individuals, small
groups, or easily separable subgroups (~ltmann 1974). Fish
culturists have rarely been able to observe their animals
and so have been required to observe the large scale, final
effects of their activities, e.g. conversion of food and
mean weight. As a result they are unable to separate any
social effects. Most major aquaculture texts (e.g. Bardach
et al. 1972) fail to supply any mention of social behaviour
beyond certain instances of cannibalism and growth
depensation in Penaiid shrimps.
Intensive culture of salmonids has been shown to have
strong and marked effects upon fish behaviour that may be
important when fish are removed to a wild situation.
Differences in vertical orientation, predator av'oidance,

reaction to cover and substrate choice, food choice and
recognition, and aggressive patterns of wild and hatchery
fish have all been recorded and may have far reaching
effects on survival and growth (Schuck 1948, Miller 1958,
Vincent 1960, Moyle 1969, Fenderson and Carpenter 1971,
Sosiak et al. 1979). However, social behaviour may also
- influence the crop of fish at the hatchery facility,
whether measured as hatchery production or as survival to
the fishery or spawning. Possible effects in large scale
facilities include slower growth rates, increased growth
variabilty, and stress affecting growth or susceptibility
to disease.
Growth variation may be of particular importance in
fish culture. Disparity in size may be an advantage where
fish are harvested directly from the hatchery depending on
market demands. In systems where fish are released to the
wild, a threshhold size is often required. For a "put and
take" fishery (no assumed or desired survival (~verhart et
al. 1975)) only those fish above the legal size limit are
useful products, therefore, the less the variance, the
lower the average size required to maximise the number of
catchable fish. Reduction of variance may be especially
important to anadromous fish that have a threshold size for
. resistance to salt water and successful smolting, including
coho and steelhead s ousto on 1961). Depending on the
processing of hatchery harvested fish, fin damage may be

disregarded, but planted hatchery fish as identified by
damaged fins are held in low esteem by sport fishermen
(whitlock 1974).
Following a laboratory investigation into the effect
of feeding regime on growth and aggressive behaviour
(Chapts. I 1 1 and V), the effects of feeding regime on
growth, size variance and fish quality in pen-reared and
hatchery populations of juvenile steelhead were tested.
Although experiments in aquaria were designed to indicate
the nature and mechanism of the effects, the results may
not be transferable to full size production facilities.
Several aspects of scale would suggest this; while fish
numbers and dimensions may be proportional to the size of
the pens, absolute size and swimming space are changed
greatly, allowing longer chase and flee distances. The
greater numbers probably preclude individual recognition
and resulting hierarchy stability (~arnard and Burk 1979).
The number of intruders is increased and the area is much
larger than any economically defendable territory ill
1978b); in fact, food is sometimes dispersed over a larger
area than a conventionally defended territory. These
reasons are enough to suggest that fish in pens may respond
differently from small aquarium populations and it was
considered necessary to test several feeding regimes in
pens.

Selection of feeding regimes was influenced by several
constraints. First, the maximum growth required by
production facilities dictated normal high rations. The
information in the literature (reviewed in Chapt. 111)
suggests frequent feeding to achieve high growth which
agrees with results obtained here (Chapt. 111). Current
- ~ritish Columbia Fish and Wildlife Branch practice involves
feeding at 20-min to 2-h intervals (P. Slaney, B. C. Fish
and Wildlife Branch, pers comm). It was decided to test the
extremes of this range and two alternative feeding methods
in pens: ( 1 ) very frequent feeding (5-min intervals), and
(2) feeding throughout the day and night (2-h interval
times 24). Night feeding was selected in the event that
fish are able to feed at very low light levels. In the .
hatchery, random intervals averaging 30 min (range 1 to 60)
were compared with a control of a regular 30 min feeding
interval. The effects of these regimes in production
facilities were examined by measuring growth and dorsal fin
damage.
METHODS
Pen Experiments:
Experiments were conducted from Oct. 1 to Dec. 1, 1982
in four, 2.44 m x 2.44 m x 2.44 m floating net pens at the

Canadian Forces Base Chilliwack bridging ponds adjacent to
the Chilliwack River. Four groups of 1250 Chilliwack River
winter-run steelhead (1982 brood) were removed from 2275-1
circular tanks at the Fraser Valley Trout Hatchery and
transported by truck to the bridging ponds. Two pens
designated as A-1 and A-2 were covered by a shed. Two other
pens, B-1 and B-2, were covered with black polyethylene
sheeting to keep the ambient light levels as similar as
possible. Fish in pen A-1 were fed at 30-min intervals, A-2
at 5-min intervals, B-1 at 2-h intervals for 24-h,and B-2
at 2-h intervals for a 12-h day. All pens recieved equal
total daily rations delivered from suspended hoppers closed
with a circular plate. Spinning of the plate at feeding
time scattered feed over most of the surface of the pens.
Rations of Silvercup feed were determined using Iwama and
Tautz's (1981) growth equation for a 2.2:1 food to biomass
conversion ratio. Water temperatures ranged from 9 to 6 C
and daylength from 11.67 to 8.45 h.
Weekly sampling was conducted on 60 fish per pen. ~ i s h
were captured by lifting the net at one corner of the pen
to concentrate the fish; the apgroximate number were then
dipped out and transferred to 77-1 containers. Fish were
transported by truck, approximately 250 m to buildings
- where power was available.
Fish were anaesthetised in 2,phenoxy-ethanol and
weighed on a Mettler P-1200 dual range electric balance.

Fork Length and length of the first dorsal fin ray were
measured and a subjective estimate of dorsal fin damage was
made. Damage (estimated fin loss) was ranked on an integer
scale of: 0, no damage; 1 , 0 to 25% damage; 2, 2 5 to 50%
damage; 3, 50 to 75% damage; and 4, 7 5 to 100% damage.
Hatchery Experiments:
Experiments were conducted from Nov. 15 to Jan. 10,
1982 in 2 2 5 0 - 1 circular flow-through tanks at the Fraser
Valley Trout Hatchery. A random feeding interval was tested
against a regular feeding interval at the Fraser Valley
Trout Hatchery. The regular feeding regime consisted of 0.5
kg Silvercup feed per day distributed every 30 min. The
random regime consisted of an equal ration distributed with
an average interval of 30 min and a range of 1 - 60 min.
Natural lighting prevailed and the temperature was a
constant 9.6 C. Samples were taken approximately weekly by
netting 60 fish which were handled and measured in the same
manner as the pen-held fish.

RESULTS
Pen Experiments:
The initial average sizes of fish groups assigned to
pens were significantly different from one another (ANOVA,
p<.05), possibly indicating an unconscious bias in
technique or sampling error. The final weights were also
significantly different (ANOVA, p<.05) but throughout the
experiment weights were similar, had a similar range and
generally appeared to follow a similar growth pattern (~ig.
36). The relative ranking of groups was also inconsistent,
all groups' except the 5-min interval regime were ranked
first on at least one occasion and all groups we,re ranked
last on at least one occasion. In addition, all groups lost
weight during at least one period. Thus, no feeding group
exhibited superior growth. Growth coefficients (Gc) ranged
from .49 to .79.
The size variance of all groups increased with time.
Variances were homogeneous at all except two sample dates
(0ct. 25 and Nov. 22) (F max test, p>.05), hence the use of
ANOVA for testing differences of the initial and final
means. Coefficients of variation were tested by an F max
test of squared coefficients of variation, as suggested by
Lewontin (1966). No significant differences were noted
except on October 25, the date of maximum range (p<.05,.
Fig. 37). Again no consistent trend was obvious. The weight
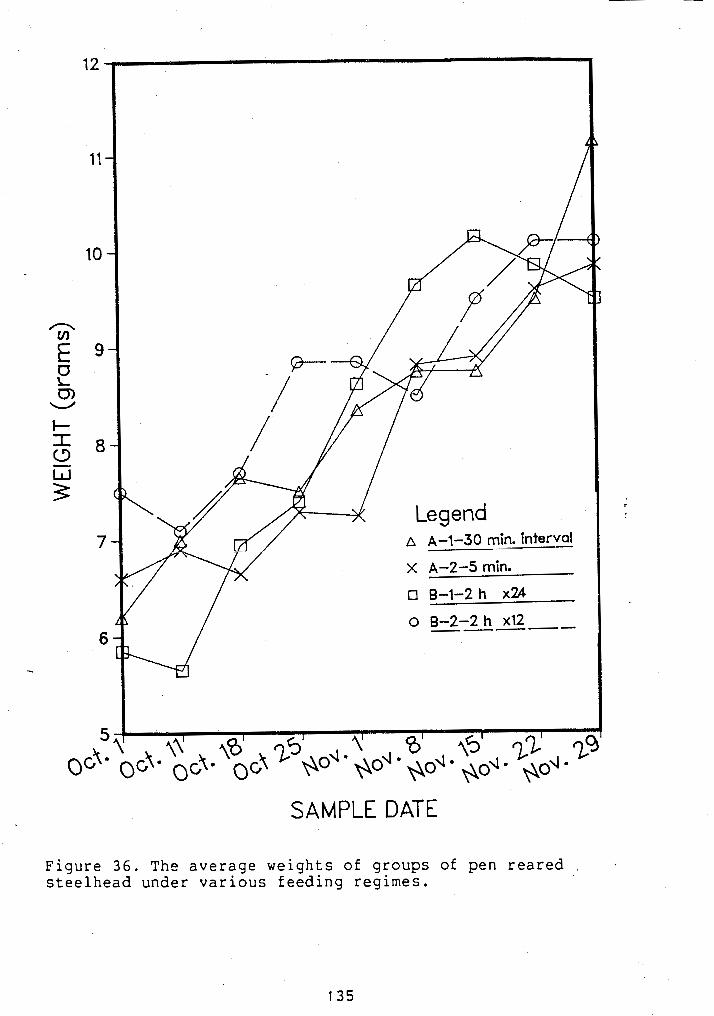
SAMPLE DATE
Figure 36 . The average weights of groups of pen reared s tee lhead under var ious feeding regimes.

A-1-30 min. interval
A-2-5 min.
8-1-2 h x24
SAMPLE DATE
Figure 37. The co-efficient of variation of groups of pen reared steelhead under various feeding regimes.

of individual fish in each of the final samples was
normally distributed (~olmogorov-Smirnov test, p.05).
Dorsal fin heights generally declined with time (~ig.
3 8 ) . Fins were generally highest in pen B-2 and shortest in
pen A - 2 . Significant differences occurred, but again no
clear pattern presents itself. The subjective measure of
fin damage generally agreed with the objective measure but
revealed less distinction between regimes.
Hatchery Trials:
Both groups had very similar initial weights and grew
at similar rates. Weights were not significantly different
at any subsequent time (Student's t test, P>.05) although
the random group had a significantly higher final weight
(p< .05, Fig. 39). Growth coefficients were high: 1.17
(regular) and 1.25 (random). Initial weight loss of the
randomly fed group coincided with a feeder malfunction.
Size variances increased with weight and remained
heterogeneous (F max test, pc.05): the weights of randomly
fed fish were less variable than those of regularly fed
fish (Fig. 40). Coefficients of variation diverged steadily
after the first half of the experiment and were
significantly different for the last sample dates (F test
of squared co-ef f icients of variation, p<.05, Fig. 40).
Both final samples were normally distributed

Legend l A-1-30 min. interval
< A-2-5 min.
3 8-1-2 h x24
1 8-2-2 h, x12 -----
SAMPLE DATE
Figure 38. The average dorsal fin heights of groups of pen reared steelhead under various feedins reaimes.

Sample Date
Figure 39. The average weight of 2 groups of hatchery-reared steelhead under different feeding regimes.

Legend a Regular
X Random
Sample Date
Figure 40. The co-efficient of variation of 2 qroups of hatchery-reared steelhead under different feeding ;egimes.

(~olmogorov-Smirnov test, p>.05),
Fin size of randomly fed fish was always smaller than
that of regularly fed fish by 0.2 to 1.2 mm (Fig. 41); the
difference was significant on three occasions (Student's t
test, p<.05). Subjective measure of fin damage revealed
less distinct diffferences.
DISCUSSION
Pen Experiments:
A test of four feeding regimes in floating net pens
did not reveal any clear, consistent superiority or trends
in measures ef g r m t h (weight), growth variation, or dorsal
fin damage. Growth coefficients (G were low compared to C
those measured at various B.C. salmonid production
facilities (Iwama and Tautz 1981). However, the fish were
behind hatchery weight goals at the start of the experiment
and would not have reached a threshold of approximately 50
g by the smolting period. The initial differences in weight
at the beginning of the experiment was due to the entire
contents of a hatchery circular tank being transferred to a
single pen. Although the original tanks had received
similar treatment, differences obviously existed. These
differences did not dictate the subsequent growth

Legend A Regular
X Random
SAMPLE DATE
Figure 41. The average dorsal fin height of 2 groups of hatchery-reared steelhead under different feeding regimes.

performance as relative ranking changed frequently.
The interpretation of the 2-h interval (X 24 h)
feeding regime presents certain problems. Hours of daylight
decreased from 11.67 to 8.45-h over the course of the
experiment. After a loss of weight in the first week,
consistently high growth rates were recorded until the last
2 samples. This regime could therefore be advantageous if
daylight hours are greater than some threshold. Since other
pens were fed for 12 h/day, 24-h feeding could be an
advantage when daylength is greater than 12-h, especially
if fish are fed more than can be processed in 12-h. Since
the 24-h regime received approximately 1/2 of it's food
during the daylight hours, this may suggest an improved
digestive efficiency to maintain equivalent growth or, more
probably, overfeeding in the 12-h pens.
The lack of major differences between the pens may be
a result of the age of the fish. Gunnes (1976) found that
grading Atlantic salmon prior to 6 months of age reduced
subsequent size variability. These fish may have
established certain growth characteristics prior to this
experiment. The reduction in activity and growth due to
seasonal effects also may account for the small differences
noted.

Hatchery:
The randomly fed group performed better than the
regularly fed controls. Final weight was significantly
higher even though the initial weight was lower. Growth
variation increased faster in regularly fed fish and was
significantly higher. Fin damage, measured by dorsal fin
height, was greater in the randomly fed group, thus
contradicting any simple hypothesis that the amount of fin
damage and growth variation should be related in the same
manner to aggression.
Growth performance of both groups was excellent
relative to recorded growth coefficients of steelhead in
other B.C. production facilities (1wama and Tautz 1981) .
projection of this growth rate until April would give an
average size of 89 g, considerably above the normal
smolting threshold. Assuming that a normal distribution of
size persisted, only 10% of the randomly fed smolts would
be below 60 g, as opposed to 16% of the regularly fed
smolts (Fig. 42). This would occur even without any further
increase in coefficient of variation. If coefficient of
variation also increased owing to random feeding over the
entire freshwater growth period, the difference in
performance would be magnified. It is to be expected that
this will increase production of smolts with no loss of
total size, but there are other factors to be considered in
this type of analysis. These are discussed in Chapter IX.
1 4 4

Legend REGULAR - - - RANDOM
Figure 42. The projected size distributions, at smolting age, of random and regularly fed juvenile steelhead. The vertical line represents a size threshold for successful smolting. The hatched area represents the difference in smolt production.
Any recommendation of random feeding on this basis
assumes that the saving achieved by uniform growth is
greater than losses due to reduced dorsal fins. No work
detailing the quantitative effects of reduced dorsal fins
on survival is known, but the absolute difference between
the two groups is only about 1 mm and the modal subjective
measure of fin damage for both groups was in the 50%
erosion category. The difference in this case may not be
biologically significant. Only five categories were used in
the subjective measure of fin damage; since this entails
the observer making a guess as to how much dorsal fin
should be there, a greater number of categories is not
realistic. Since group averages were closely clustered in
similar.categories the actual measurement of dorsal fins is
recommended for better discrimination of differences.

IX. CONCLUSIONS
This series of experiments has attempted to reveal
some of the relationships between feeding and growth
characteristics, particularly variability, and between
feeding and aggression, in juvenile steelhead. Specifically
this study has found that:
aggression occurs in floating lake rearing pens and
laboratory research shows that this behaviour is
responsible for observed patterns of fin damage
(Chapts. I1 and VI);
grouped fish display greater growth variation than
socially isolated fish (Chapt. 111);
social aspects other than differential food intake are
responsible for some growth variability (Chapt. IV);
increased feeding frequency causes greater growth and
less variability relative to the growth rate (~hapt.
111);
timing of feeding does not affect total levels of
aggression but does cause short term changes in
aggression ar~und feeding (Chapt. V);
the high ranking positions in small hierarchies are
relatively stable and correlated with a high growth
rate (Chapt. VII);
juvenile steelhead can accurately learn their feeding
times (Chapt. ~11); and
the growth and growth variability of pen-held juvenile
steelhead was unaffected by the the experimental
feeding regimes, but under a random feeding regime
growth was increased and growth depensation decreased
relative to a regularly fed control group in hatchery
circular tanks (~hapt. VIII).
The purposes of this concluding discussion are: to
consider the usefulness of present models of optimal
territory size for the purpose of generating predictions
that are testable in situations as complex as the wild
environment of juvenile salmonids; to investigate the
function of aggression as a mechanism of resource
allocation; to examine the relevance of the experimental
situation to wild fish; and to demonstrate the importance
of reducing growth depensation in hatchery production.
Schoener's (1983) publication was titled "Simple
models of optimal feeding territory size; a
reconciliation." While the models themselves are
mathematicly simple and brief, the predictions are not
necessarily simple (Figure 6c, Table 1, Schoener 1983), and
the problem of testing the array of predictions, or of
choosing the right model to fit a particular test situation
are anything but simple. Predictions based on food density
alone are simple enough (but see Ebersole 1 9 8 0 ) ~ but
because food density and intruder pressure are
inter-dependent, food density can rarely be isolated as a
determinant of territory size in natural systems. Most
studies of salmonid aggression have been confounded by a
complex of different intruder regimes superimposed upon
different experimental feeding regimes. In addition the
existence of a continuum from territories to hierarchies
raises the question of what is intruder pressure? Kalleberg
(1958) and Puckett and Dill (1985) have described salmonid
"floaters" that exist on and between territories; they are
allowed to remain there as long as they exhibit
non-threatening, non-aggressive behaviour. Thus it is clear
that,intruder pressure is not just a question of numbers
but also a matter of the initiation of certain behaviours
by the intruders. This returns us to the question
considered by Rowel1 (1974) and Wade (1978) (discussed in
Chapt. V): Is it the dominant or subordinate that initiates
aggression? Full understanding of territorial behaviour, in
salmonids at least, must await the resolution of this
quest ion.
The reasoning behind experiments in Chapters 111 and
IV, and much of the relevant literature, is that
"aggression causes growth depensation, therefore, more
aggression should cause more growth depensation". This was
explicitly stated by Magnuson (1962) and Yamagishi (1962).
More recent authors, while accepting that social
interactions are a major cause of growth depensation, have
not monitored aggression (Jobling 1982, 1983, Koebele
1 9 8 5 ) . The reduction of aggression and more economical
distribution of resources is generally considered a benefit
of hierarchies. Rowel1 ( 1974) challenged this viewpoint,
asserting that the reduction of aggression observed as
hierarchies formed in new groups was a reduction from
unnaturally high levels to a normal situation. Wade (1978)
argued against this assertion and Barnard and Burk (1979)
provided additional theoretical evidence that a well
developed social order is the most efficient means of
dividing resources.
Since the experimental apparatus was so different from
the natural surroundings of juvenile steelhead, it is
necessary to consider whether the results hold any
relevance for natural situations. Fish in this study were
probably more stressed than is usual in the wild. Fish and
'other animals tend to have hyperactive adrenals when in
captivity and in hierarchies (Rowell 1974). This and the
inability to emigrate could have forced behavioural
decisions not normally observed. However, I contend that
the experimental environment bears similarities to certain
normal juvenile steelhead habitats. Personal observation
shows that immediately after hatching, steelhead
approximately 25-30 mm in length are found in shallow
margins of streams where there is low water velocity. The
boulders or gravel there create small pockets along the
shoreline that are almost isolated from the main stream.
During heavy hatches of steelhead, up to six individuals
may occupy a pocket at a density greater than in these
experiments. For example, on May 25,1985 a sheltered
cutting in the bank of the Stamp River was observed to
contain upwards of 40 juvenile coho salmon (25 -40 mm long)
in a space approximately 1.3 m long, 0.4 m wide and up to
0.35 m deep. The end of this backwater, partially isolated
from the main body, contained 11 fish in an area 0.4 m
long, 0.2 m wide and 0.1 m deep. In 5 min, 37 aggressive
acts (as defined earlier) occurred. The density in this
case is considerably greater than in the experimental
apparatus and the frequency of aggression comparable.
Northcote ( 1 9 6 2 ) reports similar aggregations of juvenile
rainbow trout along the margins of streams at night.
Mortality rather than growth depensation is likely to be
the result of these early interactions, as Chapman ( 1 9 6 2 )
and Mason and Chapman ( 1 9 6 5 ) have documented the importance
of success in early encounters. High density and

confinement can also occur when side channels dry up and
fish are concentrated in isolated pools by old cut banks or
root wads. For example, I have observed a group of
approximately 20 juvenile coho salmon in a pool (1.2 m in
diameter and 0.3 m deep) 50 m from the mainstem of the
Stamp River. These fish persisted from May at least until
September, 1984. Similar situations exist for steelhead.
This high density and lack of stream drift create marginal
feeding conditions that are similar to the present
experimental set up. I conclude from these field
observations that natural conditions similar to those
created in these experiments exist, at least for short but
crucial periods.
Anadromous fish smolt through a physiological size
window. Fish below the lower size threshold are unlikely to
survive the transition to salt water and either die or
remain in freshwater. Salmonids that are above the upper
threshhold may have an increased chance of male precocial
maturity (~ilton 1978) with early return to the home stream
at a smaller than normal size (Maher and Larkin 1955,
Parker and Larkin 1959). Small steelhead smolts when reared
in lake-pens or hatcheries are thought to remain in
freshwater, rather than migrate to sea (Slaney and Harrower
- 1981). Any of these instances may be considered lost
production from the viewpoint of fishery management. Figure
43A shows two normal curves with the same means and
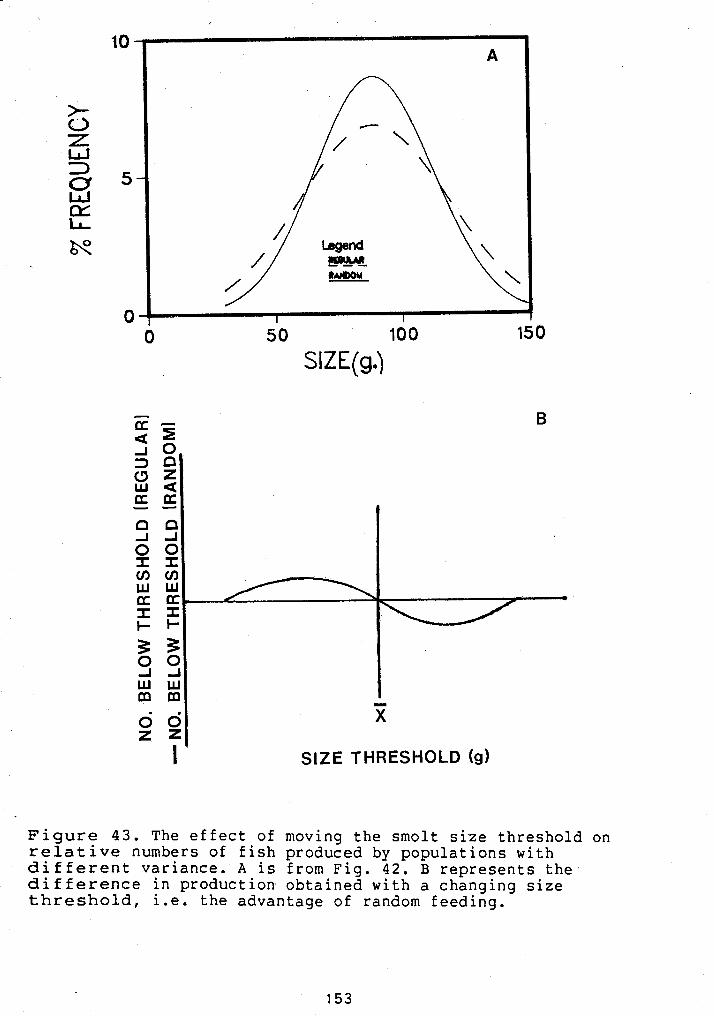
SIZE THRESHOLD (g)
F i g u r e 43. The effect of moving the smolt size threshold on r e l a t i v e numbers of fish produced by populations with d i f f e r e n t variance. A is from ~ i g . 42. B represents the d i f f e r e n c e in production obtained with a changing size t h r e s h o l d , i .e. the advantage of random feeding.

different variances. The advantage (difference in number of
smolts above a size threshold) of a low coefficient of
variation depends on the proximity of the size threshold to
the mean. The difference in number of smolts lost is given
in Figure 43B. If the group average does not exceed the
threshold size the group with the higher variation will
actually be at an advantage. A family of curves following
this pattern exists with the magnitude of the values
dependent on the relative levels of variation in the two
groups. A similar but inverted line could represent the
effect of an upper threshold.
Recommendations:
Aii the r e s u l t s from the laboratory experiments
suggest that juvenile steelhead should be fed frequently
for optimal growth and minimal size variability. The fact
that a clear cut pattern of aggressive peaks breaks down at
feeding intervals less than one hour indicates some change
at the behavioural level, but the significance of this is
not understood.
Because juvenile steelhead learn feeding times
accurately and exhibit anticipatory aggression, random
feeding may eliminate this portion of aggression. The
feeding regimes of growth trial 5 are inconclusive
considering the high mortality rate of this group and their
generally stressed appearance. Random feedings show
potential for further investigation due to the success
achieved in hatchery experiments, although the logistics of
feeding fish randomly may be impractical as random
capabilities are not generally found on commercial fish
feeders. A pseudo-random regime such as frequent, irregular "
hand feeding as a supplement to a regular regime may have a
beneficial effect.
production scale experiments with feeding regimes
should be initiated at an early stage in the fish's life.
Since fish are growing fastest (in % weight increase) at
this time there should be the greatest potential for
significant changes.
Although not specifically tested here, food should be
distributed over a wide area to prevent concerted defence
of a point source. Although it was not possible to find a
correlation between growth depensation or aggressive damage
and feeding regime, the potential post-release mortality
due to the effects of fin damage indicate that it could be
a major cause of production losses. Field studies on the
effect of damaged fins on post-release survival should be
undertaken to quantify the effect and determine the
potential benefit of reduction of fin damage.

LITERATURE CITED
Abbott, J.C., Dunbrack, R.L. and Orr, C.D. 1985. The interaction of size and experience in dominance /" - relationships of juvenile steelhead trout (Salmo gairdneri) . ~ehaviour 92:241-253.
Adron, J., Grant, P O T , and Cowey, C.B. 1973. A system for the quantitative study of the learning capacity of rainbow trout and its application to the study of food /
. preferences and behaviour. J. Fish ~iol. 5:625-636.
Altmann, J. 1974. Observational study of behaviour: sampling methods. Behaviour 49: 227-267.
Bachman , R. A. 1 984. Foraging behavior of f ree-ranging wild and hatchery brown trout in stream. Trans. Am. Fish. SOC. 113: 1-32.
Baerends, G. P. , Baerends-van Roon, J.M. 1950. An introduction to the study of the ethology of Cichlid fishes. ~ e h a v i o u r Suppl. 1 : 1-243.
Bardach, J.E., Ryther, J.H. and McLarney, W.O. 1972. Aquaculture : The farming and husbandry of freshwater and marine organisms. Wiley Interscience, New York. 860 PP
Barnard, C. J. and Burk, T. 1979. Dominance hierarchies and the evolution of "individual recognition". J. Theor. Biol. 8 1 : 65-73.
Beggs, G.L., Holeton, G.F. and Crossman, E.J. 1980. Some physiological consequences of angling stress in muskellunge, Esox masquinonqy Mitchill. J.Fish Biol. 17: 649-659.
Bilton, H.T. 1978. Returns of adult coho salmon in relation to mean size and time of release. Can. Fish. Mar.Serv. Tech. Rep. 832:73pp.
J
Boydstun, L.B. and Hopelain, J.S. 1977. Cage-rearing of steelhead rainbow trout in a freshwater impoundment. ?/ Prog, Fish Cult. 39:70-75.
Brett, J.R. 197 1 . Satiation time, appetite and maximum food intake of sockeye salmon (~ncorhynchus nerka). J. ~ish. Res. Board Can. 28:409-415.
Brett, J.R. 1979. Environmental factors and growth. Pp 599-677 in ~ i s h Physiology, Vol VIII. W.S. Hoar, D.J.

Randall and'J.R. Brett (eds). ~cademic Press, New York.
Brown, J.L. 1964. The evolution of diversity in avian territorial defense systems. Wilson Bull. 76:160-169.
Brown, M.E. 1946. The growth of brown trout (Salmo trutta). I. Factors influencing the growth of trout fry. J. Exp. - - - - Biol. 22:118-129.
Carline, R.F. and Hall, J.D. 1973. Evaluation of a method for estimating food consumption rates of fish. J. Fish. Res. Board Can. 30:623-629.
* Chapman, D.W. 1958. studies on the life history of the J
Alsea River steelhead. J. Wild. Manag. 22:123-134.
Chapman, D.W. 1962. Aggressive behaviour in juvenile coho salmon as a cause of emigration. J. Fish. Res. Board v" Can. 19:1047-1080.
Chapman, D.W. 1966. Food and space as regulators of sal-monid populations in streams. Am. Nat. 100:345-357.
Cole, K.S. 1976. of young rai origin. M.Sc
Soc ia nbow t . thes
1 behaviour and social o rout, Salmo qairdneri, o is, Univ. Guelph. 100pp.
rganisation f hatchery
Dawkins, R. 1982. The extended phenotype: the gene as the unit of selection. W.H.Freeman and Co, Oxford. 307pp.
Dill, L.M, 19?8a. Aggressive distance in juvenile coho salmon (Oncorhynchus kisutch). Can. J. 2001. 56:1441-1446.
Dill, L.M. 1978b. An energy based model of optimal feeding-territory size. Theor. Pop. Biol. 14:396-429.
Dill, L.M., Ydenberg, R.C, and Fraser, A.H.G. 1981. Food abundance and territory size in juvenile coho salmon (Oncorhynchus kisutch). Can. J. 2001. 59:1801-1809.
Donnelly, W.A. and Dill, L.M. 1984. Evidence for crypsis in coho salmon, Oncorhynchus kisutch (Walbaum), parr: substrate colour preference and achromatic reflectance. J.Fish Biol. 25:183-195.
Ebersole, J.P. 1980. Food density and territory size: an alternative model and a test on the reef fish (Eupomacentrus leucostictus). Am. Nat. 115:492-509.
Ejike, E. and Schreck, C.B. 1980. Stress and social hierarchy rank in coho salmon. Trans. Am. Fish. Soc. 109:423-426.

Elliott, J.M. 1975. The growth rate of brown trout fed on maximum rations. J. ~nim. Ecol. 44:805-821.
Erickson, J.G. 1967. Social hierarchy, territoriality, and stress reactions in sunfish. ~hysiol. Zool. 40:84-90.
Everest, F.H. and Edmundson, E.H. 1967. Cold branding for field use in marking salmonids. Prog. Fish Cult. 29:175-176.
Everhart, W.H., Eipper, A.W and Youngs, W.D. 1975. principles of fishery science. Cornell Univ. Press, I thaca .
Fagerlund, U.H.M., Mc~ride, J.R. and Stone, E.T. 1981. Stress related effects of hatchery rearing density on coho salmon. Trans. Am. ~ i s h Soc. 110:644-649.
Fenderson, O.C. and Carpenter, M.R. 1971. Effects of crowding on the behaviour of juvenile hatchery and wild / landlocked ~tlantic salmon (~almo salar L.). ~nim. Behav. 19:439-447.
Francis, R.C. 1983. Experiential effects on agonistic behaviour in the paradise fish, Macropodus operculatus. Behavior 85:292-313
Frey, D.F. and Miller, R.J. 1972. The establishment of dominance relationships in the blue gourami, Trichoqaster leeri (pallus). Behaviour 42:8-62.
Gall, G.A.E. and Gross, S.J. 1978. Genetic studies of growth in domesticated rainbow trout. Aquaculture 13:225-234. d
Gauthreaux, S.A. Jr. 1978. The ecological significance of behavioural dominance. Pp 17-54 in perspectives in Ethology, Vol 3. P.P.G. Bateson, P.H. Klopfer (eds) Plenum Press, New York.
Gibson, R.J. 1981. Behavioural interactions between coho salmon (Oncorhynchus kisutch), Atlantic salmon (Salmo salar), brook trout (~alvelinus fontinalis) and steelhead trout (~almo qairdneri), at the juvenile
v'
fluviatile stages. Can. Tech. Rep. Fish. Aquat. Sci. 1029: 1 l6pp.
Greenberg, B. 1947. Some relations between territory, social hierarchy and leadership in the green sunfish (~epomis cyanellus). Physiol. Zool. 20:267-299.
Gunnes, K. 1976. Effect of size grading young Atlantic salmon (Salmo salar) on subsequent growth. Aquaculture

Hartman, G. F. 1965. The role of behaviour in the ecology of underyearling coho salmon (Oncorh nchus kisutch) and steelhead trout (Salmo gairdneri J. Fish. Res. Board Can. 22:1035-1052.
+ Hixon, M.A. 1980. Food production and competitor density as
the d.eterminants of feeding territory size. Am. Nat. 115:510-530.
Hoar, W.S. 1951. The behaviour of chum, pink and coho 2" salmon in relation to their seaward migration. J. Fish. Res. Board Can. 8:241-263.
Houston, A.H. 1961. Influence of size w o n the ada~tation of steelhead trout, Salmo qairdneri; and chum kalmon, / Oncorhynchus keta to salt water. J.Fish. Res. Board Can. 18:401-415.
Iwama, G.K. and Tautz, A.F. 1981. A simple growth model for salmonids in hatcheries. Can. J. Fish. Aquat. Sci. 38:649-656.
Jenkins, T.M., Jr. 1969. Social structure, position choice and microdistribution of two trout species (Salmo v' trutta and S. qairdneri) resident in mountain streams. Anim. ~ehav7~onogr. 2:l-123.
Jobling, M. 1982. Some observations on the effects of feeding frequency on t h e food intake and growth sf plaice Pleuronectes platessa L. J. Fish. Biol 20:431-444.
Jobling, M. 1983. A short review and critique of methodology used in fish growth and nutrition studies. J. Fish Biol. 23:685-703.
Jobling, M. 1985. Physiological and social constraints on growth of fish with special reference to arctic charr, Salvelinus alpinus L. Aquaculture 44:83-90.
Jobling, M. and Wandsvik, A. 1983. Effect of social interactions on growth rates and conversion efficiency of Arctic charr, Salvelinus alpinus L. J. Fish Biol. 22:577-584.
Kalleberg, H. 1958. Observations in a stream tank of territoriality and competition in juvenile salmon and ,
trout. Inst. Freshwater Res. ~rottningholm Rep. 39: 55-98.
Keenleyside, M.H.A and Yamamoto, F.T. 1962. Territorial

behaviour of juvenile Atlantic salmon (Salmo salar). Behaviour. 19:139-169.
Koebele, B.P. 1985. Growth and the size hierarchy effect: an experimental assessment of three proposed mechanisms; activity differences, disproportional food acquisition, physiological stress. Env. Biol. Fishes 12:181-188.
Krebs, J.R. 1978. Optimal foraging: decision rules for predators. Pp 23-63 in Behavioural Ecology: an evolutionary approach. J . R . Krebs and N.B. Davies (eds). Blackwell Scientific Publications, Oxford.
Landless, P.J. 1976. Demand feeding behaviour of rainbow trout. Aquaculture 7:11-25.
arki in, P.A., Anderson, G.C.! Clemens, W.A. and Mackay, D.C.G. 1950. The production of Kamloops trout (Salmo gairdneri) in Paul lake, B.C. Sci. Publs. B.C. Game
A Dept. no. 1. 37pp.
Le Cren, E.D. 1965. Some factors regulating the size of populations of freshwater fish. Mitt. Internat. Verein. Limnol. 13:88-105.
~ewontin, R.C. 1966. On the measurement of relative variability. Syst. Zool. 15:141-142.
&i, H.W, and Brocksen, R,w, !9??, Approaches to the analysis of energetic costs of intraspecific competition for space by rainbow trout (Salmo qairdneri). J. Fish. Biol. 11:329-341.
McFadden, J.T. 1969. Dynamics and regulation of salmonid J populations in streams. Pp. 313-329 in Salmon and trout in streams. T. G. Northcote (ed.) H. R. MacMillan Lect. in Fisheries, Univ. British Columbia, Vancouver, B.C.
McNicol, R.E. and Noakes, D.L.G. 1984. Environmental influences on territoriality of juvenile brook charr, Salvelinus fontinalis, in a stream environment. Envir. Biol. Fishes 10:29-42.
MacPhee, C. 1961. An experimental study of competition for J
food in fish. Ecology 42:666-681.
Magnuson, J.J. 1962. An analysis of aggressive behaviour and competition for food and space in medaka (Oryzias latipes), Pisces, Cyprinodontidae. Can. J. Zool. 40:313-363.
Maher, F.P. and Larkin, P.A. 1955. Life history of the

steelhead trout of the Chilliwack River. Trans. Am. /' Fish. Soc. 84:27-38.
Mason, J.C. 1966. Behavioural ecology of juvenile coho salmon (~ncorhynchus kisutch) in stream aquaria with particular reference to competition and aggressive -
behaviour. Ph.D. Thesis. Oregon State Univ, Corvallis. ' 9 5 ~ ~
Mason, J.C. 1976. Response of underyearling coho salmon to supplementary feeding in a natural stream. J. Wildl. / Manag. 40:775-788.
' Mason, J.C. and Chapman, D.W. 1965. Significance of early emergence, environmental rearing capacity and behavioural ecology of juvenile coho salmon in stream channels. J. Fish. Res. Board Can. 22:173-190.
Maynard Smith, J. and Parker, G.A. 1976. The logic of asymmetric contests. Anim. Behav. 24:159-175.
Mazeaud, M.M., Mazeaud, F. and Donaldson, E.M. 1977. Primary and secondary effects of stress in fish: some new results data, with a general review. Trans. Am. Fish. Soc. 106:201-21'2.
Miller, R.B. 1958. The role of competition in the mortality of hatchery trout. J. Fish. Res. Board Can. 15:27-45.
Moring, J.R. 1982. Fin erosion and culture related injuries of chinook salmon raised in floating pens. Prog. Fish Cult. 44:189-191.
Moyle, P.B. 1969. Comparative behaviour of young brook trout of domestic and wild origin. Prog. Fish Cult. 31 :51-59.
Newman, M.A. 1956. Social behaviour and interspecific ,,
competition in two trout species. Physiol. Zool. 29:64-81.
Noakes, D.L.G. 1978. Social behaviour as it influences fish production. Pp 260-282 in Ecology of freshwater fish
J production. S.D. Gerking (ed.) Blackwell, Oxford.
Noakes,D.L.G., and Leatherland, J.F. 1977. Social dominance and interrenal cell activity in rainbow trout, Salmo qardneri (~isces; Salmonidae). Env. Biol. Fish. 1' 2:131-136.
Northcote, T.G. 1962. Migratory behaviour of juvenile rainbow trout, Salmon gairdneri, in outlet and inlet streams of Loon Lake, British Columbia. J. Fish. Res.

Board Can. 19:201-270
Novotny, A.J. 1980. Delayed release of salmon. Pp 325-369 J in Salmon Ranching. J.E. Thorpe (ed.) ~cademic Press, New York.
O'Keefe, T. M., Purdy, C.B., Brauer, E.P. and Willoughby, C.E. 1979. A mechanical volumetric feeding device for aquaculture research. Aquaculture 17:69-71 .
Parker, G.A. 1974. Assessment strategy and the evolution of animal conflicts. J. Theor. Biol. 47:223-243.
Parker, R.R. and Larkin, P.A. 1959. A concept of growth in / fishes. J. Fish. Res. Board. Can. 16:721-745.
Peters, R.H. 1983. The ecological implications of body size. Cambridge Univ. Press, New York. 3 2 9 pp. d
Puckett, K.J. and Dill, L.M. 1985 . The energetics of ' feeding territoriality in juvenile coho salmon
(Oncorhynchus kisutch). Behaviour 92:91-111.
Ra'anan, Z. and Cohen, D. 1984. The effect of group interactions on the development of size distribution in Macrobrachium rosenbergii ( ~ e Man) juvenile populations.. Biol. Bull. 166:22-31. .
Refstie, T. and Steine, T.A. 1978 . Selection experiments /' with salmon. 11, Genetic and environmental sources of
length and weight variation of Atlantic salmon in the freshwater phase. Aquaculture 14:221-234.
Rowell, T.E. 1974 . The concept of social dominance. Behav. Biol. 11:131-154.
Rubenstein, D.I. 1981. Combat and communication in the everglades pygmy sunfish. ~nim. Behav. 29:249-258.
Schneider, R. and Nicholson, B.L. 1980. Bacteria associated with fin rot disease in hatchery reared Atlantic salmon (Salmo salar). Can. J. Fish. Aquat. Sci. 37:1505-1513.
Schoener, T.W. 1971. Theory of feeding strategies. Ann. Rev. Ecol. Syst. 2:370-404.
Schoener, T.W. 1983. Simple models of optimal territory size: a reconciliation. Am. Nat. 121 :608 -629 .
Schuck, H.A. 1948 . Survival of hatchery trout in streams and possible methods of improving the quality of ,/ hatchery trout. Prog. Fish Cult. 10:3-14.

S.E.P. Annual Report. 1979. M. Glover and 3. Barnetson. (eds). Govt. of Canada. 92pp.
Shelborn, J.E., Brett, J.R. and Shirahata, S. 1973. Effect of temperature and feeding regime on the specific growth rate of sockeye salmon fry (Oncorhynchus nerka), with a consideration of the size effect, 3. Fish. Res. Board Can. 30:1191-1194.
Shelton, W.L., Davies, W.D., King, T.A. and Timmons, T.J. 1979. Variation in growth of the initial year class of largemouth bass in Westpoint Res. Alabama and ~eorgia. Trans. Am. Fish. Soc. 108:142-149.
Shirahata, S. 1964. On "cannibalism" in the rainbow trout fingerling, Salmo qairdneri irideus. Jap. 3. Ecol. J 14:25-32.
Slaney, P.A., and Harrower, W.L.1981. Experimental culture and release of steelhead trout reared in net pens at O'Connor Lake in British Columbia. Pp 43-49 in Proceedings: propagation, enhancement, and
J rehabilitation of anadromous salmonid populations and habitat symposium. October 15-17, Humboldt State University, Arcata, California.
Slaney, P.A. and Northcote, T.G. 1974. Effects of prey abundance on density and territorial behaviour of young i/ rainbow trout in laboratory stream channels. 3. Fish. Res. Board Can. 31:1201-1209.
Sosiak, A.J., Randall, R.G, and McKenzie, J.A. 1979. Feeding by hatchery reared and wild ~tlantic salmon. J.Fish. Res. Board Can. 36:1408-1412.
Stringer, G.E. and Hoar, W.S. 1955. Aggressive behaviour of underyearling Kamloops trout. Can. 3. Zool. 33:148-160.
Symons, P.E.K. 1968. Increase in aggression and in strength of the social hierarchy among juvenile Atlantic salmon J deprived of food. J. Fish. Res. Board Can. 25:2387-2401.
Symons, P.E.K. 1971. Behavioural adjustment of population density to available food by juvenile Atlantic salmon. J. Anim. Ecol. 40:569-587.
Symons, P.E.K. 1974. Territorial behaviour of juvenile Atlantic salmon reduced predation by brook trout. Can. J. Zool. 52:677-679.
Teitelbaum, P. 1966. ~otivation and control of food intake. Pp 319-335 in Handbook of physiol. Am. Physiol. Soc.,

washington.
Tinbergen, N. 1951. The study of instinct. Oxford University Press, New York. 228pp.
Vincent, R.E. 1960. Some influences of domestication upon three stocks of brook trout (Salvelinus fontinalis itche ell). Trans. Am. Fish. Soc. 89:25-32.
Wade, T.D. 1978. Status and hierarchy in nonhuman primate societies. Pp 109-134 in Perspectives in Ethology, Vol. 3, P.P.G. Bateson and P.H. Klopfer (eds). Plenum Press, New York.
W6nkowski, J.W.J, and Thorpe, J.E. 1979. Spatial distribution and feeding in Atlantic salmon, Salmo salar L., juveniles. J. ~ i s h Biol. 1 1 4 : 2 3 9 - 2 4 7
Weatherly, A.H. and Rodgers, S.C. 1978. Some aspects of age and growth. Pp 52-74 in The ecology of freshwater fish J production, S.D. Gerking (ed.) Blackwell, Oxford.
Webb, P.W. 1978. Partitioning of energy into metabolism and growth. Pp 184-214 in The ecology of freshwater fish production, S.D. Gerking (ed.) Blackwell, Oxford.
Whitlock, D. 1974. Fish stocking and reproduction: trout and warmwater species. Pp 123-153 in The Stream Conservation Handbook, J.M. Migel (ed.) Crown Publishers Inc, New York.
Wilson, E.O. 1975. Sociobiology: the new synthesis. Belknap Press, Cambridge, Mass.697~~.
Yamagishi, H. 1962. Growth relations in some small experimental populations of rainbow trout fry, Salmo J'
gairdneri, Richardson, with special reference to social relations among individuals. Jap. J. Ecol. 12:43-53.
~amagishi, H., Matsushima, T. and Nakamura, M. 1981. Note on the aggressive behaviour of juvenile Japanese chum salmon, Oncorhynchus keta (~albaum). Sci. Repts. Hokkaido Salmon Hatchery 35:25-31.