Embed Size (px)
Citation preview
1
Influence of dietary sesamin, a bioactive compound on fatty acids and expression of some 1
lipid regulating genes in Baltic Atlantic salmon (Salmo salar L.) juveniles 2
3
S. Trattnera,c*, B. Ruyterb, T. K. Østbyeb, A. Kamal-Eldina, A. Moazzamia, J.Pana, T. 4
Gjøend, E. Brännäsc, V. Zlabekae and J. Pickovaae 5 aDepartment of Food Science, SLU, PO Box 7051, 75007 Uppsala, Sweden; 6
b Nofima AS, Ås, Norway; 7 cDepartment of Wildlife, Fish, and Environmental Studies, SLU, Umeå, Sweden; 8
dDepartment of Pharmaceutical Bioscience, School of Pharmacology, University of Oslo, 9
Oslo, Norway; 10 eResearch Institute of Fish Culture and Hydrobiology, University of South Bohemia in 11
Ceske Budejovice, Vodnany, Czech Republic. 12
13
*Corresponding author: Tel.: + 46-18-672005; fax: 46-18-672995. 14
Email address: [email protected] 15
16
2
Abstract 17
The effects of including sesamin / episesamin in Baltic Atlantic salmon (Salmo salar L.) 18
diets based on vegetable oils were studied. The study was designed as a dose response 19
study with two control diets, one diet based on fish oil (FO) and one diet based on a 20
mixture of linseed and sunflower oil (6:4 by vol.) (MO). As experimental diets three 21
different levels of inclusion of sesamin / episesamin (hereafter named sesamin) to the MO 22
based diet and one diet based on sesame oil and linseed oil (SesO)(1:1 by vol.) were used. 23
The dietary oils were mirrored in the fatty acid profile of the white muscle. Sesamin 24
significantly decreased the levels of 18:3n-3 in the white muscle phospholipid (PL) 25
fraction of all groups fed sesamin, no significant differences were found in the 26
triacylglycerol fraction (TAG). Slightly increased levels of docosahexaenoic acid (22:6n-27
3, DHA) in PL and TAG were found in some of the sesamin fed groups. Sesamin 28
significantly affected the expression of peroxisome proliferator-activated receptor α, 29
scavenger receptor type B and hormone sensitive lipase, in agreement with previous 30
studies on rainbow trout (Oncorhynchus mykiss) and Atlantic salmon (Salmo salar L.) 31
hepatocytes published from our group. No significant effects on toxicological response 32
measured as ethoxyresorufin O-deethylase activity was found. The total cytochrome P450 33
enzymes were significantly higher in MO 0.29 and SesO group. The amount of α- and γ- 34
tocopherols in liver and the amount of γ-tocopherol in white muscle were significantly 35
lower in fish fed the FO diet compared to the MO diet, but no difference after inclusion 36
of sesamin was found in this study. Increased inclusion of sesamin increased the levels of 37
sesamin and episesamin in the liver, but did not affect the amounts in white muscle. 38
39
Key words: 40
Sesamin, Episesamin, Tocopherols, Cytochrome P450, Peroxisome proliferator-activated 41
receptor, Hormone sensitive lipase, Scavenger receptor type B 42
43
3
Abbreviations 44
ACO Acyl-CoA oxidase 45
CD 36 Cluster of differentiation 36 46
CPT Carnitine palmitoyltransferase 47
CYP Cytochrome P450 48
Δ5 Δ5 desaturase 49
Δ6 Δ6 desaturase 50
DHA Docosahexaenoic acid (22:6n-3) 51
DPA Docosapentaenoic acid (22:5n-3) 52
EF1A Elongation factor 1α 53
EPA Eicosapentaenoic acid (20:5n-3) 54
EROD Ethoxyresorufin O-deethylase 55
FA Fatty acid 56
FO Fish oil 57
HSL3 Hormone sensitive lipase 58
HUFA Highly unsaturated fatty acids 59
MO Linseed and sunflower oil 6:4 by vol 60
MUFA Monounsaturated fatty acids 61
PL Phospholipids 62
TAG Triacylglycerol 63
TLC Thin-layer chromatography 64
SesO Sesame oil and linseed oil 1:1 by vol 65
SRB-I Scavenger receptor type B 66
RPL2 RNA polymerase II polypeptide 67
PCR Polymerase chain reaction 68
PPAR Peroxisome proliferator-activated receptor 69
PUFA Polyunsaturated fatty acids 70
SREBP Sterol regulatory element binding protein 71
VLDL Very low-density lipoprotein 72
73
74
75
4
Introduction 76
Sesamin, a minor component of sesame oil (Moazzami and Kamal-Eldin 2006), is a 77
potent lipid modulator in mammals. It has been shown to affect enzymatic activity and 78
expression of genes involved in lipid metabolism e.g. acyl-CoA oxidase (ACO) and 79
carnitine palmitoyltransferase (CPT) (Kushiro et al. 2002; Jeng and Hou 2005; Kiso et al. 80
2005). In the fungus Mortierella alpina and in primary rat hepatocytes, sesamin was 81
shown to reduce Δ-5 desaturation index and enzymatic activity of Δ-5 desaturase 82
(Shimizu et al. 1991). To our knowledge, only two studies from our group have 83
investigated the effects of dietary sesamin in fish. In these studies, it was shown that 84
sesamin increased docosahexaenoic acid (22:6n-3, DHA) in rainbow trout 85
(Oncorhynchus mykiss) white muscle phospholipid (PL) and triacylglycerol (TAG) 86
fraction and decreased the expression of peroxisome proliferator-activated receptor α 87
(PPARα) in liver (Trattner et al. 2008). In Atlantic salmon (Salmo salar L.) hepatocytes, 88
it was shown that sesamin increased elongation and desaturation of radiolabelled 18:3n-3 89
towards DHA. It increased the levels of β-oxidation products and the relative expression 90
of cluster of differentiation 36 (CD36), scavenger receptor (SRB) type B, PPARα and γ 91
(Trattner et al. 2008). The metabolic effects of sesamin have been suggested to be caused 92
through the activation of PPARs and sterol regulatory element binding protein-1 93
(SREBP-1) (Ashakumary et al. 1999; Ide et al. 2004). Furthermore, sesamin has been 94
reported to inhibit cholesterol absorption and synthesis, and tocopherol hydroxylation and 95
clearance in rats and humans (Jeng and Hou 2005). Other compounds known to modulate 96
lipids are 3-thia fatty acids, conjugated linoleic acid and Lipoic acid (Berge et al. 2001); 97
(Huong and Ide 2008); Kennedy et al. 2009). 98
99
The methylenedioxyphenyl group of sesamin is known to affect cytochrome P450-100
dependent drug oxidation (Murray 2000). Cytochrome P450 (CYP) enzymes are known 101
to play a central role in the oxidative metabolism and biotransformation of a wide range 102
of endogenous and exogenous compounds (Nelson et al. 1996). Among the numerous 103
CYP families identified, primarily CYP 1-3 are involved in biotransformation of 104
xenobiotics. The CYP1A subfamily is reported to be expressed in the liver of both 105
mammals and fish (Murray 2000; Jönsson et al. 2006). Due to the role of CYP1A 106
5
isoenzymes in the metabolism and bioactivation of foreign compounds, alteration of the 107
expression of hepatic CYP1A may affect the potential risk of xenobiotics (Williams et al. 108
1998). CYP1A is readily inducible by aryl hydrocarbon (Ah) receptor agonist, thus the 109
activity of CYP1A, measured as ethoxyresorufin O-deethylase (EROD) activity, is used 110
as a biomarker for exposure to xenobiotic compounds in fish (Havelkova et al. 2007). 111
112
Traditionally, carnivorous farmed fish has been fed diets based on fish ingredients. At 113
present there is an overuse of marine raw materials for aquaculture feed production and at 114
the same time aquaculture is the fastest growing food production industry (Tacon 2005; 115
FAO 2007). Therefore, alternative fish feed ingredients are being investigated. Vegetable 116
oil is used as a replacement of fish oil (up to 50%) without affecting growth and 117
production yield (Torstensen et al. 2005). One well known drawback of replacement with 118
vegetable oils in fish feed are the decreased amounts of n-3 highly unsaturated fatty acids 119
(HUFA) in fish tissues (Torstensen et al. 2005; Pettersson et al. 2009). The n-3 HUFA are 120
known to have positive health effects in man. In terms of human health, it is important to 121
preserve the beneficial fatty acid (FA) composition of fish (Mozaffarian and Rimm 122
2006). It is necessary to find alternatives to fish oil use, without decreasing the content of 123
n-3 HUFA in fish. 124
125
To achieve more n-3 HUFA in fish fed vegetable oils, bioactive compounds can be added 126
in the fish diet. It is interesting to study the effects on sesamin in common aquaculture 127
species, on the nutritional quality of muscle as human food in terms of FA, tocopherols 128
and sesamin content. Furthermore, it is important to investigate how sesamin is 129
metabolized in the fish and how it affects fish welfare. To investigate the effects of 130
sesamin in wild strain Baltic Atlantic salmon (Salmo salar L.) juveniles, a dose response 131
study was designed and the FA composition, the relative expression of nine lipid related 132
genes, the content of tocopherols, sesamin and episesamin, EROD activity and the total 133
level of CYP were analyzed. 134
135
Material and method 136
6
Chemicals and Reagents 137
Sesamin/episesamin mixture (1:1, w/w) was a kind gift from Takemoto Oil and Fat Co., 138
Ltd. (Gamagori Aichi, Japan). Fatty acid peaks were identified by comparison with the 139
standard mixture GLC-68 A (Nu-check Prep, Inc, Elysian, Minnesota, USA). Tocopherol 140
standards were purchased as an isomer kit (article number 15496) from Merck 141
(Darmstadt, Germany). All solvents and other chemicals for FA, tocopherols and sesamin 142
analysis were also purchased from Merck and were used without further purification. 143
Animals and diets 144
Baltic Atlantic salmon was fed six different diets, fifteen fish per group. Prior the 145
experiment all fish were fed the same commercial diet. Four groups were fed 146
experimental diets based of vegetable oils and sesamin/episesamin mixture (1:1, w/w) 147
(hereafter named sesamin), while one group was fed a diet based on fish ingredients, and 148
one group was fed a diet based on vegetable oil. The diets were prepared according to the 149
method of Sanchez-Vazquez (1999), the ingredients are shown in Table 1. The diets 150
differed in oil composition and the content of sesamin as follow; 1) mixed linseed : 151
sunflower oil, 6 : 4 by vol. (MO), 2) fish oil (FO), 3) sesame oil : linseed oil, 1:1 by vol. 152
(SesO), 4) MO + sesamin 0.29 g 100g -1, 5) MO + sesamin 0.58 g 100g -1, 6) MO + 153
sesamin 1.16 g 100g -1. The FA composition and the tocopherol content of the diets are 154
shown in Table 2. The fish were tagged individually and the individual weight increase 155
was calculated as daily growth gain. Fishes were kept at a water temperature of 10 ºC and 156
were fed ad libitum for 77 days. Before the experiment started, the fish were tagged with 157
a PIT-tag (Passive Integrated Transponder) by injecting the tag into the posterior part of 158
the abdomen. Before handling, all fish were anaesthetized (ethyleneglycol monophenyl 159
ether 5 mL L-1). The daily growth rate (DGC) were calculated as: 160
DGC = 100 x (W21/3 – W1
1/3) D-1 with W2 being final weight, W1 the starting weight and 161
D the number of days (Table 3.). 162
At sacrifice, the muscle was divided in red and white. The muscles, intestine and liver 163
were frozen at –80 ºC until analyzed. From each group six individuals were used for fatty 164
acid, tocopherols, EROD and CYP analysis and another six individuals were used for 165
gene expression analysis. 166
7
167
Lipid analysis 168
White muscle (2 g) and diets (1 g) were extracted following the method of (Hara and 169
Radin 1978). The lipid content was measured gravimetrically. Total lipids of tissues were 170
separated into PL and TAG according to Pickova et al. (1997). Total lipids in the diets, 171
and the PL and TAG lipid fractions of tissues were methylated following the procedure of 172
(Appelqvist 1968) and the FA were analysed by gas chromatograph CP3800 (Varian AB, 173
Stockholm, Sweden) equipped with flame ionisation detector (FID) and split injector and 174
fitted with a fused silica capillary column BPX 70 (SGE, Austin, Tex.), length 50 m. id. 175
0.22 mm, 0.25 μm film thickness. The column temperature was programmed to start at 176
158°C hold 5 min and then increase 2°C/min from 158°C to 220°C and remain at 220°C 177
for 8 min. The carrier gas was helium (0.8 ml/ min) and make up gas was nitrogen. The 178
injector and detector temperatures were 230°C and 250°C, respectively. FA were 179
identified by comparison with the standard FA mixture GLC-68. Peak areas were 180
integrated using Varian Star chromatography workstation software version 5.5. 181
182
Tocopherols, sesamin and episesamin analyses 183
For the analysis of tocopherols in the diets, and the tocopherols, sesamin and episesamin 184
in the tissues, the lipid extracts were dissolved in hexane and analysed with high 185
performance liquid chromatography (HPLC). The mobile phase used was hexane/1,4-186
dioxane (94:4, vol/vol). The HPLC system was equipped with a Bischoff HPLC pump 187
(Bischoff Analysentechnik und geräte GmbH, Leonberg, Germany) and Agilent 1100 188
series fluorescence detector (Agilent Technologies, Waldbronn, Germany). The HPLC 189
column was Alltech SI 5U silica column (4.6 x 250 mm; Alltech Associates Inc., 190
Deerfield, IL). The fluorescence detector was operated at an excitation wavelength of 296 191
nm and an emission wavelength of 324 nm as described by Moazzami and Kamal-Eldin 192
(2006). Identification and quantification was achieved by comparison to external 193
standards. 194
195
RNA analysis 196
8
Total RNA was purified from livers, muscle and intestine from each group (n = 6) and 197
analyzed in duplicate, using Trizol® (Invitrogen), followed by DNase treatment (TURBO 198
DNA-free, Ambion). All protocols were according to the manufacture’s instructions. 199
RNA quality and quantity were determined spectrophotometrically (A260/280) using 200
NanoDrop® (ND-1000 Spectrophotometer, NanoDrop Technologies, Wilmington, 201
Delaware, USA). Samples were stored in RNase-free water at –80˚C. 202
203
The cDNA was synthesized from 2.4µg RNA, a modified protocol from the Taq Man 204
Reverse Transcription Reagents kit (Applied Biosystems). The Oligo d(T)16 primers were 205
used. The reaction was performed by incubating the samples at 25 ˚C for 10 min, 48 ˚C 206
for 6 min, 95 ˚C for 50 min and was terminated by reducing the temperature to 10 ˚C. 207
Primers for Real-Time PCR analysis (Table 4) were designed using the Primer Express® 208
software based on available salmon sequences in the GenBank® and purchased from 209
Invitrogen (CA, USA). Real-Time PCR was performed in a Prism® 7000 system by 210
using gene-specific primers. A 2 x SYBR® Green PCR Mastermix (ABI) was used in the 211
PCR reaction mix of 25 µl with 1 µl primers (final concentration of 0.5 µM), and 5 µl 212
cDNA. All samples were analyzed in duplicate with a non-template control on each 213
plate. The reference genes used were elongation factor 1α (EF1A) and RNA polymerase 214
II polypeptide (RPL II). The reaction was preformed by incubating the samples at 50˚C 215
for 2 min, 95˚C 10 min and 50 cycles of 95˚C for 10 s and 60˚C for 15 s. Standard curves 216
were made for each primer pair and efficiencies (E) were calculated E=10 (-1/slope) . 217
218
Total content of CYP and EROD activity in liver 219
For the analysis of total CYP content and EROD activity, six liver samples from each 220
group were analysed. The liver tissue was homogenized in ice-cold homogenization 221
buffer (0.25 M sucrose and 0.1 mM EDTA in 0.01 M TRIS buffer, pH 7.4) using a 222
Potter-Elvehjem homogeniser. The homogenate was centrifuged for 15 min at 10,000×g 223
(4 °C) and the resulting supernatant was spun down for 1 h at 105,000×g (4 °C). The 224
microsomal pellets were resuspended in the homogenization buffer and stored at - 80 °C 225
until used. The total CYP content was determined spectrophotometrically by the Co- and 226
9
dithionite difference method (Shimanzu UV-1601PC, Columbia, USA) according to 227
(Omura and Sato 1964). 228
229
Hepatic EROD activity was determined according to a modified method by (Jönsson et 230
al. 2006). Standard solutions of resorufin (0–50µM) and protein (BSA; 1 mg BSA ml−1) 231
were prepared in HEPES-Cortland buffer pH 8. The HC buffer was prepared by 232
dissolving 0.38 g KCl, 7.74 g NaCl, 0.23 g MgSO4·7H2O, 0.23 g CaCl2·2H2O, 0.41 g 233
NaH2PO4·H2O, 1.43 g HEPES, and 1 g glucose in 1 l of distilled water. Microsome 234
suspensions were further diluted in the same buffer (1:5 and 1:10). Aliquots of the 235
microsome suspensions (50 µl) and of the standard solutions (40 µl of resorufin and 10 µl 236
of BSA) were added in duplicate wells in 96-well plate. A 160 µl aliquot of 7-237
ethoxyresorufin (12.7 µM) and NADPH (2.1 mM) in HC buffer was rapidly added to all 238
wells. The plate was then immediately placed in a microplate reader (Wallac 1420 239
VICTOR2, Turku, Finland) and the resorufin fluorescence was monitored for 10 min by 240
repeated measurements at 544 nm (ex) and 590 nm (em). EROD activity was calculated 241
and expressed as pmol of resorufin formed per mg protein and minute. The protein 242
contents of the microsomes were assayed by the (Smith et al. 1985), adapted for 243
microplate readers. 244
245
Data analysis 246
Fatty acids, EROD, CYP, tocopherols, sesamin and episesamin data are presented as 247
mean values ± standard deviation. The General Linear Model (GLM) of SAS (SAS 248
Institute Inc., Cary, N.C., USA, version 8.2) was used to compare the physiological 249
responses of the different diets. The model included the fixed effect of treatment and 250
random effect of individual. Relative expression of the different genes, in relation to 251
housekeeping genes were determined by using the Relative Expression Software Tool 252
(REST-384©-version 1) for group wise comparison and statistical analysis of relative 253
expression results in real-time PCR (Pfaffl et al. 2002). 254
255
Results 256
10
Survival 257
The total mortality during the study was 5 fish, of which three belonged to the FO-group, 258
one to the MO group and one to the MO+0.28 group. 259
There was no difference in starting weight, final weight or daily growth coefficient 260
(DGC) between the MO group and the groups with added sesamin. For the FO group 261
both start and end weight were lower (6.9 and 13.8, respectively) than in the other groups 262
(range 8.7 - 20.7 g). The DGR is shown for the six fish from each group which were 263
analysed for fatty acid composition. The variation between individuals is large in all 264
groups as seen from the data in Table 3. 265
266
267
Fatty acid composition and lipid content 268
The groups did not differ in lipid content. The FA composition of white muscle clearly 269
reflected the FA profile of the oils used in the diets (Table 5). The FO group was 270
characterized by high proportions of EPA and DHA in PL and TAG. The vegetable oil 271
groups had higher proportions of 18:3n-3 and lower proportions of n-3HUFA. The 272
response to the change in dietary FA composition was faster in TAG than PL. The levels 273
of 18:3n-3 were significantly lower in PL of all three groups fed sesamin compared to the 274
MO group without sesamin (P<0.05). The level of docosapentaenoic acid (DPA, 22:5n-3) 275
and DHA in PL of the MO groups with added sesamin were higher than in the MO 276
group, however the difference was only significant for DPA in the MO 0.58 group 277
(P<0.05). In the PL of MO 0.58 group DHA increased to 36.6 (P = 0.16). Similar to the 278
PL fraction 18:3n-3 decreased and DPA and DHA increased in the TAG of MO 0.58 and 279
MO 1.16 group (non significant changes). 280
281
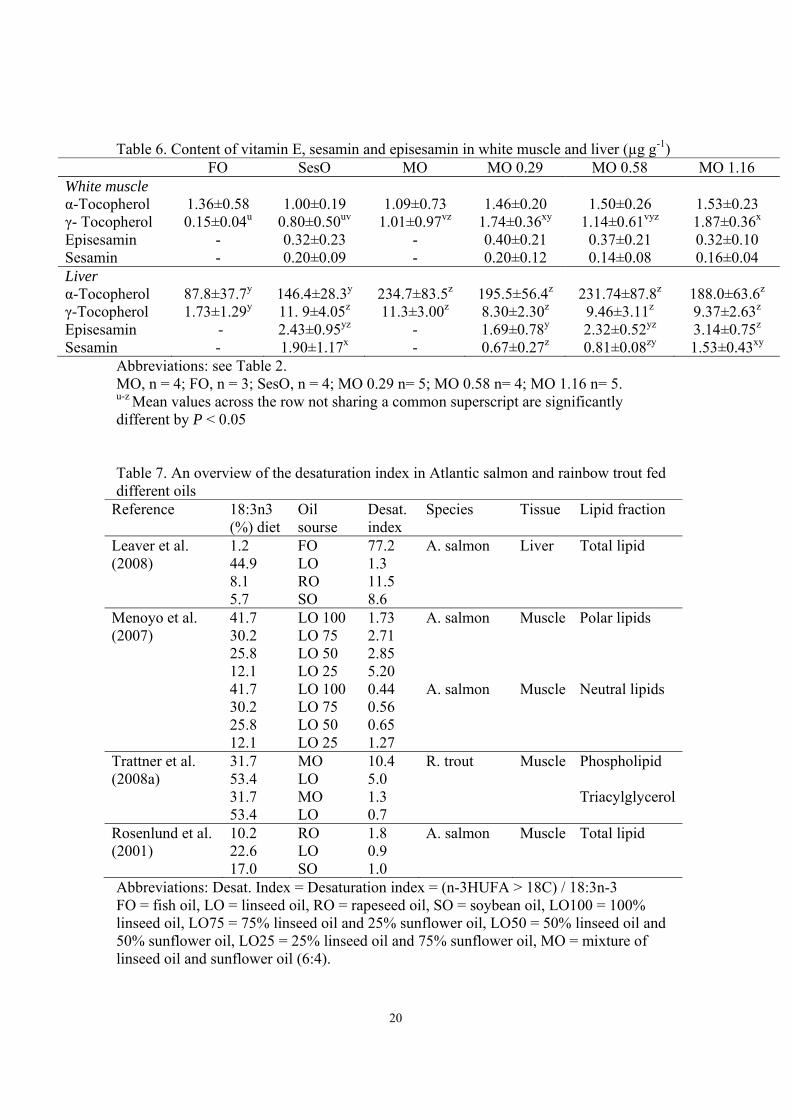
Tocopherols and sesamin content 282
The contents of α- and γ- tocopherols in the liver were significantly lower (P< 0.05) in 283
FO group compared to the MO groups with or without addition of sesamin. In the white 284
muscle, the γ- tocopherol content was significantly lower in the FO group than in the MO 285
groups (P< 0.05). No differences were found in the content of sesamin and episesamin in 286
white muscle, in the liver sesamin and episesamin levels were higher in the MO 1.16 287
11
group, the difference was significant compared to the MO 0.29 group (P = 0.03, P<0.01 288
for sesamin and episesamin respectively), but was higher than in the SesO (P = 0.3, P = 289
0.2 for sesamin and episesamin respectively) and MO 0.58 (P =0.1 both for sesamin and 290
episesamin) group as well (Table 6). 291
292
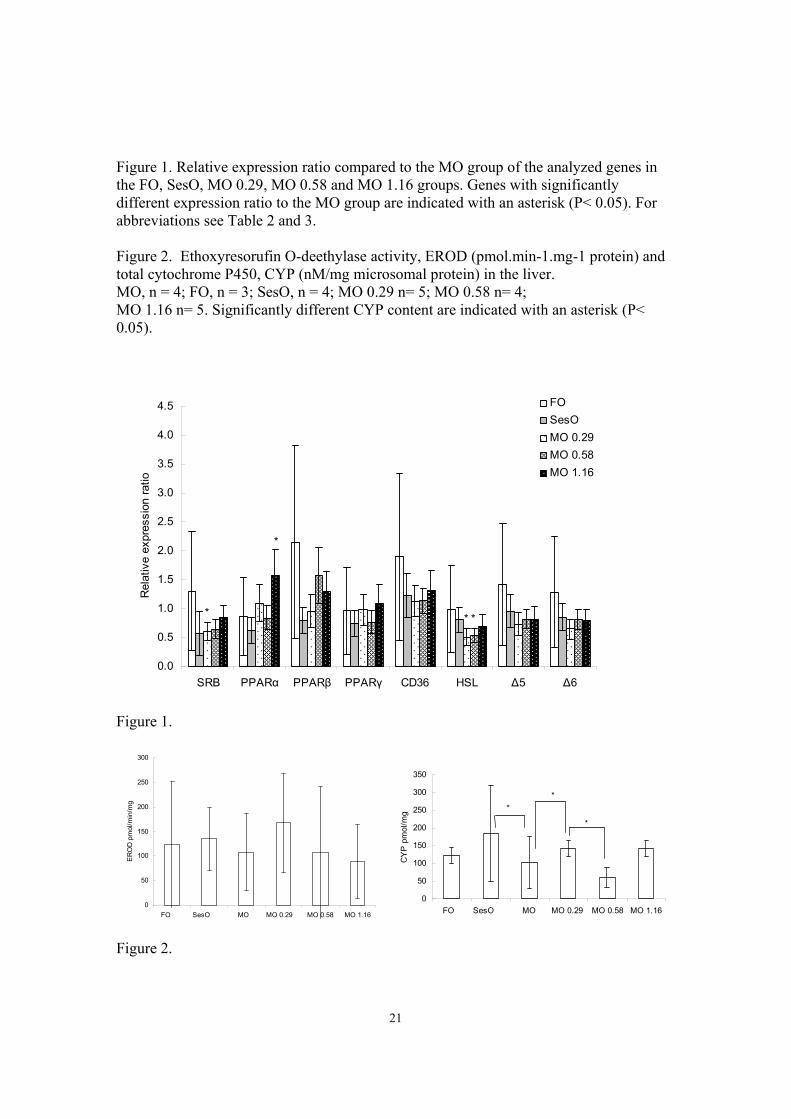
Relative expression of target genes 293
The relative expressions of target genes in the experimental groups, compared to MO 294
group, after normalization to the reference gene are shown in Figure 1. In the MO + 1.16 295
group, PPARα (P = 0.05) was upregulated compared to control group. In the MO + 0.29 296
group, SRB (P= 0.03) and HSL3 (P<0.01) were upregulated, and in the MO + 0.58 297
group, HSL3 (P= 0.03) was upregulated compared to the MO group. 298
299
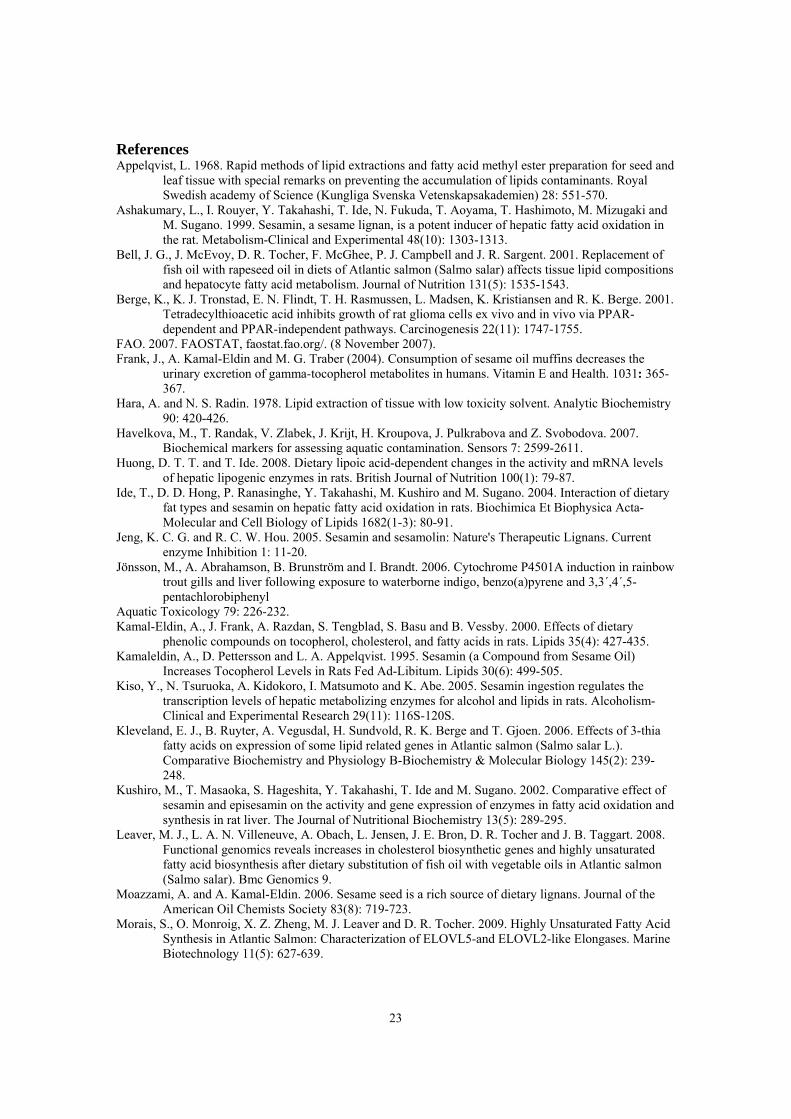
Total content of CYP and EROD activity in the liver 300
The EROD activity did not differ significantly among groups (Figure 2). The CYP 301
(Figure 2) levels were significantly higher in the MO 0.29 group (P = 0.02) and slightly 302
higher in the MO 1.16 group (P = 0.07) compared to MO group and significantly lower in 303
MO 0.58 group (P < 0.01) compared to MO 0.29 group. The CYP response was also 304
significantly higher in the SesO group compared to the MO group. There was a large 305
variation in individual response detected, with CV values within groups from 16 up to 306
125 %. 307
308
Discussion 309
In general, the results of different analyses in this study showed a large variation caused 310
by a broad individual response. The reason for the different weight in the fish group is 311
most likely caused by the low number of individuals as the fish were divided between 312
groups according to stastistical methods. In Sweden, the long breeding history of Baltic 313
Atlantic salmon smolts is aimed for release purposes as a replacement for the wild 314
spawners being hindered the enter the rivers by hydro-electric power dams and the large 315
number of parents is a prerequisite. Therefore, this fish had a wide range of genetic 316
background compared to the fish used in our previous studies on rainbow trout and 317
Atlantic salmon hepatocytes. Schlechtriem et al. (2007) found inter individual variations 318
12
in FA composition of Atlantic salmon smolt, and suggested individual variation in 319
elongation and desaturation capacity as a likely explanation. Other known factors 320
affecting the capacity of elongation and desaturation are environmental factors and life 321
stage, e.g. salmon prior seawater transfer had higher relative expression of Δ-5 and Δ-6 322
desaturase (Zheng et al. 2005). Addition of bioactive compounds such as 3-thia fatty 323
acids and lipoic acid can also influence lipid metabolism. The 3-thia fatty acids increased 324
β-oxidation capacity and the levels of DHA (Moya-Falcon et al. 2006) and reduced 325
mRNA expression of PPARα and apolipoproteinAI (ApoAI) (Kleveland et al. 2006) in 326
Atlantic salmon. Conjugated linoleic acid decreased adipocytes by elevating energy 327
expenditure (Kennedy et al. 2009). Dietary lipoic acid was shown to increase EPA levels 328
in pacu (Piractus mesopotamicus) muscle (Trattner et al. 2007). 329
330
In our previous study on rainbow trout, significantly increased levels of DHA and 331
decreased proportions of 18:3n-3 in the TAG and PL fractions were found after sesamin 332
addition to the fish diet. Also the total level of polyunsaturated fatty acids (PUFA) was 333
decreased, possibly due to increased β-oxidation of PUFA in sesamin fed fish (Trattner et 334
al. 2008a). These results were confirmed in an in vitro study on Atlantic salmon 335
hepatocytes incubated with radiolabelled 18:3n-3 with or without sesamin addition to the 336
media. It was shown that the amount of 18:3n-3 elongated and desaturarated to DHA was 337
increased after sesamin incubation. It was also shown that sesamin increased the total 338
level of β-oxidation products, in particular acetate, which indicate peroxisomal β-339
oxidation (Trattner et al. 2008). Sesamin also decreased secretion of lipids (mainly TAG) 340
in Atlantic salmon hepatocytes, in agreement with the lipid lowering effects reported as 341
reduced TAG and VLDL levels in rat serum (Umeda-Sawada et al. 1998; Kamal-Eldin et 342
al. 2000). In the present study, sesamin significantly decreased levels of 18:3n-3 in the PL 343
of all sesamin fed groups, also the average DHA level was (not significantly) increased in 344
the groups after sesamin addition to the diet. 345
346
In the rainbow trout study, two different oils, sunflower: linseed oil mixture (MO) and 347
linseed oil (LO) were used. In that study the effects of sesamin on gene expression and 348
FA composition were greater in MO diet than in LO diet. The use of 100% linseed oil in 349
13
the LO group decreased desaturation index (n-3HUFA/18:3n-3) compared to the use of a 350
mixture of vegetable oil as in the MO group, indicating less efficient conversion of 18:3n-351
3 to DHA when linseed oil is included at higher levels in the diet. There are a number of 352
studies showing decreased desaturation index with increased inclusion of linseed oil, a 353
summary of results from studies are presented in Table 7. In a study on Atlantic salmon, 354
it was suggested that increased inclusion of linseed oil due to its high content of 18:3n-3 355
inhibited elongation and desaturation of 18:3n-3 in hepatocytes, and increased oxidation 356
of 18:3n-3 in enterocytes (Tocher et al. 2002). The replacement of fish oil with linseed 357
oil, decreased the DHA levels in the liver 4-fold (Tocher et al. 2002), whereas 358
replacement of the fish oil with rapeseed oil decreased the DHA levels to half (Bell et al. 359
2001). (Leaver et al. 2008) showed increased activity of fatty acyl Δ-6 desaturase in the 360
liver of Atlantic salmon fed vegetable oils, the increased activity was highest for rapeseed 361
oil followed by soybean oil and last linseed oil. The expression of elov15b and elovl2 362
elongases were also significantly higher in liver of vegetable oil fed fish compared to fish 363
oil fed fish, with lower expression in linseed oil fed fish than in rapeseed oil and soybean 364
oil fed fish (Morais et al. 2009). In agreement with these studies, we also found decreased 365
desaturation index in the MO group, which had higher 18:3n-3 content in the diet 366
compared to the SesO group. 367
368
The differences in tocopherols (Table 6) are due to the difference in tocopherols in the 369
diet, the vegetable oil had a higher content of tocopherols than the fish oil. The FO diet 370
had low levels of α-tocopherol and levels below detection limit for γ-tocopherol. In 371
contrast to our results, in rats and humans, it has been shown that sesamin increased the 372
levels of γ-tocopherol and reduced the urine extraction of its metabolites (Frank et al. 373
2004); (Kamaleldin et al. 1995). In the liver, the sesamin and episesamin contents were 374
increased with increased content in the diet. Even though the sesamin : episesamin ratio 375
was 1:1 in the feed, episesamin was detected at higher levels in muscle and liver. This 376
finding is in agreement with the study on rainbow trout and has also been found in rats 377
(Trattner et al. 2008a; (Umeda-Sawada et al. 1999). 378
379
14
Interestingly, even if there were no significant differences in the composition of n-3 380
HUFA in TAG, it was found that the MO+1.16g group with increased relative expression 381
of PPARα also had higher proportions of DPA and DHA in white muscle PL and TAG. A 382
result well corresponding with the increased levels of DHA in the in vivo rainbow trout 383
livers and the in vitro Atlantic salmon hepatocytes and increase β-oxidation in Atlantic 384
salmon hepatocytes. The relative expression of PPARα in rainbow trout liver and Atlantic 385
salmon hepatocytes, was also found previously to be effected by sesamin, although in 386
these previous cases, this expression was downregulated. The highest levels of DPA and 387
DHA were found in PL and TAG of the MO 0.58 group, which also had increased 388
relative expression of HSL3. HSL activate intracellular hydrolysis of TAG, which can 389
then be used for β-oxidation (Watt et al. 2003). The increase in DHA could also indicate 390
increased β-oxidation as DHA is produced through β-oxidation of longer n-3 fatty acids 391
(Voss et al. 1991). 392
393
The average values for each group in the EROD analysis indicate that the activity 394
decreases with increased levels of sesamin and for the CYP analysis the content is lower 395
at intermediate doses than at low and high dose of sesamin (Figure 2). However, due to 396
the large variation within groups, it is difficult to draw any conclusions. It would be 397
interesting to study the dose dependent response in vitro conditions. The large individual 398
response of enzymes involved in the defence against xenobiotic compounds also support 399
the above mentioned suggestion that individual fish react differently to bioactive 400
compounds in the diet, also in terms of lipid metabolism. 401
402
To improve lipid metabolism in farmed fish may be a useful tool in the future to meet the 403
demands for production of farmed fish with a healthy FA composition produced on less 404
amounts of fish based raw materials. This study indicates that the response of Atlantic 405
salmon (Swedish Baltic origin) to sesamin is less than in rainbow trout in vivo (Trattner 406
et al 2008a) and in Atlantic salmon in vitro (Trattner et al. 2008b). This difference 407
deserves further evaluation and may be utilised for selection to improve desaturation 408
capacity in farmed fish fed vegetable oils.409
15
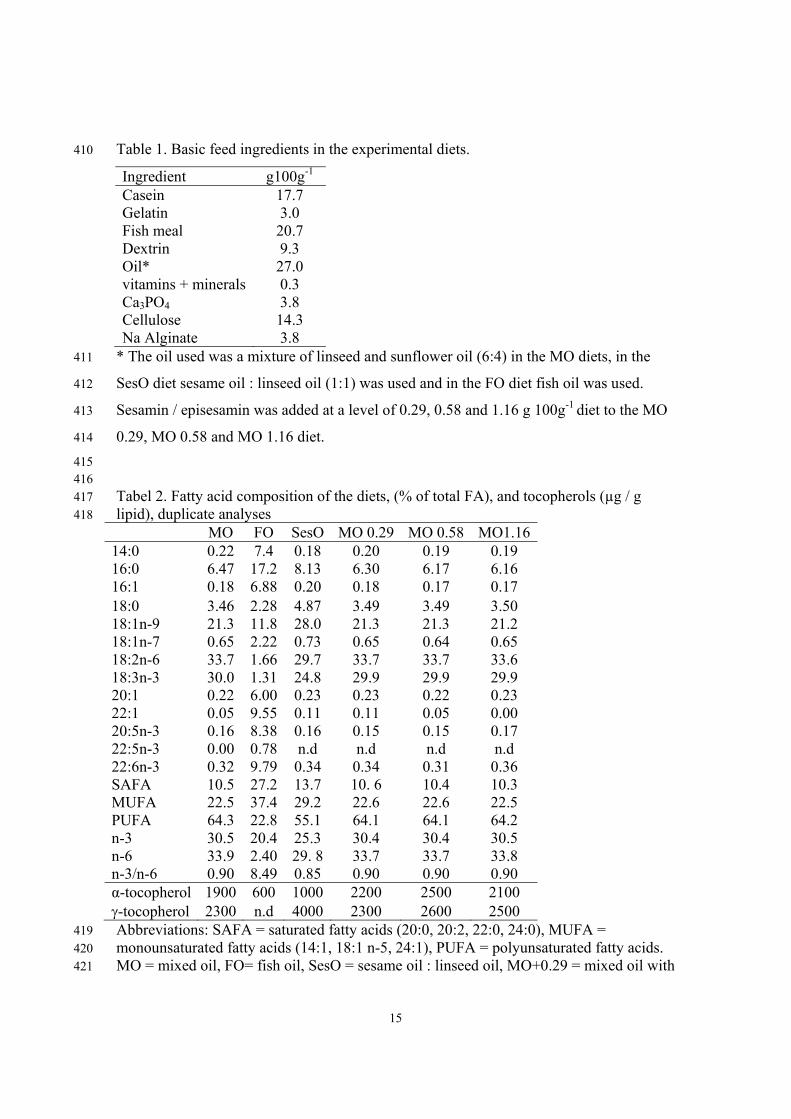
Table 1. Basic feed ingredients in the experimental diets. 410
Ingredient g100g-1 Casein 17.7 Gelatin 3.0 Fish meal 20.7 Dextrin 9.3 Oil* 27.0 vitamins + minerals 0.3 Ca3PO4 3.8 Cellulose 14.3 Na Alginate 3.8
* The oil used was a mixture of linseed and sunflower oil (6:4) in the MO diets, in the 411
SesO diet sesame oil : linseed oil (1:1) was used and in the FO diet fish oil was used. 412
Sesamin / episesamin was added at a level of 0.29, 0.58 and 1.16 g 100g-1 diet to the MO 413
0.29, MO 0.58 and MO 1.16 diet. 414
415 416 Tabel 2. Fatty acid composition of the diets, (% of total FA), and tocopherols (µg / g 417 lipid), duplicate analyses 418
MO FO SesO MO 0.29 MO 0.58 MO1.1614:0 0.22 7.4 0.18 0.20 0.19 0.19 16:0 6.47 17.2 8.13 6.30 6.17 6.16 16:1 0.18 6.88 0.20 0.18 0.17 0.17 18:0 3.46 2.28 4.87 3.49 3.49 3.50 18:1n-9 21.3 11.8 28.0 21.3 21.3 21.2 18:1n-7 0.65 2.22 0.73 0.65 0.64 0.65 18:2n-6 33.7 1.66 29.7 33.7 33.7 33.6 18:3n-3 30.0 1.31 24.8 29.9 29.9 29.9 20:1 0.22 6.00 0.23 0.23 0.22 0.23 22:1 0.05 9.55 0.11 0.11 0.05 0.00 20:5n-3 0.16 8.38 0.16 0.15 0.15 0.17 22:5n-3 0.00 0.78 n.d n.d n.d n.d 22:6n-3 0.32 9.79 0.34 0.34 0.31 0.36 SAFA 10.5 27.2 13.7 10. 6 10.4 10.3 MUFA 22.5 37.4 29.2 22.6 22.6 22.5 PUFA 64.3 22.8 55.1 64.1 64.1 64.2 n-3 30.5 20.4 25.3 30.4 30.4 30.5 n-6 33.9 2.40 29. 8 33.7 33.7 33.8 n-3/n-6 0.90 8.49 0.85 0.90 0.90 0.90 α-tocopherol 1900 600 1000 2200 2500 2100 γ-tocopherol 2300 n.d 4000 2300 2600 2500 Abbreviations: SAFA = saturated fatty acids (20:0, 20:2, 22:0, 24:0), MUFA = 419 monounsaturated fatty acids (14:1, 18:1 n-5, 24:1), PUFA = polyunsaturated fatty acids. 420 MO = mixed oil, FO= fish oil, SesO = sesame oil : linseed oil, MO+0.29 = mixed oil with 421
16
sesamin addition 0.29 g 100g-1diet, MO+0.58 = mixed oil with sesamin addition 0.58 g 422 100g-1diet, MO+1.16 = mixed oil with sesamin addition 1.16 g 100g-1diet. 423 424
425
17
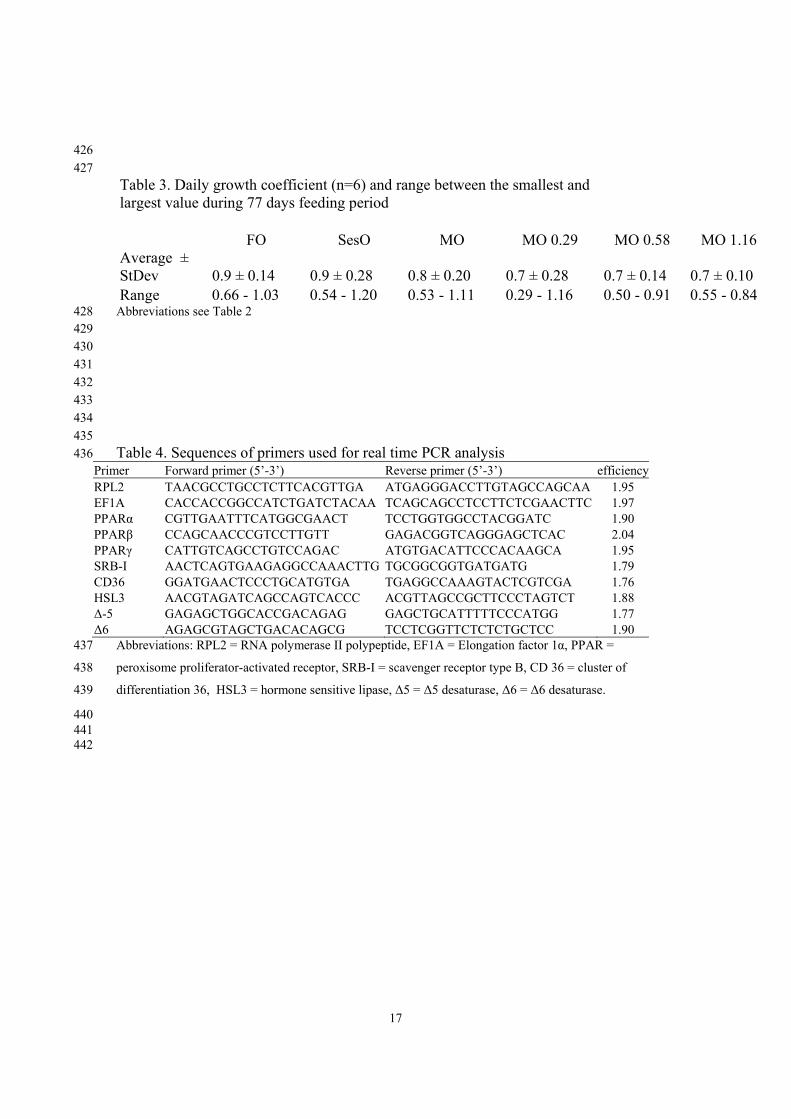
426 427 Table 3. Daily growth coefficient (n=6) and range between the smallest and largest value during 77 days feeding period FO SesO MO MO 0.29 MO 0.58 MO 1.16 Average ± StDev 0.9 ± 0.14 0.9 ± 0.28 0.8 ± 0.20 0.7 ± 0.28 0.7 ± 0.14 0.7 ± 0.10 Range 0.66 - 1.03 0.54 - 1.20 0.53 - 1.11 0.29 - 1.16 0.50 - 0.91 0.55 - 0.84
Abbreviations see Table 2 428 429 430 431 432 433 434 435 Table 4. Sequences of primers used for real time PCR analysis 436
Primer Forward primer (5’-3’) Reverse primer (5’-3’) efficiency RPL2 TAACGCCTGCCTCTTCACGTTGA ATGAGGGACCTTGTAGCCAGCAA 1.95 EF1A CACCACCGGCCATCTGATCTACAA TCAGCAGCCTCCTTCTCGAACTTC 1.97 PPARα CGTTGAATTTCATGGCGAACT TCCTGGTGGCCTACGGATC 1.90 PPARβ CCAGCAACCCGTCCTTGTT GAGACGGTCAGGGAGCTCAC 2.04 PPARγ CATTGTCAGCCTGTCCAGAC ATGTGACATTCCCACAAGCA 1.95 SRB-I AACTCAGTGAAGAGGCCAAACTTG TGCGGCGGTGATGATG 1.79 CD36 GGATGAACTCCCTGCATGTGA TGAGGCCAAAGTACTCGTCGA 1.76 HSL3 AACGTAGATCAGCCAGTCACCC ACGTTAGCCGCTTCCCTAGTCT 1.88 Δ-5 GAGAGCTGGCACCGACAGAG GAGCTGCATTTTTCCCATGG 1.77 Δ6 AGAGCGTAGCTGACACAGCG TCCTCGGTTCTCTCTGCTCC 1.90
Abbreviations: RPL2 = RNA polymerase II polypeptide, EF1A = Elongation factor 1α, PPAR = 437
peroxisome proliferator-activated receptor, SRB-I = scavenger receptor type B, CD 36 = cluster of 438
differentiation 36, HSL3 = hormone sensitive lipase, Δ5 = Δ5 desaturase, Δ6 = Δ6 desaturase. 439
440 441 442
18
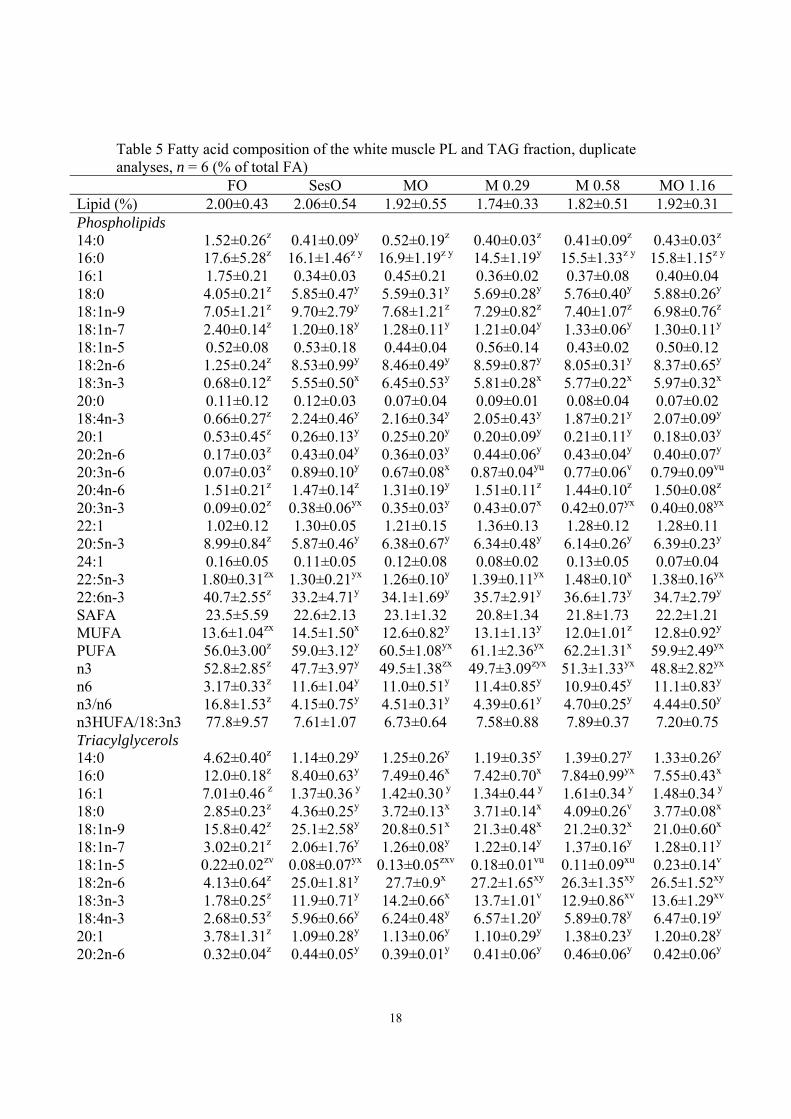
Table 5 Fatty acid composition of the white muscle PL and TAG fraction, duplicate analyses, n = 6 (% of total FA)
FO SesO MO M 0.29 M 0.58 MO 1.16 Lipid (%) 2.00±0.43 2.06±0.54 1.92±0.55 1.74±0.33 1.82±0.51 1.92±0.31 Phospholipids 14:0 1.52±0.26z 0.41±0.09y 0.52±0.19z 0.40±0.03z 0.41±0.09z 0.43±0.03z 16:0 17.6±5.28z 16.1±1.46z y 16.9±1.19z y 14.5±1.19y 15.5±1.33z y 15.8±1.15z y
16:1 1.75±0.21 0.34±0.03 0.45±0.21 0.36±0.02 0.37±0.08 0.40±0.04 18:0 4.05±0.21z 5.85±0.47y 5.59±0.31y 5.69±0.28y 5.76±0.40y 5.88±0.26y 18:1n-9 7.05±1.21z 9.70±2.79y 7.68±1.21z 7.29±0.82z 7.40±1.07z 6.98±0.76z 18:1n-7 2.40±0.14z 1.20±0.18y 1.28±0.11y 1.21±0.04y 1.33±0.06y 1.30±0.11y 18:1n-5 0.52±0.08 0.53±0.18 0.44±0.04 0.56±0.14 0.43±0.02 0.50±0.12 18:2n-6 1.25±0.24z 8.53±0.99y 8.46±0.49y 8.59±0.87y 8.05±0.31y 8.37±0.65y 18:3n-3 0.68±0.12z 5.55±0.50x 6.45±0.53y 5.81±0.28x 5.77±0.22x 5.97±0.32x 20:0 0.11±0.12 0.12±0.03 0.07±0.04 0.09±0.01 0.08±0.04 0.07±0.02 18:4n-3 0.66±0.27z 2.24±0.46y 2.16±0.34y 2.05±0.43y 1.87±0.21y 2.07±0.09y 20:1 0.53±0.45z 0.26±0.13y 0.25±0.20y 0.20±0.09y 0.21±0.11y 0.18±0.03y 20:2n-6 0.17±0.03z 0.43±0.04y 0.36±0.03y 0.44±0.06y 0.43±0.04y 0.40±0.07y 20:3n-6 0.07±0.03z 0.89±0.10y 0.67±0.08x 0.87±0.04yu 0.77±0.06v 0.79±0.09vu 20:4n-6 1.51±0.21z 1.47±0.14z 1.31±0.19y 1.51±0.11z 1.44±0.10z 1.50±0.08z 20:3n-3 0.09±0.02z 0.38±0.06yx 0.35±0.03y 0.43±0.07x 0.42±0.07yx 0.40±0.08yx 22:1 1.02±0.12 1.30±0.05 1.21±0.15 1.36±0.13 1.28±0.12 1.28±0.11 20:5n-3 8.99±0.84z 5.87±0.46y 6.38±0.67y 6.34±0.48y 6.14±0.26y 6.39±0.23y 24:1 0.16±0.05 0.11±0.05 0.12±0.08 0.08±0.02 0.13±0.05 0.07±0.04 22:5n-3 1.80±0.31zx 1.30±0.21yx 1.26±0.10y 1.39±0.11yx 1.48±0.10x 1.38±0.16yx 22:6n-3 40.7±2.55z 33.2±4.71y 34.1±1.69y 35.7±2.91y 36.6±1.73y 34.7±2.79y SAFA 23.5±5.59 22.6±2.13 23.1±1.32 20.8±1.34 21.8±1.73 22.2±1.21 MUFA 13.6±1.04zx 14.5±1.50x 12.6±0.82y 13.1±1.13y 12.0±1.01z 12.8±0.92y PUFA 56.0±3.00z 59.0±3.12y 60.5±1.08yx 61.1±2.36yx 62.2±1.31x 59.9±2.49yx n3 52.8±2.85z 47.7±3.97y 49.5±1.38zx 49.7±3.09zyx 51.3±1.33yx 48.8±2.82yx n6 3.17±0.33z 11.6±1.04y 11.0±0.51y 11.4±0.85y 10.9±0.45y 11.1±0.83y n3/n6 16.8±1.53z 4.15±0.75y 4.51±0.31y 4.39±0.61y 4.70±0.25y 4.44±0.50y n3HUFA/18:3n3 77.8±9.57 7.61±1.07 6.73±0.64 7.58±0.88 7.89±0.37 7.20±0.75 Triacylglycerols 14:0 4.62±0.40z 1.14±0.29y 1.25±0.26y 1.19±0.35y 1.39±0.27y 1.33±0.26y 16:0 12.0±0.18z 8.40±0.63y 7.49±0.46x 7.42±0.70x 7.84±0.99yx 7.55±0.43x 16:1 7.01±0.46 z 1.37±0.36 y 1.42±0.30 y 1.34±0.44 y 1.61±0.34 y 1.48±0.34 y 18:0 2.85±0.23z 4.36±0.25y 3.72±0.13x 3.71±0.14x 4.09±0.26v 3.77±0.08x 18:1n-9 15.8±0.42z 25.1±2.58y 20.8±0.51x 21.3±0.48x 21.2±0.32x 21.0±0.60x 18:1n-7 3.02±0.21z 2.06±1.76y 1.26±0.08y 1.22±0.14y 1.37±0.16y 1.28±0.11y 18:1n-5 0.22±0.02zv 0.08±0.07yx 0.13±0.05zxv 0.18±0.01vu 0.11±0.09xu 0.23±0.14v 18:2n-6 4.13±0.64z 25.0±1.81y 27.7±0.9x 27.2±1.65xy 26.3±1.35xy 26.5±1.52xy 18:3n-3 1.78±0.25z 11.9±0.71y 14.2±0.66x 13.7±1.01v 12.9±0.86xv 13.6±1.29xv 18:4n-3 2.68±0.53z 5.96±0.66y 6.24±0.48y 6.57±1.20y 5.89±0.78y 6.47±0.19y 20:1 3.78±1.31z 1.09±0.28y 1.13±0.06y 1.10±0.29y 1.38±0.23y 1.20±0.28y 20:2n-6 0.32±0.04z 0.44±0.05y 0.39±0.01y 0.41±0.06y 0.46±0.06y 0.42±0.06y
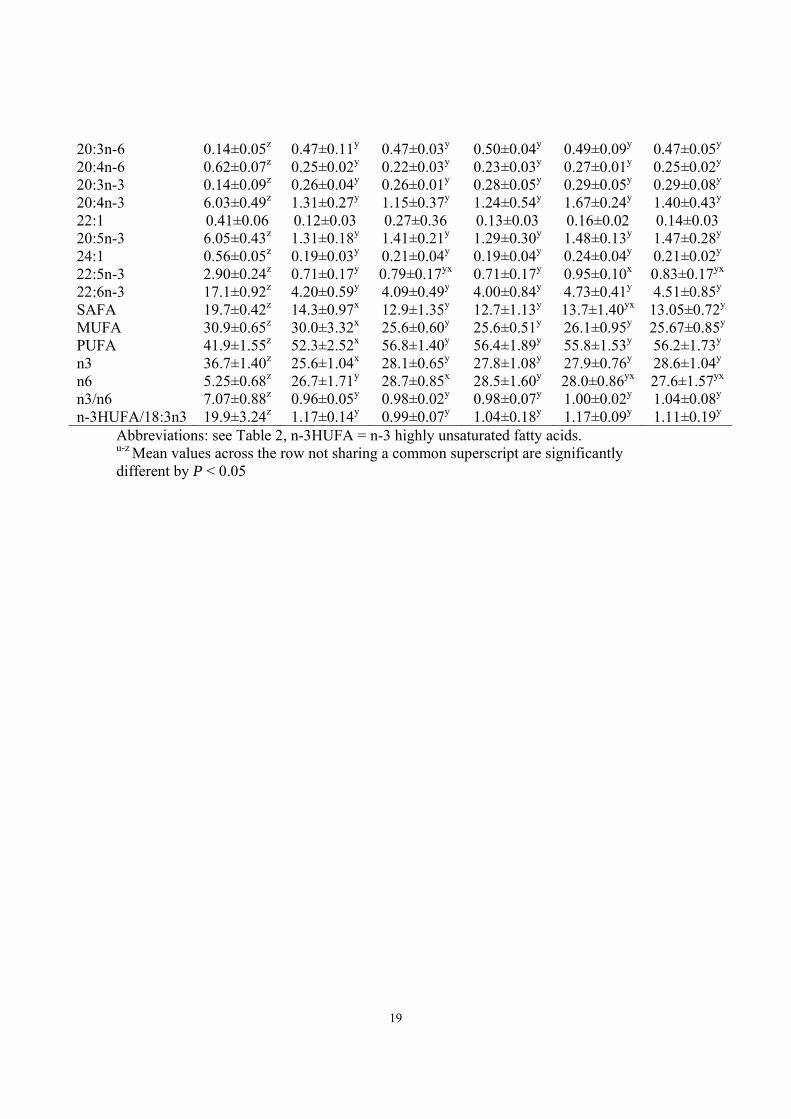
19
20:3n-6 0.14±0.05z 0.47±0.11y 0.47±0.03y 0.50±0.04y 0.49±0.09y 0.47±0.05y 20:4n-6 0.62±0.07z 0.25±0.02y 0.22±0.03y 0.23±0.03y 0.27±0.01y 0.25±0.02y 20:3n-3 0.14±0.09z 0.26±0.04y 0.26±0.01y 0.28±0.05y 0.29±0.05y 0.29±0.08y 20:4n-3 6.03±0.49z 1.31±0.27y 1.15±0.37y 1.24±0.54y 1.67±0.24y 1.40±0.43y 22:1 0.41±0.06 0.12±0.03 0.27±0.36 0.13±0.03 0.16±0.02 0.14±0.03 20:5n-3 6.05±0.43z 1.31±0.18y 1.41±0.21y 1.29±0.30y 1.48±0.13y 1.47±0.28y 24:1 0.56±0.05z 0.19±0.03y 0.21±0.04y 0.19±0.04y 0.24±0.04y 0.21±0.02y 22:5n-3 2.90±0.24z 0.71±0.17y 0.79±0.17yx 0.71±0.17y 0.95±0.10x 0.83±0.17yx 22:6n-3 17.1±0.92z 4.20±0.59y 4.09±0.49y 4.00±0.84y 4.73±0.41y 4.51±0.85y SAFA 19.7±0.42z 14.3±0.97x 12.9±1.35y 12.7±1.13y 13.7±1.40yx 13.05±0.72y
MUFA 30.9±0.65z 30.0±3.32x 25.6±0.60y 25.6±0.51y 26.1±0.95y 25.67±0.85y
PUFA 41.9±1.55z 52.3±2.52x 56.8±1.40y 56.4±1.89y 55.8±1.53y 56.2±1.73y n3 36.7±1.40z 25.6±1.04x 28.1±0.65y 27.8±1.08y 27.9±0.76y 28.6±1.04y n6 5.25±0.68z 26.7±1.71y 28.7±0.85x 28.5±1.60y 28.0±0.86yx 27.6±1.57yx n3/n6 7.07±0.88z 0.96±0.05y 0.98±0.02y 0.98±0.07y 1.00±0.02y 1.04±0.08y n-3HUFA/18:3n3 19.9±3.24z 1.17±0.14y 0.99±0.07y 1.04±0.18y 1.17±0.09y 1.11±0.19y
Abbreviations: see Table 2, n-3HUFA = n-3 highly unsaturated fatty acids. u-z Mean values across the row not sharing a common superscript are significantly different by P < 0.05
20
Table 6. Content of vitamin E, sesamin and episesamin in white muscle and liver (µg g-1) FO SesO MO MO 0.29 MO 0.58 MO 1.16 White muscle α-Tocopherol 1.36±0.58 1.00±0.19 1.09±0.73 1.46±0.20 1.50±0.26 1.53±0.23 γ- Tocopherol 0.15±0.04u 0.80±0.50uv 1.01±0.97vz 1.74±0.36xy 1.14±0.61vyz 1.87±0.36x Episesamin - 0.32±0.23 - 0.40±0.21 0.37±0.21 0.32±0.10 Sesamin - 0.20±0.09 - 0.20±0.12 0.14±0.08 0.16±0.04 Liver α-Tocopherol 87.8±37.7y 146.4±28.3y 234.7±83.5z 195.5±56.4z 231.74±87.8z 188.0±63.6z γ-Tocopherol 1.73±1.29y 11. 9±4.05z 11.3±3.00z 8.30±2.30z 9.46±3.11z 9.37±2.63z Episesamin - 2.43±0.95yz - 1.69±0.78y 2.32±0.52yz 3.14±0.75z Sesamin - 1.90±1.17x - 0.67±0.27z 0.81±0.08zy 1.53±0.43xy
Abbreviations: see Table 2. MO, n = 4; FO, n = 3; SesO, n = 4; MO 0.29 n= 5; MO 0.58 n= 4; MO 1.16 n= 5. u-z Mean values across the row not sharing a common superscript are significantly different by P < 0.05 Table 7. An overview of the desaturation index in Atlantic salmon and rainbow trout fed different oils
Reference 18:3n3 (%) diet
Oil sourse
Desat. index
Species Tissue Lipid fraction
Leaver et al. 1.2 FO 77.2 A. salmon Liver Total lipid (2008) 44.9 LO 1.3 8.1 RO 11.5 5.7 SO 8.6 Menoyo et al. 41.7 LO 100 1.73 A. salmon Muscle Polar lipids (2007) 30.2 LO 75 2.71 25.8 LO 50 2.85 12.1 LO 25 5.20 41.7 LO 100 0.44 A. salmon Muscle Neutral lipids 30.2 LO 75 0.56 25.8 LO 50 0.65 12.1 LO 25 1.27 Trattner et al. 31.7 MO 10.4 R. trout Muscle Phospholipid (2008a) 53.4 LO 5.0 31.7 MO 1.3 Triacylglycerol 53.4 LO 0.7 Rosenlund et al. 10.2 RO 1.8 A. salmon Muscle Total lipid (2001) 22.6 LO 0.9 17.0 SO 1.0 Abbreviations: Desat. Index = Desaturation index = (n-3HUFA > 18C) / 18:3n-3 FO = fish oil, LO = linseed oil, RO = rapeseed oil, SO = soybean oil, LO100 = 100% linseed oil, LO75 = 75% linseed oil and 25% sunflower oil, LO50 = 50% linseed oil and 50% sunflower oil, LO25 = 25% linseed oil and 75% sunflower oil, MO = mixture of linseed oil and sunflower oil (6:4).
21
Figure 1. Relative expression ratio compared to the MO group of the analyzed genes in the FO, SesO, MO 0.29, MO 0.58 and MO 1.16 groups. Genes with significantly different expression ratio to the MO group are indicated with an asterisk (P< 0.05). For abbreviations see Table 2 and 3. Figure 2. Ethoxyresorufin O-deethylase activity, EROD (pmol.min-1.mg-1 protein) and total cytochrome P450, CYP (nM/mg microsomal protein) in the liver. MO, n = 4; FO, n = 3; SesO, n = 4; MO 0.29 n= 5; MO 0.58 n= 4; MO 1.16 n= 5. Significantly different CYP content are indicated with an asterisk (P< 0.05).
0.0
0.5
1.0
1.5
2.0
2.5
3.0
3.5
4.0
4.5
SRB PPARα PPARβ PPARγ CD36 HSL Δ5 Δ6
Rel
ativ
e ex
pres
sion
ratio
FOSesOMO 0.29MO 0.58MO 1.16
* *
*
*
Figure 1.
0
50
100
150
200
250
300
FO SesO MO MO 0.29 MO 0.58 MO 1.16
ER
OD
pm
ol/m
in/m
g
0
50
100
150
200
250
300
350
FO SesO MO MO 0.29 MO 0.58 MO 1.16
CY
P p
mol
/mg *
*
*
Figure 2.

22
23
References Appelqvist, L. 1968. Rapid methods of lipid extractions and fatty acid methyl ester preparation for seed and
leaf tissue with special remarks on preventing the accumulation of lipids contaminants. Royal Swedish academy of Science (Kungliga Svenska Vetenskapsakademien) 28: 551-570.
Ashakumary, L., I. Rouyer, Y. Takahashi, T. Ide, N. Fukuda, T. Aoyama, T. Hashimoto, M. Mizugaki and M. Sugano. 1999. Sesamin, a sesame lignan, is a potent inducer of hepatic fatty acid oxidation in the rat. Metabolism-Clinical and Experimental 48(10): 1303-1313.
Bell, J. G., J. McEvoy, D. R. Tocher, F. McGhee, P. J. Campbell and J. R. Sargent. 2001. Replacement of fish oil with rapeseed oil in diets of Atlantic salmon (Salmo salar) affects tissue lipid compositions and hepatocyte fatty acid metabolism. Journal of Nutrition 131(5): 1535-1543.
Berge, K., K. J. Tronstad, E. N. Flindt, T. H. Rasmussen, L. Madsen, K. Kristiansen and R. K. Berge. 2001. Tetradecylthioacetic acid inhibits growth of rat glioma cells ex vivo and in vivo via PPAR-dependent and PPAR-independent pathways. Carcinogenesis 22(11): 1747-1755.
FAO. 2007. FAOSTAT, faostat.fao.org/. (8 November 2007). Frank, J., A. Kamal-Eldin and M. G. Traber (2004). Consumption of sesame oil muffins decreases the
urinary excretion of gamma-tocopherol metabolites in humans. Vitamin E and Health. 1031: 365-367.
Hara, A. and N. S. Radin. 1978. Lipid extraction of tissue with low toxicity solvent. Analytic Biochemistry 90: 420-426.
Havelkova, M., T. Randak, V. Zlabek, J. Krijt, H. Kroupova, J. Pulkrabova and Z. Svobodova. 2007. Biochemical markers for assessing aquatic contamination. Sensors 7: 2599-2611.
Huong, D. T. T. and T. Ide. 2008. Dietary lipoic acid-dependent changes in the activity and mRNA levels of hepatic lipogenic enzymes in rats. British Journal of Nutrition 100(1): 79-87.
Ide, T., D. D. Hong, P. Ranasinghe, Y. Takahashi, M. Kushiro and M. Sugano. 2004. Interaction of dietary fat types and sesamin on hepatic fatty acid oxidation in rats. Biochimica Et Biophysica Acta-Molecular and Cell Biology of Lipids 1682(1-3): 80-91.
Jeng, K. C. G. and R. C. W. Hou. 2005. Sesamin and sesamolin: Nature's Therapeutic Lignans. Current enzyme Inhibition 1: 11-20.
Jönsson, M., A. Abrahamson, B. Brunström and I. Brandt. 2006. Cytochrome P4501A induction in rainbow trout gills and liver following exposure to waterborne indigo, benzo(a)pyrene and 3,3´,4´,5-pentachlorobiphenyl
Aquatic Toxicology 79: 226-232. Kamal-Eldin, A., J. Frank, A. Razdan, S. Tengblad, S. Basu and B. Vessby. 2000. Effects of dietary
phenolic compounds on tocopherol, cholesterol, and fatty acids in rats. Lipids 35(4): 427-435. Kamaleldin, A., D. Pettersson and L. A. Appelqvist. 1995. Sesamin (a Compound from Sesame Oil)
Increases Tocopherol Levels in Rats Fed Ad-Libitum. Lipids 30(6): 499-505. Kiso, Y., N. Tsuruoka, A. Kidokoro, I. Matsumoto and K. Abe. 2005. Sesamin ingestion regulates the
transcription levels of hepatic metabolizing enzymes for alcohol and lipids in rats. Alcoholism-Clinical and Experimental Research 29(11): 116S-120S.
Kleveland, E. J., B. Ruyter, A. Vegusdal, H. Sundvold, R. K. Berge and T. Gjoen. 2006. Effects of 3-thia fatty acids on expression of some lipid related genes in Atlantic salmon (Salmo salar L.). Comparative Biochemistry and Physiology B-Biochemistry & Molecular Biology 145(2): 239-248.
Kushiro, M., T. Masaoka, S. Hageshita, Y. Takahashi, T. Ide and M. Sugano. 2002. Comparative effect of sesamin and episesamin on the activity and gene expression of enzymes in fatty acid oxidation and synthesis in rat liver. The Journal of Nutritional Biochemistry 13(5): 289-295.
Leaver, M. J., L. A. N. Villeneuve, A. Obach, L. Jensen, J. E. Bron, D. R. Tocher and J. B. Taggart. 2008. Functional genomics reveals increases in cholesterol biosynthetic genes and highly unsaturated fatty acid biosynthesis after dietary substitution of fish oil with vegetable oils in Atlantic salmon (Salmo salar). Bmc Genomics 9.
Moazzami, A. and A. Kamal-Eldin. 2006. Sesame seed is a rich source of dietary lignans. Journal of the American Oil Chemists Society 83(8): 719-723.
Morais, S., O. Monroig, X. Z. Zheng, M. J. Leaver and D. R. Tocher. 2009. Highly Unsaturated Fatty Acid Synthesis in Atlantic Salmon: Characterization of ELOVL5-and ELOVL2-like Elongases. Marine Biotechnology 11(5): 627-639.
24
Moya-Falcon, C., E. Hvattum, T. N. Tran, M. S. Thomassen, J. Skorve and B. Ruyter. 2006. Phospholipid molecular species, beta-oxidation, desaturation and elongation of fatty acids in Atlantic salmon hepatocytes: Effects of temperature and 3-thia fatty acids. Comparative Biochemistry and Physiology B-Biochemistry & Molecular Biology 145(1): 68-80.
Mozaffarian, D. and E. B. Rimm. 2006. Fish intake, contaminants, and human health - Evaluating the risks and the benefits. Jama-Journal of the American Medical Association 296(15): 1885-1899.
Murray, M. 2000. Mechanisms of inhibitory and regulatory effects of methylenedioxyphenyl compounds on cytochrome P450-dependent drug oxidation. . Current Drug Metabolism 1: 67-84.
Nelson, D. R., L. Koymans, T. Kamataki, J. J. Stegeman, R. Feyereisen, D. J. Waxman, M. R. Waterman, O. Gotoh, M. J. Coon, R. W. Estabrook, I. C. Gunsalus and D. W. Nebert. 1996. P450 superfamily: Update on new sequences, gene mapping, accession numbers and nomenclature. Pharmacogenetics 6(1): 1-42.
Omura, T. and R. Sato. 1964. The carbon monoxide-binding pigment of liver microsomes. II. Solubilization, purification, and properties. J Biol Chem 239: 2379-2385.
Pettersson, A., L. Johnsson, E. Brannas and J. Pickova. 2009. Effects of rapeseed oil replacement in fish feed on lipid composition and self-selection by rainbow trout (Oncorhynchus mykiss). Aquaculture Nutrition 15(6): 577-586.
Pfaffl, M. W., G. W. Horgan and L. Dempfle. 2002. Relative expression software tool (REST (c)) for group-wise comparison and statistical analysis of relative expression results in real-time PCR. Nucleic Acids Research 30(9).
Schlechtriem, C., J. E. Bron and D. R. Tocher. 2007. Inter-individual variation in total fatty acid compositions of flesh of Atlantic salmon smolts-fed diets containing fish oil or vegetable oil. Aquaculture Research 38(10): 1045-1055.
Shimizu, S., K. Akimoto, Y. Shinmen, H. Kawashima, M. Sugano and H. Yamada. 1991. Sesamin Is a Potent and Specific Inhibitor of Delta-5 Desaturase in Polyunsaturated Fatty-Acid Biosynthesis. Lipids 26(7): 512-516.
Smith, P. K., R. I. Krohn, G. T. Hermansson, A. K. Malilia, Gartner, F.H., M. D. Provenzano, E. K. Fujimito, N. M. Goeke, B. J. Olson and D. C. Klenk. 1985. Measurement of protein using bicinchoninic acid. Analytical Biochemistry 150: 76-85.
Tacon, A. G. J. (2005). Global trends in aquaculture and compound aquafeed production. International Aquafeed Directory and Buyers’ Guide. A. G. J. Tacon, R. A. I., Turret Uxbridge, Middlesex (United Kingdom): 8-23.
Tocher, D. R., J. Fonseca-Madrigal, J. G. Bell, J. R. Dick, R. J. Henderson and J. R. Sargent. 2002. Effects of diets containing linseed oil on fatty acid desaturation and oxidation in hepatocytes and intestinal enterocytes in Atlantic salmon (Salmo salar). Fish Physiology and Biochemistry 26(2): 157-170.
Torstensen, B. E., J. G. Bell, G. Rosenlund, R. J. Henderson, I. E. Graff, D. R. Tocher, O. Lie and J. R. Sargent. 2005. Tailoring of Atlantic salmon (Salmo salar L.) flesh lipid composition and sensory quality by replacing fish oil with a vegetable oil blend. Journal of Agricultural and Food Chemistry 53(26): 10166-10178.
Trattner, S., A. Kamal-Eldin, E. Brannas, A. Moazzami, V. Zlabek, P. Larsson, B. Ruyter, T. Gjoen and J. Pickova. 2008. Sesamin Supplementation Increases White Muscle Docosahexaenoic Acid (DHA) Levels in Rainbow Trout (Oncorhynchus mykiss) Fed High Alpha-Linolenic Acid (ALA) Containing Vegetable Oil: Metabolic Actions. Lipids 43(11): 989-997.
Trattner, S., J. Pickova, K. H. Park, J. Rinchard and K. Dabrowski. 2007. Effects of alpha-lipoic and ascorbic acid on the muscle and brain fatty acids and antioxidant profile of the South American pacu Piaractus mesopotamicus. Aquaculture 273(1): 158-164.
Trattner, S., B. Ruyter, T. K. Ostbye, T. Gjoen, V. Zlabek, A. Kamal-Eldin and J. Pickova. 2008. Sesamin Increases Alpha-Linolenic Acid Conversion to Docosahexaenoic Acid in Atlantic Salmon (Salmo salar L.) Hepatocytes: Role of Altered Gene Expression. Lipids 43(11): 999-1008.
Umeda-Sawada, R., M. Ogawa and O. Igarashi. 1998. The Metabolism and n-6/n-3 Ratio of Essential Fatty Acids in Rats: Effect of Dietary Arachidonic Acid and Mixture of Sesame Lignans (sesamin and episesamin). Lipids 33(6): 567-527.
Umeda-Sawada, R., M. Ogawa and O. Igarashi. 1999. The metabolism and distribution of sesame lignans (sesamin and episesamin) in rats. Lipids 34(6): 633-637.
25
Watt, M. J., G. R. Steinberg, G. J. F. Heigenhauser, L. L. Spriet and D. J. Dyck. 2003. Hormone-sensitive lipase activity and triacylglycerol hydrolysis are decreased in rat soleus muscle by cyclopiazonic acid. American Journal of Physiology-Endocrinology and Metabolism 285(2): E412-E419.
Williams, D. E., J. J. Lech and D. R. Buhler. 1998. Xenobiotics and xenoestrogens in fish: modulation of cytochrome P450 and carcinogenesis. Mutation Research-Fundamental and Molecular Mechanisms of Mutagenesis 399(2): 179-192.
Voss, A., M. Reinhart, S. Sankarappa and H. Sprecher. 1991. The Metabolism of 7,10,13,16,19-Docosapentaenoic Acid to 4,7,10,13,16,19-Docosahexaenoic Acid in Rat-Liver Is Independent of a 4-Desaturase. Journal of Biological Chemistry 266(30): 19995-20000.
Zheng, X. Z., B. E. Torstensen, D. R. Tocher, J. R. Dick, R. J. Henderson and J. G. Bell. 2005. Environmental and dietary influences on highly unsaturated fatty acid biosynthesis and expression of fatty acyl desaturase and elongase genes in liver of Atlantic salmon (Salmo salar). Biochimica Et Biophysica Acta-Molecular and Cell Biology of Lipids 1734(1): 13-24.