Embed Size (px)
Citation preview

Salmon Creek WatershedBacteria and Turbidity
Total Maximum Daily Load
Submittal Report
January 2001Publication No. 01-10-007

Salmon Creek Watershed
Bacteria and Turbidity
Total Maximum Daily Load
Submittal Report
By
Dave Howard
Washington State Department of EcologyWater Quality ProgramVancouver Field Office
2108 Grand Blvd.Vancouver, Washington 98661-4622
Telephone (360) 690-4796
e-mail [email protected]
January 2001Publication No. 01-10-007

For additional copies of this report, contact:
Department of EcologyPublications
P.O. Box 47600Olympia, WA 98504-7600Telephone: (360) 407-7472
The Department of Ecology is an equal opportunity agency and does not discriminate on the basis ofrace, creed, color, disability, age, religion, national origin, sex, marital status, disabled veteran'sstatus, Vietnam Era veteran's status, or sexual orientation.
If you have special accommodation needs or require this document in an alternative format, pleasecall Donna Lynch at (360) 407-7529. The TDD number is (306) 407-6006. E-mail can be sent [email protected]

Salmon Creek Bacteria and Turbidity Page i
Table Of Contents
List of Figures..........................................................................................................................................1
List of Tables ........................................................................................................................................... I
Introduction.............................................................................................................................................1
Acknowledgements..................................................................................................................................3
Methodology and Components of The Tmdl…………………………………………………………3
Background .............................................................................................................................................5
Applicable Criteria .................................................................................................................................9
Water Quality and Resources Impairments………………………………………………………...11
Modeling Approach ..............................................................................................................................13
Loading Capacity and Wasteload Allocations ...................................................................................13
Margin of Safety……………………………………………………………………………………....19
Summary Implementation Strategy ....................................................................................................19
Appendix A - Public Participation Materials…………………………………….…………………27
Appendix B - Quality Assurance Project Plan………………………………………………………29
Appendix C - Technical Report: Salmon Creek Nonpoint Pollution Tmdl……………………….39

Page ii Salmon Creek Bacteria and Turbidity
List of Figures
Figure 1. Salmon Creek study area and sampling locations
List of TablesTable 1. 1998 §303(d) List for the Salmon Creek Drainage
Table 2. Salmon Creek average, minimum, and maximum flows based onUSGS station data, 1943-1994, collected near Battleground, and averageand minimum flows based on 1991-94 data collected by CCDCD at astation near Klineline Park. All units in cfs
Table 3. Salmon Creek drainage wet and dry season fecal coliform geometricmeans, 90th percentiles, and recommended reductions
Table 4. Salmon Creek drainage wet and dry season average turbidity, 90th percentiles, andrecommended reductions

Salmon Creek Bacteria and Turbidity Page 1
Introduction
Clark County, the fastest growing county in the state, faces water quality challenges in the SalmonCreek watershed. The creek and its tributaries are located northeast of Vancouver and entirely withinClark County. Salmon Creek flows from the foothills of the Cascade Mountains through a mixture ofsmall towns, small and large farms, pasture, and homes. Near the end of its journey, it meandersthrough a highly urbanized, developed area of Clark County and then west to Lake River, which flowsinto the Columbia River.
Under the Clean Water Act, every state has its own water quality standards designed to protect, restore,and preserve water quality. Water quality standards consist of designated uses, such as cold waterbiota and drinking water supply, and criteria, usually numeric criteria, to achieve those uses. When alake, river or stream fails to meet water quality standards the Clean Water Act requires that the stateplace the water body on a list of "impaired" water bodies. When a water body is listed, the state isrequired to prepare an analysis called a Total Maximum Daily Load (TMDL). The U.S.Environmental Protection Agency (EPA) has established regulations (40 CFR 130) and developedguidance (EPA, 1991) for establishing TMDLs.
The goal of a TMDL is to ensure the impaired water will attain state water quality standards. A TMDLincludes a quantitative assessment of water quality problems and of the pollutant sources that causethem. The TMDL determines the amount of a given pollutant that can be discharged to the water bodyand still meet standards, called the loading capacity, and allocates that load among the various sources.If the pollutant comes from a discrete source (referred to as a point source), such as an industrialfacility’s discharge pipe, that facility’s share of the loading capacity is called a wasteload allocation. Ifthe load comes from a diffuse source (referred to as a nonpoint source), such as a farm or stormwaterrunoff, that facility’s share is called a load allocation.
The TMDL must also consider seasonal variations and include a margin of safety. The margin ofsafety takes into account any lack of knowledge about the causes of the water quality problem or theloading capacity. The sum of the individual allocations and the margin of safety must be equal to orless than the loading capacity.
A study completed in 1995 by the State of Washington Department of Ecology (Ecology) foundsignificant violations of water quality standards in Salmon Creek for fecal coliform, turbidity,temperature and dissolved oxygen. Water quality monitoring by Clark Public Utilities from 1995 to1999 shows that violations of water quality standards are continuing.
Fecal coliform is a major concern because it indicates that biological waste is entering the river.Common sources of fecal coliform are failing septic tanks and agricultural waste.
Turbidity is a measure of the ability of light to pass through the water and indicates suspended solids.Turbid water impairs the ability of fish to survive and spawn. It also degrades habitat needed foraquatic invertebrates that are a food source for fish. Runoff from construction sites and washouts dueto natural and human causes sometimes cause turbid water.

Page 2 Salmon Creek Bacteria and Turbidity
Ecology is establishing a TMDL for Salmon Creek watershed for fecal coliform and turbidity. ThisTMDL will address potential impairments of beneficial uses on four stream segments in this watershedthat are listed in the 1998 Section 303(d) list of impaired surface waters. As models and loadallocations are developed for other parameters that exceed water quality standards in this watershed,they will be added to this TMDL.
This Submittal Report to EPA establishes load allocations for fecal coliform and turbidity. The reportalso includes a summary implementation schedule that lists the groups that will implement the cleanupof Salmon Creek.
AcknowledgementsThis Submittal Report is based on the technical report written by Robert F. Cusimano and DavidGiglio and published as Ecology Publication No. 95-335 in October 1995. The SummaryImplementation Schedule was reviewed by Liza Bucy, Clark Conservation District, Douglas M.Stienbarger, WSU Cooperative Extension Clark County and Rod Swanson, Clark County PublicWorks Department. I greatly appreciate their assistance in developing this report.

Salmon Creek Bacteria and Turbidity Page 3
Methodology and Components of the TMDLThe five components of any TMDL as required by the Clean Water Act are defined as:
Loading Capacity:
The greatest amount of pollution load that a water body can receive without violating water qualitystandards. The loading capacity of fecal coliform and turbidity varies with seasonal flow based on thepeak loading measured.
Wasteload Allocation:
The portion of a water body’s loading capacity that is allocated to one of the existing or potential pointsources of pollution. Salmon Creek watershed has no permitted discharges therefore, the waste loadallocations are set at zero.
Load Allocations:
The portion of a water body’s loading capacity that is attributed either to one of its existing or potentialnonpoint sources of pollution or to natural background sources. The Salmon Creek watershed loadallocations for fecal coliform are equal to the loading capacities described in the document. Thereductions in fecal coliform needed to achieve the load allocations in the various stream segments ofthe watershed range from 98% to 32%. The reductions in turbidity necessary to meet the loadallocation range from 16% to 75%.
Margin of Safety:
A margin of safety is identified to account for uncertainty when establishing a TMDL. The margin ofsafety can be explicit in the form of an allocation, or implicit in the use of conservative assumptions inthe analysis. In this study, the margin of safety was implicit due to the use of conservative values forthe geometric mean and ninety 90th percentile.
Seasonal Variation:
Seasonal variation was accounted for by organizing data into “wet” and “dry” seasons. Grouping thehighest and lowest six contiguous month’s average flow allowed allocations to be made separately forhigh and low flow periods.
Monitoring the Results:
Evaluating the effectiveness of best management practices (BMPs) to achieve water cleanup is vital.In June 1995, Ecology, Clark Public Utilities, (CPU) and Clark County ratified the Salmon CreekBasin Monitoring and Management Implementation Plan. CPU has contracted with the PacificGroundwater Group (PGG) to continue sampling at control points used to establish Load Allocationsfor fecal coliform and turbidity. Sampling began in summer 1995 and is ongoing.

Page 4 Salmon Creek Bacteria and Turbidity

Salmon Creek Bacteria and Turbidity Page 5
BackgroundSalmon Creek, located entirely within Clark County, flows from the foothills of the CascadeMountains west to Lake River which in turn flows into the Columbia River. The Cascade foothills aregenerally forested while the lower drainage is primarily urban. The city of Vancouver lies just south oflower Salmon Creek, and several small towns lie along the tributaries and central plains of the basin.These middle reaches contain a mixture of small towns, large and small-scale farms, pasture, andhomes. Six major tributaries flow into Salmon Creek: Rock Creek and Morgan Creek to the east,Weaver Creek (also called Woodin) and Curtin Creek (also called Glenwood) in the middle, and MillCreek and Cougar Creek to the west (Figure 1). Salmon Creek and the lower portions of Mill, Curtin,Morgan, and Rock Creeks and their associated wetlands are under shoreline jurisdiction of the ClarkCounty Shoreline Master Program.
The Salmon Creek basin is primarily rural-residential and is characterized by gently rolling hills andalluvial flood plains. Forestry, agriculture, commercial, and industrial activities are significant useswithin the basin (Wille 1990). Urban areas also comprise a considerable proportion of the basin's landarea, mostly along its southwest reaches. The basin is highly urbanized near Vancouver, with manysmall subbasins already heavily developed. The Suds Creek, Tenny Creek, 114th Street tributary, and119th Street tributary subbasins typify the urbanization within this portion of the Salmon Creekdrainage. Cougar Creek and Curtin Creek, the larger tributaries of lower Salmon Creek, are alsodeveloping rapidly. These basins often experience problems with stormwater runoff, inadequate buffervegetation, erosion, and sedimentation. Rapid and diverse development within the basin has also led towater quality degradation of Salmon Creek and its tributaries, resulting in non-attainment of statewater quality standards.
Weaver Creek is a well-studied example of a Salmon Creek tributary suffering human-induceddegradation. Flowing through Battle Ground, Weaver Creek received the town's treated wastewater,which resulted in violations of state water quality standards, most notably dissolved oxygen andammonia. A 1978 Ecology study found that total ammonia in the wastewater treatment plant's(WWTP) outflow severely depleted the creek's dissolved oxygen levels, threatening aquatic life in thestream (Moore and Anderson 1978). The average dissolved oxygen concentration downstream of theoutfall was 3.7 mg/L while the standard is a minimum of 8 mg/L for a Class A waterbody. A furtherinvestigation of Battle Ground WWTP's impacts on Weaver Creek found that although streamflowresponded quickly to rain events, it was insufficient to dilute WWTP inputs (Crawford 1985). Theplant was designed to use natural stream flow to dilute effluent at a 20:1 ratio, but flow from thefacility was typically half that of the stream. In 1993, the United States Environmental ProtectionAgency approved a biochemical oxygen demand and ammonia TMDL for Weaver Creek. Subsequentto the approved TMDL, discharge from the treatment plant was rerouted to the regional wastewatertreatment plant at the mouth of Salmon Creek and discharged to Lake River.

Page 6 Salmon Creek Bacteria and Turbidity
Figure 1. Salmon Creek study area and sampling locations

Salmon Creek Bacteria and Turbidity Page 7
Fecal coliform levels on Weaver Creek, a problem throughout the basin, never met water qualitystandards both upstream and downstream of the WWTP (Crawford 1985). Upstream values were oftenhigher, implying the WWTP discharge was diluting fecal coliform concentrations. Other pointsources, including plywood manufacturing and dairy production, had been reported to contribute lessthan one percent of the coliform loading, suggesting that the fecal contamination was from nonpointpollution (Crawford 1985).
Fecal coliform contamination is a major concern because it indicates that biological waste is enteringthe water. A 1981 study investigated the basin's septic systems, which were believed to contribute tononpoint fecal coliform contamination. The study found that 3% of surveyed septic systems along theSalmon Creek drainage were leaking, and 10% had failed previously and been fixed. One finding wasthat 47% of failures were preventable: the result of a lack of maintenance, undersized systems, andpoor siting, or physical damage (SWHD 1981).
A follow-up survey in 1989 of septic systems within Salmon Creek studied all parcels adjacent to thecreek, and randomly sampled all systems within 1,000 feet of the creek and its tributaries. In thisstudy, 5.6% of the systems were failing, sub-standard, or absent. The vast majority (92%) of systemswere at least 15 years old; 58.7% of the systems had either never been pumped or were not known tohave been pumped. Calculations from this study attribute from one to five percent of Salmon Creek'sfecal coliform loading to failing septic systems (Newman 1989). The 1989 survey results are similarto the 1981 results, implying that septic systems contribute to but are not the major source of coliformcontamination.
A 1990 study of the Salmon Creek basin by the Southwest Washington Health District (SWHD) foundfecal coliform to be the most consistent and most severe violator of state water quality standards. Thisstudy isolated dairies as the primary source of contamination, with the regions around lower MorganCreek, central Salmon Creek and Mill Creek having the highest concentrations of both dairies andcoliform contamination (SWHD 1990). In response to this agriculturally-based water qualitydegradation, the Clark Conservation District (CCD) undertook a review of basin farming practices,recommending implementation of appropriate Best Management Practices (BMPs) for agriculture(CCD 1990). The document outlines BMPs for erosion and animal waste control, pastureland andcropland management, and stream corridor protection. It concludes with strong recommendations forstream fencing, streambank re-vegetation, and animal waste and sediment education programs tocounter the negative impacts of dairy production.
Negative impacts from human land uses are not strictly recent events, however. Euro-Americanssettled along Salmon Creek beginning in 1852. In 1864, A.S. Marble built the first mill on the creek.A woolen factory, which failed, also attempted to run a mill on the stream in 1867. The draining andditching of Fourth Plain swamp (now the town of Orchards) began in 1863, which may mark thebeginning of wetland losses in the area. About 1880 Isaac Dietderich built a millpond on the creek,perhaps the first man-made obstruction to salmon passage. Dairy farming in the basin goes back atleast to 1882, when the Honorable H.D. Rissell owned 30 milk cows (Parsons 1983). Pasture, small-scale farms, forestry and increasing development have all contributed to impaired water quality, whichhas gradually reduced habitat quantity and quality for salmon and other fish and aquatic organisms.
The earliest impediments to salmonid reproduction occurred in the late 19th century, when loggingdams were first constructed along Salmon Creek. Today, however, it is sedimentation fromwidespread development that impairs stream habitat quality. While no historical data exist, currentcoho, steelhead, and cutthroat trout populations are between three and five percent of what an intact

Page 8 Salmon Creek Bacteria and Turbidity
habitat might support (Wille 1989). The highest quality existing habitat presently lies within thebasin's less developed headwaters: upper Salmon Creek, upper Morgan Creek, and Rock Creek. Directcattle access along lower Salmon Creek and many tributaries increases turbidity and ammonia levels,and impairs habitat quality. As a low-gradient creek (averaging slope 0.24% over first 35 km), SalmonCreek has a limited ability to flush sediment deposits (Wille 1989). In addition to covering poolhabitat for salmon, sediment buildup over time decreases the channel capacity, which increases thepotential for flooding and can lead to increases in water temperature due to greater solar heating of theshallower waters.
Wetlands, which provide flood control and contribute to summer flow levels, have been estimated toconstitute 3.4% of the basin (Wille 1990). Roughly half of Salmon Creek basin's wetlands areemergent (usually seasonal and adjacent to the stream), while forested and scrub-shrub wetlands arealso fairly common. The greatest numbers of wetlands are within Mill Creek and Curtin Creeksubbasins, but the greatest acreage lies along lower and central Salmon Creek itself. However, onefifth of recent county developments involve wetlands. Threats to wetlands include channelization anddraining, as well as indiscriminate filling of privately owned wetlands (Wille 1990). Loss ofremaining wetlands could contribute to further water quality degradation by removing ecologicallyimportant water detention and filtering systems.
Salmon Creek Bacteria and Turbidity Page 9
Applicable CriteriaWithin the state of Washington, water quality standards are published pursuant to Chapter 90.48 of theRevised Code of Washington (RCW). Authority to adopt rules, regulations, and standards to protectthe environment is vested with the Department of Ecology. Under the federal Clean Water Act, theEPA Regional Administrator must approve the water quality standards adopted by the state (Section303(c)(3)). Through adoption of these standards, Washington has designated certain characteristicuses to be protected and the criteria necessary to protect these uses [Washington Administrative Code(WAC), Chapter 173-201A). These standards were last adopted in November 1997.
This TMDL is designed to address impairments of characteristic uses caused by fecal coliform andturbidity. The characteristic uses designated for protection in the Salmon Creek watershed streams areas follows:
"Characteristic uses. Characteristic uses shall include, but not be limited to, the following:(i) Water supply (domestic, industrial, and agricultural).(ii) Stock watering.(iii) Fish and shellfish:
Salmonid migration, rearing, spawning, and harvesting.Other fish migration, rearing, spawning, and harvesting.Clam and mussel rearing, spawning, and harvesting.Crayfish rearing, spawning, and harvesting.
(iv) Wildlife habitat.(v) Recreation (primary contact recreation, sport fishing, boating, and aesthetic enjoyment).(vi) Commerce and navigation."
[WAC 173-201A-030(2)]
The water quality standards describe criteria for fecal coliform and turbidity for the protection ofcharacteristic uses. Listed streams in the Salmon Creek watershed are designated as Class A. Thefollowing criteria are used for the protection of characteristic uses:
"fecal coliform organism levels shall both not exceed a geometric mean value of 100colonies/100 mL, and not have more than 10 percent of all samples obtained for calculating thegeometric mean value exceeding 43 colonies/100 ml."
[WAC 173-201A-030(2)(c)(i)(A)]
“Turbidity shall not exceed 5 NTU over background turbidity when the background turbidity is50 NTU or less, or have more than a 10 percent increases in turbidity when the backgroundturbidity is more than 50 NTU.”
[WAC 173-201A-030(2)©(vi)

Page 10 Salmon Creek Bacteria and Turbidity
The water quality standards describe the averaging periods in the calculation of the geometric mean forthe fecal coliform criteria:
"In determining compliance with the fecal coliform criteria in WAC 173-201A-030, averaging ofdata collected beyond a thirty-day period,… shall not be permitted when such averaging wouldskew the data set as to mask noncompliance periods."
[WAC 173-201A-060(3)]
In cases where natural background conditions exceed a standard, the water quality standards state thefollowing:
"Whenever the natural conditions of said waters are of a lower quality than the criteria assigned,the natural conditions shall constitute the water quality criteria."
[WAC 173-201A-070(2)]
Water quality data have been collected as part of monthly monitoring programs, as well as specialstudies such as stormwater sampling. The SWHD contracted with the CCD and Clark CountyDepartment of Community Development (CCDCD) to conduct monthly water quality sampling in theSalmon Creek drainage. They collected data from four sites on mainstem Salmon Creek from October1988 through September 1989 as part of a Centennial Clean Water Fund grant from Ecology (SWHD1990). This study also included storm event sampling from 26 sites within the basin on November 2,1988. From May 1991 through February 1994, the SWHD also sampled water quality monthly at up to10 sites on the mainstem and major tributaries of Salmon Creek, including the four 1988-89 mainstemsites (as annotated on Figure 1). Additionally, several diurnal samples were collected during thisperiod.
A Quality Assurance Project Plan (QAPP) for the 1991-94 study was approved by Ecology (Gaddis1991). All field measurements followed manufacturer's recommendations and all laboratory tests wereperformed at Clark County Water Quality Laboratory, accredited by Ecology. Although a QAPP wasnot prepared for the 1988-89 data, the same methods and procedures used in the 1991-94 study werefollowed. Because these studies have all been under the direction of Carl Addy of the SWHD, usingacceptable quality assurance, the information is being treated as one body of data.
A pooled precision estimate was made by taking the root mean square (RMS) of the coefficient ofvariation (CV) for each replicate pair (Table 2). To compensate for possible differences in variationover the analytical range, coliform and turbidity replicates were divided into categories (above orbelow Water Quality Standards).
Given the quantity and quality of the existing data, Ecology proposed using the 1988-94 monitoringdata to develop appropriate TMDLs for the Salmon Creek watershed (Cusimano and Giglio 1995).Additional field sampling was not needed to establish TMDL targets, but follow-up monitoring will beneeded to evaluate the effectiveness of the pollution control measures employed in the drainage.

Salmon Creek Bacteria and Turbidity Page 11
Water Quality & Resource Impairments
As a result of measurements made that show criteria are exceeded, five streams (representing foursegments) are included on Washington’s 1998 Section 303(d) list.
Table 1 Parameter: Water
BodyIdentific
ationNo.
FecalColiform
Turbidity Temperature DissolvedOxygen
Salmon Creek WA 281020
X X X
Cougar CanyonCreek
WA 281023
X
Mill Creek WA 281025
X
Curtin Creek WA 281026
X
Woodin Creek WA 281027
X
Table 1. 1998 §303(d) List for the Salmon Creek Drainage
The following is a summary of the existing data. In order to better show temporal and spatialdifferences and to define seasonal allocation targets, the raw data were separated into dry (May-October) and wet (November-April) seasons. The seasons were established by simply grouping thehighest and lowest six contiguous months average flows.
More detailed charts and graphs showing this data are available in Salmon Creek Nonpoint SourcePollution TMDL Publication No. 95-355, October 1995 and are included in appendix C

Page 12 Salmon Creek Bacteria and Turbidity
Table 2USGS Station
(#1421200)near Battleground
CCDCD Stationnear Klineline Park
Month Average Minimum Maximum Average Minimum Maximum
January 150 12.0 1010 268 73 787
February 116 13.0 1440 241 54 1500
March 95 18.0 502 209 61 1373
April 65 13.0 380 305 56 1840
May 38 7.4 390 114 33 697
June 20 1.2 285 62 26 445
July 7.9 0.9 71 37 20 110
August 4.4 0.6 38 27 19 43
September 5.1 0.6 104 26 19 56
October 21 1.0 760 43 19 1500
November 89 1.3 974 191 23 1500
December 134 5.4 978 308 51 1620
Table 2. Salmon Creek average, minimum, and maximum flows based on SUGS station data, 1943-1994 collected near Battleground, and average and minimum flows based on 1991-94 data collected byCCDCD at a station near Klineline Pond. All units in cfs.
Fecal Coliform
While not directly harmful themselves, fecal coliform bacteria are indicators of animal wastes (andassociated pathogens) entering waterbodies. Cattle, failing septic systems, pets, and wildlife can allcontribute to elevated levels. High counts of fecal coliform make waters unsuitable for humanconsumption and recreation.
The existing data indicate regular exceedences of the state water quality standard of 100 colonies/100mL at all monitoring sites downstream of Salmon Creek headwaters. Fecal coliform levels vary littlebetween dry and wet seasons. The possible influence of flow on fecal coliform concentrations wasexamined using flow data collected by CCDCD near Klineline Park. Correlation analysis oflogarithmic transformed flow and fecal coliform data indicates no significant relationship at any of thesampling sites, except site #1, which shows a positive relationship due to one high flow and high fecalcoliform value.
The 1988 storm event data reported by SWHD (1990) showed that every site exceeded the waterquality standard for fecal coliform. Twenty-one of the 26 sites had values exceeding 1,000

Salmon Creek Bacteria and Turbidity Page 13
colonies/100 mL, and eight sites had values beyond 10,000 colonies/100 mL. Again, the lowest valuesoccurred in the less developed headwaters.
Turbidity
Turbidity measures the ability of light to penetrate water, and is an indicator of suspended particlessuch as clay, silt, organic matter, and small biological organisms. High turbidity impairs salmonidrearing by reducing clean gravel spawning habitat and aquatic insect habitat (a key food source forsalmonids).
Five violations of the state water quality criterion for turbidity occurred on mainstem Salmon Creekbetween 1991 and 1993, all during November, December, and January. All sites experience occasional(wet-season) high turbidity levels. With the exceptions of Curtin Creek and Salmon Creek headwaters,turbidity appears to be a problem throughout the basin.
The 1988 storm event data reported by SWHD (1990) showed that turbidity was generally lowest inthe headwaters and central mainstem of Salmon Creek (usually below or about 10 NephelometricTurbidity Units (NTU)). A small tributary of Mill Creek was the most turbid (almost 70 NTU), andthe lower Salmon Creek and Cougar Creek sites were also high (between 20 and 30 NTU). Nine of 25storm event sampling sites violated water quality standards by exceeding natural background levels bygreater than 5 NTU.
Modeling ApproachA narrative explaining the modeling approach was not developed in the Salmon Creek TechnicalReport (95-355). Although a mechanistic model was not used to predict possible values, statisticalmethods were used to determine descriptive statistics mean, standard deviation and z-score, for thesampling distribution. These statistics were used to predict a 90th percentile and a geometric mean(GM) for the range of foreseeable values. The distribution was “rolled back” until the 90 percentile orthe GM (which ever was more conservative) was below regulatory values. The GM and 90 percentilecorresponding to this distribution were established as the Load Allocation (LA).
Loading Capacity and Wasteload AllocationsIdentification of the loading capacity is an important step in developing TMDLs. EPA defines theloading capacity as "the greatest amount of loading that a water can receive without violating waterquality standards."
The loading capacity provides a reference for calculating the amount of pollutant reduction needed tobring a water body into compliance with water quality standards. An allocation is defined as theportion of a receiving water's loading capacity that is assigned to a particular source. By definition, aTMDL is the sum of the allocations.
Since there are no waste water discharges in the Salmon Creek watershed that are permitted byEcology, the waste load allocations for all streams in this TMDL are zero. However, based on the

Page 14 Salmon Creek Bacteria and Turbidity
Dairy Nutrient Management Program currently being conducted, some dairies may be issued adischarge permit, which would allow only those discharges caused by chronic or catastrophic stormevents prompting an overflow from facilities designed for a 25-year, 24-hour storm event. Even withthis consideration, the waste load allocations for these streams will remain at zero.
The existing pollutant loads are from nonpoint sources, which means that the load allocations will beset at the loading capacity, which equals the water quality standard.
The following targets and priorities for water quality improvement are based on Washington State'snumeric standards for fecal coliform and turbidity.
Fecal Coliform
To meet the TMDL, concentration-based Load Allocations were established for monitoring stations1-9 annotated in Figure 1. Table 4 lists the dry and wet season levels for both the geometric means andthe 90th percentiles for each site based on the 1988-94 data. Table 4 also lists the percent reductionrequired to meet the standard at each site for both parts of the criteria. The percent reductions requiredby each part of the criteria were then compared, and the most restrictive criterion was used to establishthe Load Allocation. The allocations and percent reductions were calculated as follows:
1. Partition monthly data into a wet and dry season.
2. Calculate the GM of the data for each of the major mainstem and subbasinsampling sites for each season.
3. Determine the (log) distribution statistics for each season at each site and calculatethe 90th percentile based on the mean, standard deviation, and Z-score. Adjust the distributionsuch that no more than 10% of the values exceed 200 colonies/100 mL. Then calculate the GMof the adjusted data. If the adjusted GM for a site is <100 colonies/mL, it will be the site LoadAllocation. If the GM is >100 colonies/100 mL, the Load Allocation will then be 100colonies/100 mL. Divide by the GM from step 2 and multiply times 100 to obtain the percentreduction required to meet the site specific LAs.
Figure 11 in appendix C shows how the estimated sample distribution was adjusted to the targetdistribution based on the above procedure for wet season data at site 1. The adjusted frequencydistribution has a 90th percentile of 200 colonies/100 mL, and a GM of 33 colonies/100 mL. Thepercent reduction in this case is 89%.
In summary, the fecal coliform TMDL is simply the concentration-based freshwater Class A waterquality criteria. Load allocations are the site-specific geometric means needed to meet both parts ofthe water quality criteria. These site-specific Load Allocations can be used as control points tomonitor the success of management measures taken in the subbasins or along the mainstem of theSalmon Creek drainage.

Salmon Creek Bacteria and Turbidity Page 15
Table 3Salmon Creek andits Major Tributaries
Station Name
Site #
First Criterion:Geometric Mean < 100
Second Criterion:90% of Samples < 200
Recommended TargetLevels
ExistingGeometric
Mean
PercentReduction
needed(mean<100)
ExistingUpper Tenth
Percentile
PercentReduction
needed(90%<200)
TargetGeometric
Mean
TargetPercent
Reduction
WetSeason
DrySeaso
n
WetSeas
on
DrySeason
WetSeason
DrySeason
WetSeason
DrySeason
WetSeason
DrySeaso
n
WetSeaso
n
DrySeason
Salmon Creek (mouth) 1 313 129 68 23 1917 301 89 34 33 86 89 34
Cougar Creek 2 722 899 86 89 9243 1803 98 89 16 100 98 89
Salmon Creek (lower) 3 182 281 45 64 1261 806 84 75 29 70 84 75
Mill Creek 4 839 282 88 65 8763 1121 98 82 19 50 98 82
Curtin Creek 5 1155 743 91 87 4409 2608 96 92 52 57 96 92
Salmon Creek(middle)
6 257 453 61 78 1162 869 83 77 44 100 83 78
Weaver Creek 7 534 857 81 88 9204 6509 98 97 12 26 98 97
Salmon Creek (upper) 8 234 751 57 87 1125 1404 82 86 42 100 82 87
Salmon (headwaters) 9 28 54 0 0 200 318 0 37 28 34 0 37
Table 3. Salmon Creek drainage wet and dry season fecal coliform geometric means, 90th percentiles,and recommended reductions.
Turbidity
To meet the TMDL, numeric Load Allocations were established for monitoring stations 1-9 annotatedin Figure 1. Background turbidity was assumed to be equal to turbidity at the headwater sampling site,which was always less than 50 NTU. Load Allocations were established such that turbidity levelswould not exceed 5 NTU over background 90% of the time. The 90th percentile was chosen as acontrol level for turbidity because allowing 10% of the values to exceed water quality standards forconventional parameters is supported by EPA (EPA 1995). The turbidity Load Allocation for each siteis the background level plus 5 NTU, and the target percent reduction is the percent reduction requiredfor the 90th percentile of the data to meet the LA. Table 5 lists the 90th percentile of backgroundadjusted data (as discussed below) and target percent reductions to meet the Load Allocation. Theallocations and percent reductions were calculated as follows:
1. Partitioned monthly data into a wet and dry season.
Page 16 Salmon Creek Bacteria and Turbidity
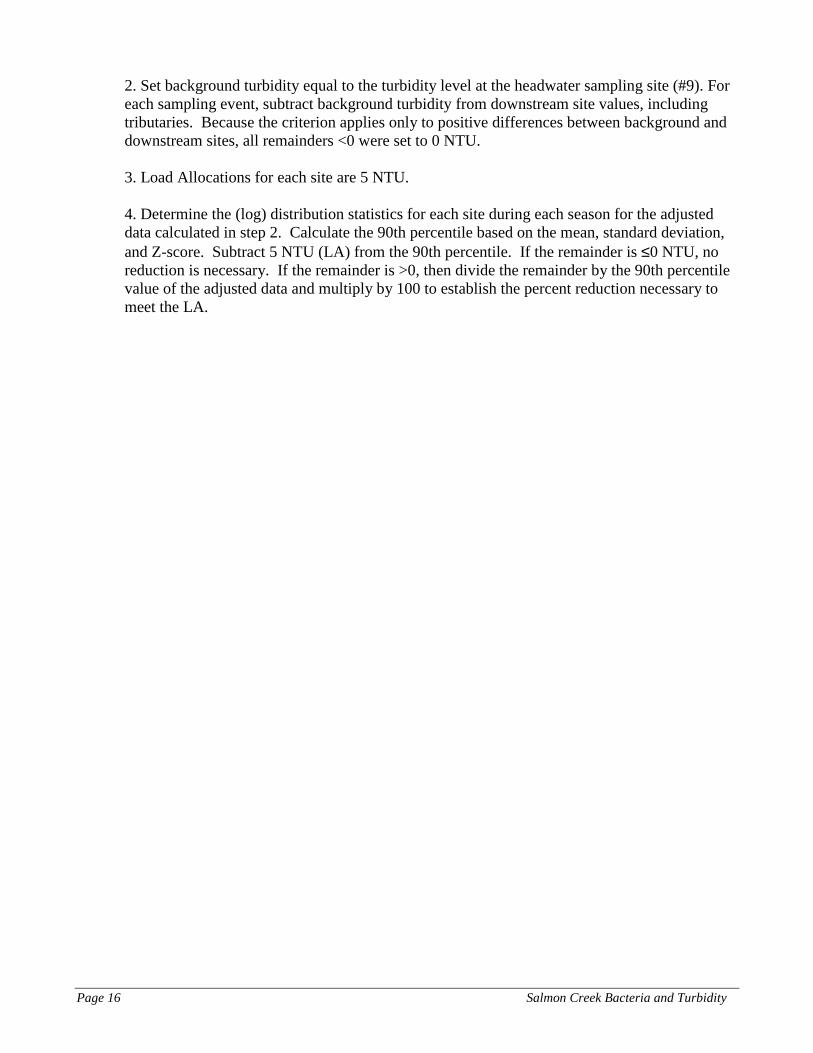
2. Set background turbidity equal to the turbidity level at the headwater sampling site (#9). Foreach sampling event, subtract background turbidity from downstream site values, includingtributaries. Because the criterion applies only to positive differences between background anddownstream sites, all remainders <0 were set to 0 NTU.
3. Load Allocations for each site are 5 NTU.
4. Determine the (log) distribution statistics for each site during each season for the adjusteddata calculated in step 2. Calculate the 90th percentile based on the mean, standard deviation,and Z-score. Subtract 5 NTU (LA) from the 90th percentile. If the remainder is ≤0 NTU, noreduction is necessary. If the remainder is >0, then divide the remainder by the 90th percentilevalue of the adjusted data and multiply by 100 to establish the percent reduction necessary tomeet the LA.

Salmon Creek Bacteria and Turbidity Page 17
Table 4Salmon Creek and itsMajor Tributaries
Site #
90th %tileof Adjusted Dataa
90th %tileof Adjusted Data minus
LA of 5 NTU
Target PercentReductionb
Station Name WetSeason
DrySeason
WetSeason
DrySeason
WetSeason
DrySeason
Salmon Creek (mouth) 1 13.4 3.7 8.4 -1.3 63 0
Cougar Creek 2 20.1 1.9 15.1 -3.1 75 0
Salmon Creek (lower) 3 12.8 1.8 7.8 -3.2 61 0
Mill Creek 4 21.1 3.5 16.1 -1.5 76 0
Curtin Creek 5 5.9 2.8 0..9 -2.2 16 0
Salmon Creek (middle) 6 17.9 2.8 12.9 -2.2 72 0
Weaver Creek 7 10.1 2.0 5.1 -3.0 51 0
Salmon Creek (upper) 8 8.2 3.2 3.2 -1.8 39 0
Salmon Creek (headwaters) 9 NA NA NA NA NA NA
Table 4. Salmon Creek drainage wet and dry season average turbidity, 90th percentiles, and recommended reductionsa Adjusted data equals each site value minus background ( site 9) value for each sampling event.b Target reduction is the percent reduction required to reduce the 90th percentile of the adjusted data to 5 above background.

Page 18 Salmon Creek Bacteria and Turbidity

Salmon Creek Bacteria and Turbidity Page 19
Margin of SafetyThe Clean Water Act requires that a margin of safety be identified to account for uncertainty whenestablishing a TMDL. The margin of safety can be explicit in the form of an allocation, or implicit inthe use of conservative assumptions in the analysis.
The statistical rollback method used to establish the target geometric means for the concentration-based allocations provides a more restrictive geometric mean count, in most cases, than the Class Ageometric mean criteria. The lower geometric means provide an implicit margin-of-safety for meetingthe fecal coliform concentration-based nonpoint TMDL
Summary Implementation StrategyIntroduction
The purpose of this implementation strategy is to present a clear, concise, and sequential concept (i.e.vision statement) of how agencies will achieve water quality standards in the Salmon Creek watershedover time.
This strategy meets the requirements of a TMDL submittal for approval as outlined in the 1997Memorandum of Agreement between the U.S. Environmental Protection Agency and the WashingtonState Department of Ecology.
• Implementation Plan Development
The following is a description of the key agencies, and other groups that have influence, regulatoryauthority, involvement, or other controls that will be incorporated into a coordinated effort toimplement the Water Cleanup Plan. Ecology will lead the coordination effort as needed to affect Planimplementation. Considerable work will be needed by all parties especially in the heavily urbanizedsection of Salmon Creek in order to meet water quality standards. Regular reviews of monitoring data,leading to changes in management regimes if standards are not being met will need to be conducted. Areasonable expectation of when the stream might meet these standards for bacteria and turbidity isdifficult to determine. The most reasonable expectation given the excessive population growth in thewatershed, is that by 2010 a sizable reduction in violations of the water quality standards for bacteriaand turbidity will occur (see reasonable assurance paragraph below).
� Clark Public Utilities
In 1992, Washington State Departments of Ecology and Health, Clark Public Utilities, and ClarkCounty entered into a memorandum of understanding to develop and implement a water resourcemanagement plan for the Salmon Creek basin. The memorandum created a partnership between stateand local public agencies to evaluate the water resource management needs and craft a program thatfurthers state and local water resource management objectives and legal requirements. The SalmonCreek Basin Monitoring & Management Implementation Plan noted in the Monitoring section of thisSummary was developed as a result of this memorandum.

Page 20 Salmon Creek Bacteria and Turbidity
For the past few years Clark Public Utilities has taken the lead in developing a number of programsthat impact water quality in Salmon Creek in conjunction with other agencies.
The list of these programs is as follows:• Water System Planning• Water Conservation• Ground Water Management• Wellhead Protection• Streamside Rehabilitation• Streamflow Augmentation• Wastewater Reuse• Fisheries Enhancement• School Salmon Rearing Aquarium• Recreation and Park Planning• Stormwater Management• Septic Tank Maintenance• Watershed Protection Planning• Public Information and Education• Environmental Information Center• Salmon Creek Water Festival
The Utility agreed in May 2000 to conduct the necessary planning to develop a Phase 2 and Phase 3Watershed Plan that would meet all the requirements of the Watershed Management Act (HB 2514,RCW 90.82). In addition, the Utility has contracted with the Corps of Engineers to conduct a LimitingFactors Analysis in conjunction with the Conservation Commission. Both of these efforts arescheduled to be completed by January, 2003.
• Clark County
Clark County was granted a National Pollution Discharge Elimination Permit (NPDES) in 1999 forstormwater. EPA rules require local governments to develop stormwater programs that address thefollowing six main elements:
• Public Education and Outreach• Illicit Discharge, Detection and Elimination• Post-Construction Runoff Control• Public Participation/Involvement• Construction Site Runoff Control• Pollution Prevention/Good Housekeeping
Current and anticipated federal Endangered Species Act (ESA) and Clean Water Act stormwaterrequirements are placing more demands on state and local governments for staffing and resources.Urban stormwater management represents a significant funding challenge for local and stategovernments, as well as a potential outstanding liability due to third party actions.
The municipal stormwater permits require the implementation of a Stormwater Management Program.The Stormwater Management Program is a plan for the term of the permit to reduce the discharge of
Salmon Creek Bacteria and Turbidity Page 21
pollutants, reduce impacts to receiving waters, eliminate illicit discharges, and make progress towardscompliance with surface water, ground water, and sediment standards. Ecology is in the process ofreissuing the municipal stormwater permits. Ecology’s proposal is to issue a single statewide generalpermit for Phase I municipal stormwater permit holders by early summer of 2001.
Clark County has developed the storm water program required by the Permit. They will produce theirfirst annual report in July 2001. Staff is being hired to carry out the items noted above. Funding forthese activities is provided by the storm water utility created by the Clark County Commission inDecember 1999.
• Southwest Washington Health District
The Southwest Washington Health District (SWHD) has the specific requirement to:"Identify failing septic tank drainfield systems in the normal manner and will usereasonable effort to determine new failures." (RCW 70.118.030)
“The normal manner” implies the use of inspections and responses to citizen complaints. Theseinspections are to take place in areas where water quality standards have been violated. SWHD hasdeveloped an administrative plan to respond to on-site sewage system failures, including, whereappropriate, inspection of these systems. The outline below shows the steps that will be taken toimplement the plan.
A. Identify Sources• Phased Approach• Develop Complete and Accurate List of Septic Systems in Basin• Septic Maintenance Inspection Program (Statewide Requirement for Homeowners)• Use monitoring Results to Focus Efforts• Hold educational meetings for communities in various subbasins of the
Watershed.
B. Identify Control Measures• Provide List of certified/licensed inspection contractors• Provide List of certified pumpers and repair contractors• Provide educational materials• Require Repairs or Replacements if necessary
A Memorandum of Agreement between Ecology and the Health District to carry out this program wassigned on November 8, 2000 (see Appendix A).
• Ecology
Ecology has been delegated authority under the Federal Clean Water Act by EPA to establish waterquality standards, administer the NPDES program, and enforce water quality regulations.
As part of those duties, Ecology inspects dairy farms and manages dairy permits in the Salmon CreekWatershed. In 1998, Washington State passed the Dairy Nutrient Management Act (DNMA). The actrequires all Class A dairies to have a farm plan by July 1, 2002. After receiving a farm plan, dairiesmust implement them by December 31, 2003. All of the dairies in the Salmon Creek basin have been

Page 22 Salmon Creek Bacteria and Turbidity
inspected once. The dairies with probable pollution problems have received a notice of correction andfollow up inspections. Additional inspections by the Department of Ecology dairy inspectors will bemade during the wet season. Over the next two years, these actions should result in control of dairywaste causing FC and BOD loading from entering the streams emptying into Salmon Creek. Ifvoluntary compliance is not obtained from the landowners, enforcement and fines may be employedunder the DNMA, Chapter 90.48 and the Clean Water Act.
• Clark Conservation District
The Clark Conservation District (CCD) works closely with Ecology and National ResourceConservation Service (NRCS) in developing resources management plans. The CCD also provideseducation and technical assistance to landowners. Landowners receiving a Notice of Correction or aformal enforcement action frequently get assistance from the CCD to assist coming into compliance.Ecology will work closely with the CCD and NRCS by identifying and prioritizing referrals in theSalmon Creek area for resources management planning.
Ecology and CCD have developed the Small Farm Water Quality Improvement Project. The goals ofthis project are to provide people with small acreage farms technical assistance in controlling waterpollution from their farm. The main focus of this grant is on providing educational efforts such as mudand manure workshops, septic tank workshops, and informational brochures for people with just a fewlivestock on their property. Salmon Creek has been targeted as the first watershed to have thisprogram. Workshops have been held over the past two years. An informational brochure will bedistributed in the spring of 2001 to several thousand property owners adjacent to Salmon Creek and itstributaries.
• USDA Natural Resource Conservation Service
The USDA Natural Resource Conservation Service (NRCS) provides the guidance and generalstandards and specifications used in developing farm plans. NRCS also does research used to developthe best management practices (BMP) used on farms to protect water quality. The NRCS administerscost-share money that is frequently used by farmers to do farm improvements. Many of the costlyfarm improvements required for water quality protection, such as lagoons, are constructed according todesigns approved by NRCS and funded in part by grants administered by NRCS. The NRCS will helpEcology and WCD evaluate the effectiveness of the BMPs as they are implemented in the SalmonCreek Watershed. This work will occur during the same time frame as the CCD work.
• Lower Columbia Fish Recovery Board
Established in 1998 by state law, the Lower Columbia Fish Recovery Board (LCFRB) encompassesfive counties in southwest Washington: Clark, Cowlitz, Lewis, Skamania, and Wahkiakum. The 15-member Board is comprised of representatives from the Legislature, city and county governments, theCowlitz Tribe, private property owners, hydro-project operators, the environmental community, andconcerned citizens. Its goal is to forge a broadly based regional partnership to return fish populationsto healthy levels.

Salmon Creek Bacteria and Turbidity Page 23
State law directs the Board to:
• Participate in the development of a regional fish recovery plan, particularly habitat recoverymeasures. In doing so the Board is to coordinate with local governments, the state, and theNational Marine Fisheries Service.
• Assess the factors for decline of salmon and steelhead on a “stream-by-stream” basis.
• Implement the local government responsibilities for habitat restoration and preservation,including prioritizing and approving projects and programs, and receiving and disbursingfunds.
The LCFRB has received a grant from Ecology to carry out the watershed planning authorized byRCW 90.82. This law established the watershed planning process including water quantity, quality,habitat, and in-stream flow issues. Salmon Creek will have such a plan developed by Clark PublicUtilities in conjunction with this process by 2003.
• Approaches to be used to meet load allocations
As part of the Ecology dairy inspection program, dairies with a potential to pollute will be instructed tocorrect the problem. The services of the CCD will be recommended. CCD will develop or modify anexisting farm plan to eliminate the potential to pollute under the guidance of NRCS. At that point, allthree entities will then develop a monitoring plan to measure the effectiveness of the BMPs.
If agricultural sources that are not associated with dairies are identified to be causing pollution, theywill be referred to CCD. The CCD will develop or modify an existing farm plan to eliminate thepotential to pollute under the guidance of NRCS. At that point, all three entities will then develop amonitoring plan to measure the effectiveness of the BMPs. During the first half of 2001, CCD willcontinue to work with small farm owners to implement BMPs using the existing Ecology CentennialGrant for funding. A funding source for this work will be explored with the Salmon CreekManagement Team early in 2001.
• Reasonable Assurance
Local involvement in restoring Salmon Creek is considerable. The following list is a summary ofactions currently under way or scheduled to occur soon. This list is based on the detailed informationin paragraphs above.
• If OSS failures are identified, the owners will be referred to SWHD. SWHD will implement theprovisions of their OSS program.
• Clark Public Utilities will continue stream restoration measures such as tree planting and publiceducation.
• Clark Public Utilities agreed in May 2000 to conduct the necessary planning to develop a Phase 2and Phase 3 Watershed Plan that would meet all the requirements of the Watershed ManagementAct (HB 2514, RCW 90.82). In addition, the Utility has contracted with the Corps of Engineers to

Page 24 Salmon Creek Bacteria and Turbidity
conduct a Limiting Factors Analysis in conjunction with the Conservation Commission. Both ofthese efforts are scheduled to be completed by January 2003.
• The LCFRB has received a grant from Ecology to carry out the watershed planning authorized byRCW 90.82. This law established the watershed planning process including water quantity,quality, habitat, and in-stream flow issues. Salmon Creek will have such a plan developed byClark Public Utilities in conjunction with this process by 2003.
• Clark County will continue to implement their storm water program as required by their Phase 1Storm Water Permit under NPDES.
• Clark Conservation District will continue to implement their small farm outreach program.
• In 1998, Washington State passed the Dairy Nutrient Management Act (DNMA). The act requiresall Class A dairies to have a farm plan by July 1, 2002. After receiving a farm plan, dairies mustimplement them by Dec 31, 2003.
• Adaptive Management
However, if water quality standards are not being met, regular reviews of the water quality data will beconducted and adaptive management strategies will be developed.. Ecology will again conduct itsTMDL Scoping of the WQMA in 2004. An intensive review of how effective this TMDL has beenwill be conducted as part of scoping. At that time, Ecology will work with the Salmon CreekManagement Team to identify further actions that need to be taken to achieve water quality standards.This work will continue on an ongoing basis until water quality standards are achieved.
Monitoring Strategy
The Salmon Creek Monitoring and Management Implementation Plan was agreed on by Clark PublicUtilities, Washington State Departments of Health and Ecology and Clark County in 1995. ClarkPublic Utilities performs most of the functions called for in the Plan, and prepares the annual reportson the Program. Clark Public Utilities is committed to continuing this work.
• Summary of Public Involvement
Ecology will be working with Clark County Public Works, Clark Public Utilities, Clark ConservationDistrict, Southwest Washington Health District, and the Lower Columbia River Fish Recovery Boardto develop the Detailed Implementation Strategy, through a process of peer review. General publicmeetings and consultation with interest groups will occur before corrective actions are determined andfinalized.
Public meetings will be used to keep all of the units noted above apprised of the other’s activities andto reach consensus on appropriate corrective actions and timelines.
• Potential Funding Sources
The Centennial Clean Water Fund, Section 319, and SRF grant funds are available from Ecology tofund activities by jurisdictions to help implementation of the water cleanup plan. Ecology will assistwith identifying numerous other sources of state and federal monies for which applications may be
Salmon Creek Bacteria and Turbidity Page 25
prepared. Non-government organizations may apply to be funded by a 319 grant fund to provideadditional assistance. Ecology will work with the stakeholders to prepare appropriate scopes of work,to implement this plan, and to assist with applying for grant opportunities as they arise. In order tostrengthen the implementation response, other state agency funding sources, such as salmon recoveryfunding, and watershed grants will be pursued as they become available.
• Acronyms and Abbreviations
BMP Best Management PracticeCCD Clark Conservation DistrictDNMP Dairy Nutrient Management PlanEcology Washington State Department of EcologyEPA United States Environmental Protection AgencyLCFRB Lower Columbia Fish Recovery BoardNPDES National Pollution Discharge Elimination SystemNRCS USDA Natural Resources Conservation ServiceOSS On-Site Sewage SystemSWHD Southwest Washington Health District

Page 26 Salmon Creek Bacteria and Turbidity

Salmon Creek Bacteria and Turbidity Page 27
Appendix A
Public Participation Materials

Page 28 Salmon Creek Bacteria and Turbidity
This appendix contains:
• Memorandum of Agreement between Southwest Washington Health District and theWashington Department of Ecology.
• Public Participation Materials for Salmon Creek
Summary of Public Participation and Materials
The public outreach process for the Salmon Creek TMDL was formally started with a Kick-Offmeeting on October 6, 1999 (see attached agenda). At this Kick-Off Meeting it was agreed that DaveHoward, acting as the Watershed Coordinator for the Columbia Gorge Water Quality ManagementArea in Ecology’s Vancouver Office would meet with interested groups over the next six months.During that time he would discuss the reasons for establishing a TMDL for Salmon Creek, what theimplementation steps would be, and how people could be involved in the process.
During subsequent months, presentations on these items were made at meetings of the LowerColumbia Salmon Recovery Board, Clark Conservation District Board, Clark County CommissionersBoard, Salmon Creek Management Team, and Water Resource Inventory Area 27/28 Planning Unit.All of these groups are identified in the Summary Implementation Strategy (SIS) within this document.All groups were presented with a copy of an Ecology Focus Sheet (attached), and a copy of Process fora typical Water Cleanup Plan (attached).
As noted in the Focus Sheet, the general public was invited to a public meeting with notices distributedwildly throughout the basin and press releases printed in a local daily and weekly paper along withcoverage on local television stations. This meeting was held at Battleground High School in the centerof the watershed on April 10, 2000 from 6 to 9 PM. Over 15 members of the public attended.Participating agencies sent representatives who presented what they were going to do as outlined in adraft SIS that was reviewed at the meeting. A public comment period of 30 days was opened and onlyfew comments were received (Meeting Agenda attached). No substantive comments were received.
Most concerns voiced at the meeting focused on a fish kill that was occurring in a minor tributary toSalmon Creek. Follow up monitoring has occurred during the ensuing months and no contributingfactors for the fish kill have been determined.
Clark Public Utilities has continued to conduct their stream and habitat restoration program. Thisprogram consists of a mailing in utility bills once a year outlining their Environmental Services and aStream Wheel that they give out at various fairs (see attachments)
Recently, The Columbian newspaper ran a four page special on Salmon Creek that continues to keepthe issues of water quality before the public (The Columbian, Sunday, December 17, 2000, pp. A6-A10). This article included photographs and a color display of the area and discussed the issuesconcerning pollution and sources impacting Salmon Creek and its tributaries. This article may belocated by contacting The Columbian. A hard-copy is also part of the official Salmon Creek TMDLfile at the Department of Ecology.

Salmon Creek Bacteria and Turbidity Page 29
APPENDIX B
Quality Assurance Project Plan

Page 30 Salmon Creek Bacteria and Turbidity

Salmon Creek Bacteria and Turbidity Page 31
Salmon CreekNonpoint Source Pollution TMDL
Final Quality Assurance Project Plan
byBob Cusimano
January 30, 1995
Washington State Department of EcologyEnvironmental Investigations and Laboratory Services Program
Watershed Assessments Section

Page 32 Salmon Creek Bacteria and Turbidity

Salmon Creek Bacteria and Turbidity Page 33
Approvals:
Bob CusimanoProject LeadWatershed Assessments Section
Nora JewettClient Staff ContactWQ Section, Southwest Regional Office
Will KendraSupervisorWatershed Assessments Section
Bill BackousSupervisorWQ Section, Southwest Regional Office
Bill KamminDirectorEcology Manchester Laboratory
Cliff KirchmerEcology QA OfficerQuality Assurance Section

Page 34 Salmon Creek Bacteria and Turbidity

Salmon Creek Bacteria and Turbidity Page 35
Introduction
The Clean Water Act (CWA) Section 303(d) requires states to effect pollution controls onwaterbody segments where technology-based controls are insufficient to reach water qualitystandards. To meet this requirement, a total maximum daily load (TMDL) must beestablished for each pollutant violating water quality criteria. The TMDL is then apportionedbetween point and nonpoint sources as wasteload (WLA) and load (LA) allocations,respectively. Allocations are implemented through NPDES permits, grant projects, andnonpoint source controls. Thus, the TMDL process helps bring problem waterbodies intocompliance with water quality standards.
Ecology's Southwest Regional Office (SWRO) is concerned about nonpoint pollutant loadingto Salmon Creek, a Class A waterbody, due to anthropogenic activities in the watershed.They have requested that the Watershed Assessment Section (WAS) assess the water qualityof the drainage system and establish appropriate TMDLs and LAs. (Since there are nopermitted point source discharges, WLAs are not needed.) Figure 1 is a map of the proposedstudy area.
Problem Description
Salmon Creek has experienced gradual water quality degradation from historic and recentdevelopment and urbanization. Forestry, small-scale farming, dairies, urban, and industrialland uses have resulted in numerous violations of state water quality standards (ClarkCounty Department of Public Works, 1989; Meyer, 1981; Southwest Washington HealthDistrict, 1990; Wille, 1990). Stream monitoring by Clark County has identified violations ofClass A criteria for fecal coliform, turbidity, dissolved oxygen, and temperature (SouthwestWashington Health District, 1990). Nutrient levels, while not regulated, are also high.Currently, five segments of the basin are on the §303(d) list (Table 1).
Table 1. 1994 §303(d) List for the Salmon Creek Drainage
Parameter: FecalColiform Temperature
DissolvedOxygen
Salmon Creek X X
Cougar CanyonCreek
X X
Mill Creek X
Curtin Creek X
Woodin Creek X
Previous studies have documented the roles of septic tanks (Southwest Washington HealthDistrict, 1981; Newman, 1989), dairy waste (Clark County Conservation District, 1990;
Page 36 Salmon Creek Bacteria and Turbidity
Southwest Washington Health District, 1990), and wastewater (Moore and Anderson, 1978;Crawford, 1986) in the basin's pollution. The leading point source of contamination in thebasin historically was the Battle Ground wastewater treatment plant (WTP). Because of itseffects on water quality in Woodin Creek, the WTP discharge was diverted away from theSalmon Creek basin in March 1993. Since then, pollutant loading has been limited to non-point sources. Fecal coliform bacteria, the most consistent violator of state water qualitystandards in the basin, exceeds standards along the mainstem of Salmon Creek and in everysub-basin. Newman (1989) suggested that the widespread coliform contamination is likelythe result of animal wastes entering streams, not failing septic systems as once suspected.
Study Objectives:
Objectives for the Salmon Creek basin Total Maximum Daily Load (TMDL) study include:
1. Assess the quality of existing water quality data on Salmon Creek and its tributaries foruse in assessment of §303(d) listed parameters.
2. Establish wet and dry season concentration-based load allocations (LAs) for fecalcoliform and turbidity.
3. Relate LAs and concentration-reduction targets to land-use.
4. Propose a non-point source pollution reduction strategy that incorporates use of BestManagement Practices in the drainage.
5 Propose a follow-up monitoring program to evaluate the effectiveness of the pollutionreduction strategy(s).
Existing Data
Water quality data have been collected as part of monitoring programs, as well as specialstudies. The Clark County Conservation District and Clark County Public Services Divisionconducted monthly water quality sampling for the Southwest Washington Health District.Four sites on mainstem Salmon Creek were sampled from October 1988 through September1989 as part of a Centennial Clean Water Fund grant. This study also included storm eventsampling from 26 sites within the basin on November 2, 1988. From May 1991 throughFebruary 1994, the SWHD also sampled monthly water quality at up to ten sites on themainstem and major tributaries of Salmon Creek (as annotated on Figure 1). Additionally,several diurnal samples were collected during this period. Because these studies have allbeen conducted by Carl Addy of the Southwest Washington Health District, using acceptableQuality Assurance, the information is being treated as one body of data.
A Quality Assurance Project Plan (QAPP) was submitted to and approved by Ecology for the1991 Health District study. All field measurements followed manufacturer's

Salmon Creek Bacteria and Turbidity Page 37
recommendations and all laboratory tests were performed at Clark County Water QualityLaboratory, accredited by Ecology. Twenty-three pairs of field replicates were collected aspart of the sampling program; replicate results demonstrate acceptable precision. A pooledprecision estimated for variables was made by taking the root mean square (RMS) of theCoefficient of Variation (CV) for each replicate pair (Table 2). To compensate for differencesin variation over the analytical range, coliform and turbidity replicates were divided intocategories (above or below water quality standards).
Given the quantity and quality of the existing data, WAS is proposing to use the data todevelop appropriate TMDLs for the Salmon Creek watershed. Additional field sampling willnot be needed to establish allocation targets, but follow-up monitoring will be proposed toevaluate the effectiveness of the pollution reduction strategies employed in the watershed.
Table 2. Field Replicate Precision
Parameter # ofReplicate
s
Root Mean Square ofthe Coefficient of
Variation (%)
Fecal Coliform, Mean MPN <100
10 49.9
Fecal Coliform, Mean MPN >100
13 42.8
Temperature 22 1.6
Dissolved Oxygen 22 0.8
Turbidity, Mean NTU < 5.0 16 5.4
Turbidity, Mean NTU > 5.0 7 3.0
Ammonia 23 22.6
Nitrates-Nitrites 23 4.5
Total Phosphorus 22a 7.5
pH 23 0.8
a One pair of phosphorus samples was excluded because of a suspected error. Were itincluded, the pooled precision would be 25.2.

Page 38 Salmon Creek Bacteria and Turbidity
Data Management:
SWHD sampling data was obtained as hard copy and entered into the Excel spreadsheetsoftware program. Data were verified by Clark County, and 100% of data entry wasreviewed for errors by WAS.
Data Analysis and Presentation:
The major water quality variable of concern in the watershed is fecal coliform from nonpointsources (Table 1). The fecal coliform concentration-based nonpoint TMDL is simply theFreshwater Class A fecal coliform standard (WAC 173-201A-030-2):
Fecal coliform organism levels shall both not exceed a geometric mean (GM) value of 100cfu/100 mL and not have more than 10 percent of all samples obtained for calculating thegeometric mean value exceeding 200 cfu/100 mL.
To meet the TMDL, LAs will be established at sampling sites in the watershed as follows:
1. Partition monthly data into a wet and dry season using historical flow and precipitationdata.
2. Calculate the GM of the data for each of the major mainstem and subbasin samplingsites for each season.
3. Determine the cumulative frequency distribution of fecal coliform data for each seasonat each site and adjust the distribution such that no more than 10% of the valuesexceed 200 cfu/100 mL. Then calculate the GM of the adjusted data. If the adjustedGM for a site is <100 cfu/mL, it will be the site LA. If the GM is >100 cfu/100 mL, theLA will then be 100 cfu/100 mL.
4. Subtract the GM for each site established in step 3 from the GM calculated in step 2.Each remainder divided by the GM from step 2 times 100 will be the percent reductionrequired to meet the site specific LAs.
The existing data suggest that waterbodies in the Salmon Creek drainage also consistentlyviolate the state turbidity standard. A turbidity concentration-based nonpoint TMDL is theFreshwater Class A turbidity standard (WAC 173-201A-030-2):
Turbidity shall not exceed 5 NTU over background turbidity when backgroundturbidity is 50 NTU or less, or have more than a 10 percent increase in turbidity whenthe background turbidity is more than 50 NTU.
To meet the turbidity TMDL for background levels <50 NTUs, LAs will be established atsampling sites in the watershed as follows:

Salmon Creek Bacteria and Turbidity Page 39
1. Partition monthly data into a wet and dry season using historical flow andprecipitation data.
2. Set background turbidity equal to data collected from the furthest upstream samplingsite. Subtract background turbidity for each sampling event from downstream sitevalues. The remainders are the background adjusted turbidity values.
3. LAs for each site are 5 NTUs.
4. Subtract 5 NTUs from the 90th percentile value of the adjusted seasonal data setcalculated in step 2. If the remainder is >0, then divide the remainder by the 90thpercentile value of the adjusted data and multiply by 100 to establish the percentreduction necessary to meet the LA. If the remainder is ≤0 NTUs no reduction isnecessary.
In addition to the analysis presented above, all data will be presented with plots that showthe relative concentrations of water quality variables through the sampling period (i.e.,concentration versus time by site for monthly data; concentration versus site for storm eventsamples). A step trend analysis will be performed on data collected from Woodin Creek inorder to assess changes associated with removing the Battle Ground WTP discharge.
Land-use and Best Management Practices
Clark County Public Works Department has a geographic information system (GIS) withland-use layers for the county available. WAS is currently planning to request that ClarkCounty provide GIS maps for the Salmon Creek watershed that have, at a minimum, thefollowing characteristics annotated: residential homes, commercial buildings/properties,towns/cities, small scale farms, dairy farms, forest, and subbasin drainages.
SWRO, Clark County Conservation District, and Southwest Health District personnel willprovide a nonpoint source pollution mitigation strategy plan. Their recommendations andproposed Best Management Practices for the watershed will be included in the final report.
Project Schedule:
Submit draft QAPP for internal review: January 31, 1995Submit draft QAPP to client: February 14, 1995Finalize QAPP: February 28, 1995Submit draft report for internal review: June 30, 1995Submit draft report to client: August 15, 1995Final report to printer: October 15, 1995

Page 40 Salmon Creek Bacteria and Turbidity
Data Sources:
GIS land-use data will be obtained through Clark County.
BMP information will come from Clark County Conservation District (contact:Gordon Douglas) and Southwest Washington Health District (contact: Steven Kurd andCarl Addy).
Project Responsibilities:
Bob Cusimano - project lead, and David Giglio (Ecology): responsible for project design,collecting and analyzing data, developing graphs and figures, writing and editing draftand final reports.
Nora Jewett (Ecology): responsible for reviewing draft report and coordinating developmentand implementation of BMP strategies.
Gordon Douglas (Clark County Conservation District): participate in developing andimplementing BMP strategies.
Steven Kurd and Carl Addy (Southwest Washington Health District): participate indeveloping and implementing BMP strategies.

Salmon Creek Bacteria and Turbidity Page 41
References
CCCD (Clark County Conservation District), 1990. Agriculture's Contribution to Non-PointPollution in the Salmon Creek Basin.
CCDPW (Clark County Department of Public Works), 1989. Salmon Drainage Master Plan.
Crawford, P., 1986. "Weaver (Woodin) Creek Low-Flow, Point-Source Reconnaissance,"memo to Jon Neel. Washington State Department of Ecology, Olympia WA.
Meyer, Robert E., Consultants, 1981. Salmon Creek Basin Master Plan. Beaverton, OR.Prepared for Clark County Board of Commissioners.
Moore, A. and D. Anderson, 1978. Weaver (Woodin) Creek-Battleground Sewage Treatment PlantImpact Study. Project Report PR-4, Washington State Department of Ecology, Olympia,WA.
Newman, T., 1989. Septic Systems in the Salmon Creek Basin: A Sanitary Survey. SouthwestWashington Health District, Vancouver, WA.
SWHD (Southwest Washington Health District), 1981. Non-Point Source Water Pollution fromSeptic Tank Systems in the Salmon Creek Basin. Vancouver, WA.
SWHD (Southwest Washington Health District), 1990. Salmon Creek Water Quality MonitoringReport: Final Report. Clark County, WA.
Wille, S. A., 1990. Wetland Resources of the Salmon Creek Basin. Clark County ConservationDistrict, Vancouver, WA.

Page 42 Salmon Creek Bacteria and Turbidity
APPENDIX C
Technical Report
Salmon Creek Nonpoint Source Pollution TMDLPublication No. 95-355
October 1995
(Published Separately)
http://www.ecy.wa.gov/biblio/95355.html