Embed Size (px)
Citation preview
SALT LAKE CITY WATER, SEWER, AND
STORMWATER UTILITIES
(Enterprise Funds of Salt Lake City Corporation)
INDEPENDENT AUDITORS’ REPORT
AND
COMBINED FINANCIAL STATEMENTS
June 30, 2010

SALT LAKE CITY WATER, SEWER, AND STORMWATER UTILITIES
TABLE OF CONTENTS
Page
Independent Auditors’ Report 1
Management’s Discussion and Analysis 3
Combined Financial Statements:
Balance Sheet as of June 30, 2010 15
Statement of Revenues, Expenses and Changes in Net Assets
for the Year Ended June 30, 2010 17
Statement of Cash Flows for the Year Ended June 30, 2010 18
Notes to Combined Financial Statements 20
Supplemental Information for the Year Ended June 30, 2010:
Supplemental Schedule of Net Revenues to Aggregate Debt Service for
Water, Sewer and Stormwater Utility Funds for the
Year Ended June 30, 2010 40
Supplemental Schedule of Investment Balances Controlled by
Trustee for Water and Sewer Utility Funds as of June 30, 2010 41
Supplemental Schedule of Consumer Information as of June 30, 2010 42
Supplemental Schedule of Insurance Policies as of June 30, 2010 43
Independent Auditors’ Report on Utility Revenue Bond Compliance 44

1
INDEPENDENT AUDITORS’ REPORT
Salt Lake City Public Utilities Advisory Committee
Salt Lake City Water, Sewer and Stormwater Utilities
We have audited the accompanying combined balance sheet of the Water Utility Fund, the Sewer Utility
Fund, and the Stormwater Utility Fund (the “Salt Lake City Water, Sewer, and Stormwater Utilities” or
the “Utilities”), enterprise funds of Salt Lake City Corporation (the City), as of June 30, 2010, and the
related combined statements of revenues, expenses and changes in net assets and cash flows for the year
then ended. These financial statements are the responsibility of the Utilities’ management. Our
responsibility is to express an opinion on these financial statements based on our audit.
We conducted our audit in accordance with auditing standards generally accepted in the United States of
America. Those standards require that we plan and perform the audit to obtain reasonable assurance about
whether the financial statements are free of material misstatement. An audit includes examining, on a test
basis, evidence supporting the amounts and disclosures in the financial statements. An audit also includes
assessing the accounting principles used and significant estimates made by management, as well as
evaluating the overall financial statement presentations. We believe that our audit provides a reasonable
basis for our opinion.
As discussed in Note 1 to the combined financial statements, the combined financial statements referred
to above present only three enterprise funds of the City – the Water Utility Fund, the Sewer Utility Fund,
and the Stormwater Utility Fund and are not intended to present fairly the net assets, changes in financial
position, and cash flows of the City in conformity with accounting principles generally accepted in the
United States of America.
In our opinion, such combined financial statements present fairly, in all material respects, the financial
position of the Utilities as of June 30, 2010, and the changes in net assets and their cash flows for the year
then ended in conformity with accounting principles generally accepted in the United States of America.
The combined financial statements include summarized prior-year comparative information. Such
information does not include all of the information required to constitute a presentation in conformity
with accounting principles generally accepted in the United States of America. Accordingly, such
information should be read in conjunction with the Utilities’ combined financial statements for the year
ended June 30, 2009, from which the summarized information was derived.
The Management’s Discussion and Analysis on pages 3 through 14 is not a required part of the financial
statements but is supplementary information required by accounting principles generally accepted in the
United States of America. This supplementary information is the responsibility of the Utilities’
2
management. We have applied certain limited procedures, which consisted principally of inquiries of
management regarding the methods of measurement and presentation of supplementary information.
However, we did not audit the information and express no opinion on it.
Our audit was conducted for the purpose of forming an opinion on the basic financial statements taken as
a whole. The additional supplemental combining information is presented for the purpose of additional
analysis of the basic combined financial statements rather than to present the financial position, changes
in net assets, and cash flows of the individual enterprise funds, and is not a required part of the basic
combined financial statements. The additional supplemental information listed in the table of contents,
which is also the responsibility of the Utilities’ management, is presented for purposes of additional
analysis and is not a required part of the basic combined financial statements. Such additional information
has been subjected to the auditing procedures applied in our audit of the financial statements and, in our
opinion, is fairly stated in all material respects when considered in relation to the financial statements
taken as a whole. The supplemental schedule of consumer information has not been subjected to the
auditing procedures applied in the audit of the basic financial statements and, accordingly, we express no
opinion on it.
HANSEN, BARNETT & MAXWELL, P.C.
Salt Lake City, Utah
November 8, 2010

3
Management’s Discussion and Analysis (MD&A)
For the Year Ended June 30, 2010
(Unaudited)
The management for the Department of Public Utilities for Salt Lake City Corporation (referred hereafter
as the Department, Public Utilities or the Utilities) offers readers of the Utilities’ financial statements a
narrative overview and analysis of the financial activities or results of operation for the twelve months
ended June 30, 2010. Public Utilities encourages readers to consider the information presented here and
use this also in conjunction with the overall Salt Lake City Corporation (the “City”) financial report for
this same period. As with the overall City financial statements, Public Utilities financial statements also
follow Governmental Accounting Standards Board (“GASB”) pronouncements. A requirement of GASB
is to provide this discussion letter detailing activities of the reporting fiscal year with additional
comparative year’s information as a precursor and in-depth overview to the financial report for the same
period. The Public Utilities financial statements are prepared on an accrual basis in accordance with
generally accepted accounting standards set forth by GASB.
OUR MISSION
To serve our community and protect our environment by working to continuously improve water,
wastewater and stormwater services in a sustainable manner.
OUR VISION
Salt Lake City Public Utilities strives to be a leader in water resources by:
Valuing employees as our most important resource
Valuing partnerships with customers, suppliers and other agencies
Striving to continuously improve
Implementing innovative solutions
Acting as environmental stewards
Working toward governmental transparency
Improving our carbon footprint
Financial and Managerial Highlights
Public Utilities operate and manage three separate agencies under one managing Department. Water,
Sewer and Stormwater functions are each enterprise funds where the financial activities are separately
accounted for and presented in the financial statements. These funds are accounted for similarly to
business type activities in the private sector and money earned from each service charge can only be used
to provide the related services. Stormwater and Sewer serve the Salt Lake City’s incorporated boundaries
while Water serves both Salt Lake City and about 320,000 customers in Salt Lake County. The water
system evolved since inception about 1876 to meet the water needs of citizens when City boundaries were
few or non-existent. The water system in the County covers about 45 square miles of service area
compared to 90 square miles within Salt Lake City.

4
During the 2010 fiscal year, Water and Sewer rates did not increase as the struggles in the economy have
continued. The Department was able to meet budgetary needs without looking at reductions in employees
or scaling back needed capital improvements. Federal Stimulus money of $6.3 million for improvements
to the Reclamation Plant in the Sewer Fund was negotiated to be received from the State of Utah which
administers these funds. The funds are being delivered as needed to pay the contractor on a pay as you go
basis. These funds were received as revenue bonds at a zero interest rate. For more details, see notes to
the financial statement. The Department continues working on the multi-million dollar fire protection
upgrade for customers with Big Cottonwood Tanner Ditch Irrigation Company. Over the last 3 years, $8.7
million has been expended to replace smaller lines with larger capacity lines to improve the fire flow
needs of the customers in the Cottonwood Tanner Ditch area. The recent sewer master plan pinpointed the
Orange Street sewer line for immediate replacement. This line will cost nearly $10 million and require a
$12 million bond issue that was sold on Oct 5, 2010. Orange Street is one of three major trunk lines
showing signs of failure that connects to the sewer treatment plant. In other highlights, the Riparian
Corridor phase 1 was completed for Stormwater which was designed to look at environmental issues
along streams, such as protecting vegetation, fish, other wildlife and minimizing erosion. The cost of
phase 2 will be about $100,000. The economic slowdown in the Country continues with the greatest
impact on the Department’s interest rates. Rates are below 1% for most invested money, thereby reducing
our interest income by several million dollars each year for the last two years. Sales will need to increase
or a rate increase is needed to help us make up this difference.
Capital Projects were bid out by the Department at a greater rate than past years to help assist the local
economy and take advantage of reduced construction bids as much as possible. All of the projects were
budgeted projects or planned projects but were hurried along at a faster pace which did increase spending.
Management asked our engineers to design and build projects at a pace that was accelerated compared
with most years. The available cash in the three funds still remains strong despite the greater than normal
effort to design and construct as many projects as possible. Weather and the construction period available
in Utah is still largely confined to the warmer 6 months of the year thereby limiting the number of
projects that can be finished.
The Department continues to receive special local or national awards or recognition for water quality and
for the Sewer Reclamation plant compliance to national standards. The Department continues to meet all
of the requirements under the Safe Drinking and Clean Water Acts, including all of the standards that
must be met in providing drinking water and complying with the City’s National Pollutant Discharge
Elimination System (NPDES) permits for wastewater and stormwater discharges into the State’s receiving
waters. The Sewer Reclamation Plant did receive its seventeenth EPA Platinum Award in January 2010
for continued perfect compliance.
The City Council approved, beginning in July 2010, the collection of franchise fees on stormwater
revenue payable to the City General Fund. It is anticipated to generate approximately $500,000 of new
funding for the City. Total franchise fees payable to the General Fund from all three utility funds will
generate over $4 million in revenue for the City.
5
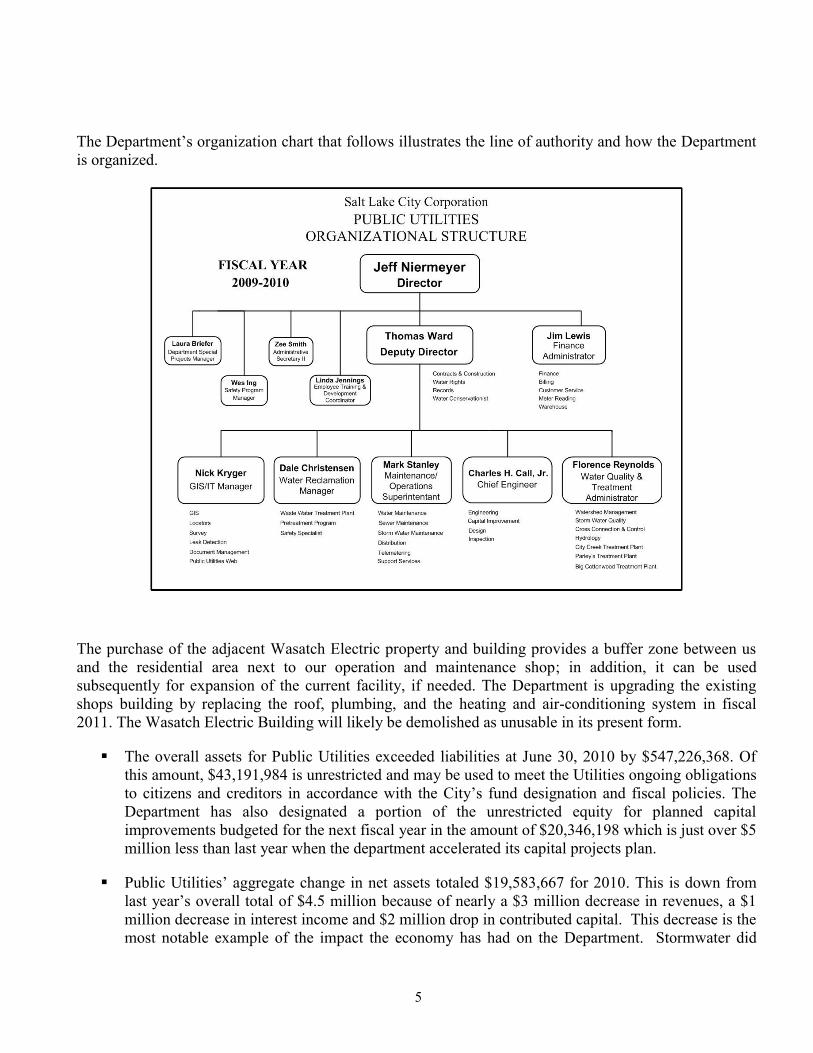
The Department’s organization chart that follows illustrates the line of authority and how the Department
is organized.
The purchase of the adjacent Wasatch Electric property and building provides a buffer zone between us
and the residential area next to our operation and maintenance shop; in addition, it can be used
subsequently for expansion of the current facility, if needed. The Department is upgrading the existing
shops building by replacing the roof, plumbing, and the heating and air-conditioning system in fiscal
2011. The Wasatch Electric Building will likely be demolished as unusable in its present form.
The overall assets for Public Utilities exceeded liabilities at June 30, 2010 by $547,226,368. Of
this amount, $43,191,984 is unrestricted and may be used to meet the Utilities ongoing obligations
to citizens and creditors in accordance with the City’s fund designation and fiscal policies. The
Department has also designated a portion of the unrestricted equity for planned capital
improvements budgeted for the next fiscal year in the amount of $20,346,198 which is just over $5
million less than last year when the department accelerated its capital projects plan.
Public Utilities’ aggregate change in net assets totaled $19,583,667 for 2010. This is down from
last year’s overall total of $4.5 million because of nearly a $3 million decrease in revenues, a $1
million decrease in interest income and $2 million drop in contributed capital. This decrease is the
most notable example of the impact the economy has had on the Department. Stormwater did
6
show an increase in revenues because of a 33% rate increase that was effective January 1, 2010.
This was the first Stormwater rate increase in nearly 20 years.
Changes in net assets or income for the Utilities were:
Water Sewer Stormwater Total
$9,875,064 $7,136,957 $2,571,646 $19,583,667
Public Utilities continued to have a strong debt service coverage ratio at 4.49 which is a slight
decrease but still very strong compared to similar utilities. The cause of this decrease occurred as
debt increased along with a drop in income. Interest income took another large drop from an
aggregate $4.1 million in 2008 and $1.6 million in 2009 to $750,000 for the current year. Interest
rates on state pooled investments are currently less than 1%.
Total individual net assets for each fund were as follows:
Water Sewer Stormwater Total
$282,450,668 $167,678,612 $97,097,088 $547,226,368
Total liabilities increased $2.9 million because of related long term obligations, while current liabilities
dropped over $200,000 from the prior year. Payables from restricted assets and long term debt increased
about $250,000 over last year. The long-term compensation liabilities jumped about $800,000 from last
year, while revenues collected in advance decreased $1 million.
The Water Fund for 2010 delayed a rate increase to assist customers affected by the poor
economy. However, the budgeted capital improvement plan of $27 million during this year
remained as an aggressive plan. Cost of buying water is budgeted next year to be $945,000 higher
than this year. The 2008 bond issue in the Water Fund from previous years has funded the $8
million fire system upgrade to the Big Cottonwood area water lines. Conservation continues to be
a hot topic as the City finished a rate and conservation study which recommended both a rate hike
and a creation of a 4th
tier rate shown at the end of this report. The approved Water Utility 2011
fiscal budget is $6 million lower than last year as spending needs drop back to more normal
expectations.
The Sewer Fund treatment plant upgrade was completed at a cost of $29 million, upgrading the
secondary treatment process and expanding the plant’s ability to handle organic waste loads to
meet future regulations. Another major project at the plant is replacing the three digester roofs and
walls using a State bond for $6.3 million. This project will increase the treatment capacity of the
digester by increasing the height of the walls. With the capital needs identified by the new master
plan, a $12 million bond issue late in 2010 will assist with the replacement of the Orange Street
line. The new $29.6 million capital improvement budget for 2011 is $12 million higher than the
current 2010 budget. Replacing the Orange Street major trunk line is one of the highlights of the
new budget and completion of the 1800 North trunk line.
The Stormwater Fund received a half year of its first rate increase in 18 years of 33% and,
beginning July of 2010, another 8% increase will be in effect. The Riparian Corridor phase 2

7
Study of our city streams is underway. The Oil Drain Project includes a budget of $1 million next
year to cover expected additional costs to clean the canal. Overall capital projects dips about $2
million from the previous year allowing for a rate increase to help strengthen cash reserves as
projects lined up for 2012 are expected to double the current capital budget.
Overall, the Public Utilities’ operating income again decreased by $2,242,183 from the prior year. This
significant decrease is caused by nearly a $3 million decrease in sales revenues. Both Sewer and Water
sales were affected by the wet spring and continued conservation practices. Operating expenses actually
decreased by $667,000 through continued efficient use of resources. The Water fund accounts for 70% of
the utility funds’ operating revenue for fiscal 2010, a drop of 1% from last year. The Water Fund capital
payment to the Metropolitan Water District of $7,021,892 plus water purchases account for 26% of the
Water Fund’s operating costs or 18.4% in aggregate for all three funds. The Stormwater Fund was the
only fund to have an increase in revenues of $806,376 or 14.8% because of the 6 months of fee increase
for the year. Since salaries did not increase this year, there was only a $155,527 increase in the cost of
salaries and benefits above 2009 because of changes in the employee benefits and new hires in existing
positions.
OVERVIEW OF THE FINANCIAL STATEMENTS This discussion and analysis is presented as an introduction to both the financial statements and notes to
the financial statements of the Salt Lake City Department of Public Utilities. This discussion report
contains additional information to help the reader better understand this agency, its activities and financial
performance.
The combined balance sheets show the Utilities’ total assets and liabilities with the difference between
them as net assets. In the past net assets was referred to as equity. Over time, increases or decrease in net
assets may serve as an indicator as to whether the financial condition of the Utilities is improving or
declining. The Utilities continues to show sustained steady growth but also reflects the impact from the
economy, conservation and changes in sustainability.
The combined statements of activities, also referred to as the Statements of Revenues, Expenses, and
Changes in Net Assets, show the changes to net assets through the activities of each fund and earnings.
These changes are recorded when the underlying event that causes the change occurs, regardless of when
the cash transaction takes place. Thus, some revenues and expenses are recorded in the statement of
activities for some items even when the resulting cash flow may occur in a future period. Examples are
water that has been used but remains unbilled at year end. The revenue is accrued or recorded although
the actual billing for services does not occur until the next fiscal year. A similar effect occurs when
expenses are incurred, but the actual invoices are not paid or received until the next fiscal year.
GASB Statement 45 accounting for retired employee benefits was a new schedule and cost that began
in 2008. This is referred to in the accounting literature as OPEB or Other Post Employment Benefits. The
objective of Statement 45 is to accurately reflect the financial effects of OPEB transactions, including the
amounts paid and contributed by the Utilities, whatever those amounts may be. Public Utilities provide
retired employees healthcare benefits at a reduced cost as part of the compensation package to attract and
retain qualified employees. The annual expense for the Utilities is calculated based on an actuarially
determined amount to arrive at the Utilities’ yearly required contribution. For 2010 the annual required
contribution dropped slightly to $949,000 for the Utilities. The total unfunded accrued actuarial liability is
8
about $10.7 million which is about $1 million less than last year. See Note 9 in the financial statements
for more detailed information.
Notes to the combined financial statements contain additional information important for a complete
understanding of the information contained in the financial statements. Notes to the financial statement
are located on pages 20 - 38 of the statements.
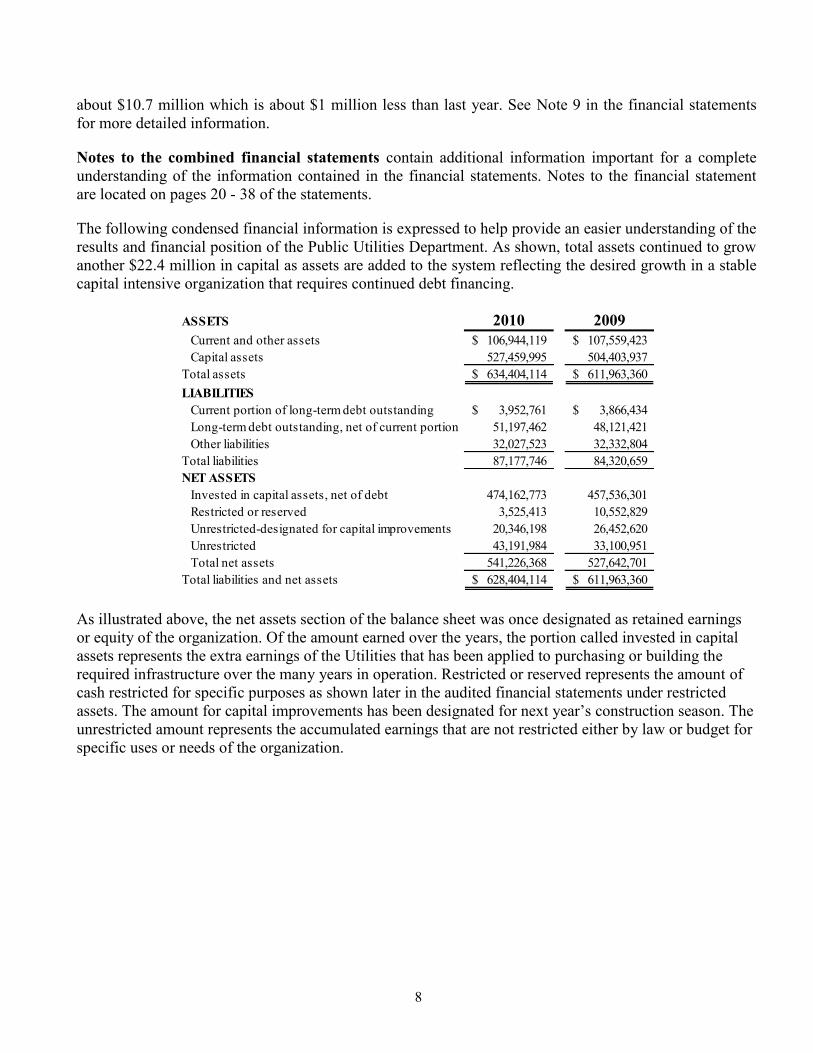
The following condensed financial information is expressed to help provide an easier understanding of the
results and financial position of the Public Utilities Department. As shown, total assets continued to grow
another $22.4 million in capital as assets are added to the system reflecting the desired growth in a stable
capital intensive organization that requires continued debt financing.
ASSETS 2010 2009
Current and other assets 106,944,119$ 107,559,423$
Capital assets 527,459,995 504,403,937
Total assets 634,404,114$ 611,963,360$
LIABILITIES
Current portion of long-term debt outstanding 3,952,761$ 3,866,434$
Long-term debt outstanding, net of current portion 51,197,462 48,121,421
Other liabilities 32,027,523 32,332,804
Total liabilities 87,177,746 84,320,659
NET ASSETS
Invested in capital assets, net of debt 474,162,773 457,536,301
Restricted or reserved 3,525,413 10,552,829
Unrestricted-designated for capital improvements 20,346,198 26,452,620
Unrestricted 43,191,984 33,100,951
Total net assets 541,226,368 527,642,701
Total liabilities and net assets 628,404,114$ 611,963,360$
As illustrated above, the net assets section of the balance sheet was once designated as retained earnings
or equity of the organization. Of the amount earned over the years, the portion called invested in capital
assets represents the extra earnings of the Utilities that has been applied to purchasing or building the
required infrastructure over the many years in operation. Restricted or reserved represents the amount of
cash restricted for specific purposes as shown later in the audited financial statements under restricted
assets. The amount for capital improvements has been designated for next year’s construction season. The
unrestricted amount represents the accumulated earnings that are not restricted either by law or budget for
specific uses or needs of the organization.

9
As shown below, the Summary of Changes in Net Assets reflects the activities of the organization during
the fiscal year through earnings and operating expenses to determine what income or change in assets will
occur for the year’s activity. These activities include the cost of debt and capital contributed as either cash
or infrastructure to the system as contractors provide impact fees or develop subdivisions, constructing the
needed lines to connect to the existing water, sewer and stormwater systems.
SUMMARY OF CHANGES IN NET ASSETS 2010 2009
Operating revenues 77,254,535$ 80,164,369$
Operating expenses before depreciation 54,933,303 55,979,840
Operating income before depreciation 22,321,232 24,184,529
Depreciation (13,132,012) (12,753,126)
Operating income 9,189,220 11,431,403
Non-operating revenue (expense) and capital
contributions
Contributions and grants 9,556,221 11,582,751
Net bond interest expense (385,170) (756,696)
Interest income 749,739 1,661,807
Gain on disposition of property and equipment 473,657 167,985
10,394,447 12,655,847
Change in net assets $19,583,667 $24,087,250
A review of changes in net assets illustrates the decrease in operating income and a continued decline in
interest income, which explains the downward change in net assets. However, the change in interest
income is not a manageable income but is highly dependent on the rates set by economic conditions.
Thus, the comparison financially between 2009 and 2010 does reflect the struggling economy as
contributions, interest income and operating revenue all declined. A decrease in operating expenses,
however, shows a sustained amount of efficiency to reduce variable costs, although some costs to produce
water or treat sewer would naturally be less with reduced demand.
REVENUES
The chart on the following page gives a breakdown of major revenue sources and percentages for Public
Utilities for the fiscal year ending June 30, 2010. Percentages of Utilities’ revenue sources showed some
changes that reflect the volatile economy, especially in interest income and contributions. Interest income,
although a small percentage, changed 45% from last year and contributions dropped 1.5% as new
construction remains slow. Percentages for Water and Sewer revenues did not change much but
Stormwater revenue increased from 5.7% to 7.1% reflecting the rate increase for Stormwater. Water
conservation practices continue to affect sales for both sewer and water without a rate increase to generate
more income than the previous year. With the wet spring, demand for water did not increase until July and
customers adhered to the plea to conserve and lower their bills. Sale of fixed assets increased as the
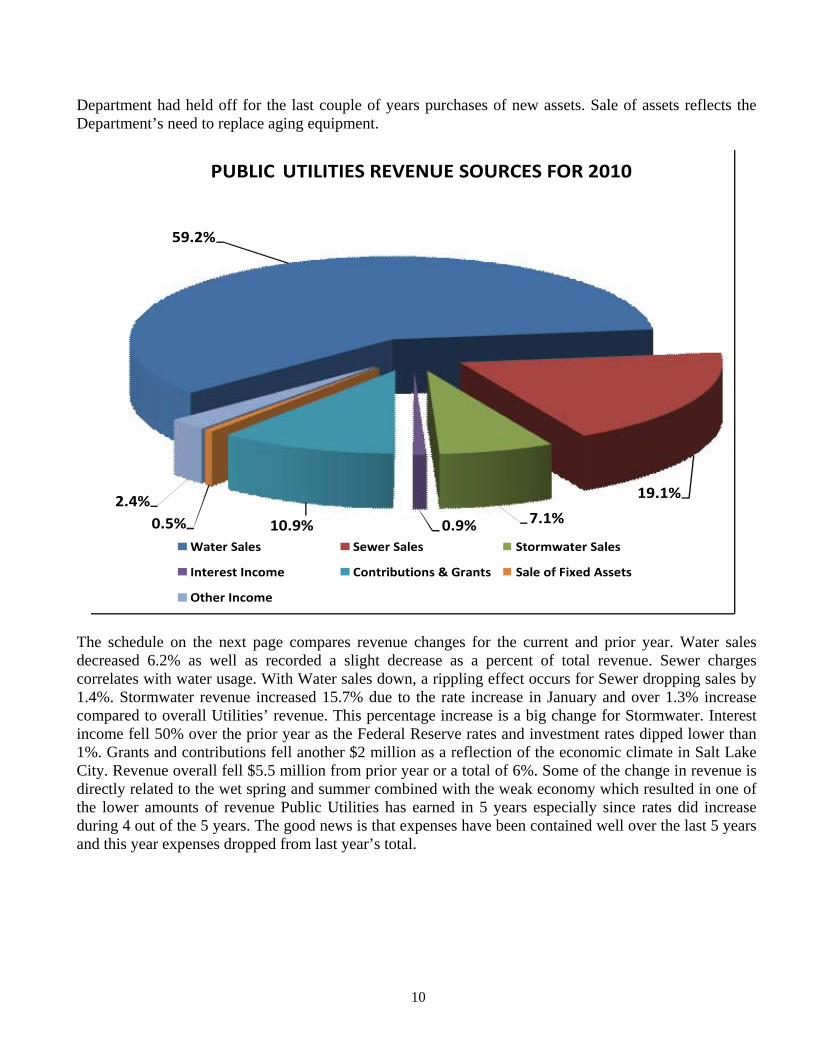
10
Department had held off for the last couple of years purchases of new assets. Sale of assets reflects the Department’s need to replace aging equipment.
59.2%
19.1%
7.1%0.9%10.9%0.5%
2.4%
Water Sales Sewer Sales Stormwater Sales
Interest Income Contributions & Grants Sale of Fixed Assets
Other Income
PUBLIC UTILITIES REVENUE SOURCES FOR 2010
The schedule on the next page compares revenue changes for the current and prior year. Water sales decreased 6.2% as well as recorded a slight decrease as a percent of total revenue. Sewer charges correlates with water usage. With Water sales down, a rippling effect occurs for Sewer dropping sales by 1.4%. Stormwater revenue increased 15.7% due to the rate increase in January and over 1.3% increase compared to overall Utilities’ revenue. This percentage increase is a big change for Stormwater. Interest income fell 50% over the prior year as the Federal Reserve rates and investment rates dipped lower than 1%. Grants and contributions fell another $2 million as a reflection of the economic climate in Salt Lake City. Revenue overall fell $5.5 million from prior year or a total of 6%. Some of the change in revenue is directly related to the wet spring and summer combined with the weak economy which resulted in one of the lower amounts of revenue Public Utilities has earned in 5 years especially since rates did increase during 4 out of the 5 years. The good news is that expenses have been contained well over the last 5 years and this year expenses dropped from last year’s total.

11
2010
Amount
Percent
of Total
2009
Amount
Percent
of Total
Operating
Water Sales 52,121,963$ 59.21% 55,580,475$ 59.40%
Charges for sewer services 16,808,524 19.09% 17,056,970 18.23%
Stormwater fees 6,220,499 7.07% 5,377,785 5.74%
Other revenues 2,103,549 2.39% 2,149,139 2.30%
Total operating revenue 77,254,535 87.76% 80,164,369 85.67%
Non-operating revenue (expense) and capital
contributions
Contributions and grants 9,556,221 10.85% 11,582,751 12.37%
Interest income 749,739 0.85% 1,661,807 1.78%
Gain on disposition of property and equipment 473,657 0.54% 167,985 0.18%
Total non-operating revenue 10,779,617 12.24% 13,412,543 14.33%
Total revenue 88,034,152$ 100.00% 93,576,912$ 100.00%
EXPENSES
The following tables provide a summary of expenses for the year ended June 30, 2010. Comparisons are
shown for changes between fiscal year 2010 and 2009 and comparison between budget and actual
expenses excluding depreciation and capital expenditures.
FY 2010
Amount
Percent of
Total
FY 2009
Amount
Percent of
Total
Operating Expense:
Personnel services 24,257,412$ 35.44% 24,101,884$ 34.69%
Operating and Maintenance supply 3,818,987 5.58% 3,773,075 5.43%
Charges / services / fees 26,856,904 39.24% 28,104,881 40.44%
Total operating expense before depreciation 54,933,303 80.26% 55,979,840 80.56%
Depreciation 13,132,012 19.18% 12,753,126 18.35%
Total operating expense 68,065,315 99.44% 68,732,966 98.91%
Non-operating -bond interest expense 385,170 0.56% 756,696 1.09%
Total expense 68,450,485$ 100.00% 69,489,662$ 100.00%
As shown above, the operating expenses were $1 million lower as water purchase costs and consulting
costs dropped across the Department. The Department continued with a positive budget variance as
anticipated costs were expected to rise but actual costs dropped, likely reflecting the weak economy. The
Department kept expenses $4.2 million or 6.5% less than budgeted which correlates with a decrease in
revenue. Cost of services and employee costs remained consistent with last year with only a wet spring
requiring less water used and reduced Utilities costs.
12
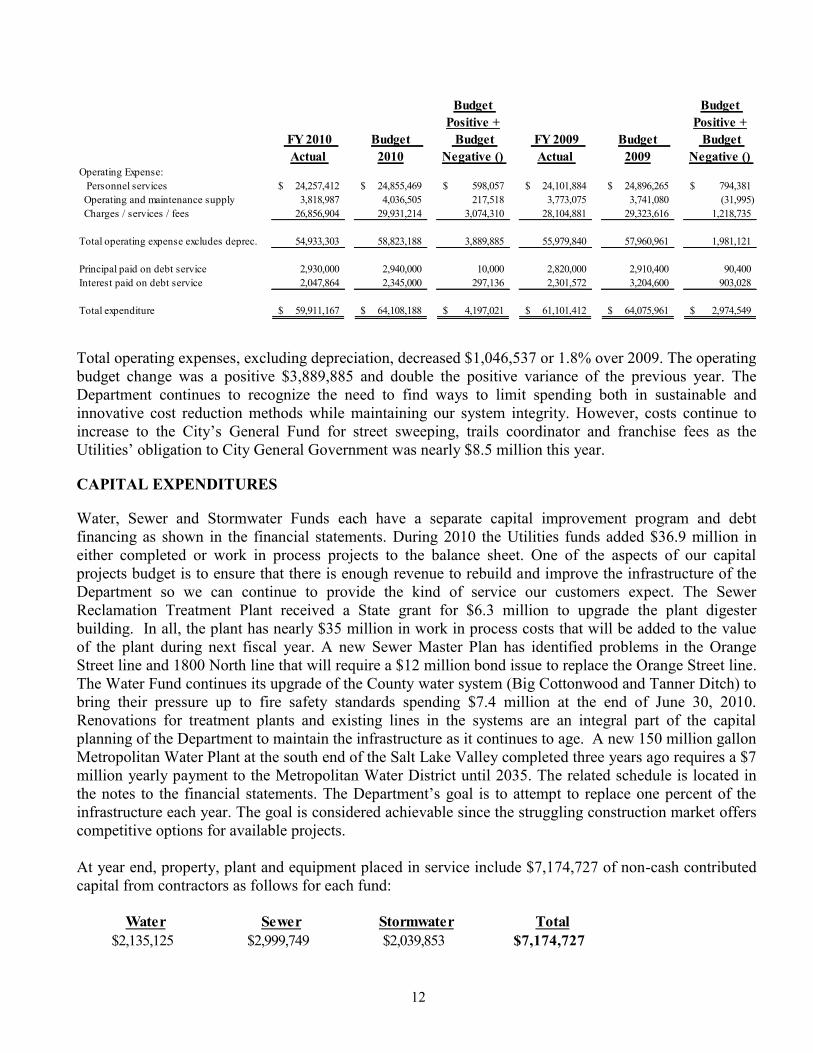
Budget
Positive +
Budget
Positive +
FY 2010
Actual
Budget
2010
Budget
Negative ()
FY 2009
Actual
Budget
2009
Budget
Negative ()
Operating Expense:
Personnel services 24,257,412$ 24,855,469$ 598,057$ 24,101,884$ 24,896,265$ 794,381$
Operating and maintenance supply 3,818,987 4,036,505 217,518 3,773,075 3,741,080 (31,995)
Charges / services / fees 26,856,904 29,931,214 3,074,310 28,104,881 29,323,616 1,218,735
Total operating expense excludes deprec. 54,933,303 58,823,188 3,889,885 55,979,840 57,960,961 1,981,121
Principal paid on debt service 2,930,000 2,940,000 10,000 2,820,000 2,910,400 90,400
Interest paid on debt service 2,047,864 2,345,000 297,136 2,301,572 3,204,600 903,028
Total expenditure 59,911,167$ 64,108,188$ 4,197,021$ 61,101,412$ 64,075,961$ 2,974,549$
Total operating expenses, excluding depreciation, decreased $1,046,537 or 1.8% over 2009. The operating
budget change was a positive $3,889,885 and double the positive variance of the previous year. The
Department continues to recognize the need to find ways to limit spending both in sustainable and
innovative cost reduction methods while maintaining our system integrity. However, costs continue to
increase to the City’s General Fund for street sweeping, trails coordinator and franchise fees as the
Utilities’ obligation to City General Government was nearly $8.5 million this year.
CAPITAL EXPENDITURES
Water, Sewer and Stormwater Funds each have a separate capital improvement program and debt
financing as shown in the financial statements. During 2010 the Utilities funds added $36.9 million in
either completed or work in process projects to the balance sheet. One of the aspects of our capital
projects budget is to ensure that there is enough revenue to rebuild and improve the infrastructure of the
Department so we can continue to provide the kind of service our customers expect. The Sewer
Reclamation Treatment Plant received a State grant for $6.3 million to upgrade the plant digester
building. In all, the plant has nearly $35 million in work in process costs that will be added to the value
of the plant during next fiscal year. A new Sewer Master Plan has identified problems in the Orange
Street line and 1800 North line that will require a $12 million bond issue to replace the Orange Street line.
The Water Fund continues its upgrade of the County water system (Big Cottonwood and Tanner Ditch) to
bring their pressure up to fire safety standards spending $7.4 million at the end of June 30, 2010.
Renovations for treatment plants and existing lines in the systems are an integral part of the capital
planning of the Department to maintain the infrastructure as it continues to age. A new 150 million gallon
Metropolitan Water Plant at the south end of the Salt Lake Valley completed three years ago requires a $7
million yearly payment to the Metropolitan Water District until 2035. The related schedule is located in
the notes to the financial statements. The Department’s goal is to attempt to replace one percent of the
infrastructure each year. The goal is considered achievable since the struggling construction market offers
competitive options for available projects.
At year end, property, plant and equipment placed in service include $7,174,727 of non-cash contributed
capital from contractors as follows for each fund:
Water Sewer Stormwater Total
$2,135,125 $2,999,749 $2,039,853 $7,174,727

13
The Utilities also capitalizes a portion of the debt interest paid during the year as part of the cost of
constructing Water, Sewer and Storm lines during the year. Water, Sewer and Stormwater capitalized
interest in the amounts of $549,002, $933,008 and $180,684, respectively.
DEBT ADMINISTRATION
During the year the State provided the Sewer Fund with a stimulus type bond for $6.3 million to replace
the digester covers at the Sewer Reclamation Plant. These bonds have no interest and are not payable until
2012. No other bonds were issued during the year, but with an aggressive capital program underway, the
Department may issues bonds for all three funds. Current debt for all three funds is about $54.2 million
which reflects an increase of $3.2 million compared to 2009 fiscal year. Water still has outstanding
revenue bonds of $21.7 million that will mature in 2024. Sewer has outstanding revenue bonds of $26.2
million used for the extensive upgrade in secondary treatment capacity at the sewer reclamation plant
which will mature in 2031. Stormwater has about $6.3 million debt outstanding which will mature in
2024. After year end, the Department bonded for $12 million more for the Sewer Fund to repair the
Orange Street trunk line as determined by the latest Sewer Master Plan. The Department is always
watching the bond interest rates so when desirable, the Department may refund higher yield bonds and
replace them with lower interest bearing amounts as occurred in fiscal year 2008. With favorable interest
rates, the debt service for next year will increase about $750,000.
PUBLIC UTILITIES RATE STRUCTURE
Listed below is the general rate structure for Water, Sewer and Stormwater rates as of July 2010. Rates for
fiscal 2010 did not change except for a Stormwater increase to $4 from $3 a month. A rate study this year
by the Department has created a 4th
tier for a summer conservation rate. Overall a water increase of 5%
will be applied to the new tier structure including an increase to Sewer of 4.5% and Stormwater of 6%.
These rates effective 2011 fiscal year are shown below. Public Utilities’ rates still remain some of the
lowest in the Country. Water rates are structured to help conservation efforts as authorized by a special
2008 conservation study approved by a nine member Public Utilities Advisory Committee, City Council
and Mayor. Units of water are measured in 100 cubic foot units. One unit of 748 gallons of water at the
winter rate costs 93 cents. Bills are sent to customers monthly unless a special agreement exists. The
Department also bills garbage collection to all residential customers for the Salt Lake Municipal
Government. The Refuse Collection Fund pays Public Utilities for the garbage collection billing services.
Service
Fee*
First Tier
1-10 units
Second Tier
11-30 units
Third Tier
31-70 units
Fourth Tier
>70 units
Service
Fee*
First Tier
1-10 units
Second Tier
11-30 units
Third Tier
31-70 units
Fourth Tier
>70 units
Water Rates / Unit $7.79 $0.93 $1.43 $1.98 $2.08 $10.34 $1.26 $1.93 $2.67 $2.80
Sewer Rates@
Stormwater
BASIC RESIDENTIAL RATE STRUCTURE Effective 7/01/2010
1 Unit = 748 gallons
Salt Lake City Customers
$1.38 per unit of Winter water use
Salt Lake County Customers
No Sewer customers in the County
$4.24 per month per resident depending on size of property and pervious or impervious property
*Amount shown is minimum monthy service fee. Bill minimum starts at $93.48 per year City; County fixed fee is 35% higher at
$124.08 per year. The fixed monthly charge increases by line size up to 10" line size.@
Sewer rates for commercial owners maybe placed into one of 7 categories by waste strength thus increasing unit costs

14
ECONOMIC OUTLOOK
The effects of a struggling economy continue to bring stress to the City forcing layoffs and budget cuts
unlike any existing employees have seen. A new franchise fee will be implemented for Stormwater to
generate additional fees to the General Fund starting July 2010. One positive aspect of the weak economy
is that the price of construction will not likely increase. However, as equally offsetting, interest earning
rates for idle funds are at all time lows and do not help bridge the gap when wet weather further decreases
income. As last year, the Department is moving ahead full bore to complete desired projects and do its
part to continue to help bolster our local economy. The new rates for all three funds will support the
funding of projects at such an accelerated pace. The Department will still remain focused at providing the
necessary water and utility services our customers have come to expect and look to this service with the
expectation of providing it at the least impact possible to our customers during the struggling economy.
Conservation, transparency, sustainability and improving our carbon footprint are part of the vision that
management is focusing additional time and effort to improve or implement throughout the Department.
The general revenue outlook is affected by weather and conservation. July through October 2010 has
remained dry and mild. Our hope is for a good snow pack along with a hot and dry spring next year. We
also expect to see continued conservation with a tougher water tier structure that was implemented.
Overall, in the eight years since the Department started educating the public on water conservation and
the implementation of the new conservation rate structure in 2002, it is estimated that 45 billion gallons of
water were saved. This is greater than one full year of water use for the Department, or about 138,000
acre feet of water. An acre foot of water contains 325,900 gallons of water. The Department continues to
meet its own and State of Utah’s water conservation goals.
REQUEST FOR INFORMATION
Questions concerning any of the information provided in this report or requests for additional financial
information should be addressed to the Salt Lake City Public Utilities, 1530 South West Temple, Salt
Lake City, Utah 84115.
* * * * * *
Public Utilities Management

15
SALT LAKE CITY WATER, SEWER, AND STORMWATER UTILITIES
(Enterprise Funds of Salt Lake City Corporation)
COMBINED BALANCE SHEET
JUNE 30, 2010 (WITH COMPARATIVE INFORMATION FOR 2009)
Water Sewer Stormwater
Utility Utility Utility 2010 2009
ASSETS
CURRENT ASSETS:
Cash and cash equivalents 23,511,719$ 38,017,185$ 9,353,774$ 70,882,678$ 70,241,460$
Investments 8,046,224 - - 8,046,224 10,185,117
Accounts receivable, less allowance for
doubtful accounts of $299,008, $13,077,
$3,222, totaling $315,307, respectively 5,607,190 1,830,014 753,523 8,190,727 6,955,675
Bond proceeds receivable - 4,540,000 - 4,540,000 -
Other receivables 658,772 12,891 - 671,663 848,743
Prepaids - 1,429 - 1,429 19,149
Supplies inventories 2,331,661 602,691 - 2,934,352 2,995,092
Total current assets 40,155,566 45,004,210 10,107,297 95,267,073 91,245,236
NONCURRENT ASSETS:
Restricted and reserved cash and cash equivalents,
amounts restricted or reserved for:
Revenue bond debt service 1,144,932 775,133 244,779 2,164,844 2,163,021
Renewal and replacement 142,200 1,384,500 - 1,526,700 1,526,700
Capital improvements 16 788,564 - 788,580 3,634,458
Customer deposits 496,597 - - 496,597 536,889
Impact fees 2,443,926 1,163,047 941,699 4,548,672 6,326,219
Total restricted and reserved
cash and cash equivalents 4,227,671 4,111,244 1,186,478 9,525,393 14,187,287
Property and equipment, at cost:
Land 13,491,785 4,185,947 1,387,919 19,065,651 17,885,381
Water rights 32,359,285 - - 32,359,285 32,359,285
Buildings 45,226,962 46,813,235 6,952,656 98,992,853 97,897,597
Improvements other than buildings, principally
water and sewer lines and stormwater facilities 253,536,329 85,716,866 113,593,483 452,846,678 435,695,538
Machinery and equipment 23,058,361 28,756,918 2,880,787 54,696,066 53,911,028
Construction in progress 16,316,007 52,509,803 4,454,554 73,280,364 59,153,905
383,988,729 217,982,769 129,269,399 731,240,897 696,902,734
Less accumulated depreciation (96,910,888) (70,700,059) (36,169,955) (203,780,902) (192,498,797)
Net property and equipment 287,077,841 147,282,710 93,099,444 527,459,995 504,403,937
Other assets:
Unamortized bond issue costs, net 245,030 266,520 62,141 573,691 548,938
Investments in water company stock, at cost 1,577,962 - - 1,577,962 1,577,962
Total other assets 1,822,992 266,520 62,141 2,151,653 2,126,900
Total noncurrent assets 293,128,504 151,660,474 94,348,063 539,137,041 520,718,124
TOTAL ASSETS 333,284,070$ 196,664,684$ 104,455,360$ 634,404,114$ 611,963,360$
Supplemental Information
Combined

16
SALT LAKE CITY WATER, SEWER, AND STORMWATER UTILITIES
(Enterprise Funds of Salt Lake City Corporation)
COMBINED BALANCE SHEET
JUNE 30, 2010 (WITH COMPARATIVE INFORMATION FOR 2009)
Water Sewer Stormwater
Utility Utility Utility 2010 2009
LIABILITIES AND NET ASSETS
CURRENT LIABILITIES:
Accounts payable 2,240,355$ 1,247,366$ 663,037$ 4,150,758$ 4,189,598$
Accrued compensation 203,907 76,049 23,939 303,895 246,241
Current portion of long-term compensation liability 355,161 59,703 18,080 432,944 521,963
Current revenues collected in advance 1,260,923 140,169 60,660 1,461,752 1,423,524
Current maturities of long-term obligations 1,055,834 556,383 175,699 1,787,916 1,102,876
Total current liabilities 5,116,180 2,079,670 941,415 8,137,265 7,484,202
LIABILITIES PAYABLE FROM
RESTRICTED ASSETS:
Current maturities of long-term obligations:
Principal 754,166 397,417 125,501 1,277,084 1,827,124
Accrued interest 390,766 377,716 119,279 887,761 936,434
Customer deposits 496,597 - - 496,597 536,889
Total liabilities payable from restricted assets 1,641,529 775,133 244,780 2,661,442 3,300,447
Long-term obligations, less current maturities 19,950,078 25,260,012 5,987,372 51,197,462 48,121,421
Long-term compensation liability 3,874,749 871,257 184,705 4,930,711 4,141,129
Revenues collected in advance 20,250,866 - - 20,250,866 21,273,460
Total liabilities payable from restricted
assets and long-term liabilities 45,717,222 26,906,402 6,416,857 79,040,481 76,836,457
Total liabilities 50,833,402 28,986,072 7,358,272 87,177,746 84,320,659
COMMITMENTS AND CONTINGENCIES (Note 10)
NET ASSETS:
Invested in capital assets, net of related debt 265,562,808 121,726,953 86,873,012 474,162,773 457,536,301
Restricted or reserved 4,227,691 4,111,244 1,186,478 9,525,413 10,552,829
Unrestricted - designated for capital improvements 9,119,956 9,177,125 2,049,117 20,346,198 26,452,620
Unrestricted 3,540,213 32,663,290 6,988,481 43,191,984 33,100,951
Total net assets 282,450,668 167,678,612 97,097,088 547,226,368 527,642,701
TOTAL LIABILITIES AND NET ASSETS 333,284,070$ 196,664,684$ 104,455,360$ 634,404,114$ 611,963,360$
(Concluded)
Supplemental Information
Combined

17
SALT LAKE CITY WATER, SEWER, AND STORMWATER UTILITIES
(Enterprise Funds of Salt Lake City Corporation)
COMBINED STATEMENT OF REVENUES, EXPENSES, AND CHANGES IN NET ASSETS
YEAR ENDED JUNE 30, 2010 (WITH COMPARATIVE INFORMATION FOR 2009)
Water Sewer Stormwater
Utility Utility Utility 2010 2009
OPERATING REVENUES:
Metered sales 52,121,963$ -$ -$ 52,121,963$ 55,580,475$
Charges for sewer services - 16,808,524 - 16,808,524 17,056,970
Stormwater fees - - 6,220,499 6,220,499 5,377,785
Other 1,780,698 303,734 19,117 2,103,549 2,149,139
Total operating revenues 53,902,661 17,112,258 6,239,616 77,254,535 80,164,369
OPERATING EXPENSES:
Cost of sales and services 32,361,955 7,418,483 1,998,202 41,778,640 42,817,503
General and administrative 8,617,402 2,809,357 1,727,904 13,154,663 13,162,337
Depreciation and amortization 6,824,427 3,957,809 2,349,776 13,132,012 12,753,126
Total operating expenses 47,803,784 14,185,649 6,075,882 68,065,315 68,732,966
OPERATING INCOME 6,098,877 2,926,609 163,734 9,189,220 11,431,403
OTHER REVENUE (EXPENSE):
Bond interest expense (979,181) (933,008) (294,634) (2,206,823) (2,301,572)
Bond premium 36,943 92,732 29,284 158,959 158,958
Less capitalized interest portion 549,002 933,008 180,684 1,662,694 1,385,918
Net bond interest expense (393,236) 92,732 (84,666) (385,170) (756,696)
Interest income, net 434,780 259,117 55,842 749,739 1,661,807
Gain on disposition of property and equipment 144,118 317,418 12,121 473,657 167,985
Net other revenue 185,662 669,267 (16,703) 838,226 1,073,096
CAPITAL CONTRIBUTIONS AND GRANTS 3,590,525 3,541,081 2,424,615 9,556,221 11,582,751
CHANGES IN NET ASSETS 9,875,064 7,136,957 2,571,646 19,583,667 24,087,250
NET ASSETS:
Beginning of the year 272,575,604 160,541,655 94,525,442 527,642,701 503,555,451
End of the year 282,450,668$ 167,678,612$ 97,097,088$ 547,226,368$ 527,642,701$
Supplemental Information
Combined

18
SALT LAKE CITY WATER, SEWER, AND STORMWATER UTILITIES
(Enterprise Funds of Salt Lake City Corporation)
COMBINED STATEMENT OF CASH FLOWS
YEAR ENDED JUNE 30, 2010 (WITH COMPARATIVE INFORMATION FOR 2009)
Water Sewer Stormwater
Utility Utility Utility 2010 2009
CASH FLOWS FROM OPERATING
ACTIVITIES:
Receipts from customers 53,277,738$ 16,873,626$ 5,997,369$ 76,148,733$ 82,034,635$
Payments for services provided by Salt Lake City (2,832,443) (1,027,923) (1,008,640) (4,869,006) (4,855,294)
Payments to suppliers (23,187,237) (2,583,804) (644,604) (26,415,645) (27,012,052)
Payments to employees (15,656,409) (6,274,759) (1,641,774) (23,572,942) (23,498,998)
Net cash provided by operating activities 11,601,649 6,987,140 2,702,351 21,291,140 26,668,291
CASH FLOWS FROM CAPITAL AND
RELATED FINANCING ACTIVITIES:
Purchases of capital equipment (1,683,374) (595,492) (8,815) (2,287,681) (3,088,538)
Payments for acquisition and construction of
property (16,090,480) (5,727,404) (2,756,474) (24,574,358) (19,757,924)
Proceeds from issue of bonds - 1,760,000 - 1,760,000 -
Premium on issue of bonds - (92,732) - (92,732) (92,732)
Principal paid on capital debt (1,735,000) (908,200) (286,800) (2,930,000) (2,820,000)
Interest paid on capital debt (761,219) (928,937) (294,855) (1,985,011) (1,828,877)
Deferred contributions (1,022,595) - - (1,022,595) (1,022,596)
Capital contributions 1,455,399 541,332 384,762 2,381,493 4,154,416
Receipts from sale of capital assets 167,370 313,128 24,175 504,673 192,766
Net cash used in capital and
related financing activities (19,669,899) (5,638,305) (2,938,007) (28,246,211) (24,263,485)
CASH FLOWS FROM INVESTING ACTIVITIES:
Interest received on investments 480,544 259,117 55,842 795,503 2,258,566
Proceeds from sale of investments 2,138,892 - - 2,138,892 8,880,184
Net cash provided by investing activities 2,619,436 259,117 55,842 2,934,395 11,138,750
CHANGE IN CASH AND CASH
EQUIVALENTS (5,448,814) 1,607,952 (179,814) (4,020,676) 13,543,556
CASH AND CASH EQUIVALENTS:
Beginning of year 33,188,204 40,520,477 10,720,066 84,428,747 70,885,191
End of year 27,739,390$ 42,128,429$ 10,540,252$ 80,408,071$ 84,428,747$
Supplemental Information
Combined
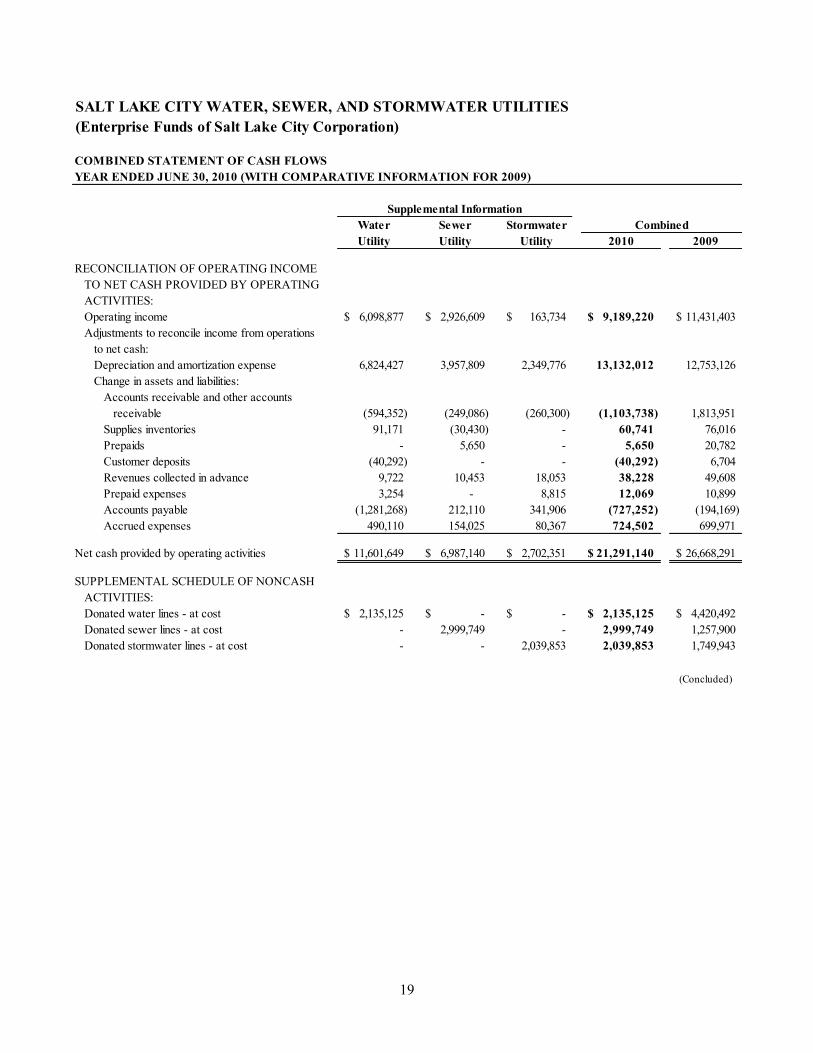
19
SALT LAKE CITY WATER, SEWER, AND STORMWATER UTILITIES
(Enterprise Funds of Salt Lake City Corporation)
COMBINED STATEMENT OF CASH FLOWS
YEAR ENDED JUNE 30, 2010 (WITH COMPARATIVE INFORMATION FOR 2009)
Water Sewer Stormwater
Utility Utility Utility 2010 2009
RECONCILIATION OF OPERATING INCOME
TO NET CASH PROVIDED BY OPERATING
ACTIVITIES:
Operating income 6,098,877$ 2,926,609$ 163,734$ 9,189,220$ 11,431,403$
Adjustments to reconcile income from operations
to net cash:
Depreciation and amortization expense 6,824,427 3,957,809 2,349,776 13,132,012 12,753,126
Change in assets and liabilities:
Accounts receivable and other accounts
receivable (594,352) (249,086) (260,300) (1,103,738) 1,813,951
Supplies inventories 91,171 (30,430) - 60,741 76,016
Prepaids - 5,650 - 5,650 20,782
Customer deposits (40,292) - - (40,292) 6,704
Revenues collected in advance 9,722 10,453 18,053 38,228 49,608
Prepaid expenses 3,254 - 8,815 12,069 10,899
Accounts payable (1,281,268) 212,110 341,906 (727,252) (194,169)
Accrued expenses 490,110 154,025 80,367 724,502 699,971
Net cash provided by operating activities 11,601,649$ 6,987,140$ 2,702,351$ 21,291,140$ 26,668,291$
SUPPLEMENTAL SCHEDULE OF NONCASH
ACTIVITIES:
Donated water lines - at cost 2,135,125$ -$ -$ 2,135,125$ 4,420,492$
Donated sewer lines - at cost - 2,999,749 - 2,999,749 1,257,900
Donated stormwater lines - at cost - - 2,039,853 2,039,853 1,749,943
(Concluded)
Supplemental Information
Combined

20
SALT LAKE CITY WATER, SEWER, AND STORMWATER UTILITIES (Enterprise Funds of Salt Lake City Corporation)
NOTES TO COMBINED FINANCIAL STATEMENTS
YEAR ENDED JUNE 30, 2010 (WITH COMPARATIVE TOTALS FOR 2009)
1. SUMMARY OF ACCOUNTING POLICIES
A summary of the significant accounting policies consistently applied in the preparation of the
accompanying combined financial statements follows.
Basis of Presentation—The Water Utility Fund, the Sewer Utility Fund, and the Stormwater Utility
Fund (the “Salt Lake City Water, Sewer, and Stormwater Utilities” or the “Utilities”) are enterprise
funds of Salt Lake City Corporation (the “City”). The accompanying combined financial statements
include only these three enterprise funds of the City; however, the Utilities are an integral part of the
City and are included in the City’s Comprehensive Annual Financial Report as enterprise funds.
The Utilities provide water, sewer and storm drain services to industrial, commercial, and residential
users in Salt Lake City, Utah. Two significant components of the Utilities’ processes, power and
chemicals, are received from single source suppliers. Significant droughts over the course of several
years or a contamination of a significant source of water could impede the Utilities ability to provide
services.
All federal awards and related reports required under the Single Audit Act of 1996 and Office of
Management and Budget Circular A-133 are issued by Salt Lake City Corporation (the “City”).
Basis of Accounting—Revenues and expenses of the Utilities are recognized using the accrual basis of
accounting.
Proprietary funds distinguish operating revenues and expenses from non-operating items. Operating
revenues and expenses generally result from providing services and producing and delivering goods in
connection with a proprietary fund’s principal ongoing operations. The principal operating revenues of
the Utilities are charges to customers for sales and services. Operating expenses for enterprise funds and
internal service funds include the cost of sales and services, administrative expenses, and depreciation
on capital assets. All revenues and expenses not meeting this definition are reported as non-operating
revenues and expenses.
When both restricted and unrestricted resources are available for use, it is the government’s policy to use
restricted resources first, then unrestricted resources as they are needed.
Cash and Cash Equivalents—The Utilities consider investments in highly liquid debt instruments
purchased with an original maturity of three months or less to be cash equivalents.
Accounts Receivable—Due to the Utilities cycle billing system, the accounts receivable balances at June
30, 2010 include an accrual for unbilled sales.

21
Supplies Inventories—Supplies inventories are stated at the lower of cost (determined on a first-in, first-
out or average-cost basis) or market.
Applicable Accounting Standards—The combined financial statements of the Utilities have been
prepared in conformity with generally accepted accounting principles (“GAAP”) as applied to
government units. The Governmental Accounting Standards Board (“GASB”) is the accepted standard-
setting body for establishing governmental accounting and financial reporting principles. With respect to
proprietary activities, the Utilities have adopted GASB Statement No. 20, “Accounting and Financial
Reporting for Proprietary Funds and Other Governmental Entities that use Proprietary Fund
Accounting.” New effective July 1 2007, GASB Statement 45, “Accounting and Financial Reporting by
Employers for Postemployment Benefits Other Than Pensions” (OPEB) was implemented. This requires
the Utility to account for these post employment benefits as services by employees when rendered rather
than when they are paid. See note 9. The Utilities have elected to apply all applicable GASB
pronouncements as well as Financial Accounting Standards Board pronouncements and Accounting
Principles Board Opinions, issued on or before November 30, 1989, unless those pronouncements
conflict with or contradict GASB pronouncements.
Investments—The Utilities account for investments in accordance with GASB Statement No. 31,
Accounting and Financial Reporting for certain Investments and for External Investment Pools. GASB
Statement No. 31 requires certain investments to be reported at fair value with the accompanying change
in fair market value to be included in revenues or expenses.
A portion of the Utilities’ investments at June 30, 2010 are deposited in the City’s pooled cash account.
The City’s pooled cash account is invested primarily in the Utah Public Treasurer’s Investment Pool (the
“Treasurer’s Pool”) which is not registered with the Securities and Exchange Commission. Regulatory
oversight of the Treasurer’s Pool is provided by the Money Management Council, which is subsequently
monitored by the State of Utah. The fair market value of the City’s position in the fund is the same as
the value of the fund shares owned by the City.
Investments in the Treasurer’s Pool are shown at fair value based on information obtained from the pool
sponsor.
Property and Equipment—Property and equipment are stated at cost. A substantial portion of the
property and equipment costs relating to the Stormwater Utility were estimated in 1991 based on
engineering records and current price levels adjusted to historical cost using a consumer price index.
Depreciation of property and equipment is computed using the straight-line method over the following
estimated useful lives:
Years
Buildings 35–60
Improvements other than buildings 13–100
Machinery and equipment 3–30
No depreciation is provided on construction in progress until construction is complete and the assets are
placed in service.
22
When an asset is sold or otherwise disposed of, the related cost and accumulated depreciation are
removed from the accounts and any gain or loss is included in net earnings. At June 30, 2010, the Water,
Sewer and Storm Utilities had approximately $11,527,653, $10,955,906, and $1,458,286, respectively,
of fully depreciated property and equipment that was still in service. The capitalization threshold for
capital assets is $5,000.
Risk Management—The Utilities is covered by insurance policies for property (all risk), excess workers
compensation, employee dishonesty, theft, forgery and alteration, and bond. The Utilities are covered
under the City’s Risk Management Fund, which is self-insured, for workers compensation, public
liability, and automobile liability.
Amortization—Amortization of bond issue costs, bond discount, and the deferred loss on refunding and
defeasance of revenue bonds is computed on the straight-line method (which approximates the amount
determined using the interest method) over the life of the related bonds.
Capitalization of Interest—The Utilities capitalize, as a cost of property and equipment, that portion of
its interest costs (net of any interest earned on related interest-bearing investments acquired with
proceeds of related tax-exempt borrowings) which represents interest incurred during the construction
period on qualifying assets.
Contributions—The Utilities have received contributions in aid of construction from various sources.
Consistent with GASB Statement No. 33, Accounting and Financial Reporting for Nonexchange
Transactions, these contributions are recorded as revenue and are reflected in the Statements of
Revenues, Expenses, and Changes in Fund Net Assets.
Total Columns—The total columns shown on the accompanying financial statements are mathematical
totals and do not eliminate interfund transactions or include other entries required to present
consolidated financial statements. Therefore, the accompanying financial statements are not intended to
present consolidated financial information.
Use of Estimates—The preparation of financial statements in conformity with accounting principles
generally accepted in the United States of America requires management to make estimates and
assumptions that affect the reporting amounts of assets and liabilities and disclosure of contingent assets
and liabilities at the date of the financial statements and the reported amounts of revenues and expenses
during the reporting period. Actual amounts could differ from those estimates.
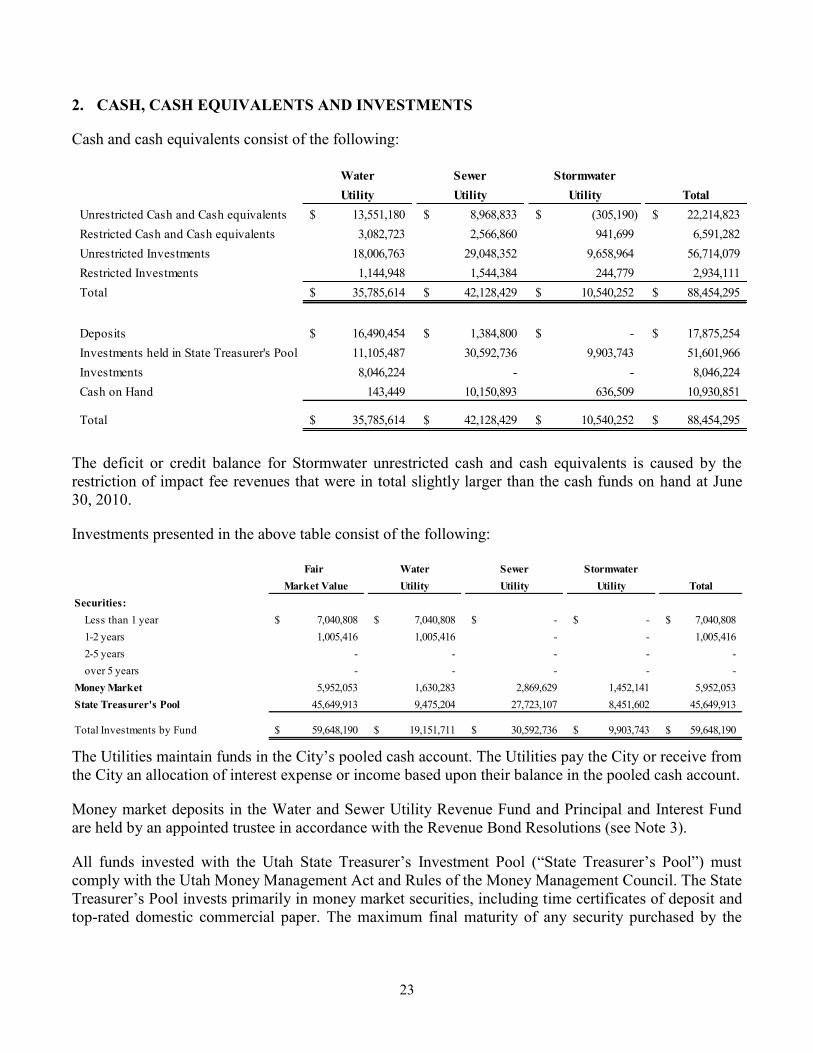
23
2. CASH, CASH EQUIVALENTS AND INVESTMENTS
Cash and cash equivalents consist of the following:
Water Sewer Stormwater
Utility Utility Utility Total
Unrestricted Cash and Cash equivalents 13,551,180$ 8,968,833$ (305,190)$ 22,214,823$
Restricted Cash and Cash equivalents 3,082,723 2,566,860 941,699 6,591,282
Unrestricted Investments 18,006,763 29,048,352 9,658,964 56,714,079
Restricted Investments 1,144,948 1,544,384 244,779 2,934,111
Total 35,785,614$ 42,128,429$ 10,540,252$ 88,454,295$
Deposits 16,490,454$ 1,384,800$ -$ 17,875,254$
Investments held in State Treasurer's Pool 11,105,487 30,592,736 9,903,743 51,601,966
Investments 8,046,224 - - 8,046,224
Cash on Hand 143,449 10,150,893 636,509 10,930,851
Total 35,785,614$ 42,128,429$ 10,540,252$ 88,454,295$
The deficit or credit balance for Stormwater unrestricted cash and cash equivalents is caused by the
restriction of impact fee revenues that were in total slightly larger than the cash funds on hand at June
30, 2010.
Investments presented in the above table consist of the following:
Fair Water Sewer Stormwater
Market Value Utility Utility Utility Total
Securities:
Less than 1 year 7,040,808$ 7,040,808$ -$ -$ 7,040,808$
1-2 years 1,005,416 1,005,416 - - 1,005,416
2-5 years - - - - -
over 5 years - - - - -
Money Market 5,952,053 1,630,283 2,869,629 1,452,141 5,952,053
State Treasurer's Pool 45,649,913 9,475,204 27,723,107 8,451,602 45,649,913
Total Investments by Fund 59,648,190$ 19,151,711$ 30,592,736$ 9,903,743$ 59,648,190$
The Utilities maintain funds in the City’s pooled cash account. The Utilities pay the City or receive from
the City an allocation of interest expense or income based upon their balance in the pooled cash account.
Money market deposits in the Water and Sewer Utility Revenue Fund and Principal and Interest Fund
are held by an appointed trustee in accordance with the Revenue Bond Resolutions (see Note 3).
All funds invested with the Utah State Treasurer’s Investment Pool (“State Treasurer’s Pool”) must
comply with the Utah Money Management Act and Rules of the Money Management Council. The State
Treasurer’s Pool invests primarily in money market securities, including time certificates of deposit and
top-rated domestic commercial paper. The maximum final maturity of any security purchased by the

24
State Treasurer’s Pool is limited to five years. The maximum weighted average life of the portfolio does
not exceed 180 days.
Cash on Deposit with Banks and Pooled Cash—State law requires that City funds, of which the
Utilities are a part, be deposited with a “qualified depository” as defined by the Utah Money
Management Act. “Qualified depository” includes any depository institution which has been certified by
the Utah State Commissioner of Financial Institutions as having met the requirements as defined in
Rule 11 of the Utah Money Management Act. Rule 11 establishes the formula for determining the
amount of public funds which a qualified institution can accept. City policy provides that not more than
25% of total City funds or 25% of the qualified depository’s allotment, whichever is less, can be
invested in any one qualified depository. Not more than 20% of total City funds may be invested in any
one certified out-of-state financial institution.
The bank balance of the Utilities’ cash on deposit with banks was $6,734,311 at June 30, 2010, of which
$250,000 was insured in the Utilities’ name. The remaining uninsured and uncollateralized balance of
$6,484,311 was deposited with certified institutions according to the Utah Money Management Act.
Custodial Credit Risk — Custodial credit risk for investments is the risk that, in the event of a failure of
the counter party, the Utility or City will not be able to recover the value of the investment or collateral
securities that are in the possession of an outside party. Of the total $59,648,190 invested by the City for
Public Utilities, $8,046,224 was exposed to custodial credit risk. The entire amount exposed was held in
the Water Fund's name by the counterparty. The City has no formal policy with respect to investment
custodial credit risk. All of this custodial amount is given an AAA rating by nationally recognized
security rating agencies and has a weighted investment life of 0.67 years. Of these investments 100% are
other US instruments such as FHLB (Federal Home Loan Bank), FNMA (Federal National Mortgage
Association) and FFCB (Federal Farm Credit Bank).
Cash Equivalents—The City’s investment policies are governed by State statutes. In addition, the City
has its own written investment policies. City funds, of which the Utilities’ funds are a part, are invested
only in the following: (1) negotiable or non-negotiable deposits of qualified depositories (see definition
of qualified depository in “Cash on Deposit with Banks and Pooled Cash” above); (2) repurchase
agreements with qualified depositories or certified dealers acting as principal for securities of the United
States Treasury or other authorized investments, only if these securities are delivered to the custody of
the City Treasurer or the City’s safekeeping bank, or the investment activities are conducted with a
qualified depository; (3) commercial paper which is rated P-1 by Moody’s Investor Services or A-1 by
Standard and Poors, Inc., having a remaining term to maturity of 270 days or less (commercial paper can
be purchased directly from the issuer provided proper delivery and safekeeping procedures are followed
with a qualified depository or the City Treasurer’s safekeeping bank or trust company); (4) banker’s
acceptances that are eligible for discount at a federal reserve bank and which have a remaining term to
maturity of 270 days or less; (5) negotiable certificates of deposit of $100,000 or less which have a
remaining term to maturity of 365 days or less; (6) obligations of the United States Treasury included
United States Treasury Bills, United States Treasury Notes, and United States Treasury Bonds; (7) top-
rated corporate notes having a remaining term of one year or less; (8) certain no-load money market
mutual funds; or (9) the Utah State Treasurer’s Investment Pool.

25
3. RESTRICTED AND RESERVED CASH AND CASH EQUIVALENTS
Certain cash and cash equivalents are restricted by provisions of the Improvement and Refunding Bond
Resolutions (“Bond Resolutions”) adopted by the City (see Note 5) as follows:
Amounts Restricted for Revenue Bond Debt Service—The Bond resolutions require that a debt service
account be maintained in the Principal and Interest Fund that is equal to the “average aggregate debt
service,” as defined, on outstanding revenue bonds and that a sinking fund be established for the
“accrued aggregate debt service,” as defined, on outstanding revenue bonds. The assets which have been
restricted for revenue bond debt service came from earnings rather than bond proceeds. As of June 30,
2010, the Utilities have restricted cash and cash equivalents of $2,164,844 for revenue bond debt
service.
Amounts Restricted and Reserved for Renewal and Replacement—The Bond Resolutions require that a
renewal and replacement reserve of $300,000 be established. In addition, this reserve is to be reviewed
every three years and adjusted as necessary. The Chief Engineer of the Utilities determined this reserve
should be $1,526,700 as of June 30, 2010. The Utilities have restricted cash and cash equivalents of
$1,526,700. As of June 30, 2010, $1,526,700 of net assets has also been reserved.
Amounts Restricted for Capital Improvements—Public Utilities bonds have been issued almost
exclusively for existing and future capital projects. The $788,580 of unspent bond proceeds is the
remaining cash available for specific capital improvements at June 30, 2010.
Amounts Restricted for Customer Deposits—The Utilities’ customers living in apartments, duplexes,
and fourplexes are required to provide the Utilities with deposits designed to protect the Utilities from
loss associated with non-payment. The remaining balance of a customer’s deposit is refunded when
service has been discontinued and the account is paid in full. As of June 30, 2010, the Utilities have
reserved cash and cash equivalents in the amount of $496,597 for these customer deposits.
Amounts Restricted for Impact Fees Collected—To comply with the Utah Impact Fee Act (Chapter 36
of the Utah Code), funds collected from land developers and private individuals are required to be
restricted until contractual requirements have been satisfied and the funds are spent on appropriate
projects. Such impact fees are recognized as capital contributions when received. As of June 30, 2010,
the Utilities have restricted cash and cash equivalents in the amount of $4,548,672 for these restricted
impact fees.
26
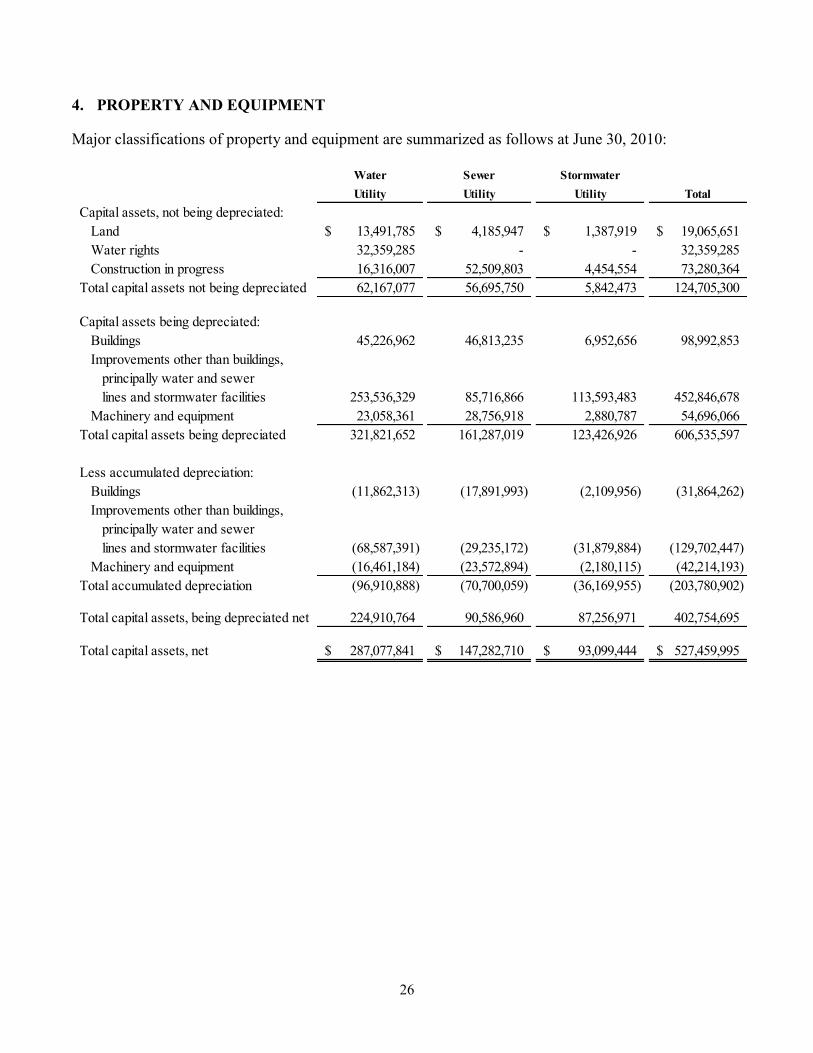
4. PROPERTY AND EQUIPMENT
Major classifications of property and equipment are summarized as follows at June 30, 2010:
Water Sewer Stormwater
Utility Utility Utility Total
Capital assets, not being depreciated:
Land 13,491,785$ 4,185,947$ 1,387,919$ 19,065,651$
Water rights 32,359,285 - - 32,359,285
Construction in progress 16,316,007 52,509,803 4,454,554 73,280,364
Total capital assets not being depreciated 62,167,077 56,695,750 5,842,473 124,705,300
Capital assets being depreciated:
Buildings 45,226,962 46,813,235 6,952,656 98,992,853
Improvements other than buildings,
principally water and sewer
lines and stormwater facilities 253,536,329 85,716,866 113,593,483 452,846,678
Machinery and equipment 23,058,361 28,756,918 2,880,787 54,696,066
Total capital assets being depreciated 321,821,652 161,287,019 123,426,926 606,535,597
Less accumulated depreciation:
Buildings (11,862,313) (17,891,993) (2,109,956) (31,864,262)
Improvements other than buildings,
principally water and sewer
lines and stormwater facilities (68,587,391) (29,235,172) (31,879,884) (129,702,447)
Machinery and equipment (16,461,184) (23,572,894) (2,180,115) (42,214,193)
Total accumulated depreciation (96,910,888) (70,700,059) (36,169,955) (203,780,902)
Total capital assets, being depreciated net 224,910,764 90,586,960 87,256,971 402,754,695
Total capital assets, net 287,077,841$ 147,282,710$ 93,099,444$ 527,459,995$
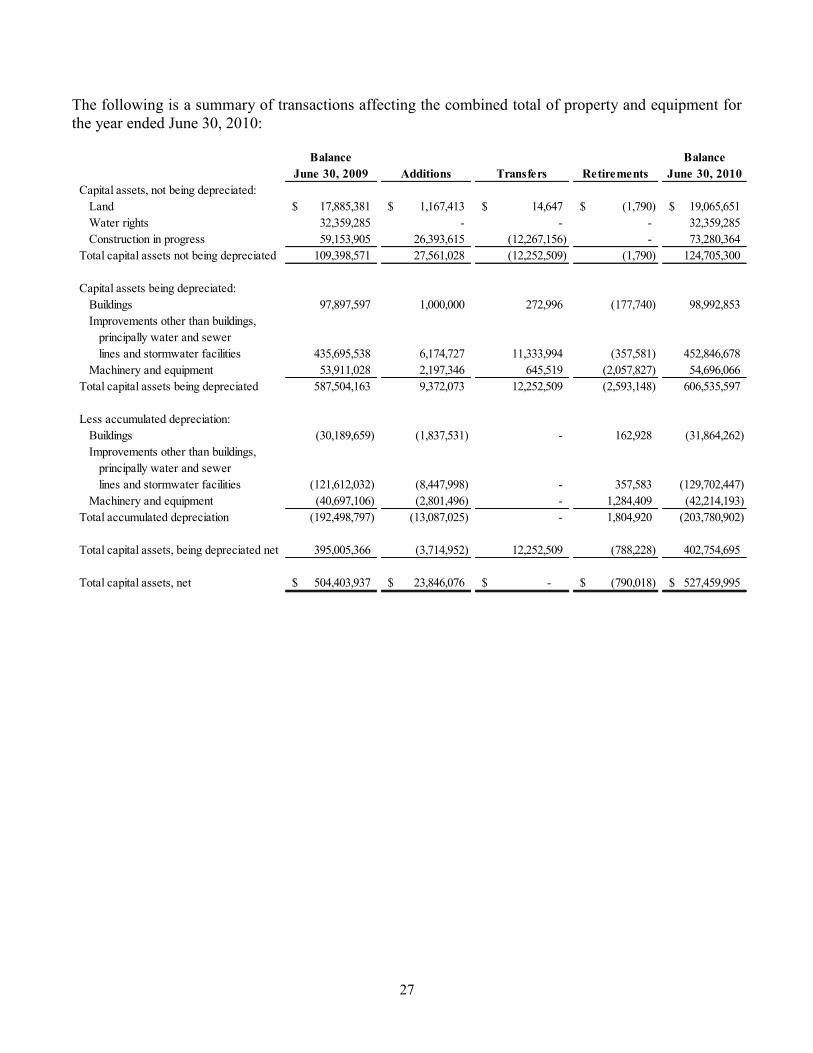
27
The following is a summary of transactions affecting the combined total of property and equipment for
the year ended June 30, 2010:
Balance Balance
June 30, 2009 Additions Transfers Retirements June 30, 2010
Capital assets, not being depreciated:
Land 17,885,381$ 1,167,413$ 14,647$ (1,790)$ 19,065,651$
Water rights 32,359,285 - - - 32,359,285
Construction in progress 59,153,905 26,393,615 (12,267,156) - 73,280,364
Total capital assets not being depreciated 109,398,571 27,561,028 (12,252,509) (1,790) 124,705,300
Capital assets being depreciated:
Buildings 97,897,597 1,000,000 272,996 (177,740) 98,992,853
Improvements other than buildings,
principally water and sewer
lines and stormwater facilities 435,695,538 6,174,727 11,333,994 (357,581) 452,846,678
Machinery and equipment 53,911,028 2,197,346 645,519 (2,057,827) 54,696,066
Total capital assets being depreciated 587,504,163 9,372,073 12,252,509 (2,593,148) 606,535,597
Less accumulated depreciation:
Buildings (30,189,659) (1,837,531) - 162,928 (31,864,262)
Improvements other than buildings,
principally water and sewer
lines and stormwater facilities (121,612,032) (8,447,998) - 357,583 (129,702,447)
Machinery and equipment (40,697,106) (2,801,496) - 1,284,409 (42,214,193)
Total accumulated depreciation (192,498,797) (13,087,025) - 1,804,920 (203,780,902)
Total capital assets, being depreciated net 395,005,366 (3,714,952) 12,252,509 (788,228) 402,754,695
Total capital assets, net 504,403,937$ 23,846,076$ -$ (790,018)$ 527,459,995$

28
5. LONG-TERM OBLIGATIONS
The following is a summary of outstanding long-term obligations as of June 30, 2010:
Water Sewer Stormwater
Utility Utility Utility Total
Revenue bonds:
2004 Series Improvement and
Refunding Revenue Bonds, 3.0%
to 5%, due 2005-2024 -$ 18,654,200$ 5,890,800$ 24,545,000$
Plus unamortized premium - 1,259,612 397,772 1,657,384
Total 2004 Series Revenue Bonds - 19,913,812 6,288,572 26,202,384
2005 Series Improvement and
Refunding Revenue Bonds, 3.5%
to 5.0%, due 2006-2017 8,120,000 - - 8,120,000
Plus unamortized premium 426,742 - - 426,742
Less unamortized loss on refunding -
and defeasance (208,216) - - (208,216)
Total 2005 Series Revenue Bonds 8,338,526 - - 8,338,526
2008 Series Improvement and
Refunding Revenue Bonds, 3.5%
to 4.5%, due 2009-2024 13,365,000 - - 13,365,000
Plus unamortized premium 461,392 - - 461,392
Less unamortized loss on refunding
and defeasance (404,840) - - (404,840)
Total 2008 Series Revenue Bonds 13,421,552 - - 13,421,552
2009 Series Revenue Bonds,
0%, due 2012 - 2031 - 6,300,000 - 6,300,000
Total 2009 Series Revenue Bonds - 6,300,000 - 6,300,000
Total revenue bonds 21,760,078 26,213,812 6,288,572 54,262,462
Long-term compensation liability 4,229,910 930,960 202,785 5,363,655
Total long-term obligations 25,989,988$ 27,144,772$ 6,491,357$ 59,626,117$

29
Water Sewer Stormwater
Utility Utility Utility Total
Financial statement classification:
Current maturities of long-term
obligations 1,055,834$ 556,383$ 175,699$ 1,787,916$
Current maturities of long-term
obligations payable from
restricted assets 754,166 397,417 125,501 1,277,084
Long-term obligations, less
current maturities 19,950,078 25,260,012 5,987,372 51,197,462
Total long-term obligations 21,760,078 26,213,812 6,288,572 54,262,462
Current portion of long-term
compensation 355,161 59,703 18,080 432,944
Long-term compensation liability,
less current portion 3,874,749 871,257 184,705 4,930,711
Total long-term compensation 4,229,910 930,960 202,785 5,363,655
Total 25,989,988$ 27,144,772$ 6,491,357$ 59,626,117$
The following is a summary of long-term obligation activity during 2010:
Beginning Ending
Balance Additions Deductions Balance
2004 Series Revenue Bonds 25,740,000$ -$ (1,195,000)$ 24,545,000$
2005 Series Revenue Bonds 9,135,000 - (1,015,000) 8,120,000
2008 Series Revenue Bonds 14,085,000 - (720,000) 13,365,000
2009 Series Revenue Bonds - 6,300,000 - 6,300,000
Premium on Revenue Bonds 2,765,513 - (219,995) 2,545,518
Deferred loss from defeasance of
Revenue Bonds (674,092) - 61,036 (613,056)
Compensation liability 4,663,092 714,866 (14,303) 5,363,655
Total 55,714,513$ 7,014,866$ (3,103,262)$ 59,626,117$
Revenue Bonds—On June 23, 1993, the Water and Sewer Utilities issued $13,500,000 in Revenue
Bonds, Series 1993 ($11,110,130 Water and $2,389,870 Sewer). The principle purpose of the Series
1993 Bonds was to defease a portion of the Series 1986 Bonds in the amount of $9,635,000, maturing on
or after February 1, 2001 through February 1, 2005, with an average interest rate of 7.5%. The bonds
were also used to generate $2,470,000 in additional construction funds to construct a new water line and
to replace operating equipment at the City’s Big Cottonwood Water Treatment Plant and to pay certain
30
costs of issuance of the Series 1993 Bonds. Net proceeds (after payment of bond issue costs of $270,100
and net of discount of $7,615) amounted to $13,222,285.
On July 19, 1994, the Water Utility issued $14,000,000 in Revenue Bonds. The principle purpose of the
Series 1994 Bonds was to finance construction of Water Utility capital improvement projects with an
estimated date of completion of June 30, 1998. Net proceeds (after payment of bond issue costs of
$235,634 and net of discount of $134,399) amounted to $13,629,967.
On November 1, 1997, the Water Utility issued $24,515,000 in Revenue Bonds. The principle purpose
of the Series 1997 Bonds was to defease a portion of the 1991 and 1994 Series Bonds and to finance the
acquisition of certain improvements to the water system. Net proceeds (after payment of bond issue
costs of $267,188 and net of discount of $135,465) amounted to $24,112,347. $3,060,000 and
$8,620,000 of the 1991 and 1994 Series Bonds, respectively, was defeased through the establishment of
an irrevocable trust escrow consisting of cash and noncallable direct obligations of the United States
Government. This defeasance reduced its total debt service payments by almost $1,358,309 and obtained
an economic gain (difference between the present value of the debt service payments on the old and new
debt) of $525,098.
On February 1, 2004, the Sewer and Stormwater Utilities issued $30,955,000 in Revenue Bonds. The
principle purpose of the Series 2004 bonds was to finance a major upgrade at the Sewer Treatment Plant
and a new storm system trunk line. Net proceeds (after payment of bond issue costs of $381,233) were
$33,344,480 including a premium of $2,389,480 on the sale.
On May 1, 2005, the Water Utility issued $11,075,000 in Revenue Bonds. The 2005 series bond was
issued to fully defease the outstanding debt for both the Water and Sewer 1993 bond issues and part of
the 1997 Water bond issue. Of the 1993 bond issue $1,042,228 was defeased for Water and $252,772 for
Sewer Revenue Bonds. The 1997 Water Revenue Bond was defeased $7,805,000 with a remaining
balance of $14,100,000 remaining at June 30, 2005. The 2005 issue included both a deferred loss of
$364,377 on the refunding and a premium on the sale of $746,799. The average net interest rate for the
2005 issue is 3.58%
On February 27, 2008, the Water Utility issued $14,800,000 in Revenue Bonds. The 2008 series bond
was issued to fully defease the outstanding debt of the 1997 Water Bond issue. The 1997 Water Revenue
Bond was defeased in the amount of $9,925,000. The 2008 issue included both a deferred loss of
$476,867 on the refunding and a premium on the sale of $543,480. The average net interest rate for the
2008 issue is 3.79%.
On November 17, 2009, the Sewer Utility issued $6,300,000 in Revenue Bonds. The 2009 series bond
was issued as part of economic stimulus funding through the State of Utah. The Sewer Utility will use
the funds to replace the digester cover and walls at the reclamation plant facility. These bonds mature
2012 through 2031 with annual principal payments of $315,000 beginning February 2012 and the
average interest of 0%. The Sewer Utility incurred issuance costs of $69,740 related to the 2009 series
bonds. The issuance cost will be amortized commensurate with the debt service payments beginning
February 2012. As of June 30, 2010, the Utilities had only drawn $1,760,000 and recorded a receivable
of $4,540,000 from State’s Treasurer where the funds are being held. The Utilities draws the proceeds of
the bonds as the project works progress.
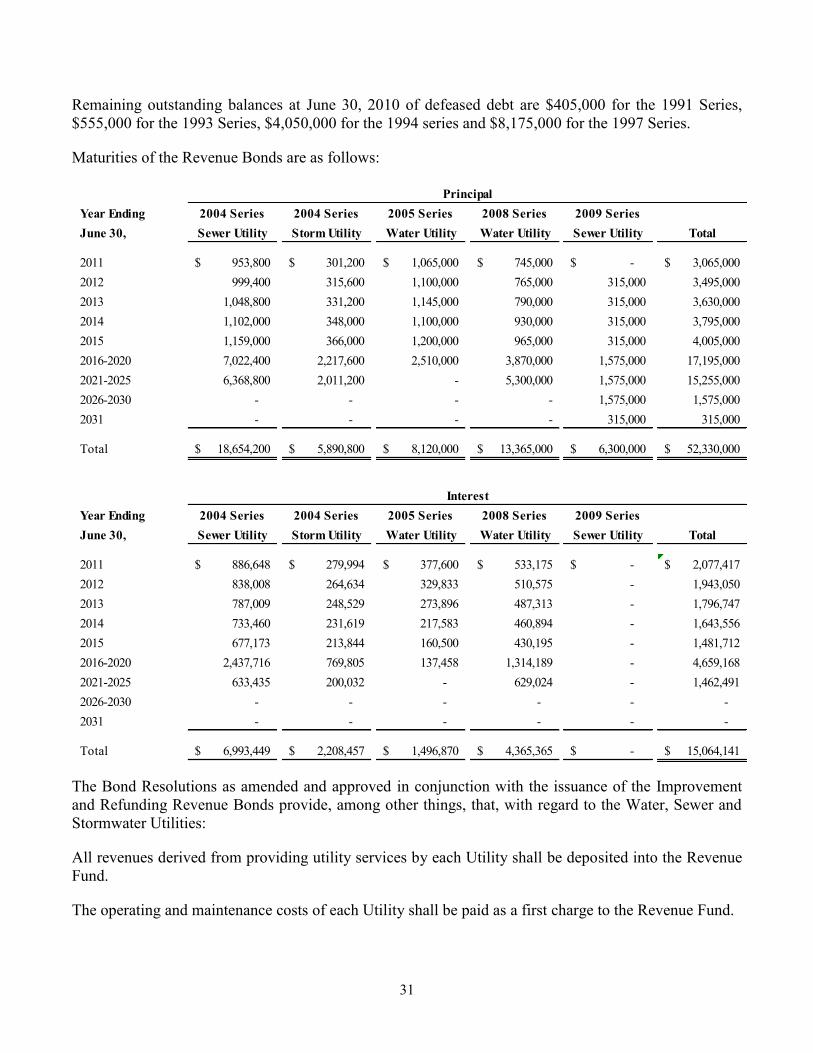
31
Remaining outstanding balances at June 30, 2010 of defeased debt are $405,000 for the 1991 Series,
$555,000 for the 1993 Series, $4,050,000 for the 1994 series and $8,175,000 for the 1997 Series.
Maturities of the Revenue Bonds are as follows:
Year Ending 2004 Series 2004 Series 2005 Series 2008 Series 2009 Series
June 30, Sewer Utility Storm Utility Water Utility Water Utility Sewer Utility Total
2011 953,800$ 301,200$ 1,065,000$ 745,000$ -$ 3,065,000$
2012 999,400 315,600 1,100,000 765,000 315,000 3,495,000
2013 1,048,800 331,200 1,145,000 790,000 315,000 3,630,000
2014 1,102,000 348,000 1,100,000 930,000 315,000 3,795,000
2015 1,159,000 366,000 1,200,000 965,000 315,000 4,005,000
2016-2020 7,022,400 2,217,600 2,510,000 3,870,000 1,575,000 17,195,000
2021-2025 6,368,800 2,011,200 - 5,300,000 1,575,000 15,255,000
2026-2030 - - - - 1,575,000 1,575,000
2031 - - - - 315,000 315,000
Total 18,654,200$ 5,890,800$ 8,120,000$ 13,365,000$ 6,300,000$ 52,330,000$
Year Ending 2004 Series 2004 Series 2005 Series 2008 Series 2009 Series
June 30, Sewer Utility Storm Utility Water Utility Water Utility Sewer Utility Total
2011 886,648$ 279,994$ 377,600$ 533,175$ -$ 2,077,417$
2012 838,008 264,634 329,833 510,575 - 1,943,050
2013 787,009 248,529 273,896 487,313 - 1,796,747
2014 733,460 231,619 217,583 460,894 - 1,643,556
2015 677,173 213,844 160,500 430,195 - 1,481,712
2016-2020 2,437,716 769,805 137,458 1,314,189 - 4,659,168
2021-2025 633,435 200,032 - 629,024 - 1,462,491
2026-2030 - - - - - -
2031 - - - - - -
Total 6,993,449$ 2,208,457$ 1,496,870$ 4,365,365$ -$ 15,064,141$
Principal
Interest
The Bond Resolutions as amended and approved in conjunction with the issuance of the Improvement
and Refunding Revenue Bonds provide, among other things, that, with regard to the Water, Sewer and
Stormwater Utilities:
All revenues derived from providing utility services by each Utility shall be deposited into the Revenue
Fund.
The operating and maintenance costs of each Utility shall be paid as a first charge to the Revenue Fund.

32
Monthly transfers are made from the Revenue Fund to the Principal and Interest Fund. The required
monthly transfers to the Principal and Interest Fund equal one-twelfth of the next year’s debt service. As
discussed in Note 3, the Bond Resolutions require that a Renewal and Replacement fund of $30,000 per
year be established until a total of $300,000 has been reserved. Additional transfers to or from the
Renewal and Replacement fund are made at the time the Utilities’ Chief Engineer determines that the
total reserve should be adjusted. The Chief Engineer determined that the total reserve should be
$1,526,700 as of June 30, 2010 (see Note 3).
Any remaining amounts in the Revenue Fund may be applied to any lawful Utility purpose.
The Bond Resolutions constitute a contractual agreement between the City and the bondholders, under
which the City has irrevocably pledged the net revenues of the Water, Sewer and Stormwater Utilities
for the payment of the bonds. The bonds are obligations of the Water, Sewer and Stormwater Utilities,
and all Utilities have pledged their individual future net revenues against the entire balance of the
revenue bonds outstanding. Net revenues are defined as the revenues derived by the City from or
attributable to the Water, Sewer and Stormwater Utilities, less all operating and maintenance costs.
Under the terms of the Bond Resolutions, the City covenanted that rates will be established to yield
aggregate net revenues equal to at least 1.25 times the aggregate debt service to become due in the next
fiscal year. If the aggregate revenues fall below 1.25 times the aggregate debt service, the Water, Sewer,
and Stormwater Utilities must make quarterly payments to a debt service reserve account.
6. INTERFUND RECEIVABLE AND PAYABLE
In prior years, the Water, Sewer and Stormwater Utility Funds had book receivables or payables in their
cash accounts that represented cash amounts due to and from the General Fund. The cash account is
used by the Water, Sewer, and Stormwater Utility Funds and is considered to be a pooled cash account.
As a result, the book receivable or payable is considered to be a loan to or from the Utility Funds to the
General Fund pool account. These pooled cash amounts are included in cash and cash equivalents on the
Balance Sheet. As of June 30, 2010 there are no interfund loans between Public Utilities and the City
General Fund.
7. INTERFUND AND RELATED PARTY TRANSACTIONS
Operating expenses include the following amounts charged by other funds of the City as of June 30,
2010:
Water Sewer Stormwater
Utility Utility Utility Total
Administrative services 692,632$ 160,832$ 64,716$ 918,180$
Fleet maintenance 932,210 272,544 220,773 1,425,527
Data processing 280,145 203,942 173,728 657,815
Risk management 560,357 104,202 40,930 705,489
Telephone charges 9,533 18,414 7,000 34,947
Payment in lieu of taxes 320,066 267,989 90,122 678,177
Trails Coordinator 37,500 - - 37,500
Street Sweeping - - 411,371 411,371
Total 2,832,443$ 1,027,923$ 1,008,640$ 4,869,006$
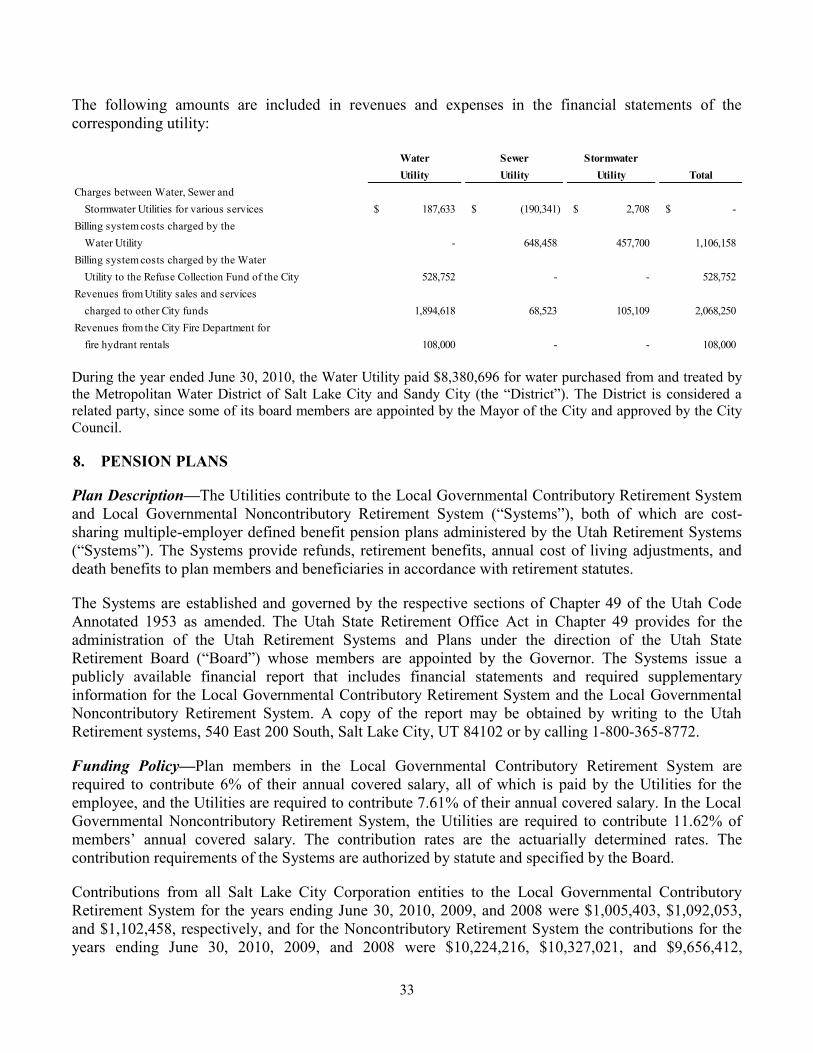
33
The following amounts are included in revenues and expenses in the financial statements of the
corresponding utility:
Water Sewer Stormwater
Utility Utility Utility Total
Charges between Water, Sewer and
Stormwater Utilities for various services 187,633$ (190,341)$ 2,708$ -$
Billing system costs charged by the
Water Utility - 648,458 457,700 1,106,158
Billing system costs charged by the Water
Utility to the Refuse Collection Fund of the City 528,752 - - 528,752
Revenues from Utility sales and services
charged to other City funds 1,894,618 68,523 105,109 2,068,250
Revenues from the City Fire Department for
fire hydrant rentals 108,000 - - 108,000
During the year ended June 30, 2010, the Water Utility paid $8,380,696 for water purchased from and treated by
the Metropolitan Water District of Salt Lake City and Sandy City (the “District”). The District is considered a
related party, since some of its board members are appointed by the Mayor of the City and approved by the City
Council.
8. PENSION PLANS
Plan Description—The Utilities contribute to the Local Governmental Contributory Retirement System
and Local Governmental Noncontributory Retirement System (“Systems”), both of which are cost-
sharing multiple-employer defined benefit pension plans administered by the Utah Retirement Systems
(“Systems”). The Systems provide refunds, retirement benefits, annual cost of living adjustments, and
death benefits to plan members and beneficiaries in accordance with retirement statutes.
The Systems are established and governed by the respective sections of Chapter 49 of the Utah Code
Annotated 1953 as amended. The Utah State Retirement Office Act in Chapter 49 provides for the
administration of the Utah Retirement Systems and Plans under the direction of the Utah State
Retirement Board (“Board”) whose members are appointed by the Governor. The Systems issue a
publicly available financial report that includes financial statements and required supplementary
information for the Local Governmental Contributory Retirement System and the Local Governmental
Noncontributory Retirement System. A copy of the report may be obtained by writing to the Utah
Retirement systems, 540 East 200 South, Salt Lake City, UT 84102 or by calling 1-800-365-8772.
Funding Policy—Plan members in the Local Governmental Contributory Retirement System are
required to contribute 6% of their annual covered salary, all of which is paid by the Utilities for the
employee, and the Utilities are required to contribute 7.61% of their annual covered salary. In the Local
Governmental Noncontributory Retirement System, the Utilities are required to contribute 11.62% of
members’ annual covered salary. The contribution rates are the actuarially determined rates. The
contribution requirements of the Systems are authorized by statute and specified by the Board.
Contributions from all Salt Lake City Corporation entities to the Local Governmental Contributory
Retirement System for the years ending June 30, 2010, 2009, and 2008 were $1,005,403, $1,092,053,
and $1,102,458, respectively, and for the Noncontributory Retirement System the contributions for the
years ending June 30, 2010, 2009, and 2008 were $10,224,216, $10,327,021, and $9,656,412,
34
respectively. The contributions were equal to the required contributions for each year. Assets of the
plans are not segregated by entity within the plan. Therefore, it is not possible to determine the portion
of contributions applicable to each entity.
The Utilities incurred expense of $213,554 for the Contributory and $1,978,918 for the Noncontributory
systems during the year ended June 30, 2010.
Additional information regarding current year covered payroll, plan provisions, employer and employee
obligations, contributions made, actuarially-determined contribution requirement, explanation of
pension benefit obligation, total pension benefit obligation, total net assets available for benefits, and
reference to historical trend information can be found in the comprehensive annual financial report of
the City.
401(k) Deferred Compensation Plan—The Utilities also participate in the City’s deferred compensation
plan established under Internal Revenue Code Section 401(k) (the “401(k) Plan”). Employees covered
by any of the Utah State Retirement plans are eligible to participate. The Utah State Retirement Board
administers this plan. The Utilities contribute 2.65% of base payroll or 1.4% of base payroll for
employees hired before 1987 who changed from the contributory plan to the noncontributory plan. The
401(k) Plan assets are not available to the Utilities or its general creditors. Therefore, no assets or
liabilities of the 401(k) Plan are reflected in the Utilities’ balance sheet. The Utilities incurred 401(k)
expenses of $68,720 for the year ended June 30, 2010.
9. POST-EMPLOYMENT BENEFITS
The Utilities participate in the City’s post-employment benefit plan for employees. In addition to
providing benefits as discussed in Note 8, the City provides health care and life insurance benefits for
retired City employees. Substantially all of the City’s employees may become eligible for those benefits
at retirement from the City. Although not statutorily required nor contractually obligated, the City has
for many years provided health and life insurance coverage for retired employees. These benefits are
expensed when incurred and are financed on a pay-as-you-go basis. As of June 30, 2010, 99 Utilities’
participants were eligible for these benefits.
Annual OPEB Cost and Net OPEB Obligation — The Utility annual other Post employment benefit
(OBEP) expense is calculated based on the employer’s annual required contribution ARC, an amount
actuarially determined in accordance with the parameters of GASB Statement 45. The ARC represents a
level of funding that, if paid on an ongoing basis, is projected to cover normal expenses each year and
amortize and unfunded actuarial liabilities over a period not to exceed thirty years. For the fiscal year
ended June 30, 2010, the Utility’s annual OPEB expense of $955,000 was greater than the ARC due to
an actuarial adjustment. The following table shows the components of the Utility’s annual OPEB
expense for the year, the amount actually contributed to the plan, and changes in the Utility’s net OPEB
obligation for the year ended June 30, 2010:

35
6/30/2009
Water Sewer Stormwater Total Total
Annual required contribution 698,000$ 194,000$ 57,000$ 949,000$ 1,025,000$
Interest on net OPEB obligation 50,000 14,000 4,000 68,000 4,000
Adjustments to annual
required contribution (45,000) (13,000) (4,000) (62,000) (131,000)
Annual OPEB Expense 703,000 195,000 57,000 955,000 898,000
Contributions made (240,000) (66,000) (19,000) (325,000) (298,000)
Increase in net OPEB obligation 463,000 129,000 38,000 630,000 600,000
Net OPEB obligation, beginning
of year 1,137,000 279,000 78,000 1,494,000 894,000
Net OPEB obligation, end of year 1,600,000$ 408,000$ 116,000$ 2,124,000$ 1,494,000$
OPEB June 30, 2010
The Utility’s annual OPEB cost, the percentage of annual OPEB cost contributed to the plan, and the net
OPEB obligation for the year ended June 30, 2010 is as follows:
Percentage of Net OPEB
Annual OPEB Obligation
Fiscal Annual Employer Expense Fiscal
Year Ended OPEB Cost Contributions Contributed Year Ended
June 30, 2010 955,000$ 325,000$ 34.0% 2,124,000$
Funded Status and Funding Progress — The funded status of the Utility’s portion of the plan as of
June 30, 2010 was as follows:
Water Sewer Stormwater
Utility Utility Utility
Actuarial Valuation Date 6/30/2010 6/30/2010 6/30/2010 6/30/2010 6/30/2009
Actuarial accrued liability (AAL) 8,399,000$ 1,832,000$ 521,000$ 10,752,000$ 11,744,000$
Actuarial value of plan assets - - - - -
Unfunded actuarial accrued
liability (UAAL) 8,399,000$ 1,832,000$ 521,000$ 10,752,000$ 11,744,000$
Funded ratio (Actuarial
value of plan assets/AAL) 0.00% 0.00% 0.00% 0.00% 0.00%
Covered payroll (active plan members) 11,467,669$ 4,361,469$ 1,214,385$ 17,043,523$ 16,629,271$
UAAL as a percentage of
covered payroll 73.24% 42.00% 42.90% 63.09% 70.62%
Total
Actuarial valuations of an ongoing plan involve estimates of the value of reported amounts and
assumptions about the probability of occurrence of events far into the future. Examples include
assumptions about future employment, mortality, and the healthcare cost trend. Amounts determined
regarding the funded status of the plan and the annual required contributions of the employer are subject
to continual revision as actual results are compared with past expectations and new estimates are made
about the future.

36
Actuarial Methods and Assumptions — Projections of benefits for financial reporting purposes are
based on the substantive plan (the plan as understood by the employer and the plan members) and
include the types of benefits provided at the time of each valuation and the historical pattern of sharing
of benefit expense between the employer and plan members to that point. The actuarial methods and
assumptions used include techniques that are designed to reduce short-term volatility in actuarial
accrued liabilities and the actuarial value of assets, consistent with the long-term perspective of the
calculations. In the fiscal year 2010 actuarial valuation, the unit credit method was used. The actuarial
assumptions included a 5.0% investment rate of return (net of administrative expenses) and an annual
healthcare cost trend rate of 10% initially, reduced by decrements to an ultimate rate of 5.0% after ten
years and added an additional 2% in 2011, 1% in 2012, and 0.5% in 2013, to account for expected health
care cost increases driven by the federal health reform bill. Covered payroll included a 3.5% inflation
assumption. The actuarial value of assets was not determined as the City has not advance funded its
obligation. The unfunded actuarial accrued liability (UAAL) is being amortized as a level percentage of
payroll over an open thirty year period.
10. COMMITMENTS AND CONTINGENCIES
As of June 30, 2010, the Utilities had outstanding commitments for the construction and acquisition of
property and equipment. Commitments of the Water Utility totaled $5,014,603, the Sewer Utility totaled
$15,688,386, and the Stormwater Utility totaled $6,523,857.
Water Right Purchase—The City purchased water rights connected to Big Cottonwood Canyon stream
flows from one of its water exchange customers called Big Cottonwood Tanner Ditch Irrigation
Company in the amount of $22,764,010. Under this new agreement the City will continue to provide
culinary water to the customers of the Big Cottonwood Tanner Ditch Irrigation Company and will
provide them with water vouchers which will entitle them to a set amount of water at no charge in return
for their ownership in the water rights to the canyon stream. The City also agreed to upgrade the water
system to meet current water system standards and to take ownership of the system. The financial
statements show the increase in water rights and the value of the system purchased. In addition a new
liability account called revenue collected in advance was required to show the value of the water
vouchers issued in the amount of $20,250,866 long term and $1,260,923 in current liabilities.
Metropolitan Water District—To meet the water supply needs of Salt Lake City and Sandy through the
year 2035, the Metropolitan Water District Board completed a new treatment plant. The new treatment
plant is located at the Point of the Mountain in Draper City and includes a conveyance pipeline
connecting the new plant to the District’s Little Cottonwood Water Treatment Plant. The cost of the
treatment plant and conveyance system totaled over $300 million, and the Utilities’ share of the cost is
over $200 million. The 70 million gallon per day plant is funded by an assessment paid by the two cities.
Salt Lake City has 62.5 percent of the capacity and cost assessment in the new treatment plant.

37
Following are the future minimum payments due from the Water Utility through 2035:
Year Ending June 30,
2011 7,021,892$
2012 7,021,892
2013 7,021,892
2014 7,021,892
2015-2019 35,109,460
2020-2024 35,109,460
2025-2029 35,109,460
2030-2034 35,109,460
2035 3,510,946
Total 172,036,354$
Litigation - The Utilities are involved in legal proceedings, primarily related to property damages and
personal injury, arising in the ordinary course of business. Based on the facts currently available,
management accrued $428,851, which is the estimated amount of litigation probable to have a negative
outcome. All of this potential liability is Water Fund related although there are some matters still
pending in the Sewer Fund related to construction disputes. Management believes that the disposition of
other matters that are pending or asserted will not have a materially adverse effect on the financial
position of the Utilities.
In 2003 the Department began an environmental remediation process on the Sewer’s Northwest Oil
Drain (NWOD) Canal under a US Environmental Protection Agency administrative order and with a
cost-sharing agreement between the Department, British Petroleum, and Chevron. Total cost of the
project was $7,079,180 in 2009 with the cost shared between the three parties. Dredging removal of
contaminated sediment was conducted 2004-2006, but confirmation sampling and subsequent
assessment indicated additional contaminated sediment remains in the canal; therefore this site, does not
meet the US EPA administrative order requirements for regulatory site closure.
A Request for Proposal process was prepared and a consultant hired to conduct a detailed remediation technology
evaluation to address the remaining contaminated sediment in the NWOD Canal. The cost of the study thus far
has been $111,039. The Technology Evaluation was completed November 2010 and is being used to guide design
studies for sediment removal alternatives along the canal. Design studies for sediment removal for the first
segment of the NWOD Canal will be completed by January 2011; it is anticipated that sediment removal actions
in the first canal segment will commence during the summer of 2011. Project costs for the design studies and
sediment removal for the first canal segment are pending. It is anticipated that project costs for design studies for
the remaining two canal segments will begin in spring/summer 2011 with sediment removal occurring during
summer of 2012.

38
11. SUBSEQUENT EVENTS
Subsequent to year end, the Sewer Utility issued $12 million in Revenue Bonds at an interest rate of
2.73%. The Series 2010 Bonds were issued by direct purchase through JPMorgan Chase Bank on
September 14, 2010 authorized by City Council resolution for the purchase, acquisition and construction
of improvements, facilities and properties including the sewer Orange Street trunk line or other various
improvements. This issue matures February 1, 2031. Annual payments for debt financing are expected
to average $747,000.
39
SUPPLEMENTAL INFORMATION
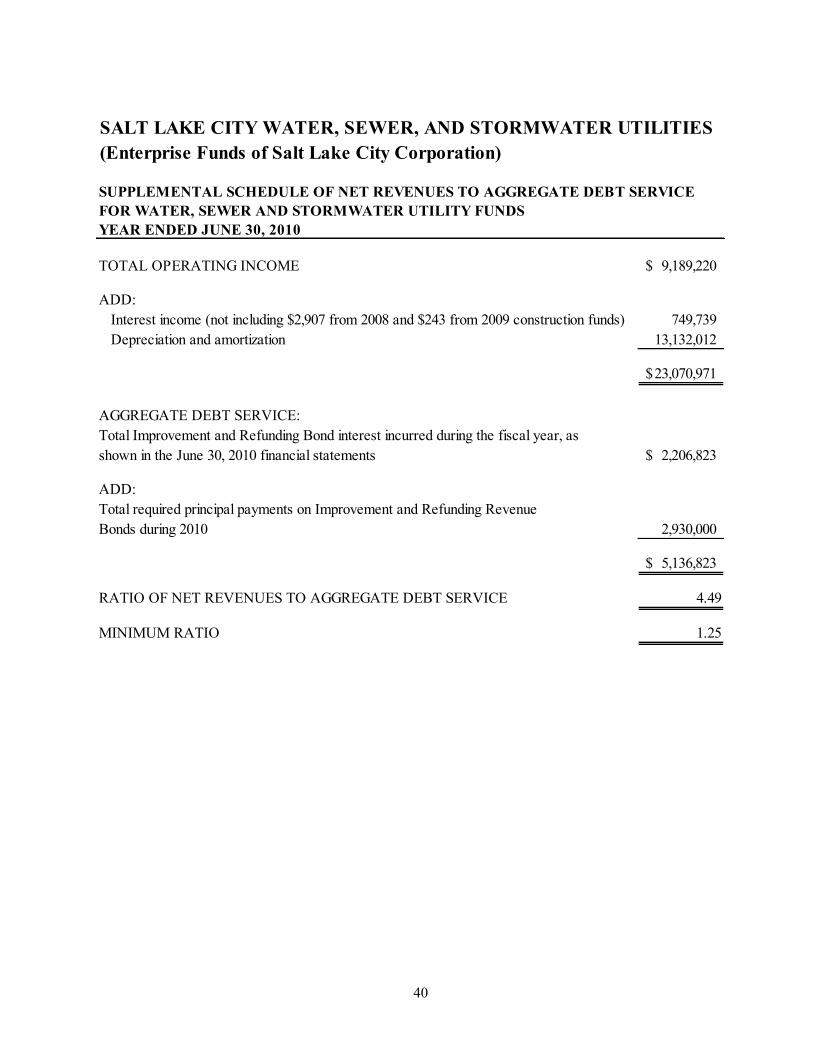
40
SALT LAKE CITY WATER, SEWER, AND STORMWATER UTILITIES
(Enterprise Funds of Salt Lake City Corporation)
SUPPLEMENTAL SCHEDULE OF NET REVENUES TO AGGREGATE DEBT SERVICE
FOR WATER, SEWER AND STORMWATER UTILITY FUNDS
YEAR ENDED JUNE 30, 2010
TOTAL OPERATING INCOME 9,189,220$
ADD:
Interest income (not including $2,907 from 2008 and $243 from 2009 construction funds) 749,739
Depreciation and amortization 13,132,012
23,070,971$
AGGREGATE DEBT SERVICE:
Total Improvement and Refunding Bond interest incurred during the fiscal year, as
shown in the June 30, 2010 financial statements 2,206,823$
ADD:
Total required principal payments on Improvement and Refunding Revenue
Bonds during 2010 2,930,000
5,136,823$
RATIO OF NET REVENUES TO AGGREGATE DEBT SERVICE 4.49
MINIMUM RATIO 1.25
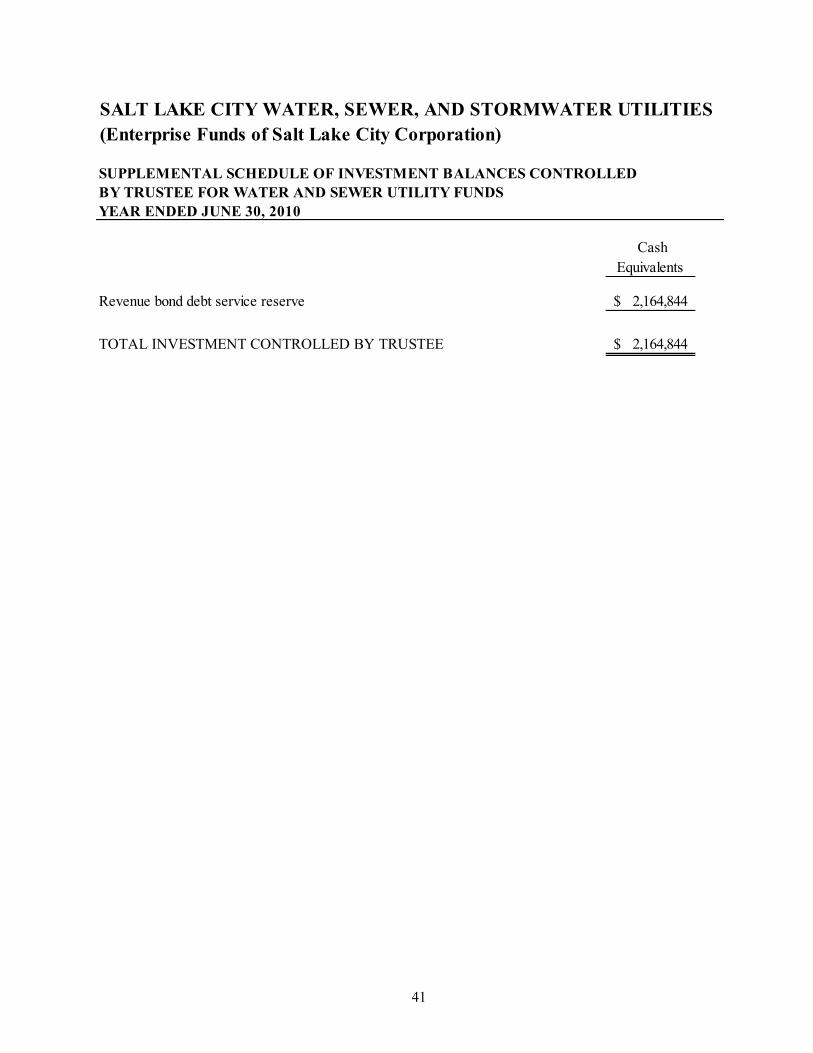
41
SALT LAKE CITY WATER, SEWER, AND STORMWATER UTILITIES
(Enterprise Funds of Salt Lake City Corporation)
SUPPLEMENTAL SCHEDULE OF INVESTMENT BALANCES CONTROLLED
BY TRUSTEE FOR WATER AND SEWER UTILITY FUNDS
YEAR ENDED JUNE 30, 2010
Cash
Equivalents
Revenue bond debt service reserve 2,164,844$
TOTAL INVESTMENT CONTROLLED BY TRUSTEE 2,164,844$

42
SALT LAKE CITY WATER, SEWER, AND STORMWATER UTILITIES
(Enterprise Funds of Salt Lake City Corporation)
SUPPLEMENTAL SCHEDULE OF CONSUMER INFORMATION
YEAR ENDED JUNE 30, 2010
WATER UTILITY
Number of metered water consumers as of June 30, 2010 90,958
Number of unmetered water consumers as of June 30, 2010 103
Billed charges by the Water Utility:
Residential 27,230,309$
Industrial 1,645,258
Commercial 10,131,119
Miscellaneous 4,848,600
Special agreements 5,319,326
49,174,612$ *
Average monthly billing 45.05$
SEWER UTILITY
Number of sewer accounts as of June 30, 2010 49,481
Billed charges by the Sewer Utility:
Residential 9,275,974$
Commercial and industrial 4,011,610
Special agreements 3,463,692
16,751,276$ *
Average monthly billing 28.21$
STORMWATER UTILITY
Number of storm water accounts as of June 30, 2010 47,794
Billed charges by the Stormwater Utility 6,050,750$ *
Average monthly billing 10.55$
* Total charges are based on internally generated reports by the Department and not audited
financial information

43
SALT LAKE CITY WATER, SEWER, AND STORMWATER UTILITIES
(Enterprise Funds of Salt Lake City Corporation)
SUPPLEMENTAL SCHEDULE OF INSURANCE POLICIES
FOR WATER, SEWER AND STORMWATER UTILITY FUNDS
YEAR ENDED JUNE 30, 2010
Type Policy Limits Description
Property (all risk) FM Global Inc $500,000,000 $100,000 deductible with sub limits for specific coverage
Workers' Compensation Self Insured*
Workers' Compensation Excess Safety National $40,000,000 $1,500,000 retention
Public Liability Self Insured*
Automobile Liability Self Insured*
Employee Dishonesty Hartford $1,000,000 $50,000 deductible
Theft Hartford $1,000,000 $50,000 deductible
Forgery and Alteration Hartford $25,000 $500 deductible
Bond Travelers Insurance Co. $10,000,000 Treasurers Bond
*Through the City's Risk Management Fund

44
INDEPENDENT AUDITORS’ REPORT
ON UTILITY REVENUE BOND COMPLIANCE Salt Lake City Public Utilities Advisory Committee
Salt Lake City Water, Sewer and Stormwater Utilities
We have audited, in accordance with auditing standards generally accepted in the United States of
America, the combined balance sheet of the Water Utility Fund, the Sewer Utility Fund, and the
Stormwater Utility Fund (the “Salt Lake City Water, Sewer, and Stormwater Utilities” or the “Utilities”),
enterprise funds of Salt Lake City Corporation (the “City”), as of June 30, 2010, and the related combined
statements of revenues, expenses, and changes in net assets and cash flows for the year then ended, and
have issued our report thereon dated November 8, 2010.
In connection with our audit, nothing came to our attention that caused us to believe that the Utilities
failed to comply with the terms, covenants, provisions, or conditions of the Master Trust Indenture
Resolution No. 100 as approved on January 1, 2004 and by Resolution No. 3-2004 authorizing the
issuance of the 2004 Water and Sewer bonds or the terms, covenants, provisions, or conditions of
Resolution No. 100 as amended providing for the issuance of Water and Sewer Revenue Bonds or the
terms, covenants, provisions, or conditions of Resolution No.25-2005, Resolution No. 5-2008, Resolution
No. 36-2009 which are supplementary and amendatory resolutions authorizing the issuance of the 2005
Series Water and Sewer Revenue Bonds, the 2008 Water Revenue bonds, and 2009 Taxable Water and
Sewer Revenue Bonds insofar as they relate to financial and accounting matters. However, our audit was
not directed primarily toward obtaining knowledge of such noncompliance.
This report is intended solely for the information and use of the Advisory Committee, management of the
Salt Lake City Water, Sewer and Stormwater Utilities, management of the City, and US Bank Trust and is
not intended to be and should not be used by anyone other than these specified parties.
HANSEN, BARNETT & MAXWELL, P.C.
Salt Lake City, Utah
November 8, 2010