Embed Size (px)
Citation preview

Photo Credit: S. Tarnasky
Samantha Tarnasky Geosciences 206
Final Project Professor Dethier
May 14, 2009

INTRODUCTION As the home of the Williams Ephs, Lansing Chapman Arena serves an important
historical and cultural role on campus. Built in 1961, the rink has seen hundreds of men
and women’s hockey games, family skating sessions for faculty and broomball
championships. For eight years, students used the open-ended facility with only the arch
roof providing shelter. In 1969, the ends were added and a heating system was installed.
Since then, the campus has continued to enjoy the facility for a variety of activities. It
currently doubles in the fall and spring sports seasons as a tennis facility for the varsity
men and women’s teams. As the College starts to move forward with sustainability and a
commitment to greater environmental conscientious, it has become clear that this
beautiful building requires improvements to keep apace with the changing campus. An
investigation of the weaknesses of the building and a variety of possible solutions is an
important first step in allowing us to keep the incredible character of this building intact
while making a difference in the energy cost and financial burden it creates.
Figure 1. Lansing Chapman Arena; view from S. (Image by E. Foster)

METHOD
For preliminary information on this project, I was in frequent contact with both
Stephanie Boyd of the Williams College Zilkha Center for Environmental Initiatives and
Don Clark from Williams College Facilities. Both of these staff members acted as
resources by providing charts, graphs, and tables containing the information I intended to
analyze. For comparison purposes, I converted all units of energy provided in this data
into BTUs. With those numbers, it was possible to find CO2 emissions for each type of
energy being used in the building.
Additionally, I used the Williams College Sustainability Website (Johns 2008) to
create comparative graphs using both real-time and monthly energy metering provided by
on-campus data collection. Using this resource, I was able to investigate what parts of the
year tended to be the most energy intensive in Lansing-Chapman Rink. I compared the
energy and electricity use in the rink to other buildings on campus. Additionally, I
compared the rink to other athletic buildings and buildings that are used throughout the
year by a large portion of the student body.
After investigating the aspects of energy use in the rink that are problematic and
stand to be improved, I began considering what kinds of changes might need to be
implemented. For behavioral changes, I referred a great deal to my experience as a user
of the building. For structural alterations and changes to mechanical systems, I used a
variety of online articles and company websites that offered insight into the possible
improvements that exist. By combining these foundations with the financial
considerations of the potential improvements, I was able to arrive at a reasonable and
possible set of recommendations.

DATA
Table 1. Energy Use in the Rink (Average over 3 years) Hot Water Heat Propane Steam (LBS) 614,000 499,200 800 btu 1131 1131 91000 mmbtu 694.43 564.60 72.80
Table 2. Electricity Use in the Rink (Average over 3 years) Refrigeration Lighting/Fan Electricity (kwh) 245,000 500,000btu 0.0064 0.0064mmbtu 1,568 3,200
Table 3. C02 Emissions from the rink based on information from Tables 1 and 2 Source Energy (mmbtu) CO2 Emissions (Kg) % Emissions Hot Water 694.43 54,165.85 13%Heat 564.60 44,038.43 11%Propane 72.80 9,998.53 2%Refrigeration 1,568 99,886.5 25%Lighting/Fan 3,200 203,850 51%Total 6,099.83 401,940.78
Table 4. Cost of Individual Utilities Elec-.13/kwh $0.1300 $31,850 Gas- Propane 2.27/g $2.2700 $1,816 Steam- $14.54/mbtu, $.01454/# $0.0145 $16,191 Water sewer- $9.32 $9.3200 $7,151 Total/Yr $57,008

ANALYSIS & DISCUSSION OVERVIEW
In comparisons of electricity use over the course of a year, it becomes obvious
that the rink requires a staggering amount of energy throughout the school year,
specifically during hockey season. By factoring out the electricity associated with the ice
making machinery and comparing the remaining electricity use to other buildings on
campus, the intense use of this building becomes even clearer (Fig.12; see appendix).
Figure 10 (see appendix) shows the electricity usage from a week in May. During this
month there are no varsity sports teams using the facility and the ice surface has already
been removed. Clearly, the usage in the rink at this time is not a major concern. We can
see slight heightening in electricity demand during the times when the tennis teams are
using the facility for training (Fig. 12). This is more typical of September and early April
before the weather allows for outdoor training. Directly in contrast to this reasonable use
of electricity are the measurements of nearly 200 kilowatts that we see when the rink is in
use by the varsity hockey teams (Fig.11; see appendix). What these graphs display is that

while there may be ways to improve the use of this building in the time between March
and September, it is imperative that the focus be placed on the months when classes are
in session and most importantly, when hockey is in season. Because of more intense use
and the additional mechanisms required, this is definitely the time of year where the most
noticeable improvements can be made.
The building costs over $57,000 to run intensively for a small portion of the year
(Table 4). We can see that the majority of energy use goes towards the lighting and
ventilation in Lansing-Chapman (Table 2). It makes sense to focus a majority of our
attention on improvements that can be made in this area. However, it is also important to
consider the complex interactions of the different energy uses and how improvements in
one area may allow for noticeable improvement in other areas. To an extent, this building
does function as a unit and by considering all the components separately and then
working through how they function as one, we can make more reasonable decisions as to
what steps should be taken.
While the cost and convenience of running the rink are important considerations,
the overall environmental impact must be taken into account as well. We have a
responsibility to find ways for this building run with a much higher degree of efficiency.
The current 40,000 tons of C02 emissions (Table 3) are completely unacceptable and
need to be reduced along with the operating costs.
HEATING
The current heating system was installed in the rink in 1969 when the ends were
added to the building. Over time and with frequent use, the system has reached a point

where it is not functioning properly. The controls are no longer calibrated correctly,
which causes the heat in the building to operate at a much higher temperature than is
necessary for the space (D.Clark, Williams Facilities, written communication, May
2009). Hockey being played at the Collegiate level requires a facility temperature of
somewhere between -2 degrees Celsius and -5 degrees Celsius (Energie Innovation
2007). There is no exact measurement available but after using the facility, both on the
ice in full equipment and as a spectator that doesn’t even require a sweater, it is clear to
me that such low temperatures are not being maintained. The heat is simply being kept at
too high of a level. Additionally, because the system has deteriorated, the manual control
over the heat is lacking in its present state (D. Clark, Williams Facilities, written
communication, May 2009).
Figure 3. North end of Lansing Chapman; glass end added in 1969 (Photo by E.Foster)
While heating only accounts for 9% of the total energy use in the building (Fig.2),
it does contribute considerably to the cost of running the building, costing approximately
$7,238 for the school year alone.

There is currently a proposed improvement to the heating system that can be
installed over the summer and will reinstate manual control over the heat by fixing the
calibration of the mechanisms. The proposal has a predicted cost of $2000-$3000.
Unfortunately, the direct decrease in steam usage and heating costs cannot be predicted
because such data has not been measured up to this point (D. Clark, Williams Facilities,
written communication, May 2009). It does seem intuitive, however, that a reduction in
unnecessary heat will cut both costs and utility use. This should in turn lower C02
emissions.
REFRIGERATION
Because the refrigeration that keeps the ice surface at the necessary cool
temperature does not operate on a consistent schedule, it is responsible for most of the
drastic swings that appear in the winter use of electricity (Fig. 11). It turns on and off as
needed but is always running at a minimum 24 hours a day during hockey season
(D.Clark, Williams Facilities, verbal communication, May 2009).
There are alternate refrigeration systems to the one we use. Ours currently
operates on electricity. Any heat that comes as a by-product of the cooling system is
literally pumped out the window. One proposed solution to this situation is the
installation of a geo-exchange cooling system created and distributed by a company
called Ice Kube. The company has created a novel way of cooling the temperatures in an
ice rink while at the same time keeping the ice frozen. The heat that is removed from the
coolant and air needed to keep the rink at the proper cold temperature is collected and
used to heat other parts of the rink facility, such as locker rooms or offices. Another
option is to export the collected heat and use it to heat a completely different space (Ice
Kube Systems 2009). Specifically on our campus, the heat could be used for the pool or
other spaces in Chandler. Unfortunately, this requires a great deal of complicated
retrofitting and the cost will end up including consultation fees, material fees, and
installation costs. Because the cost is not certain, it is hard to say whether the payback
period on such a big investment would be prohibitive.
One arena in Burnsville, MN is taking a leap of faith on a similar technology that
is relatively new to ice rinks. They have taken the initiative and installed a $4.3 million
geothermal system in hopes of reducing both the cost of running the facility and the
emissions associated with the previous system. This particular system is impressive
because it reduces the amount of Freon used to cool the ice surface from a maximum of
12,000 lbs to roughly 360 lbs. This equipment has a life span of 25 years and has
potential to reduce energy costs by up to 90% (Spiros 2009). It seems that, in general,
projects of such a large scale garner more support in areas that consider ice hockey a way
of life, or at least a priority. It doesn’t seem unreasonable, however, to expect Williams to
put some resources into Lansing-Chapman Rink, given how many members of our
community use it.
Figure 4. Orr Rink at Amherst College; notice Astro-Rink ceiling (Photo by Amherst.edu)
Another possibility for saving energy on refrigeration costs might be the
installation of an Astro-Rink reflective ceiling (Fig.4). This is a low-emissivity insulation
layer that can easily be installed retroactively. It provides a barrier between the ceiling
and the airspace in the rink that maintains temperatures and reduces radiation heating. In
doing so, this system offers a more stable indoor environment, which allows for less
maintenance of the ice surface. Installation of this product can offer as much as a 28%
reduction in refrigeration needs. It can also help with condensation problems, which
lightens the load on ventilation systems. As a permanent installation, the Astro-Rink
ceiling requires little to no maintenance (Energie Innovations 2007). There are estimates
that it is worth $12,000 per year at electricity price of $0.065 to install a low-e ceiling
(EnergyIce Publications). It is not specified whether this number is for the whole year but
at Williams, our electricity is $0.13. If this roof installation could save 30% of current
refrigeration energy that would be around $6500/yr based on our current data (S.Boyd,
Williams Zilkha Center, written communication, May 2009). One company estimates
$25,000 for the installation of the ceiling (EnergyIce Publications). With these numbers
in mind, and the possibility of increased electricity costs, the payback on this installation
would be less than 4 years.
LIGHTING
After breaking down the electricity used in the rink, it is obvious that the lighting
system is a problem (Fig. 2). The lights are used throughout the entire year but again, it

seems that their use is most intensive during the winter months and hockey season (Fig.
11; see appendix).
One proposal, in its preliminary stages, has been offered as a solution to the
currently inefficient lighting in the building. Unfortunately, there are too many unknown
variables and inaccurate estimates within this proposal for it to be a viable option at this
time. Naomi Miller Lighting Design has suggested replacing all the lighting, including
the wiring. As a result, the foot-candles would be increased from their current 30 to a
much brighter 100. Additionally, the new system would offer better control over certain
areas of lighting, allow for partial lighting and decrease electricity required to run the
system (Naomi Miller Lighting Design, written communication, May 2009). With a
closer look at this proposal, it is obvious that the estimated hour usage is not correct.
Another problematic aspect of this proposed renovation is the cost. The project would
cost nearly $60,000 to install and provide an energy savings of only $3000/year at the
very most (Naomi Miller Lighting Design, written communication, May 2009). Lastly,
this project attempts to increase the lighting by an unnecessary margin. Only professional
hockey games that will be broadcast on television require 100 foot-candles. Collegiate
hockey could easily function with anywhere from 40-50 foot candles (Energie Innovation
2007). Luckily, this is not the only option when considering changes to the lighting.
Other facilities have found success by installing more energy efficient lighting and
providing a dimming option so the lights are not required to be at full capacity all the
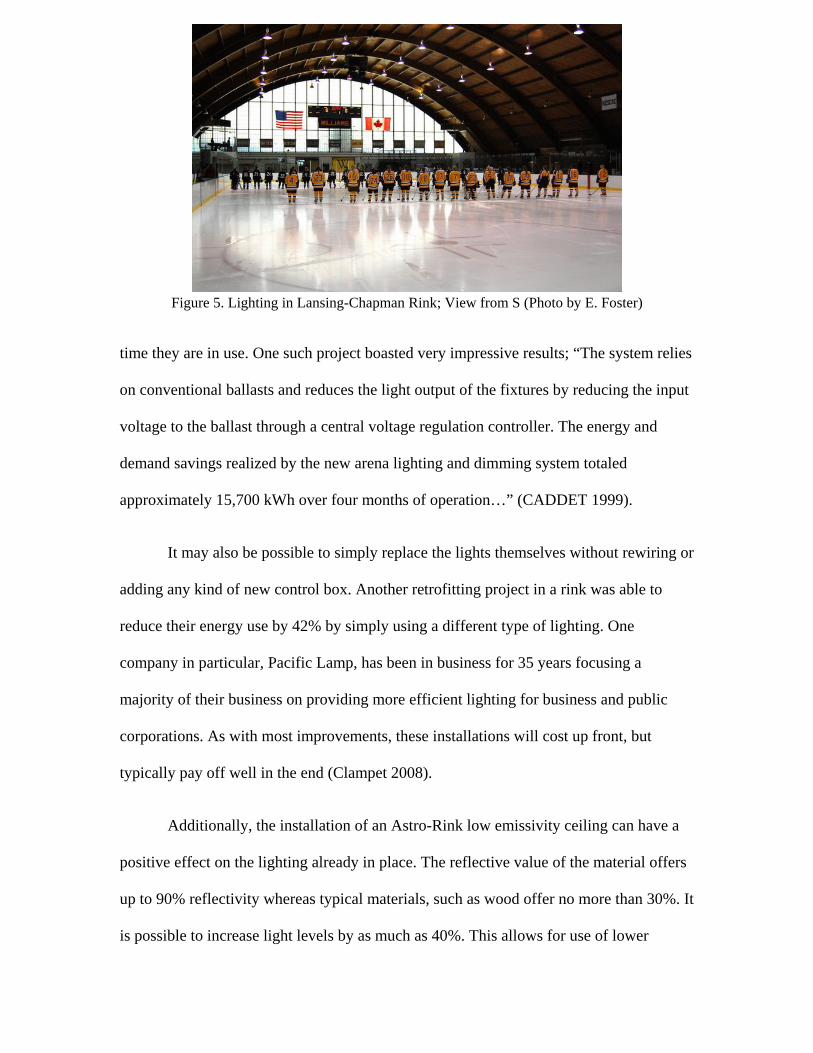
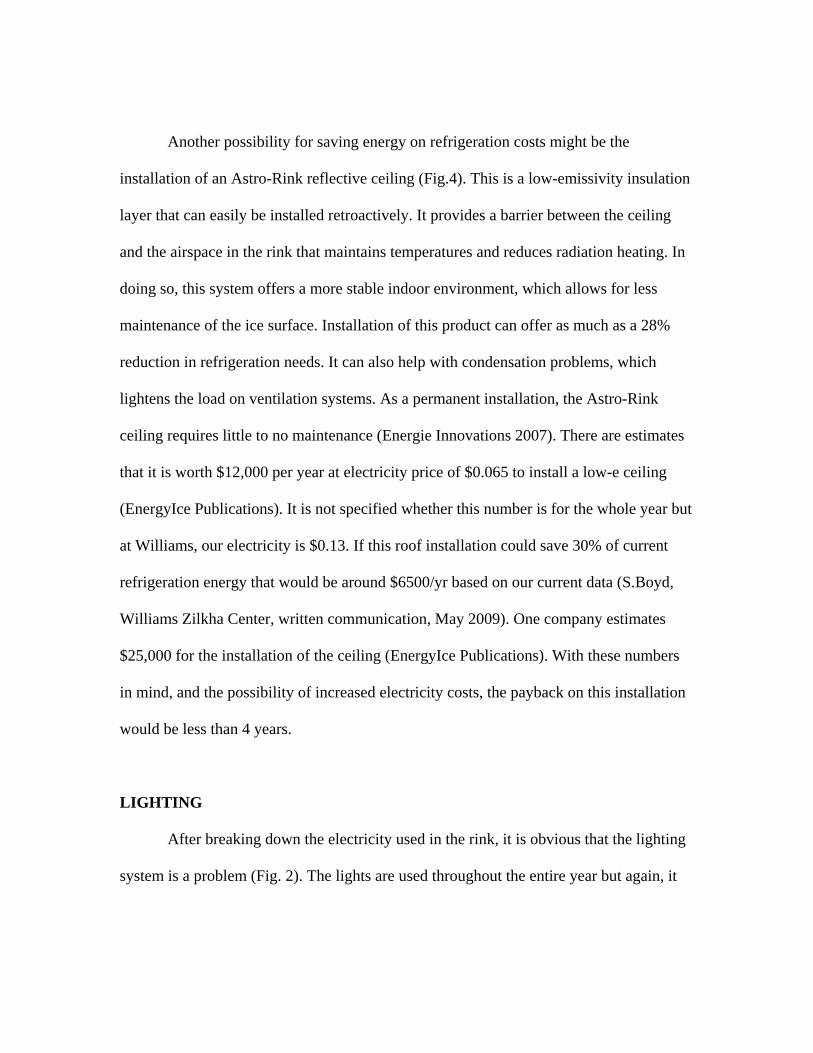
Figure 5. Lighting in Lansing-Chapman Rink; View from S (Photo by E. Foster)
time they are in use. One such project boasted very impressive results; “The system relies
on conventional ballasts and reduces the light output of the fixtures by reducing the input
voltage to the ballast through a central voltage regulation controller. The energy and
demand savings realized by the new arena lighting and dimming system totaled
approximately 15,700 kWh over four months of operation…” (CADDET 1999).
It may also be possible to simply replace the lights themselves without rewiring or
adding any kind of new control box. Another retrofitting project in a rink was able to
reduce their energy use by 42% by simply using a different type of lighting. One
company in particular, Pacific Lamp, has been in business for 35 years focusing a
majority of their business on providing more efficient lighting for business and public
corporations. As with most improvements, these installations will cost up front, but
typically pay off well in the end (Clampet 2008).
Additionally, the installation of an Astro-Rink low emissivity ceiling can have a
positive effect on the lighting already in place. The reflective value of the material offers
up to 90% reflectivity whereas typical materials, such as wood offer no more than 30%. It
is possible to increase light levels by as much as 40%. This allows for use of lower

wattage in the bulbs, which decreases radiant heat. This added benefit is helpful for
refrigeration costs and heating concerns (Energie Innovation 2007). By taking into
consideration the reduced electricity costs of running such high-watt lights, the Astro-
Rink ceiling should have an even shorter pay back than assessed previously.
Figure 6. The ice fresh after maintenance; (Photo by A. Taylor) ZAMBONI & ICE MAINTENANCE
As we see in Figure 2, the propane used for the Zamboni could be a negligible
cost in the grand scheme of keeping the rink running. However, it does end up using 800
gallons of propane (Table 1) costing the College just over $1,800 to run for the 5 months
it is needed. In this short window of time it produces nearly 1,000 tons of C02 (Table 3).

RECOMMENDATIONS CHANGES IN USE
While there are certainly students on campus that get a great deal of enjoyment
from playing Broomball on the frosty nights of Winter Study, this activity actually incurs
a dispensable cost to the College. There are a number of ways in which eliminating this
intramural activity could reduce the cost of running the rink as well as the associated
emissions.
Typically Broomball is played 2 or 3 weeknights every week of January. The
games begin around or after 10:00pm. On a typical day, the varsity teams have vacated
the arena by 8:30pm. Half an hour after this, the maintenance team has finished any ice
repairs and can leave for the night. Operating on these assumptions, we should see the
lights and a majority of energy consuming machinery completely shut down by 9:00pm.
By waiting the additional hour for Broomball to start and the time it takes for the
games to be played as well as the time to repair the ice after the games have finished, we
are adding easily 3-4 hours of use for the days when the intramurals are scheduled.
Because the lights can be using up to 50 kw at any given time (A. Johns, Williams Zilkha
Center for Environmental Initiatives, verbal communication, May 2009), this additional
usage is important to consider. If the lights are operating at 50 kw and are on for an
additional 4 hours, this is adding an unnecessary 300 kwh to the electric demand for the
building. In terms of cost, with electricity costing $0.13, this adds nearly $100 to the
electricity bill for every week of Winter Study, assuming games are only played 3 nights
a week.

Not only are the lights kept on for longer, the Zamboni also ends up incurring
unneeded cost. In order to have the ice back to game quality after the damage caused by a
Broomball game, facilities often has to resurface as many as 3 times. This not only uses
propane, hot water and requires lighting, it also increases C02 emissions. To avoid
ruining the skates worn by hockey players in games and practices following Broomball,
the benches and entire lobby area must be pressure washed to remove dirt and sand. This
adds to the cost through use of hot water and electricity to run the necessary equipment.
Overall, it seems that eliminating Broomball is a step in the right direction for
lowering costs and emissions at the rink. In the big picture, it may be seen as too small of
a change, but it is a good step in the direction of less unnecessary use of this building
overall.
HEATING
The recommendation here is a fairly moot point as the decision as already has
been made to recalibrate the controls on the faulty heating system. The cost incurred can
be paid back rather quickly and this improvement has many periphery benefits. For
example, by fixing the heating system and allowing the controls to maintain a much
lower temperature within the building, the load on the ice maintenance machinery will be
greatly lessened. To maintain a low temperature on the ice surface, the ice plant will no
longer have to contend with high temperatures in the building and this will lessen the
amount of time the plant will need to run (D. Clark, Williams Facilities, verbal
communication, May 2009).

LIGHTING
While there are many options being offered at this time, none of them strike me as
the most effective solution. Rather than replacing all the lighting or attempting to
completely rewire the system, there needs to be a smaller fix offered. In order for the
lights to be used more effectively, they simply need to be shut off more of the time. This
might mean either installing a sensor to have them shut off after a certain period of time.
It might mean installing a key pad or swipe access so that only those who are authorized
can turn the lights on when they are needed. It may also be necessary to install certain
wiring changes that allow only some of the lights to be turned on when full light is not
needed. Portions of these solutions have surfaced in my research but I have not yet
uncovered the ideal system. These improvements are something I felt I should mention in
case a new proposal is brought to the attention of the College.
Figure 7. The wood ceiling in the rink; View from S. spectator seating (Photo by E. Foster)

However, something that seems to be helping both the lighting and heating
situations would be the installation of the Astro-Rink reflective ceiling. From the data
available, this appears to be a financially viable solution that will not only have a rather
quick payback but is also durable and should last for a reasonable amount of time. It
seems that having considered other options, this installation may be one of the best
possibilities at this time. A ceiling of this type was installed in the rink at Amherst
College (Fig.4) and seems to be fulfilling its potential and making a big difference in the
facility (Amherst College 2009). Indeed, it would be a shame to see the beautiful wood
ceiling of the rink covered (Fig.7). The building has such character and history as it now
stands. That said, the drastic improvements in cost, energy use, and associated emissions
are awfully convincing.
BEHAVIOURAL CHANGES
A last recommendation is one that I can only base on experience. There are
improvements happening in the rink already that are not being used to their full potential.
Last fall both low-flow shower heads and sensor pads for the locker room light switches
were installed (D. Clark, Williams Facilities, written communication, May 2009) and yet
no one was instructed on how to use them. Telling teams, coaches and other facility users
about the proper use of such energy saving technologies could make an impact. For
example, placing stickers by the light switches with instructions to turn them off when
leaving would be a simple and effective way to better the use of the locker rooms.
This type of educational strategy needs to expand to all the habits of those that use
the rink. Many times both varsity hockey teams will be traveling and stereos, skate
sharpening machines, cell phone chargers, etc will be left plugged in, in both locker
rooms (Fig.8). Simply placing signs that remind people to unplug and turn off everything
they are leaving behind would make at least some difference in how much electricity the
building is using.
Figure 8. Freshman Sarah Herr ties up her skates in the Women’s locker room (Photo by S. Tarnasky)
This recommendation is important for the future as well. Whatever changes are
made or improvements are implemented, they need to be explained to both those that use
the facility and those that run it. By informing everyone involved, we greatly increase the
chance people will understand how things need to be done and make an effort to
participate in doing things the right way.
CONCLUSION
It seems that to improve Lansing-Chapman Rink in terms of energy use, cost and
C02 emissions, a great deal of the focus needs to be on changing the way it is run during
the winter months. Clearly, the hockey season gives rise to the most concerning data.
Luckily, there are a number of options to consider for improving this building. The next
step will be ensuring that proposed changes strive to maintain the functionality of the
building while simultaneously allowing it to operate more smoothly and on a smaller
budget. Most of the projects that are available at this time offer a reasonable payback
period. But they do require an upfront investment in order for any changes to be
implemented. After a closer look at the available information, the project does not seem
terribly daunting or hopeless at all. Rather, it is exciting to consider the many options that
are out there and the ways in which we can incorporate new and effective technology into
our historic and well-loved rink.

APPENDIX
Figure 9. Electricity Use for Week of 4/4/09-4/11/09 (Tennis Season)
Figure 10. Electricity Use for Week of 5/10/09-5/18/09 (No Sport)

Figure 11. Electricity Use for Week of 1/18/09-1/25/09 (Hockey Season)
Figure 12. Comparison of KWH Used in Sample of Campus Buildings

Bibliography No author (May 2009). Energy Conservation Projects. Retrieved from https://www.amherst.edu/campuslife/greenamherst/energy_conservation#Orr%20Rink Boyd, Stephanie (May 2009) Williams College Center for Environmental Initiatives, verbal and written communication CADDET energy efficiency (n.d.). Energy-saving measures at ice rink. Retrieved from http://oee.nrcan.gc.ca/Publications/infosource/Pub/ici/caddet/english/pdf/R339.pdf Clampet, Jennifer (2008, October 3) Sherwood Ice Arena goes greener. The Tigard Times. Retrieved from http://www.tigardtimes.com/news/story.php?story_id=122306061950953100 Clark, Don (May 2009), Williams College Facilities, verbal and written communication Energie Innovation Inc. (2007). Astro-Rink: Reflective Insulating Material Owners Manual. Retrieved from http://www.energie-innovation.com/media-files/Owners%20Manual%20Generic.pdf Ice Kube Systems Ltd. (n.d.) Product Information. Retrieved from http://www.icekubesystems.com/htmlfiles/contact.asp Johns, Amy (2009). Sustainability at Williams. Retrieved from http://www.williams.edu/resources/sustainability/ Lenko, Brendan. (September 2001). Ice Rink Energy Conservation. Retrieved from http://www.customicerinks.com/energyice/press3.htm Miller Naomi. (May 2009). Williams College Equipment and Energy Cost, written communication via email Spiros, Dean. (2009, May 18). Burnsville Ice Center will get eco-friendly energy upgrade. Star Tribune. Retrieved from http://www.startribune.com/local/south/44624812.html?elr=KArks:DCiUHc3E7_V_n