Embed Size (px)
Citation preview
UNIVEERSITY OF CAALIFORNNIA COOPERAATIVE EEXTENSIION AGRICULTUURE ANDD NATUURAL REESOURCCES
AAGRICUULTURAAL ISSUUES CENNTER
22016 SAMPLLE COSTTS TO EESTABLIISH ANDD PRODDUCE
AALFFALLFAA
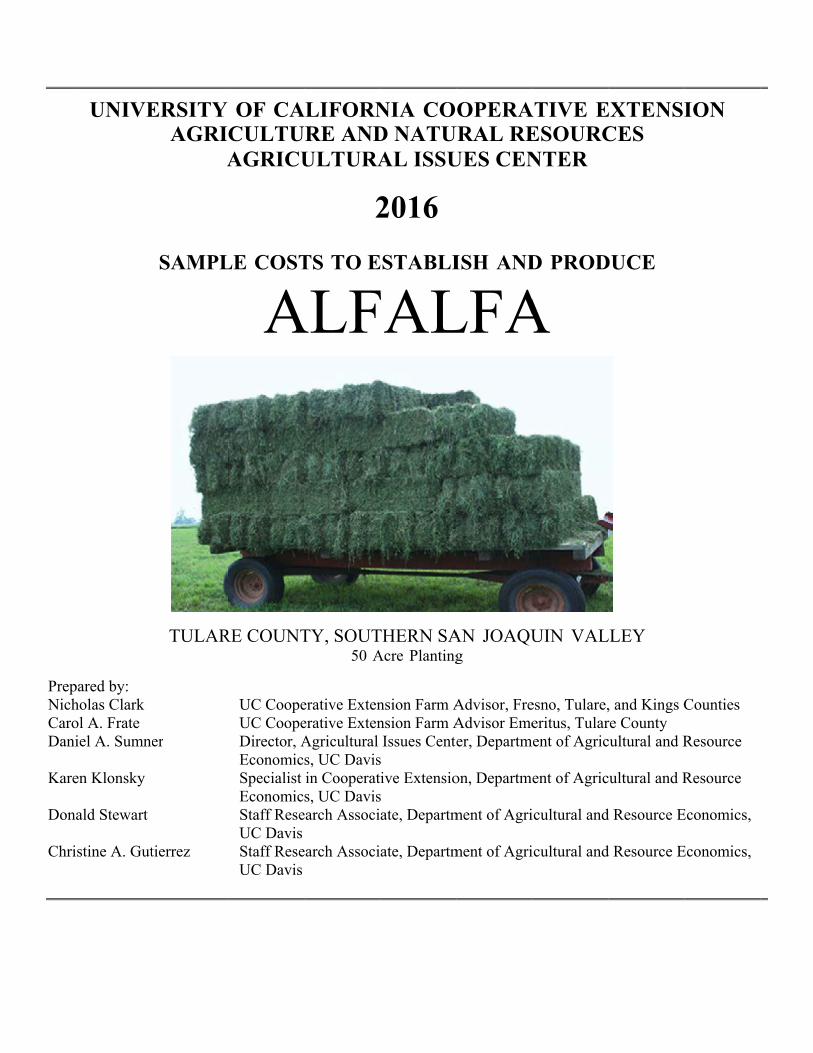
TULARRE COUNTTY, SOUTTHERN SAAN JOAQUUIN VALLLEY 50 AAcre Plantingg
Preppared by: Nichholas Clark UC Coopeerative Extennsion Farm AAdvisor, Freesno, Tulare,, and Kings CCounties Carool A. Frate UC Coopeerative Extennsion Farm AAdvisor Emeeritus, Tularre County Daniiel A. Sumneer Director, AAgricultural Issues Centeer, Departmment of Agriccultural and RResource
Economic s, UC Daviss Kareen Klonsky Specialist in Cooperative Extensioon, Departmeent of Agriccultural and RResource
Economic s, UC Daviss Donaald Stewart Staff Reseearch Associate, Departmment of Agriicultural andd Resource EEconomics,
UC Davis Christine A. Guttierrez Staff Reseearch Associate, Departmment of Agriicultural andd Resource EEconomics,
UC Davis
UNIVERSITY OF CALIFORNIA COOPERATIVE EXTENSION AGRICULTURAL ISSUES CENTER
SAMPLE COSTS TO ESTABLISH AND PRODUCE ALFALFA Tulare County - Southern San Joaquin Valley - 2016
50 Acre Planting
CONTENTS INTRODUCTION…...........................................................................................…………………… ................... 2 ASSUMPTIONS. …. ........................................................................................................................................... 3 Stand Establishment Operating Costs ..................................................................................................................... 3 Production Operating Costs......……. ..................................................................................................................... 4 Labor, Equipment & Interest ................................................................................................................................... 5 Cash Overhead ………. ....................................................................................................................................... 6 Non-Cash Overhead …. ....................................................................................................................................... 6 REFERENCES ………........................................................................................................................................ 8 Table 1. COSTS PER ACRE to ESTABLISH ALFALFA…. ...............................................................................9 Table 2. MATERIAL and INPUT COSTS to ESTABLISH ALFALFA .............................................................10 Table 3. WHOLE FARM ANNUAL EQUIPMENT COSTS FOR ESTABLISHMENT YEAR ..................... 10 Table 4. COSTS PER ACRE to PRODUCE ALFALFA ....................................................................................... 11 Table 5. COSTS AND RETURNS PER ACRE to PRODUCE ALFALFA ....................................................... 12 Table 6. MONTHLY CASH COSTS PER ACRE to PRODUCE ALFALFA .....................................................13 Table 7. RANGING ANALYSIS .......................................................................................................................... 14 Table 8. WHOLE FARM ANNUAL EQUIPMENT, INVESTMENT and OVERHEAD COSTS .....................16 Table 9. HOURLY EQUIPMENT COSTS …………………………………………………. ............................16 Table 10. OPERATIONS WITH EQUIPMENT & MATERIALS .................................................................... 17
Acknowledgements: Appreciation is expressed to the UC Cooperative Extension, growers, packers, input suppliers, and other industry representatives who provided information, assistance, and expertise for this study.
INTRODUCTION
This study is intended as a guide only. It can be used to help guide production decisions, estimate potential returns, prepare budgets and evaluate production loans. Sample costs given for labor, materials, equipment and contract services are based on early 2016 figures. Practices described are based on production practices considered typical for the crop and area, but will not apply to every situation. A blank column titled Your Costs is provided in Tables 1 and 2 to enter your estimated costs.
For an explanation of calculations used in the study refer to the section titled Assumptions. For more information contact the University of California Agriculture and Natural Resources, Agricultural Issues Center, Department of Agricultural and Resource Economics, Donald Stewart, at 530-752-4651 or [email protected], or Christine Gutierrez, at 530-752-5021 or [email protected]. The local extension office can be contacted through Nicholas Clark, UC Cooperative Extension Farm Advisor, at 559-852-2788 or [email protected].
Sample Cost of Production studies for many commodities are available and can be down loaded from the website at http://coststudies.ucdavis.edu. Archived studies are also available on the website.
The University is an affirmative action/equal opportunity employer.
ASSUMPTIONS
The assumptions refer to Tables 1 through 10 pertain to sample costs to establish an alfalfa stand and produce alfalfa hay in the southern San Joaquin Valley. Cultural practices and costs for alfalfa production vary considerably among growers within the region; therefore, many of the costs, practices, and materials for the study will not be applicable to every farm. The practices and inputs used in this cost study serve as a guide only. The use of trade names and cultural practices in this report does not constitute an endorsement or recommendation by the University of California, nor is any criticism implied by omission of other similar products or cultural practices.
Farm. The hypothetical farm consists of 50 contiguous acres owned and managed by the grower. Alfalfa is planted on the entire 50 acres. Farms of this size may have minimum charges for custom services, versus larger farms that experience increased efficiencies and thus lower costs per acre. Some operations may have equipment move-in fees; these possible costs are not reflected in the study.
Stand Establishment Operating Costs (Tables 1-3)
Tables 1 through 3 show the costs associated with ground preparation, planting and establishing an alfalfa stand. Land preparation and planting are done in the fall. The establishment year ends after the herbicide application in December.
Land Preparation. Stand establishment begins by discing down (stubble disc) the residue from the previous crop. The ground is chiseled to a depth of 18 to 24 inches to fracture the soil, which improves root penetration and water infiltration. The field is then rolled with a rice roller. Next, the field is laser leveled at a cost of $175 per acre. Lastly, the field is disced and harrowed with a ring roller to prepare the seedbed. Borders (levees) for irrigation checks are made at periodic intervals (60 ft. in this study) through the field. A custom operator does all of the land preparation.
Fertilization. Nitrogen (N) and phosphorus (P) as 11-52-0 at 200 pounds per acre of material are applied by a custom operator in September prior to the final discing. Pre-plant soil testing for phosphorous (P) and potassium (K) is recommended. In this study, the PCA collects one soil sample per 20 acres at a cost of $10.60 for each test.
Planting. A custom operator plants Roundup Ready alfalfa seed with a Brillion seeder 1/4 inch to 1/2 inch deep at 25 pounds of seed per acre. The seed is planted in September or October and the stand life is expected to be three years. Cost of seed varies, Roundup Ready seed is used in this study at a cost of $5.84 per pound with an additional $3.00 per pound tech fee.
Irrigation. In this study, the irrigation method is sprinkler irrigation during establishment, followed by border flood irrigation during production. Water for seed germination is applied using a sprinkler irrigation system in early fall immediately after planting (8 acre-inches). If winter rains do not occur, a second irrigation may be necessary. Water is supplied by the irrigation district and is supplemented by well water. Prices for water vary considerably among irrigation districts and pumping costs vary due to well depth, pumping level and type of irrigation system. This study applies a charge of $130 per acre-foot, ($10.83 per acre-inch). Irrigation labor is provided as a separate line item and includes the cost of setting up and taking down the sprinkler irrigation system.
Pest Management. The pesticides and rates mentioned in this cost study are listed in the following
2016 Alfalfa Costs and Returns Study (50 Acres) San Joaquin Valley South UC Cooperative Extension – Ag Issues Center 3
publications: Integrated Pest Management for Alfalfa and UC Pest Management Guidelines, Alfalfa. Pesticides mentioned in this study are not recommendations, but those commonly used in the region. For information and pesticide use permits, contact the local county Agricultural Commissioner’s office. For information on other pesticides available, pest identification, monitoring, and management, visit the UC IPM website at www.ipm.ucdavis.edu. Pest control costs and vary considerably each year depending upon local conditions and pest populations in any given year. Adjuvants are recommended for many pesticides for effective control and are an added cost. Adjuvants are not included as a cost in this study.
Pest Control Advisor (PCA). Written recommendations are required for many pesticides and are available from licensed pest control advisors. In addition, the PCA or an independent consultant will monitor the field for agronomic problems including irrigation and nutrition. Growers may hire a private PCA or receive the services as part of a service agreement with an agricultural chemical and fertilizer company. In this study, the PCA services are provided by the fertilizer company free of charge.
Application Methods. After planting, treatment of alfalfa with pesticides are made by either chemigation (pesticides and/or fertilizers applied through the irrigation water), by tractor or ATV mounted ground/boom sprayer, or foliar-broadcast by airplane. Some pesticides and fertilizers are mixed and applied together during the same irrigation. Some pesticides are applied to a portion of the alfalfa acreage. Pesticides with different modes of action and sites of action, and different active ingredients should be rotated to avoid resistance development by the targeted pests. Fertilizer is applied via air application using a custom operator and pesticides are applied via an ATV sprayer system with a 30’ boom.
Weeds. Broad-spectrum post-emergent herbicides, such as Roundup PowerMax, are applied depending on environmental conditions. In this study, RoundUp PowerMax is applied to the field at a rate of 2 pints per acre in December of the establishment year. A pre-emergence herbicide such as Treflan TR or Prowl H20 could be applied for grass control, but is not included in this study during the establishment year. Contact herbicides, such as Gramoxone, or Select Max, could also be applied for selective weed control and to combat species shift & resistance. In some areas of the San Joaquin Valley, sheep are introduced and allowed to graze the alfalfa fields in January as a weed, Sclerotinia Stem, and Crown Rot control measure. This operation and associated costs are not included in this study.
Production Operating Costs (Tables 3-10)
Irrigation. During the production years, this study uses border flood irrigation. The water is pumped through alfalfa valves at the head of the field and flows down the alfalfa check between the borders. A semi-permanent drain ditch is dug at the edge of the field using a V-Ditcher pulled by a tractor. All field operations turn inside the field and do not cross the drain. From April to October, ten irrigations totaling 64 acre inches (5.3 acre-feet) of water are applied by flooding the checks based on evapotranspiration (ET) requirements. Applied water values are greater than the actual water requirement due to an estimated application efficiency of 75 percent. The actual water requirement will vary each year based on soil, climatic, and plant physiological factors.
Irrigation includes the water and pumping costs, with irrigation labor provided as a separate line item. Water costs will vary considerably depending upon the irrigation district and, when pumped, upon the due to well depth, pumping level and type of irrigation system. A cost of $10.83 per acre-inch ($130 per acre-foot) is used in this study. Due to the high cost and/or unavailability of water in recent years, some growers have reduced water usage or summer fallowed the fields at a cost of lower yields.
Fertilization. After establishment, plant tissue tests should be taken each year to determine nutrient
2016 Alfalfa Costs and Returns Study (50 Acres) San Joaquin Valley South UC Cooperative Extension – Ag Issues Center 4

requirements. Tissue samples should be scheduled once during the growing season and your Ag consultant (PCA) may recommend this be done in either the spring or fall. Tissue testing in this study is done each year in August to determine the levels of P and K. Costs shown are for the analysis based on one sample per 20 acres collected by the PCA at a cost of $25.90 per sample. In this study, an allocation of phosphorous as 11-52-0, at 200 pounds per acre is charged to the field in the fall of each year. Subsequent micronutrient fertilizers are applied as needed from tissue analysis and PCA recommendations.
Pest Management. The pesticides and rates mentioned in this cost study are listed in the following publications: Integrated Pest Management for Alfalfa and UC Pest Management Guidelines, Alfalfa. Pesticides mentioned in this study are not recommendations, but those commonly used in the region. For information and pesticide use permits, contact the local county Agricultural Commissioner’s office. For information on other pesticides available, pest identification, monitoring, and management, visit the UC IPM website at www.ipm.ucdavis.edu. Pest control costs and vary considerably each year depending upon local conditions and pest populations in any given year. Adjuvants are recommended for many pesticides for effective control and are an added cost. Adjuvants are not included as a cost in this study.
Weeds. Prior to the first cutting, a post- emergence herbicide can be applied to control broadleaf and other grasses, such as 2,4-D (Butyrac 200), Buctril, Raptor, or Pursuit, or a combination thereof. During production years, herbicides other than Roundup should be used at least once to avoid weed shifts and selection for resistance. In this study, Roundup PowerMax is applied at a rate of 2 pints per acre in February of the production year.
During the second year, a pre-emergence herbicide (Treflan TR-10 or Prowl H2O) may be applied in January for grass control with a second application in April if dodder is expected (the study does not include this application). Residual herbicides for control of winter weeds could be applied starting at the end of the first year, such as Karmex DF, Velpar L, Chateau or Prowl H2O. This application is included in this study at a rate of 4 oz/acre of Chateau and 1 gallon/acre of Prowl H2O in December of the production year. A contact herbicide (Gramoxone) may be applied at the end of the second year, and is included at a rate of 1.5 pints per acre in this study.
In May of the third year, a post emergence herbicide (SelectMax or Roundup) is applied to control summer grasses. This application is included in this study at a rate of 2 pints per acre of Roundup PowerMax during May of the production year. The herbicide costs will vary slightly during the production years due to the difference in weed control each year. For additional information regarding weed management, refer to the “Herbicide Treatment Table for Seedling Alfalfa” available on the UC Davis IPM website (http://www.ipm.ucdavis.edu). The table provides a listing of available herbicides and their application rates and times.
Insects. Several insect species attack alfalfa, but alfalfa weevil, aphids, alfalfa caterpillar, and armyworms are the pests that cause the most economic damage. Weevils and aphids are assumed to reach population levels requiring a single treatment for control for which the insecticide Warrior II (lambda-cyhalothrin, a synthetic pyrethroid) is applied at a rate of 1.5 fl oz per acre in March of the production year. Aphids can also be controlled with an application of Sivanto (flupyradifurone). Worms, alfalfa caterpillar and armyworms are controlled in July with the insecticide Coragen (chlorantraniliprole) application of 3.5 fl. oz. per acre during July of the production year.
Harvest. In this study, the alfalfa is custom harvested for hay nine times – March, April, May, June, July, August, September, October and November. Alfalfa for hay is cut with a self-propelled swather and left to dry for several days before it is turned and windrowed using a rake. Once the hay has dried to the correct moisture
2016 Alfalfa Costs and Returns Study (50 Acres) San Joaquin Valley South UC Cooperative Extension – Ag Issues Center 5
content, it is baled into 125-pound bales. The bales are picked up with a bale wagon that moves them from the field and roadsides them in a stack.
Custom Harvest. A harvesting companies’ swath, rake, bale, and roadside (pick up bales and stack) the harvested alfalfa. Charges in this study for the custom harvest services are swathing and raking for $22.50 per acre, baling for $1.10 per bale and roadsiding for $0.60 per bale. In total, this is an approximate cost of $40.10 per ton for swathing/raking and baling with a roadside charge of $9.50 per ton for 125# bales.
Yields. The crop is assumed to yield 10.00 tons of hay per acre at 90 percent dry matter (DM).). Annual yields range from 5 to 11 tons of hay per acre in this region. In this study, yields are calculated as the same for each cutting, but most often the first and second cuttings are the largest and the mid-summer cuttings have the lowest yield.
Returns. A price of $250 per ton for premium hay is based on USDA first quarter 2016 averages for the central San Joaquin Valley market districts. Hay prices and hay quality will vary during the season and by district. USDA alfalfa hay standards are Supreme, Premium, Good, Fair, and Utility, with Supreme garnering the highest price. The hay price in this study is based on 90 percent dry matter. This study focuses on hay production to be sold in small bales (125#), which a primarily sold to the horse feed industry at a premium, as they are a higher cost to handle and more expensive to produce than a large bale.
Pickup/ATV. The pickup is used for business purposes as needed. The ATV is used for irrigation and pesticide applications. Associated costs are included in this study.
Labor, Equipment and Interest
Labor. Labor rates of $20.44 per hour for machine operators and $17.52 for general labor includes payroll overhead of 46 percent. The basic hourly wages are $14.00 for machine operators and $12.00 for general labor. The overhead includes the employers’ share of federal and California state payroll taxes, workers' compensation insurance for field crops (code 1071) and a percentage for other possible benefits. Workers’ compensation costs will vary among growers, but for this study, the cost is based upon the average industry final rate as of January 1, 2016. Labor for operations involving machinery are 20 percent higher than the operation time given in Table 1 and 4 to account for the extra labor involved in equipment set up, moving, maintenance, work breaks, and field repair.
Equipment Operating Costs. Repair costs are based on purchase price, annual hours of use, total hours of life, and repair coefficients formulated by American Society of Agricultural Engineers (ASAE). Fuel and lubrication costs are also determined by ASAE equations based on maximum power takeoff (PTO) horsepower, and fuel type. The cost includes a 9.25 percent sales tax on diesel fuel and 2.25 percent sales tax on gasoline. Prices for on-farm delivery of diesel and gasoline are $2.38 and $2.65 per gallon, respectively. The costs are based on the last quarter of 2015 and first quarter of 2016 Energy Information Administration (EIA) price information. Gasoline also includes federal and state excise tax, which can be refunded for on-farm use when filing your income tax. The fuel, lube, and repair costs per acre for each operation are determined by multiplying the total hourly operating cost for each piece of equipment used for the selected operation by the hours per acre. Tractor time is 10 per cent higher than implement time for a given operation to account for setup, travel and maintenance.
Interest on Operating Capital. Interest on operating capital is based on cash operating costs and is calculated monthly until harvest at a nominal rate of 4.25 per cent per year. A nominal interest rate is the typical market cost of borrowed funds. The interest cost of post-harvest operations is discounted back to the last harvest month
2016 Alfalfa Costs and Returns Study (50 Acres) San Joaquin Valley South UC Cooperative Extension – Ag Issues Center 6
using a negative interest charge. The rate will vary depending upon various factors, but the rate in this study is considered a typical lending rate by a farm-lending agency as of January 2016.
Risk. The risks associated with crop production should not be minimized. While this study makes every effort to model a production system based on typical, real world practices, it cannot fully represent financial, agronomic and market risks, which affect profitability and economic viability of alfalfa production. Because of so many potential risk factors, effective risk management must combine specific tactics in a detailed manner, in various combinations for a sustainable operation.
Cash Overhead
Cash overhead consists of various cash expenses paid out during the year that are assigned to the whole farm, not to a particular operation. Employee benefits, payroll taxes and workers’ compensation insurance are included in labor costs and not under cash overhead.
Property Taxes. Counties charge a base property tax rate of 1 per cent on the assessed value of the property. In some counties, special assessment districts exist and charge additional taxes on property including equipment, buildings, and improvements. For this study, county taxes are calculated as 1 per cent of the average value of the property. Average value equals new cost plus salvage value divided by 2 on a per acre basis.
Insurance. Insurance for farm investments varies depending on the assets included and the amount of coverage. Property insurance provides coverage for property loss and is charged at 0.834 per cent of the average value of the assets over their useful life. Liability insurance covers accidents on the farm and costs $638 for the entire farm.
Office. Costs are estimated at $50 per acre for the ranch and are not based on any specific information, except that there is a cost involved for bookkeeping, payroll, tax preparation and communication systems.
Investment Repairs. Annual repairs on investments or capital recovery items that require maintenance are calculated as 2 per cent of the purchase price. Repairs are not calculated for land and establishment costs.
Non-Cash Overhead
Non-cash overhead is calculated as the capital recovery cost for equipment and other farm investments. One- half of the overhead costs in the establishment year are allocated to the previous crop.
Capital Recovery Costs. Capital recovery cost is the annual depreciation and interest costs for a capital investment. It is the amount required each year to recover the difference between the purchase price and salvage value (unrecovered capital). It is equivalent to the annual payment on a loan for the investment with the down payment equal to the discounted salvage value. This is a more complex method of calculating ownership costs than straight-line depreciation and opportunity costs, but more accurately represents the annual costs of ownership because it takes the time value of money into account (Boehlje and Eidman). The formula for the calculation of the annual capital recovery costs is (Purchase Price – Salvage Value) x Capital Recovery Factor) + (Salvage Value x Interest Rate).
Salvage Value. Salvage value is an estimate of the remaining value of an investment at the end of its useful life. For farm machinery (tractors and implements), the remaining value is a percentage of the new cost of the investment (Boehlje and Eidman). The percent remaining value is calculated from equations developed by ASABE based on equipment type and years of life. The life in years is estimated by dividing the wear out life, as given by ASABE by the annual hours of use in this operation. For other investments including irrigation
2016 Alfalfa Costs and Returns Study (50 Acres) San Joaquin Valley South UC Cooperative Extension – Ag Issues Center 7
systems, buildings, and miscellaneous equipment, the value at the end of its useful life is zero. The salvage value for land is the purchase price because land does not depreciate. The purchase price and salvage value for equipment and investments are shown in the tables.
Capital Recovery Factor. Capital recovery factor is the amortization factor or annual payment whose present value at compound interest is 1. The amortization factor is a table value that corresponds to the interest rate used and the life of the machine.
Interest Rate. An interest rate of 3.25 per cent is used to calculate capital recovery. The rate will vary depending upon loan amount and other lending agency conditions, but is the basic suggested rate by a farm-lending agency as of January 2016.
Irrigation System. Irrigation practices in the southern San Joaquin Valley range from the dominant border flood, to sprinkler, to subsurface drip, or a combination thereof. More information regarding Alfalfa raised on sub-surface drip irrigation can be found in the “2014 Sample Costs to Establish and Produce Alfalfa in the Sacramento and Northern Delta using Sub-Surface Drip Irrigation” study at http://coststudies.ucdavis.edu.
The system utilizes a combination of well water and district water. Some growers include a tail water return system, which may increase water application efficiencies up to 85 percent. The flood irrigation system consists of underground lines with alfalfa valves. There is an 18-inch mainline (1,680 feet) with 10 or 12-inch alfalfa valves every 60-feet. During establishment, a sprinkler irrigation system is used in this study, which consists of pipes & risers, laterals lines, valve openers/bonnets and booster pumps owned by grower and shown under non-cash overhead. The permanent irrigation system consists of wells, pumps and buried mainline included in the land purchase price.
Land. Cropland with district water suitable for alfalfa production typically ranges in value among counties from $15,000 to $25,000 per acre. The land in this study is owned by the grower and cost $15,000 per acre. Small farms (50 acres and less) tend to have higher land costs than farms over 50 acres. Cropland with district water rents for $300 per acre and rents may vary according to value or type of crop planted.
Establishment Costs. Costs to establish the alfalfa stand are used to determine capital recovery expenses, depreciation, and interest on investment, during the production years. The establishment cost is the sum of cash costs for land preparation, planting, and cash overhead for establishing the alfalfa. The Total Cash Cost shown in Table 1 represents the establishment cost per acre. For this study, the cost is $966 per acre or $48,300 for the 50 acres. The alfalfa stand establishment cost is amortized over the 3-year stand life.
Equipment. Farm equipment is purchased new or used, but the study shows the current purchase price for new equipment. The new purchase price is adjusted to 60 percent to indicate a mix of new and used equipment. Equipment costs are composed of three parts: non-cash overhead, cash overhead, and operating costs. Both of the overhead factors have been discussed in previous sections. The operating costs consist of repairs, fuel, and lubrication and are discussed under operating costs.
Table Values. Due to rounding, the totals may be slightly different from the sum of the components.
2016 Alfalfa Costs and Returns Study (50 Acres) San Joaquin Valley South UC Cooperative Extension – Ag Issues Center 8
REFERENCES
American Society of Agricultural and Biological Engineers (ASABE). 2011 ASABE Standards Book with 2015 Standards Supplement. St. Joseph, MI: Curran Associates, Inc., 2015.
Boehlje, Michael D., and Vernon R. Eidman. Farm Management. New York: John Wiley and Sons, 1984.
California Chapter of the American Society of Farm Managers and Rural Appraisers. Trends in Agricultural Land & Lease Values. Woodbridge, CA: American Society of Farm Managers and Rural Appraisers, 2016.
"Hay Reports." Agricultural Marketing Service. Accessed April 1, 2016. https://www.ams.usda.gov/market-news/hay-reports.
"Identify and Manage Pests in Crops and Agriculture." University of California Statewide Integrated Pest Management Program. http://www.ipm.ucdavis.edu/PMG/crops-agriculture.html.
Long, Rachel, Michelle Leinfelder- Miles, Dan Putnam, Karen Klonsky, and Don Stewart. "2015 Sample Costs to Establish and Produce Alfalfa in the Sacramento Valley and Northern San Joaquin Valley - Flood Irrigation." Agricultural Issues Center, University of California Davis. Last modified 2015. http://coststudyfiles.ucdavis.edu.
Mueller, S. (1998). Determining the Value of Alfalfa Hay, Silage, or Green Chop. Agribusiness Dairyman, 17, 10-13.
"National Agricultural Statistics Service." United States Department of Agriculture. www.nass.usda.gov/Quick_Stats/.
Putnam, Dan. 2000. Calculations to Convert Tonnage of Moist Forage (green chop, silage, haylage, or wet hay) to Dry Hay Equivalents. Department of Agronomy & Range Science, University of California Davis, Davis, CA.
Putnam, Dan, Rachel Long, Michelle Leinfelder- Miles, Karen Klonsky, and Dan Stewart. "2014 Sample Costs to Establish and Produce Alfalfa in the Sacramento Valley and Northern Delta using Sub- Surface Drip Irrigation"." Agricultural Issues Center, University of California Davis. Last modified 2014. http://coststudyfiles.ucdavis.edu.
"Tax Rates for Motor Vehicle and Diesel Fuels." California State Board of Equalization. Last modified May 2015. http://www.boe.ca.gov/pdf/l413.pdf.
"U.S. Gasoline and Diesel Retail Prices." U.S. Energy Information Administration (EIA). Last modified January 2016. https://www.eia.gov/dnav/pet/pet_pri_gnd_dcus_nus_m.htm.
"Workers' Compensation Rate Comparison." California Department of Insurance. http://www.insurance.ca.gov/01-consumers/105-type/9-compare-prem/wc-rate/index.cfm
2016 Alfalfa Costs and Returns Study (50 Acres) San Joaquin Valley South UC Cooperative Extension – Ag Issues Center 9
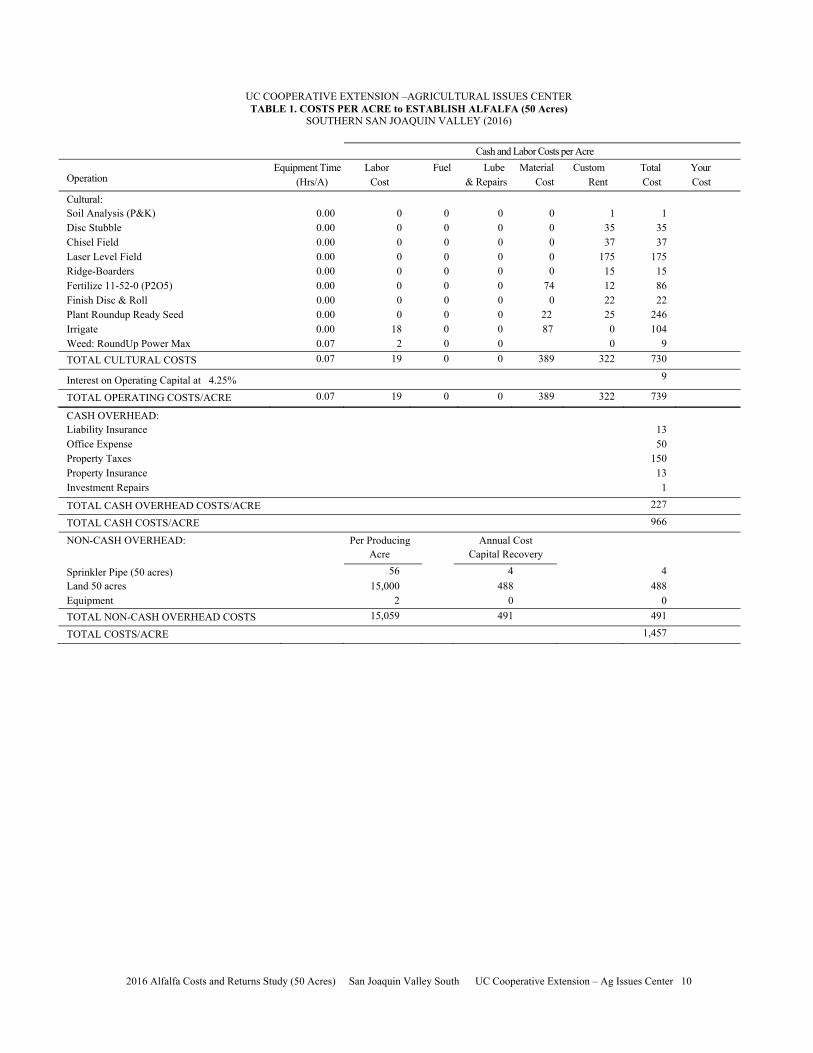
UC COOPERATIVE EXTENSION –AGRICULTURAL ISSUES CENTER TABLE 1. COSTS PER ACRE to ESTABLISH ALFALFA (50 Acres)
SOUTHERN SAN JOAQUIN VALLEY (2016)
Cash and Labor Costs per Acre
Operation Equipment Time
(Hrs/A) Labor
Cost Fuel Lube
& Repairs Material
Cost Custom
Rent Total Cost
Your Cost
Cultural: Soil Analysis (P&K) Disc Stubble
0.00 0.00
0 0
0 0
0 0
0 0
1 35
1 35
Chisel Field 0.00 0 0 0 0 37 37 Laser Level Field 0.00 0 0 0 0 175 175 Ridge-Boarders Fertilize 11-52-0 (P2O5) Finish Disc & Roll
0.00 0.00 0.00
0 0 0
0 0 0
0 0 0
0 74
0
15 12 22
15 86 22
Plant Roundup Ready Seed IrrigateWeed: RoundUp Power Max
0.00 0.00
0.07
0 18
2
0 0 0
0 0 0
22 87
25 0 0
246 104
9 TOTAL CULTURAL COSTS 0.07 19 0 0 389 322 730
Interest on Operating Capital at 4.25% TOTAL OPERATING COSTS/ACRE 0.07 19 0
9
0 389 322 739
CASH OVERHEAD: Liability Insurance 13 Office Expense 50 Property Taxes 150 Property Insurance 13 Investment Repairs 1
TOTAL CASH OVERHEAD COSTS/ACRE 227
TOTAL CASH COSTS/ACRE 966
NON-CASH OVERHEAD: Per Producing Annual Cost Acre Capital Recovery
Sprinkler Pipe (50 acres) 56 4 4 Land 50 acres 15,000 488 488 Equipment 2 0 0 TOTAL NON-CASH OVERHEAD COSTS 15,059 491 491
TOTAL COSTS/ACRE 1,457
2016 Alfalfa Costs and Returns Study (50 Acres) San Joaquin Valley South UC Cooperative Extension – Ag Issues Center 10
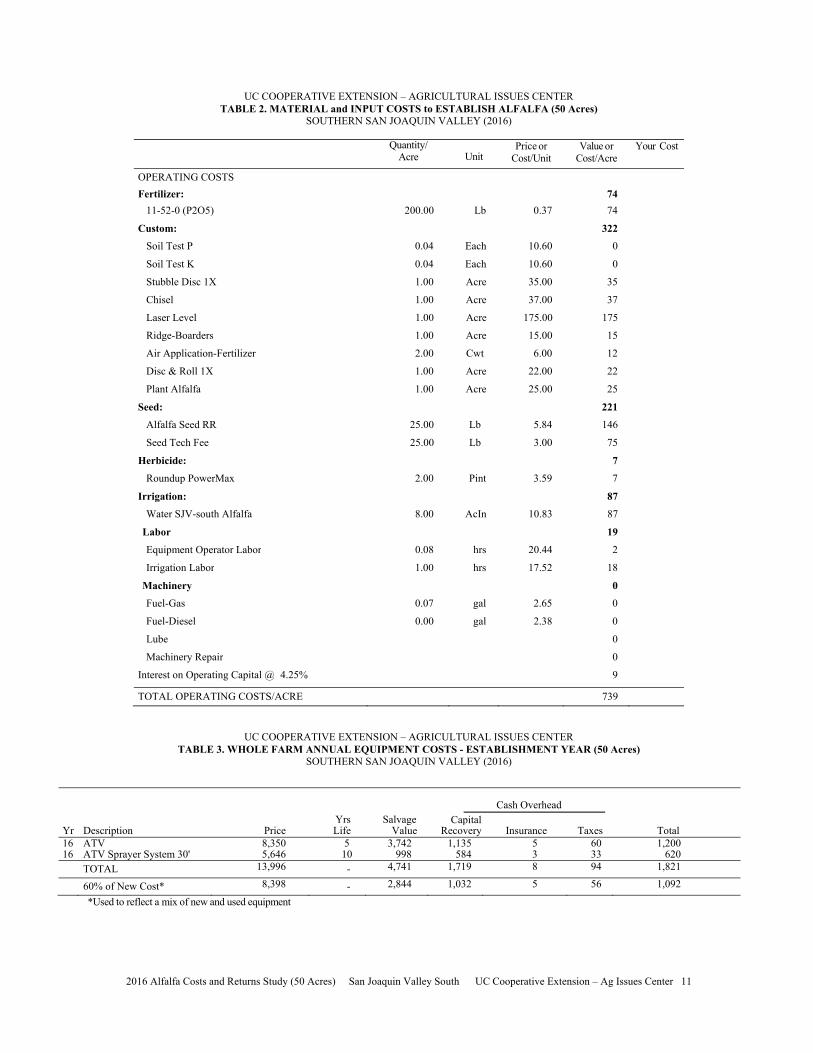
UC COOPERATIVE EXTENSION – AGRICULTURAL ISSUES CENTER TABLE 2. MATERIAL and INPUT COSTS to ESTABLISH ALFALFA (50 Acres)
SOUTHERN SAN JOAQUIN VALLEY (2016)
Quantity/ Acre Unit
Price or Cost/Unit
Value or Cost/Acre
Your Cost
OPERATING COSTS Fertilizer: 74
11-52-0 (P2O5)
Custom:
200.00 Lb 0.37 74
322 Soil Test P 0.04 Each 10.60 0
Soil Test K 0.04 Each 10.60 0
Stubble Disc 1X 1.00 Acre 35.00 35
Chisel 1.00 Acre 37.00 37
Laser Level 1.00 Acre 175.00 175
Ridge-Boarders
Air Application-Fertilizer
Disc & Roll 1X
1.00
2.00
1.00
Acre
Cwt
Acre
15.00
6.00
22.00
15
12
22
Plant Alfalfa 1.00 Acre 25.00 25
Seed: 221 Alfalfa Seed RR 25.00 Lb 5.84 146
Seed Tech Fee 25.00 Lb 3.00 75
Herbicide: 7
Roundup PowerMax
Irrigation:Water SJV-south Alfalfa
2.00
8.00
Pint
AcIn
3.59
10.83
7
87 87
Labor 19
Equipment Operator Labor
Irrigation Labor
Machinery Fuel-Gas
Fuel-Diesel
Lube
0.08
1.00
0.07
0.00
hrs
hrs
gal
gal
20.44
17.52
2.65
2.38
2
18
0 0
0
0
Machinery Repair
Interest on Operating Capital @ 4.25%
0
9
TOTAL OPERATING COSTS/ACRE 739
UC COOPERATIVE EXTENSION – AGRICULTURAL ISSUES CENTER TABLE 3. WHOLE FARM ANNUAL EQUIPMENT COSTS - ESTABLISHMENT YEAR (50 Acres)
SOUTHERN SAN JOAQUIN VALLEY (2016)
Cash Overhead Yrs Salvage Capital
Yr Description Price Life Value Recovery Insurance Taxes Total 16 ATV 8,350 5 3,742 1,135 5 60 1,200 16 ATV Sprayer System 30' 5,646 10 998 584 3 33 620
TOTAL 13,996 - 4,741 1,719 8 94 1,821
60% of New Cost* 8,398 - 2,844 1,032 5 56 1,092
*Used to reflect a mix of new and used equipment
2016 Alfalfa Costs and Returns Study (50 Acres) San Joaquin Valley South UC Cooperative Extension – Ag Issues Center 11

UC COOPERATIVE EXTENSION – AGRICULTURAL ISSUES CENTER TABLE 4. COSTS PER ACRE to PRODUCE ALFALFA (50 Acres)
SOUTHERN SAN JOAQUIN VALLEY (2016)
Cash & Labor Costs per Acre
Operation Equipment
Time (Hrs/A) Labor Cost Fuel Lube
& Repairs Material
Cost Custom
Rent Total Cost
Your Cost
Cultural: Weed: Roundup PowerMax (2x) 0.14 4 0 0 14 0 18 Make Semi-Permanent Drains 0.00 0 0 0 0 12 12 Insect: Aphid/Weevil (Warrior II) 0.07 2 0 0 8 0 10 Irrigate - 10X Flood Irrigation 0.00 32 0 0 693 0 725 Insect: Worms (Coragen) 0.07 2 0 0 29 0 31 Tissue Sample (P&K) Analysis 0.00 0 0 0 0 1 1 Fertilize (11-52-0) 0.00 0 0 0 74 12 86 Weeds: Chateau & Prowl H2O 0.07 2 0 0 63 0 65 Weeds: Gramoxone 0.00 0 0 0 11 0 11 Pickup Truck 1/2 Ton 0.12 3 1 0 0 0 4 ATV 0.12 3 0 0 0 0 3 TOTAL CULTURAL COSTS 0.56 45 2 1 893 25 966
Harvest: Harvest – 9x (Custom harvest) 0.00 0 0 0 0 463 463 TOTAL HARVEST COSTS 0.00 0 0 0 0 463 463
Interest on Operating Capital at 5.75% 12
TOTAL OPERATING COSTS/ACRE 0.56 45 2 1 893 488 1,441
CASH OVERHEAD: Liability Insurance 13 Office Expense 50 Property Taxes 159 Property Insurance 13 Investment Repairs 12
TOTAL CASH OVERHEAD COSTS/ACRE 246
TOTAL CASH COSTS/ACRE 1,687
NON-CASH OVERHEAD: Per Producing Annual Cost Acre Capital Recovery
Establishment 50 acres 966 343 343 Irrigation System for 50 acres 582 38 38 Land 50ac 15,000 488 488 Equipment 19 2 2 TOTAL NON-CASH OVERHEAD COSTS 16,566 871 871
TOTAL COSTS/ACRE 2,557
2016 Alfalfa Costs and Returns Study (50 Acres) San Joaquin Valley South UC Cooperative Extension – Ag Issues Center 12
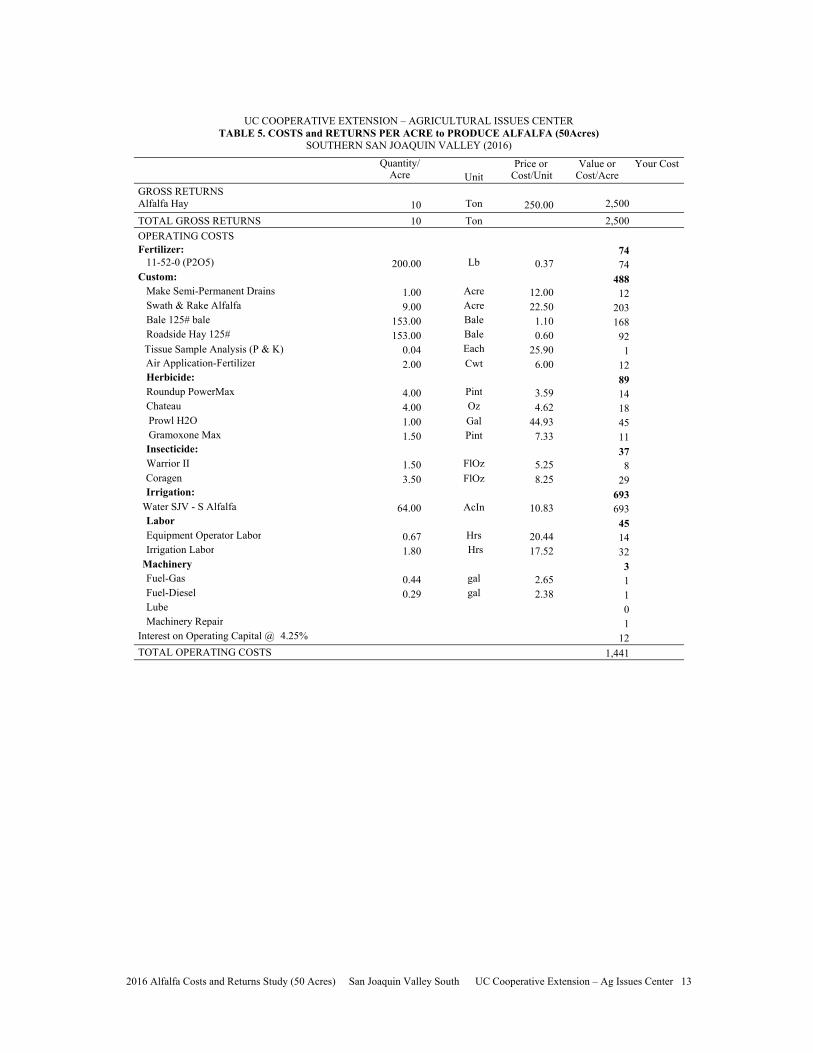
UC COOPERATIVE EXTENSION – AGRICULTURAL ISSUES CENTER TABLE 5. COSTS and RETURNS PER ACRE to PRODUCE ALFALFA (50Acres)
SOUTHERN SAN JOAQUIN VALLEY (2016)
Quantity/ Acre Unit
Price or Cost/Unit
Value or Cost/Acre
Your Cost
GROSS RETURNS Alfalfa Hay 10 Ton 250.00 2,500 TOTAL GROSS RETURNS 10 Ton 2,500 OPERATING COSTS Fertilizer: 74
11-52-0 (P2O5) 200.00 Lb 0.37 74 Custom: 488
Make Semi-Permanent Drains 1.00 Acre 12.00 12 Swath & Rake Alfalfa 9.00 Acre 22.50 203 Bale 125# bale 153.00 Bale 1.10 168 Roadside Hay 125# 153.00 Bale 0.60 92 Tissue Sample Analysis (P & K) 0.04 Each 25.90 1
Air Application-Fertilizer 2.00 Cwt 6.00 12 Herbicide: 89 Roundup PowerMax 4.00 Pint 3.59 14 Chateau 4.00 Oz 4.62 18
Prowl H2O 1.00 Gal 44.93 45 Gramoxone Max 1.50 Pint 7.33 11 Insecticide: 37 Warrior II 1.50 FlOz 5.25 8
Coragen 3.50 FlOz 8.25 29 Irrigation: 693
Water SJV - S Alfalfa 64.00 AcIn 10.83 693 Labor 45 Equipment Operator Labor 0.67 Hrs 20.44 14 Irrigation Labor 1.80 Hrs 17.52 32
Machinery 3 Fuel-Gas 0.44 gal 2.65 1 Fuel-Diesel 0.29 gal 2.38 1 Lube 0 Machinery Repair 1
Interest on Operating Capital @ 4.25% 12 TOTAL OPERATING COSTS 1,441
2016 Alfalfa Costs and Returns Study (50 Acres) San Joaquin Valley South UC Cooperative Extension – Ag Issues Center 13
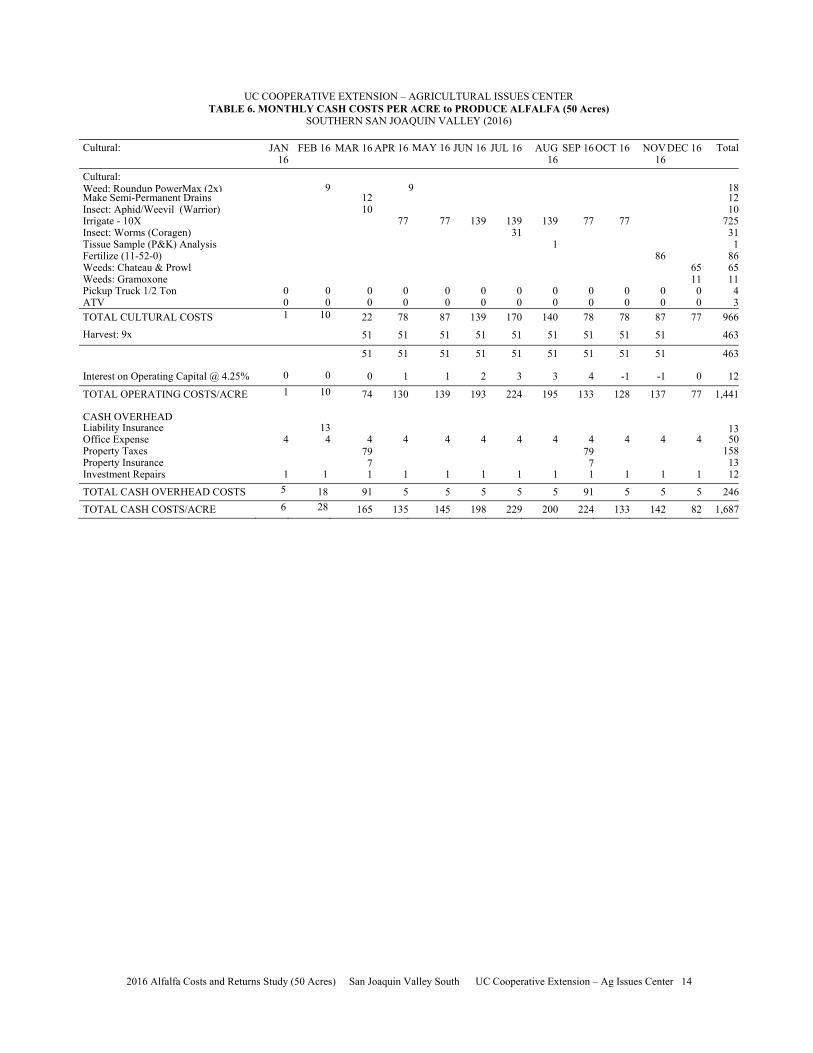
UC COOPERATIVE EXTENSION – AGRICULTURAL ISSUES CENTER TABLE 6. MONTHLY CASH COSTS PER ACRE to PRODUCE ALFALFA (50 Acres)
SOUTHERN SAN JOAQUIN VALLEY (2016)
Cultural: JAN FEB 16 MAR 16 APR 16 MAY 16 JUN 16 JUL 16 AUG SEP 16 OCT 16 NOV DEC 16 Total 16 16 16
Cultural: Weed: Roundup PowerMax (2x) Make Semi-Permanent Drains Insect: Aphid/Weevil (Warrior) Irrigate - 10X Insect: Worms (Coragen) Tissue Sample (P&K) Analysis Fertilize (11-52-0) Weeds: Chateau & Prowl Weeds: Gramoxone Pickup Truck 1/2 Ton ATV
0 0
9
0 0
12 10
0 0
9
77
0 0
77
0 0
139
0 0
139 31
0 0
139
1
0 0
77
0 0
77
0 0
86
0 0
65 11 0 0
18 12 10
725 31 1
86 65 11 4 3
TOTAL CULTURAL COSTS 1 10 22 78 87 139 170 140 78 78 87 77 966 Harvest: 9x 51 51 51 51 51 51 51 51 51 463
51 51 51 51 51 51 51 51 51 463
Interest on Operating Capital @ 4.25% 0 0 0 1 1 2 3 3 4 -1 -1 0 12
TOTAL OPERATING COSTS/ACRE 1 10 74 130 139 193 224 195 133 128 137 77 1,441
CASH OVERHEAD Liability InsuranceOffice Expense Property Taxes Property Insurance Investment Repairs
4
1
13 4
1
4 79 7 1
4
1
4
1
4
1
4
1
4
1
4 79 7 1
4
1
4
1
4
1
13 50
158 13 12
TOTAL CASH OVERHEAD COSTS 5 18 91 5 5 5 5 5 91 5 5 5 246 TOTAL CASH COSTS/ACRE 6 28 165 135 145 198 229 200 224 133 142 82 1,687
2016 Alfalfa Costs and Returns Study (50 Acres) San Joaquin Valley South UC Cooperative Extension – Ag Issues Center 14

UC COOPERATIVE EXTENSION – AGRICULTURAL ISSUES CENTER TABLE 7. RANGING ANALYSIS ALFALFA (50Acres)
SOUTHERN SAN JOAQUIN VALLEY (2016)
COSTS PER ACRE AND PER TON AT VARYING YIELDS TO PRODUCE ALFALFA
YIELD (TONS)
7.00 7.50 8.00 8.50 9.00 9.50 10.00 OPERATING COSTS/ACRE: CulturalHarvestInterest on Operating Capital @ 4.25% TOTAL OPERATING COSTS/ACRE TOTAL OPERATING COSTS/TON CASH OVERHEAD COSTS/ACRE TOTAL CASH COSTS/ACRE TOTAL CASH COSTS/TON NON-CASH OVERHEAD COSTS/ACRE TOTAL COSTS/ACRE TOTAL COSTS/TON
966 463
12 1,441
205.81 246
1,687 240.93
871 2,557
365.34
966463
12 1,441
192.09 246
1,687 224.87
871 2,557
340.99
966463 12
1,441 180.08
246 1,687
210.82 871
2,557 319.67
966463
12 1,441
169.49 246
1,687 198.41
871 2,557
300.87
966463
12 1,441
160.07 246
1,687 187.39
871 2,557
284.15
966463
12 1,441
151.65 246
1,687 177.53
871 2,557
269.20
966 463 12
1,441 144.07
246 1,687
168.65 871
2,557 255.74
Net Return Per Acre Above Operating Costs For Alfalfa
PRICE ($/ton) YIELD (Tons/acre)
Alfalfa Hay 200.00 220.00 240.00 250.00 270.00 290.00 310.00
7.00 -41 99
239 309 449 589 729
7.50 59
209359434584734884
8.00 159 319 479 559 719 879
1,039
8.50 259 429 599 684 854
1,024 1,194
9.00 359 539 719 809 989
1,169 1,349
9.50459 649 839 934
1,124 1,314 1,504
10.00 559 759 959
1,059 1,259 1,459 1,659
Net Return Per Acre Above Cash Costs For Alfalfa (300 Acres)
PRICE ($/ton) YIELD (Tons/acre)
Alfalfa Hay 200.00 220.00 240.00 250.00 270.00 290.00 310.00
7.00 -287 -147
-7 63
203343483
7.50 -187 -37 113 188 338 488 638
8.00 -87 73
233 313 473 633 793
8.50 13
183 353 438 608 778 948
9.00 113 293 473 563 743 923
1,103
9.50213 403 593 688 878
1,068 1,258
10.00 313 513 713 813
1,013 1,213 1,413
Net Return per Acre above Total Costs for Alfalfa (300 Acres)
PRICE ($/ton) YIELD (Tons/acre)
Alfalfa Hay 200.00 220.00 240.00 250.00 270.00 290.00 310.00
7.00 -1,157-1,017
-877 -807 -667 -527 -387
7.50 -1,057
-907 -757 -682 -532 -382 -232
8.00 -957 -797 -637 -557 -397 -237
-77
8.50 -857 -687 -517 -432 -262
-92 78
9.00 -757 -577 -397 -307 -127
53 233
9.50-657 -467 -277 -182
8 198 388
10.00 -557 -357 -157 -57 143 343 543
2016 Alfalfa Costs and Returns Study (50 Acres) San Joaquin Valley South UC Cooperative Extension – Ag Issues Center 15
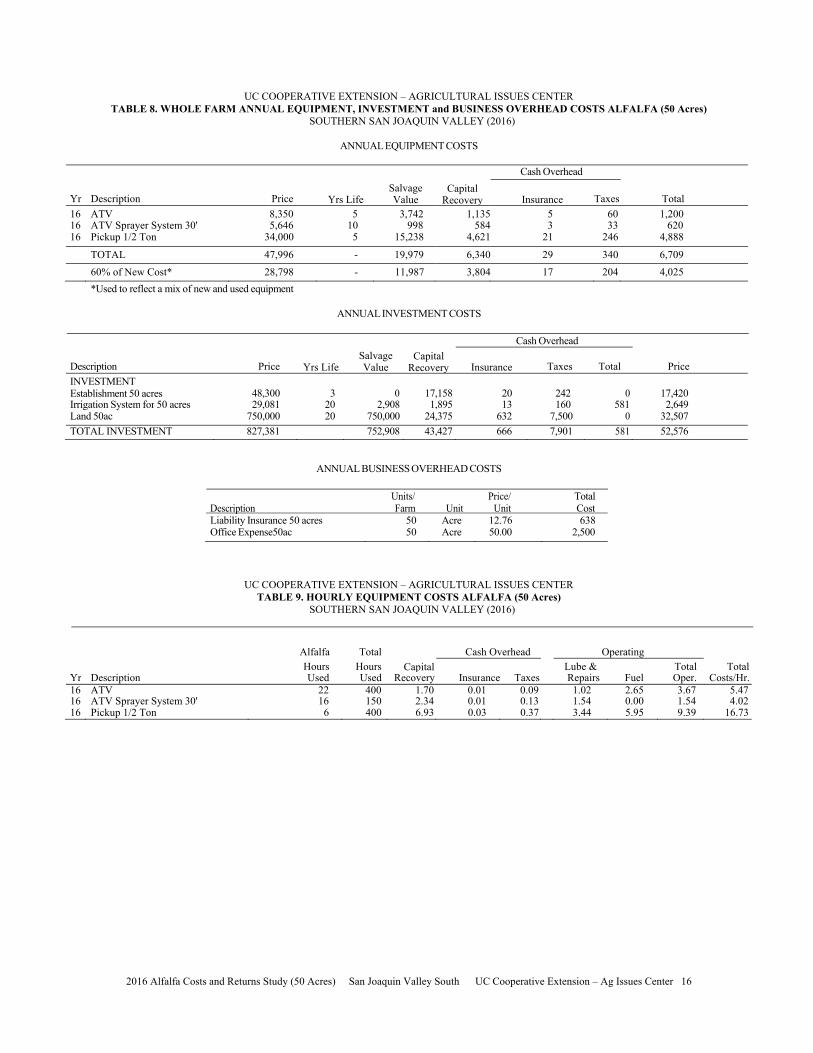
UC COOPERATIVE EXTENSION – AGRICULTURAL ISSUES CENTER TABLE 8. WHOLE FARM ANNUAL EQUIPMENT, INVESTMENT and BUSINESS OVERHEAD COSTS ALFALFA (50 Acres)
SOUTHERN SAN JOAQUIN VALLEY (2016)
ANNUAL EQUIPMENT COSTS
Cash Overhead
Yr 1616 16
Description ATV
ATV Sprayer System 30' Pickup 1/2 Ton
Price 8,350 5,646
34,000
Yrs Life 5
10 5
Salvage Value
3,742 998
15,238
Capital Recovery
1,135 584
4,621
Insurance 5 3
21
Taxes 60 33
246
Total 1,200
620 4,888
TOTAL 47,996 - 19,979 6,340 29 340 6,709 60% of New Cost* 28,798 - 11,987 3,804 17 204 4,025 *Used to reflect a mix of new and used equipment
ANNUAL INVESTMENT COSTS
Cash Overhead
Description Price Yrs Life Salvage Value
Capital Recovery Insurance Taxes Total Price
INVESTMENT Establishment 50 acres Irrigation System for 50 acres Land 50ac
48,300 29,081
750,000
3 20 20
0 2,908
750,000
17,158 1,895
24,375
20 13
632
242 160
7,500
0 581
0
17,420 2,649
32,507 TOTAL INVESTMENT 827,381 752,908 43,427 666 7,901 581 52,576
ANNUAL BUSINESS OVERHEAD COSTS
Units/ Price/ Total Description Farm Unit Unit Cost Liability Insurance 50 acres Office Expense50ac
50 50
Acre Acre
12.76 50.00
638 2,500
UC COOPERATIVE EXTENSION – AGRICULTURAL ISSUES CENTER TABLE 9. HOURLY EQUIPMENT COSTS ALFALFA (50 Acres)
SOUTHERN SAN JOAQUIN VALLEY (2016)
Alfalfa Total Cash Overhead Operating Hours Hours Capital Lube & Total Total
Yr Description Used Used Recovery Insurance Taxes Repairs Fuel Oper. Costs/Hr. 16 ATV 22 400 1.70 0.01 0.09 1.02 2.65 3.67 5.47 16 ATV Sprayer System 30' 16 150 2.34 0.01 0.13 1.54 0.00 1.54 4.02 16 Pickup 1/2 Ton 6 400 6.93 0.03 0.37 3.44 5.95 9.39 16.73
2016 Alfalfa Costs and Returns Study (50 Acres) San Joaquin Valley South UC Cooperative Extension – Ag Issues Center 16
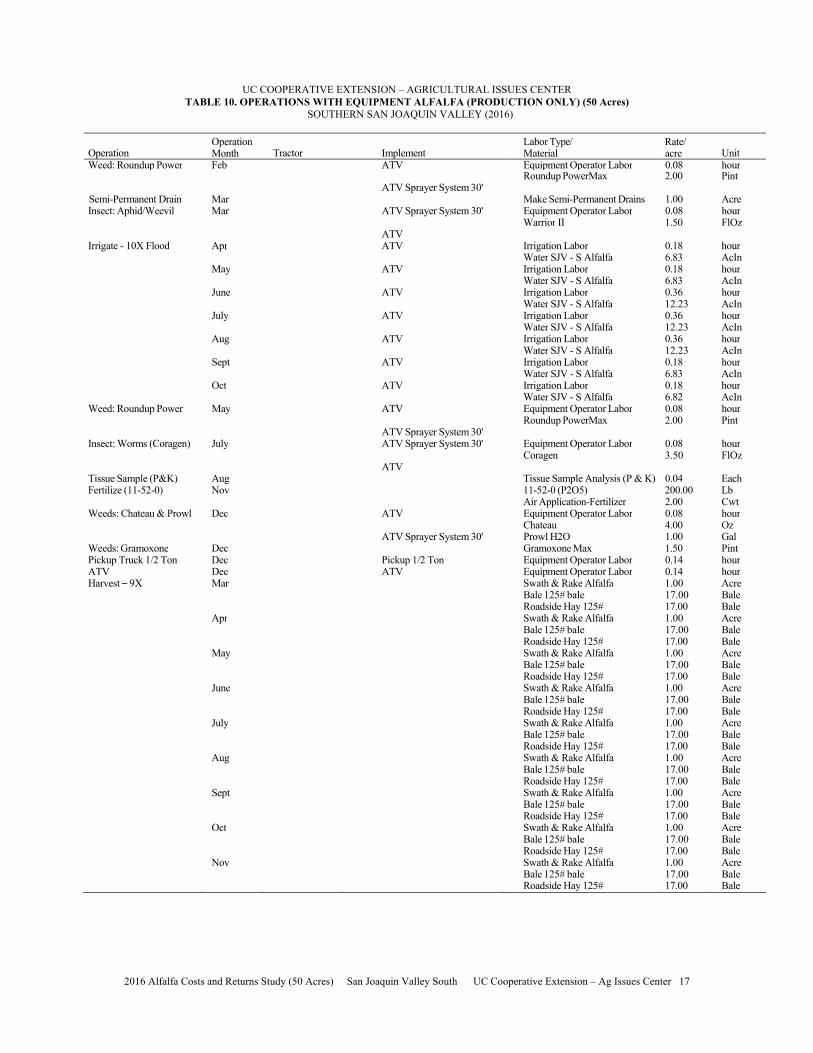
UC COOPERATIVE EXTENSION – AGRICULTURAL ISSUES CENTER TABLE 10. OPERATIONS WITH EQUIPMENT ALFALFA (PRODUCTION ONLY) (50 Acres)
SOUTHERN SAN JOAQUIN VALLEY (2016)
Operation Operation Month Tractor Implement
Labor Type/ Material
Rate/ acre Unit
Weed: Roundup Power Feb ATV Equipment Operator Labor 0.08 hour
Semi-Permanent Drain Mar ATV Sprayer System 30'
Roundup PowerMax
Make Semi-Permanent Drains
2.00
1.00
Pint
Acre Insect: Aphid/Weevil Mar ATV Sprayer System 30' Equipment Operator Labor
Warrior II 0.08
1.50 hour FlOz
ATV Irrigate - 10X Flood Apr ATV Irrigation Labor
Water SJV - S Alfalfa 0.18
6.83 hour AcIn
May ATV Irrigation LaborWater SJV - S Alfalfa
0.18 6.83
hour AcIn
June ATV Irrigation LaborWater SJV - S Alfalfa
0.36 12.23
hour AcIn
July ATV Irrigation LaborWater SJV - S Alfalfa
0.36 12.23
hour AcIn
Aug ATV Irrigation LaborWater SJV - S Alfalfa
0.36 12.23
hour AcIn
Sept ATV Irrigation LaborWater SJV - S Alfalfa
0.18 6.83
hour AcIn
Oct ATV Irrigation LaborWater SJV - S Alfalfa
0.18 6.82
hour AcIn
Weed: Roundup Power
Insect: Worms (Coragen)
May
July
ATV
ATV Sprayer System 30' ATV Sprayer System 30'
ATV
Equipment Operator LaborRoundup PowerMax
Equipment Operator LaborCoragen
0.08 2.00
0.08 3.50
hour Pint
hour FlOz
Tissue Sample (P&K) Fertilize (11-52-0)
Weeds: Chateau & Prowl
Aug Nov
Dec ATV
Tissue Sample Analysis (P & K) 11-52-0 (P2O5)Air Application-FertilizerEquipment Operator LaborChateau
0.04 200.00
2.00 0.08
4.00
Each Lb Cwt hour Oz
Weeds: Gramoxone Dec ATV Sprayer System 30' Prowl H2O
Gramoxone Max 1.00 1.50
Gal Pint
Pickup Truck 1/2 Ton ATVHarvest – 9X
Dec Dec
Mar
Pickup 1/2 Ton ATV
Equipment Operator LaborEquipment Operator LaborSwath & Rake Alfalfa
0.14 0.14
1.00
hour hour Acre
Bale 125# bale 17.00 Bale Roadside Hay 125# 17.00 Bale
Apr Swath & Rake Alfalfa Bale 125# bale
1.00 17.00
Acre Bale
Roadside Hay 125# 17.00 Bale May Swath & Rake Alfalfa 1.00 Acre
Bale 125# bale 17.00 Bale Roadside Hay 125# 17.00 Bale
June Swath & Rake Alfalfa 1.00 Acre Bale 125# bale 17.00 Bale Roadside Hay 125# 17.00 Bale
July Swath & Rake Alfalfa 1.00 Acre Bale 125# bale 17.00 Bale Roadside Hay 125# 17.00 Bale
Aug Swath & Rake Alfalfa Bale 125# bale
1.00 17.00
Acre Bale
Roadside Hay 125# 17.00 Bale Sept Swath & Rake Alfalfa
Bale 125# bale 1.00 17.00
Acre Bale
Roadside Hay 125# 17.00 Bale Oct Swath & Rake Alfalfa 1.00 Acre
Bale 125# bale 17.00 Bale Roadside Hay 125# 17.00 Bale
Nov Swath & Rake Alfalfa 1.00 Acre Bale 125# bale 17.00 Bale Roadside Hay 125# 17.00 Bale
2016 Alfalfa Costs and Returns Study (50 Acres) San Joaquin Valley South UC Cooperative Extension – Ag Issues Center 17