Embed Size (px)
Citation preview
UNIVERSITY OF CALIFORNIA COOPERATIVE EXTENSION
2014
SAMPLE COSTS TO PRODUCE PROCESSING
APPLES Various Varieties
CENTRAL COAST ndash SANTA CRUZ COUNTY Freedom Region-Pajaro Valley
Karen M Klonsky
Don Stewart
UCCE Extension Specialist Department of Agriculture and Resource Economics UC Davis Staff Research Associate Department of Agriculture and Resource Economics UC Davis
UNIVERSITY OF CALIFORNIA COOPERATIVE EXTENSION
SAMPLE COSTS TO PRODUCE PROCESSING APPLES
Various Varieties
Central Coast-Freedom Region-Pajaro Valley Santa Cruz County 2014
CONTENTS
INTRODUCTION 2 ASSUMPTIONS 3 Cultural Practices and Material Inputs 3 Cash Overhead 7 Non-Cash Overhead 8 REFERENCES 10 TABLE 1 Costs per Acre to Produce Processing Apples 11 TABLE 2 Costs and Returns per Acre to Produce Processing Apples 13 TABLE 3 Monthly Cash Costs per Acre to Produce Processing Apples 15 TABLE 4 Ranging Analysis-Processing Apples 16 TABLE 5 Whole Farm Annual Equipment Investment amp Business Overhead Costs 18 TABLE 6 Hourly Equipment Costs 19 TABLE 7 Operations with Equipment amp Materials 20
INTRODUCTION
Sample costs to produce processing apples in the Freedom Region of the Pajaro Valley in Santa Cruz County are presented in this study The study is intended as a guide only and can be used to make production decisions determine potential returns prepare budgets and evaluate production loans The practices described are based on production procedures considered typical for this crop and area and will not apply to every farm Sample costs for labor materials equipment and custom services are based on current figures A blank column Your Cost is provided to enter your costs on Tables 1 and 2
The hypothetical farm operations production practices overhead and calculations are described under the assumptions For additional information or an explanation of the calculations used in the study contact Karen Klonsky in the Department of Agricultural and Resource Economics University of California Davis (530) 752-3563 or klonskyprimalucdavisedu An additional cost of production study for processing apples grown in this region is also available (ldquoSample Costs to Produce Organic Apples for Processing Central Coast-Freedom Region-Pajaro Valley Santa Cruz County - 2014rdquo) The major differences between the two companion studies are in fertilizer pest control yield and price received for the crop
Sample Cost of Production Studies for many commodities are available at httpcoststudiesucdavisedu The University of California does not discriminate in any of its policies procedures or practices The University is an affirmative actionequal opportunity employer
2014 Processing13 Apple Costs amp Returns Freedom Region-shy‐Pajaro Valley13 Santa Cruz County13 UC Cooperative Extension 2
ASSUMPTIONS
The following assumptions refer to Tables 1 to 7 and pertain to sample costs to produce processing apples in the Freedom Region of Santa Cruz County The cultural practices described and materials used are considered typical for apple production in the region The costs practices and materials will not be applicable to all situations or every production year Cultural practices materials and production costs vary by grower and region and differences can be significant The practices and inputs used in the cost study serve as a guide only The use of trade names and cultural practices in this report does not constitute an endorsement or recommendation by the University of California nor is any criticism implied by omission of other similar products or cultural practices
Land The orchard is located in the Freedom Region of Santa Cruz County The farm is comprised of 100 acres 20 acres planted to apples in full production The other 75 acres are planted with apples cane berries strawberries and vegetables with 5 acres occupied by roads irrigation systems and farmstead Land values in this region for an established apple orchard are based on historic sales and valued at $20000 per acre There are no establishment costs included in this study
Cultural Practices and Material Inputs
Trees No specific variety is chosen for this study Varieties grown in this region are pippin red delicious Fuji pink lady and many heirloom varieties Apples in this area are harvested from September to early November with hand crews there is no mechanical harvesting The life of the orchard in this study is assumed to be 25 years
Planting The trees are planted on a 10 x 16 foot spacing (tree x row) with 272 trees per acre on normalstandard rootstocks Rootstocks are important part of the orchard establishment (Different rootstocks standard vs dwarf can affect the size and growth of the tree throughout the life of the tree) In the second year 5 or 14 trees per acre are replanted for those lost in the first year In the following years trees are replanted as needed when lost to disease mechanicalenvironmental injury and age
TrainingPruningThinning Training is the manipulation (tie down) of branches to develop the tree structure during the establishment years
Hand pruning of the establishedproducing trees is done in the winter months (December to February) to allow light into the tree canopy for fruit wood production and to remove shoots affected with disease and overwintering fire blight cankers Prunings are placed in the row middles and mulched with a flail mower and eventually disced into the soil Severely diseased prunings are carried out of the orchard and burned Minimal summer pruning (July) is done to remove disease insect mechanically or weather damaged wood Summer pruning is also used to keep the inner tree canopy open and producing fruit wood There are several pruning strategies for apple trees central perpendicular V and open vase systems Choice of pruning is dependent on several factors such as the use of size controlling rootstocks varieties susceptible to sunburn and high density plantings
Apples are thinned by hand usually in June or July to increase fruit size removal of poor quality fruit reduce areas of pest habitat around fruit clusters protection against limb breakage and to combat alternate bearing in some varieties Fuji and pippin normally require thinning for a more consistent and uniform yield Apples for processing may not be thinned The increase in cultural costs is not necessarily beneficial from an economic perspective Thinning costs are incorporated into this study at 50 of total costs to thin an acre
2014 Processing13 Apple Costs amp Returns Freedom Region-shy‐Pajaro Valley13 Santa Cruz County13 UC Cooperative Extension 3
Fertilization Soil samples taken in the fall after harvest can help in nutrient management and to amend soil Ph Ammonium sulfate (NH4SO4) is the main nitrogen source The fertilizer is broadcast to the orchard floor in two applications for a total of 125 lbs N per acre Solubor (boron fertilizer) is sometimes strip sprayed onto the soil in the spring before a rainfall event Mora-Leaf Plus (20-20-20) at 10 lbs per acre is foliar applied post bloom to coincide with pesticide applications This fertilizer contains micronutrients boron copper iron manganese molybdenum and zinc Calcium sprays are used periodically in some orchards to boost calcium levels if there is a known deficiency Leaf sample analysis are taken only when there is evidence of a deficiency problem The row middles are allowed to grow during winter months and managed as a cover crop which also harbors beneficial insects shades noxious weeds and is a nutrient source by mowing and discing the biomass into the soil Foliar nutrient applications can be timed and tank mixed with pesticide applications to decrease the number of passes through the orchard
Irrigation The pump metering system main lines five horsepower booster pump filtration station and micro sprinkler system was installed prior to planting The irrigation system is considered an improvement to the property and has a 25 year lifespan Those costs are included in the establishment costs which is not included in this study
The orchard is irrigated 1 or 2 times per growing season (July-September) with micro sprinkler emitters located between every fourth tree in row 3 to 4 inches of water is applied every irrigation which helps increase the size of the fruit Irrigation is not normally required during the spring due the amount of rainfall and fog After each irrigation the orchard floor is mowed disced and rolledsmoothed The Pajaro Water Management Agency monitors the wells and amounts of water pumped Water costs are $172acre foot ($1433acre inch) plus $13acre foot ($110acre inch) pumping costs Some orchards are dry-farmed (not irrigated) These are older orchards on normal root stocks for processing
Pest Management For pest identification monitoring management and pesticide information visit the UC IPM website at wwwipmucdavisedu Written recommendations are required for many commercially applied pesticides and are available from licensed pest control advisers (PCAs) For information on pesticide use permits contact the local county Agricultural Commissionerrsquos office Pesticides mentioned in this study are used to calculate rates and costs Although the pesticides mentioned are commonly used by growers many other pesticides are available Adjuvants are recommended for use with many pesticides for effective control but the adjuvants and their costs are not included in this study Pesticide costs may vary by location brand and grower volume Pesticide costs in this study are taken from a single dealer and shown as full retail
Orchard sanitation pest identification monitoring and prevention are essential elements of successful apple production Also timing of material applications is critical for effective insect and disease control in apples Apple growers in this region rarely augment the populations of beneficial insects with release of purchased insects Parasitic wasps and predaceous arthropods including spiders lacewings and lady beetles can lessen overall pest damage within orchards and should be encouraged to proliferate by providing appropriate habitat and avoiding detrimental insect and oil sprays whenever possible
Weeds Using a tractor and flail mower the grower mows the middles First mowing is in late Mayearly June of the winter biomass (cover crop) The cover crop in then disced into the soil Mowing and discing occurs after every irrigation to incorporate the biomass and conserve moisture The tree rows are stripped sprayed with a tractor and pull-type ground spray rig In the winter when the trees are dormant glyphosate (Roundup) is tank mixed with oxyfluorfen (Goal Tender) and strip sprayed The tree rows are again sprayed in the summer with a tank mix of saflufenacil (Treevix) and Carfentrazone (Shark)
2014 Processing13 Apple Costs amp Returns Freedom Region-shy‐Pajaro Valley13 Santa Cruz County13 UC Cooperative Extension 4
Diseases The main diseases affecting apples grown in this region are apple scab (Venturia inaequalis) and powdery mildew (Podosphaera leucotricha) The number of treatments required each year will depend on the annual rainfall and foggy conditions which are conducive to scab and mildew development A very rainy season may require multiple scabmildew sprays but at least three sprays per season are anticipated using an air blast sprayer Control begins at green tip with a tank mix of delayed dormant oil and myclobutanil (Rally 40 WSP) Followed with a second spray of golden micronized sulfur tank mixed with fluopyramtrifloxystrobin (Luna-Tranquility) at pink bud At post bloom a third application to the orchard of cyprodinil (Vangard WG) is tank mixed with triple 20 fertilizer Different materials are used in rotation to prevent fungicide resistance development Fire blight (Erwinia amylovora) bacterial disease is of low concern on apples in this area Mowing and discing prunings into the soil helps to combating the over wintering pathogens Early sprays for mildew and scab can have a detrimental effect on these pathogens also Fuji apples are especially susceptible to blight and may require additional control
Insects Dormant oils are sprayed during the winter months to aid in control of various overwintering pests such as aphids leaf rollers mites and scale insects A delayed dormant oil spray at green tip for disease control also aids in control of overwintering insects The oils are used to smother eggs larvae and increase adult mortality In general dormant oil sprays are not harmful to beneficial insects However if oils are used in the warmer spring and summer months when insect activity increases beneficial insects within the orchard can be killed if sprayed directly
Codling moth (Cydia pomonella) is the key insect pest requiring management Trapping and monitoring is critical In this study we assume a relatively low codling moth population requiring 2 hangings at half the recommended rate of pheromone-based mating disruptor traps per year (a species-specific female sex odor) The traps last about 120 days depending on weather and the number of traps per acre will vary depending on the orchard crop history insect pressure and grower experience First hanging is in April with a second hanging in July which should last through September harvest One pesticide application of chlorantraniliprole (Alticor) is applied in late May or early June for codling moths Typically the longer an orchard has been using mating disruption the lower the codling moth population and need for additional supplemental treatments
Apple skin worm complex-Leafroller insects also require control Apple pandemis (Pandemis pyrusana) and orange tortix (Argyrotaenia citrana) are two insects that cause damage The apple pandemis overwintering larvae feed on the surface of young fruit during and just after bloom causing fruit to drop become scarred and distorted The orange tortix overwintering larvae feed on alternate hosts and usually does not appear in apple trees until June when eggs from the first summer generation are laid Primarily a leaf feeder its greatest damage is to the fruit Both insects and other leafrollers feed on the surface of the leaves and fruit The application of Alticor for codling moth can also control these insects An application of Bacterium Bacillus thuringiensis (Bt) is also used to control these pests The Bt must be ingested to be effective Timing of sprays is critical and must be applied during or soon after egg hatch and is most effective during the warm dry weather when larvae are actively feeding These applications can have a detrimental effect on codling moth as well Early sprays for mildew and scab can have a detrimental effect on insects also
Snails Snails can be a significant pest in apple orchards in certain areas with high moisture or standing water and years with above average rainfall or fog Sluggo snail bait is applied around the base of the trees or broadcast with a mechanical spreader The bait is only used in areas of high infestation 20 lbs of bait per
2014 Processing13 Apple Costs amp Returns Freedom Region-shy‐Pajaro Valley13 Santa Cruz County13 UC Cooperative Extension 5
acre costs are included in this study Some growers use hand crews to remove the snails from the trees this operation is not included in this study
Vertebrates Gophers are controlled in the spring or early summer and again in the fall after harvest Bait is applied sub-surface with a tractor and 3-point attached bait applicator The applicator is pulled through the orchard between the tree rows with the shank at a depth that will get the bait into the gopher tunnels Applications are to areas of the orchard with gopher activity Deer can also be a significant pest in apples in this area no control is included in this study
Pollination Apples require bees for pollination Central coast growers contract to bring hives into their orchards on an annual basis One hive per acre at $50 per hive is charged for this study This practice improves pollination rates increasing fruit set and in turn increases yields Also cross pollinating varieties are interplanted at the time of orchard establishment to insure adequate pollination Some growers have their own bee hives that they use in their orchards and some rent bee hives to their neighbors
Frost protection The average minimum temperature for January and February (2012-2014) from CIMIS Station Pajaro-Monterey Bay Station 129 is 39`F No frost protection charges are in this study
Propping-tying branches Propping or tying of branches with heavy fruit load is common in this region and done in June andor July to support fruit load and decrease limb breakage Younger trees require more propping than the older trees with stronger branches Properly trained and pruned trees require less propping Tying and propping charges are $78 per acre for labor The cost of propping boards is under cash overhead
Harvest Harvest begins in mid-September and goes through early November depending on variety Harvest crews use ladders to hand pick fruit from the trees which is put into harvest bags and then dumped into field bins Tractors with attachments on both the front loader and rear 3-point hitch pick up the filled bins move them from the orchard to a staging area A forklift places the bins on a flatbed truck and the grower hauls the fruit to the processor Grower pays hauling costs which is normally a short distance in this area The harvest and hauling costs for this study are $50ton
Sanitizing the orchard after harvest is very important to aid prevention of pests that overwinter in the biomass The fruit that is stuck in the trees is knocked to the ground and the dropped fruit already on the ground is mowed and disced into the soil
Yields The expectations for an apple orchard in full production are between 20-25 tons per acre Yields will vary among varieties production practices and over years The entire orchard is harvested one time for processing only no harvesting for fresh packing For this study we are using 22 tons per acre which reflects average yield for 2013 in Santa Cruz County
Returns For this study a price of $275 per ton is used for processing apples The price per ton reflects average price for processing apples in Santa Cruz County in 2013
Assessment fees California Apple Commission does not charge fees for organic or conventionally produced apples for processing
2014 Processing13 Apple Costs amp Returns Freedom Region-shy‐Pajaro Valley13 Santa Cruz County13 UC Cooperative Extension 6
Labor Hourly wages for workers are $1200 and $950 per hour for machine and non-machine workers respectively Adding 36 for the employersrsquo share of federal and state payroll taxes insurance and other possible benefits gives the labor rates shown of $1632 and $1292 per hour for machine labor and non-machine labor respectively Workersrsquo compensation costs will vary among growers Labor time for operations involving machinery are 20 higher than the operation time given in Table 2 to account for the extra labor involved in equipment set up moving maintenance work breaks and field repair
Cash Overhead
Cash overhead consists of various cash expenses paid out during the year that are assigned to the whole farm and not to a particular operation These costs include property taxes interest on operating capital office expense liability and property insurance field sanitation crop insurance and investment repairs Employee benefits insurance and payroll taxes are included in labor costs and not in overhead Cash overhead costs are shown in Tables 1 2 3 4 and 5
Property Taxes Counties charge a base property tax rate of 1 on the assessed value of the property In some counties special assessment districts exist and charge additional taxes on property including equipment buildings and improvements For this study county taxes are calculated as 1 of the average value of the property Average value equals new cost plus salvage value divided by 2 on a per acre basis
Interest on Operating Capital Interest on operating capital is based on cash operating costs and is calculated monthly until harvest at a nominal rate of 575 per year A nominal interest rate is the typical market cost of borrowed funds
Insurance Insurance for farm investments varies depending on the assets included and the amount of coverage Property insurance provides coverage for property loss and is charged at 0740 of the average value of the assets over their useful life Liability insurance covers accidents on the farm and costs $360 for the 20 acres or $18 per acre
Office Expense Office and business expenses are estimated to be 5000 per acre These expenses include office supplies telephones bookkeeping accounting legal fees road maintenance office and shop utilities and miscellaneous administrative expenses
Field Sanitation Sanitation services provide portable toilet and washing facilities for the ranch during the crop season The cost includes delivery and weekly service Costs will vary depending upon the crops and number of portable units required
Crop Insurance The insurance protects the grower from crop losses due to adverse weather conditions fire unusual diseases andor insects wildlife earthquake volcanic eruption and failure of the irrigation system The grower can choose the protection level at 50 to 75 of production history or county yields In this study no level is specified
ShopField Tools This includes shop tools and equipment Hand tools miscellaneous field tools shovels and pruning equipment
Harvesting Equipment The grower owns and uses 500 (4rsquoX4rsquo) wooden bins for transporting apples to processor twenty 10-foot aluminum tripod ladders and twenty picking bags for hand harvesting
2014 Processing13 Apple Costs amp Returns Freedom Region-shy‐Pajaro Valley13 Santa Cruz County13 UC Cooperative Extension 7
Fuel Tanks Two 500-gallon fuel tanks using gravity feed are on metal stands The tanks are setup in a cement containment pad that meets federal state and county regulations
Miscellaneous Costs Included expenses are employee safety training as well as pesticide use and regulatory continuing education training employee bonuses and additional materials for unique fields or special conditions
Investment Repairs Annual repairs on investment or capital recovery items that require maintenance are calculated as two percent of the purchase price
Non-Cash Overhead
Non-cash overhead is calculated as the capital recovery cost for equipment and other farm investments Although farm equipment used for processing apples may be purchased new or used this study shows the current purchase price for new equipment The new purchase price is adjusted to 60 to reflect a mix of new and used equipment Annual ownership costs (equipment and investments) are shown in Tables 1 2 and 5 They represent the capital recovery cost for investments on an annual per acre basis
Capital Recovery Costs Capital recovery cost is the annual depreciation and interest costs for a capital investment It is the amount of money required each year to recover the difference between the purchase prices and salvage values (unrecovered capital) It is equivalent to the annual payment on a loan for the investment with the down payment equal to the discounted salvage value This is a more complex method of calculating ownership costs than straight-line depreciation and opportunity costs but more accurately represents the annual costs of ownership because it takes the time value of money into account (Boehlje and Eidman) The formula for the calculation of the annual capital recovery costs is
[Purchase price - Salvage Value x Capital recovery Factor] + [Salvage Value x Interest rate]
Salvage Value Salvage value is an estimate of the remaining value of an investment at the end of its useful life For farm machinery the remaining value is a percentage of the new cost of the investment (Boehlje and Eidman) The percent remaining value is calculated from equations developed by the American Society of Agricultural Engineers (ASAE) based on equipment type and years of life The life in years is estimated by dividing the wear out life as given by ASAE by the annual hours of use in this operation For other investments including irrigation systems buildings and miscellaneous equipment the value at the end of its useful life is zero for this study The salvage value for land is equal to the purchase price because land does not depreciate The purchase price and salvage value for certain equipment and investments are shown in Table 5
Capital Recovery Factor Capital recovery factor is the amortization factor or annual payment whose present value at compound interest is 1 The amortization factor is a table value that corresponds to the interest rate and the life of the equipment
Interest Rate The interest rate of 475 used to calculate capital recovery cost is the effective long-term interest rate in January 2014 The interest rate is used to reflect the long-term realized rate of return to these specialized resources that can only be used effectively in the agricultural sector
2014 Processing13 Apple Costs amp Returns Freedom Region-shy‐Pajaro Valley13 Santa Cruz County13 UC Cooperative Extension 8
Equipment Farm equipment is purchased new or used but the study shows the current purchase price for new equipment The new purchase price is adjusted to 60 to indicate a mix of new and used equipment Annual ownership costs for equipment and other investments are shown in Table 6 Equipment costs are composed of three parts non-cash overhead cash overhead and operating costs Both of the overhead factors have been discussed in previous sections The operating costs consist of repairs fuel and lubrication Repairs Fuel and Lube Repair costs are based on purchase price annual hours of use total hours of life and repair coefficients formulated by the ASAE Fuel and lubrication costs are also determined by ASAE equations based on maximum Power-Take-Off horsepower and fuel type Prices for on-farm delivery of diesel and unleaded gasoline are $388 and $339 per gallon respectively
Risk Risks associated with processing apple production are not assigned a production cost All acres are contracted prior to harvest and all tonnage-time delivery contracts are assumed to have been met While this study makes an effort to model a production system based on typical real world practices it cannot fully represent financial agronomic and market risks which affect the profitability and economic viability of apple production Any returns above total costs are considered returns on risk and investment to management (or owners)
Table Values Due to rounding the totals may be slightly different from the sum of the components
2014 Processing13 Apple Costs amp Returns Freedom Region-shy‐Pajaro Valley13 Santa Cruz County13 UC Cooperative Extension 9
References
American Society of Agricultural Engineers (ASAE) 1994 American Society of Agricultural EngineersStandards Yearbook St Joseph MO
Boehlje Michael D and Vernon R Eidman 1984 Farm Management John Wiley and Sons New York NY
California Chapter of the American Society of Farm Managers and Rural Appraisers 2014 Trends in Agricultural Land and Lease Values California Chapter of the American Society of Farm Managers and Rural Appraisers Inc Woodbridge CA
California State Board of Equalization Fuel Tax Division Tax Rates Internet accessed October 2014 httpwwwboecagovsptaxprogspftdrateshtm
Integrated Pest Management for Apples and Pears second edition 1999 Publication 3340 University of California Division of Agriculture and Natural Resources Oakland CA
Karen Klonsky Richard DeMoura et al 2001 UC Cooperative Extension ldquoSample Costs to Establish an Apple Orchard and Produce apples San Joaquin Valley-Northrdquo httpcoststudiesucdaviseduarchivedphp
Karen Klonsky Laura Tourte Chuck Ingels Sean Swezey Pete Livingston 1993-1994-UC CooperativeExtension ldquoOverview of Organic Apple Production for the Fresh Market The Central Coast (Monterey San Benito and Santa Cruz Counties)rdquo httpcoststudiesucdaviseduarchivedphp
John Deere Equipment Configuratorhttpsconfiguratordeerecomservletcomdeereu90947eproductsviewservletsEProductsInitializationSer vletsbu=AGampuserAction=amplang=enampcountry=us
California State Organic Program 1220 N Street Sacramento CA 95814 916-900-5030httpwwwcdfacagovisi_amp_corganichtml
California Certified Organic Farmers CCOF 2155 Delaware Ave Santa Cruz CA 95060 httpwwwccoforg
USDA National Agriculture Statistics Service with CDFA ldquo2011 California Certified Organic Production Surveyrdquo wwwnassusdagovca
Organic Materials Review Institute OMRI 2649 Willamette Street Eugene OR 97405-3134 httpwwwomriorg
Santa Cruz County Agriculture Department 175 Westridge Drive Watsonville CA 95076 2013 Annual Crop Report httpwwwagdeptcom
2014 Processing13 Apple Costs amp Returns Freedom Region-shy‐Pajaro Valley13 Santa Cruz County13 UC Cooperative Extension 10
UC COOPERATIVE EXTENSION TABLE 1 COSTS PER ACRE TO PRODUCE PROCESSING APPLES
Operation Cash and Labor Costs per Acre Time Labor Fuel Lube Material Custom Total Your
Operation (HrsA) Cost amp Repairs Cost Rent Cost Cost Cultural Dormant Pruning 5900 762 0 0 0 0 762 Mow Prunings 034 7 3 2 0 0 12 Disc Prunings 026 5 2 1 0 0 9 Dormant Oil Spray 046 9 4 2 20 0 35 Strip Spray Herbicides 2X 051 10 5 2 75 0 92 Delayed Dormant Spray-Green Tip 046 9 4 2 43 0 57 Vertebrate Pest Control 2X 100 20 9 2 25 0 56 Bee Hives (1) 000 0 0 0 0 50 50 Mow Orchard 4X 100 20 9 5 0 0 34 DiscSmooth Orchard Floor 5X 10³ 20 10 5 0 0 35 Fertilize-Broadcast (NH4SO4) 053 10 5 1 31 0 48 Disease Control-Pink Bud 046 9 4 2 20 0 35 Set Pheromone Traps 2X 250 32 0 0 100 0 132 DiseaseInsectFertilizer-Post Bloom 046 9 4 2 41 0 56 Snail Bait Application 026 5 2 1 99 0 108 Thinning Fruit 50 Ac 1100 142 0 0 0 0 142 TieProp Branches 2X 600 78 0 0 0 0 78 Irrigate 2X 200 26 0 0 93 0 118 Insect Control -Worms 046 9 4 2 16 0 31 Sanitize Field Equipment 175 23 0 0 0 0 23 12 Ton Pickup (2) 107 21 9 3 0 0 33 Bobtail Truck 020 4 4 1 0 0 10 Back Hoe 017 3 1 0 0 0 5
TOTAL CULTURAL COSTS 9091 1232 83 31 563 50 1959
Harvest Harvest- Haul Apples 000 0 0 0 0 1320 1320
TOTAL HARVEST COSTS 000 0 0 0 0 1320 1320
Post-Harvest DiscSmooth Orchard Floor 5X 026 5 2 1 0 0 9 Soil Samples (Ph Calcium) 000 0 0 0 60 0 60 Irrigation System Maintenance 150 19 0 0 25 0 44
TOTAL POST-HARVEST COSTS 176 24 2 1 85 0 113
Interest on Operating Capital at 575 68 TOTAL OPERATING COSTSACRE 93 1257 85 32 648 1370 3461
2014 Processing13 Apple Costs amp Returns Freedom Region-shy‐Pajaro Valley13 Santa Cruz County13 UC Cooperative Extension 11
TABLE 1 CONTINUED
Operation Cash and Labor Costs per Acre Time Labor Fuel Lube Material Custom Total Your
Operation (HrsA) Cost amp Repairs Cost Rent Cost Cost CASH OVERHEAD Office Expense 50Field Sanitation 60Miscellaneous Cost-Training 50Liability Insurance 18Property Taxes 206Property Insurance 152Investment Repairs 18
TOTAL CASH OVERHEAD COSTSACRE
TOTAL CASH COSTSACRE NON-CASHOVERHEAD Per Producing
Acre Annual Cost
Capital Recovery
554
4015
Bins 500 Shop Tools Harvest Bin Trailer-3 Bin (2) Fork Lift Fuel Tanks (2) Wood Props 6 Tripod Harvesting Ladders (20) Harvest Shoulder Bags (20) Land 20 Acres Established Apples Equipment
263 211 44
132 231 21 26 9
20000 552
18 14 3
12 17 3 2 1
950 56
18 14 3
12 17 3 2 1
950 56
TOTAL NON-CASH OVERHEAD COSTS 21489 1075 1075 TOTAL COSTSACRE 5090
2014 Processing13 Apple Costs amp Returns Freedom Region-shy‐Pajaro Valley13 Santa Cruz County13 UC Cooperative Extension 12
UC COOPERATIVE EXTENSION TABLE 2 COSTS AND RETURNS PER ACRE TO PRODUCE PROCESSING APPLES
Quantity Price or Value or Your Acre Unit CostUnit CostAcre Cost
GROSS RETURNS Apples 22 Ton 27500 6050 TOTAL GROSS RETURNS 22 Ton 6050
OPERATING COSTS Fertilizer 43
Ammonium Sulfate (NH4SO4) Mora-Leaf Plus (20-20-20)
Insecticide
12500 1000
Lb Lb
025 120
31 12
160 440 Superior Spray Oil Pheromone Traps Alticor
700 100 400
Gal Acre FlOz
500 10000
213
35 100
9 Entrust 300 Oz 536 16
Fungicide Rally 40WSP Golden Micronized Sulfur
500 1000
Oz Lb
550 025
68 28 3
Luna-Tranquility Vangard
Herbicide
200 400
FlOz FlOz
875 510
18 20 75
Roundup Ultra 200 Pint 859 17 Goal Tender 800 FlOz 218 17 Shark 200 FlOz 992 20 Treevix 100 FlOz 2100 21
Rodenticide 25 Rodent Bait 1000 Lb 250 25
Irrigation 118 Pajaro Water Costs Irrigation System-Parts
Contract
600 050
AcIn Acre
1542 5000
93 25
1320 Harvesting-Hauling
Miscellaneous 2200 Ton 6000 1320
159 Sluggo Snail Bait Soil Samples
Rent
2000 100
Lb Acre
497 6000
99 60 50
Bee Hives 100 Each 5000 50 Labor 1257 Equipment Operator Labor Non-Machine Labor
1070 8025
Hrs Hrs
1632 1292
175 1037
Irrigation Labor Machinery
350 Hrs 1292 45 118
Fuel-Gas 303 Gal 339 10 Fuel-Diesel 1932 Gal 388 75 Lube 13 Machinery Repair 20
Interest on Operating Capital 575 68 TOTAL OPERATING COSTSACRE 3461
TOTAL OPERATING COSTSTON 157 NET RETURNS ABOVE OPERATING COSTS 2589
201 Processing13 Apple Costs amp Returns Freedom Region-shy‐Pajaro Valley13 Santa Cruz County13 UC Cooperative Extension 13
TABLE 2 CONTINUED
Quantity Price or Value or Your Acre Unit CostUnit CostAcre Cost
CASH OVERHEAD COSTS Office Expense 50Field Sanitation 60Miscellaneous Cost-Training 50Liability Insurance 18Property Taxes 206Property Insurance 152Investment Repairs 18
TOTAL CASH OVERHEAD COSTSACRE 554 TOTAL CASH OVERHEAD COSTSTON 25
TOTAL CASH COSTSACRE 4015 TOTAL CASH COSTSTON 183 NET RETURNS ABOVE CASH COSTS 2035
NON-CASH OVERHEAD COSTS (Capital Recovery) Bins 500 18 Shop Tools 14 Harvest Bin Trailer-3 Bin (2) 3 Fork Lift 12 Fuel Tanks (2) 17 Wood Props 6 3 Tripod Harvesting Ladders (20) 2 Harvest Shoulder Bags (20) 1 Land 20 Acres Established Apples 950 Equipment 56
TOTAL NON-CASH OVERHEAD COSTSACRE 1075 TOTAL NON-CASH OVERHEAD COSTSTON 49 TOTAL COSTACRE 5090
TOTAL COSTTON 231 NET RETURNS ABOVE TOTAL COST 960
201 Processing13 Apple Costs amp Returns Freedom Region-shy‐Pajaro Valley13 Santa Cruz County13 UC Cooperative Extension 14
UC COOPERATIVE EXTENSION TABLE 3 MONTHLY COSTS PER ACRE TO PRODUCE PROCESSING APPLES
Cultural Dormant Pruning Mow Prunings Disc Prunings Dormant Oil Spray Strip Spray Herbicides 2X Delayed Dormant Spray-Green Tip Vertebrate Pest Control 2X Bee Hives (1) Mow Orchard 4X DiscSmooth Orchard Floor 5X Fertilize-Broadcast (NH4SO4) Disease Control-Pink Bud Set Pheromone Traps 2X DiseaseInsectFertilizer-Post Bloom Snail Bait Application Thinning Fruit 50 Ac TieProp Branches 2X Irrigate 2X Insect Control -Worms Sanitize Field Equipment 12 Ton Pickup (2) Bobtail Truck Back Hoe
TOTAL CULTURAL COSTS Harvest Harvest- Haul Apples
TOTAL HARVEST COSTS
Post-Harvest DiscSmooth Orchard Floor 5X Soil Samples (Ph Calcium) Irrigation System Maintenance
TOTAL POST-HARVEST COSTS Interest on Operating Capital 575
TOTAL OPERATING COSTSACRE CASH OVERHEAD Office Expense Field Sanitation Miscellaneous Cost-Training Liability Insurance Property Taxes Property Insurance Investment Repairs
TOTAL CASH OVERHEAD COSTS TOTAL CASH COSTSACRE
DEC 13
762 12
9
3
0
786
0
0 4
790
2 2
791
JAN 14
FEB 14
MAR 14
APR 14
MAY 14
35 43 57
28 50
8 9
24 35 66
56
3 3 3 3 3
0 0 0 0 0
38 104 82 146 59
0 0 0 0 0
0 0 0 0 0 4 4 5 6 6
42 108 86 151 65
103 76
2 2 2 2 2 2 181 2 2 2
44 289 88 153 67
JUN 14
JUL 14
AUG 14
SEP 14
49
8 8 8 9 9 9
24
66
108 142 39 39
59 59 31
23 3 3 3 3
10 0 0 0 0
309 265 126 13
1320
0 0 0 1320
9
0 0 0 9 7 9 9 16
316 273 135 1357
50 60 50 18
103 76
2 2 2 2 2 181 2 180
318 454 137 1537
OCT 14
28
3
0
32
0
60 44
104 -1
135
2 2 137
Total
762 12 9
35 92 57 56 50 34 35 48 35
132 56
108 142
78 118
31 23 33 10 5
1959
1320
1320
9 60 44
113 68
3461
50 60 50 18
206 152
18 554
4015
2014 Processing13 Apple Costs amp Returns Freedom Region-shy‐Pajaro Valley13 Santa Cruz County13 UC Cooperative Extension 15
UC COOPERATIVE EXTENSION TABLE 4 RANGING ANALYSIS ndash PROCESSING APPLES
COSTS PER ACRE AND PER TON AT VARYING YIELDS TO PRODUCE APPLES
YIELD (TON)
1600 1800 2000 2200 2400 2600 2800 OPERATINGCOSTSACRE Cultural 1959 1959 1959 1959 1959 1959 1959 Harvest 960 1080 1200 1320 1440 1560 1680 Post-Harvest 113 113 113 113 113 113 113 Interest on Operating Capital 575 67 67 68 68 69 70 70
TOTAL OPERATING COSTSACRE 3099 3220 3340 3461 3581 3702 3823 TOTAL OPERATING COSTSTON 19369 17887 16701 15731 14922 14238 13652
CASH OVERHEAD COSTSACRE 559 559 559 559 559 559 559
TOTAL CASH COSTSACRE 3658 3779 3899 4020 4140 4261 4382 TOTAL CASH COSTSTON 22864 20993 19497 18272 17252 16389 15649
NON-CASH OVERHEAD COSTSACRE 1075 1075 1075 1075 1075 1075 1075
TOTAL COSTSACRE 4733 4853 4974 5095 5215 5336 5456 TOTAL COSTSTON 29600 27000 24900 23200 21700 20500 19500
Net Return per Acre above Operating Costs for Apples
PRICE ($ton) YIELD (Tonacre)
Apples 1600 1800 2000 2200 2400 2600 2800
20000 101 380 660 939 1219 1498 1777 22500 501 830 1160 1489 1819 2148 2477 25000 901 1280 1660 2039 2419 2798 3177 27500 1301 1730 2160 2589 3019 3448 3877 30000 1701 2180 2660 3139 3619 4098 4577 32500 2101 2630 3160 3689 4219 4748 5277 35000 2501 3080 3660 4239 4819 5398 5977
Net Return per Acre above Cash Costs for Apples
PRICE ($ton) YIELD (Tonacre)
Apples 1600 1800 2000 2200 2400 2600 2800
20000 -458 -179 101 380 660 939 1218 22500 -58 271 601 930 1260 1589 1918 25000 342 721 1101 1480 1860 2239 2618 27500 742 1171 1601 2030 2460 2889 3318 30000 1142 1621 2101 2580 3060 3539 4018 32500 1542 2071 2601 3130 3660 4189 4718 35000 1942 2521 3101 3680 4260 4839 5418
2014 Processing13 Apple Costs amp Returns Freedom Region-shy‐Pajaro Valley13 Santa Cruz County13 UC Cooperative Extension 16
TABLE 4 RANGING ANALYSIS CONTINUED
Net Return per Acre above Total Costs for Apples
PRICE ($ton) YIELD (Tonacre)
Apples 1600 1800 2000 2200 2400 2600 2800
20000 -1533 -1253 -974 -695 -415 -136 144 22500 -1133 -803 -474 -145 185 514 84425000 -733 -353 26 405 785 1164 1544 27500 -333 97 526 955 1385 1814 2244 30000 67 547 1026 1505 1985 2464 2944 32500 467 997 1526 2055 2585 3114 3644 35000 867 1447 2026 2605 3185 3764 4344
2014 Processing13 Apple Costs amp Returns Freedom Region-shy‐Pajaro Valley13 Santa Cruz County13 UC Cooperative Extension 17
UC COOPERATIVE EXTENSION TABLE 5 WHOLE FARM ANNUAL EQUIPMENT INVESTMENT AND BUSINESS OVERHEAD COSTS
ANNUAL EQUIPMENT COSTS
Cash OverheadYrs Salvage Capital Insur-
Yr Description Price Life Value Recovery ance Taxes 14 Gopher Bait Applicator 2858 30 47 180 11 15 14 45 HP2WD Tractor 18745 20 2405 1398 78 106 14 Bobtail Truck 45000 15 8761 3849 199 269 14 Back Hoe 16599 15 1594 1497 67 91 14 Ring Roller 8 3028 15 291 273 12 17 14 Offset Disc 8 13209 10 2336 1502 58 78 14 Airblast Sprayer 3 PT 100 Gal 7971 10 1410 906 35 47 14 Flail Mower 6 5764 10 1019 655 25 34 14 Strip Sprayer 4017 10 710 457 17 24 14 Spreader-Double Spinner 3600 10 679 406 16 21 14 1 12 Ton Pickup 24000 7 9104 2983 122 166 14 2 12 Ton Pickup 24000 7 9104 2983 122 166
TOTAL 168791 - 37459 17090 763 1031 60 of New Cost 101275 - 22476 10254 458 619 Used to reflect a mix of new and used equipment
ANNUAL INVESTMENT COSTS
Total 205
1582 4316 1655
302 1637
988 714 498 443
3271 3271
18884 11331
Cash Overhead
Description Price Yrs Life
Salvage Value
Capital Recovery
Insur-ance Taxes Repairs
INVESTMENT Land 20 Acres Established Apples 400000 25 400000 19000 2960 4000 0 Bins 500 25000 25 2500 1675 102 138 500 Fuel Tanks (2) 21949 20 2195 1656 89 121 439 Shop Tools 20000 25 2000 1340 81 110 400 Fork Lift 12500 15 1250 1125 51 69 250 Harvest Bin Trailer-3 Bin (2) 4180 25 418 280 17 23 84 Tripod Harvesting Ladders (20) 2500 25 250 168 10 14 50 Wood Props 6 2000 10 0 256 7 10 0 Harvest Shoulder Bags (20) 900 25 0 62 3 5 18 TOTAL INVESTMENT 489029 - 408613 25562 3321 4488 1741
Total
25960 2415 2305 1932 1495
404 241 273 88
35113
ANNUAL BUSINESS OVERHEAD COSTS
Units Price Total Description Farm Unit Unit Cost Office Expense 20 Acre 5000 1000 Field Sanitation 20 Acre 6000 1200 Miscellaneous Cost-Training 20 Acre 5000 1000 Liability Insurance 20 Acre 1800 360
2014 Processing13 Apple Costs amp Returns Freedom Region-shy‐Pajaro Valley13 Santa Cruz County13 UC Cooperative Extension 18
UC COOPERATIVE EXTENSION TABLE 6 HOURLY EQUIPMENT COSTS
Apples Total Cash Overhead Operating
Yr Description Hours Used
Hours Used
Capital Recovery
Insur-ance Taxes
Lubeamp Repairs Fuel
Total Oper
Total CostsHr
14 45 HP2WD Tractor 165 600 140 008 011 209 857 1066 1224 14 Back Hoe 4 400 225 010 014 140 678 818 1066 14 Airblast Sprayer 3 PT 100 Gal 46 200 272 010 014 137 000 137 434 14 Offset Disc 8 31 200 451 017 023 218 000 218 709 14 Flail Mower 6 27 200 197 008 010 243 000 243 457 14 Spreader-Double Spinner 16 200 122 005 006 000 000 000 133 14 Strip Sprayer 10 150 183 007 009 108 000 108 307 14 Ring Roller 8 31 130 126 006 008 034 000 034 173 14 14
Bobtail Truck Gopher Bait Applicator
4 20
120 100
1924 108
099 006
134 009
736 000
2183 000
2918 000
5077 123
14 1 12 Ton Pickup 11 100 1790 073 099 244 848 1091 3054 14 2 12 Ton Pickup 11 100 1790 073 099 244 848 1091 3054
2014 Processing13 Apple Costs amp Returns Freedom Region-shy‐Pajaro Valley13 Santa Cruz County13 UC Cooperative Extension 19
UC COOPERATIVE EXTENSION TABLE 7 OPERATIONS WITH EQUIPMENT amp MATERIALS
Operation Labor Type Rate Operation Month Tractor Implement Material acre Unit Dormant Pruning Dec Non-Machine Labor 5900 hours Mow Prunings Dec 45 HP2WD Tractor Flail Mower 6 Equipment Operator Labor 041 hour Disc Prunings Dec 45 HP2WD Tractor Offset Disc 8 Equipment Operator Labor 031 hour
Ring Roller 8 Dormant Oil Spray Jan 45 HP2WD Tractor Airblast Sprayer 3 PT 100 Gal Equipment Operator Labor 055 hour
440 Superior Spray Oil 400 Gal Strip Spray Herbicide 2X Feb 45 HP2WD Tractor Strip Sprayer Equipment Operator Labor 030 hour
Roundup Ultra 200 Pint Goal Tender 800 FlOz
July 45 HP2WD Tractor Strip Sprayer Equipment Operator Labor 030 hourShark 200 FlOz Treevix 100 FlOz
Delayed Dormant Spray Feb 45 HP2WD Tractor Airblast Sprayer 3 PT 100 Gal Equipment Operator Labor 055 hour 440 Superior Spray Oil 300 Gal Rally 40WSP 500 Oz
Vertebrate Pest Control 2X Mar 45 HP2WD Tractor Gopher Bait Applicator Equipment Operator Labor 060 hour Rodent Bait 500 Lb
Oct 45 HP2WD Tractor Gopher Bait Applicator Equipment Operator Labor 060 hourRodent Bait 500 Lb
Bee Hives (1) Mar Bee Hives 100 Each Mow Orchard 4X Apr 45 HP2WD Tractor Flail Mower 6 Equipment Operator Labor 030 hour
June 45 HP2WD Tractor Flail Mower 6 Equipment Operator Labor 030 hourJuly 45 HP2WD Tractor Flail Mower 6 Equipment Operator Labor 030 hourAug 45 HP2WD Tractor Flail Mower 6 Equipment Operator Labor 030 hour
DiscSmooth Orchard 5X Apr 45 HP2WD Tractor Offset Disc 8 Equipment Operator Labor 031 hour Ring Roller 8
June 45 HP2WD Tractor Offset Disc 8 Equipment Operator Labor 031 hourRing Roller 8
July 45 HP2WD Tractor Offset Disc 8 Equipment Operator Labor 031 hourRing Roller 8
Aug 45 HP2WD Tractor Offset Disc 8 Equipment Operator Labor 031 hourRing Roller 8
Sept 45 HP2WD Tractor Offset Disc 8 Equipment Operator Labor 031 hourRing Roller 8
Fertilize-Broadcast 2X Apr 45 HP2WD Tractor Spreader-Double Spinner Equipment Operator Labor 032 hour Ammonium Sulfate (NH4SO4) 6250 Lb
Aug 45 HP2WD Tractor Spreader-Double Spinner Equipment Operator Labor 032 hourAmmonium Sulfate (NH4SO4) 6250 Lb
Disease Control-Pink Bud Apr 45 HP2WD Tractor Airblast Sprayer 3 PT 100 Gal Equipment Operator Labor 055 hour Golden Micronized Sulfur 1000 LbLuna-Tranquility 200 FlOz
Set Pheromone Traps 2X Apr Non-Machine Labor 125 hours Pheromone Traps 050 Acre
July Non-Machine Labor 125 hours Pheromone Traps 050 Acre
DiseaseInsectFertilize May 45 HP2WD Tractor Airblast Sprayer 3 PT 100 Gal Equipment Operator Labor 055 hour Vangard 400 FlOz Alticor 400 FlOz Mora-Leaf Plus (20-20-20) 1000 Lb
Snail Bait Application June 45 HP2WD Tractor Spreader-Double Spinner Equipment Operator Labor 032 hour Sluggo Snail Bait 2000 Lb
Thinning Fruit 50 Ac June Non-Machine Labor 1100 hours TieProp Branches 2X June Non-Machine Labor 300 hours
July Non-Machine Labor 300 hours Irrigate 2X July Irrigation Labor 100 hour
Pajaro Water Costs 300 AcIn Aug Irrigation Labor 100 hour
Pajaro Water Costs 300 AcIn Insect Control ndashWorms July 45 HP2WD Tractor Airblast Sprayer 3 PT 100 Gal Equipment Operator Labor 055 hour
Entrust 300 OzSanitize Field Equipment Aug Non-Machine Labor 175 hours 12 Ton Pickup (2) Aug 12 Ton Pickup Equipment Operator Labor 064 hour
Aug 12 Ton Pickup Equipment Operator Labor 064 hourBobtail Truck Sept Bobtail Truck Equipment Operator Labor 024 hourBack Hoe Sept Back Hoe Equipment Operator Labor 020 hourHarvest- Haul Apples Sept Harvesting-Hauling 2200 Ton Soil Samples (Ph Ca) Oct Soil Samples 100 Acre Irrigation System Main Oct Irrigation Labor 150 hours
Irrigation System-Parts 050 Acre
2014 Processing13 Apple Costs amp Returns Freedom Region-shy‐Pajaro Valley13 Santa Cruz County13 UC Cooperative Extension 20
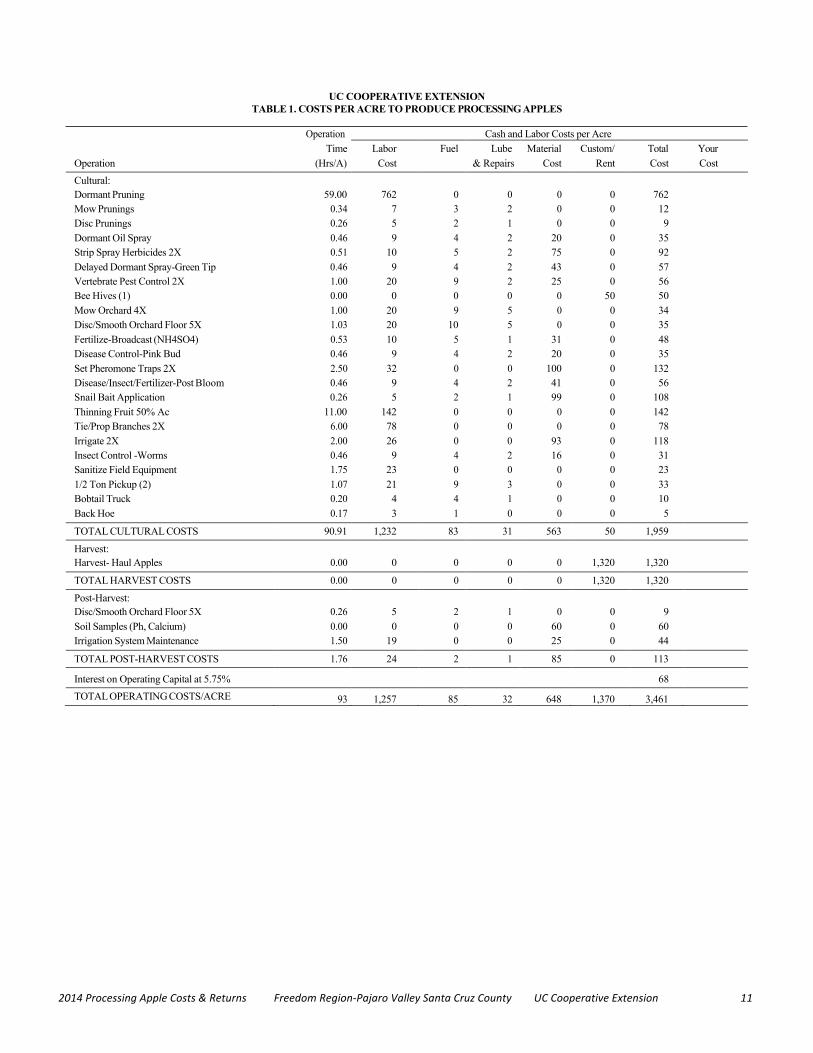
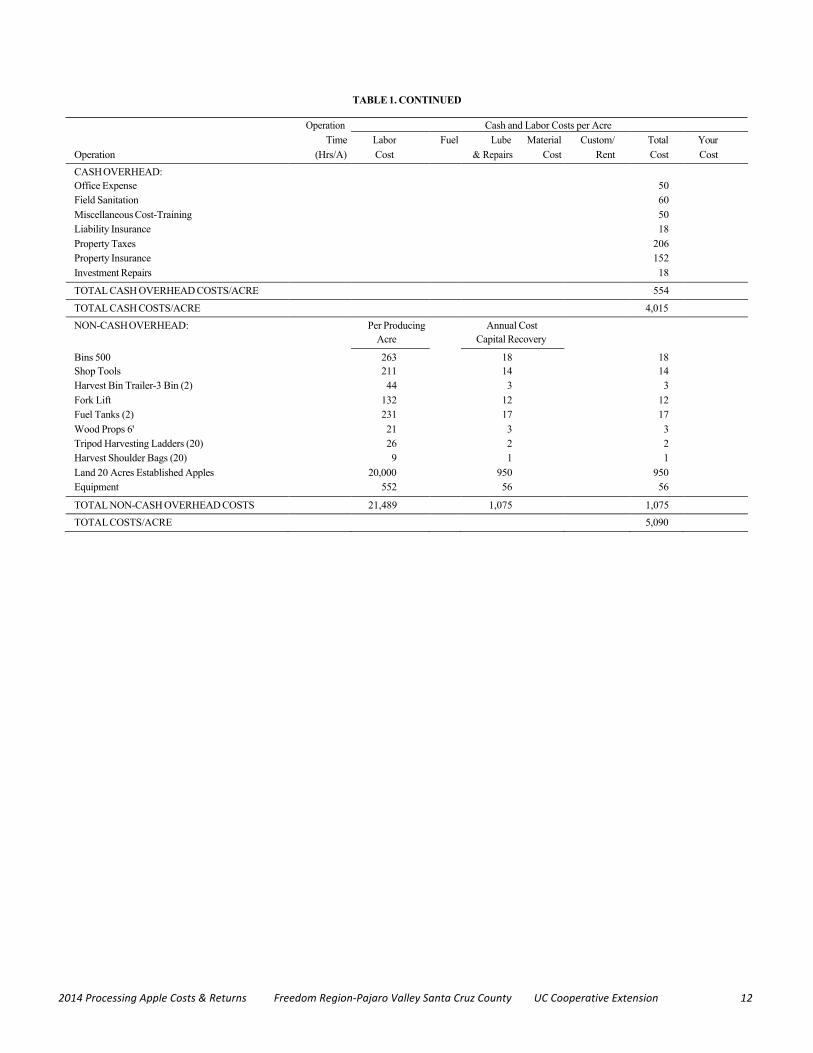
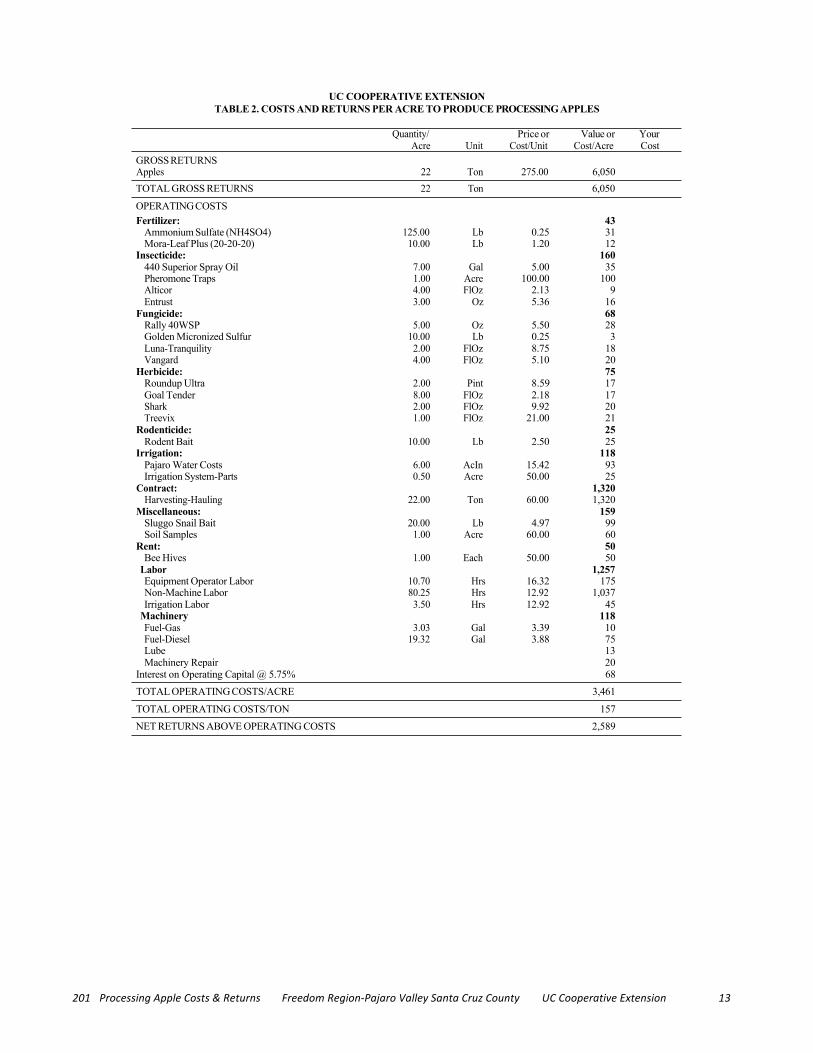
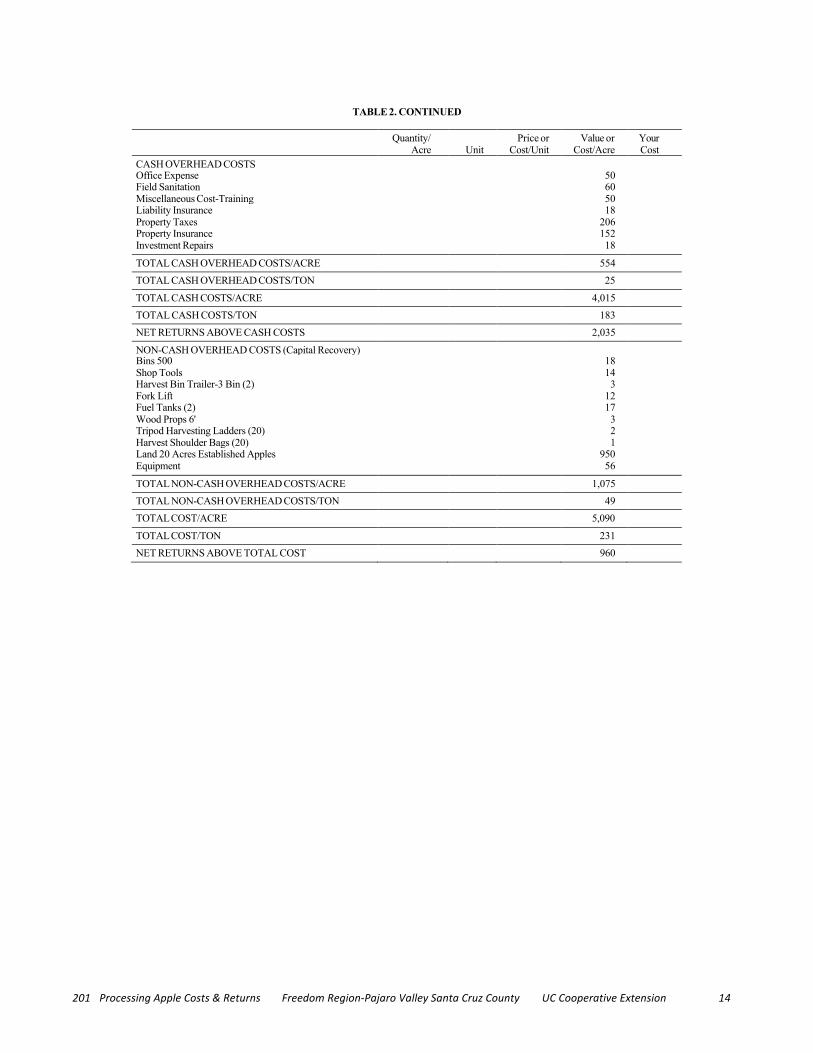
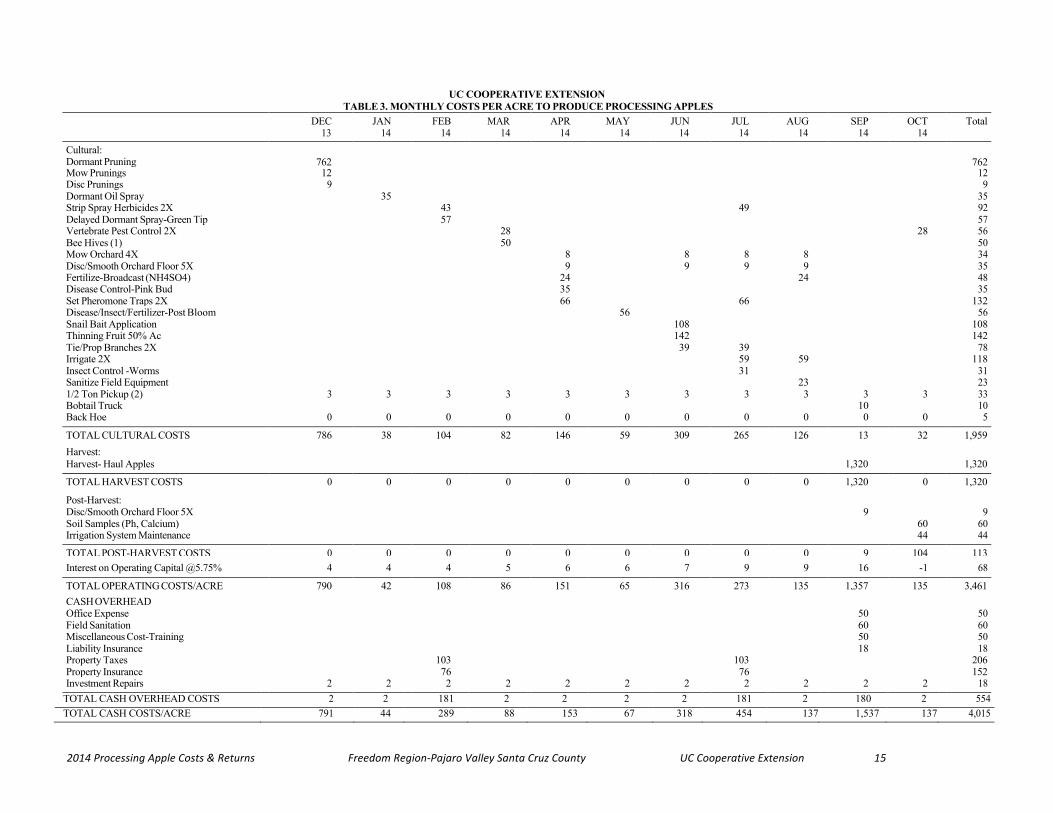
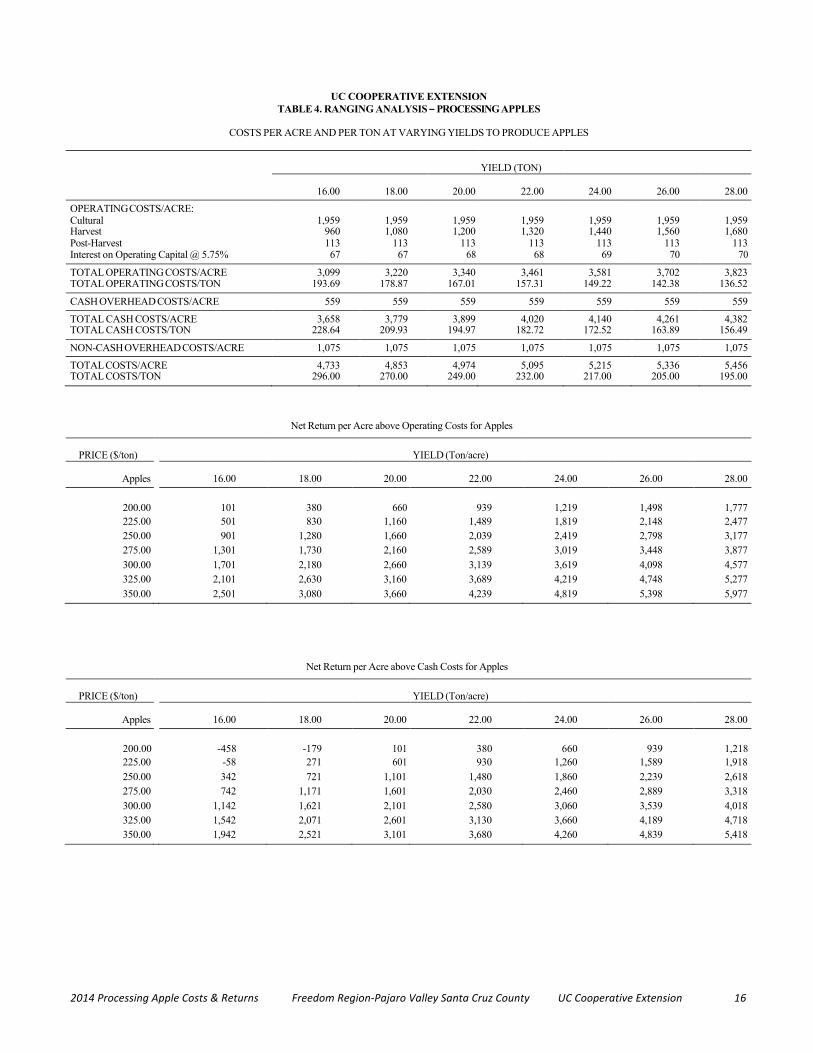
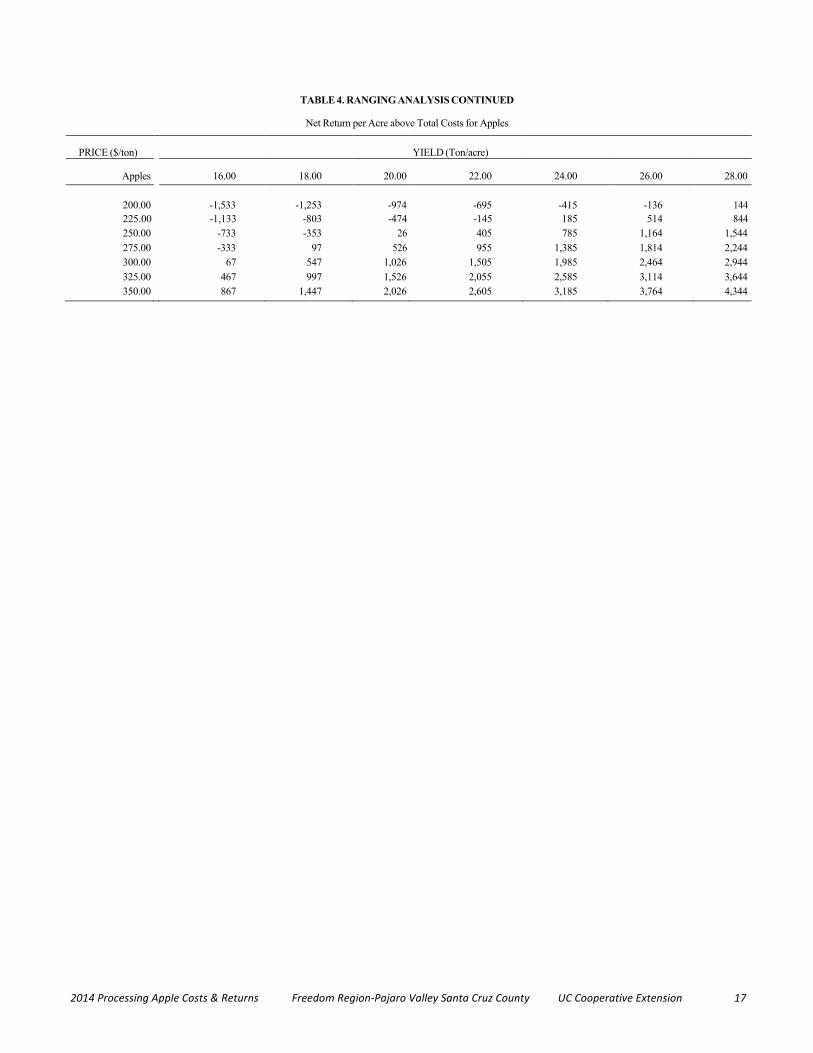
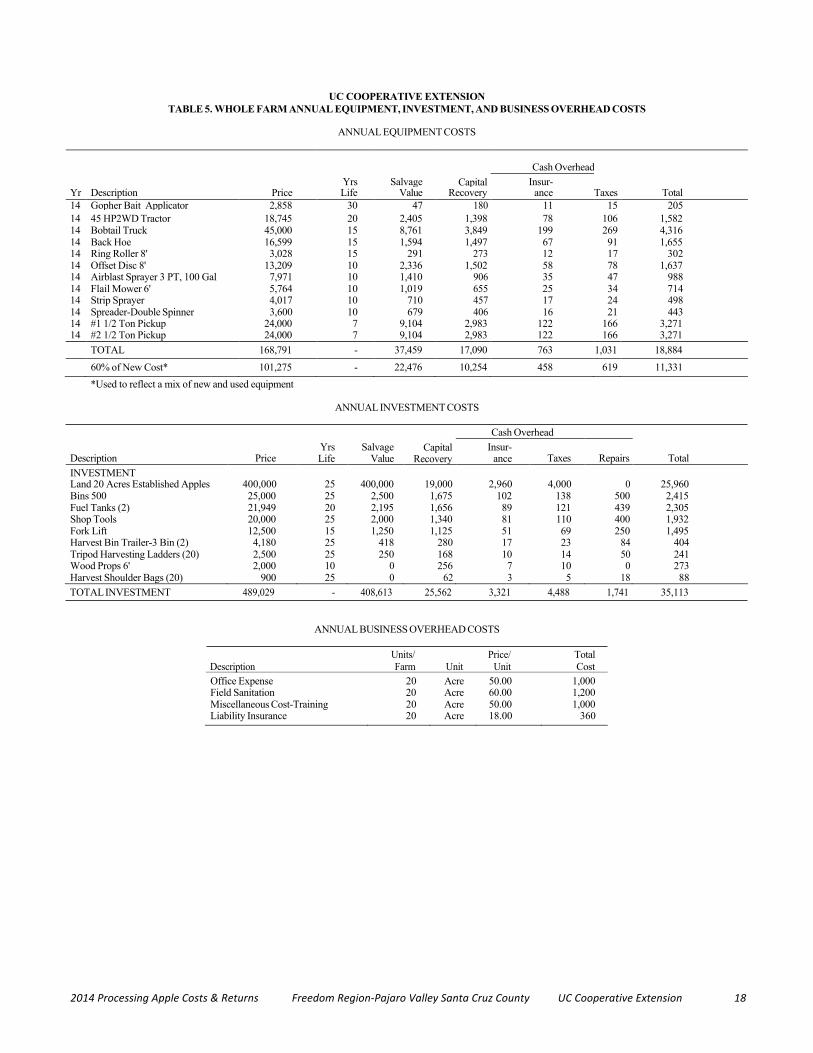
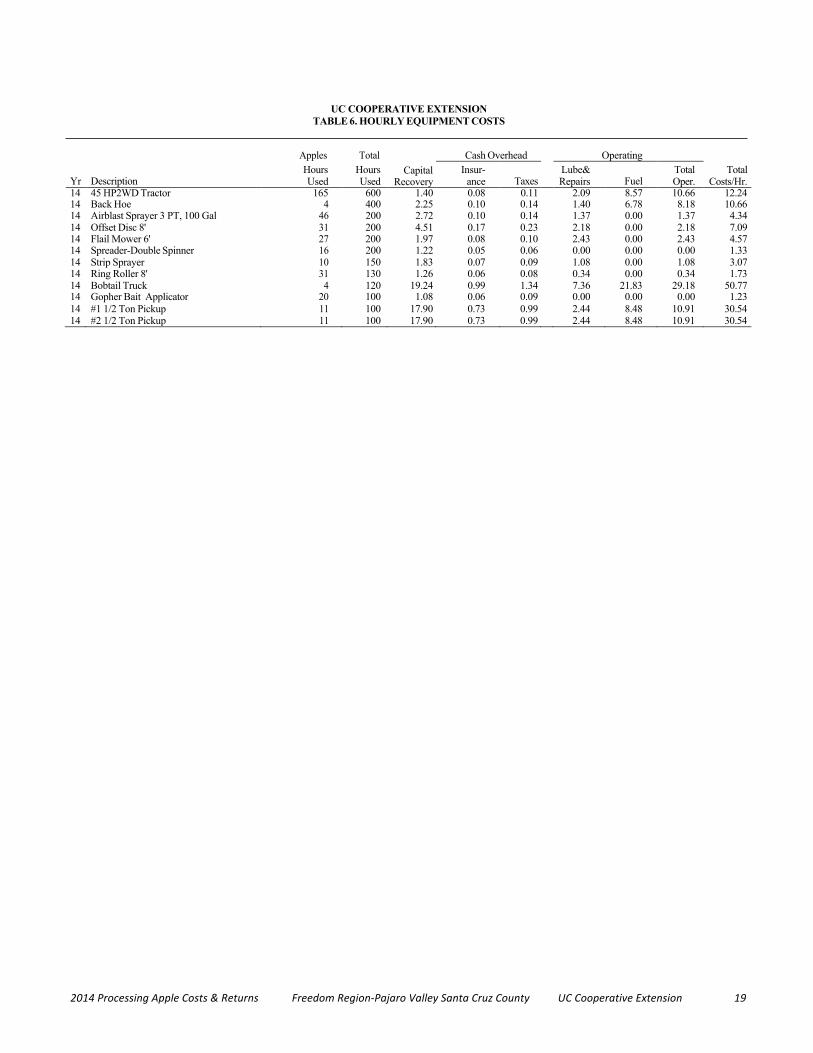
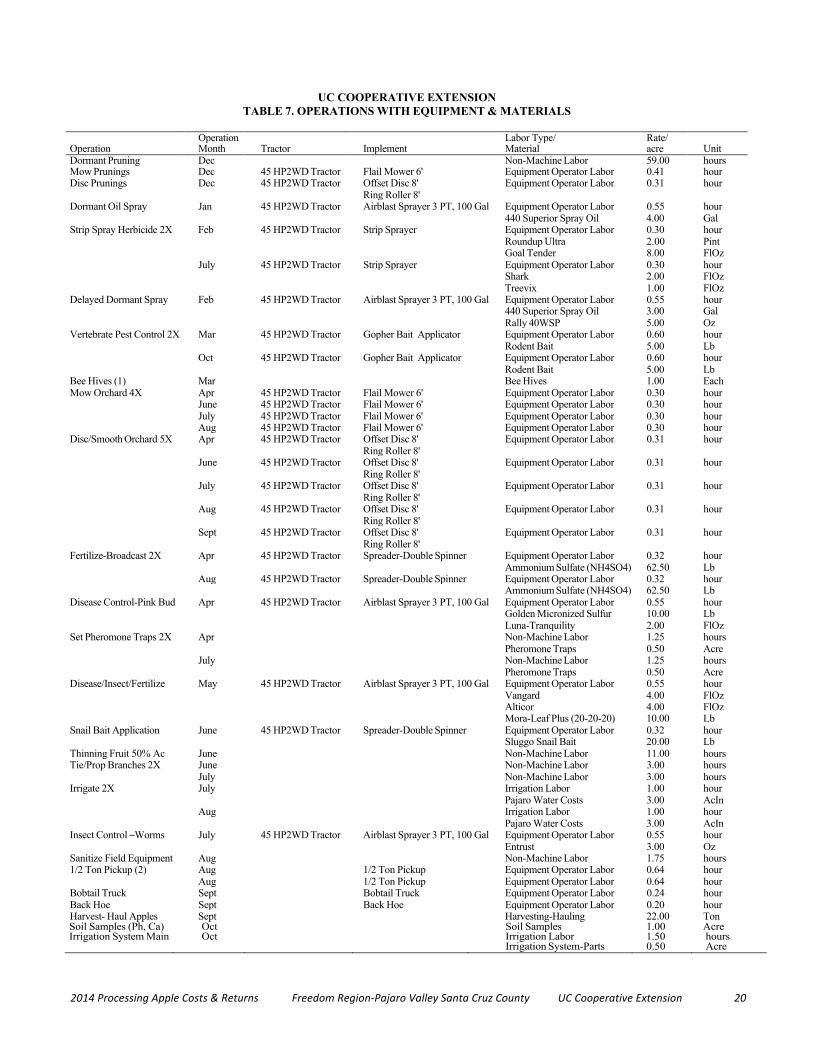