Embed Size (px)
Citation preview

Sample design and attrition in MCSTarek MostafaCentre for Longitudinal [email protected]

Outline
• The MCS sample and design• Attrition in the Millennium Cohort Study.
What do we know about attrition in MCS?What can we do about it?
• Access to MCS documentation.• Data structure and how to merge datasets.

The MCS sample
MCS population is defined as All children born between 1 September 2000 and 31 August 2001 (for England and Wales), and between 23 November 2000 and 11 January 2002 (for Scotland and Northern Ireland, see 2.2), alive and living in the UK at age nine months, and eligible to receive Child Benefit at that age.CB was then a universal benefit.
and, after nine months: for as long as they remain living in the UK.

The MCS population• The population includes:1. Children living in non-household situations (women's refuges, hostels,
hospitals, prisons etc.) at age nine months in principle – in practice none?.2. Children not born in the UK but established as resident in the UK at age
nine months.
• The population excludes:1. Children who died before age 9 months.2. UK-born children who emigrated from the UK before 9 months.3. Children not established as resident in the UK at age nine months- e.g.
children of foreign diplomats, asylum seekers etc.

The MCS sample design• The population was stratified by UK country - England, Wales,
Scotland and Northern Ireland.• Each country had two strata: advantaged and disadvantaged
families. England had an additional one for areas with high percentage of ethnic minorities.
• The primary sampling unit is the electoral ward. Small wards with very few births were combined into ‘super-wards’.
• Minorities and disadvantaged families were over sampled.• Identified sample: 27201 | Issued sample: 24180• Productive at wave 1: 18552• About 692 new families joined MCS in wave 2.

Problems of non-response/attrition• Distinction between unit (respondents’) non
response and item non-response (focus on former here)
• Types of non-response (have separate reasons)Non-contact Refusal InabilityOut of scope/ineligible
• Non-response on increase in all surveys• Non-response may not be permanent (in panel
survey)• Effects of non-response/attrition

Attrition
Definition
• Attrition is the discontinued participation of some individuals in a longitudinal survey for reasons that are unknown and/or beyond the control of the researcher

Productive sample over time18,552
15,590 15,24613,857 13,287
0
2,000
4,000
6,000
8,000
10,000
12,000
14,000
16,000
18,000
20,000
Wave 1 Wave 2 Wave 3 Wave 4 Wave 5
Pru
ctiv
e sa
mpl
e si
ze

Non-responseOutcome Wave 1 Wave 2 Wave 3 Wave 4 Wave 5
Productive 18,552 15,590 15,246 13,857 13,287
Not Issued 692 0 0 2,213 2,851
Ineligible 0 167 300 126 78
Untraced Movers 0 687 547 706 388
Refusal 0 1,739 2,315 1,811 2,196
Non-Contact 0 930 546 123 438
Other 0 131 290 408 6
Total 19,244 19,244 19,244 19,244 19,244

Types of non-response
0
500
1,000
1,500
2,000
2,500
3,000
Wave 1 Wave 2 Wave 3 Wave 4 Wave 5Not Issued Ineligible Untraced Movers Refusal Non-Contact Other

Monotone vs. non-monotone response
Type of non-response Freq. %
Monotone 5,023 26.1
Non-monotone 3,773 19.6
All waves 10,448 54.3
Total 19,244 100.0
Monotone response: respondents dropped out without coming back.Non-monotone: interrupted response pattern over time. (New families are special case of non-monotone).
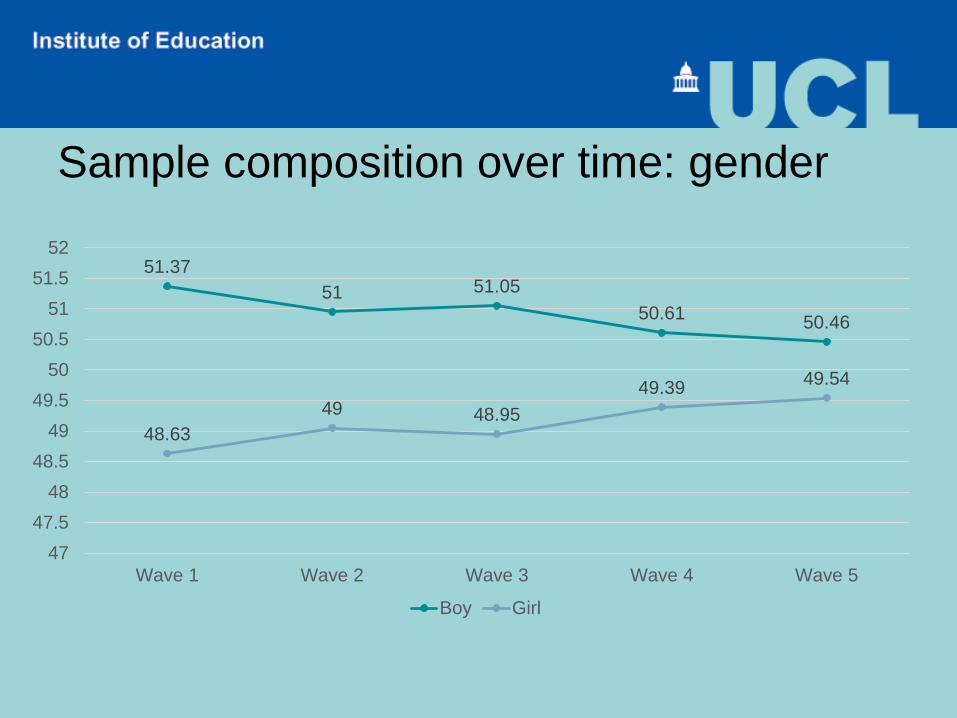
Sample composition over time: gender
51.3751 51.05
50.61 50.46
48.6349 48.95
49.39 49.54
4747.5
4848.5
4949.5
5050.5
5151.5
52
Wave 1 Wave 2 Wave 3 Wave 4 Wave 5
Boy Girl

Sample composition over time: class & ‘race’
0
5
10
15
20
25
30
35
Wave 1 Wave 2 Wave 3 Wave 4 Wave 5
Non-White Managerial and professional

• Missing dataSmaller samples, fewer transitions, incomplete histories.
• Biases in results (all surveys)Disproportionate to some groups (mobile,
disadvantaged, young, men, long working hours)
Problem if linked to survey topic focus/variables
Effects of non-response/attrition

Non-response bias - implications
• Ignore the problem : equivalent to assuming that there are no sample bias.
• Use adjustment techniques such as weighting and imputations.

Sampling and attrition weights• Sampling weights: adjust the sample
composition to take account of over-sampling in the first wave.
• Attrition weights: adjust the sample composition to take account of the loss of particular type of respondents.
• Adjustment means giving more importance (weight) to a particular group.
• Overall weights = Sampling Wgt x Attrition Wgt

Attrition weights construction
• Logistic response models• Dependent variable: binary response
outcome (0/1) in wave M. • Independent variables: characteristics of
respondents in previous waves.

MCS weightsWeights Wave
Variable name
Sampling weight (country specific analyses) weights1
Sampling weight (whole of UK analyses) weights2
Overall weights (country specific analyses) 1 aovwt1
Overall weights (whole of UK analyses) 1 aovwt2
Overall weights (country specific analyses) 2 bovwt1
Overall weights (whole of UK analyses) 2 bovwt2
Overall weights (country specific analyses) 3 covwt1
Overall weights (whole of UK analyses) 3 covwt2
Overall weights (country specific analyses) 4 dovwt1
Overall weights (whole of UK analyses) 4 dovwt2
Overall weights (country specific analyses) 5 eovwt1
Overall weights (whole of UK analyses) 5 eovwt2
Overall weights =
Sampling weights x Attrition weights
Weights are prefixed in alphabetical order depending on the wave
If you are doing an analysis with an outcome at wave 4 use the
corresponding weight at same wave

Applying survey design in Stata: svy
svyset sptn00 [pweight=covwt2], strata(pttype2) fpc(nh2)
• Sptn00: Electoral ward ID.• Covwt2: weight (you need to choose the correct one).• Strata: Stratum ID.• Nh2: finite population coefficient.

MCS datasets and access

Documentation• Guide to the Datasets• Questionnaires (CAPI and paper)• Technical reports on sampling, response and
fieldwork, Data notes• Data Dictionary• User Guides to Initial Findings (per sweep), to
geographical identifiers, psychological scales, derived variables.
• Online bibliography

Available datasets: main survey data MCS1 MCS2 MCS3 MCS4 MCS5 MCS6
Age 9 months 3 years 5 years 7 years 11 years 14 years
Longitudinal family file X X X X X X
Parental interview X X X X X X
Household grid X X X X X X
Child assessment X X X X X
Child measurement X X X
Neighbourhood assessment X
Older siblings X X
Child self completion X X X
Consent to data linkage X X X X X X
Derived variables X X X X X X

Available datasets: additional dataMCS1 MCS2 MCS3 MCS4 MCS5 MCS6
Age 9 months 3 years 5 years 7 years 11 years 14 years
Geographical linked data X X X X
Foundation stage profile X
Teacher survey X X XBirth registration and maternity espisodes X
Health visitor survey X
Oral fluid X X
Activity monitor X X
Time use record X
Nursery observations Undeposited

Access• Registration for UK based researchers has the following steps:• Apply for a username and password. This can be done on this page:
http://www.data-archive.ac.uk/sign-up/credentials-application
• Complete an online registration form after logging in.
• In the process of downloading the data, they will also be asked to register their project online (30 words).
• All that is quick and straight forward.

Access
• Website:http://discover.ukdataservice.ac.uk/series/?sn=2000031• MCS datasets come under three different licence
types:1. End User Licence = easy!2. Special Access Licence = difficult3. Secure Access Licence = difficult & impossible for
non-UK based researchers.

Access• All aforementioned datasets (with End User Licence) are
accessible and downloadable once the users are fully registered.
• Special Licence Access: Hospital of Birth: Special Licence Access. Available to non-UK based researcher, but process more difficult.
• Secure Access: Access to sensitive information such as geographical identifiers and admin data. Possible to link to many datasets. Data are not downloadable and can be access only via remote desktop.

Secure Access – linking Geographical identifiers Possible to link area-level
dataset to MCS:level of poverty of their neighbourhood, presence of services or other amenities, etc.
MCS1-MCS4: Ward level
MCS1-MCS4: Lower Super Output Area
MCS1-MCS4: Output area
Education administrative DatasetsMCS1-MCS4: Linked Education Administrative Dataset - Scotland
MCS1-MCS4: Linked Education Administrative Dataset - Wales
MCS1-MCS4: Linked Education Administrative Dataset - England
Data Structure and Linking Datasets

Linking Datasets
• Understand the layout of the datasets• How you link depends on what you want– Family - bedrooms in household – Interview - Cohort child outcomes– Respondent - income of mother.– Twins and triplets.

Dataset Layout
mcsid ampnum00 ampsex00 .... appnum00 appsex00 ...
M10001N 1 female 2 male
M10002P 1 female 2 male
M10007U 2 male 1 female
M10008V 1 female 2 male
M10011Q 1 female 2 male
mcsid bmpnum00 bmpsex00 .... bppnum00 bppsex00 ...
M10001N 2 male 1 female
M10002P 1 female 2 male
M10007U 2 male 1 female
M10008V 1 female 2 male
M10014T 1 female 2 male
MCS1
MCS2
Sweep 1 Main respondent person no.
Sweep 1 Main respondent sex Sweep 1 Partner respondent
sex
Sweep 1 Partner respondent person no.
MCS Family Identifier
Sweep Identifier ‘b’
Mother not always main respondent
Sometimes they swap around
Families don’t always appear at each sweep

mcsid ampnum00 ampsex00 ....
M10001N 1 female
M10002P 1 female
M10007U 2 male
M10008V 1 female
M10011Q 1 female
mcsid bmpnum00 bmpsex00 ....
M10001N 2 male
M10002P 1 female
M10007U 2 male
M10008V 1 female
M10014T 1 female
MCS1 MCS2
mcsid appnum00 appsex00 ...
M10001N 2 male
M10002P 2 male
M10007U 1 female
M10008V 2 male
M10011Q 2 male
mcsid bppnum00 bppsex00 ...
M10001N 1 female
M10002P 2 male
M10007U 1 female
M10008V 2 male
M10014T 2 male
Stack equivalent variables
Potentially rename variables
Same Respondent Linkage
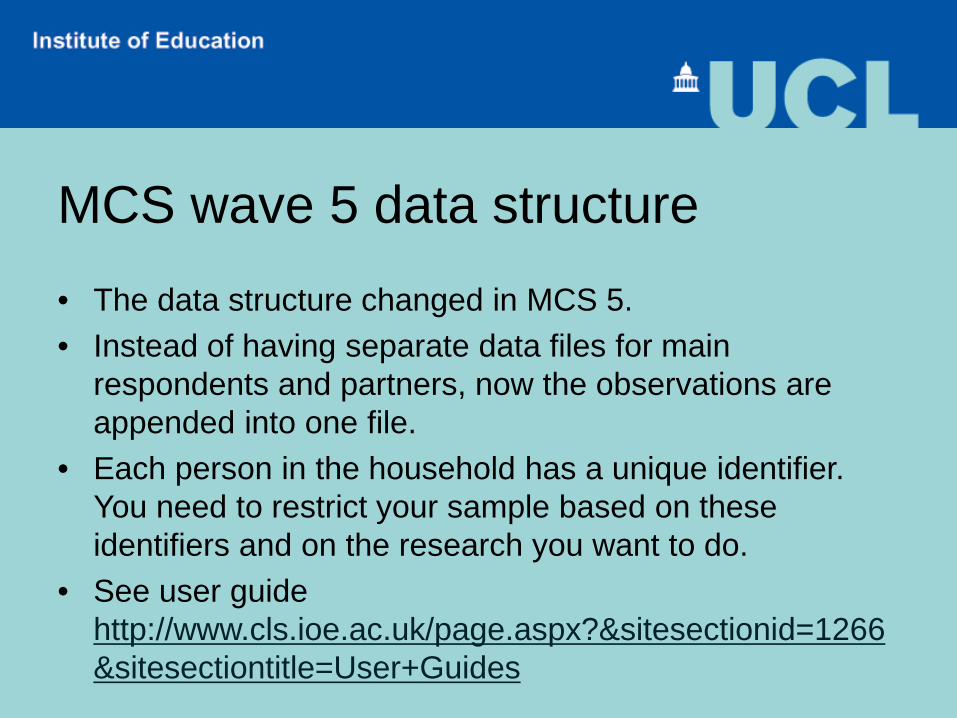
MCS wave 5 data structure• The data structure changed in MCS 5.• Instead of having separate data files for main
respondents and partners, now the observations are appended into one file.
• Each person in the household has a unique identifier. You need to restrict your sample based on these identifiers and on the research you want to do.
• See user guide http://www.cls.ioe.ac.uk/page.aspx?&sitesectionid=1266&sitesectiontitle=User+Guides

Variable Namingcmreofa0 - S3 Main: How often reads to CM C11. c - sweep identifier2. m - respondent identifier3. reof - CAPI Question name
– 0, or a, b, c - cohort member identifier
– 0 or a… - no multi-code on question
• cpreofb0 - S3 Partner: How often reads to CM C2
• c - sweep identifier
• m - respondent identifier
• reof - CAPI Question name
• 0, or a, b, c - cohort member identifier
• 0 or a… - no multi-code on question

Derived Variables• Respondent Identity and Response• Household composition• Ethnicity (Parents/ Carers and Cohort Members)• Education (Highest NVQ)• Employment and Occupation coding• Religion• Income• Housing• Anthropometry• Psychological Scales

Finding Variables
• There are many MCS files and each file contains a huge number of variables
• This can make it difficult to locate specific variables you are interested in
• The questionnaires for each sweep are available on the CLS website, as is a searchable online data dictionary In Stata, command lookfor Allows to search variables and labels based on key words.

Data Dictionary

Website resources
• http://www.cls.ioe.ac.uk/mcs
• http://www.spsstools.net/
• http://www.stata.com/links/resources-for-learningstata/

Tarek MostafaCentre for Longitudinal [email protected]