Embed Size (px)
Citation preview
EPA/600/R-20/327 | October 202 0www.epa.gov/homeland-security-research
Sample Plan Development for Biological Incidents, Large and Small – Trade-Off Tool for Sampling (TOTS)
Office of Research and Development Homeland Security Research Program
Tabletop Exercise Report
EPA 600-R20-327 October 2020
Tabletop Exercise Report
Sample Plan Development for Biological Incidents, Large and Small – Trade-Off Tool for Sampling (TOTS)
M. Worth Calfee, Timothy Boe, Leroy Mickelsen U.S. Environmental Protection Agency Christopher Johnson, Ryan James Battelle Memorial Institute
ii
DISCLAIMER
The U.S. Environmental Protection Agency (EPA) through its Office of Research and Development funded and managed the research described herein under EP-C-16-014 to Battelle Memorial Institute. It has been subjected to the Agency’s review and has been approved for publication. Note that approval does not signify that the contents necessarily reflect the views of the Agency. Any mention of trade names, products, or services does not imply an endorsement by the U.S. Government or EPA. The EPA does not endorse any commercial products, services, or enterprises.
Questions concerning this document or its application should be addressed to:
M. Worth Calfee, Ph.D.Center for Environmental Solutions and Emergency Response (CESER)EPA's Office of Research and DevelopmentPhone: 919-541-7600Fax: [email protected]/homeland-security-research
iii
FOREWORD The U.S. Environmental Protection Agency (EPA) is charged by Congress with protecting the Nation's land, air, and water resources. Under a mandate of national environmental laws, the Agency strives to formulate and implement actions leading to a compatible balance between human activities and the ability of natural systems to support and nurture life. To meet this mandate, EPA's research program is providing data and technical support for solving environmental problems today and building a science knowledge base necessary to manage our ecological resources wisely, understand how pollutants affect our health, and prevent or reduce environmental risks in the future. The Center for Environmental Solutions and Emergency Response (CESER) within the Office of Research and Development (ORD) conducts applied stakeholder-driven research and provides responsive technical support to help solve the Nation’s environmental challenges. The Center’s research focuses on innovative approaches to address environmental challenges associated with the built environment. We develop technologies and decision-support tools to help safeguard public water systems and groundwater, guide sustainable materials management, remediate sites from traditional contamination sources and emerging environmental stressors, and address potential threats from terrorism and natural disasters. CESER collaborates with both public and private sector partners to foster technologies that improve the effectiveness and reduce the cost of compliance, while anticipating emerging problems. We provide technical support to EPA regions and programs, states, tribal nations, and federal partners, and serve as the interagency liaison for EPA in homeland security research and technology. The Center is a leader in providing scientific solutions to protect human health and the environment. Gregory Sayles, Director Center for Environmental Solutions and Emergency Response
iv
Table of Contents
Table of Contents DISCLAIMER ................................................................................................................................ ii FOREWORD ................................................................................................................................. iii Abbreviations/Acronyms ........................................................................................................ viii Executive Summary .................................................................................................................... x
1.0 Introduction ............................................................................................................................... 1
2.0 Trade-Off Tool for Sampling .................................................................................................... 2
2.1 TOTS Overview .................................................................................................................. 2 2.2 TOTS Functionality ............................................................................................................ 2 2.3 TOTS Sampling Techniques ............................................................................................... 3
3.0 Table-top Exercise .................................................................................................................... 4
3.1 TTX Description ................................................................................................................. 4 3.2 TTX Quality Assurance ...................................................................................................... 8 3.3 Scenario 1 –Office Building (Indoor Setting) ..................................................................... 8
3.3.1 Scenario 1a – Develop Sampling Plan for Building Characterization .............................. 9
3.3.2 Scenario 1b – Develop Plan for Clearance Sampling ................................................... 11
3.3.3 Scenario 1c – Develop Plan for Clearance Sampling with Restrictions ........................ 12
3.3.4 Scenario 1d – Develop Plan for Clearance Sampling with Additional Restrictions .................................................................................................................... 14
3.4 Scenario 2 – Outdoor Neighborhood ................................................................................ 17
3.4.1 Scenario 2a – Develop Sampling Plan for Characterization Sampling ......................... 18
3.4.2 Scenario 2b – Develop Sampling Plan for Characterization Sampling (with restrictions) .................................................................................................................... 19
3.4.3 Scenario 2c – Develop a Clearance Sampling Plan with Probabilistic Sampling .......... 21
3.4.4 Scenario 2d – Develop a Clearance Sampling Plan with Additional Restrictions ......... 23
4.0 Table-top Exercise Feedback .................................................................................................. 25
4.1 TOTS TTX Participant Questions/Comments and Discussion on Sample Planning ....... 25
4.1.1 Questions/Comments and Discussion from OSC Academy TTX .................................. 25
4.1.2 Questions/Comments and Discussion from IDC TTX ................................................... 26
4.2 TOTS TTX Participant Feedback (Hotwash) on General TOTS Functionality (combined from both TTX) .......................................................................................................................... 27
v
4.2.1 TOTS TTX Participant Feedback (Hotwash) on Scenario 1 (combined from both TTXs) ..................................................................................................................... 28
4.2.2 TOTS TTX Participant Feedback (Hotwash) on Scenario 2 (combined from both TTX) ....................................................................................................................... 29
4.2.3 TOTS TTX Participant Feedback from OSC Academy Evaluation Forms .................... 29
5.0 Table-top Exercise Conclusions ............................................................................................. 30
6.0 References ............................................................................................................................... 30
Appendix A Class Slides .......................................................................................................... A-1
FIGURES
Figure 1. TOTS ArcMap toolbar. ................................................................................................... 3
Figure 2. Sampling techniques in TOTS (Traditional – left and Innovative – right). .................... 3
Figure 3. One of the TTX Teams working at the OSC Academy TTX.......................................... 6
Figure 4. Indoor office map (right) representing an actual office building (left). Ground floor (right bottom) and 2nd Floor (right top). ............................................................................... 8
Figure 5. Example Scenario 1a TOTS graphic. Includes 444 vacuum cassette placed probabilistically (grid-based design, shown with small squares) and 13 wet vacuum samples (shaded rooms) placed with a targeted approach at a total cost of $273,000. ....................... 9
Figure 6. Example Scenario 1b TOTS graphic. Includes 84 aggressive air samples to cover entire area of the building at a total cost of $80,000. ..................................................................... 11
Figure 8. Example Scenario 1d TOTS graphic. Includes 11 wet vacuum samples and 4 robot floorcleaners (shaded rooms) placed using a targeted approach at a total cost of $12,434. .................15
Figure 9. Scenario 2 neighborhood map....................................................................................... 17
Figure 10. Example Scenario 2a TOTS graphic. Includes 6,945 vacuum cassette samples determined probabilistically at a total cost of $4.3M. ......................................................... 18 Figure 11. Example Scenario 2b TOTS graphic. Includes 238 aggressive air samples placed using a targeted approach (shown with small squares) at a total cost of $227,124 (over 2 days). 20
Figure 12. Example Scenario 2c TOTS graphic. Includes 5,646 wet vacuum samples placed using a probabilistic approach (shown with small squares) at a total cost of $4M (over 23 days) ... 22
vi
Figure 7. Example Scenario 1c TOTS graphic. Includes 391 vacuum cassette samples (small squares) placed using a 95% Hotspot VSP at a total cost of $239,000. ............................... 13
vii
TABLES Table 1. TOTS Teams and Organizations/Expertise ...................................................................... 4 Table 2. Surface Areas for the Areas of Interest ............................................................................. 6 Table 3. Sampling Tool Attributes.................................................................................................. 7 Table 4. Sampling Strategies Available .......................................................................................... 7 Table 5. Scenario 1a Inputs and Results ....................................................................................... 10 Table 6. Scenario 1b Inputs and Results ....................................................................................... 12 Table 7. Scenario 1c Inputs and Results ....................................................................................... 14 Table 8. Scenario 1d Inputs and Results ....................................................................................... 16 Table 9. Scenario 2a Inputs and Results ....................................................................................... 19 Table 10. Scenario 2b Inputs and Results ..................................................................................... 21 Table 11. Scenario 2c Inputs and Results ..................................................................................... 23 Table 12. Scenario 2d Inputs and Results ..................................................................................... 24
Appendix A. TTX Introductory Slides Appendix B. TTX Handouts
viii
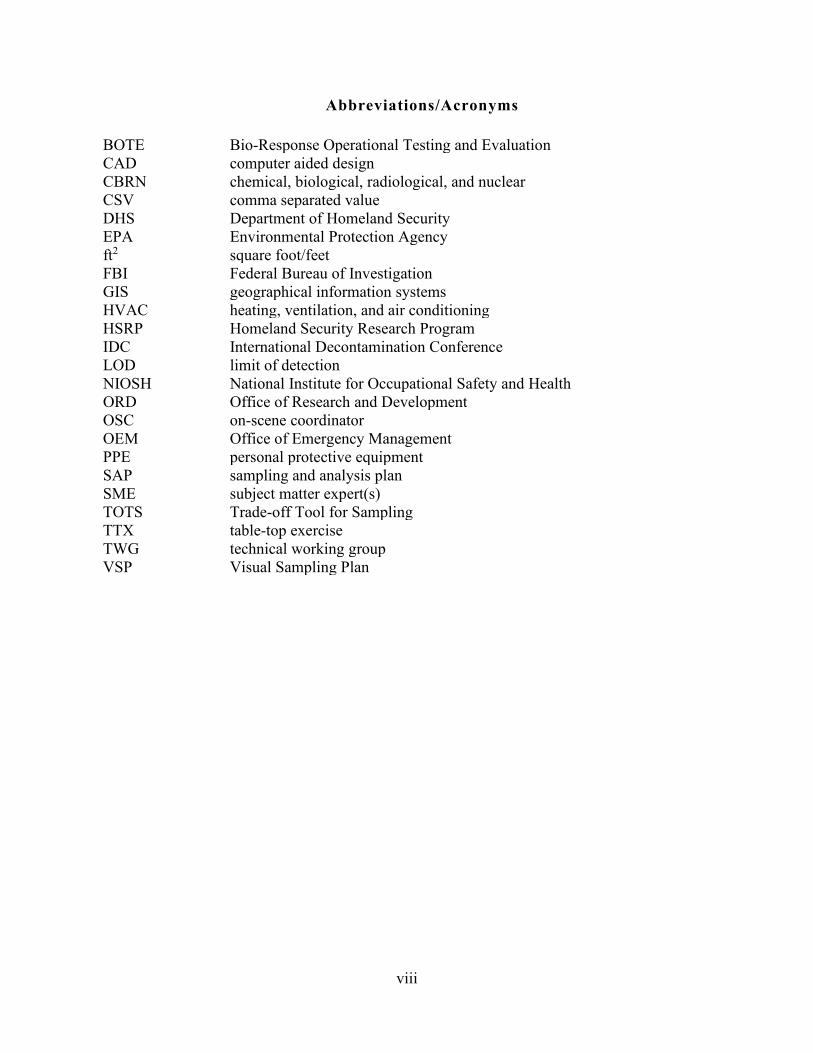
Abbreviations/Acronyms
BOTE Bio-Response Operational Testing and Evaluation CAD computer aided design CBRN chemical, biological, radiological, and nuclear CSV comma separated value DHS Department of Homeland Security EPA Environmental Protection Agency ft2 square foot/feet FBI Federal Bureau of Investigation GIS geographical information systems HVAC heating, ventilation, and air conditioning HSRP Homeland Security Research Program IDC International Decontamination Conference LOD limit of detection NIOSH National Institute for Occupational Safety and Health ORD Office of Research and Development OSC on-scene coordinator OEM Office of Emergency Management PPE personal protective equipment SAP sampling and analysis plan SME subject matter expert(s) TOTS Trade-off Tool for Sampling TTX table-top exercise TWG technical working group VSP Visual Sampling Plan
ix
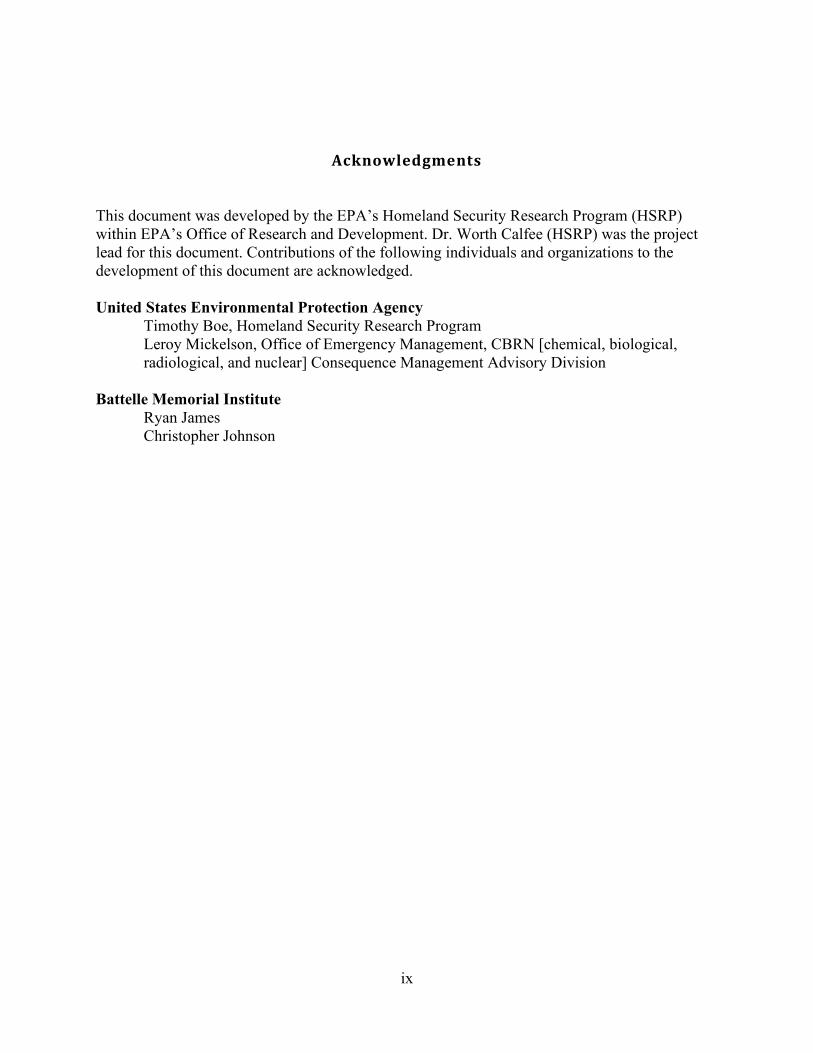
Acknowledgments
This document was developed by the EPA’s Homeland Security Research Program (HSRP) within EPA’s Office of Research and Development. Dr. Worth Calfee (HSRP) was the project lead for this document. Contributions of the following individuals and organizations to the development of this document are acknowledged.
United States Environmental Protection Agency Timothy Boe, Homeland Security Research Program Leroy Mickelson, Office of Emergency Management, CBRN [chemical, biological, radiological, and nuclear] Consequence Management Advisory Division
Battelle Memorial Institute Ryan James Christopher Johnson
x
Executive Summary
The Trade-off Tool for Sampling (TOTS) is a tool under development that aids planners, responders, and subject matter experts in developing defensible yet practicable sample collection plans following a biological contamination incident. The U.S. Environmental Protection Agency (EPA) held a table-top exercise (TTX) with two separate groups of people. The purpose of the TTX was to gather critical end-user feedback on the utility of the tool for future revisions of TOTS and to increase collective (responders, planners, and researchers) understanding of challenges during the sampling and analysis plan (SAP) development for biological incidents, all for the goal of strengthening EPA’s capabilities in this area. The first TTX session was held at the 2019 EPA International Decontamination Conference in Norfolk, Virginia (November 18, 2019), and the second TTX session was held at the EPA On-scene Coordinator (OSC) Academy in Chicago, Illinois (February 26, 2020). The ultimate goal is to provide EPA planners and operational personnel (e.g., on-scene coordinators) the tools and resources necessary to effectively and efficiently plan and execute EPA’s response obligations.
For this TTX, several contamination response scenarios were provided to the participants (as will be described thoroughly throughout this report), each including unique requirements or resource restrictions. During each TTX session, the participants were divided into teams of four to six people who gathered around a computer with TOTS capability to work through the scenarios. While friendly competition between the teams was beneficial, the goal of each TTX session was not to “win” the scenario. Specifically, the objectives of the TTX sessions were as follows:
• To provide feedback of the strengths and limitations of TOTS to improve tool utility• To compare resource requirements (cost, time, staffing, laboratories, etc.) for various
sampling plans developed for biological contamination scenarios• To determine which factors (targeted or probabilistic, number of samples, sample
collection methods, etc.) have the greatest impact on time and resource demand• To identify critical information and capabilities required for effective SAP development• To identify gaps in capabilities and in knowledge to inform future research.
The two TTX sessions have provided valuable feedback. Through the use of TOTS (facilitated by experienced ArcGIS users), a significant benefit was that the teams clearly developed an increased operational understanding of the use of innovative sampling approaches. The scenarios were designed to provide an opportunity to evaluate targeted and probabilistic sampling plans (using traditional and innovative sampling approaches) to understand their respective strengths and weaknesses. As the teams progressed through Scenarios 1 and 2, they tended to increase the use of the targeted innovative sampling approaches (and thus decreased time and cost).
The biggest challenge surrounding TOTS remains the requirement of having experienced ArcGIS users available for those who want to utilize TOTS. TOTS has been shown to be a valuable training tool for responders, and as TTX sessions are performed more frequently, perhaps there could be several OSCs who are identified as being willing to assist with conducting analyses using TOTS when required (thus increasing its practical use in the field), which would expand its use beyond only being a research or training tool.
Trade-Off Tool for Sampling (TOTS) Tabletop Exercise Date: 9/28/20 Final Report Page 1 of 43
1
1.0 Introduction
The Homeland Security Research Program in the U.S. Environmental Protection Agency’s (EPA’s) Office of Research and Development strives to support EPA’s chemical, biological, radiation and nuclear (CBRN) response capabilities through the research and development of scientific solutions such as data tools that aid in response planning and decision making. The Trade-off Tool for Sampling (TOTS) is one such tool under development that aids planners, responders, and subject matter experts in developing defensible, yet practicable, sample collection plans. TOTS employs a user-friendly graphical interface that facilitates the design of sampling and analysis plans (SAPs) with immediate feedback on the cost, time, and resource requirements for each SAP.
The ultimate goal of TOTS is to provide EPA planners and operational personnel (e.g., on-scene coordinators) the tools and resources necessary to effectively and efficiently plan and execute EPA’s response obligations following a biological incident. EPA held a table-top exercise (TTX) on two separate occasions to gather critical end-user feedback on the utility of the tool for future revisions and to increase collective understanding by responders, planners, and researchers of challenges during SAP development for biological incidents, all for the goal of strengthening EPA’s capabilities in this area. The first TTX session was held at the 2019 EPA International Decontamination Conference in Norfolk, Virginia (November 18, 2019), and the second TTX session was held at the EPA On-scene Coordinator Academy in Chicago, Illinois (February 26, 2020).
For this TTX, several contamination response scenarios were provided to the participants (as will be described thoroughly throughout this report), each including unique requirements or resource restrictions. During each TTX session, the participants were divided into teams of four to six people who gathered around a computer with TOTS capability to work through the scenarios. While friendly competition between the teams was generated, the goal of the TTX sessions was not to “win” the scenario. Specifically, the goal of the TTX sessions were as follows:
• To provide feedback on the strengths and limitations of TOTS to improve tool utility• To compare resource requirements (cost, time, staffing, laboratories, etc.) for various
sampling plans developed for biological contamination scenarios• To determine which factors (targeted or probabilistic, number of samples, sample
collection methods, etc.) have the greatest impact on time and resource demand• To identify critical information and capabilities required for effective SAP development• To identify gaps in capabilities and in knowledge to inform future research
This report provides a description of the TTX scenarios, gives examples of how teams approached the response scenarios (using TOTS) to determine resource needs for sampling plans, shows graphics depicting the shape files resulting from using TOTS to develop said sampling plans, and documents the feedback received from the participants on the function and usability of TOTS.
Trade-Off Tool for Sampling (TOTS) Tabletop Exercise Date: 9/28/20 Final Report Page 2 of 43
2
2.0 Trade-Off Tool for Sampling
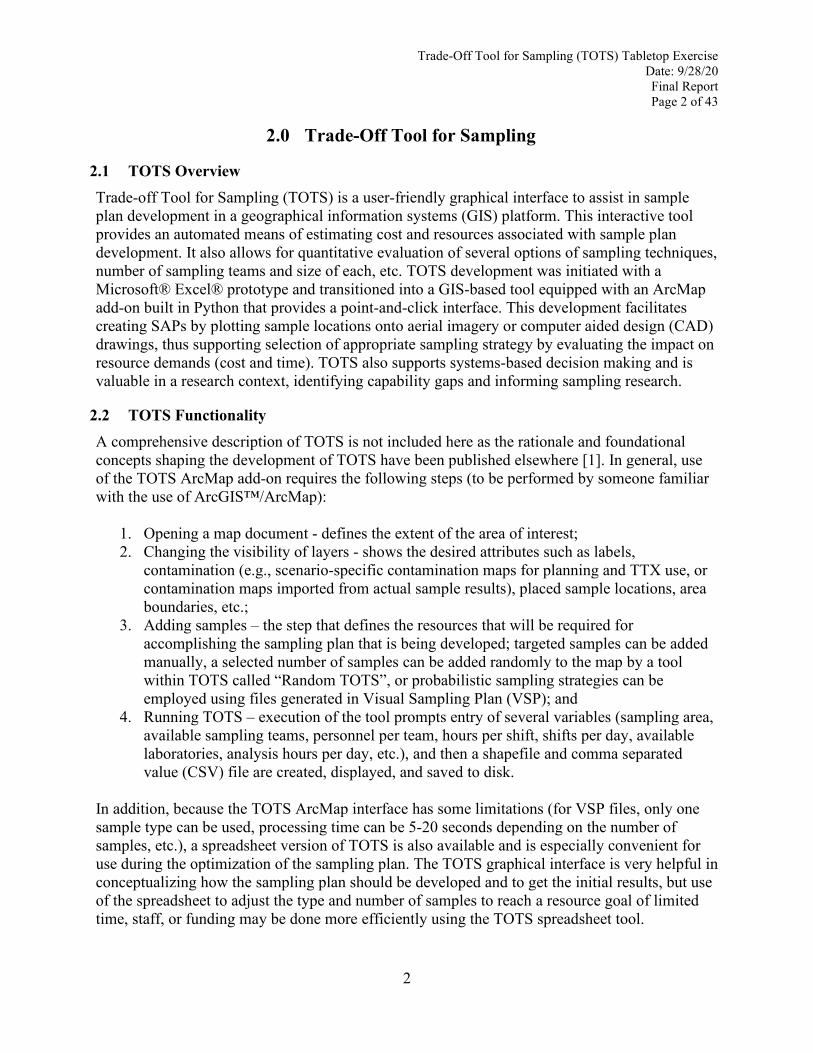
2.1 TOTS Overview Trade-off Tool for Sampling (TOTS) is a user-friendly graphical interface to assist in sample plan development in a geographical information systems (GIS) platform. This interactive tool provides an automated means of estimating cost and resources associated with sample plan development. It also allows for quantitative evaluation of several options of sampling techniques, number of sampling teams and size of each, etc. TOTS development was initiated with a Microsoft® Excel® prototype and transitioned into a GIS-based tool equipped with an ArcMap add-on built in Python that provides a point-and-click interface. This development facilitates creating SAPs by plotting sample locations onto aerial imagery or computer aided design (CAD) drawings, thus supporting selection of appropriate sampling strategy by evaluating the impact on resource demands (cost and time). TOTS also supports systems-based decision making and is valuable in a research context, identifying capability gaps and informing sampling research.
2.2 TOTS Functionality A comprehensive description of TOTS is not included here as the rationale and foundational concepts shaping the development of TOTS have been published elsewhere [1]. In general, use of the TOTS ArcMap add-on requires the following steps (to be performed by someone familiar with the use of ArcGIS™/ArcMap):
1. Opening a map document - defines the extent of the area of interest;2. Changing the visibility of layers - shows the desired attributes such as labels,
contamination (e.g., scenario-specific contamination maps for planning and TTX use, orcontamination maps imported from actual sample results), placed sample locations, areaboundaries, etc.;
3. Adding samples – the step that defines the resources that will be required foraccomplishing the sampling plan that is being developed; targeted samples can be addedmanually, a selected number of samples can be added randomly to the map by a toolwithin TOTS called “Random TOTS”, or probabilistic sampling strategies can beemployed using files generated in Visual Sampling Plan (VSP); and
4. Running TOTS – execution of the tool prompts entry of several variables (sampling area,available sampling teams, personnel per team, hours per shift, shifts per day, availablelaboratories, analysis hours per day, etc.), and then a shapefile and comma separatedvalue (CSV) file are created, displayed, and saved to disk.
In addition, because the TOTS ArcMap interface has some limitations (for VSP files, only one sample type can be used, processing time can be 5-20 seconds depending on the number of samples, etc.), a spreadsheet version of TOTS is also available and is especially convenient for use during the optimization of the sampling plan. The TOTS graphical interface is very helpful in conceptualizing how the sampling plan should be developed and to get the initial results, but use of the spreadsheet to adjust the type and number of samples to reach a resource goal of limited time, staff, or funding may be done more efficiently using the TOTS spreadsheet tool.
Trade-Off Tool for Sampling (TOTS) Tabletop Exercise Date: 9/28/20 Final Report Page 3 of 43
3
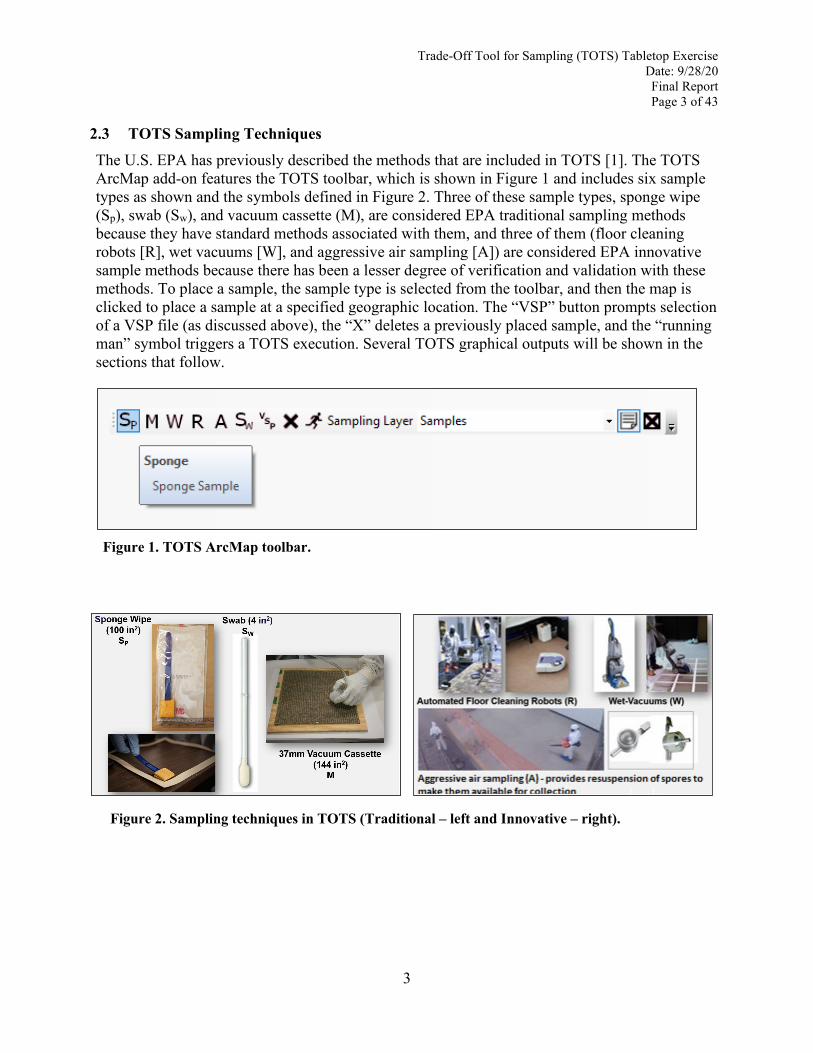
2.3 TOTS Sampling Techniques The U.S. EPA has previously described the methods that are included in TOTS [1]. The TOTS ArcMap add-on features the TOTS toolbar, which is shown in Figure 1 and includes six sample types as shown and the symbols defined in Figure 2. Three of these sample types, sponge wipe (Sp), swab (Sw), and vacuum cassette (M), are considered EPA traditional sampling methods because they have standard methods associated with them, and three of them (floor cleaning robots [R], wet vacuums [W], and aggressive air sampling [A]) are considered EPA innovative sample methods because there has been a lesser degree of verification and validation with these methods. To place a sample, the sample type is selected from the toolbar, and then the map is clicked to place a sample at a specified geographic location. The “VSP” button prompts selection of a VSP file (as discussed above), the “X” deletes a previously placed sample, and the “running man” symbol triggers a TOTS execution. Several TOTS graphical outputs will be shown in the sections that follow.
Figure 2. TOTS ArcMap Toolbar. Figure 1. TOTS ArcMap toolbar.
Figure 2. Sampling techniques in TOTS (Traditional – left and Innovative – right).
Trade-Off Tool for Sampling (TOTS) Tabletop Exercise Date: 9/28/20 Final Report Page 4 of 43
4
3.0 Table-top Exercise
One TTX session was held at the EPA OSC Academy in Chicago, Illinois (February 26, 2020), and another TTX session was held in conjunction with the 2019 EPA International Decontamination Conference (IDC) in Norfolk, Virginia (November 18, 2019). The ultimate goal was to introduce EPA planners and operational personnel (e.g., on-scene coordinators) to the tools and resources necessary to effectively and efficiently plan and execute EPA’s response obligations.
Several contamination response scenarios were provided to the participants (as described below), each including unique requirements or resource restrictions. During each TTX session, the participants were divided into TOTS teams of four to six people who each gathered around a computer with TOTS capability to work through the scenarios.
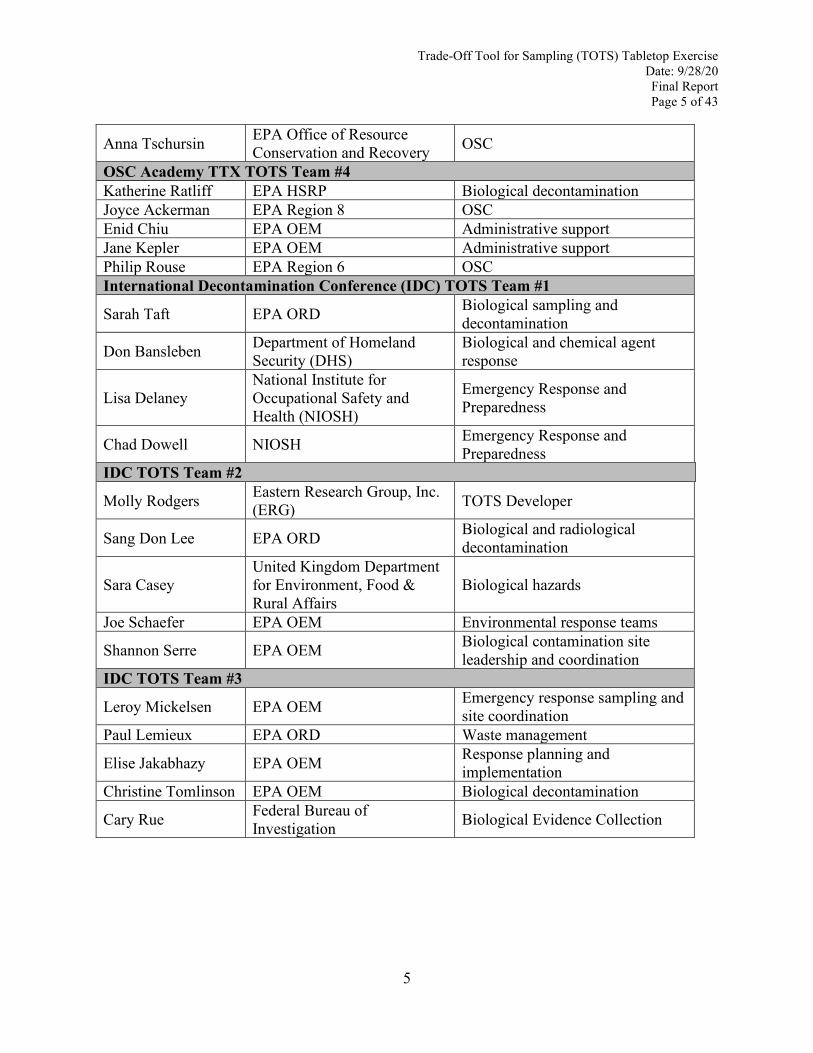
3.1 TTX Description The IDC TTX consisted of three TOTS teams, and the OSC Academy TTX consisted of four TOTS teams. Table 1 shows the members of each TOTS team and their organization/expertise.
Table 1. TOTS Teams and Organizations/Expertise Name Organization Expertise OSC Academy TTX TOTS Team #1
John Archer EPA Office of Research and Development (ORD)
Aerosol sampling and personnel decontamination
Steve Touw EPA Region 2 On-scene Coordinator (OSC) Chris Wagner EPA Region 3 OSC
Adam Broughton Iowa Department of Natural Resources OSC
Eric Nold EPA Region 7 OSC Kirk Mammoliti EPA Region 7 OSC OSC Academy TTX TOTS Team #2
Lukas Oudejans EPA ORD Biological and chemical agent sampling and decontamination
Jennifer Gundersen EPA Office of Emergency Management (OEM) OSC
Cathy Young EPA Region 1 OSC Mark Durno EPA Region 5 OSC Alex Sherrin EPA Region 1 OSC Greg Bazley EPA Region 9 OSC OSC Academy TTX TOTS Team #3
Leroy Mickelsen EPA OEM Emergency response sampling and site coordination
Lawrence Kaelin EPA OEM OSC James Mitchell EPA Region 5 OSC David Rees EPA Region 5 OSC
Trade-Off Tool for Sampling (TOTS) Tabletop Exercise Date: 9/28/20 Final Report Page 5 of 43
5
Anna Tschursin EPA Office of Resource Conservation and Recovery OSC
OSC Academy TTX TOTS Team #4 Katherine Ratliff EPA HSRP Biological decontamination Joyce Ackerman EPA Region 8 OSC Enid Chiu EPA OEM Administrative support Jane Kepler EPA OEM Administrative support Philip Rouse EPA Region 6 OSC International Decontamination Conference (IDC) TOTS Team #1
Sarah Taft EPA ORD Biological sampling and decontamination
Don Bansleben Department of Homeland Security (DHS)
Biological and chemical agent response
Lisa Delaney National Institute for Occupational Safety and Health (NIOSH)
Emergency Response and Preparedness
Chad Dowell NIOSH Emergency Response and Preparedness
IDC TOTS Team #2
Molly Rodgers Eastern Research Group, Inc. (ERG) TOTS Developer
Sang Don Lee EPA ORD Biological and radiological decontamination
Sara Casey United Kingdom Department for Environment, Food & Rural Affairs
Biological hazards
Joe Schaefer EPA OEM Environmental response teams
Shannon Serre EPA OEM Biological contamination site leadership and coordination
IDC TOTS Team #3
Leroy Mickelsen EPA OEM Emergency response sampling and site coordination
Paul Lemieux EPA ORD Waste management
Elise Jakabhazy EPA OEM Response planning and implementation
Christine Tomlinson EPA OEM Biological decontamination
Cary Rue Federal Bureau of Investigation Biological Evidence Collection
Trade-Off Tool for Sampling (TOTS) Tabletop Exercise Date: 9/28/20 Final Report Page 6 of 43
6
Area of Interest Square Feet
Single Building 7400
Neighborhood Building Footprints 142746 Neighborhood Outdoors (large) 1742824 Neighborhood Outdoors (small) 661500 Neighborhood Combined (large) 1885570 Neighborhood Combined (small) 804246
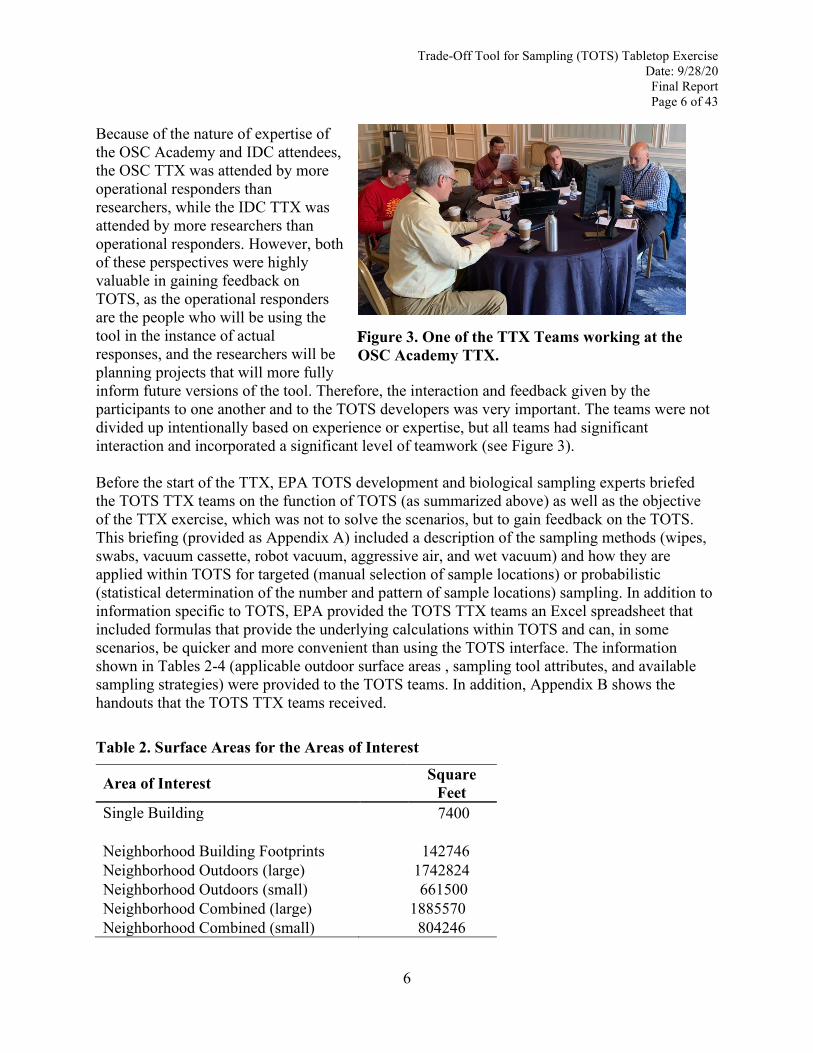
Because of the nature of expertise of the OSC Academy and IDC attendees, the OSC TTX was attended by more operational responders than researchers, while the IDC TTX was attended by more researchers than operational responders. However, both of these perspectives were highly valuable in gaining feedback on TOTS, as the operational responders are the people who will be using the tool in the instance of actual FFigure 3. One of the TTX Teams working at the responses, and the researchers will be OSC Academy TTX. planning projects that will more fully inform future versions of the tool. Therefore, the interaction and feedback given by the participants to one another and to the TOTS developers was very important. The teams were not divided up intentionally based on experience or expertise, but all teams had significant interaction and incorporated a significant level of teamwork (see Figure 3).
Before the start of the TTX, EPA TOTS development and biological sampling experts briefed the TOTS TTX teams on the function of TOTS (as summarized above) as well as the objective of the TTX exercise, which was not to solve the scenarios, but to gain feedback on the TOTS. This briefing (provided as Appendix A) included a description of the sampling methods (wipes, swabs, vacuum cassette, robot vacuum, aggressive air, and wet vacuum) and how they are applied within TOTS for targeted (manual selection of sample locations) or probabilistic (statistical determination of the number and pattern of sample locations) sampling. In addition to information specific to TOTS, EPA provided the TOTS TTX teams an Excel spreadsheet that included formulas that provide the underlying calculations within TOTS and can, in some scenarios, be quicker and more convenient than using the TOTS interface. The information shown in Tables 2-4 (applicable outdoor surface areas , sampling tool attributes, and available sampling strategies) were provided to the TOTS teams. In addition, Appendix B shows the handouts that the TOTS TTX teams received.
Table 2. Surface Areas for the Areas of Interest
Trade-Off Tool for Sampling (TOTS) Tabletop Exercise Date: 9/28/20 Final Report Page 7 of 43
7
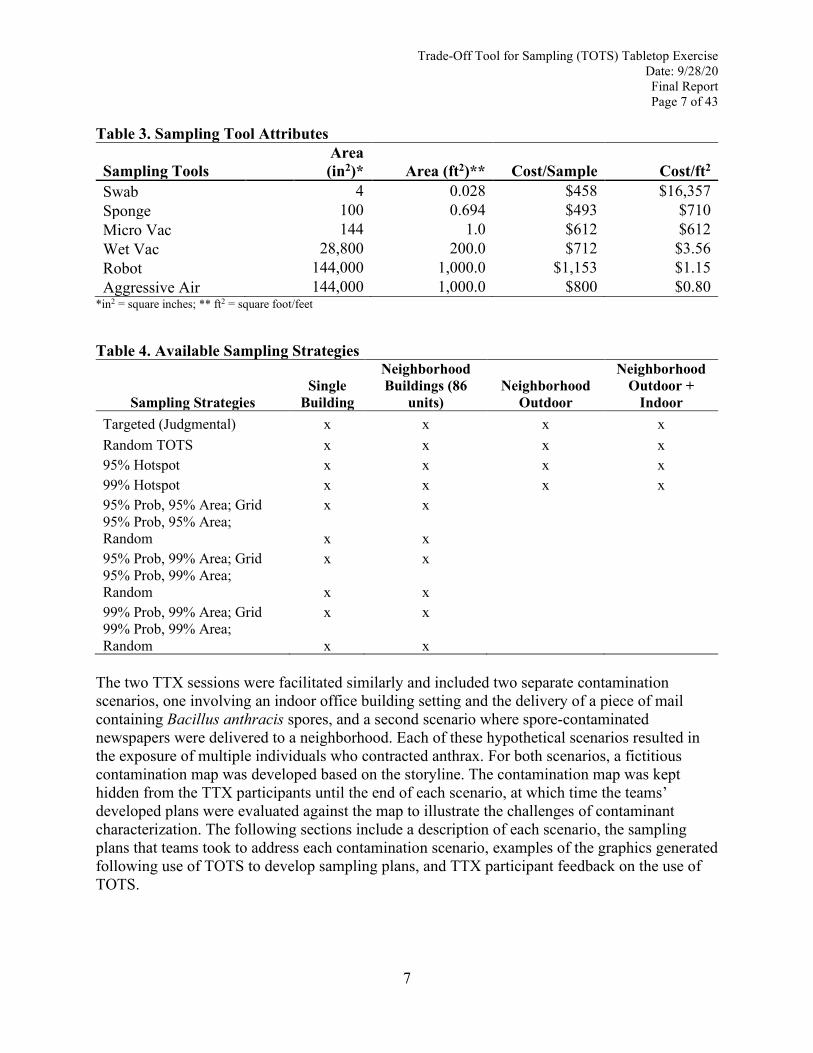
Table 3. Sampling Tool Attributes
Sampling Tools Area (in2)* Area (ft2)** Cost/Sample Cost/ft2
Swab 4 0.028 $458 $16,357 Sponge 100 0.694 $493 $710 Micro Vac 144 1.0 $612 $612 Wet Vac 28,800 200.0 $712 $3.56 Robot 144,000 1,000.0 $1,153 $1.15 Aggressive Air 144,000 1,000.0 $800 $0.80
*in2 = square inches; ** ft2 = square foot/feet
Table 4. Available Sampling Strategies
Sampling Strategies Single
Building
Neighborhood Buildings (86
units) Neighborhood
Outdoor
Neighborhood Outdoor +
Indoor Targeted (Judgmental) x x x x Random TOTS x x x x 95% Hotspot x x x x 99% Hotspot x x x x 95% Prob, 95% Area; Grid x x 95% Prob, 95% Area; Random x x 95% Prob, 99% Area; Grid x x 95% Prob, 99% Area; Random x x 99% Prob, 99% Area; Grid x x 99% Prob, 99% Area; Random x x
The two TTX sessions were facilitated similarly and included two separate contamination scenarios, one involving an indoor office building setting and the delivery of a piece of mail containing Bacillus anthracis spores, and a second scenario where spore-contaminated newspapers were delivered to a neighborhood. Each of these hypothetical scenarios resulted in the exposure of multiple individuals who contracted anthrax. For both scenarios, a fictitious contamination map was developed based on the storyline. The contamination map was kept hidden from the TTX participants until the end of each scenario, at which time the teams’ developed plans were evaluated against the map to illustrate the challenges of contaminant characterization. The following sections include a description of each scenario, the sampling plans that teams took to address each contamination scenario, examples of the graphics generated following use of TOTS to develop sampling plans, and TTX participant feedback on the use of TOTS.
Trade-Off Tool for Sampling (TOTS) Tabletop Exercise Date: 9/28/20 Final Report Page 8 of 43
8
3.2 TTX Quality Assurance Quality assurance/quality control procedures were performed in accordance with the project quality requirements. Given that no experimental data was collected and no secondary data was directly used, no audits were performed. The EPA quality assurance staff reviewed the report and confirmed technical accuracy and consistency in the description of the TOTS TTX.
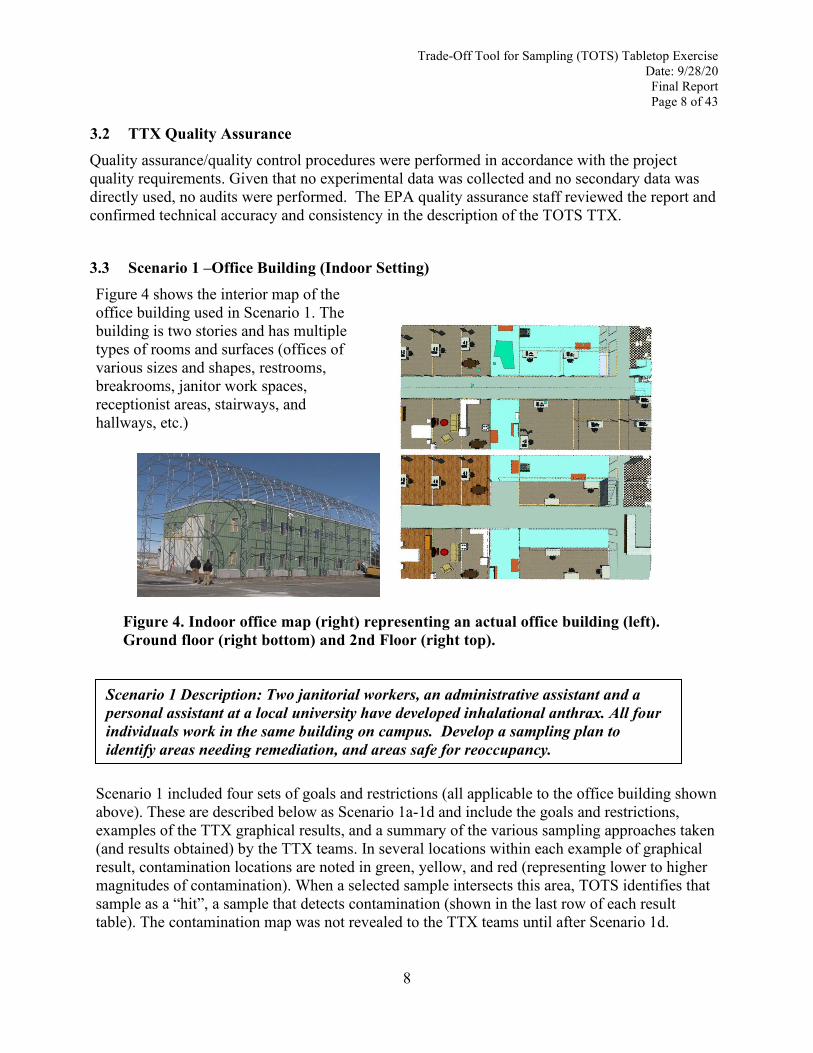
3.3 Scenario 1 –Office Building (Indoor Setting) Figure 4 shows the interior map of the office building used in Scenario 1. The building is two stories and has multiple types of rooms and surfaces (offices of various sizes and shapes, restrooms, breakrooms, janitor work spaces, receptionist areas, stairways, and hallways, etc.)
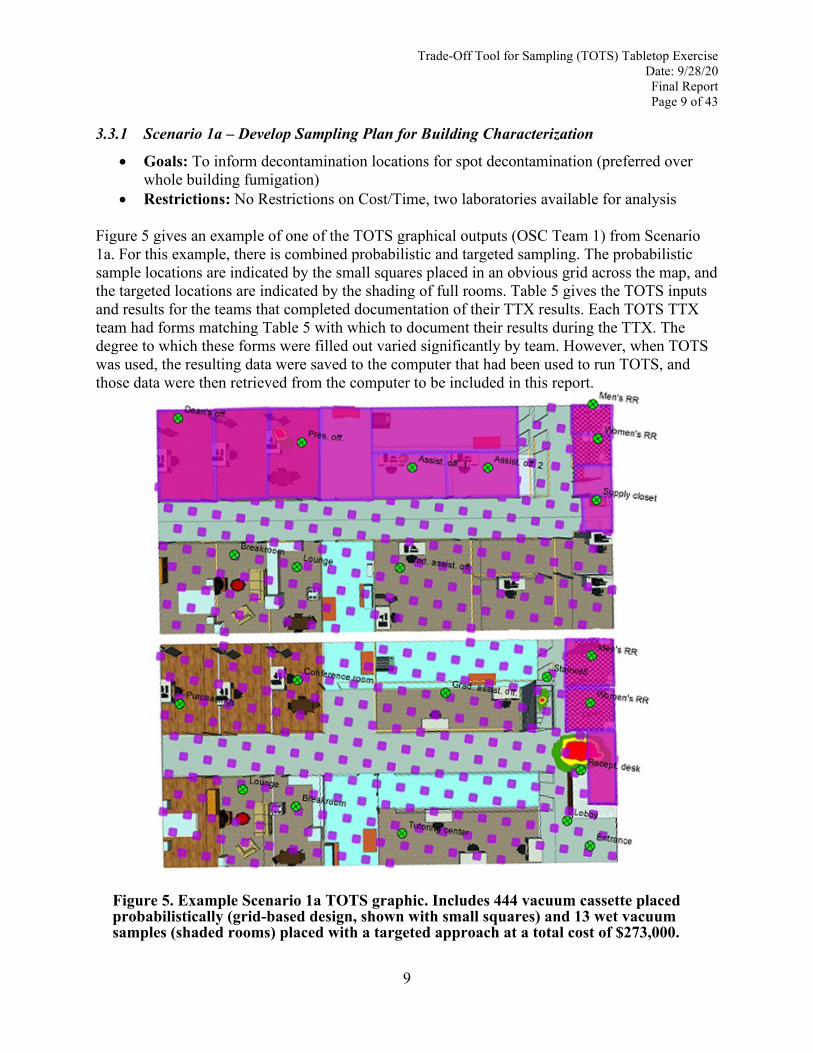
Scenario 1 included four sets of goals and restrictions (all applicable to the office building shown above). These are described below as Scenario 1a-1d and include the goals and restrictions, examples of the TTX graphical results, and a summary of the various sampling approaches taken (and results obtained) by the TTX teams. In several locations within each example of graphical result, contamination locations are noted in green, yellow, and red (representing lower to higher magnitudes of contamination). When a selected sample intersects this area, TOTS identifies that sample as a “hit”, a sample that detects contamination (shown in the last row of each result table). The contamination map was not revealed to the TTX teams until after Scenario 1d.
Scenario 1 Description: Two janitorial workers, an administrative assistant and a personal assistant at a local university have developed inhalational anthrax. All four individuals work in the same building on campus. Develop a sampling plan to identify areas needing remediation, and areas safe for reoccupancy.
Figure 4. Indoor office map (right) representing an actual office building (left). Ground floor (right bottom) and 2nd Floor (right top).
Trade-Off Tool for Sampling (TOTS) Tabletop Exercise Date: 9/28/20 Final Report Page 9 of 43
9
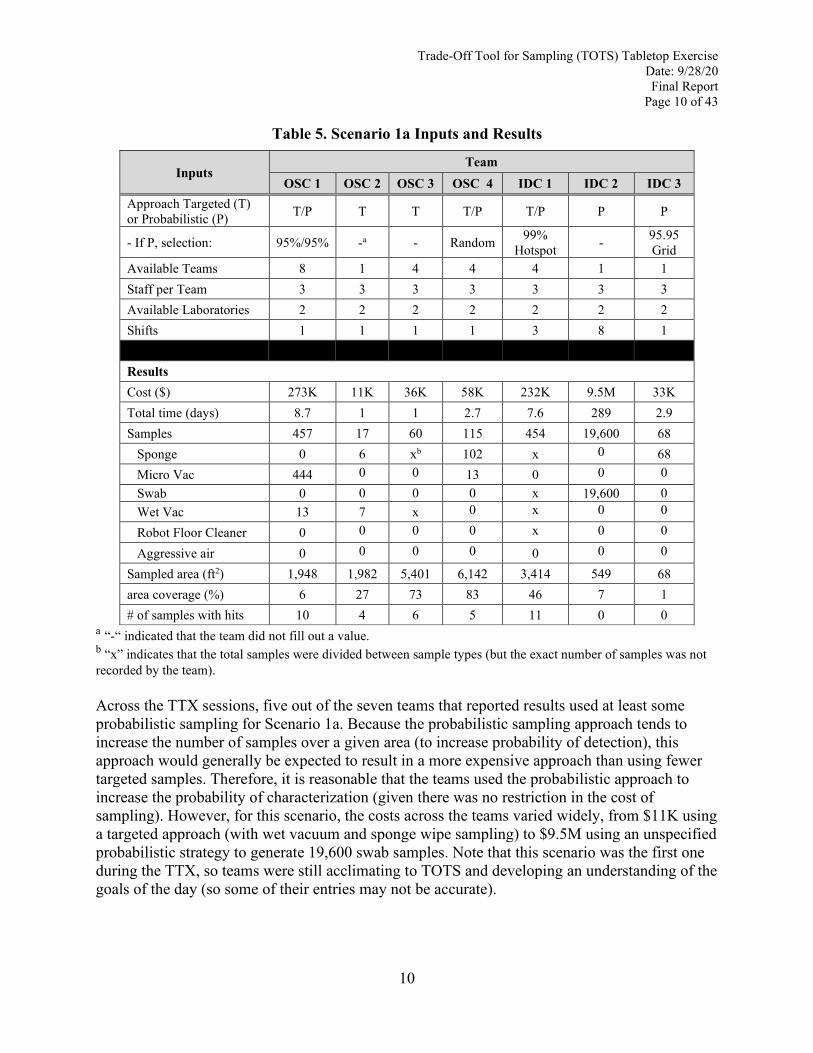
3.3.1 Scenario 1a – Develop Sampling Plan for Building Characterization
• Goals: To inform decontamination locations for spot decontamination (preferred overwhole building fumigation)
• Restrictions: No Restrictions on Cost/Time, two laboratories available for analysis
Figure 5 gives an example of one of the TOTS graphical outputs (OSC Team 1) from Scenario 1a. For this example, there is combined probabilistic and targeted sampling. The probabilistic sample locations are indicated by the small squares placed in an obvious grid across the map, and the targeted locations are indicated by the shading of full rooms. Table 5 gives the TOTS inputs and results for the teams that completed documentation of their TTX results. Each TOTS TTX team had forms matching Table 5 with which to document their results during the TTX. The degree to which these forms were filled out varied significantly by team. However, when TOTS was used, the resulting data were saved to the computer that had been used to run TOTS, and those data were then retrieved from the computer to be included in this report.
Figure 5. Example Scenario 1a TOTS graphic. Includes 444 vacuum cassette placedprobabilistically (grid-based design, shown with small squares) and 13 wet vacuum samples (shaded rooms) placed with a targeted approach at a total cost of $273,000.
Trade-Off Tool for Sampling (TOTS) Tabletop Exercise Date: 9/28/20 Final Report
Page 10 of 43
10
Table 5. Scenario 1a Inputs and Results
Inputs Team
OSC 1 OSC 2 OSC 3 OSC 4 IDC 1 IDC 2 IDC 3 Approach Targeted (T) or Probabilistic (P) T/P T T T/P T/P P P
- If P, selection: 95%/95% -a - Random 99% Hotspot - 95.95
Grid Available Teams 8 1 4 4 4 1 1 Staff per Team 3 3 3 3 3 3 3 Available Laboratories 2 2 2 2 2 2 2 Shifts 1 1 1 1 3 8 1
Results - Results Cost ($) 273K 11K 36K 58K 232K 9.5M 33K Total time (days) 8.7 1 1 2.7 7.6 289 2.9 Samples 457 17 60 115 454 19,600 68 Sponge 0 6 xb 102 x 0 68 Micro Vac 444 0 0 13 0 0 0 Swab 0 0 0 0 x 19,600 0 Wet Vac 13 7 x 0 x 0 0
Robot Floor Cleaner 0 0 0 0 x 0 0
Aggressive air 0 0 0 0 0 0 0
Sampled area (ft2) 1,948 1,982 5,401 6,142 3,414 549 68 area coverage (%) 6 27 73 83 46 7 1 # of samples with hits 10 4 6 5 11 0 0
a “-“ indicated that the team did not fill out a value. b “x” indicates that the total samples were divided between sample types (but the exact number of samples was not recorded by the team).
Across the TTX sessions, five out of the seven teams that reported results used at least some probabilistic sampling for Scenario 1a. Because the probabilistic sampling approach tends to increase the number of samples over a given area (to increase probability of detection), this approach would generally be expected to result in a more expensive approach than using fewer targeted samples. Therefore, it is reasonable that the teams used the probabilistic approach to increase the probability of characterization (given there was no restriction in the cost of sampling). However, for this scenario, the costs across the teams varied widely, from $11K using a targeted approach (with wet vacuum and sponge wipe sampling) to $9.5M using an unspecified probabilistic strategy to generate 19,600 swab samples. Note that this scenario was the first one during the TTX, so teams were still acclimating to TOTS and developing an understanding of the goals of the day (so some of their entries may not be accurate).
Trade-Off Tool for Sampling (TOTS) Tabletop Exercise Date: 9/28/20 Final Report
Page 11 of 43
11
3.3.2 Scenario 1b – Develop Plan for Clearance Sampling
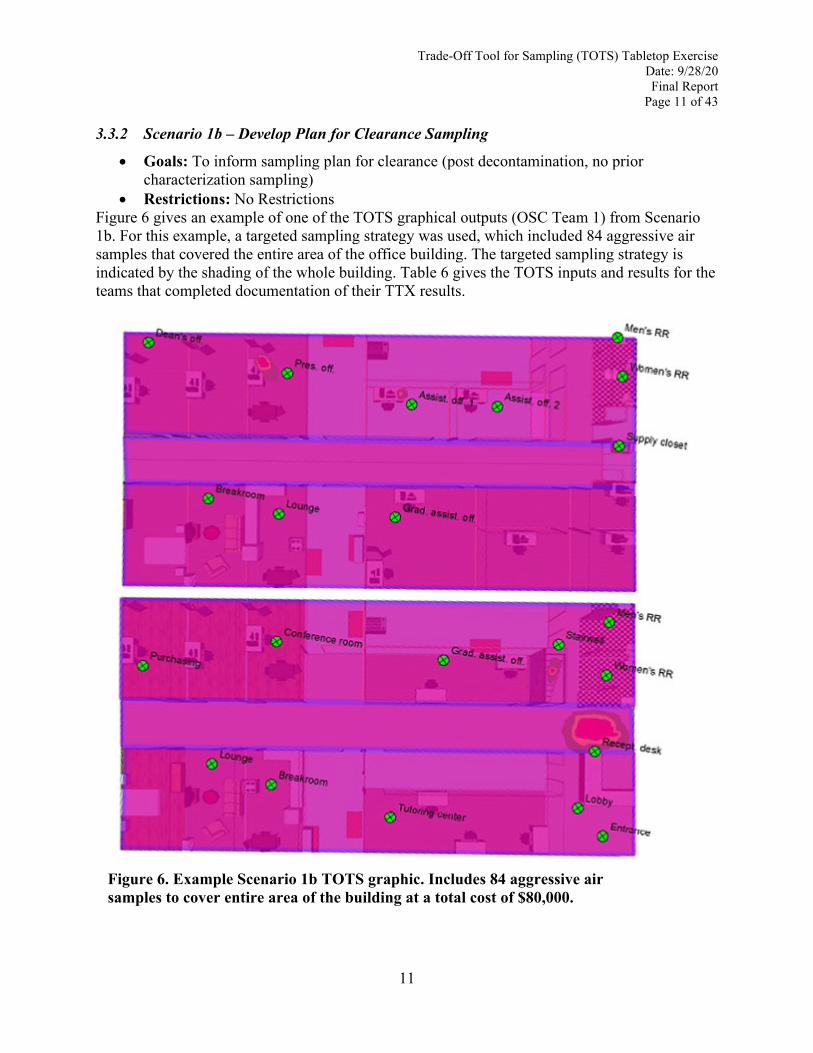
• Goals: To inform sampling plan for clearance (post decontamination, no priorcharacterization sampling)
• Restrictions: No RestrictionsFigure 6 gives an example of one of the TOTS graphical outputs (OSC Team 1) from Scenario 1b. For this example, a targeted sampling strategy was used, which included 84 aggressive air samples that covered the entire area of the office building. The targeted sampling strategy is indicated by the shading of the whole building. Table 6 gives the TOTS inputs and results for the teams that completed documentation of their TTX results.
Figure 6. Example Scenario 1b TOTS graphic. Includes 84 aggressive air samples to cover entire area of the building at a total cost of $80,000.
Trade-Off Tool for Sampling (TOTS) Tabletop Exercise Date: 9/28/20 Final Report
Page 12 of 43
12
Table 6. Scenario 1b Inputs and Results
Inputs Team
OSC 1 OSC 2 OSC 3 OSC 4 IDC 1 IDC 2 IDC 3 Approach Targeted (T) or Probabilistic (P) T -a P T P T P
- If P, selection: - - 95%/95% Random - 99/99
Grid - 99/99 Grid
Available Teams 2 - 6 4 4 10 6 Staff per team 3 - 3 3 3 3 3 Available Laboratories - - 6 10 2 3 2 Shifts 1 - 1 1 3 2 Results - Results - Cost ($) 80K - 31K 114K 354K 8.6K 270K Total time (days) 6.5 - 0.4 5 9.9 1.6 9 Samples 84 - 63 128 637 90 549 Sponge 0 - 63 0 549 0 549 Micro Vac 0 - 0 0 0 0 0 Swab 0 - 0 0 0 0 0 Wet Vac 0 - 0 xb 0 0 0 Robot Floor Cleaner 0 - 0 x 0 0 0 Aggressive air 84 - 0 x 2 x 0 Sampled area (ft2) 7,076 - 62 21,312 - - 518 Area coverage (%) 96 - 1 288c 101 100 7 # of samples with hits 4 - - 6 10 - 8
a “-“ indicated that the team did not fill out a value. b “x” indicates that the total samples were divided between sample types (but the exact number of samples was not recorded by the team) c Sampling area coverage can be greater than 100% if sampling areas overlap one another.
Across the TTX sessions, three teams used probabilistic sampling strategies and three teams used targeted sampling strategies for Scenario 1b. The use of probabilistic sampling may have been driven because there were no budget or time restrictions in this scenario, therefore, minimizing the number of samples and sample locations was not a priority. The teams that chose targeted approaches tended to choose sampling approaches that covered larger areas (wet vacuum, aggressive air, etc.) that would meet the “clearance” objective of this scenario at a generally lower cost. The costs across the teams varied from $8.6K using a targeted approach (with aggressive air sampling) to $354K using an probabilistic strategy to generate 637 samples (mostly sponge).
3.3.3 Scenario 1c – Develop Plan for Clearance Sampling with Restrictions
• Goals: To inform sampling plan for clearance (post decontamination, no priorcharacterization sampling)
Trade-Off Tool for Sampling (TOTS) Tabletop Exercise Date: 9/28/20 Final Report
Page 13 of 43
13
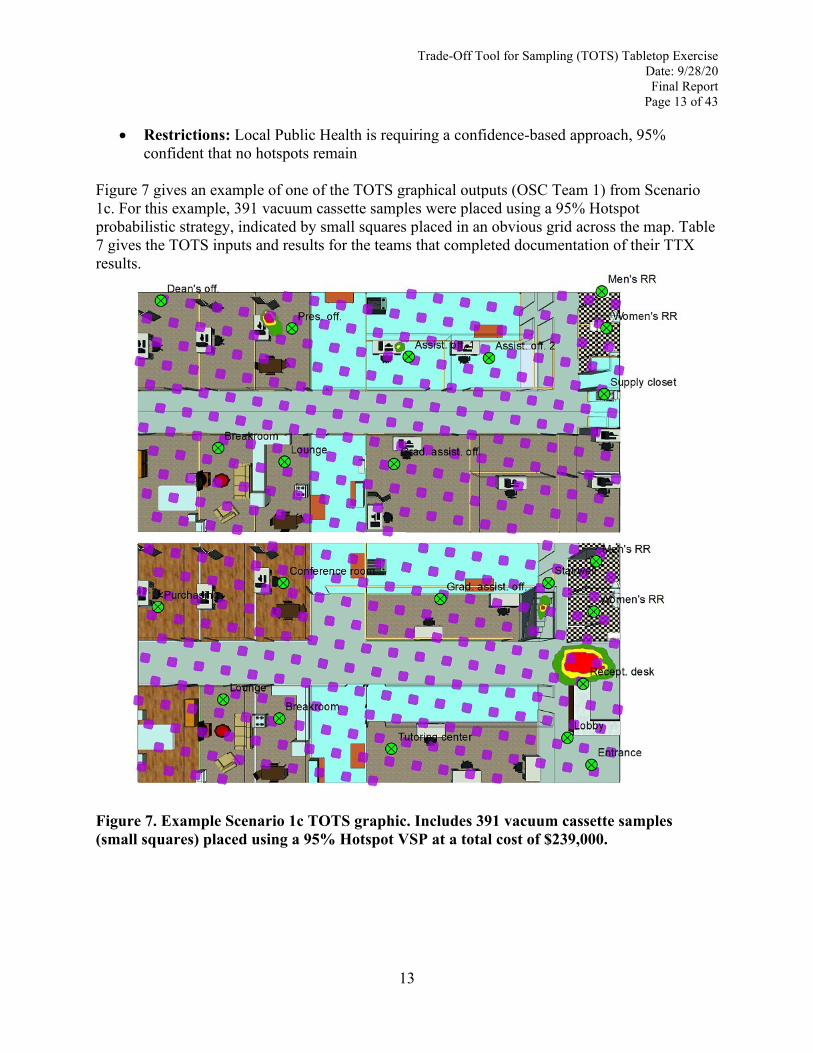
• Restrictions: Local Public Health is requiring a confidence-based approach, 95%confident that no hotspots remain
Figure 7 gives an example of one of the TOTS graphical outputs (OSC Team 1) from Scenario 1c. For this example, 391 vacuum cassette samples were placed using a 95% Hotspot probabilistic strategy, indicated by small squares placed in an obvious grid across the map. Table 7 gives the TOTS inputs and results for the teams that completed documentation of their TTX results.
Figure 7. Example Scenario 1c TOTS graphic. Includes 391 vacuum cassette samples (small squares) placed using a 95% Hotspot VSP at a total cost of $239,000.
Trade-Off Tool for Sampling (TOTS) Tabletop Exercise Date: 9/28/20 Final Report
Page 14 of 43
14
Table 7. Scenario 1c Inputs and Results
Inputs Team
OSC 1 OSC 2 OSC 3 OSC 4 IDC 1 IDC 2 IDC 3 Approach Targeted (T) or Probabilistic (P) P -a P P - - -
- If P, selection: 95% Hotspot - 95%
Hotspot 95%
Hotspot - - -
Available Teams 8 - 6 4 - - -
Staff per team 3 - 3 3 - - -
Available Laboratories 2 - 6 10 - - -
Shifts 1 - 1 1 - - -
Results - - - -
Results - - - -
Cost ($) 239K - 192K 192K - - -
Total time (days) 7.5 - 2.7 4.1 - - -
Samples 391 - 391 391 - - -
Sponge 0 - 391 391 - - -
Micro Vac 391 - 0 0 - - - Swab 0 - 0 0 - - - Wet Vac 0 - 0 0 - - -
Robot Floor Cleaner 0 - 0 0 - - -
Aggressive air 0 - 0 0 - - -
Sampled area (ft2) 391 - 391 391 - - -
Area coverage (%) 5 - 5 5 - - -
# of samples with hits 7 - - 7 - - - a “-“ indicated that the team did not fill out a value.
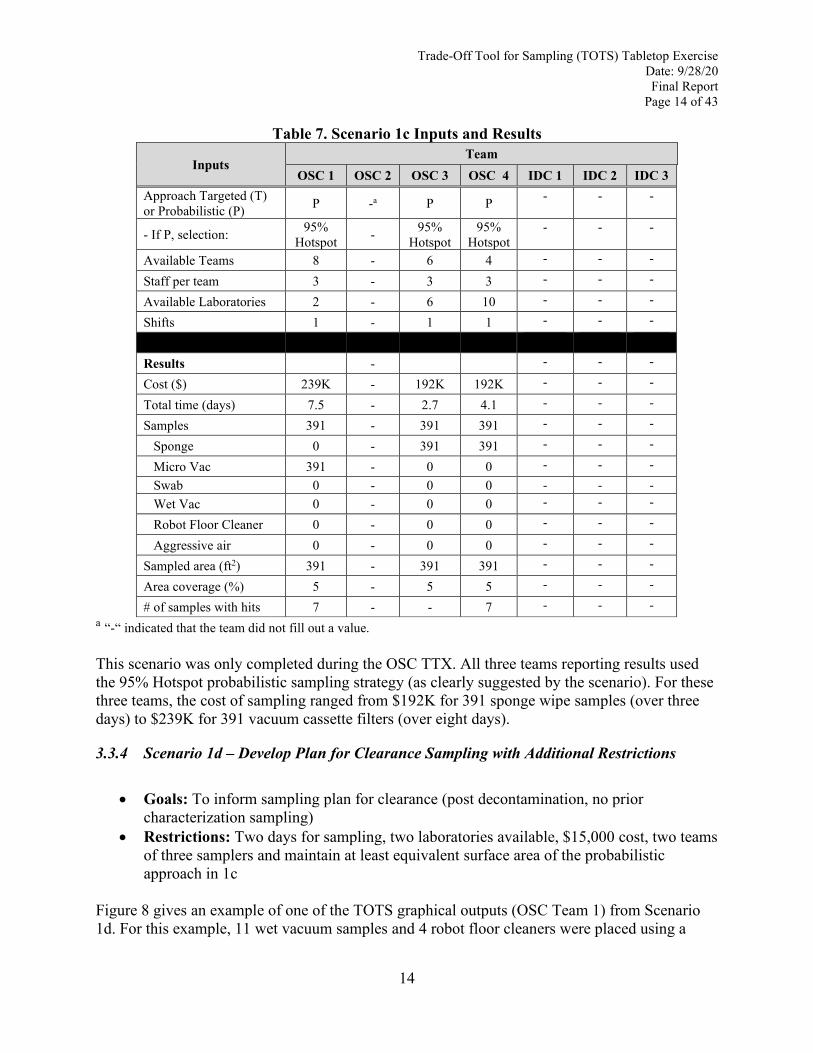
This scenario was only completed during the OSC TTX. All three teams reporting results used the 95% Hotspot probabilistic sampling strategy (as clearly suggested by the scenario). For these three teams, the cost of sampling ranged from $192K for 391 sponge wipe samples (over three days) to $239K for 391 vacuum cassette filters (over eight days).
3.3.4 Scenario 1d – Develop Plan for Clearance Sampling with Additional Restrictions
• Goals: To inform sampling plan for clearance (post decontamination, no priorcharacterization sampling)
• Restrictions: Two days for sampling, two laboratories available, $15,000 cost, two teamsof three samplers and maintain at least equivalent surface area of the probabilisticapproach in 1c
Figure 8 gives an example of one of the TOTS graphical outputs (OSC Team 1) from Scenario 1d. For this example, 11 wet vacuum samples and 4 robot floor cleaners were placed using a
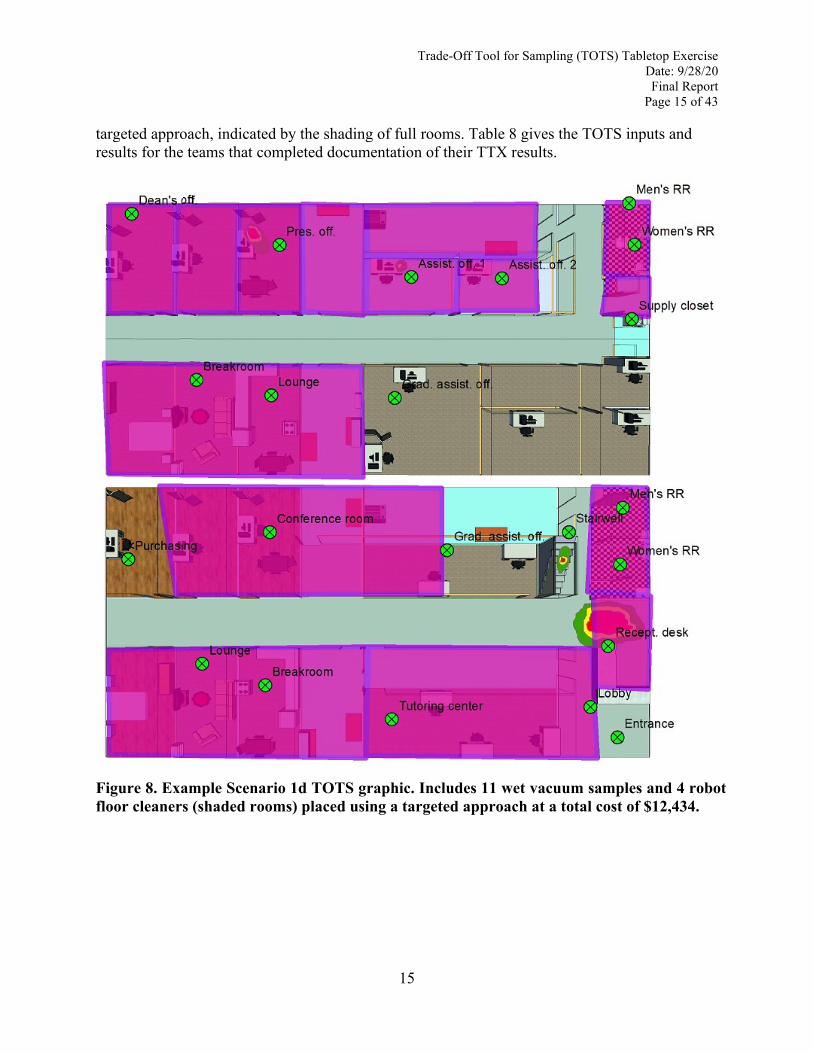
Trade-Off Tool for Sampling (TOTS) Tabletop Exercise Date: 9/28/20 Final Report
Page 15 of 43
15
targeted approach, indicated by the shading of full rooms. Table 8 gives the TOTS inputs and results for the teams that completed documentation of their TTX results.
Figure 8. Example Scenario 1d TOTS graphic. Includes 11 wet vacuum samples and 4 robot floor cleaners (shaded rooms) placed using a targeted approach at a total cost of $12,434.
Trade-Off Tool for Sampling (TOTS) Tabletop Exercise Date: 9/28/20 Final Report
Page 16 of 43
16
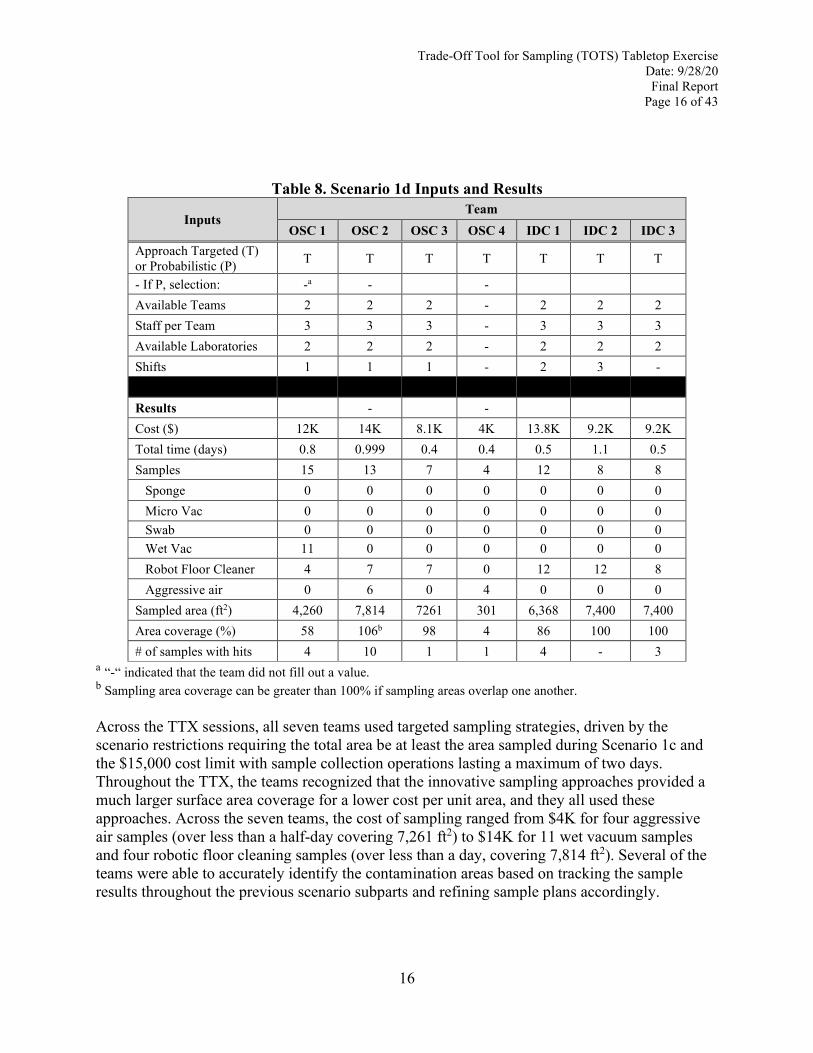
Table 8. Scenario 1d Inputs and Results
Inputs Team
OSC 1 OSC 2 OSC 3 OSC 4 IDC 1 IDC 2 IDC 3 Approach Targeted (T) or Probabilistic (P) T T T T T T T
- If P, selection: -a - - Available Teams 2 2 2 - 2 2 2 Staff per Team 3 3 3 - 3 3 3 Available Laboratories 2 2 2 - 2 2 2 Shifts 1 1 1 - 2 3 - Results - - Results - - Cost ($) 12K 14K 8.1K 4K 13.8K 9.2K 9.2K Total time (days) 0.8 0.999 0.4 0.4 0.5 1.1 0.5 Samples 15 13 7 4 12 8 8 Sponge 0 0 0 0 0 0 0 Micro Vac 0 0 0 0 0 0 0 Swab 0 0 0 0 0 0 0 Wet Vac 11 0 0 0 0 0 0 Robot Floor Cleaner 4 7 7 0 12 12 8 Aggressive air 0 6 0 4 0 0 0 Sampled area (ft2) 4,260 7,814 7261 301 6,368 7,400 7,400 Area coverage (%) 58 106b 98 4 86 100 100 # of samples with hits 4 10 1 1 4 - 3
a “-“ indicated that the team did not fill out a value. b Sampling area coverage can be greater than 100% if sampling areas overlap one another.
Across the TTX sessions, all seven teams used targeted sampling strategies, driven by the scenario restrictions requiring the total area be at least the area sampled during Scenario 1c and the $15,000 cost limit with sample collection operations lasting a maximum of two days. Throughout the TTX, the teams recognized that the innovative sampling approaches provided a much larger surface area coverage for a lower cost per unit area, and they all used these approaches. Across the seven teams, the cost of sampling ranged from $4K for four aggressive air samples (over less than a half-day covering 7,261 ft2) to $14K for 11 wet vacuum samples and four robotic floor cleaning samples (over less than a day, covering 7,814 ft2). Several of the teams were able to accurately identify the contamination areas based on tracking the sample results throughout the previous scenario subparts and refining sample plans accordingly.
Trade-Off Tool for Sampling (TOTS) Tabletop Exercise Date: 9/28/20 Final Report
Page 17 of 43
17
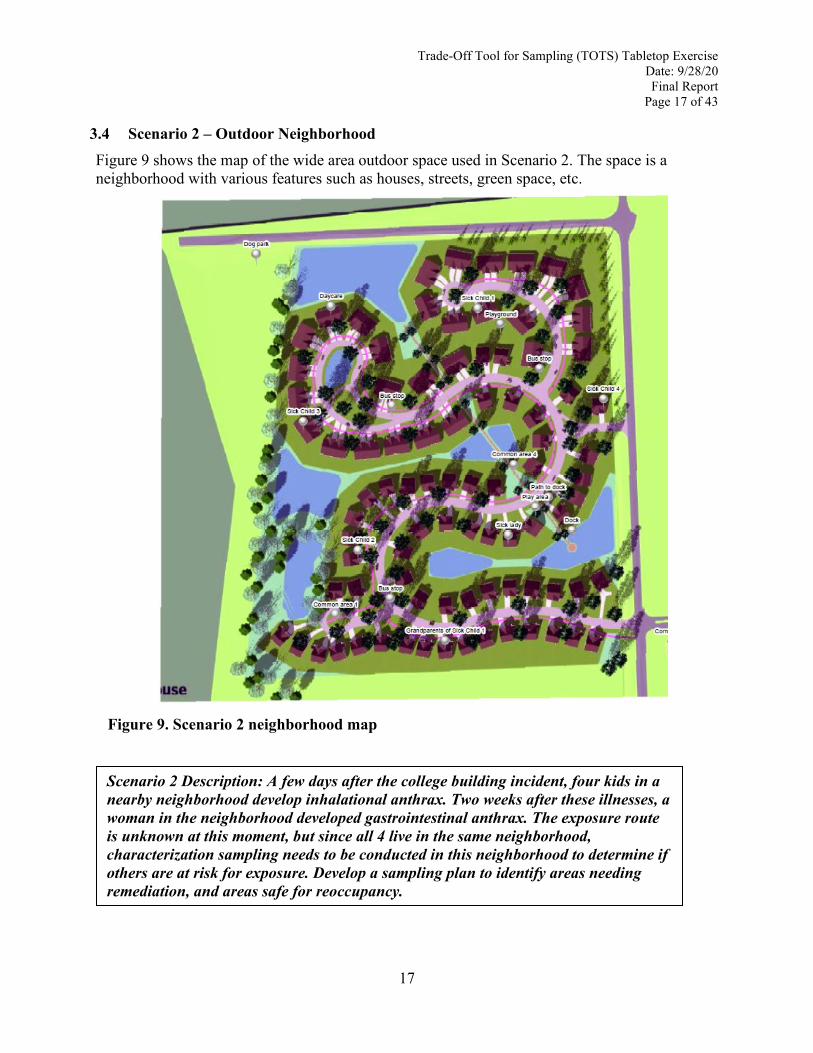
3.4 Scenario 2 – Outdoor Neighborhood Figure 9 shows the map of the wide area outdoor space used in Scenario 2. The space is a neighborhood with various features such as houses, streets, green space, etc.
Scenario 2 Description: A few days after the college building incident, four kids in a nearby neighborhood developed inhalational anthrax. Two weeks after these illnesses, a woman in the neighborhood developed gastrointestinal anthrax. The exposure route is unknown at this moment, but since all 4 four live in the same neighborhood, characterization sampling needs to be conducted in this neighborhood to determine if others are at risk for exposure. Develop a sampling plan to identify areas needing remediation, and areas safe for reoccupancy.
Figure 9. Scenario 2 neighborhood map
Scenario 2 Description: A few days after the college building incident, four kids in a nearby neighborhood develop inhalational anthrax. Two weeks after these illnesses, a woman in the neighborhood developed gastrointestinal anthrax. The exposure route is unknown at this moment, but since all 4 live in the same neighborhood, characterization sampling needs to be conducted in this neighborhood to determine if others are at risk for exposure. Develop a sampling plan to identify areas needing remediation, and areas safe for reoccupancy.
Trade-Off Tool for Sampling (TOTS) Tabletop Exercise Date: 9/28/20 Final Report
Page 18 of 43
18
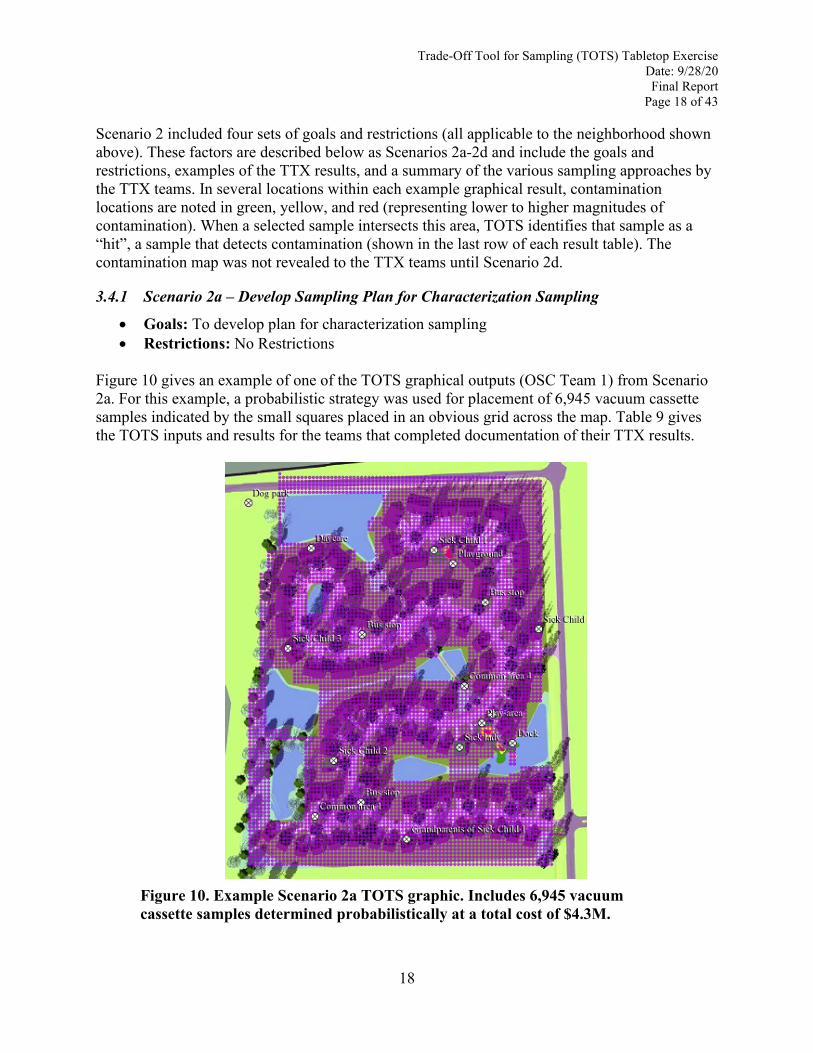
Scenario 2 included four sets of goals and restrictions (all applicable to the neighborhood shown above). These factors are described below as Scenarios 2a-2d and include the goals and restrictions, examples of the TTX results, and a summary of the various sampling approaches by the TTX teams. In several locations within each example graphical result, contamination locations are noted in green, yellow, and red (representing lower to higher magnitudes of contamination). When a selected sample intersects this area, TOTS identifies that sample as a “hit”, a sample that detects contamination (shown in the last row of each result table). The contamination map was not revealed to the TTX teams until Scenario 2d.
3.4.1 Scenario 2a – Develop Sampling Plan for Characterization Sampling
• Goals: To develop plan for characterization sampling• Restrictions: No Restrictions
Figure 10 gives an example of one of the TOTS graphical outputs (OSC Team 1) from Scenario 2a. For this example, a probabilistic strategy was used for placement of 6,945 vacuum cassette samples indicated by the small squares placed in an obvious grid across the map. Table 9 gives the TOTS inputs and results for the teams that completed documentation of their TTX results.
Figure 10. Example Scenario 2a TOTS graphic. Includes 6,945 vacuum cassette samples determined probabilistically at a total cost of $4.3M.
Trade-Off Tool for Sampling (TOTS) Tabletop Exercise Date: 9/28/20 Final Report
Page 19 of 43
19
Table 9. Scenario 2a Inputs and Results
Inputs Team
OSC 1 OSC 2 OSC 3 OSC 4 IDC 1 IDC 2 IDC 3 Approach Targeted (T) or Probabilistic (P) P T T P P/T P T
- If P, selection: 99% hotspot -a - - - - -
Available Teams 20 1 15 10 7 86 10 Staff per Team 3 3 3 3 3 3 3 Available Laboratories 200 1 2 10 10 20 10 Shifts 1 1 1 1 2 2 1 Results - - Results Cost ($) 4.3M 99K 78K 3.7M - 7.5M 85K Total time (days) 14 11 90 39.6 - 23 0.7 Samples 6,945 86 - 6,000 - 15,000 177 Sponge 0 86 - - - - 172 Micro Vac 6,945 - - 6,000 - - - Swab 0 - - - - - - Wet Vac 0 - - - - - -
Robot Floor Cleaner 0 - - - - - 5 Aggressive air 0 - 90 - - - - Sampled area (ft2) 6,994 85,994 90,000 6,000 - 18,177 119 Area coverage (%) 1 5 5 1 - 1 0.01 # of samples with hits 81 5 5 20 - 81 6
a “-“ indicated that the team did not fill out a value.
Because the probabilistic sampling approach tends to increase the number of samples over a given area (to increase probability of detection), this approach would generally be expected to result in a more expensive approach than using fewer targeted samples. Therefore, it is reasonable that the teams used the probabilistic approach to increase the probability of contaminant detection during characterization (given there was no restriction in the cost of sampling). However, across the TTX sessions, three of the six teams that reported results used targeted sampling for Scenario 2a even though there were no restrictions. The teams using probabilistic strategies had costs of $3.7M to $7.5M, while the teams that used targeted strategies had costs of less than $100K.
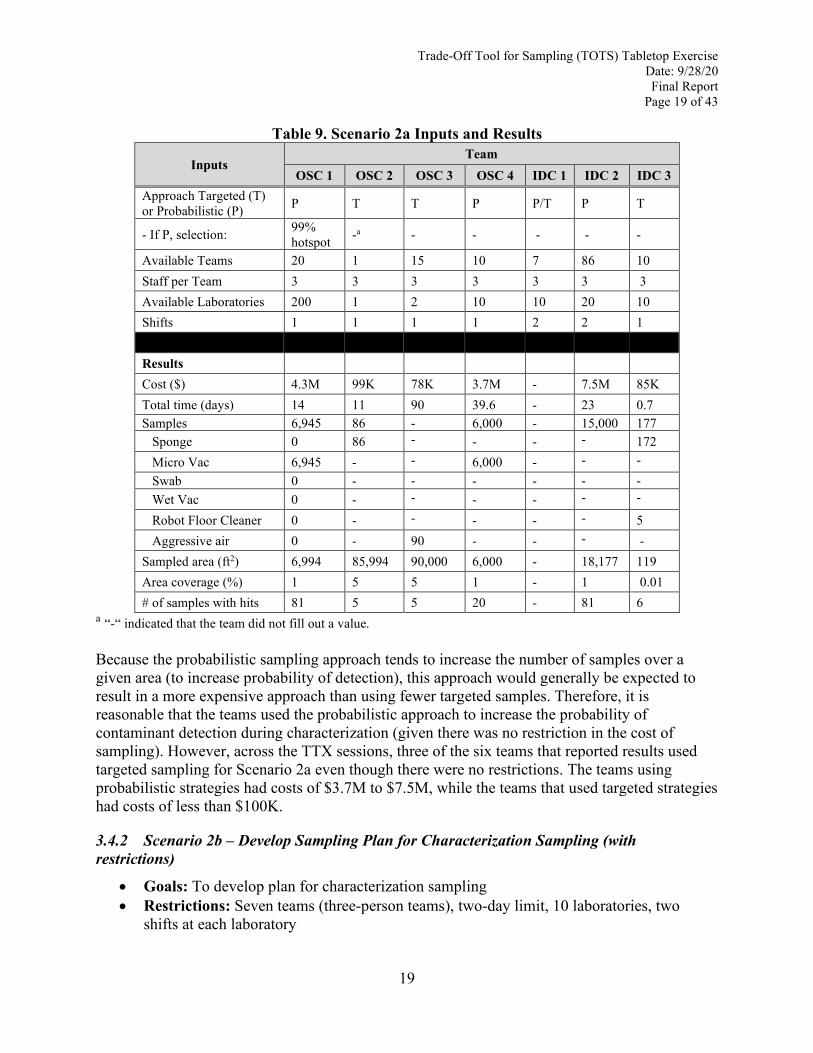
3.4.2 Scenario 2b – Develop Sampling Plan for Characterization Sampling (with restrictions)
• Goals: To develop plan for characterization sampling• Restrictions: Seven teams (three-person teams), two-day limit, 10 laboratories, two
shifts at each laboratory
Trade-Off Tool for Sampling (TOTS) Tabletop Exercise Date: 9/28/20 Final Report
Page 20 of 43
20
Figure 11 gives an example of one of the TOTS graphical outputs (OSC Team 1) from Scenario 2b. For this example, 238 aggressive air samples were placed using a targeted approach. Table 10 gives the TOTS inputs and results for the teams that completed documentation of their TTX results.
Figure 11. Example Scenario 2b TOTS graphic. Includes 238 aggressive air samples placed using a targeted approach (shown with small squares) at a total cost of $227,124 (over 2 days).
Trade-Off Tool for Sampling (TOTS) Tabletop Exercise Date: 9/28/20 Final Report
Page 21 of 43
21
Table 10. Scenario 2b Inputs and Results
Inputs Team
OSC 1 OSC 2 OSC 3 OSC
4 IDC 1 IDC 2 IDC 3
Approach Targeted (T) or Probabilistic (P) T T T T T - T
- If P, selection: -a - - - - - Available Teams 7 7 7 7 7 - 7 Staff per team 3 3 3 3 3 - 3 Available Laboratories 10 10 10 10 10 - 10 Shifts 2 2 2 2 2 - 2 Results - - - 2 Results Cost ($) 227K 7K 130K 139K 47K - 174K Total time (days) 1.97 0.054 1.02 1.014 0.64 - 1.7 Samples 238 6 113 168 23 - 264 Sponge 0 - 0 150 xb - 172 Micro Vac 0 - 0 - - - - Swab 0 - 0 - - - - Wet Vac 0 - 0 - - Robot Floor Cleaner 0 6 113 18 x - 7 Aggressive air 238 - 0 - - 4 Sampled area (ft2) 19,831 3,640 113,000 82,788 22,917 - 15,188 Area coverage (%) 2.3 3 6 - 1 - 11 # of samples with hits 7 3 5 6 7 - 12
a “-“ indicated that the team did not fill out a value. b “x” indicates that the total samples were divided between sample types (but the exact number of samples was not recorded by the team)
Across the TTX sessions, all six teams reporting results used targeted sampling strategies, driven by the scenario restrictions requiring results within two days, thus limiting the number of samples that could be collected (diminishing probabilistic strategies as options). Throughout the TTX, the teams recognized that the innovative sampling approaches provided a much larger surface area coverage for a lesser time (and cost), and they all used these approaches. Across the six teams, the cost of sampling ranged from $7K for robot floor cleaning samples to $227K for 238 aggressive air samples.
3.4.3 Scenario 2c – Develop a Clearance Sampling Plan with Probabilistic Sampling
• Goalso To develop a plan for clearance sampling with probabilistic samplingo Local public health has stated that any plan should meet 95% confidence that no
hotspots of contamination reside in the area (outdoors or indoors)
Trade-Off Tool for Sampling (TOTS) Tabletop Exercise Date: 9/28/20 Final Report
Page 22 of 43
22
• Restrictions: Seven teams (three-person teams), ten laboratories, two shifts at eachlaboratory
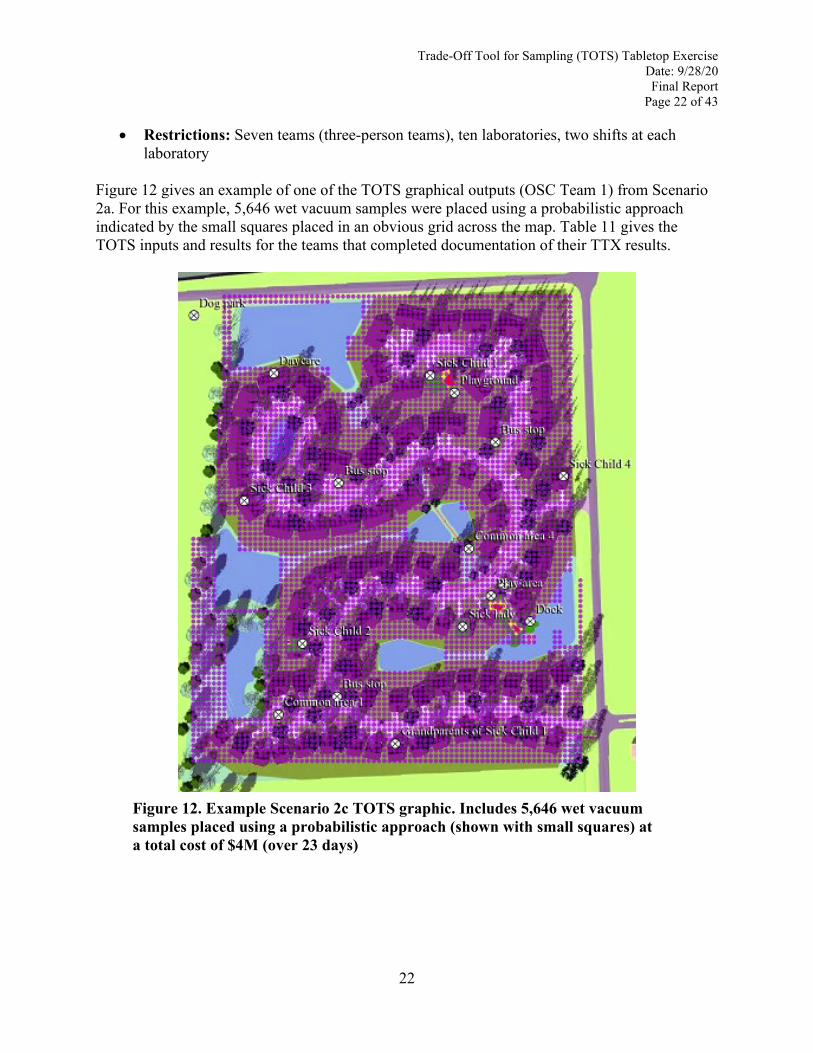
Figure 12 gives an example of one of the TOTS graphical outputs (OSC Team 1) from Scenario 2a. For this example, 5,646 wet vacuum samples were placed using a probabilistic approach indicated by the small squares placed in an obvious grid across the map. Table 11 gives the TOTS inputs and results for the teams that completed documentation of their TTX results.
Figure 12. Example Scenario 2c TOTS graphic. Includes 5,646 wet vacuum samples placed using a probabilistic approach (shown with small squares) at a total cost of $4M (over 23 days)
Trade-Off Tool for Sampling (TOTS) Tabletop Exercise Date: 9/28/20 Final Report
Page 23 of 43
23
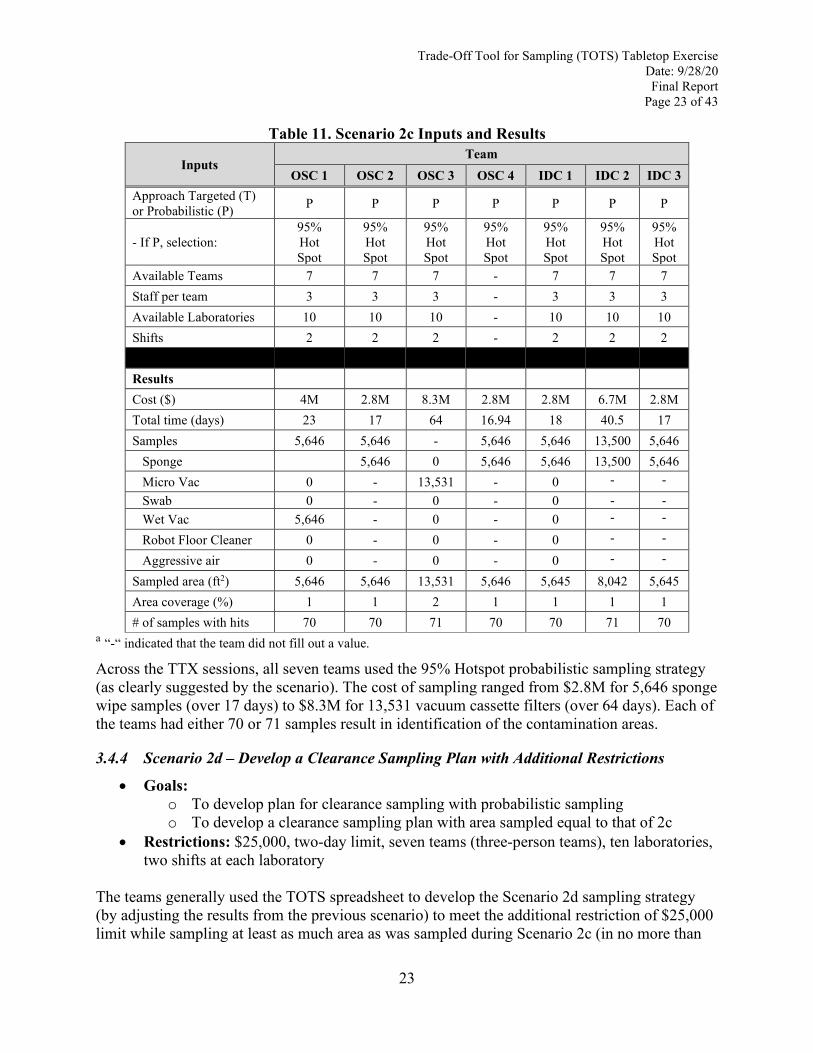
Table 11. Scenario 2c Inputs and Results
Inputs Team
OSC 1 OSC 2 OSC 3 OSC 4 IDC 1 IDC 2 IDC 3 Approach Targeted (T) or Probabilistic (P) P P P P P P P
- If P, selection: 95% Hot Spot
95% Hot Spot
95% Hot Spot
95% Hot Spot
95% Hot Spot
95% Hot Spot
95% Hot Spot
Available Teams 7 7 7 - 7 7 7 Staff per team 3 3 3 - 3 3 3 Available Laboratories 10 10 10 - 10 10 10 Shifts 2 2 2 - 2 2 2 Results - - Results Cost ($) 4M 2.8M 8.3M 2.8M 2.8M 6.7M 2.8M Total time (days) 23 17 64 16.94 18 40.5 17 Samples 5,646 5,646 - 5,646 5,646 13,500 5,646 Sponge 5,646 0 5,646 5,646 13,500 5,646 Micro Vac 0 - 13,531 - 0 - - Swab 0 - 0 - 0 - - Wet Vac 5,646 - 0 - 0 - -
Robot Floor Cleaner 0 - 0 - 0 - -
Aggressive air 0 - 0 - 0 - -
Sampled area (ft2) 5,646 5,646 13,531 5,646 5,645 8,042 5,645 Area coverage (%) 1 1 2 1 1 1 1 # of samples with hits 70 70 71 70 70 71 70
a “-“ indicated that the team did not fill out a value.
Across the TTX sessions, all seven teams used the 95% Hotspot probabilistic sampling strategy (as clearly suggested by the scenario). The cost of sampling ranged from $2.8M for 5,646 sponge wipe samples (over 17 days) to $8.3M for 13,531 vacuum cassette filters (over 64 days). Each of the teams had either 70 or 71 samples result in identification of the contamination areas.
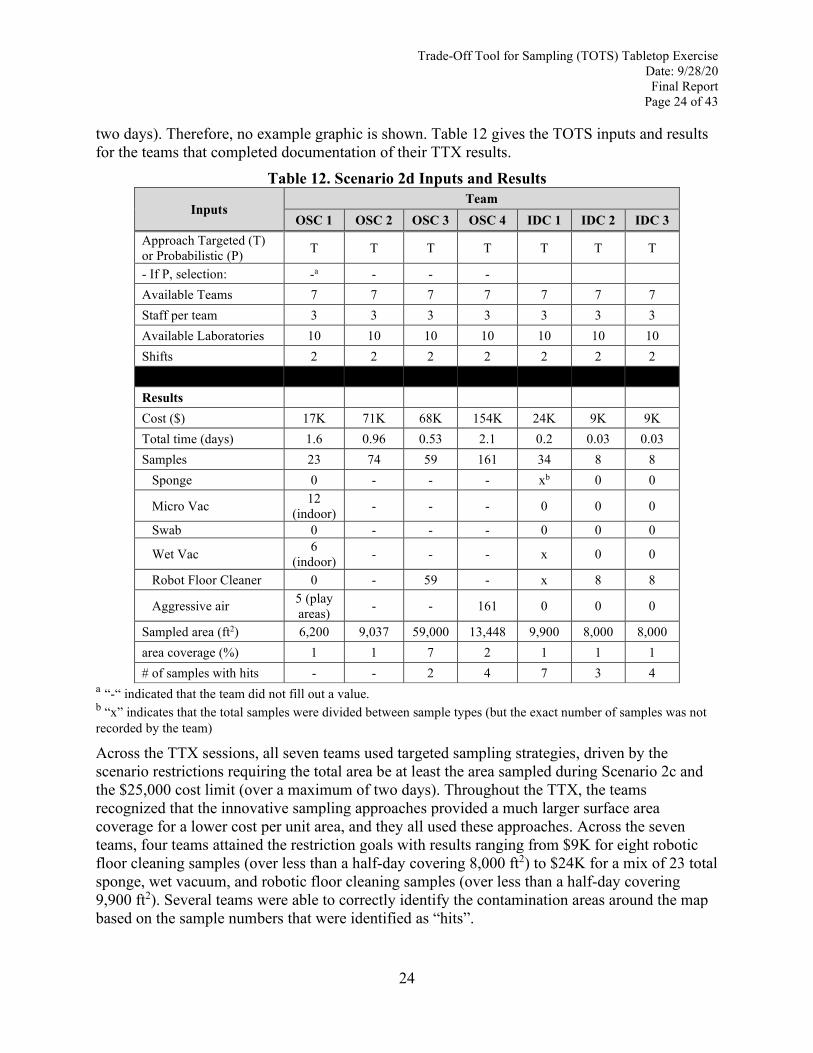
3.4.4 Scenario 2d – Develop a Clearance Sampling Plan with Additional Restrictions
• Goals: o To develop plan for clearance sampling with probabilistic sampling o To develop a clearance sampling plan with area sampled equal to that of 2c
• Restrictions: $25,000, two-day limit, seven teams (three-person teams), ten laboratories, two shifts at each laboratory
The teams generally used the TOTS spreadsheet to develop the Scenario 2d sampling strategy (by adjusting the results from the previous scenario) to meet the additional restriction of $25,000 limit while sampling at least as much area as was sampled during Scenario 2c (in no more than
Trade-Off Tool for Sampling (TOTS) Tabletop Exercise Date: 9/28/20 Final Report
Page 24 of 43
24
two days). Therefore, no example graphic is shown. Table 12 gives the TOTS inputs and results for the teams that completed documentation of their TTX results.
Table 12. Scenario 2d Inputs and Results
Inputs Team
OSC 1 OSC 2 OSC 3 OSC 4 IDC 1 IDC 2 IDC 3 Approach Targeted (T) or Probabilistic (P) T T T T T T T
- If P, selection: -a - - - Available Teams 7 7 7 7 7 7 7 Staff per team 3 3 3 3 3 3 3 Available Laboratories 10 10 10 10 10 10 10 Shifts 2 2 2 2 2 2 2 Results - - - Results Cost ($) 17K 71K 68K 154K 24K 9K 9K Total time (days) 1.6 0.96 0.53 2.1 0.2 0.03 0.03 Samples 23 74 59 161 34 8 8 Sponge 0 - - - xb 0 0
Micro Vac 12 (indoor) - - - 0 0 0
Swab 0 - - - 0 0 0
Wet Vac 6 (indoor) - - - x 0 0
Robot Floor Cleaner 0 - 59 - x 8 8
Aggressive air 5 (play areas) - - 161 0 0 0
Sampled area (ft2) 6,200 9,037 59,000 13,448 9,900 8,000 8,000 area coverage (%) 1 1 7 2 1 1 1 # of samples with hits - - 2 4 7 3 4
a “-“ indicated that the team did not fill out a value. b “x” indicates that the total samples were divided between sample types (but the exact number of samples was not recorded by the team)
Across the TTX sessions, all seven teams used targeted sampling strategies, driven by the scenario restrictions requiring the total area be at least the area sampled during Scenario 2c and the $25,000 cost limit (over a maximum of two days). Throughout the TTX, the teams recognized that the innovative sampling approaches provided a much larger surface area coverage for a lower cost per unit area, and they all used these approaches. Across the seven teams, four teams attained the restriction goals with results ranging from $9K for eight robotic floor cleaning samples (over less than a half-day covering 8,000 ft2) to $24K for a mix of 23 total sponge, wet vacuum, and robotic floor cleaning samples (over less than a half-day covering 9,900 ft2). Several teams were able to correctly identify the contamination areas around the map based on the sample numbers that were identified as “hits”.
Trade-Off Tool for Sampling (TOTS) Tabletop Exercise Date: 9/28/20 Final Report
Page 25 of 43
25
4.0 Table-top Exercise Feedback
4.1 TOTS TTX Participant Questions/Comments and Discussion on Sample Planning
4.1.1 Questions/Comments and Discussion from OSC Academy TTX • Does TOTS have the ability to consider surfaces of heating, ventilation, and air
conditioning (HVAC) systems, surfaces of walls and other systems, and surfaces of other complicated surface areas to sample? Current solution is to assume all surfaces were horizontal and accessible, as the more complicated and enclosed HVAC systems are difficult to deal with in GIS.
• The previous question led into a discussion describing a feature of TOTS where a sampling area selected in TOTS is larger than the specified area of a sample tool. When this happens, TOTS will calculate the required number of samples (of the selected sampling tool) to complete sampling across the entire selected sampling area and determine the corresponding cost to collect and waste generation for that calculated number of samples. TOTS uses results from the Underground Transport Restoration Operational Technology Demonstration , and other field-scale tests, to estimate costs.
• Can TOTS be applied to break areas into zones (like early anthrax work)? TOTS does not automatically break selected sampling areas in to “zones”, but users can easily fashion area maps to functionally generate zones of interest.
• Can TOTS be used for modeling? A discussion ensued that using TOTS for modeling requires creation of shape files from the desired modules of interest that can then be iterated to effectively “model” using TOTS. In addition, dispersion modeling and import of models into ArcMap can be used as contours in conjunction with Random TOTS.
• Participants commented that use of probabilistic sampling is limited to use of only one sample type. While this is true, it was explained that the TOTS capability can be expanded by use the TOTS spreadsheet (mentioned above) that includes the foundational formulas on which TOTS was built. The spreadsheet allows for assignment of ratios of selected sample times during probabilistic sampling. In addition, Random TOTS is a capability that has been added to place a selected number of samples randomly across the area of interest.
• How was the number of random samples is determined? The determination of the number of random samples is not a TOTS function, but is a data quality objective determination made by researchers or on-scene staff.
• EPA research staff asked if the TOTS spreadsheet would be helpful for traditional contaminants (PCBs, Hg, etc.). Experienced sampling staff shared that their experience enables very accurate estimates, but that that TOTS could be valuable for larger sites.
• Is the TOTS data transferable into the collector application? There is a “Collector” approach (e.g., Collector for ArcGIS) to help with this, and EPA is working on a tool that would track a team’s location through a site using barcodes placed on workers and scanning stations at ingress and egress locations.
• Does TOTS handle composite sampling? Not at this time.
Trade-Off Tool for Sampling (TOTS) Tabletop Exercise Date: 9/28/20 Final Report
Page 26 of 43
26
• How does modifying VSP [Visual Sampling Plan] plans alter probabilities? VSP files generate probabilistic sampling plans of various area coverages corresponding to confidence intervals of likelihood of contamination detection.
• Is TOTS applicable for decision point determination? Discussion ensued that acknowledged that TOTS applicability depended on the decision point that needed to be made. Also, EPA has several Decision Support Tools that may be used in combination with the results from TOTS as part of an approach that uses multiple lines of evidence to come to a preponderance of evidence with which to make a decision.
4.1.2 Questions/Comments and Discussion from IDC TTX
• Participants noted that there should be both ArcGIS and sampling/response expertise for the exercise to be successful and expressed concern that utilization of TOTS might be limited because of the relatively few people who have ArcGIS experience. For these TTXs, experienced ArcGIS operators were selected to lead each team, but further user interface improvements are planned to increase user-friendliness.
• 2D sampling is a potential limiter. Discussion revealed that TOTS may be able to receive Z coordinate information in the future to consider vertical (above floor height, desktops, doorknobs, cabinets, etc.) surfaces. Also, the “notes” function can receive text data that provides instructions defining the orientation of a sample (e.g., indicating a vertical surface such as a wall or desktop).
• Inclusion of a demonstration on sampling method options and their associated costs and efficacy was very important to the participants and their ability to benefit from the TTX.
• Cost per sample/ft2 should be conveniently available for users. Also, lodging and meals may need to be included via Government Services Administration per diem calculations based on location.
• A discussion took place to describe Federal Bureau of Investigation (FBI)/NIOSH/ Department of Homeland Security (DHS) actions
o Access to private residences would depend on attribution “legal case” scenario” – around a two-week delay, likely three to four weeks for EPA to get access
o Law Enforcement would only conduct sampling until the “story” is complete for legal prosecution. (e.g., not conduct sampling sufficient for environmental clearance)
• OEM staff initiated discussion that another outside variable that can come into play during sampling design planning is whether or not evacuation of a building or area has taken place. This comment recognized that when people are removed from their homes or businesses from their locations, there is a heightened level of pressure to complete sampling in the shortest amount of time to minimize the disruption in people’s lives.
• Participants recognized that TOTS could be applicable to a non-biological contaminant response. Discussion ensued that acknowledged that the same tool could be coded with cost and area data that would be applicable to other contaminant sampling techniques (to accommodate the different physical/chemical properties) to make TOTS applicable to other contaminants.
Trade-Off Tool for Sampling (TOTS) Tabletop Exercise Date: 9/28/20 Final Report
Page 27 of 43
27
4.2 TOTS TTX Participant Feedback (Hot wash) on General TOTS Functionality (combined from both TTX)
• TOTS is a great teaching tool to show how each variable impacts resources available to execute the mission.
• Participants were initially concerned about how difficult it might be to develop or otherwise obtain building maps. Discussion indicated that an experienced ArcGIS operator would have little difficulty in generating the building or neighborhood background files with the required level of detail. Further discussion acknowledged that developing detailed maps for indoor spaces is a larger response capability gap common to many requirements, not exclusively a TOTS issue.
• Participants noted that an effective file management system (.csv files) is critical for recall/comparison of TOTS outputs.
• Participants questioned how/whether “false negatives” could/should be considered in this exercise. Response stated that no false negatives were introduced as they are accounted for in the limit of detection (LOD); LOD is ~30 cfu. Because any detect of Bacillus anthracis is actionable, results below LOD come back zero.
• Participants desired that detection limits for each sampling method be displayed for comparison purposes. Discussion revealed that detection limits can be enabled in TOTS.
• The ability to export developed sampling plans to other applications (Collector and Survey123) was viewed as a very important capability of TOTS. Also, compatibility with Scribe was deemed a necessary capability. Scribe is a software tool developed by EPA to assist in the process of managing environmental data. The tool captures sampling, observational and monitoring field data.
• It was suggested that there should be an addition to the toolbar that allows users the ability to unite multiple sampling files. At least one team of participants wanted to import the VSP-generated sampling plan for all outdoor areas, and then use Random TOTS to place samples in a subset of houses based on intelligence. Both tools create separate layers, but TOTS can only process one layer at a time.
• In addition, a tool to create custom ArcGIS masks for Random TOTS may be beneficial. • As more sampling methods become available, participants noted the flexibility to add
additional sampling methods to the toolbar would be necessary. • Participants inquired if TOTS can prioritize samples. Discussions indicated that layering
sample plans is possible but may require more advanced ArcGIS skills to accomplish. • Participants wanted to know if the waste volume/weight data consider the personal
protective equipment (PPE) waste stream. Yes, those estimates were based on results from the Operational Technology Demonstration and Bio-Response Operational Testing and Evaluation (BOTE) use data.
• What assumptions were made to calculate costs? URS (the contractor for Operational Technology Demonstration-subway decontamination project) provided their estimates.
• Participants inquired if waste weight will be adjusted by hours per team. Discussions indicated that it is calculated per entry and may need to consider changing this methodology because of the possible gap in accounting for all the changes of PPE given the various lengths of time in a contaminated area.
Trade-Off Tool for Sampling (TOTS) Tabletop Exercise Date: 9/28/20 Final Report
Page 28 of 43
28
• Participants noted that rounding values of the TOTS output would be helpful as the large number of decimal places make the results difficult to read.
• Participants asked if the sampling robot was not contaminated, could it be transported and reused to save cost and waste. The research staff noted that the waste and purchase cost would be insignificant with respect to the rest of the sampling efforts.
• Can TOTS run probabilistic and targeted sampling plans together? Samples can be added to probabilistic plans. The user must be in that layer and select the samples to add.
• Is personnel sampling a capability that could be used or added? If determined to be applicable, it could be added to a future version.
• Are there any samples appropriate for outdoors? Yes, they can all be assumed applicable to outdoors for TTX purposes, and in most cases, there have been research projects completed that show they are applicable.
• Participants asked if there would be reachback capabilities for those not savvy with TOTS and ArcGIS, especially if sampling plans are on short timeframes. As TOTS use may become more prevalent, there would be assistance available from EPA research staff and staff more familiar with TOTS and ArcGIS.
• Participants noted that a consideration may need to be made for complex surfaces such as crown molding or wainscoting, which increase the surface area to something higher than just a flat surface.
Recommendations for future table-top exercises (combined from both TTXs):
• Focus more on the sampling methods and spend less time on TOTS demonstration. • Make clear how to navigate to VSP folder. • Make clear how to use the Home button when using file system browser. • Explain VSP plans. Explain difference between hotspot versus confidence. Provide
explanation of VSP filename syntax, e.g., what 95-95 implies. How were plans created in VSP?
• VSP plans: Don't include Areas.shp if it is not needed. • VSP import: Restrict choices to those that make sense; e.g., wet vac didn't make as much
sense as sponge, microvac, or swab. • Label all rooms. • Make a driver manual available. • Driver manual: Include an explanation on how to quickly iterate by using the ArcMap
results window. • Two teams experienced a bug in TOTS when using aggressive air sampling; TOTS drew
just two polygons for aggressive air, and the number of samples was not adjusted based on the areas selected.
4.2.1 TOTS TTX Participant Feedback (Hot wash) on Scenario 1 (combined from both TTXs)
• Participants questioned whether other interagency characterization data (specifically FBI) could be available at the start of the scenario. The TTX team acknowledged that
Trade-Off Tool for Sampling (TOTS) Tabletop Exercise Date: 9/28/20 Final Report
Page 29 of 43
29
realistically that would be the case. However, in the interest of making the problem more challenging, that information was omitted.
• Participants recommended that a contamination overlay should be prepared for both pre- and post-decontamination operations to show the effectiveness of the sampling plan.
• Participants recommended that future evolution should encourage more iterations of each sub-scenario to generate more comparisons (most “hits” per sample).
• Participants noted that a more complex building (i.e., airport terminal) with multiple HVAC systems would offer a more challenging exercise. Current scenario does not consider the impact of HVAC systems on contaminant spread, and does not allow developing sampling plans within the HVAC ducts.
• Participants recommended the need for inclusion of compositing in future versions. • A comment was made that aggressive air could cause the further spread of contamination,
but discussion revealed that sealing each room and doing aggressive air samples in each room could be an effective way of identifying hotspots
4.2.2 TOTS TTX Participant Feedback (Hot wash) on Scenario 2 (combined from both TTX)
• Provide a cheat sheet for TOTS (user guide). • Currently, the TOTS results are written to a .csv file that defaults to the bottom of the .csv
rather than starting at the top, which would be preferable. • Currently, every time TOTS is rerun, TOTS renumbers the ID numbers on the samples,
so if you are trying to keep track of which samples are getting “hits”, they keep changing. • Rework the exercise to follow reality: conduct characterization sampling;
decontamination occurs; display any detects; conduct clearance sampling. • Participants recommended the need to include the option of a soil sample for outdoors. • TTX was very good at considering thinking about the use of the innovative sampling
approaches (in showing the clear cost and time advantages).
4.2.3 TOTS TTX Participant Feedback from OSC Academy Evaluation Forms
• Interesting and informative for a non-OSC to develop perspective of the tasks that OSCs are responsible for
• ArcGIS introduction was not applicable to those without such experience; learned about sampling methods from discussions with colleagues, but other than that felt like we were solving a puzzle; have gained a better understanding of time and budget restrictions
• Would need an ArcGIS expert to use TOTS in a real scenario; seems most valuable for cost estimating
• Good mix of lecture and “hands-on” • Would be nice to do this for waste; really needs a simpler user interface; autoload from
shape file to spreadsheet • Course was a great first introduction to TOTS; it could benefit from additional
information shared on other options for biological response. • Had a great time playing with the tools; cost estimating seems most beneficial • Good opportunity to work as a group to share ideas and points of view
Trade-Off Tool for Sampling (TOTS) Tabletop Exercise Date: 9/28/20 Final Report
Page 30 of 43
30
5.0 Table-top Exercise Conclusions Two TTX sessions have provided valuable feedback (as indicated in the above sections). By the use of the TOTS (facilitated by experienced ArcGIS users), a significant benefit was that the teams clearly developed an increased operational understanding of the use of innovative sampling approaches. The scenarios were designed to provide opportunity to evaluate targeted and probabilistic sampling plans (using traditional and innovative sampling approaches) to understand their respective strengths and weaknesses. As the teams progressed through Scenarios 1 and 2, they tended to increase the use of the targeted innovative sampling approaches (and thus decreased time and cost). The biggest challenge surrounding TOTS remains the requirement of having experienced ArcGIS users available for those who want to utilize TOTS. The TTX allowed EPA TOTS developers to observe and document feedback provided by TTX participants. This feedback was essential in addressing software bugs and implementing enhancements to improve its reliability and usability, such as transitioning TOTS to a web-based platform for increased ease of use and access. In addition to technical enhancements, as TTX sessions are performed more frequently, perhaps there could be several OSCs who are identified as being willing to assist with TOTS use when required (thus increasing its practical use in the field) and moving away from its use as a research-only tool.
6.0 References
1. U.S. Environmental Protection Agency. A Review of Biological Agent Sampling Methods and Application to a Wide-Area Incident Scenario to Characterize Time and Resource Demands. U.S. Environmental Protection Agency, Washington, DC, EPA/600/R-17/176, 2017.
Trade-Off Tool for Sampling (TOTS) Tabletop Exercise Date: 9/28/20 Final Report
Page 31 of 43
31
Appendix A Table-top Exercise Introductory Slides
Trade-Off Tool for Sampling (TOTS) Tabletop Exercise Date: 9/28/20 Final Report
Page 32 of 43
32
Appendix B Table-top Exercise Handouts
Trade-Off Tool for Sampling (TOTS) Tabletop Exercise Date: 9/28/20 Final Report
Page 33 of 43
33
Course Packet Sample Plan Development for Biological Incidents, Large and Small – An Interactive TTX and Training Course
Trade-Off Tool for Sampling (TOTS) Tabletop Exercise Date: 9/28/20 Final Report
Page 34 of 43
34
Course Title Sample Plan Development for Biological Incidents, Large and Small – An Interactive TTX and Training Course Course Abstract This scenario-driven table-top exercise and training will be conducted during a one-day course with the main objective to familiarize EPA personnel with the decisions, methods, strategies and trade-offs necessary when developing indoor/outdoor sampling plans following a biological contamination incident. The course and TTX will provide a venue for emergency response personnel, managers, researchers, and other support staff to discuss and learn about incident response challenges from each other’s perspectives, with regards to sampling plan development and execution. Two scenarios will be presented to the attendees, a small-scale, single-building incident and a larger-scale, multi-facility incident. Each scenario brief will include current incident knowledge, site characteristics, epidemiological information, as well as the status of any remediation efforts and the phase of response. Attendees will be divided into teams and tasked with developing defensible sampling plans for each of the two scenarios. Additionally, Office of Research and Development (ORD) HSRP is developing an ArcGIS-based tool, intended to assist technical working groups (TWGs) and responders to quickly and defensibly develop sampling plans following contamination incidents. The tool allows the user to understand the resource demand (cost, time, personnel, etc.) necessary to carry out any plans developed. TOTS (trade-off tool for sampling) will be demonstrated during the initial briefing and made available to attendees for plan development. At the end of the course, a hotwash will be conducted to gather feedback from participants to: 1) identify gaps in current capabilities with regards to sample plan development, 2) prioritize future research, 3) identify issues or areas of improvement for the TOTS and training course, and 4) generate an after-action report to memorialize the findings.
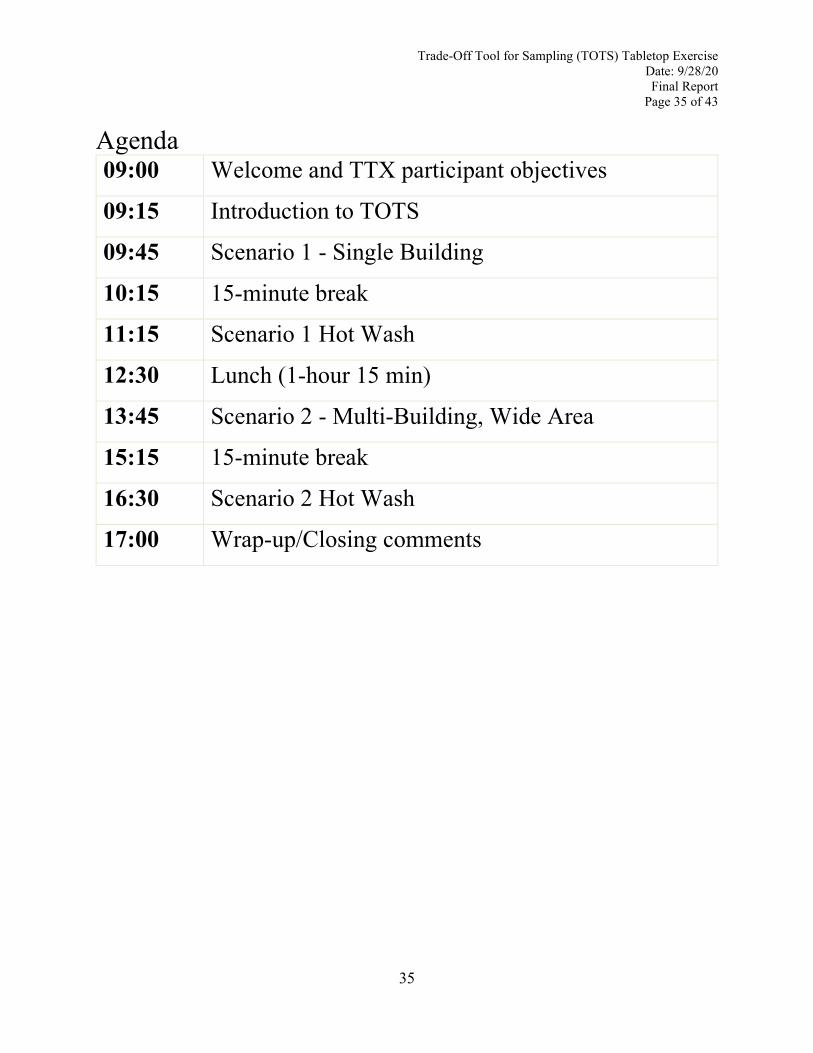
Trade-Off Tool for Sampling (TOTS) Tabletop Exercise Date: 9/28/20 Final Report
Page 35 of 43
35
Agenda 09:00 Welcome and TTX participant objectives
09:15 Introduction to TOTS
09:45 Scenario 1 - Single Building
10:15 15-minute break
11:15 Scenario 1 Hot Wash
12:30 Lunch (1-hour 15 min)
13:45 Scenario 2 - Multi-Building, Wide Area
15:15 15-minute break
16:30 Scenario 2 Hot Wash
17:00 Wrap-up/Closing comments
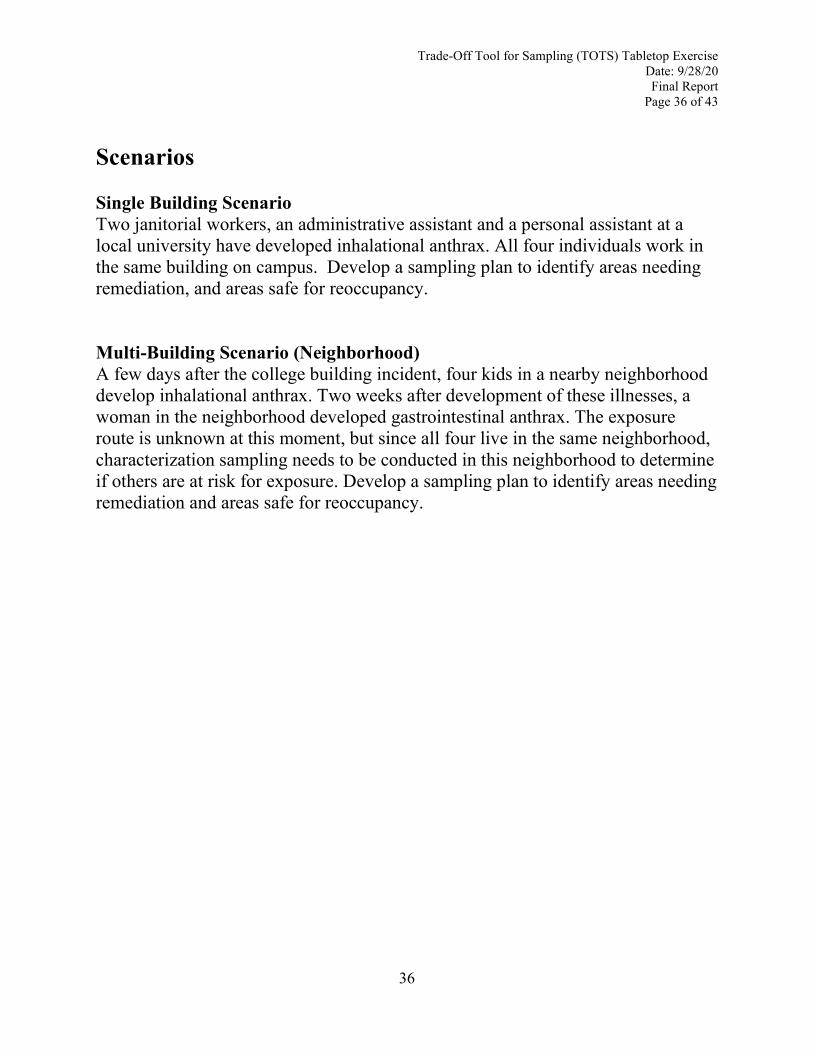
Trade-Off Tool for Sampling (TOTS) Tabletop Exercise Date: 9/28/20 Final Report
Page 36 of 43
36
Scenarios Single Building Scenario Two janitorial workers, an administrative assistant and a personal assistant at a local university have developed inhalational anthrax. All four individuals work in the same building on campus. Develop a sampling plan to identify areas needing remediation, and areas safe for reoccupancy. Multi-Building Scenario (Neighborhood) A few days after the college building incident, four kids in a nearby neighborhood develop inhalational anthrax. Two weeks after development of these illnesses, a woman in the neighborhood developed gastrointestinal anthrax. The exposure route is unknown at this moment, but since all four live in the same neighborhood, characterization sampling needs to be conducted in this neighborhood to determine if others are at risk for exposure. Develop a sampling plan to identify areas needing remediation and areas safe for reoccupancy.
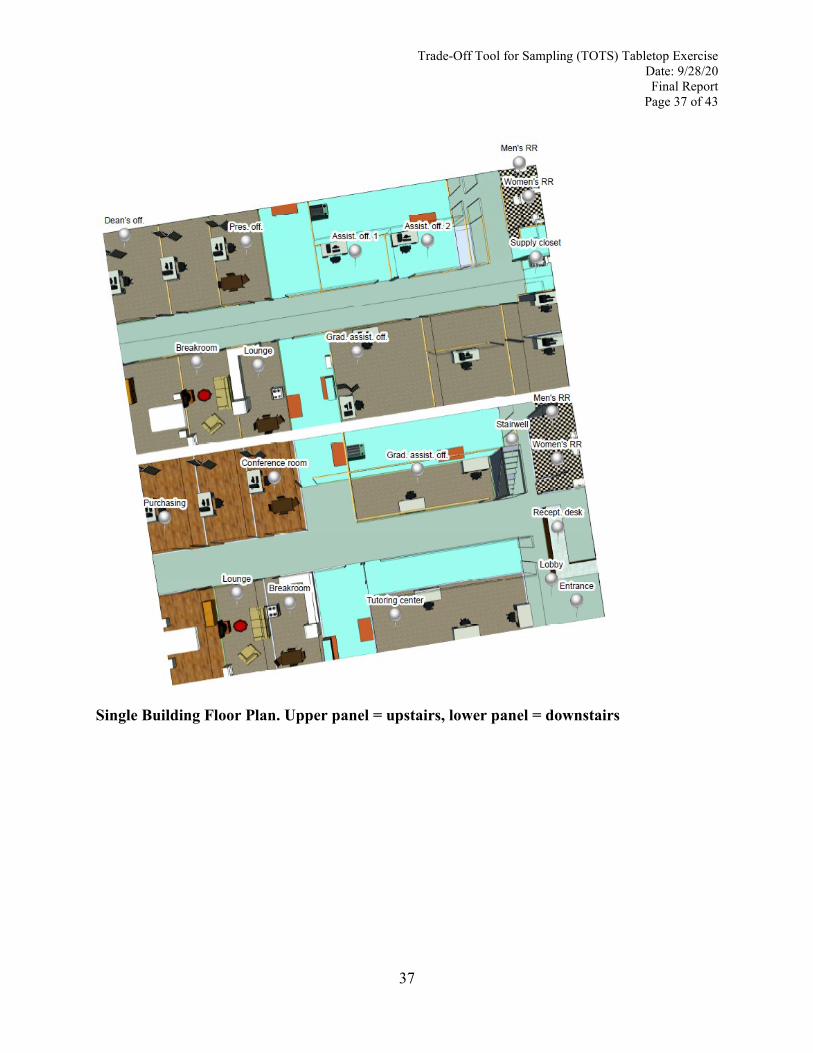
Trade-Off Tool for Sampling (TOTS) Tabletop Exercise Date: 9/28/20 Final Report
Page 37 of 43
37
Single Building Floor Plan. Upper panel = upstairs, lower panel = downstairs
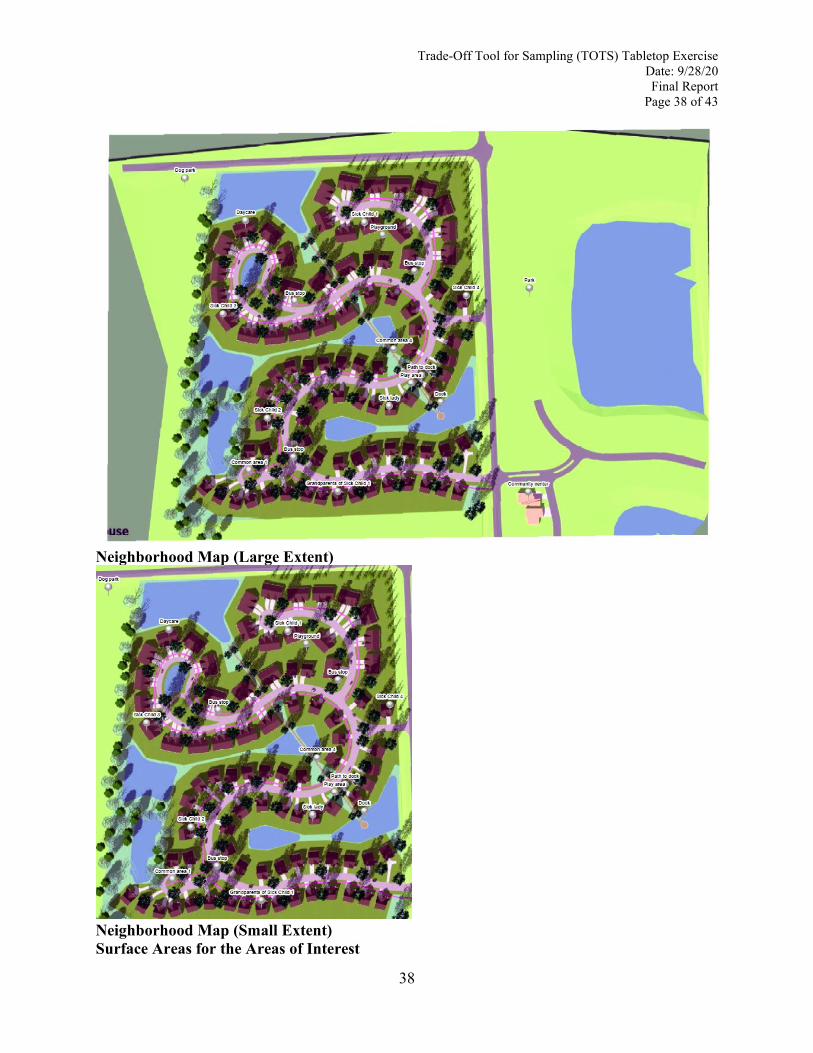
Trade-Off Tool for Sampling (TOTS) Tabletop Exercise Date: 9/28/20 Final Report
Page 38 of 43
38
Neighborhood Map (Large Extent)
Neighborhood Map (Small Extent) Surface Areas for the Areas of Interest
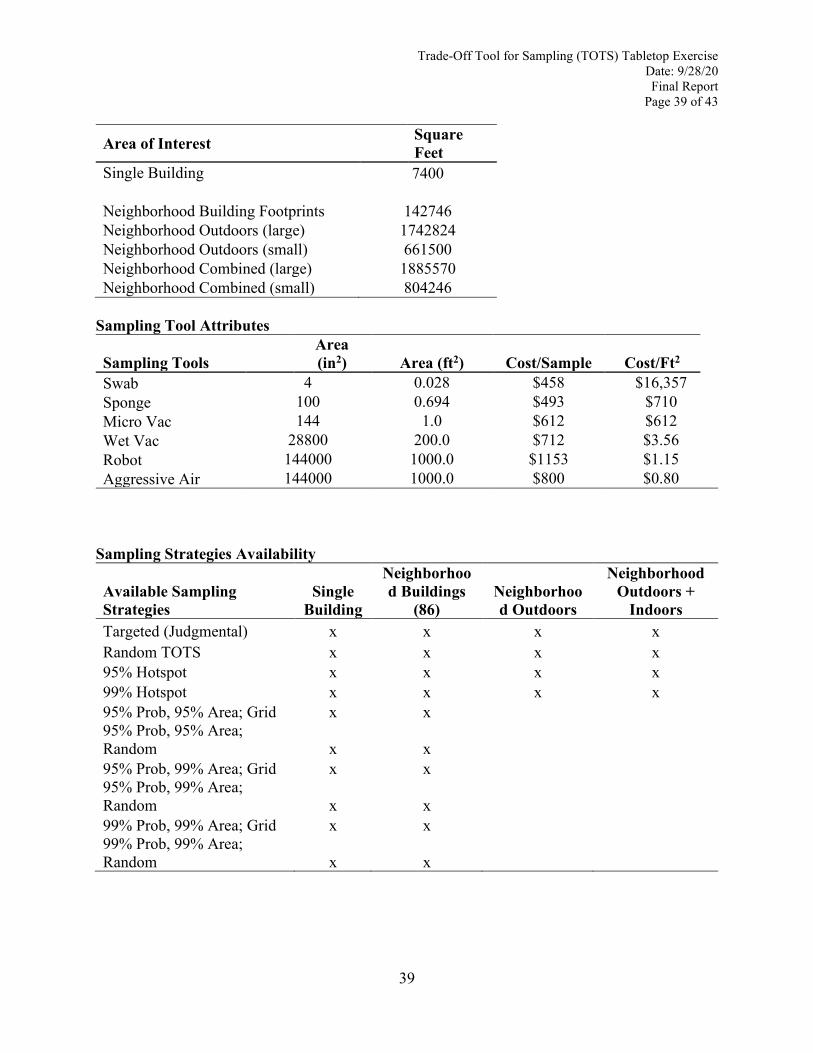
Trade-Off Tool for Sampling (TOTS) Tabletop Exercise Date: 9/28/20 Final Report
Page 39 of 43
39
Area of Interest Square Feet
Single Building 7400 Neighborhood Building Footprints 142746 Neighborhood Outdoors (large) 1742824 Neighborhood Outdoors (small) 661500 Neighborhood Combined (large) 1885570 Neighborhood Combined (small) 804246
Sampling Tool Attributes
Sampling Tools Area (in2) Area (ft2) Cost/Sample Cost/Ft2
Swab 4 0.028 $458 $16,357 Sponge 100 0.694 $493 $710 Micro Vac 144 1.0 $612 $612 Wet Vac 28800 200.0 $712 $3.56 Robot 144000 1000.0 $1153 $1.15 Aggressive Air 144000 1000.0 $800 $0.80
Sampling Strategies Availability
Available Sampling Strategies
Single Building
Neighborhood Buildings
(86) Neighborhood Outdoors
Neighborhood Outdoors +
Indoors Targeted (Judgmental) x x x x Random TOTS x x x x 95% Hotspot x x x x 99% Hotspot x x x x 95% Prob, 95% Area; Grid x x 95% Prob, 95% Area; Random x x 95% Prob, 99% Area; Grid x x 95% Prob, 99% Area; Random x x 99% Prob, 99% Area; Grid x x 99% Prob, 99% Area; Random x x
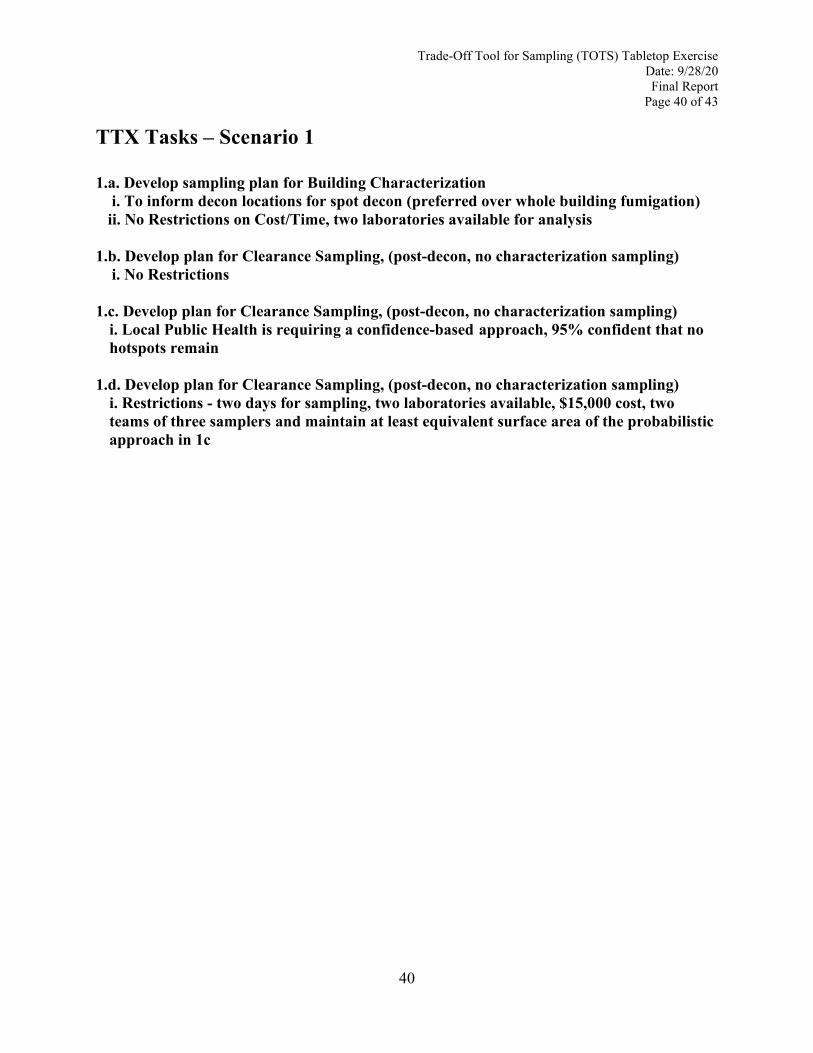
Trade-Off Tool for Sampling (TOTS) Tabletop Exercise Date: 9/28/20 Final Report
Page 40 of 43
40
TTX Tasks – Scenario 1 1.a. Develop sampling plan for Building Characterization i. To inform decon locations for spot decon (preferred over whole building fumigation) ii. No Restrictions on Cost/Time, two laboratories available for analysis 1.b. Develop plan for Clearance Sampling, (post-decon, no characterization sampling) i. No Restrictions 1.c. Develop plan for Clearance Sampling, (post-decon, no characterization sampling)
i. Local Public Health is requiring a confidence-based approach, 95% confident that no hotspots remain
1.d. Develop plan for Clearance Sampling, (post-decon, no characterization sampling) i. Restrictions - two days for sampling, two laboratories available, $15,000 cost, two teams of three samplers and maintain at least equivalent surface area of the probabilistic approach in 1c
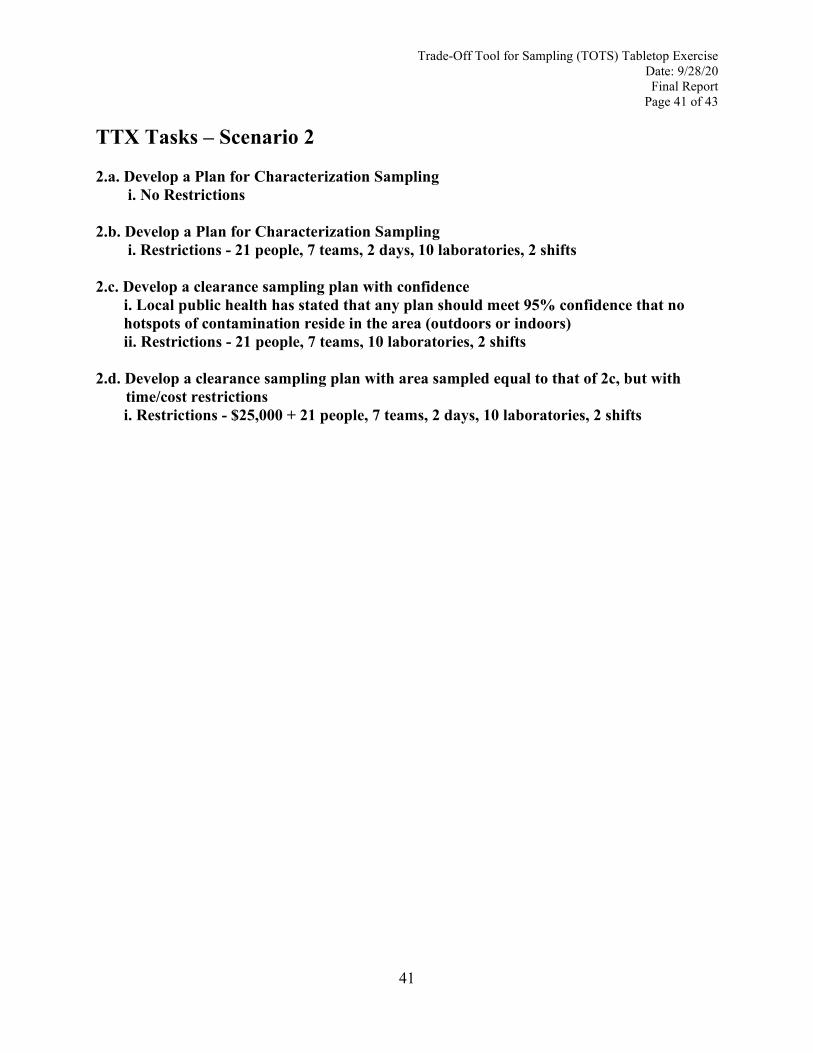
Trade-Off Tool for Sampling (TOTS) Tabletop Exercise Date: 9/28/20 Final Report
Page 41 of 43
41
TTX Tasks – Scenario 2 2.a. Develop a Plan for Characterization Sampling i. No Restrictions 2.b. Develop a Plan for Characterization Sampling i. Restrictions - 21 people, 7 teams, 2 days, 10 laboratories, 2 shifts 2.c. Develop a clearance sampling plan with confidence
i. Local public health has stated that any plan should meet 95% confidence that no hotspots of contamination reside in the area (outdoors or indoors)
ii. Restrictions - 21 people, 7 teams, 10 laboratories, 2 shifts 2.d. Develop a clearance sampling plan with area sampled equal to that of 2c, but with
time/cost restrictions i. Restrictions - $25,000 + 21 people, 7 teams, 2 days, 10 laboratories, 2 shifts
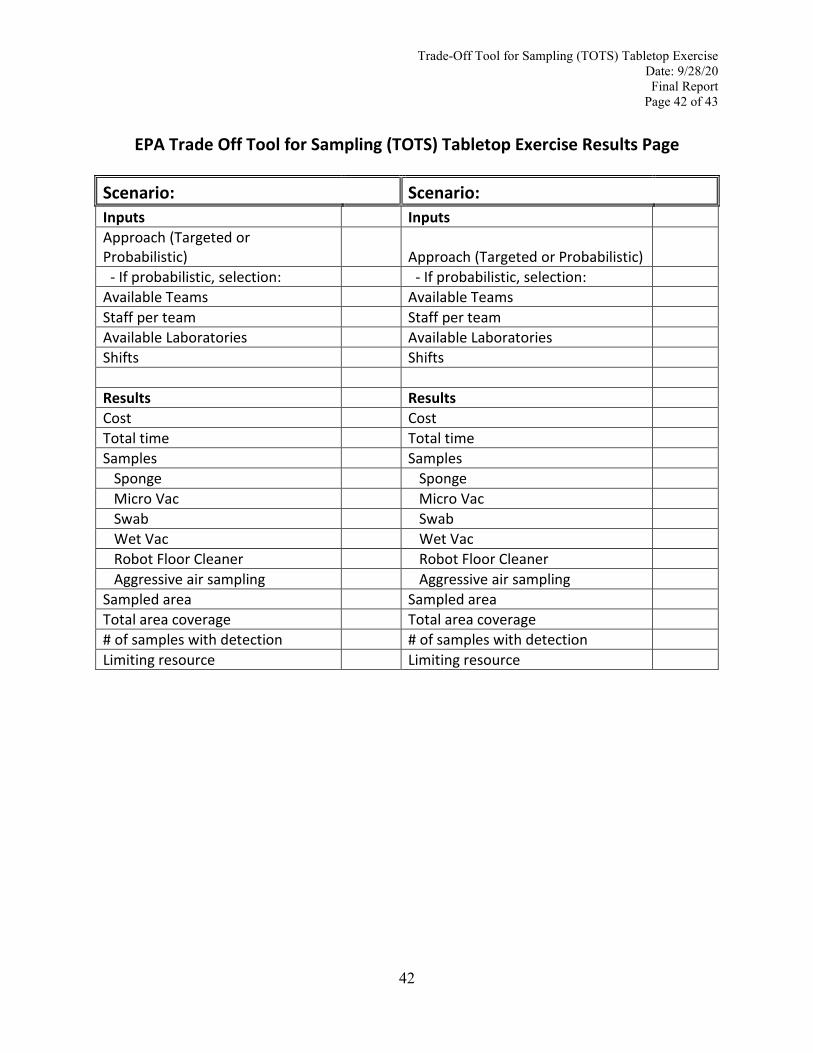
Trade-Off Tool for Sampling (TOTS) Tabletop Exercise Date: 9/28/20 Final Report
Page 42 of 43
42
EPA Trade Off Tool for Sampling (TOTS) Tabletop Exercise Results Page
Scenario: Scenario: Inputs Inputs Approach (Targeted or Probabilistic) Approach (Targeted or Probabilistic) - If probabilistic, selection: - If probabilistic, selection: Available Teams Available Teams Staff per team Staff per team Available Laboratories Available Laboratories Shifts Shifts Results Results Cost Cost Total time Total time Samples Samples Sponge Sponge Micro Vac Micro Vac Swab Swab Wet Vac Wet Vac Robot Floor Cleaner Robot Floor Cleaner Aggressive air sampling Aggressive air sampling Sampled area Sampled area Total area coverage Total area coverage # of samples with detection # of samples with detection Limiting resource Limiting resource
Trade-Off Tool for Sampling (TOTS) Tabletop Exercise Date: 9/28/20 Final Report
Page 43 of 43
43
TOTS TTX Hot-Wash Questions
TOTS Questions; • What did you like about TOTS?• What did you dislike about TOTS?• What steps could have been made easier?• What additional features/functionality would make TOTS more useful?• Could TOTS be useful outside a Bio-Response?• Who do you envision being the appropriate end-user for TOTS? Environmental Unit
Lead? SME [subject matter experts]? TWG [technical working groups]?• TOTS can export developed plans to apps such as Collector and Survey123, is this
useful?• Does TOTS allow enough flexibility for development of sampling plans that meet your
site-specific needs?• Do you commonly work with ArcGIS or have someone who supports your GIS needs?• Did TOTS give you new insights into sample planning? If yes, what did you learn?
Sample Plan Development Questions: • Is there a process you currently follow for sample plan development? Would TOTS fit
into this process?• What other information do you foresee being needed prior to developing a sampling
plan?• What are other ways decision tools or data tools could assist in response activities?
TTX Questions: • What would you have changed about the scenario? How could it have been more realistic
or engaging?• What should we have spent more time on?• What should we have spent less time on?• Does this TTX help us identify and discuss capability gaps?

Appendix A: Class Slides
Sample Plan Development for Biological Incidents, Large and Small –An Interactive Table Top Exercise and Training Course
A-1
2020 OSC Academy
Sample Plan Development for Biological Incidents, Large and Small – An Interactive
Table Top Exercise and Training Course
Worth Calfee (ORD), Timothy Boe (ORD), Leroy Mickelsen (CMAD), Christy Tomlinson (CMAD), Elise
Jakabhazy (CMAD)

2020 OSC Academy
Disclaimer
This presentation has been subjected to theAgency’s review and has been approved forpublication. Note that approval does notsignify that the contents necessarily reflectthe views of the Agency. Mention of tradenames, products, or services does notconvey official EPA approval, endorsement,or recommendation.
1
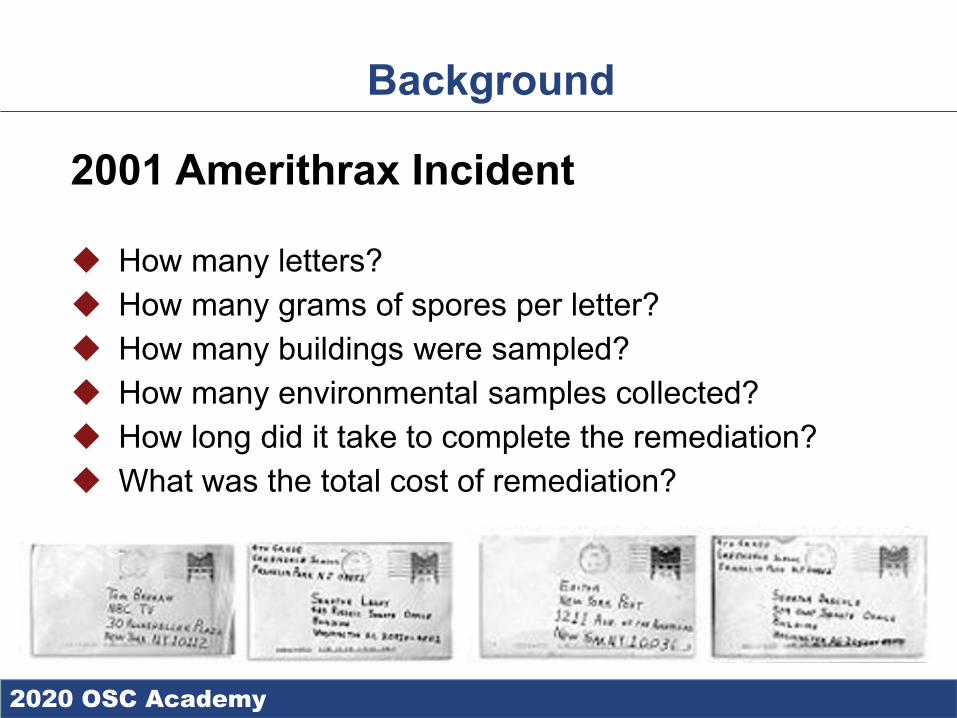
2020 OSC Academy2
Background
2001 Amerithrax Incident
How many letters? How many grams of spores per letter? How many buildings were sampled? How many environmental samples collected? How long did it take to complete the remediation? What was the total cost of remediation?
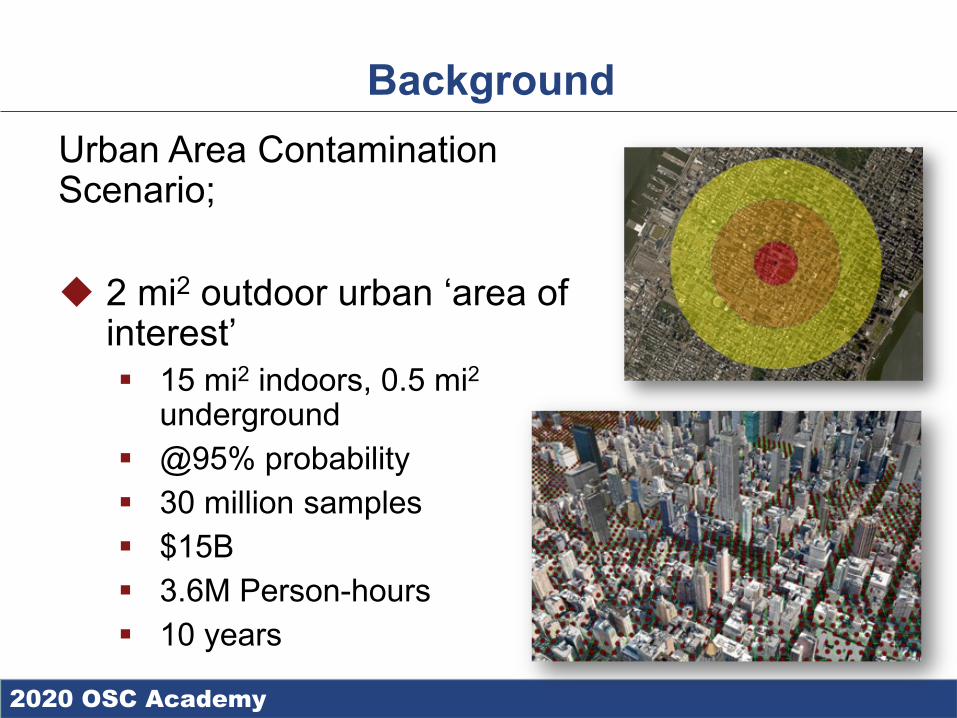
2020 OSC Academy3
BackgroundUrban Area Contamination Scenario;
2 mi2 outdoor urban ‘area of interest’ 15 mi2 indoors, 0.5 mi2
underground @95% probability 30 million samples $15B 3.6M Person-hours 10 years
2020 OSC Academy4
BackgroundBiological contamination incidents often require development of sampling plans to characterize extent of contamination, to develop decontamination strategies, and to verify areas are safe for re-entry. Many factors need to be considered when developing sampling plans.
A tool to develop sampling plans for bio-incident is desirable Transparency of decision making One platform for planning, documenting, and generation of fieldable maps Optimizing resources, weighing options, understanding trade-offs
EPA HSRP is currently developing a tool to meet these needs The current TTX aims to gather critical responder and end-user input to refine
the tool What works, what doesn’t work, what’s missing?
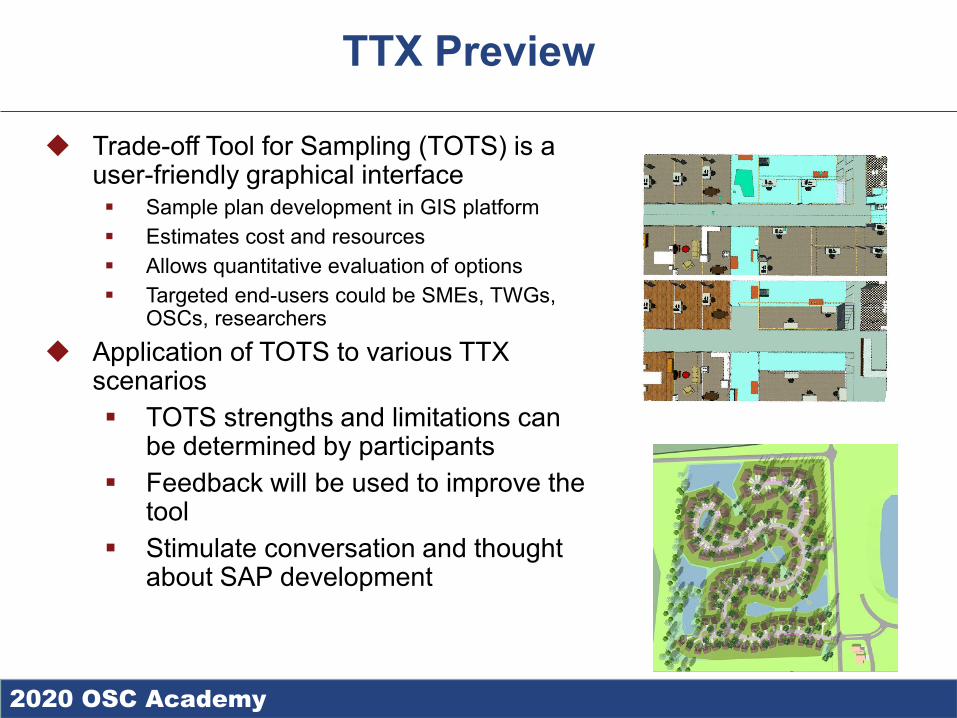
2020 OSC Academy
TTX Preview
Trade-off Tool for Sampling (TOTS) is a user-friendly graphical interface Sample plan development in GIS platform Estimates cost and resources Allows quantitative evaluation of options Targeted end-users could be SMEs, TWGs,
OSCs, researchers Application of TOTS to various TTX
scenarios TOTS strengths and limitations can
be determined by participants Feedback will be used to improve the
tool Stimulate conversation and thought
about SAP development
5
2020 OSC Academy
TTX Participant Objectives
Utilize TOTS, create sampling plans per the scenario requirementsCompare resource requirements (cost, time,
staffing, laboratories, etc.) for various sampling plans developedProvide feedback of the strengths and
limitations of TOTS to improve tool utilityIdentify critical information and capabilities
required for effective SAP development, including gaps in capabilities and knowledge to inform future research
6
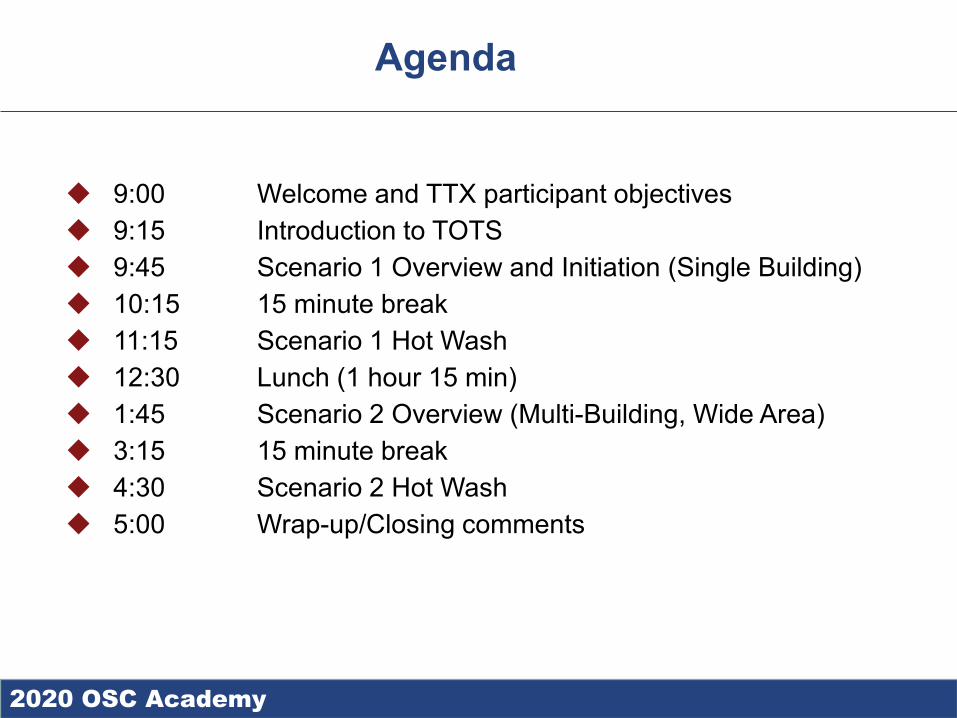
2020 OSC Academy
Agenda
9:00 Welcome and TTX participant objectives 9:15 Introduction to TOTS 9:45 Scenario 1 Overview and Initiation (Single Building) 10:15 15 minute break 11:15 Scenario 1 Hot Wash 12:30 Lunch (1 hour 15 min) 1:45 Scenario 2 Overview (Multi-Building, Wide Area) 3:15 15 minute break 4:30 Scenario 2 Hot Wash 5:00 Wrap-up/Closing comments
7
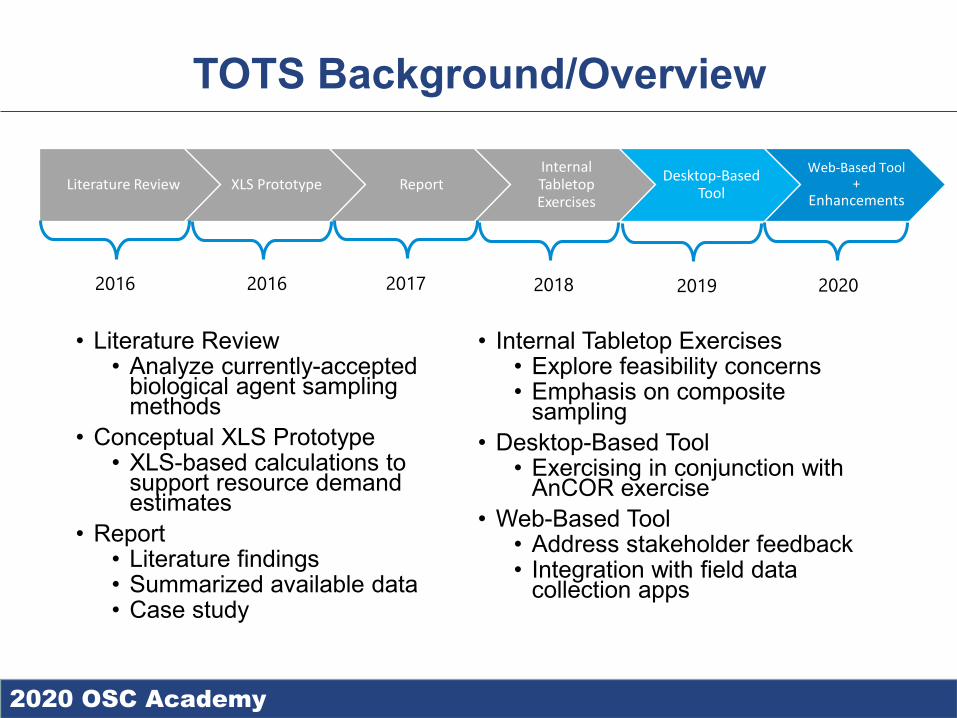
2020 OSC Academy
TOTS Background/Overview
8
Literature Review XLS Prototype ReportInternal Tabletop Exercises
Desktop-Based Tool
Web-Based Tool +
Enhancements
• Literature Review• Analyze currently-accepted
biological agent sampling methods
• Conceptual XLS Prototype• XLS-based calculations to
support resource demand estimates
• Report• Literature findings• Summarized available data• Case study
• Internal Tabletop Exercises• Explore feasibility concerns• Emphasis on composite
sampling• Desktop-Based Tool
• Exercising in conjunction with AnCOR exercise
• Web-Based Tool• Address stakeholder feedback• Integration with field data
collection apps
2016 2016 2017 2018 2019 2020
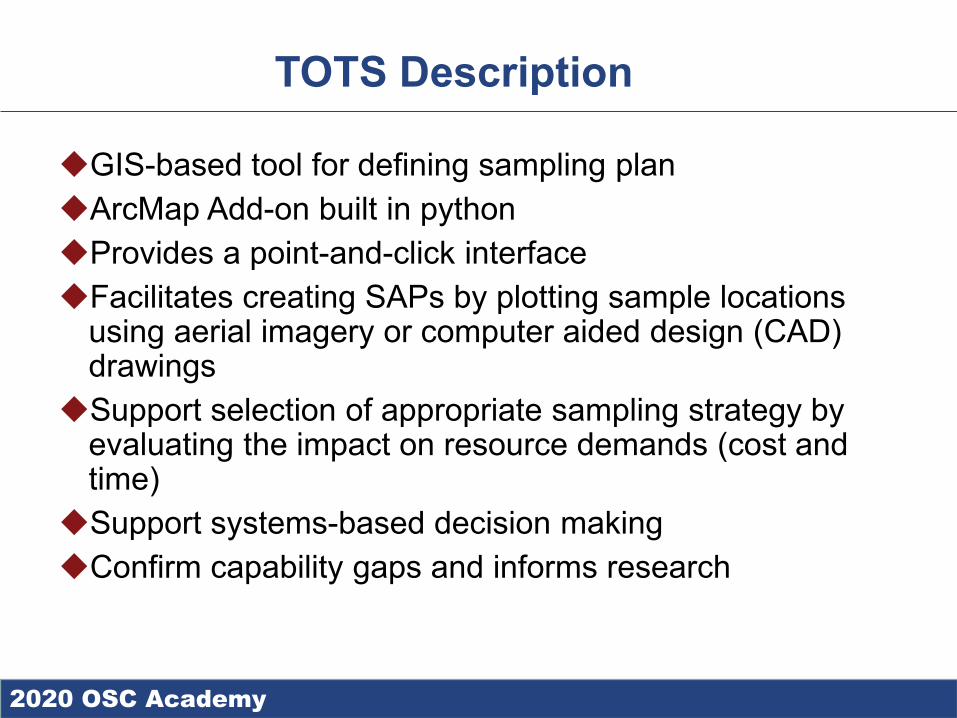
2020 OSC Academy
TOTS Description
GIS-based tool for defining sampling planArcMap Add-on built in pythonProvides a point-and-click interface Facilitates creating SAPs by plotting sample locations
using aerial imagery or computer aided design (CAD) drawings
Support selection of appropriate sampling strategy by evaluating the impact on resource demands (cost and time)
Support systems-based decision makingConfirm capability gaps and informs research
9
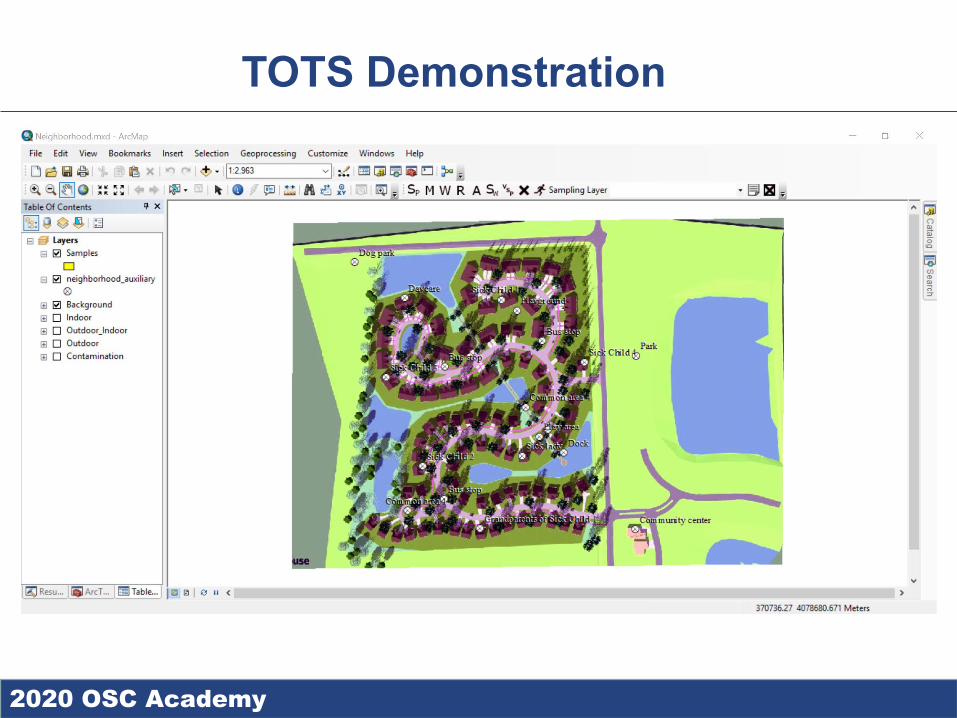
2020 OSC Academy
TOTS Demonstration
10
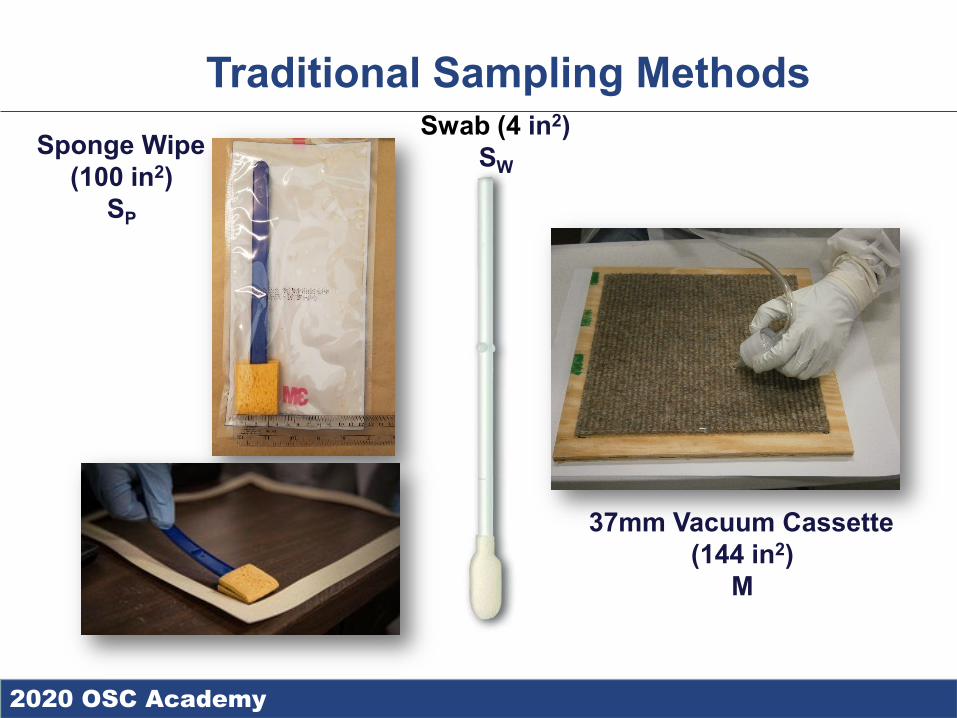
2020 OSC Academy
Traditional Sampling Methods
11
Sponge Wipe(100 in2)
SP
37mm Vacuum Cassette(144 in2)
M
Swab (4 in2)SW
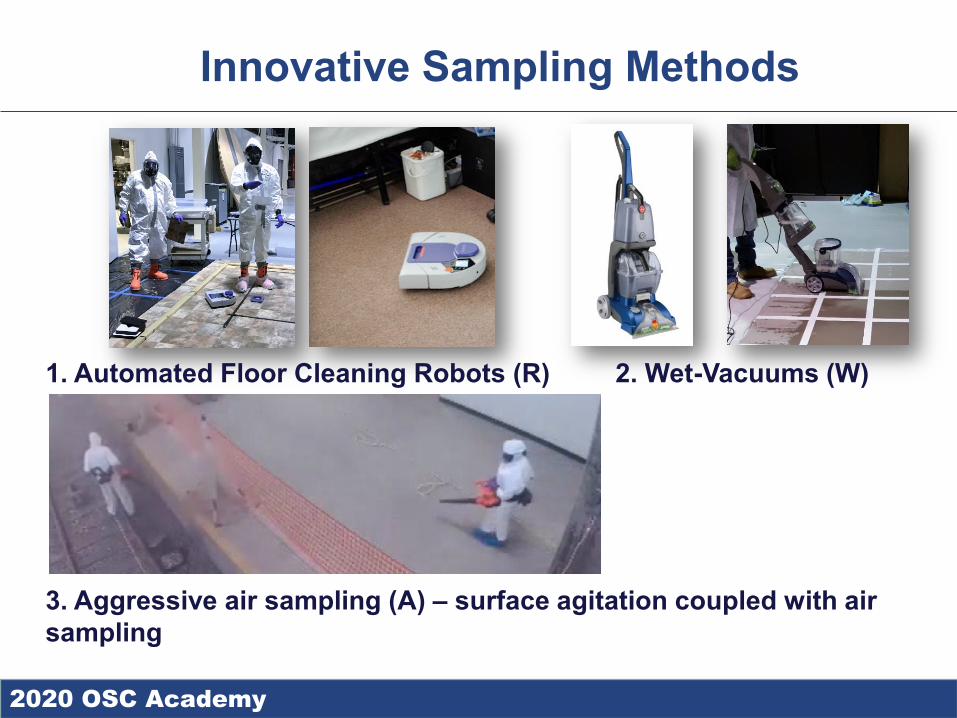
2020 OSC Academy
Innovative Sampling Methods
12
1. Automated Floor Cleaning Robots (R) 2. Wet-Vacuums (W)
3. Aggressive air sampling (A) – surface agitation coupled with air sampling
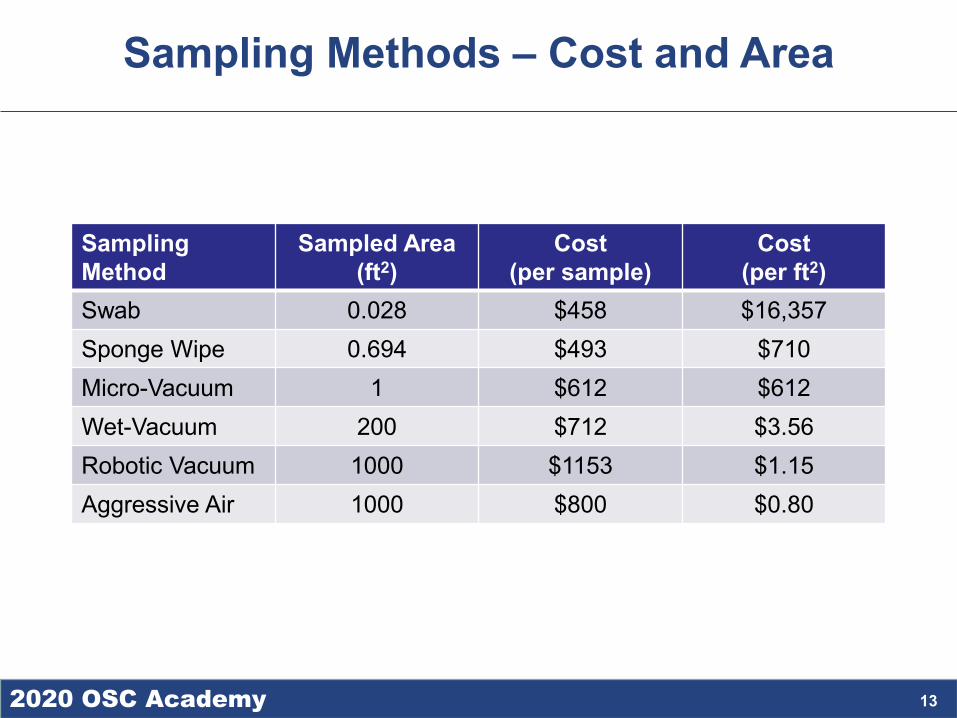
2020 OSC Academy
Sampling Methods – Cost and Area
13
Sampling Method
Sampled Area (ft2)
Cost (per sample)
Cost (per ft2)
Swab 0.028 $458 $16,357Sponge Wipe 0.694 $493 $710Micro-Vacuum 1 $612 $612Wet-Vacuum 200 $712 $3.56Robotic Vacuum 1000 $1153 $1.15Aggressive Air 1000 $800 $0.80
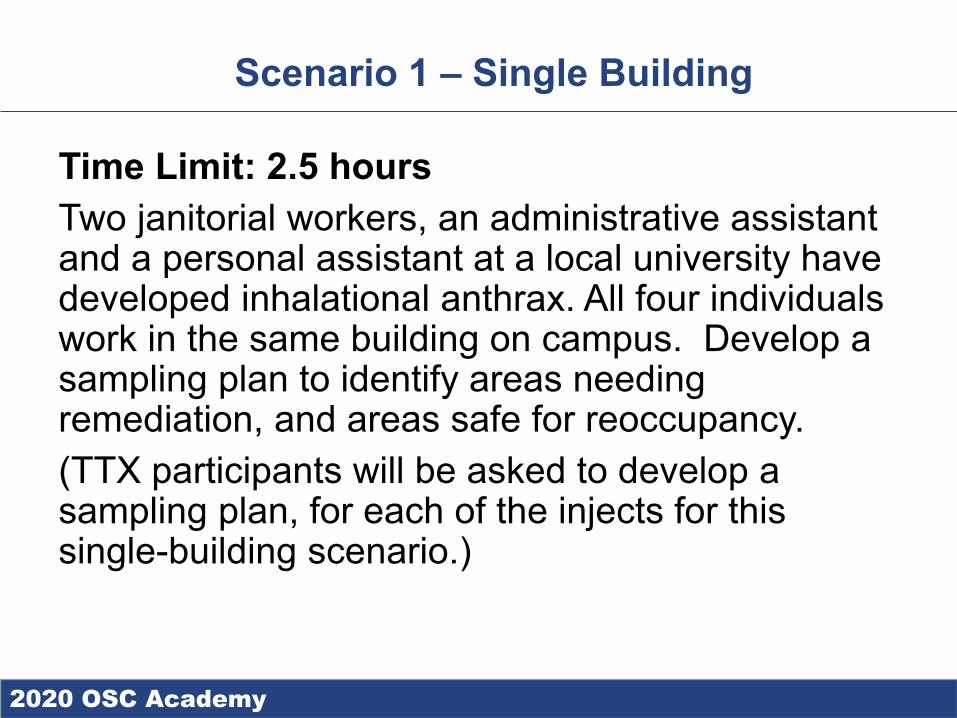
2020 OSC Academy
Scenario 1 – Single Building
Time Limit: 2.5 hoursTwo janitorial workers, an administrative assistant and a personal assistant at a local university have developed inhalational anthrax. All four individuals work in the same building on campus. Develop a sampling plan to identify areas needing remediation, and areas safe for reoccupancy.(TTX participants will be asked to develop a sampling plan, for each of the injects for this single-building scenario.)
14
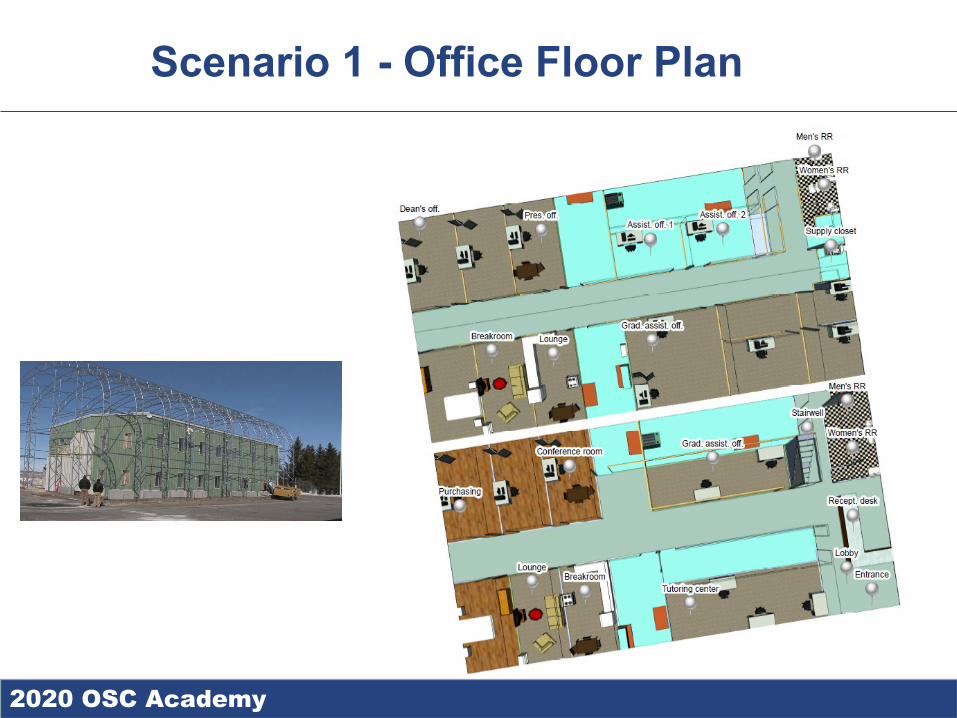
2020 OSC Academy
Scenario 1 - Office Floor Plan
15
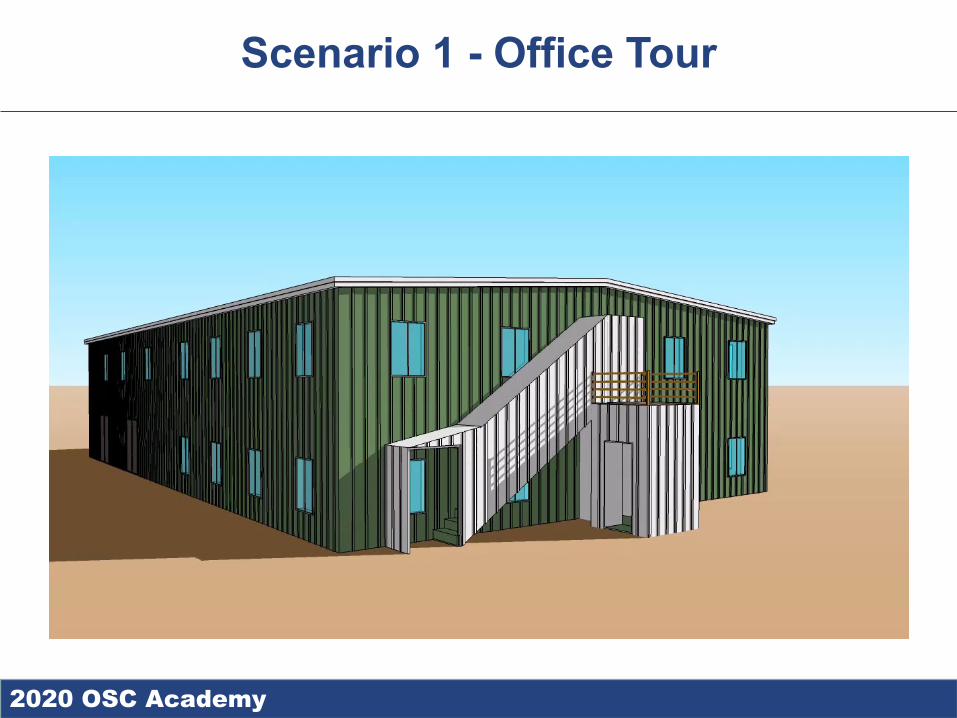
2020 OSC Academy
Scenario 1 - Office Tour
16
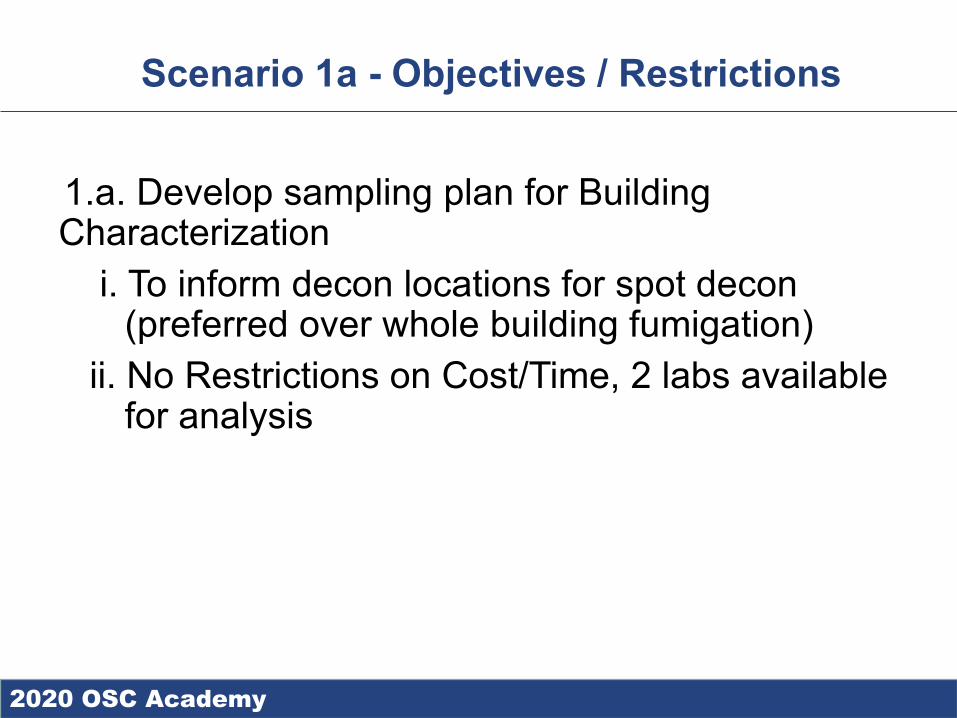
2020 OSC Academy
Scenario 1a - Objectives / Restrictions
1.a. Develop sampling plan for Building Characterization
i. To inform decon locations for spot decon (preferred over whole building fumigation)
ii. No Restrictions on Cost/Time, 2 labs available for analysis
17
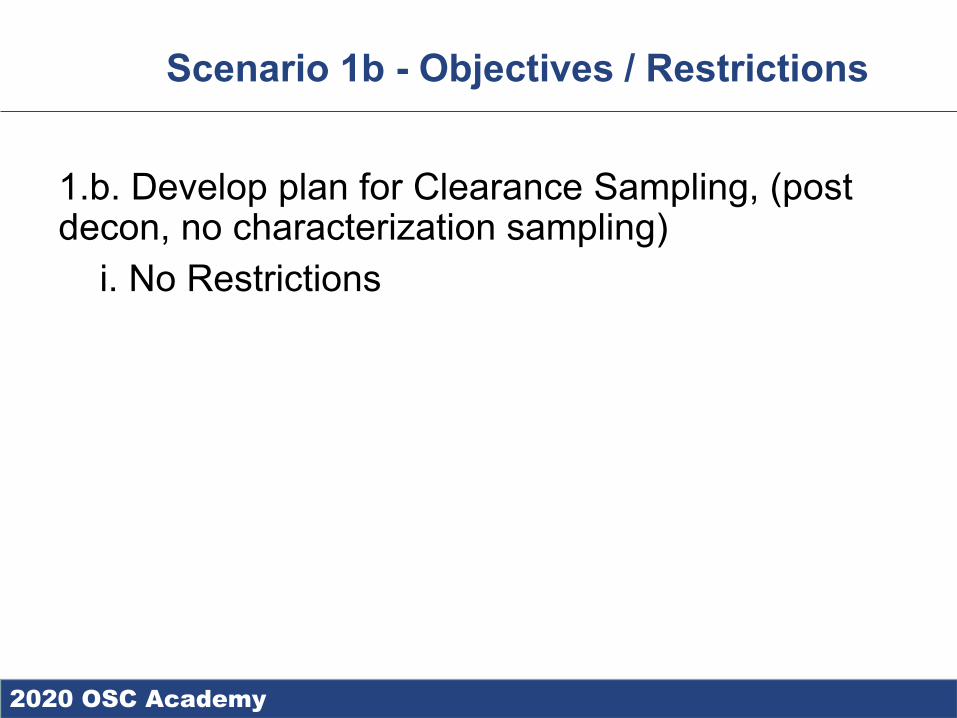
2020 OSC Academy
Scenario 1b - Objectives / Restrictions
1.b. Develop plan for Clearance Sampling, (post decon, no characterization sampling)
i. No Restrictions
18
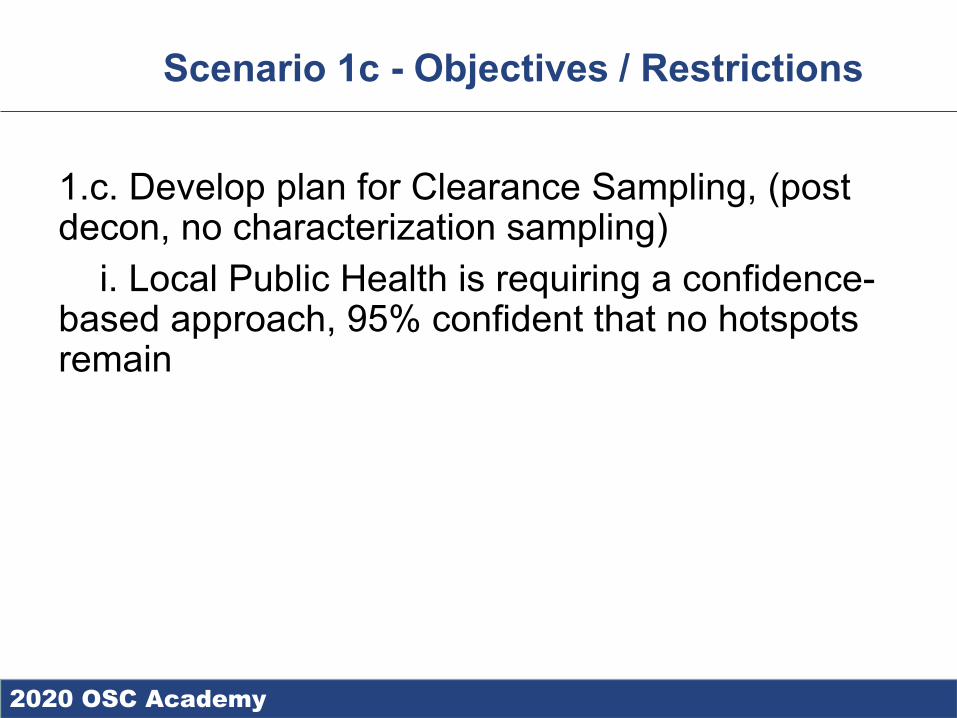
2020 OSC Academy
Scenario 1c - Objectives / Restrictions
1.c. Develop plan for Clearance Sampling, (post decon, no characterization sampling)
i. Local Public Health is requiring a confidence-based approach, 95% confident that no hotspots remain
19
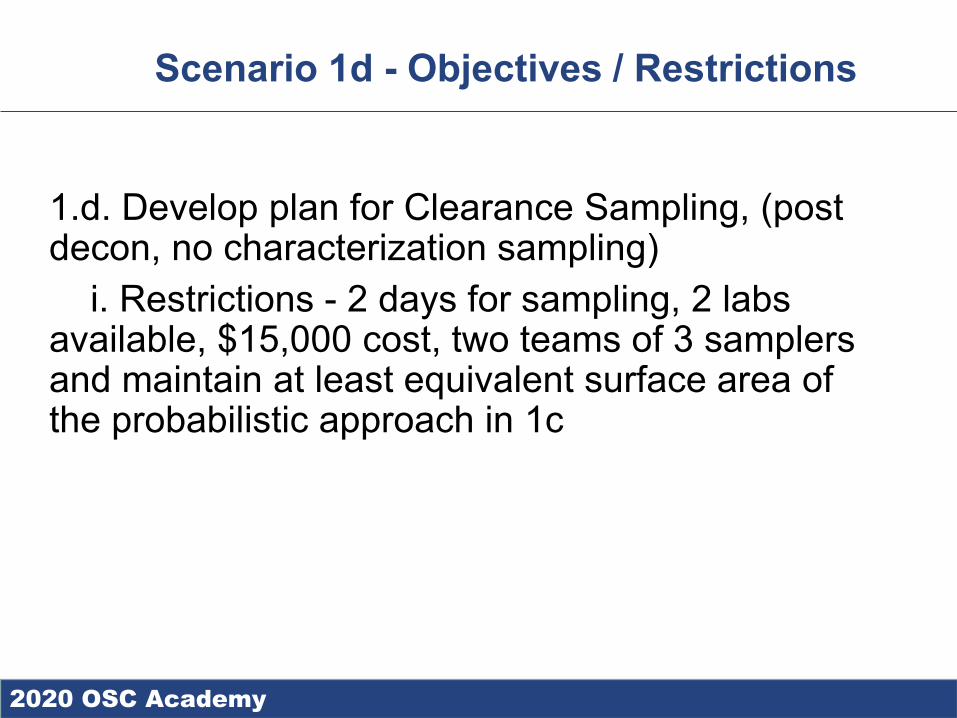
2020 OSC Academy
Scenario 1d - Objectives / Restrictions
1.d. Develop plan for Clearance Sampling, (post decon, no characterization sampling)
i. Restrictions - 2 days for sampling, 2 labs available, $15,000 cost, two teams of 3 samplers and maintain at least equivalent surface area of the probabilistic approach in 1c
20
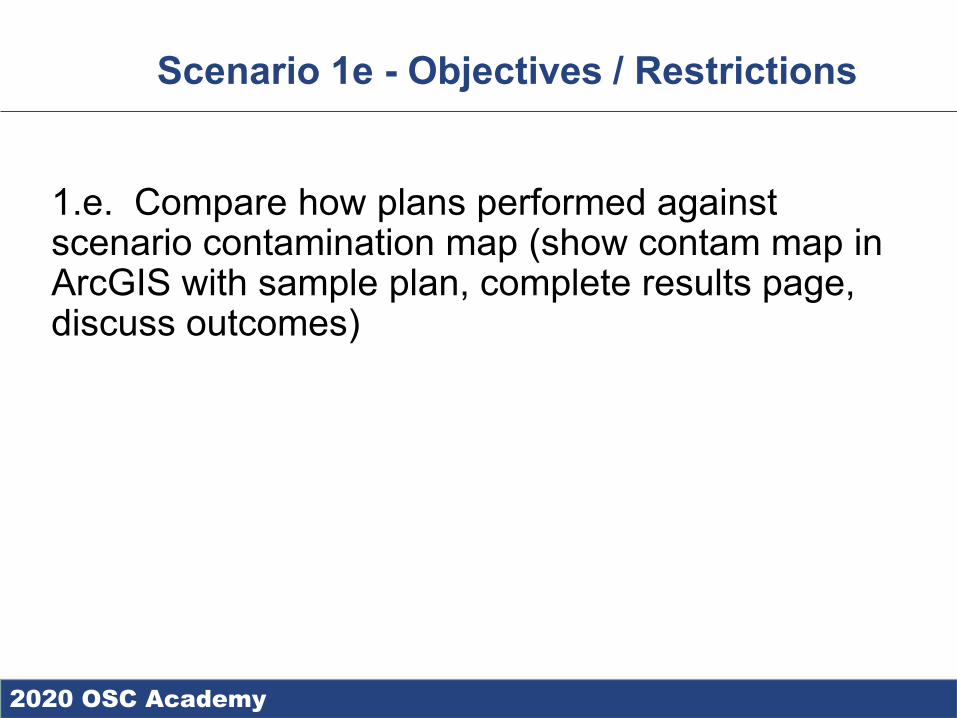
2020 OSC Academy
Scenario 1e - Objectives / Restrictions
1.e. Compare how plans performed against scenario contamination map (show contam map in ArcGIS with sample plan, complete results page, discuss outcomes)
21
2020 OSC Academy
Scenario 1 Hot Wash
22
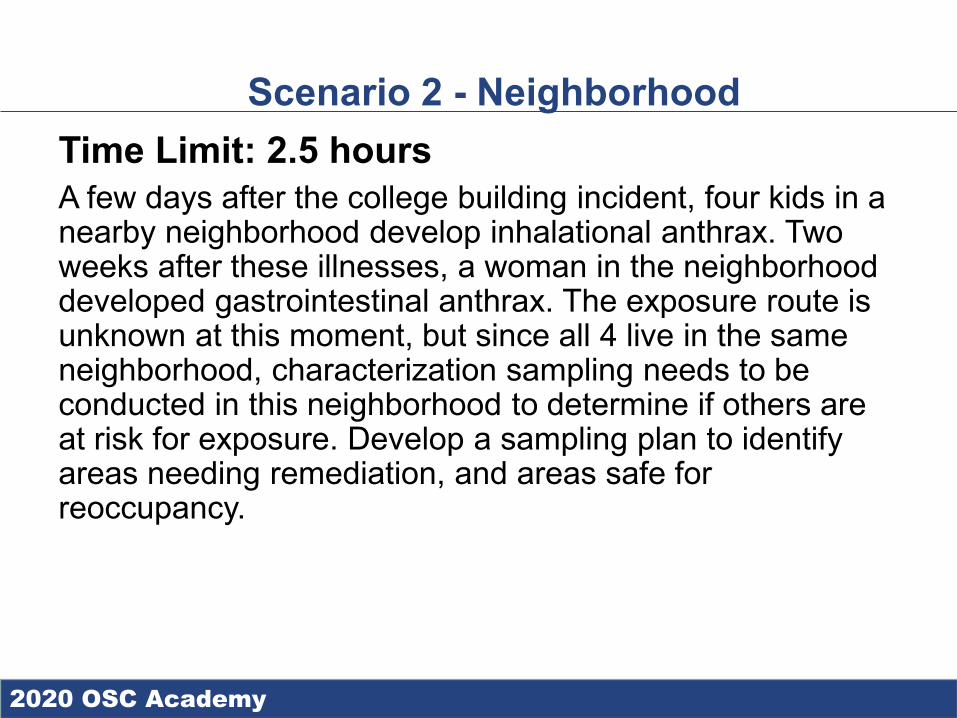
2020 OSC Academy
Scenario 2 - NeighborhoodTime Limit: 2.5 hoursA few days after the college building incident, four kids in a nearby neighborhood develop inhalational anthrax. Two weeks after these illnesses, a woman in the neighborhood developed gastrointestinal anthrax. The exposure route is unknown at this moment, but since all 4 live in the same neighborhood, characterization sampling needs to be conducted in this neighborhood to determine if others are at risk for exposure. Develop a sampling plan to identify areas needing remediation, and areas safe for reoccupancy.
23
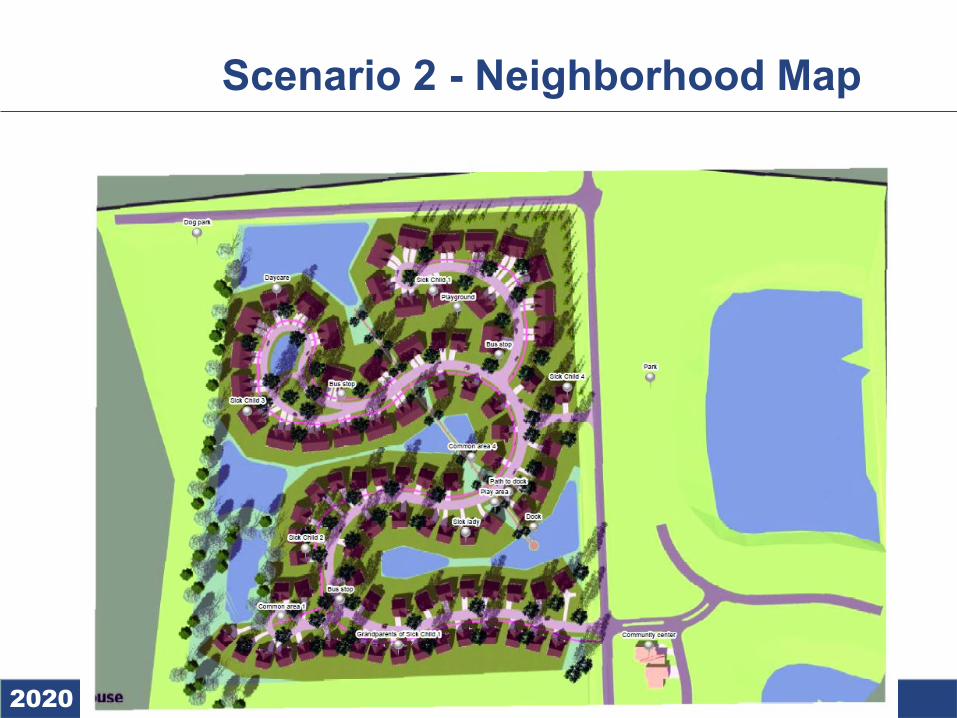
2020 OSC Academy
Scenario 2 - Neighborhood Map
24
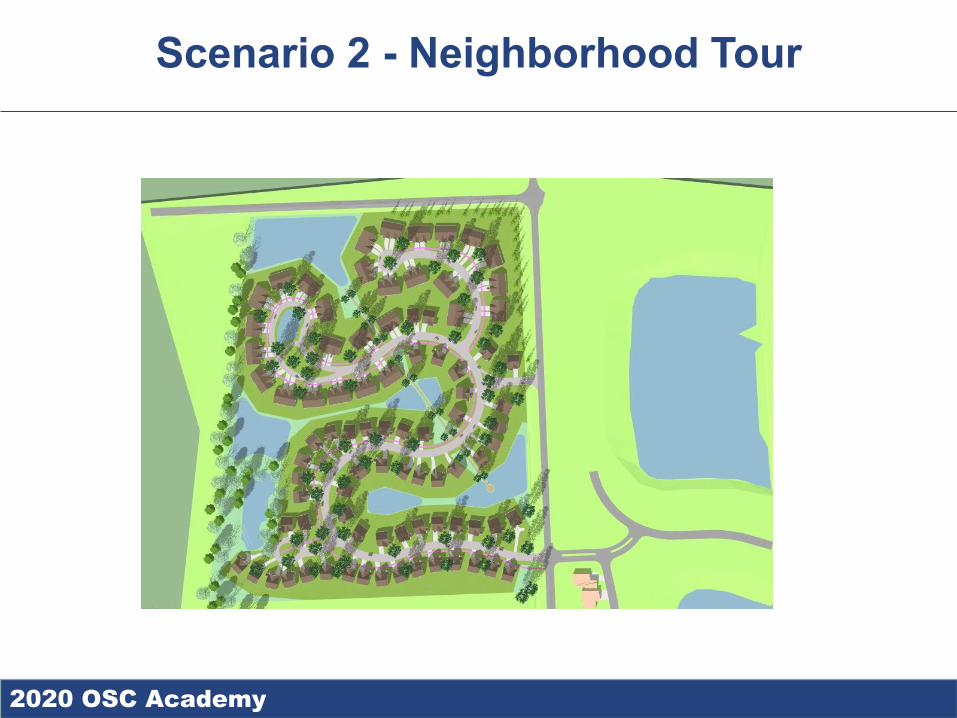
2020 OSC Academy
Scenario 2 - Neighborhood Tour
25
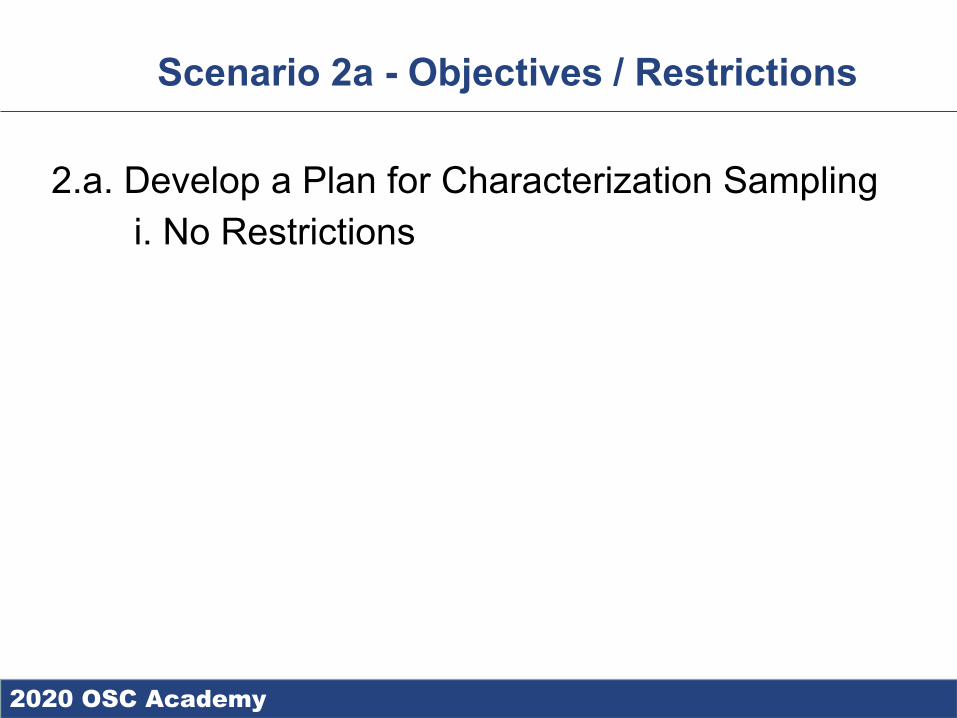
2020 OSC Academy
Scenario 2a - Objectives / Restrictions
2.a. Develop a Plan for Characterization Samplingi. No Restrictions
26
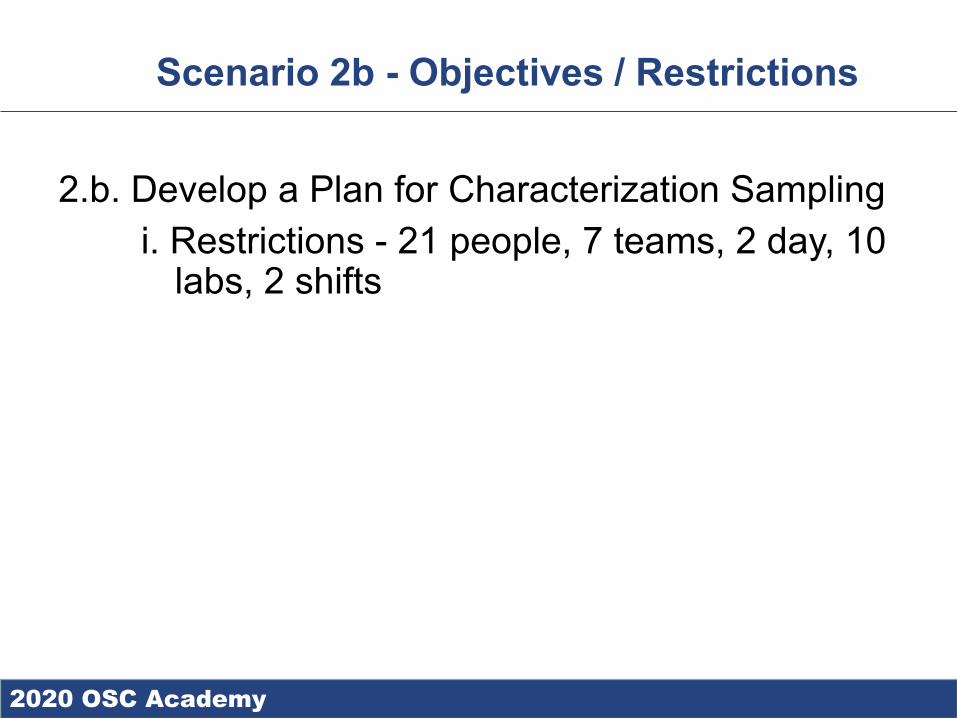
2020 OSC Academy
2.b. Develop a Plan for Characterization Samplingi. Restrictions - 21 people, 7 teams, 2 day, 10
labs, 2 shifts
27
Scenario 2b - Objectives / Restrictions
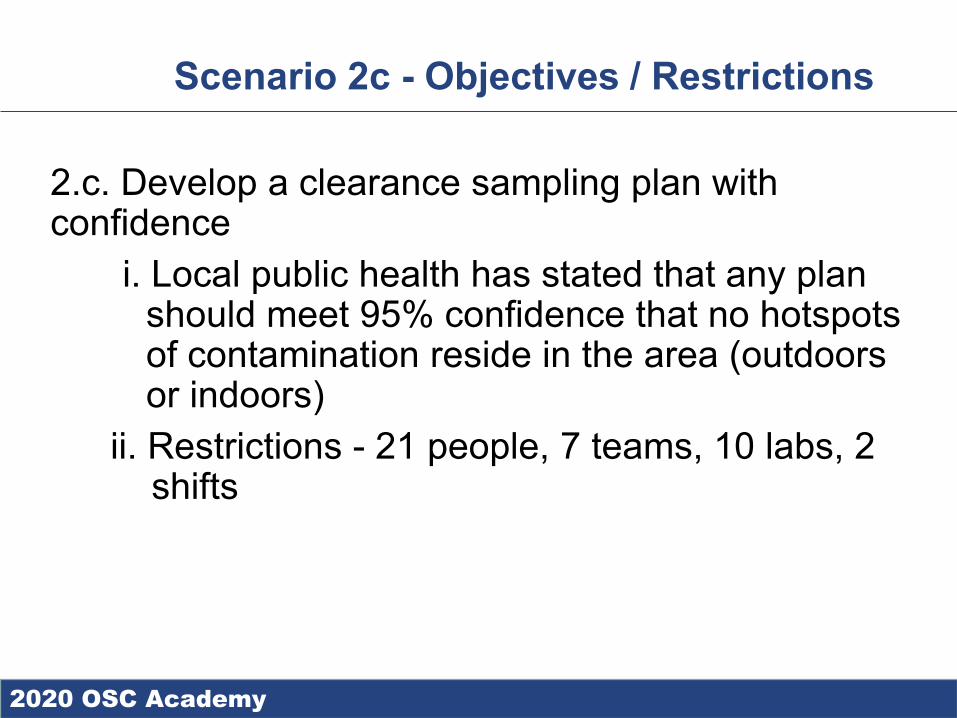
2020 OSC Academy
Scenario 2c - Objectives / Restrictions
2.c. Develop a clearance sampling plan with confidence
i. Local public health has stated that any plan should meet 95% confidence that no hotspots of contamination reside in the area (outdoors or indoors)
ii. Restrictions - 21 people, 7 teams, 10 labs, 2 shifts
28
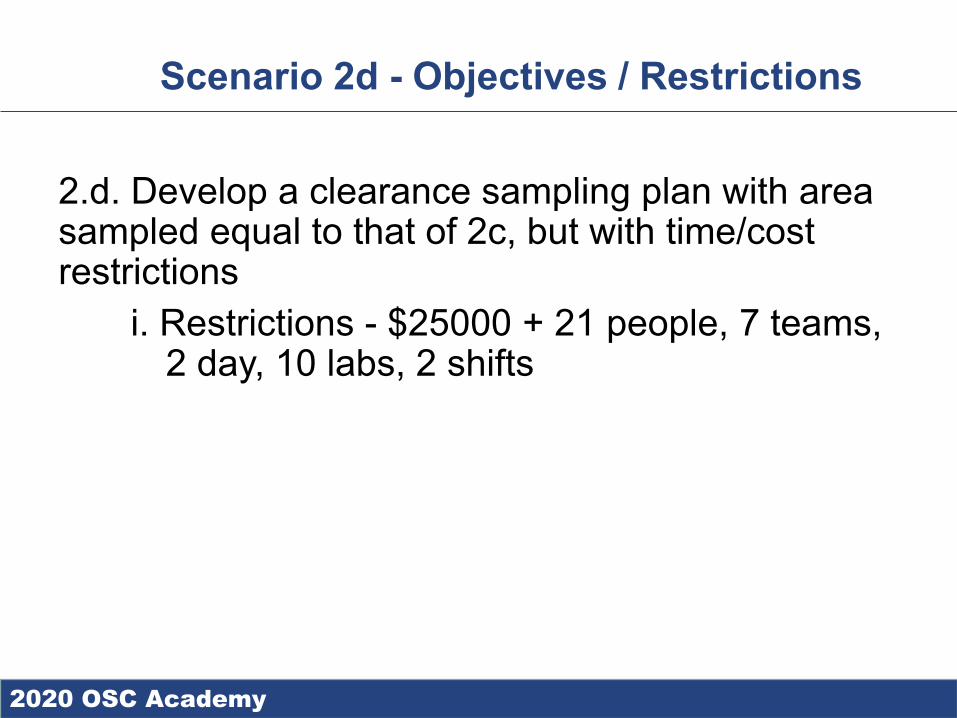
2020 OSC Academy
Scenario 2d - Objectives / Restrictions
2.d. Develop a clearance sampling plan with area sampled equal to that of 2c, but with time/cost restrictions
i. Restrictions - $25000 + 21 people, 7 teams, 2 day, 10 labs, 2 shifts
29
2020 OSC Academy
Scenario 2e - Objectives / Restrictions
2.e. Compare how plans performed against scenario contamination map
30
2020 OSC Academy
Scenario 2 Hot Wash
31
2020 OSC Academy
TTX Hot Wash
32

PRESORTED STANDARD POSTAGE & FEES PAID
EPA PERMIT NO. G-35
Office of Research and Development (8101R) Washington, DC 20460
Official Business Penalty for Private Use $300