Embed Size (px)
Citation preview
SAMPLE POLLUTION PREVENTION PLANPREPARED IN ACCORDANCE WITH THENEW JERSEY POLLUTION PREVENTION
ACT AND PROGRAM RULES
(Printing Example)
New Jersey Department of Environmental ProtectionOffice of Pollution Prevention and Right to Know
Revised May, 2006

2
How to Use This Sample Pollution Prevention Plan
The New Jersey Department of Environmental Protection, Office of Pollution Preventionand Right to Know, has prepared a Sample Pollution Prevention Plan for a hypotheticalpaint formulation facility regulated under the New Jersey Pollution Prevention Act andProgram Rules (N.J.A.C. 7:1K). Although the Plan has been written in the manner that atypical facility might prepare a Plan, numerous guidance notes from the Department areinserted in comment boxes throughout the document. These notes are intended to providetips and options to the users of this Sample Plan in the preparation of their actual Plan.The style and format used in this document are also simply an example, and may bevaried as desired by the facility. The order in which the information is presented does nothave to adhere to the order as given in the program rules. In this Sample Plan the orderdeviated in parts from the rules to follow a more logical progression. The order ofinformation is therefore optional, but the content must include all rule requirements. It isalso encouraged that additional information not specifically required by the rule beincluded in the Plan if it is deemed useful. It is recommended that this Sample Plan beused in conjunction with the Program Rules and with the guidance documents entitled,“Industrial Pollution Prevention Planning (Planning Guidance Document),” “PollutionPrevention Fill in the Blank Plan” and “Pollution Prevention Planning AdministrativeReview.” These documents are available at the Office of Pollution Prevention and Rightto Know’s website, http://www.nj.gov/dep/opppc/figdoc.htm.

3
POLLUTION PREVENTION PLAN
For
Garden State Paint CompanyJerseyville, New Jersey
FACID: 0123450000
NAICS 325510Base Year 2003
Revision 1.0
Date: June 30, 2005
4
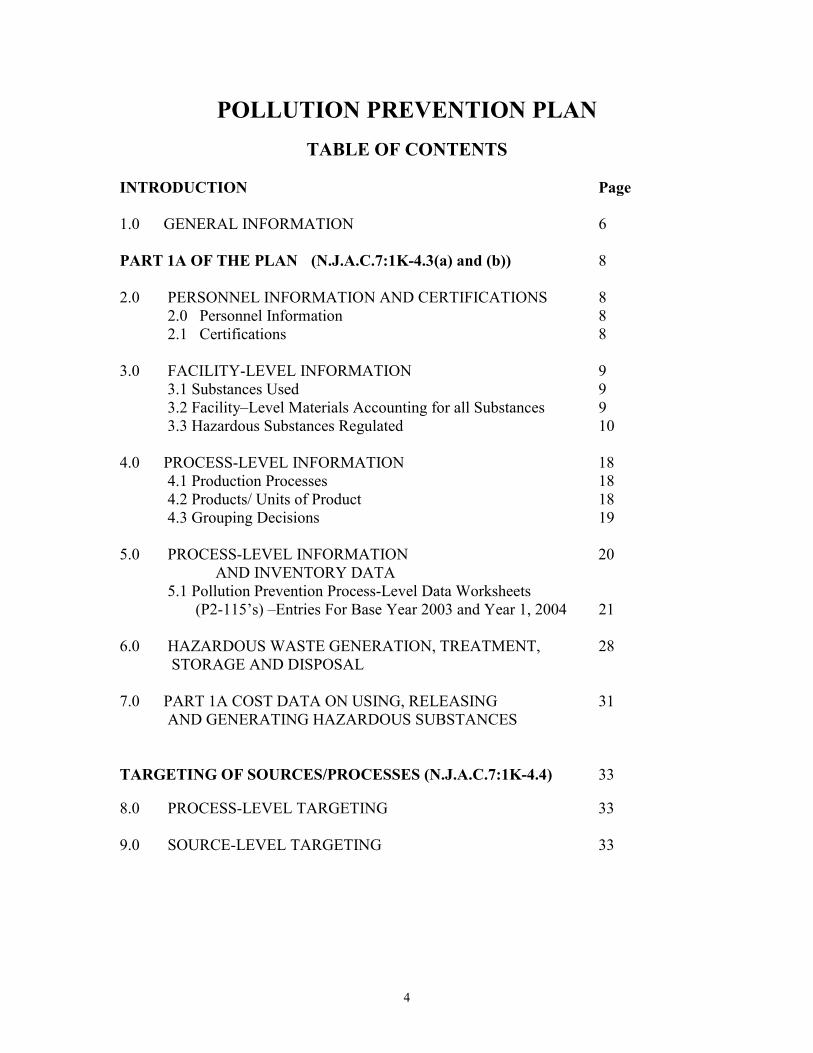
POLLUTION PREVENTION PLANTABLE OF CONTENTS
INTRODUCTION Page
1.0 GENERAL INFORMATION 6
PART 1A OF THE PLAN (N.J.A.C.7:1K-4.3(a) and (b)) 8
2.0 PERSONNEL INFORMATION AND CERTIFICATIONS 82.0 Personnel Information 82.1 Certifications 8
3.0 FACILITY-LEVEL INFORMATION 93.1 Substances Used 93.2 Facility–Level Materials Accounting for all Substances 93.3 Hazardous Substances Regulated 10
4.0 PROCESS-LEVEL INFORMATION 184.1 Production Processes 184.2 Products/ Units of Product 184.3 Grouping Decisions 19
5.0 PROCESS-LEVEL INFORMATION 20AND INVENTORY DATA
5.1 Pollution Prevention Process-Level Data Worksheets (P2-115’s) –Entries For Base Year 2003 and Year 1, 2004 21
6.0 HAZARDOUS WASTE GENERATION, TREATMENT, 28 STORAGE AND DISPOSAL
7.0 PART 1A COST DATA ON USING, RELEASING 31AND GENERATING HAZARDOUS SUBSTANCES
TARGETING OF SOURCES/PROCESSES (N.J.A.C.7:1K-4.4) 33
8.0 PROCESS-LEVEL TARGETING 33
9.0 SOURCE-LEVEL TARGETING 33

5
PART II OF THE PLAN (N.J.A.C.7:1K-4.5) 36
10.0 SOURCE-LEVEL NPO INVENTORY DATA 36
11.0 POLLUTION PREVENTION OPTIONS 4011.1 Technical Analysis of Pollution Prevention Options 4011.2 Financial Analysis of Pollution Prevention Options 4011.3 Selection of Pollution Prevention Options 45
12.0 POLLUTION PREVENTION GOALS 46
13.0 SCHEDULE OF IMPLEMENTATION 49
14.0 EXPECTED IMPACT OF IMPLEMENTED OPTIONS ON 50POST-TREATMENT MULTI-MEDIA RELEASES
PART IB OF THE PLAN (N.J.A.C.7:1K-4.3 (c)) 51
15.0 FACILITY-LEVEL INFORMATION ON REDUCTIONS 51
16.0 PROCESS-LEVEL INFORMATION ON TARGETED 56PROCESS REDUCTIONS
6
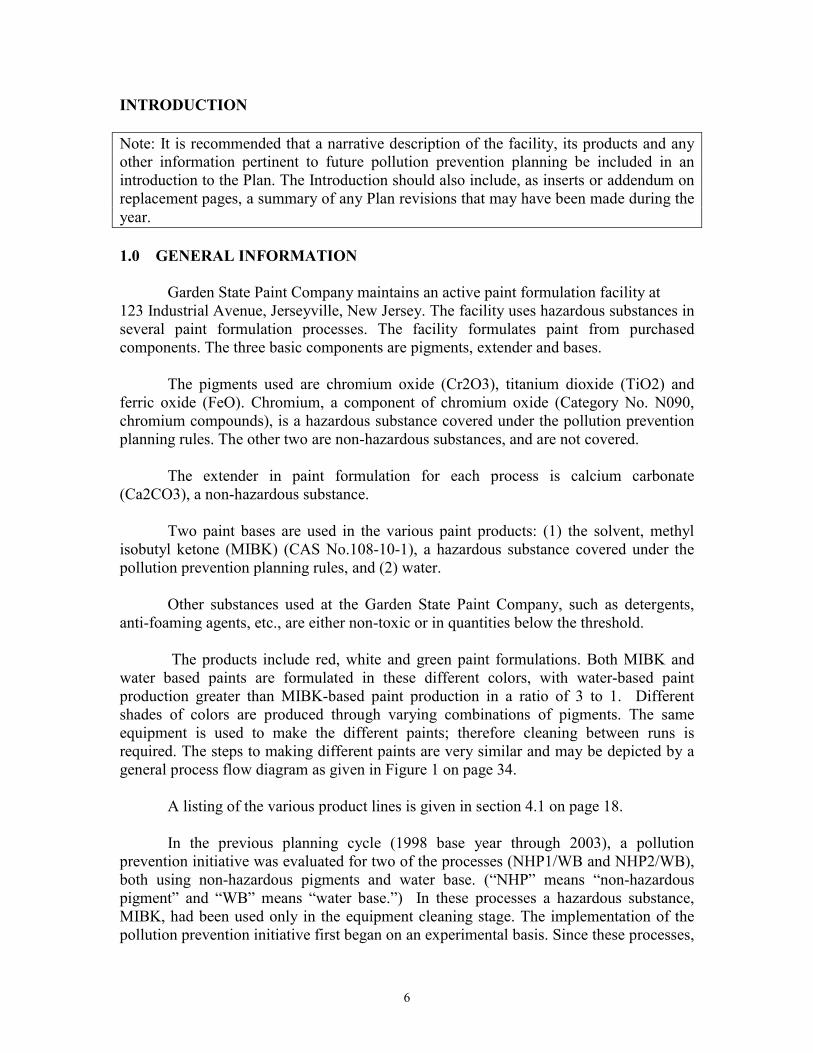
INTRODUCTION
Note: It is recommended that a narrative description of the facility, its products and anyother information pertinent to future pollution prevention planning be included in anintroduction to the Plan. The Introduction should also include, as inserts or addendum onreplacement pages, a summary of any Plan revisions that may have been made during theyear.
1.0 GENERAL INFORMATION
Garden State Paint Company maintains an active paint formulation facility at123 Industrial Avenue, Jerseyville, New Jersey. The facility uses hazardous substances inseveral paint formulation processes. The facility formulates paint from purchasedcomponents. The three basic components are pigments, extender and bases.
The pigments used are chromium oxide (Cr2O3), titanium dioxide (TiO2) andferric oxide (FeO). Chromium, a component of chromium oxide (Category No. N090,chromium compounds), is a hazardous substance covered under the pollution preventionplanning rules. The other two are non-hazardous substances, and are not covered.
The extender in paint formulation for each process is calcium carbonate(Ca2CO3), a non-hazardous substance.
Two paint bases are used in the various paint products: (1) the solvent, methylisobutyl ketone (MIBK) (CAS No.108-10-1), a hazardous substance covered under thepollution prevention planning rules, and (2) water.
Other substances used at the Garden State Paint Company, such as detergents,anti-foaming agents, etc., are either non-toxic or in quantities below the threshold.
The products include red, white and green paint formulations. Both MIBK andwater based paints are formulated in these different colors, with water-based paintproduction greater than MIBK-based paint production in a ratio of 3 to 1. Differentshades of colors are produced through varying combinations of pigments. The sameequipment is used to make the different paints; therefore cleaning between runs isrequired. The steps to making different paints are very similar and may be depicted by ageneral process flow diagram as given in Figure 1 on page 34.
A listing of the various product lines is given in section 4.1 on page 18.
In the previous planning cycle (1998 base year through 2003), a pollutionprevention initiative was evaluated for two of the processes (NHP1/WB and NHP2/WB),both using non-hazardous pigments and water base. (“NHP” means “non-hazardouspigment” and “WB” means “water base.”) In these processes a hazardous substance,MIBK, had been used only in the equipment cleaning stage. The implementation of thepollution prevention initiative first began on an experimental basis. Since these processes,

7
NHP1/WB and NHP2/WB, are water-based, MIBK deliveries were always made to thefar section of the facility in the vicinity of MIBK-based processes. Rather than transportstorage containers to these processes for equipment cleaning only, it was decided toevaluate cleaning with mineral spirits and with an alkaline cleaner, which were readilyavailable in this section of the facility. It was found that both options are technically andeconomically feasible. The use of an alkaline cleaner in the equipment cleaning step ofProcess NHP1/WB and NHP2/WB was initiated in January 2004, and at the writing ofthis Plan (June, 2004) has resulted in the elimination of MIBK in this process. The annualuse total of MIBK will be only 25 pounds, and will be reported in the P2-115 ProgressReport for 2005. (Revision 1.0 - June 30, 2005: This P2-115 data is included on page27 of this Plan revision.) The option of substituting an alkaline cleaner or mineral spiritsin the cleaning step will continue to be evaluated for the other processes, and will beimplemented in general in this five-year Plan.
Garden State Paint Company has been filing TRI Form R’s to the USEPA andRelease and Pollution Prevention Reports (RPPR’s) to the NJDEP since prior to the firstbase year for Pollution Prevention Planning in 1993. The facility originally had an SICcode 2851 for paint manufacture, and thus had established base years of 1993, 1998,2003, etc., according to the original rules. A New Jersey statute now requires all SICcodes to be converted to North American Industry Classification (NAICS) codes inenvironmental regulations. The facility now has an NAICS code 325510 for paintmanufacture.
According to new rules N.J.A.C. 7:1K-3.1(i) and (j), facilities will continue to useoriginal base year cycles, and thus will not be affected by the change from SIC to NAICScodes.
The current base year therefore remains 2003.
According to N.J.A.C. 7:1K-3.19(f), the base year for a new facility is the year after thefirst submittal of an RPPR Sections A and B, thus establishing five-year cycles and baseyears not affected by the change from SIC to NAICS codes.
Revision 1.0 - June 30, 2005: This Plan was revised to include changes inSection 13.0, Schedule of Implementation, page 49.

8
PART 1A OF THE PLAN N.J.A.C.7:1K-4.3(a) and (b)
2.0 PERSONNEL INFORMATION AND CERTIFICATIONS2.1 Personnel Information
Company: Garden State Paint Company123 Industrial AvenueJerseyville, New Jersey 12345(609) 555-1234
Highest Ranking Corporate Official at the Facility:Mr. William ShermanTitle: PresidentPhone: (609) 555-1234
Highest Ranking Corporate Official with Direct Operating Responsibility (Operator):
Mr. Henry Pinto Title: Vice-President Phone: (609) 555-1234
Non-Management Employee Representative: Mr. Richard CoatesOperator – Union StewardPhone: (609) 555-1234
2.2 Certifications
"I certify under penalty of law that I have read the Pollution Prevention Plan andthat the Pollution Prevention Plan is true, accurate and complete to the best of myknowledge."
Henry Pinto June 30, 2005Henry Pinto, Vice President Date
"I certify under penalty of law that I am familiar with the Pollution PreventionPlan and that it is the corporate policy of this industrial facility to achieve the goals of thePollution Prevention Plan."
William Sherman June 30, 2005William Sherman, President Date

9
3.0 FACILITY-LEVEL INFORMATION
Note: It is recommended that all substances, both hazardous and non-hazardous (un-regulated), be listed, to provide an indication of the extent ofthe entire facility’s operations.
3.1 Substances used
The following substances/chemicals are used at Garden State PaintCompany’s facility:
Titanium dioxide, TiO2Chromium oxide, Cr2O3Ferric oxide, FeOCalcium carbonate, CaCO3Methyl isobutyl ketone, MIBKWater
3.2 Facility–Level Materials Accounting Summary for all Substances
Note: A complete materials accounting of all hazardous substances at thefacility level is required. You may include Sections A and B of the RPPR inthe plan to fulfill the requirement, except for USE quantities, which mayhave to be calculated since it was not included in previous versions of theelectronic RPPR (eRPPR). For more recent years, USE is calculated byeRPPR in Section B. It is recommended that tables, such as Tables 2through 7, be included in the Plan for ease of comparison in subsequentyears, even if the RPPR is included.
Note: You may also want to provide a base-year facility-level materialsaccounting summary for all substances, including non-hazardous substances,to provide a facility-wide perspective. The facility may decide to provide amaterials accounting summary for non-hazardous substances in subsequentyears in order to understand changes in facility operation.
Table 1 provides a summary for base year 2003 of facility-level use and NPOof all substances listed in 3.1 above. This summary does not include a completeitemization of NPO categories and quantities, but this data for regulatedsubstances are included below. Only two substances on the above list areregulated under SARA 313 and therefore under Pollution Prevention planning.

10
3.3 Hazardous substances regulated
Tables 2 through 7 (including blank tables to be completed in subsequentyears) provide year by year facility-level inventory data on the two hazardoussubstances used at Garden State Paint Company that are regulated under SARA313. The two substances that are also subject to Pollution Prevention Planningare as follows:
Chromium oxide, Cr2O3 (N090, Chromium compounds)Methyl isobutyl ketone, MIBK (108-10-1)
The data in these tables are the same as those reported on the New JerseyRPPR. Use quantities are calculated as follows:
Use = Consumed + Shipped (as/in product) + NPO.
Inclusion of the RPPR in the Plan along with the use calculation satisfiesthe requirement for facility-level information (N.J.A.C.7:1K-4.3(b)2). TheRPPR’s have not been included in this Plan but copies are available at the facility.These tables, as required, include a complete itemization of NPO categories andquantities.
Note: For regulated hazardous substances, as part of the Plan, you may wantto include blank tables to be completed in future years, especially if these areentered by hand. The blank tables also serve as a reminder that the Plan is inprogress and is to be updated annually. In any case, this data must be addedin subsequent years.
Note: The difference between annual input quantities and annual outputquantities must not exceed five percent. (N.J.A.C. 7:1K-4.3(b)x.)

11
TABLE 1 BASE YEAR 2003 FACILITY-LEVEL SUBSTANCE INVENTORYSUMMARY FOR ALL FACILITY SUBSTANCES
Substance MIBK Cr2O3 FeO CaCo3 TiO2 WaterINPUTS: (pounds)Starting inventory 1040 1048 946 1006 1075 N/AProduced onsite 0 0 0 0 0 0Brought onsite 288016 134538 140862 276930 278460 830790Recycled out ofprocess/re-used onsite
0 0 0 0 0 0
OUTPUTS: (pounds)Consumed onsite 0 0 0 0 0 0Shipped offsite as/inproduct
271500 131900 138100 271500 273000 814500
Total NPO 11,132 2507 2486 4073 5460 8145Ending inventory 6424 1180 1222 2364 1075 N/AUSE 282,632 134,407 140,586 275,573 278,460 830,790

12
TABLE 2 FACILITY-LEVEL HAZARDOUS SUBSTANCE INVENTORYFOR COVERED SUBSTANCES
Base Year 2003Substance MIBK Cr2O3CAS No. 108-10-1 N090INPUTS: (pounds)Starting inventory 1040 1048Produced onsite 0 0Brought onsite 288016 134538Recycled out ofprocess/re-used onsite
0 0
OUTPUTS: (pounds)Consumed onsite 0 0Shipped offsite as/inproduct
271500 131900
Ending inventory 6424 1180Total NPO 11132 2507NPO: (pounds)Recycled outside ofprocess onsite
0 0
Destroyed through onsitetreatment
0 0
Destroyed through onsiteenergy recovery
0 0
Release to air through stackemissions
2305 1000
Release to air throughfugitive emissions
0 0
Discharged to POTW 217 40Discharged to surfacewaters
0 0
Discharge to ground water 0 0Onsite land disposal 0 0Transferred offsite 8610 1467USE (pounds) 282,632 134,407
NOTE: USE = Consumed + Shipped (as/in product) + NPO
13
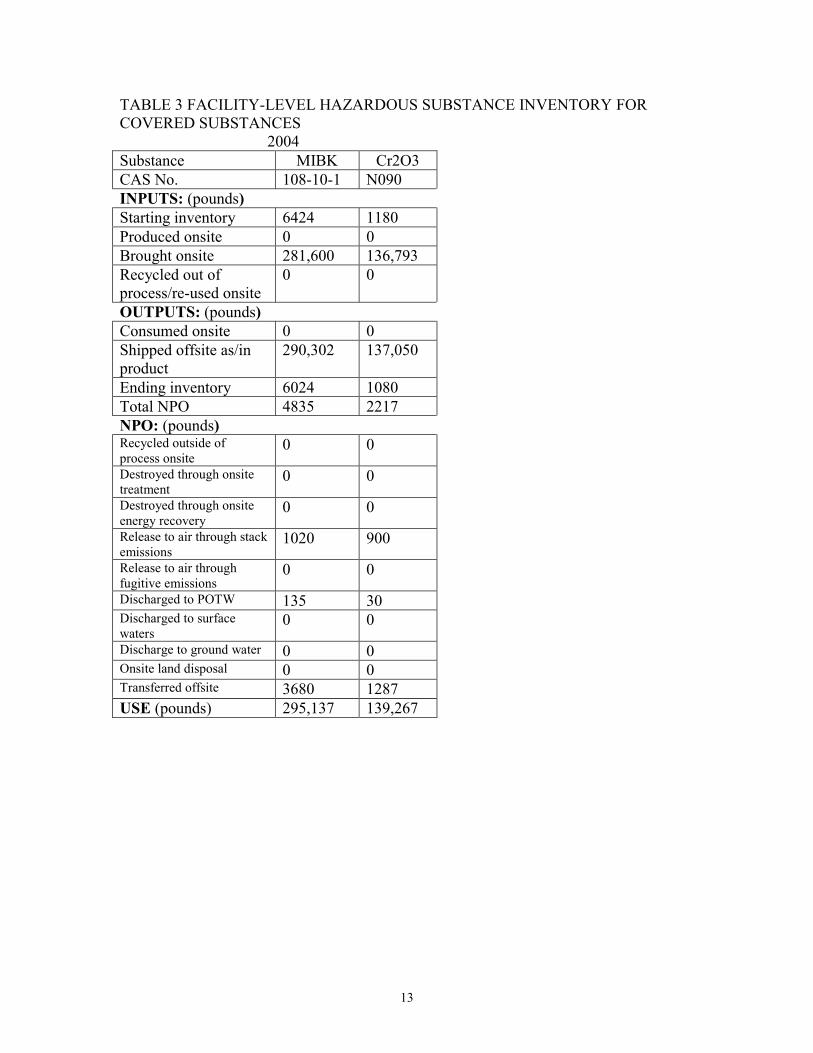
TABLE 3 FACILITY-LEVEL HAZARDOUS SUBSTANCE INVENTORY FORCOVERED SUBSTANCES
2004Substance MIBK Cr2O3CAS No. 108-10-1 N090INPUTS: (pounds)Starting inventory 6424 1180Produced onsite 0 0Brought onsite 281,600 136,793Recycled out ofprocess/re-used onsite
0 0
OUTPUTS: (pounds)Consumed onsite 0 0Shipped offsite as/inproduct
290,302 137,050
Ending inventory 6024 1080Total NPO 4835 2217NPO: (pounds)Recycled outside ofprocess onsite
0 0
Destroyed through onsitetreatment
0 0
Destroyed through onsiteenergy recovery
0 0
Release to air through stackemissions
1020 900
Release to air throughfugitive emissions
0 0
Discharged to POTW 135 30Discharged to surfacewaters
0 0
Discharge to ground water 0 0Onsite land disposal 0 0Transferred offsite 3680 1287USE (pounds) 295,137 139,267

14
TABLE 4 FACILITY-LEVEL HAZARDOUS SUBSTANCE INVENTORY FORCOVERED SUBSTANCES
2005Substance MIBK Cr2O3CAS No. 108-10-1 N090INPUTS: (pounds)Starting inventoryProduced onsiteBrought onsiteRecycled out ofprocess/re-used onsiteOUTPUTS: (pounds)Consumed onsiteShipped offsite as/inproductEnding inventoryTotal NPONPO: (pounds)Recycled outside ofprocess onsiteDestroyed through onsitetreatmentDestroyed through onsiteenergy recoveryRelease to air through stackemissionsRelease to air throughfugitive emissionsDischarged to POTWDischarged to surfacewatersDischarge to ground waterOnsite land disposalTransferred offsiteUSE (pounds)

15
TABLE 5 FACILITY-LEVEL HAZARDOUS SUBSTANCE INVENTORYFOR COVERED SUBSTANCES
2006Substance MIBK Cr2O3CAS No. 108-10-1 N090INPUTS: (pounds)Starting inventoryProduced onsiteBrought onsiteRecycled out ofprocess/re-used onsiteOUTPUTS: (pounds)Consumed onsiteShipped offsite as/inproductEnding inventoryTotal NPONPO: (pounds)Recycled outside ofprocess onsiteDestroyed through onsitetreatmentDestroyed through onsiteenergy recoveryRelease to air through stackemissionsRelease to air throughfugitive emissionsDischarged to POTWDischarged to surfacewatersDischarge to ground waterOnsite land disposalTransferred offsiteUSE (pounds)
16
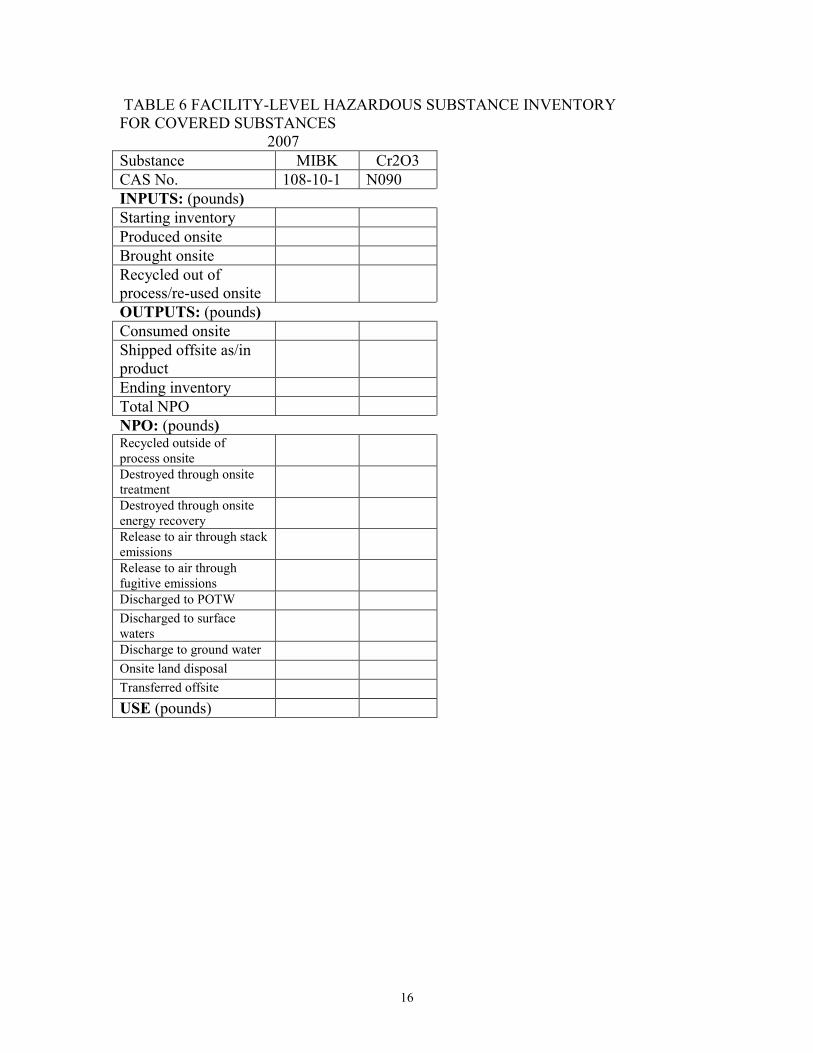
TABLE 6 FACILITY-LEVEL HAZARDOUS SUBSTANCE INVENTORYFOR COVERED SUBSTANCES
2007Substance MIBK Cr2O3CAS No. 108-10-1 N090INPUTS: (pounds)Starting inventoryProduced onsiteBrought onsiteRecycled out ofprocess/re-used onsiteOUTPUTS: (pounds)Consumed onsiteShipped offsite as/inproductEnding inventoryTotal NPONPO: (pounds)Recycled outside ofprocess onsiteDestroyed through onsitetreatmentDestroyed through onsiteenergy recoveryRelease to air through stackemissionsRelease to air throughfugitive emissionsDischarged to POTWDischarged to surfacewatersDischarge to ground waterOnsite land disposalTransferred offsiteUSE (pounds)

17
TABLE 7 FACILITY-LEVEL HAZARDOUS SUBSTANCE INVENTORYFOR COVERED SUBSTANCES
2008Substance MIBK Cr2O3CAS No. 108-10-1 N090INPUTS: (pounds)Starting inventoryProduced onsiteBrought onsiteRecycled out ofprocess/re-used onsiteOUTPUTS: (pounds)Consumed onsiteShipped offsite as/inproductEnding inventoryTotal NPONPO: (pounds)Recycled outside ofprocess onsiteDestroyed through onsitetreatmentDestroyed through onsiteenergy recoveryRelease to air through stackemissionsRelease to air throughfugitive emissionsDischarged to POTWDischarged to surfacewatersDischarge to ground waterOnsite land disposalTransferred offsiteUSE (pounds)

18
4.0 PROCESS-LEVEL INFORMATION
4.1 Production Processes
The facility operates six paint formulation processes, identified as follows:
1. HP/SB - Formulation of green paints with hazardous pigment Cr2O3 in ahazardous solvent base, MIBK.
2. HP/WB -Formulation of green paints with hazardous pigment Cr2O3 in awater base.
3. NHP1/SB -Formulation of white paints with a non-hazardous pigment (TiO2)in a hazardous solvent base, MIBK.
4. NHP2/SB -Formulation of red paints with a non-hazardous pigment (FeO) ina hazardous solvent base, MIBK.
5. NHP1/WB - Formulation of white paints with a non-hazardous pigment(TiO2) in a water base. A hazardous solvent, MIBK, is used for equipmentcleaning.
6. NHP2/WB - Formulation of red paints with a non-hazardous pigment (FeO) ina water base. A hazardous solvent, MIBK, is used for equipment cleaning.
Pollution prevention planning is required for all processes. A process flowdiagram is required for each process (N.J.A.C. 7:1K-4.3(b)3iv). For a generalexample that represents all six processes, see Figure 1 on page 34.
4.2 Products/ Units of Product
The facility formulates a variety of paints in six production processes.Unit of product in all cases is a gallon of paint. All six processes use at least onehazardous substance. Table 8 shows production quantity (total units of product ingallons) for each year for each production line (or groupings) containing ahazardous substance. Groupings will now be discussed.

19
4.3 Grouping Decisions
A description of grouping decisions, if any, is required by N.J.A.C. 7:1K-4.3(b)3iii. The decision was made to group some of the six processes. It wasdecided to group processes that use similar ingredients to make similar products.For example, all shades of white are considered one process, and white and redcould be combined in cases where the same base is used. The following tableshows the groupings:
MIBK hazardoussolvent base
Water
Cr2O3Hazardous pigment
1 process (HP/SB)(Process 1)
1 process (HP/WB)(Process 2)
Non-hazardouspigment
2 processes in group(NHP/SB)(Process 3 and 4)
2 processes in group(NHP/WB)(Process 5 and 6)
Process NHP1/SB and NHP2/SB are combined into a group identified as NHP/SB, andprocess NHP1/WB and NHP2/WB are combined into a group identified as NHP/WB.
TABLE 8 PRODUCTION QUANTITY (total units of production) (gallons)
PRODUCT 2003 2004 2005 2006 2007 2008HP/SB 9618 10005HP/WB 28853 29993NHP/SB 29976 32276NHP/WB 89928 96828

20
5.0 PROCESS-LEVEL INFORMATION AND INVENTORY DATA
The Pollution Prevention Process-level Data Worksheets (P2-115’s) foreach chemical in each process are given on the following pages. These fulfill allthe requirements of N.J.A.C. 7:1K-4.3(b)3i and ii and 4i, for process-level data tobe included in the Plan. The data in the P2-115’s cover base year 2003, whichwas in the initial Plan, and the data for Year 1, 2004, which has been added in thisPlan revision (Revision 1.0).
Note: Revised text concerning the added data is recommended if thesignificance of the change is important for the implementation of the Plan.The revised text may be added in the Introduction or on separate pages. Inthis Sample Plan, a discussion of data changes for one process is includedin the Introduction.
Note: Additions of data into P2-115’s in subsequent years of the five-yearPlan must be made in the Plan. Further explanation of the four questionson the P2-115’s may be included on separate pages.
Copies of the Pollution Prevention Process-level Data Worksheets (P2-115’s) for each chemical in each process were submitted to the Department onJune 30, 2005 to include data for 2004. These submittals fulfill the ProgressReport requirement in accordance with of N.J.A.C. 7:1K-6.2. In subsequentyears, 2005, 2006, 2007 and 2008, of the planning cycle, entries will be made intothe P2-115’s in the Plan and copies will be submitted to the Department by July 1.
Note: If P2-115’s are submitted as the progress reporting option in lieu ofSections C And D (Release And Pollution Prevention Report), facility-levelreductions (Section 15.0) and targeted process-level reductions (Section16.0) in Part IB are not required (see pages 21 through 27). The Departmentwill perform these calculations and return the results to the facility to beincorporated into the Plan.
It is recommended that the Plan include a statement of which progressreporting option will be used. Certification is required on only one P2-115,if multiple P2-115’s are submitted.

21
5.1 Pollution Prevention Process-level Data Worksheets (P2-115’s) The following pages provide the Pollution Prevention Process-Level Data Worksheets(P2-115’s) for each substance at each process.

22
NOTE: THIS WORKSHEET IS REQUIRED AS PART OF THE POLLUTION PREVENTION PLAN, ANDIS OPTIONAL AS A SUBMITTAL IN LIEU OF SECTIONS C AND D OF THE RELEASE AND POLLUTIONPREVENTION REPORT. ALL OPTIONAL SUBMITTALS ARE NOT CONFIDENTIAL.
POLLUTION PREVENTION PROCESS LEVEL DATA WORKSHEET (P2-115)Base Year __2003______
PROCESS LEVEL INFORMATION: (Use one sheet for each hazardous substance at each process.)PROCESS I.D. __HP/SB______________________________________________UNITS OF PRODUCTION (e.g. type of widget, lbs. of chemical, ft2 of product) __gallons___________Is process targeted? (Y/N)__Y_ Is this a grouped process? (Y/N)_N____
HAZARDOUS SUBSTANCE: MIBK CAS No. 108-10-1Base Year Year 1 Year 2 Year 3 Year 4 Year 5
Production quantity 9618 10005USE (pounds) 67269 69709 Consumed Shipped off-site as (or in) product 65950 68759 NPO (pounds) 1319 950
Recycled out of processDestroyed: on site treatmentDestroyed: on site energy recoveryStack air emissions 200 190Fugitive air emissionsDischarge to POTWS 50 50Discharge to groundwaterDischarge to surface watersOn site land disposalTransferred off site 1069 710End. Inv. as NPO – Beg. Inv. as NPO
P2 techniques used in given year (use thecode(s) from the Appendix of the RPPRInstructions)
W42, W58
Was this process discontinued or sent offsite in given year? (Y/N)
N
Did facility make process change(s) thattriggered Plan modification? (Y/N)
N
Was facility's P2 progress (targetedprocess only) less than anticipated?(Y/N) (Attach explanation if Y.)
N
CERTIFICATION OF OWNER OR OPERATOR (Required only on one P2-115) - I certify under penaltyof law that the information submitted on this worksheet is true, accurate and complete to the best ofmy knowledge.
Signature______Henry Pinto_____________ Date 6/30/05 Phone (609) 555-1234 Name (print) Henry Pinto Title Vice President
Garden State Paint Company123 Industrial AvenueJerseyville, New Jersey 12345

23
NOTE: THIS WORKSHEET IS REQUIRED AS PART OF THE POLLUTION PREVENTION PLAN, ANDIS OPTIONAL AS A SUBMITTAL IN LIEU OF SECTIONS C AND D OF THE RELEASE AND POLLUTIONPREVENTION REPORT. ALL OPTIONAL SUBMITTALS ARE NOT CONFIDENTIAL.
POLLUTION PREVENTION PROCESS LEVEL DATA WORKSHEET (P2-115)Base Year _____2003___
PROCESS LEVEL INFORMATION: (Use one sheet for each PROCESS I.D.__HP/SB________________________UNITS OF PRODUCTION (e.g. type of widget, lbs. of chemiIs process targeted? (Y/N) Y Is this a grouped proces
HAZARDOUS SUBSTANCE: Cr2O3 Base Year Year
Production quantity 9,618 10,0USE (pounds) 33,602 34,8 Consumed Shipped off-site as (or in) product 32,975 34,3 NPO (pounds) 627 567
Recycled out of processDestroyed: on site treatmentDestroyed: on site energy recoveryStack air emissions 500 450Fugitive air emissionsDischarge to POTWs 20 15Discharge to groundwaterDischarge to surface watersOn site land disposalTransferred off site 107 102End. Inv. as NPO – Beg. Inv. as NPO
P2 techniques used in given year (use thecode(s) from the Appendix of the RPPRInstructions)
W42
Was this process discontinued or sent offsite in given year? (Y/N)
N
Did facility make process change(s) thattriggered Plan modification? (Y/N)
N
Was facility's P2 progress (targetedprocess only) less than anticipated?(Y/N) (Attach explanation if Y.)
N
CERTIFICATION OF OWNER OR OPERATOR (Required onof law that the information submitted on this worksheet is my knowledge.
Signature __________________________________ Date ___Name (print) ___________________________ Title _______
Garden State Paint Company123 Industrial AvenueJerseyville, New Jersey 12345
Garden State Paint Company123 Industrial AvenueJerseyville, New Jersey 12345
hazardous substance at each process.)
cal, ft2 of product) _____gallons_______s? (Y/N) ___ N ____
CAS No. N 090 1 Year 2 Year 3 Year 4 Year 50592
25
, W58
ly on one P2-115) - I certify under penaltytrue, accurate and complete to the best of
___________ Phone ( )________________________________________________
24
NOTE: THIS WORKSHEET IS REQUIRED AS PART OF THE POLLUTION PREVENTION PLAN, ANDIS OPTIONAL AS A SUBMITTAL IN LIEU OF SECTIONS C AND D OF THE RELEASE AND POLLUTIONPREVENTION REPORT. ALL OPTIONAL SUBMITTALS ARE NOT CONFIDENTIAL.
POLLUTION PREVENTION PROCESS LEVEL DATA WORKSHEET (P2-115)Base Year ____2003 ____
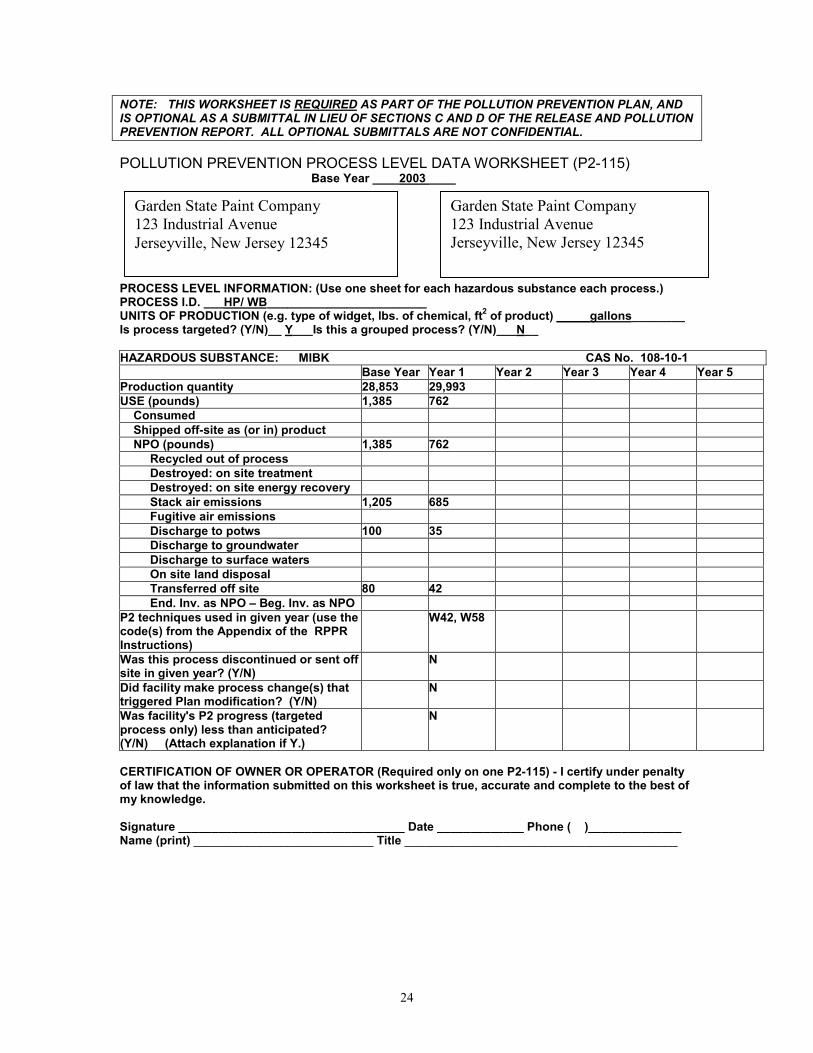
PROCESS LEVEL INFORMATION: (Use one sheet for each hazardous substance each process.)PROCESS I.D. ___HP/ WB________________________UNITS OF PRODUCTION (e.g. type of widget, lbs. of chemical, ft2 of product) _____gallons________Is process targeted? (Y/N)__ Y___Is this a grouped process? (Y/N)___N__
HAZARDOUS SUBSTANCE: MIBK CAS No. 108-10-1Base Year Year 1 Year 2 Year 3 Year 4 Year 5
Production quantity 28,853 29,993USE (pounds) 1,385 762 Consumed Shipped off-site as (or in) product NPO (pounds) 1,385 762
Recycled out of processDestroyed: on site treatmentDestroyed: on site energy recoveryStack air emissions 1,205 685Fugitive air emissionsDischarge to potws 100 35Discharge to groundwaterDischarge to surface watersOn site land disposalTransferred off site 80 42End. Inv. as NPO – Beg. Inv. as NPO
P2 techniques used in given year (use thecode(s) from the Appendix of the RPPRInstructions)
W42, W58
Was this process discontinued or sent offsite in given year? (Y/N)
N
Did facility make process change(s) thattriggered Plan modification? (Y/N)
N
Was facility's P2 progress (targetedprocess only) less than anticipated?(Y/N) (Attach explanation if Y.)
N
CERTIFICATION OF OWNER OR OPERATOR (Required only on one P2-115) - I certify under penaltyof law that the information submitted on this worksheet is true, accurate and complete to the best ofmy knowledge.
Signature __________________________________ Date _____________ Phone ( )______________Name (print) ___________________________ Title _________________________________________
Garden State Paint Company123 Industrial AvenueJerseyville, New Jersey 12345
Garden State Paint Company123 Industrial AvenueJerseyville, New Jersey 12345

NOTE: THIS WORKSHEET IS REQUIRED AS PART OF THE POLLUTION PREVENTION PLAN, ANDIS OPTIONAL AS A SUBMITTAL IN LIEU OF SECTIONS C AND D OF THE RELEASE AND POLLUTIONPREVENTION REPORT. ALL OPTIONAL SUBMITTALS ARE NOT CONFIDENTIAL.
POLLUTION PREVENTION PROCESS LEVEL DATA WORKSHEET (P2-115)Base Year ___2003_____
PRPRUNIs p
HA
ProUS C S N
P2 codInsWasiteDidtrigWapro(Y/N
CEof lmy
SigNam
Garden State Paint Company123 Industrial AvenueJerseyville, New Jersey 12345
25
OCESS LEVEL INFORMATION: (Use one sheet for eaOCESS I.D. ______HP/WB_______________________ITS OF PRODUCTION (e.g. type of widget, lbs. of cherocess targeted? (Y/N)__Y___ Is this a grouped pro
ZARDOUS SUBSTANCE: Cr2O3 Base Year Y
duction quantity 28853 2E (pounds) 100805 1onsumedhipped off-site as (or in) product 98,925 1PO (pounds) 1880 1
Recycled out of processDestroyed: on site treatmentDestroyed: on site energy recoveryStack air emissions 500 4Fugitive air emissionsDischarge to potws 20 1Discharge to groundwaterDischarge to surface watersOn site land disposalTransferred off site 1360 1End. Inv. as NPO – Beg. Inv. as NPO
techniques used in given year (use thee(s) from the Appendix of the RPPR
tructions)
W
s this process discontinued or sent off in given year? (Y/N)
N
facility make process change(s) thatgered Plan modification? (Y/N)
N
s facility's P2 progress (targetedcess only) less than anticipated?) (Attach explanation if Y.)
N
RTIFICATION OF OWNER OR OPERATOR (Requiredaw that the information submitted on this worksheet knowledge.
nature __________________________________ Datee (print) ___________________________ Title _____
Garden State Paint Company123 Industrial AvenueJerseyville, New Jersey 12345
ch hazardous substance each process.)_mical, ft2 of product) _______gallons ____cess? (Y/N)___N__
CAS No. N090ear 1 Year 2 Year 3 Year 4 Year 5999304375
02,725650
50
5
185
42, W58
only on one P2-115) - I certify under penalty is true, accurate and complete to the best of
_____________ Phone ( )__________________________________________________

NOTE: THIS WORKSHEET IS REQUIRED AS PART OF THE POLLUTION PREVENTION PLAN, ANDIS OPTIONAL AS A SUBMITTAL IN LIEU OF SECTIONS C AND D OF THE RELEASE AND POLLUTIONPREVENTION REPORT. ALL OPTIONAL SUBMITTALS ARE NOT CONFIDENTIAL.
POLLUTION PREVENTION PROCESS LEVEL DATA WORKSHEET (P2-115)Base Year _2003____
PPUIs
H
PU
PcInWsDtrWp(Y
Com
SN
Garden State Paint Company123 Industrial AvenueJerseyville, New Jersey 12345
26
ROCESS LEVEL INFORMATION: (Use one sheet for eaROCESS I.D. __NHP/SB______________________NITS OF PRODUCTION (e.g. type of widget, lbs. of che process targeted? (Y/N)___Y__Is this a grouped proc
AZARDOUS SUBSTANCE: MIBK Base Year Y
roduction quantity 29,976 3SE (pounds) 209,661 2 Consumed Shipped off-site as (or in) product 205,550 2 NPO (pounds) 4111 3
Recycled out of processDestroyed: on site treatmentDestroyed: on site energy recoveryStack air emissions 200 1Fugitive air emissionsDischarge to potws 50 5Discharge to groundwaterDischarge to surface watersOn site land disposalTransferred off site 3861 2End. Inv. as NPO – Beg. Inv. as NPO
2 techniques used in given year (use theode(s) from the Appendix of the RPPRstructions)
W
as this process discontinued or sent offite in given year? (Y/N)
N
id facility make process change(s) thatiggered Plan modification? (Y/N)
N
as facility's P2 progress (targetedrocess only) less than anticipated?/N) (Attach explanation if Y.)
N
ERTIFICATION OF OWNER OR OPERATOR (Requiredf law that the information submitted on this worksheety knowledge.
ignature __________________________________ Dateame (print) ___________________________ Title _____
Garden State Paint Company123 Industrial AvenueJerseyville, New Jersey 12345
ch hazardous substance each process.)
mical, ft2 of product) ____gallons_________ess? (Y/N)___Y __
CAS No. 108-10-1ear 1 Year 2 Year 3 Year 4 Year 52,27624,641
21,543098
40
0
908
42, W58
only on one P2-115) - I certify under penalty is true, accurate and complete to the best of
_____________ Phone ( )__________________________________________________

NOTE: THIS WORKSHEET IS REQUIRED AS PART OF THE POLLUTION PREVENTION PLAN, ANDIS OPTIONAL AS A SUBMITTAL IN LIEU OF SECTIONS C AND D OF THE RELEASE AND POLLUTIONPREVENTION REPORT. ALL OPTIONAL SUBMITTALS ARE NOT CONFIDENTIAL.
POLLUTION PREVENTION PROCESS LEVEL DATA WORKSHEET (P2-115)Base Year _2003____
PPUIs
H
PU
PcInWsDtrWp(Y
Com
SN
Garden State Paint Company123 Industrial AvenueJerseyville, New Jersey 12345
27
ROCESS LEVEL INFORMATION: (Use one sheet for eaROCESS I.D. _NHP/WB______________________NITS OF PRODUCTION (e.g. type of widget, lbs. of che process targeted? (Y/N)___Y__Is this a grouped proc
AZARDOUS SUBSTANCE: MIBK Base Year Y
roduction quantity 89,928 9SE (pounds) 4,317 2 Consumed Shipped off-site as (or in) product NPO (pounds) 4,317 2
Recycled out of processDestroyed: on site treatmentDestroyed: on site energy recoveryStack air emissions 700 5Fugitive air emissionsDischarge to potws 17Discharge to groundwaterDischarge to surface watersOn site land disposalTransferred off site 3,600 2End. Inv. as NPO – Beg. Inv. as NPO
2 techniques used in given year (use theode(s) from the Appendix of the RPPRstructions)
W
as this process discontinued or sent offite in given year? (Y/N)
N
id facility make process change(s) thatiggered Plan modification? (Y/N)
N
as facility's P2 progress (targetedrocess only) less than anticipated?/N) (Attach explanation if Y.)
N
ERTIFICATION OF OWNER OR OPERATOR (Requiredf law that the information submitted on this worksheety knowledge.
ignature __________________________________ Dateame (print) ___________________________ Title _____
Garden State Paint Company123 Industrial AvenueJerseyville, New Jersey 12345
ch hazardous substance each process.)
mical, ft2 of product) ____gallons_________ess? (Y/N)___Y __
CAS No. 108-10-1ear 1 Year 2 Year 3 Year 4 Year 56,8285
5
0
42, W58
only on one P2-115) - I certify under penalty is true, accurate and complete to the best of
_____________ Phone ( )__________________________________________________

28
6.0 ANNUAL HAZARDOUS WASTE GENERATION, TREATMENT, STORAGE AND DISPOSAL
Note: “Hazardous waste” is defined by the Pollution Prevention Act to be anysolid waste defined as hazardous by the Department pursuant to the hazardouswaste statute (N.J.S.A. 13:1E-1 et seq.), and includes any hazardous wastecategory included under this Act.
The program rules (N.J.A.C. 7:1K-4.3(b)5) require that information on annualhazardous waste generation, treatment, storage and disposal for the facility and annualamounts of waste generated for each process be included in the Plan. All hazardous wasteshould be included, not only wastes containing the substances regulated under the P2Program. This Plan provides inventory data of all required waste categories at thefacility, deposition and method of treatment or disposal, and wastes generated from eachprocess.
Note: Inclusion of your RCRA hazardous Waste Biennial Report is acceptable butmust be supplemented with alternate year’s data.
Note: Completion of this section with all hazardous wastes meets the wasteminimization planning requirements under RCRA. All hazardous wastes must bereported, whether or not they contain a covered substance under pollutionprevention planning.
Table 9 provides facility inventory of the hazardous wastes generated at GardenState Paint Company in 2003. This table also provides estimates of quantities of regulatedsubstances in the wastes, which is not required.
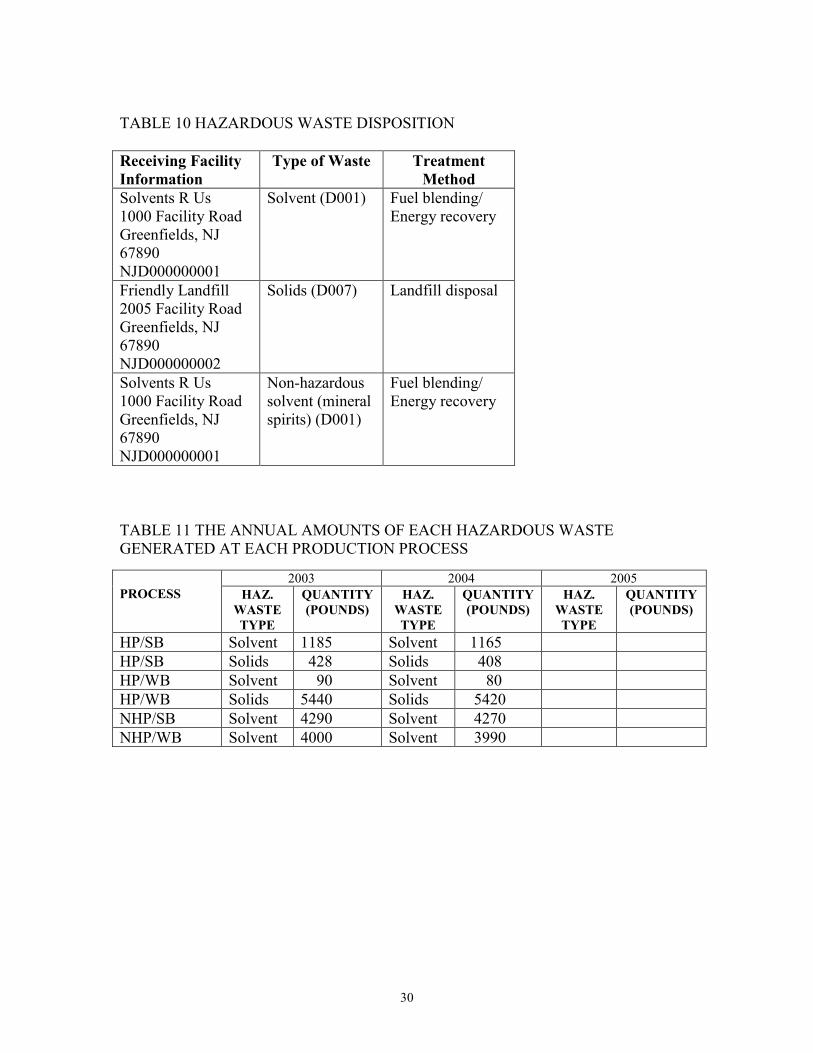
Table 10 presents the Treatment, Storage and Disposal (TSD) facility the wastewas shipped to, and the treatment method used on each waste stream.
Table 11 presents the amounts of each hazardous waste category generated ateach production process.

29
TABLE 9 ANNUAL FACILITY-LEVEL INVENTORY OF HAZARDOUS WASTE (POUNDS)
2003 2004 2005
Hazardous waste categoryWaste
solventsWastesolids
Wastesolvents
Wastesolids
Wastesolvents
Wastesolids
Amount generated 9566 5868 9455 5757Amount treated outside of aproduction process
0 0 0 0
Amount stored outside of aproduction process
9566 5868 9455 5757
Amount Disposed outsideof a production process
9566 5868 9455 5757
Recycled onsite 0 0 0 0Recycled offsite 0 0 0 0
Covered substance in waste MIBK * Cr2O3**
MIBK Cr2O3
CAS No. 108-10-1 N090 108-10-1 N090
* Hazardous substance was 90% of total weight of the associated hazardous waste** Hazardous substance was 25% of total weight of the associated hazardous waste
30
TABLE 10 HAZARDOUS WASTE DISPOSITION
Receiving FacilityInformation
Type of Waste TreatmentMethod
Solvents R Us1000 Facility RoadGreenfields, NJ67890NJD000000001
Solvent (D001) Fuel blending/Energy recovery
Friendly Landfill2005 Facility RoadGreenfields, NJ67890NJD000000002
Solids (D007) Landfill disposal
Solvents R Us1000 Facility RoadGreenfields, NJ67890NJD000000001
Non-hazardoussolvent (mineralspirits) (D001)
Fuel blending/Energy recovery
TABLE 11 THE ANNUAL AMOUNTS OF EACH HAZARDOUS WASTEGENERATED AT EACH PRODUCTION PROCESS
2003 2004 2005PROCESS HAZ.
WASTETYPE
QUANTITY(POUNDS)
HAZ.WASTETYPE
QUANTITY(POUNDS)
HAZ.WASTETYPE
QUANTITY(POUNDS)
HP/SB Solvent 1185 Solvent 1165HP/SB Solids 428 Solids 408HP/WB Solvent 90 Solvent 80HP/WB Solids 5440 Solids 5420NHP/SB Solvent 4290 Solvent 4270NHP/WB Solvent 4000 Solvent 3990
31
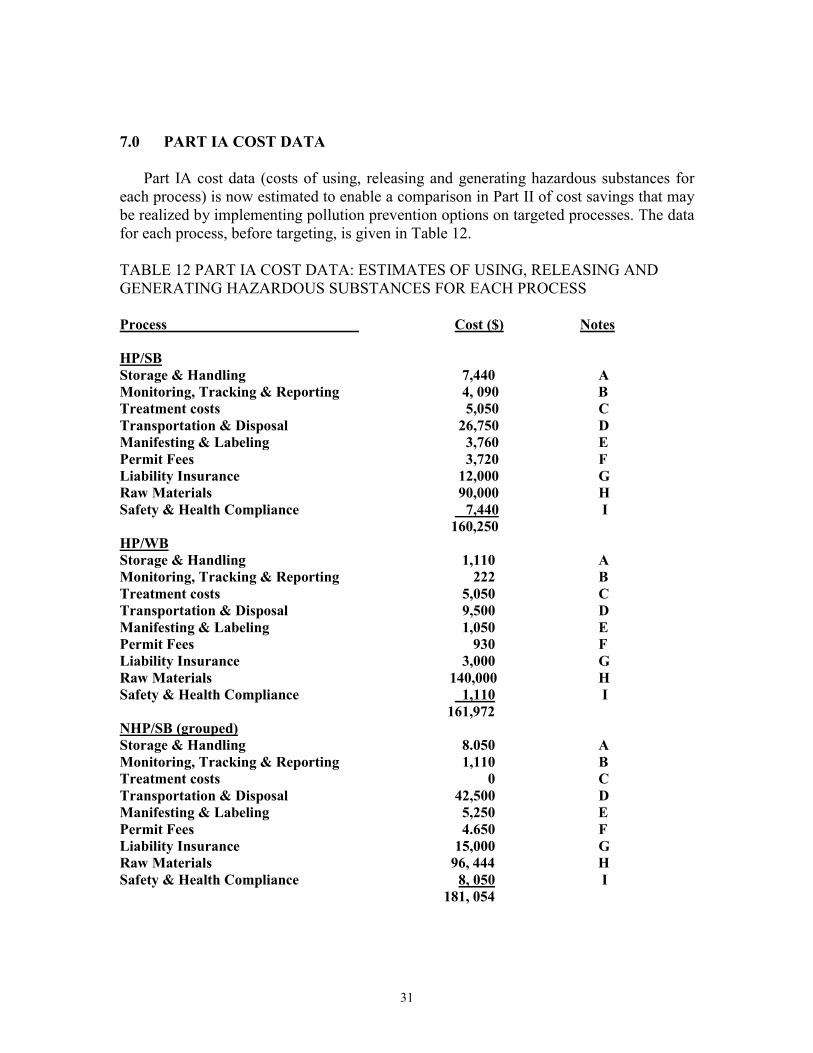
7.0 PART IA COST DATA
Part IA cost data (costs of using, releasing and generating hazardous substances foreach process) is now estimated to enable a comparison in Part II of cost savings that maybe realized by implementing pollution prevention options on targeted processes. The datafor each process, before targeting, is given in Table 12.
TABLE 12 PART IA COST DATA: ESTIMATES OF USING, RELEASING ANDGENERATING HAZARDOUS SUBSTANCES FOR EACH PROCESS
Process Cost ($) Notes
HP/SBStorage & Handling 7,440 AMonitoring, Tracking & Reporting 4, 090 BTreatment costs 5,050 CTransportation & Disposal 26,750 DManifesting & Labeling 3,760 EPermit Fees 3,720 FLiability Insurance 12,000 GRaw Materials 90,000 HSafety & Health Compliance 7,440 I
160,250HP/WBStorage & Handling 1,110 AMonitoring, Tracking & Reporting 222 BTreatment costs 5,050 CTransportation & Disposal 9,500 DManifesting & Labeling 1,050 EPermit Fees 930 FLiability Insurance 3,000 GRaw Materials 140,000 HSafety & Health Compliance 1,110 I
161,972NHP/SB (grouped)Storage & Handling 8.050 AMonitoring, Tracking & Reporting 1,110 BTreatment costs 0 CTransportation & Disposal 42,500 DManifesting & Labeling 5,250 EPermit Fees 4.650 FLiability Insurance 15,000 GRaw Materials 96, 444 HSafety & Health Compliance 8, 050 I
181, 054

32
NHP/WB (grouped)Storage & Handling 825 AMonitoring, Tracking & Reporting 222 BTreatment costs 0 CTransportation & Disposal 1,000 DManifesting & Labeling 150 EPermit Fees 930 FLiability Insurance 3,000 GRaw Materials 1.985 HSafety and Health Compliance 825 I
8,938Total of all four processesStorage & Handling 17,430 AMonitoring, Tracking & Reporting 5,644 BTreatment costs 10,100 CTransportation & Disposal 79,750 DManifesting & Labeling 10,210 EPermit Fees 10,230 FLiability Insurance 33,000 GRaw Materials 328,429 HSafety and Health Compliance 17,430 I 512,214NOTES:
A – Costs of storage/handling involve 2 operators @ 20% of their time; 1 operator @ 10%;facility supervisor @ 5%; environmental engineer @ 2.5% - Plus 24% benefits.
B – Costs of monitoring/reporting involve one facility supervisor @ 5% of his time; oneenvironmental engineer @ 2.5% - Plus 24% benefits
C – Operation of baghouse for hazardous pigments
D – Fuel blending for solvent – $26,250 each hazardous solvent process; landfill disposalfor solids – $10,100 for each hazardous pigment process
E – Approximately 10-15% of transportation and disposal cost.
F – Air permit fees, RTK fees, DPPC fees, etc.
G – Based on 3% of manufacturing expense
H – MIBK cost = $0.46 per pound ($96,000 for process NHP/SB); Cr2O3 cost = approx. 3 xMIBK cost
I - Costs of safety and heath compliance involve 2 operators @ 20% of their time; 1operator @ 10%; facility supervisor @ 5%; environmental engineer @ 2.5% - Plus 24%benefits.

33
TARGETING OF SOURCES/PROCESSES (N.J.A.C. 7:1K-4.4)
8.0 TARGETING
A "targeted production process" means any production process whichsignificantly contributes to the use or release of hazardous substances or thegeneration of nonproduct output, as determined by the owner or operator of apriority industrial facility pursuant to criteria established by the Department atN.J.A.C. 7:1K-4.4.
All four processes, HP/SB, HP/WB, NHP/SB and NHP/WB were targetedbecause pollution prevention options and improved efficiency seemed likely in allprocesses.
Total NPO for both MIBK and Cr2O3 in each process is summarized in thefollowing table:
Process NPO (pounds) NPO (%)HP/SB 1,946 14HP/WB 3,265 24NHP/SB 4,111 30NHP/WB 4,317 32Facility 13,639 100.0
Note: This table is not required since all processes are targeted, but hasnevertheless been provided to show how NPO is distributed.
Note: According to N.J.A.C. 7:1K-4.4(a)2, “the owner or operator of a priorityindustrial facility shall target for Part II pollution prevention planning all sourcesor production processes that use or generate persistent, bioaccumulative, toxic(PBT) chemicals as nonproduct output at the industrial facility, if the facility levelquantities are above the reporting thresholds contained at 40 CFR 372.” In thisPlan, there are no PBTs, so this rule does not apply. However, if for example, oneof the processes used lead oxide in the paint, it would have to be targeted, whetheror not it met the other targeting criteria, since lead compounds are PBTs.
9.0 SOURCE IDENTIFICATION
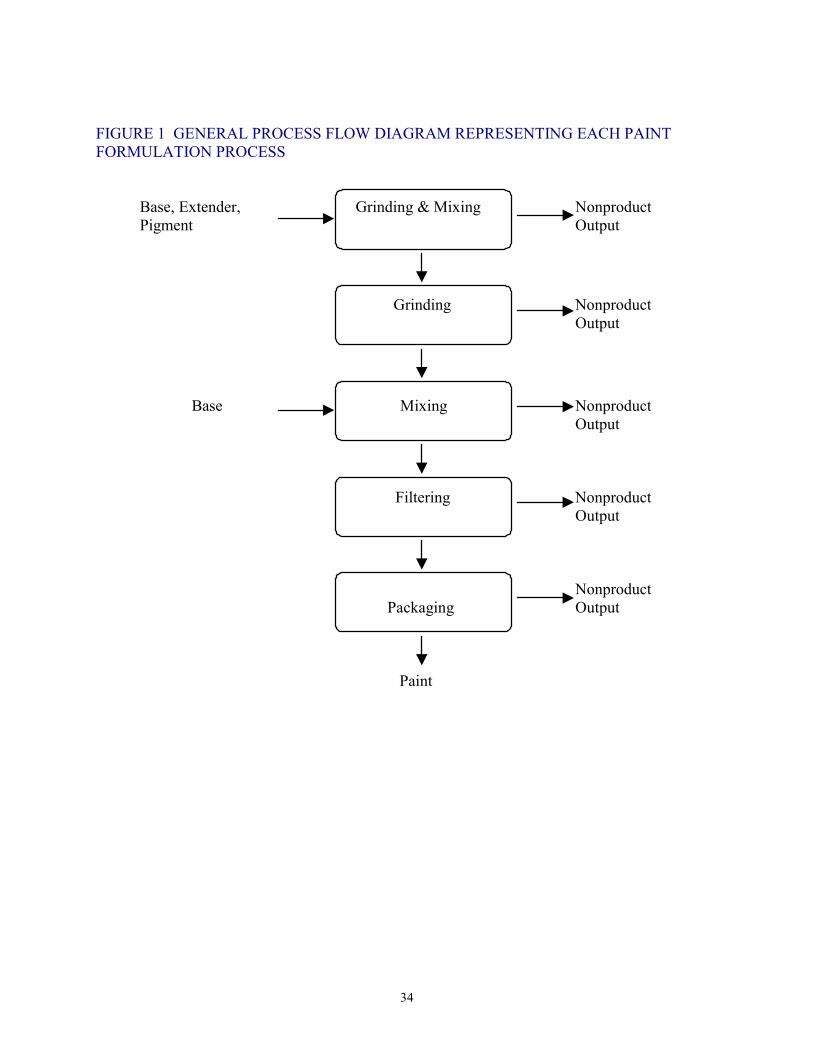
Figure 1 is a process Flow Diagram that depicts the various stages or steps of thepaint formulation process, and is generally applicable to each process at thefacility. At each step, sources of NPO have been identified as given in Table 13.
34
FIGURE 1 GENERAL PROCESS FLOW DIAGRAM REPRESENTING EACH PAINTFORMULATION PROCESS
Base, Extender, Grinding & Mixing Nonproduct Pigment Output
Grinding NonproductOutput
Base Mixing NonproductOutput
Filtering NonproductOutput
Nonproduct Packaging Output
Paint

35
TABLE 13 SOURCES OF NPO AT EACH STEP OF THE PAINT FORMULATIONPROCESS
Process Step Source IdentificationGrinding and Mixing RM1 Discarded raw materials containers
DE1 Dust emissionsVO1 Volatile organic emissionsLO1 Leftover productEC1 Equipment cleaning
Grinding DE2 Dust emissionsVO2 Volatile organic emissionsLO2 Leftover productEC2 Equipment cleaning
Mixing VO3 Volatile organic emissionsLO3 Leftover productEC3 Equipment cleaning
Filtering FC1 Filter cartridgeVO4 Volatile organic emissionsLO4 Leftover productEC4 Equipment cleaning
Packaging VO5 Volatile organic emissionsLO5 Leftover productEC5 Equipment cleaning
36
PART II OF THE PLANN.J.A.C.7:1K-4.5
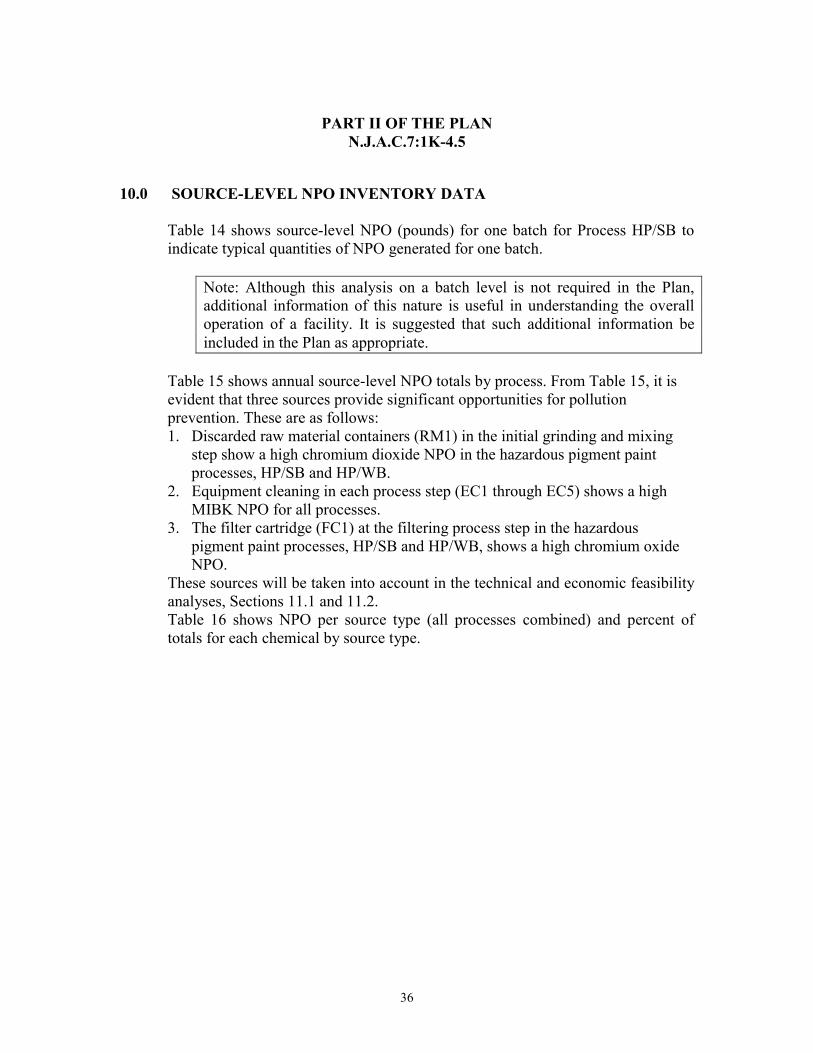
10.0 SOURCE-LEVEL NPO INVENTORY DATA
Table 14 shows source-level NPO (pounds) for one batch for Process HP/SB toindicate typical quantities of NPO generated for one batch.
Note: Although this analysis on a batch level is not required in the Plan,additional information of this nature is useful in understanding the overalloperation of a facility. It is suggested that such additional information beincluded in the Plan as appropriate.
Table 15 shows annual source-level NPO totals by process. From Table 15, it isevident that three sources provide significant opportunities for pollutionprevention. These are as follows:1. Discarded raw material containers (RM1) in the initial grinding and mixing
step show a high chromium dioxide NPO in the hazardous pigment paintprocesses, HP/SB and HP/WB.
2. Equipment cleaning in each process step (EC1 through EC5) shows a highMIBK NPO for all processes.
3. The filter cartridge (FC1) at the filtering process step in the hazardouspigment paint processes, HP/SB and HP/WB, shows a high chromium oxideNPO.
These sources will be taken into account in the technical and economic feasibilityanalyses, Sections 11.1 and 11.2.Table 16 shows NPO per source type (all processes combined) and percent oftotals for each chemical by source type.

37
TABLE 14 SOURCE LEVEL NPO (POUNDS/GALLON) FOR PROCESS HP/SB(ONE BATCH)
Process Step Source MIBK Cr2O3RM1 0.00 4.89DE1 0.00 1.47VO1 2.06 0.00LO1 7.20 5.37
Grinding and Mixing
EC1 10.29 0.00DE2 0.00 1.47VO2 1.03 0.00LO2 3.09 2.44
Grinding
EC2 5.14 0.00VO3 2.06 0.00LO3 7.20 4.40
Mixing
EC3 8.23 0.00FC1 29.83 21.50VO4 1.03 0.00LO4 7.20 4.89
Filtering
EC4 9.26 0.00VO5 2.06 0.00LO5 4.11 2.44
Packaging
EC5 3.09 0.00Total 102.86 48.86
Production: 750 Gallons
MIBK NPO/Unit of Product:= 102.86 lbs/750 gal= 0.14 lbs/gallon
Cr2O3 NPO/Unit of Product:= 48.86 lbs/750 gal
= 0.07 lbs./gallon

38
TABLE 15 ANNUAL SOURCE-LEVEL NPO (POUNDS) TOTALS BY PROCESS
SOURCE HP/SBMIBK
Cr2O3 HP/WBMIBK
Cr2O3 NHP/SBMIBK
NHP/WBMIBK
RM1 0.00 62.65 0.00 187.96 0.00 0.00DE1 0.00 18.80 0.00 56.39 0.00 0.00VO1 26.38 0.00 0.00 0.00 82.22 0.00LO1 92.33 68.92 0.00 206.75 287.77 0.00EC1 131.90 0.00 395.76 0.00 411.10 1233.55
DE2 0.00 18.80 0.00 56.39 0.00 0.00VO2 13.19 0.00 0.00 0.00 41.11 0.00LO2 9.57 31.33 0.00 93.98 123.33 0.00EC2 65.95 0.00 197.88 0.00 205.55 616.75
VO3 26.38 0.00 0.00 0.00 82.22 0.00LO3 92.33 56.39 0.00 169.16 287.77 0.00EC3 105.52 0.00 316.61 0.00 328.88 986.80
FC1 382.51 275.67 0.00 827.01 1192.19 0.00VO4 13.19 0.00 0.00 0.00 41.11 0.00LO4 92.33 62.65 0.00 187.96 287.77 0.00EC4 118.71 0.00 356.19 0.00 69.99 1110.00
VO5 26.38 0.00 0.00 0.00 82.22 0.00LO5 52.76 31.33 3.00 93.98 164.44 0.00EC5 39.57 0.00 118.73 0.00 123.33 370.05
TOTALS 1319.00 626.53 1385.17 1879.58 4111.00 4317.24

39
TABLE 16 NPO PER SOURCE TYPE (ALL PROCESSES COMBINED) ANDPERCENT OF TOTALS FOR EACH CHEMICAL BY SOURCE TYPE
NPO (pounds) MIBK Cr2O3 %MIBK %Cr2O3EC’s 7,603 0 68 0
RM’s 0 251 0 10VO’s 434 0 4 0DE’s 0 150 0 6FC’s 1,575 1,103 14 44LO’s 1,520 1,002 14 40
TOTALS 11,132 2,507 100 100

40
11.0 POLLUTION PREVENTION OPTIONS
11.1 Technical Analysis of Pollution Prevention Options
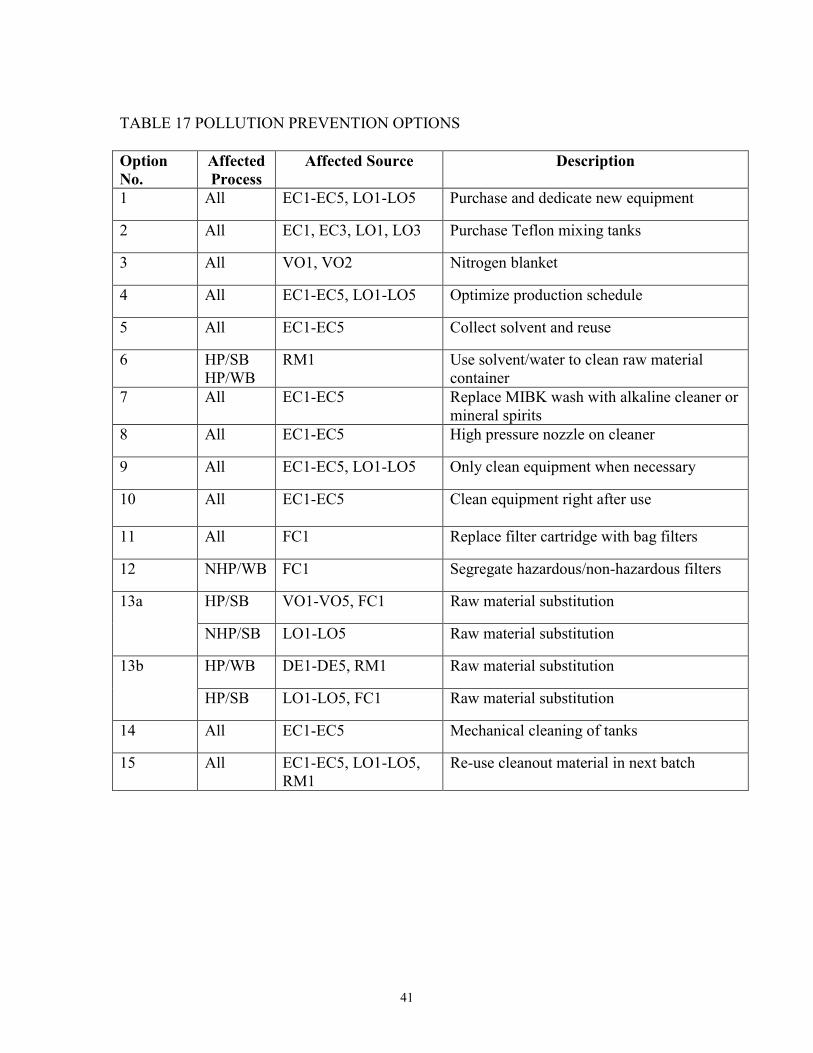
Pollution prevention options were reviewed and a list was developed as given inTable 17. Although all options have been demonstrated as feasible by other companies,some were not technically feasible at this facility or too involved to implement.
Options 1 and 3, using dedicated equipment and using a nitrogen blanket, wouldnot be possible under present plant layout, space restrictions and production scheduling.
Option 2, using Teflon mixing tanks, is technically feasible.Option 4, optimizing production schedule, is technically feasible.Options 5 and 15, involving re-use, is technically feasible, but not pollution
prevention, since it is out of process recycling.Options 6 and 7 were both technically and economically feasible.Option 8, using high-pressure nozzles, is technically feasible, but would be
uneconomical.Option 9, only cleaning when necessary, may lead to poor product quality, so at
this point is not technically feasible, but will be reconsidered in the future.Option 10, cleaning right after use, conflicted with timely scheduling needs, and
therefore is not technically feasible.Option 11, replacing filter cartridges with bag filters, is technically feasible and
should lead to less waste.Option 12, segregating hazardous and non-hazardous filters, is feasible but not
pollution prevention. The facility will still segregate waste streams.Options 13a and b: all raw material substitutions reviewed under Options 13a and
b would result in poor product quality, and therefore are not technically feasible.Option 14 is technically feasible but deemed uneconomical at this time.
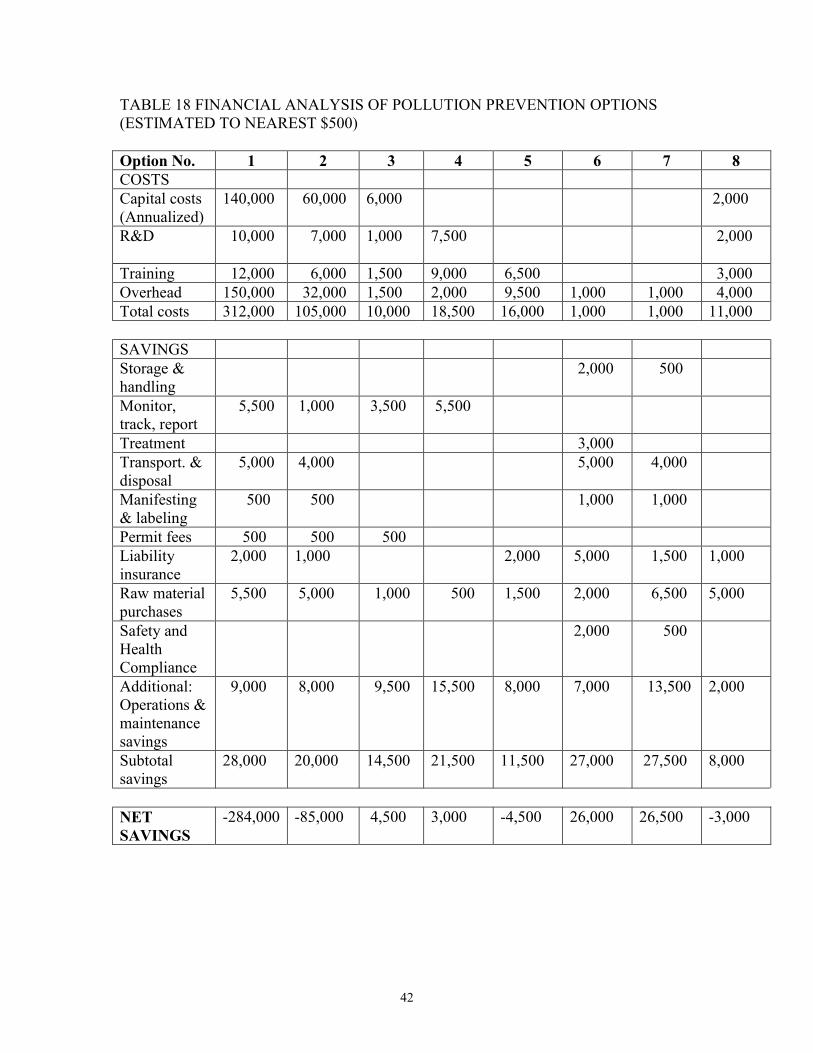
11.2 Financial Analysis of Pollution Prevention Options
A financial analysis was performed as summarized in Table 18, and total costs(upper table) and savings (lower table) were projected for each option for all applicableprocesses. Several options showed higher costs than savings and were not financiallyfeasible. All other options showed some savings, although savings below $5,000 were notconsidered at this time based on a corporate priority decision. This decision will be re-considered in subsequent years of this planning cycle. Notes on financial analysis followTable 18.
41
TABLE 17 POLLUTION PREVENTION OPTIONS
OptionNo.
AffectedProcess
Affected Source Description
1 All EC1-EC5, LO1-LO5 Purchase and dedicate new equipment
2 All EC1, EC3, LO1, LO3 Purchase Teflon mixing tanks
3 All VO1, VO2 Nitrogen blanket
4 All EC1-EC5, LO1-LO5 Optimize production schedule
5 All EC1-EC5 Collect solvent and reuse
6 HP/SBHP/WB
RM1 Use solvent/water to clean raw materialcontainer
7 All EC1-EC5 Replace MIBK wash with alkaline cleaner ormineral spirits
8 All EC1-EC5 High pressure nozzle on cleaner
9 All EC1-EC5, LO1-LO5 Only clean equipment when necessary
10 All EC1-EC5 Clean equipment right after use
11 All FC1 Replace filter cartridge with bag filters
12 NHP/WB FC1 Segregate hazardous/non-hazardous filters
HP/SB VO1-VO5, FC1 Raw material substitution13a
NHP/SB LO1-LO5 Raw material substitution
HP/WB DE1-DE5, RM1 Raw material substitution13b
HP/SB LO1-LO5, FC1 Raw material substitution
14 All EC1-EC5 Mechanical cleaning of tanks
15 All EC1-EC5, LO1-LO5,RM1
Re-use cleanout material in next batch
42
TABLE 18 FINANCIAL ANALYSIS OF POLLUTION PREVENTION OPTIONS(ESTIMATED TO NEAREST $500)
Option No. 1 2 3 4 5 6 7 8COSTSCapital costs(Annualized)
140,000 60,000 6,000 2,000
R&D 10,000 7,000 1,000 7,500 2,000
Training 12,000 6,000 1,500 9,000 6,500 3,000Overhead 150,000 32,000 1,500 2,000 9,500 1,000 1,000 4,000Total costs 312,000 105,000 10,000 18,500 16,000 1,000 1,000 11,000
SAVINGSStorage &handling
2,000 500
Monitor,track, report
5,500 1,000 3,500 5,500
Treatment 3,000Transport. &disposal
5,000 4,000 5,000 4,000
Manifesting& labeling
500 500 1,000 1,000
Permit fees 500 500 500Liabilityinsurance
2,000 1,000 2,000 5,000 1,500 1,000
Raw materialpurchases
5,500 5,000 1,000 500 1,500 2,000 6,500 5,000
Safety andHealthCompliance
2,000 500
Additional:Operations &maintenancesavings
9,000 8,000 9,500 15,500 8,000 7,000 13,500 2,000
Subtotalsavings
28,000 20,000 14,500 21,500 11,500 27,000 27,500 8,000
NETSAVINGS
-284,000 -85,000 4,500 3,000 -4,500 26,000 26,500 -3,000

43
TABLE 18 (CONTINUED) FINANCIAL ANALYSIS OF POLLUTIONPREVENTION OPTIONS
Option No. 9 10 11 12 13a 13b 14 15COSTSCapital costs(Annualized)
10, 500 9,000
R&D 5,000 5,000 5,000Training 1,000 3,500 1,000 5,000Overhead 1,000 2,000 3,500 1,500 500 500 6,000 1,000Total costs 2,000 2,000 17,500 2,500 5,500 5,500 25,000 1,000
SAVINGSStorage &handling
500 1,250
Monitor,track, report
1,000 3,000
Treatment 3,000Transport. &disposal
32,000 1,000 5,000 1,000
Manifesting& labeling
25,000 500 1,000
Permit fees 1,000 1,000Liabilityinsurance
5,000 5,000
Raw materialpurchases
1,000 1,500 1,000 3,000 4,500 5,000 2,500
Safety &HealthCompliance
500 1,250
Additional:Operations &maintenancesavings
3,000 3,000 5,500 4,000
Subtotalsavings
5,000 3,000 76,000 3,500 3,000 4,500 23,500 3,500
NETSAVINGS
3,000 1,000 58,500 1,000 2,500 -1,000 -1,500 2,500

44
Notes on Table 18:1. Capital Costs for Options 1,2,3,8,11, and 14 are annualized with a five–year payback.2. R&D is required for options 1,2,3,4,8,13 and 14 since these options involve newequipment or new raw materials that require test runs.3. Options 1,2,3, 8 and 14 also require operator training costs on new equipment.4. Overhead includes salaries and benefits, building maintenance, etc., associated with theoption.5. Since less hazardous substances are used, storage and handling, and safety and healthcompliance savings are realized by options 6, 7, 12 and 14.6. Monitoring, tracking and reporting cost savings were highest with dedicated equipmentand with optimizing production schedules.7. Transportation, disposal, manifesting, labeling and permitting savings are realized bythose options that result in handling less hazardous substances. Some of the options alsomerited reductions in liability insurance,8. Raw materials savings is the savings of using lower quantities of hazardous materials,and of using less expensive cleaning materials, notably water.9. Operations and maintenance savings are additional savings considered. These savingsare the annual operation and maintenance savings realized by the option minus operationsor maintenance costs during initial installation or implementation.10. No entries were made for costs or savings below $250.

45
11.3 Selection of Pollution Prevention Options
It was decided that only three of analyzed options would be implemented at thistime, since they are the only technically feasible and cost effective options.
Option 6: Use solvent/water to clean hazardous pigment raw material containers(processes HP/SB and HP/WB). By not using as much MIBK, $26,000 was saved inthese processes.
Option 7: Replace MIBK wash with alkaline cleaner or mineral spirits in equipmentcleaning step for each process. Substitution of alkaline cleaner or mineral spirits resultedin an average cost savings of $26,500.
Option 11: Replace filter cartridge with bag filters at filtering step of each process. Bagfilters reduce solids leakage, capture more solids, and reduce need for equipment cleaningwith MIBK. Cost savings in chromium oxide and MIBK use and disposal were $58,500.
Total cost savings for all three options are estimated at $ 111, 000 or 21.7% of thetotal cost of handling hazardous substances ($512,214) from Part I Cost Analysis.

46
12.0 POLLUTION PREVENTION GOALS
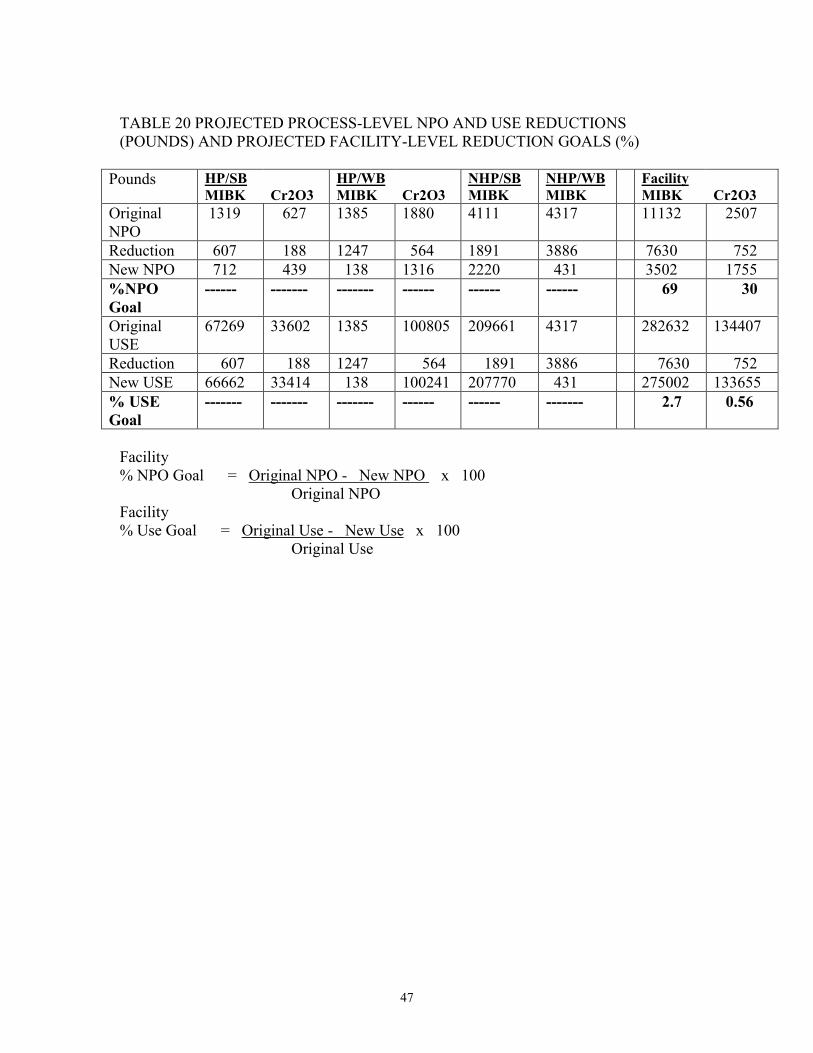
The rules require that the Plan provide the following:1. Facility-level NPO and use reduction goals.2. Targeted process-level NPO per unit product and use per unit product.Source-level data on expected reductions in targeted processes due to selected
options are first calculated and given in Table 19. (See also Table 15.)The sum of the targeted process-level expected reductions would then yield
projected facility-level reductions for each hazardous substance as shown in Table 20.Percent goals are then calculated for the total facility.
The data in Table 21 is then used to perform a per-unit-of-product analysis, whichthen is used to calculate per-unit-of-product goals in percentages for each process asrequired and shown in Table 21.
TABLE 19 EXPECTED REDUCTIONS AT SOURCE-LEVEL FROM SELECTEDOPTIONS (IN POUNDS)
Source HP/SBMIBK
HP/SBCr2O3
HP/WBMIBK
HP/WBCr2O3
NHP/WBMIBK
NHP/WBMIBK
TotalMIBK
TotalCr2O3
OPTION 6: Reduce Cr2O3 @ RM1 by 80%RM1 0 62.65 0 187.96 0 0 0 250.61RM1 x80%
0 50.12 0 150.37 0 0 0 200.49
OPTION 7: Reduce MIBK @ EC1-EC5 by 90%EC1 131.90 0 395.76 0 411.10 1233.50 2172.26 0EC2 65.95 0 197.88 0 205.55 616.75 1086.13 0EC3 105.52 0 316.61 0 328.88 986.80 1737.81 0EC4 118.71 0 356.19 0 369.99 1110.15 1955.04 0EC5 39.57 0 118.73 0 123.33 370.05 651.68 0EC Total 461.65 0 1385.17 0 1438.85 4317.25 7602.92 0EC x90%
415.49 0 1246.65 0 1294.97 3885.53 6842.63 0
OPTION 11: Reduce Cr2O3 and MIBK @ FC1 by 50%FC1 382.51 275.67 0 827.01 1192.19 0 1574.70 1102.68FC1 x50%
191.26 137.84 0 413.51 596.10 0 787.36 551.35
TotalReductn
606.75 187.96 1246.65 563.87 1891.07 3885.53 1629.98 751.83
47
TABLE 20 PROJECTED PROCESS-LEVEL NPO AND USE REDUCTIONS(POUNDS) AND PROJECTED FACILITY-LEVEL REDUCTION GOALS (%)
Pounds HP/SBMIBK Cr2O3
HP/WBMIBK Cr2O3
NHP/SBMIBK
NHP/WBMIBK
FacilityMIBK Cr2O3
OriginalNPO
1319 627 1385 1880 4111 4317 11132 2507
Reduction 607 188 1247 564 1891 3886 7630 752New NPO 712 439 138 1316 2220 431 3502 1755%NPOGoal
------ ------- ------- ------ ------ ------ 69 30
OriginalUSE
67269 33602 1385 100805 209661 4317 282632 134407
Reduction 607 188 1247 564 1891 3886 7630 752New USE 66662 33414 138 100241 207770 431 275002 133655% USEGoal
------- ------- ------- ------ ------ ------- 2.7 0.56
Facility% NPO Goal = Original NPO - New NPO x 100
Original NPOFacility% Use Goal = Original Use - New Use x 100
Original Use

48
TABLE 21 ANALYSIS OF NPO AND USE PER UNIT OF PRODUCT FOR EACHCHEMICAL AT EACH TARGETED PROCESS, CALCULATED FROM P2-115DATA (SECTION 5.0, PAGES 22 TO 27)
Pounds/Gallon
HP/SBMIBK Cr2O3
HP/WBMIBK Cr2O3
NHP/SB MIBK
NHP/WB MIBK
Orig.NPO/ UnitOfProduct.
0.1371 0.0652 0.0480 0.0652 0.1371 0.0480
Reduction 0.0631 0.0195 0.0432 0.0195 0.0631 0.0432New NPO/Unit ofProduct
0.0740 0.0456 0.0048 0.0456 0.0740 0.0048
%NPOGoal
46 30 90 30 46 90
Orig.USE/Unitof Product
6.9941 3.4937 0.0480 3.4937 6.9941 0.0480
Reduction 0.0631 0.0195 0.0432 0.0195 0.0631 0.0432NewUSE/Unitof Product
6.9310 3.4741 0.0048 3.4741 6.9310 0.0048
% USEGoal
<1 <1 90 <1 <1 90
EXAMPLE: (For MIBK in Process HP/SB) Orig. NPO/Unit of Product = 1319 pounds/ 9618 gallons = 0.1371 pounds/ gallon
49
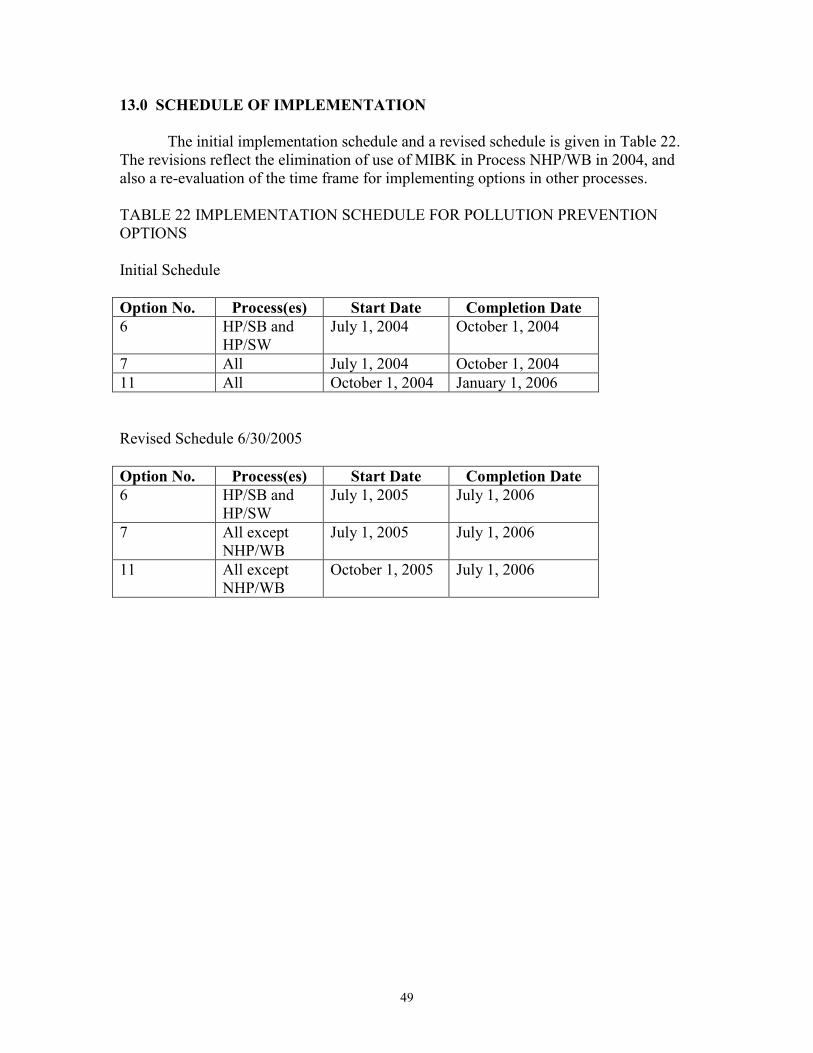
13.0 SCHEDULE OF IMPLEMENTATION
The initial implementation schedule and a revised schedule is given in Table 22.The revisions reflect the elimination of use of MIBK in Process NHP/WB in 2004, andalso a re-evaluation of the time frame for implementing options in other processes.
TABLE 22 IMPLEMENTATION SCHEDULE FOR POLLUTION PREVENTIONOPTIONS
Initial Schedule
Option No. Process(es) Start Date Completion Date6 HP/SB and
HP/SWJuly 1, 2004 October 1, 2004
7 All July 1, 2004 October 1, 200411 All October 1, 2004 January 1, 2006
Revised Schedule 6/30/2005
Option No. Process(es) Start Date Completion Date6 HP/SB and
HP/SWJuly 1, 2005 July 1, 2006
7 All exceptNHP/WB
July 1, 2005 July 1, 2006
11 All exceptNHP/WB
October 1, 2005 July 1, 2006

50
14.0 EXPECTED IMPACT OF IMPLEMENTED OPTIONS ON POST-TREATMENT MULTI-MEDIA RELEASES
Implementation of Options 6, 7 and 11 combined should result in significantfacility reductions in post treatment releases from base year 2003 to 2003 for both MIBKand Cr2O3. The summary of expected reductions in air and water media and in waste (inpounds) is shown in Table 23 as follows:
TABLE 23 EXPECTED MULTI-MEDIA RELEASES (POUNDS)
MIBK Cr2O32003 Air 2,305 1,000
Waste 8,610 1,467Water 217 40
2008 Air 807 720Waste 2,586 916Water 76 28
% Reduction Air 65 28Waste 69 38Water 65 30
Base year air, water and waste data are the sum of stack emissions, POTWdischarges and off-site transfers for each process as given in the P2-115’s. MIBK airreleases are mainly evaporative. MIBK and Cr2O3 waste (to disposal) and water releases(to the POTW) are mainly from spills and cleaning. The expected percent releasereductions for air, water and waste are approximately equal to percent NPO reductionsfor the facility. Each is expected to be reduced proportionally.

51
INFORMATION REQUIRED IN THE POLLUTION PREVENTION PROGRESSREPORT
PART IB OF THE PLAN (N.J.A.C.7:1K-4.3 (c))
Note: Sections 15.0 and 16.0 must be included in the Plan only if the facility doesnot submit P2-115’s to the Department as the Progress Report instead of SectionsC and D of the Release and Pollution Prevention Report. It is presented in thisSample Plan since the submittal of P2-115’s is optional.
15.0 FACILITY-LEVEL INFORMATION ON REDUCTIONS
Table 24 shows facility-level information on reductions in Use and NPO of MIBKfrom base year 2003 to 2004. Data for 2005, 2006, 2007 and 2008 are to be completed insubsequent years. The rows designated “ + / - “ indicate change in given units ascompared to base year.
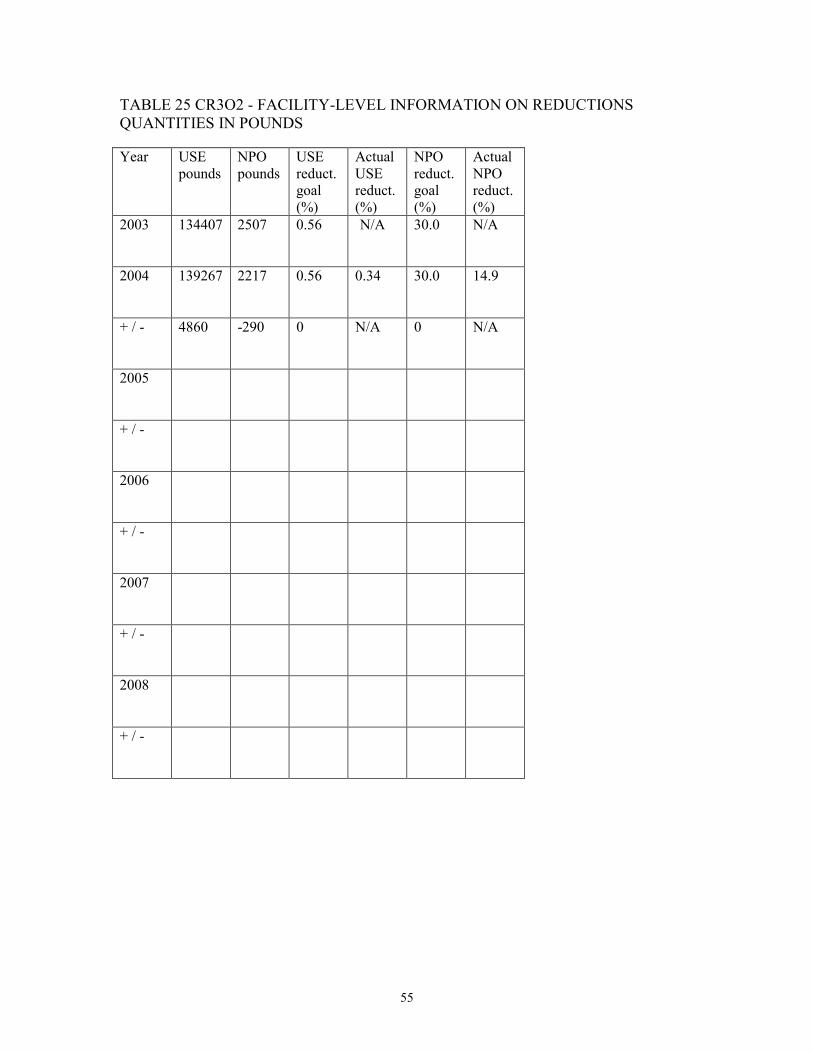
Table 25 shows facility-level information on reductions in Use and NPO ofCr3O2 from base year 2003 to 2004. Data for 2005, 2006, 2007 and 2008 are to becompleted in subsequent years.
In both Tables 24 and 25, the first two columns are the actual Use and NPOamounts independent of production. The Actual Use and NPO reductions (%) take intoaccount the Production Index as calculated in the RPPR instructions. Calculations aregiven on the following two pages.
Note: Refer to latest RPPR instructions, SECTION C: FACILITY-LEVEL SUBSTANCE-SPECIFIC POLLUTION PREVENTIONPROGRESS, for the calculation methods.

52
CALCULATIONS FOR MIBK
Production Ratio:
[(10,005/9816 x 67,269) + (29,993/28,853 x 1,385) + (32,276/29,976 x 209,661) +(96,828/89,928 x 4317)] / (67,269 + 1,385 + 209,661 + 4,317) = 1.068
% Change for MIBK USE:
[(67,269 + 1,385 + 209,661 + 4,317) x 1.068 – (69,709 + 762 + 224,641 + 25)] x 100 (67,269 + 1,385 + 209,661 + 4,317) x 1.068=2.21%
% Change for MIBK NPO:
[(1,319 + 1,385 + 4,111 + 4,317) x 1.068 – (950 + 762 + 3,098 + 25)] x 100 = 59.3%(1,319 + 1,385 + 4,111 + 4,317) x 1.068
(Calculated using the P2-115s.)

53
CALCULATIONS FOR Cr2O3
Production Ratio:
[(10,005/9,618 x 33,602) + (29,993/28,853 x 100,805)] / (33,602 + 100,805) = 1.040
% Change for Cr2O3 USE:
[(33,602 + 100,805) x 1.040 – (34,892 + 104,375)] x 100 = 0.34%(33,602 + 100,805) x 1.040
% Change for Cr2O3 NPO:
[(627 + 1,880) x 1.040 – (567 + 1650)] x 100 = 14.9%(627 + 1,880) x 1.040
(Calculated using the P2-115s.)

54
TABLE 24 MIBK - FACILITY-LEVEL INFORMATION ON REDUCTIONS QUANTITIES IN POUNDS
Year USEpounds
NPOpounds
USEreduct.goal(%)
ActualUSEreduct.(%)
NPOreduct.goal(%)
ActualNPOreduct.(%)
2003 282632 11132 2.7 N/A 69.0 N/A
2004 295137 4835 2.7 2.21 69.0 59.3
+ / - 12505 -6297 0 N/A 0 N/A
2005
+ / -
2006
+ / -
2007
+ / -
2008
+ / -
55
TABLE 25 CR3O2 - FACILITY-LEVEL INFORMATION ON REDUCTIONSQUANTITIES IN POUNDS
Year USEpounds
NPOpounds
USEreduct.goal(%)
ActualUSEreduct.(%)
NPOreduct.goal(%)
ActualNPOreduct.(%)
2003 134407 2507 0.56 -N/A----------------
30.0 N/A
2004 139267 2217 0.56 0.34 30.0 14.9
+ / - 4860 -290 0 N/A 0 N/A
2005
+ / -
2006
+ / -
2007
+ / -
2008
+ / -

56
16.0 PROCESS-LEVEL INFORMATION ON TARGETED PROCESSREDUCTIONS
Note: This Section 16.0 must be completed only if the facility does not submit P2-115’s to the Department as the Progress Report.
Tables 26a through 29 show process-level information on reductions in Use and NPOof MIBK and Cr2O3 in targeted processes from base year 2003 to 2004.
Table 26a shows process-level information on reductions for targeted process HP/SBin Use and NPO of MIBK.
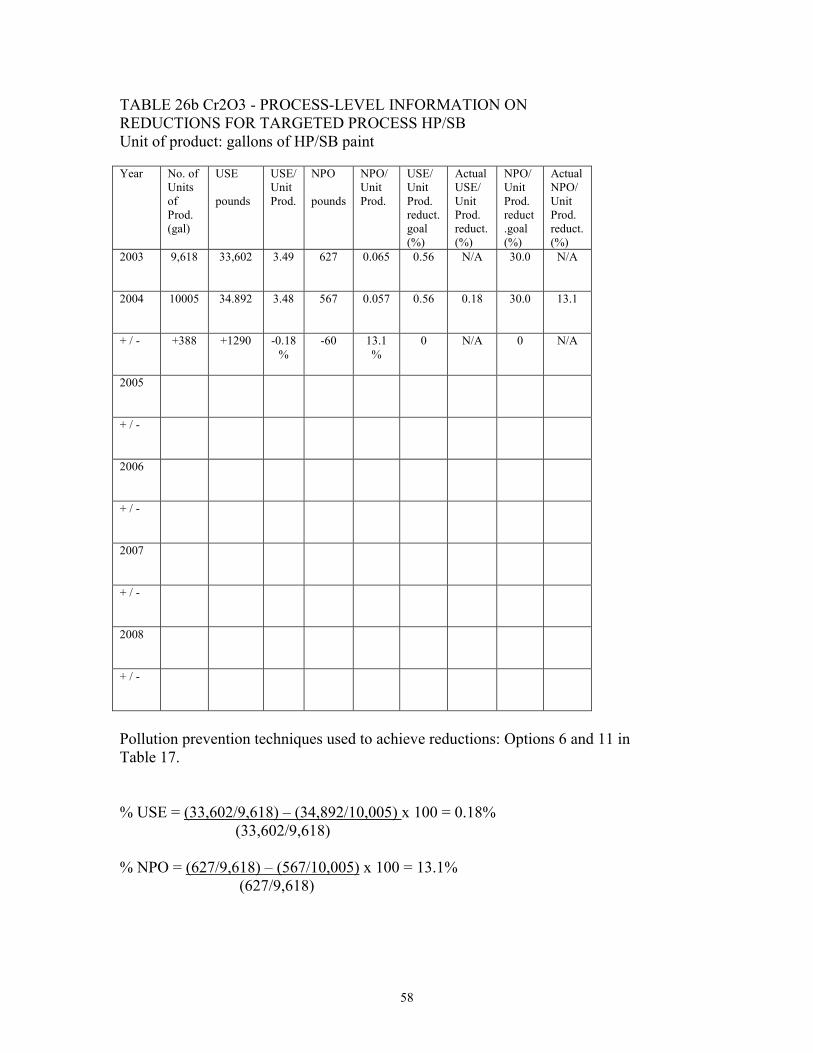
Table 26b shows process-level information on reductions for targeted process HP/SBin Use and NPO of Cr2O3.
Table 27a shows process-level information on reductions for targeted process HP/WBin Use and NPO of MIBK.
Table 27b shows process-level information on reductions for targeted process HP/WBin Use and NPO of Cr2O3.
Table 28 shows process-level information on reductions for grouped targetedprocesses NHP1/SB and NHP2/SB (called NHP/SB as a group) in Use and NPO ofMIBK.
Table 29 shows process-level information on reductions for grouped targetedprocesses NHP1/WB and NHP2/WB (called NHP/WB as a group) in Use and NPO ofMIBK.
For each of the tables, data for 2005, 2006, 2007 and 2008 are to be completed insubsequent years.
Note: Refer to latest RPPR instructions, SECTION D: PROCESS-LEVEL POLUTION PREVENTION INFORMATION FORTARGETED PROCESSES, for the calculation methods.

57
TABLE 26a MIBK - PROCESS-LEVEL INFORMATION ONREDUCTIONS FOR TARGETED PROCESS HP/SBUnit of product: gallons of HP/SB paint
Year No. ofUnitsofProd.(gal)
USE
pounds
USE/UnitProd.
NPO
pounds
NPO/UnitProd.
USE/UnitProd.reduct.goal(%)
ActualUSE/UnitProd.reduct.(%)
NPO/UnitProd.reduct.goal(%)
ActualNPO/UnitProd.reduct.(%)
2003 9618 67269 6.99 1319 0.137 0.9 N/A 46.0 N/A
2004 10005 69709 6.97 950 0.095 0.9 0.38 46.0 30.8
+ / - +388 +2440 -0.38%
-369 -30.8%
0 N/A 0 N/A
2005
+ / -
2006
+ / -
2007
+ / -
2008
+ / -
Pollution prevention techniques used to achieve reductions: Options 7 and 11 inTable 17.
% USE = (67,269/9,618) – (69,709/10,005) x 100 = 0.38% (67,269/9,618)
% NPO = (1,319/9,618) – (950/10,005) x 100 = 30.8% (1,319/9,618)
58
TABLE 26b Cr2O3 - PROCESS-LEVEL INFORMATION ONREDUCTIONS FOR TARGETED PROCESS HP/SBUnit of product: gallons of HP/SB paint
Year No. ofUnitsofProd.(gal)
USE
pounds
USE/UnitProd.
NPO
pounds
NPO/UnitProd.
USE/UnitProd.reduct.goal(%)
ActualUSE/UnitProd.reduct.(%)
NPO/UnitProd.reduct.goal(%)
ActualNPO/UnitProd.reduct.(%)
2003 9,618 33,602 3.49 627 0.065 0.56 N/A 30.0 N/A
2004 10005 34.892 3.48 567 0.057 0.56 0.18 30.0 13.1
+ / - +388 +1290 -0.18%
-60 13.1%
0 N/A 0 N/A
2005
+ / -
2006
+ / -
2007
+ / -
2008
+ / -
Pollution prevention techniques used to achieve reductions: Options 6 and 11 inTable 17.
% USE = (33,602/9,618) – (34,892/10,005) x 100 = 0.18% (33,602/9,618)
% NPO = (627/9,618) – (567/10,005) x 100 = 13.1% (627/9,618)

59
TABLE 27a MIBK - PROCESS-LEVEL INFORMATION ONREDUCTIONS FOR TARGETED PROCESS HP/WBUnit of product: gallons of HP/WB paint
Year No. ofUnitsofProd.(gal)
USE
pounds
USE/UnitProd.
NPO
pounds
NPO/UnitProd.
USE/UnitProd.reduct.goal(%)
ActualUSE/UnitProd.reduct.(%)
NPO/UnitProd.reduct.goal(%)
ActualNPO/UnitProd.reduct.(%)
2003 28,853 1,385 0.0480 1,385 0.0480 90.0 N/A 90.0 N/A
2004 29,993 762 0.0254 762 0.0254 90.0 47.1 90.0 47.1
+ / - +1140 -623 -47.1%
-623 -47.1%
0 N/A 0 N/A
2005
+ / -
2006
+ / -
2007
+ / -
2008
+ / -
Pollution prevention techniques used to achieve reductions: Options 7 and 11 inTable 17.
% USE = (1,385/28,853) – (762/29,993) x 100 = 47.1% (1,385/28,853)
% NPO = (1,385/28,853) – (762/29,993) x 100 = 47.1% (1,385/28,853)

60
TABLE 27b Cr2O3 - PROCESS-LEVEL INFORMATION ONREDUCTIONS FOR TARGETED PROCESS HP/WBUnit of product: gallons of HP/WB paint
Year No. ofUnitsofProd.(gal)
USE
pounds
USE/UnitProd.
NPO
pounds
NPO/UnitProd.
USE/UnitProd.reduct.goal(%)
ActualUSE/UnitProd.reduct.(%)
NPO/UnitProd.reduct.goal(%)
ActualNPO/UnitProd.reduct.(%)
2003 28853 100805 3.49 1880 0.065 0.56 N/A 30.0 N/A
2004 29993 104375 3.48 1650 0.055 0.56 0.39 30.0 15.6
+ / - +1140 +3570 -0.39%
-230 -15.6%
0 N/A 0 N/A
2005
+ / -
2006
+ / -
2007
+ / -
2008
+ / -
Pollution prevention techniques used to achieve reductions: Options 6 and 11 inTable 17.
% USE = (100,805/28,853) – (104,375/29,993) x 100 = 0.39% (100,805/28,853)
% NPO = (1,880/28,853) – (1,650/29,993) x 100 = 15.6% (1,880/28,853)

61
TABLE 28 MIBK - PROCESS-LEVEL INFORMATION ON REDUCTIONS FOR TARGETED PROCESS NHP/SB (two processes grouped)Unit of product: gallons of NHP/WB paint
Year No. ofUnitsofProd.(gal)
USE
pounds
USE/UnitProd.
NPO
pounds
NPO/UnitProd.
USE/UnitProd.reduct.goal(%)
ActualUSE/UnitProd.reduct.(%)
NPO/UnitProd.reduct.goal(%)
ActualNPO/UnitProd.reduct.(%)
2003 29976 209661 6.99 4111 0.137 0.9 N/A 46.0 N/A
2004 32276 224641 6.96 3098 0.096 0.9 0.49 46.0 30.0
+ / - +2300 +29960 -0.49%
-1013 -30.0%
0 N/A 0 N/A
2005
+ / -
2006
+ / -
2007
+ / -
2008
+ / -
Pollution prevention techniques used to achieve reductions: Option 7 and 11 in Table 17.
% USE = (209,661/29,976) – (224,641/32,276) x 100 = 0.49% (209,661/29,976)
% NPO = (4,111/29,976) – (3,098/32,276) x 100 = 30.0% (4,111/29,976)

62
TABLE 29 MIBK - PROCESS-LEVEL INFORMATION ON REDUCTIONS FOR TARGETED PROCESS NHP/WB (two processes grouped)Unit of product: gallons of NHP/WB paint
Year No. ofUnitsofProd.(gal)
USE
pounds
USE/UnitProd.
NPO
pounds
NPO/UnitProd.
USE/UnitProd.reduct.goal(%)
ActualUSE/UnitProd.reduct.(%)
NPO/UnitProd.reduct.goal(%)
ActualNPO/UnitProd.reduct.(%)
2003 89,928 4317 0.0480 4317 0.0480 90 N/A 90 N/A
2004 96,828 25 0.0003 25 0.0003 90 99.5 90 99.5
+ / - 6900 - 4292 -99.5%
- 210 -99.5%
0 N/A 0 N/A
2005
+ / -
2006
+ / -
2007
+ / -
2008
+ / -
Pollution prevention techniques used to achieve reductions: Option 7 and 11 in Table 17.
% USE = (4,317/89,928) – (25/96,828) x 100 = 99.5% (4,317/89,928)
% NPO = (4,317/89,928) – (25/96,828) x 100 = 99.5% (4,317/89,928)