Embed Size (px)
Citation preview
Sample preparation for proteomics by MS [email protected], Laboratory of Biochemistry, Wageningen UR Biochemistry Lab.
1
1. General information ....................................................................................................................................................... 1
1.1 pH stuff and more ............................................................................................................................................ 1 1.2 Abbreviations and solutions ............................................................................................................................ 2 1.3 Tips and ways to reduce the amount of Keratins in your samples. ................................................................. 2 1.4 Recommended procedures ............................................................................................................................. 3 1.5 Sample losses, methods comparison.............................................................................................................. 3 1.6 nLC-MSMS sample necessities. ..................................................................................................................... 4 1.7 General sample cleanup procedures with µColumns. .................................................................................... 4 1.8 About Methionine oxidation ............................................................................................................................. 4
2. Protein determination (BCA). ......................................................................................................................................... 5 3. Gel free protein digestion methods. ............................................................................................................................... 6
3.1 Filter aided sample preparation (FASP, 20-30 ug protein1, easy and reliable = preferred) ........................... 6 3.2 In-StageTip sample preparation (iST, upto 5 ug protein, fast but tricky)........................................................ 7 3.3 Normal “In solution” trypsin digestion ............................................................................................................. 8 3.4 Methanol and TriFluoroEthanol (TFE) sample preparation method ............................................................... 8 3.5 Other proteomics sample prep methods ........................................................................................................ 8
4. In-Gel Digestion method (IGD, 2 μg for 1 purified protein to 60 μg for a complex mix) ................................................ 9 4.1 General info .................................................................................................................................................... 9 4.2 Recommended procedure for CCB or Oriole protein gel staining: ................................................................. 9 4.2.1 Colloidal Coomassie Preparing Staining Solution ........................................................................................ 9 4.2.2 Colloidal Coomassie Gel staining procedure ............................................................................................... 9 4.3 In Gel Digestion protocol .............................................................................................................................. 10 4.3.1 Remarks ..................................................................................................................................................... 10 4.3.2 Procedure ................................................................................................................................................... 10
5. Quantitation .......................................................................................................................................................... 11 5.1 Relative quantitation ( = Sample compared to Control ) .............................................................................. 11 5.1.1 Relative quantitation by on column peptide dimethyl labelling protocol ..................................................... 12 5.2 Absolute quantitation ..................................................................................................................................... 13
6. Phosphopeptide enrichment methods (S and T only). ................................................................................................ 14 6.1 Phosphopeptides (S, T) enrichment by Titanium Dioxide (TiO2) Chromatography. ..................................... 15 6.1.1. Enrichment with normal TiO2 in uColumns. .............................................................................................. 15 6.1.2. Enrichment with magnetic Ti4+ beads ........................................................................................................ 15 6.2 Phosphopeptide (S,T) sample preparation by sequential elution from IMAC. .............................................. 16
Dec 7, 2018
1. General information 1.1 pH stuff and more You can check the pH of your sample by putting 0.1 ul of sample (or less) on a piece of pH paper. pH UP from pH 2 to pH 8
1 ml/l HCOOH = formic acid (FA): pH = 2.4 For 1 ml: Make pH 8 – 8.5 by adding 15 – 20 ul 10* diluted conc. NH3 (max 37%). 0.5 ml/l TFA = TriFluoroAcetic acid: pH = 2.1 For 1 ml: Make pH 8 – 8.5 by adding 6- 9 ul 10* diluted conc. NH3 (max 37%).
pH DOWN from pH 8 to pH 2 - 4 50 mM ABC pH 8.0: For 1 ml: Make pH 3 by adding 35 ul 10* diluted conc. TFA.
1% Sodium DeoxyCholate (DC) can be used to extract hydrophobic proteins to replace 4% SDS: Pasing, Y., S. Colnoe and T. Hansen (2017). "Proteomics of hydrophobic samples: Fast, robust and low-cost workflows for clinical approaches." Proteomics 17(6). Schmidt, A., K. Kochanowski, S. Vedelaar, E. Ahrne, B. Volkmer, L. Callipo, K. Knoops, M. Bauer, R. Aebersold and M. Heinemann (2016). "The quantitative and condition-dependent Escherichia coli proteome." Nature Biotechnology 34(1): 104-110. Our next Proteomics course (including sample prep) will take place: May 7-10, 2019 in Wageningen, the Netherlands. https://www.vlaggraduateschool.nl/en/courses/course/Prot19.htm

Sample preparation for proteomics by MS [email protected], Laboratory of Biochemistry, Wageningen UR Biochemistry Lab.
2
1.2 Abbreviations and solutions MW AA AcrylAmide (Wear gloves) lab 3055 71 20 mM = 1.4 mg/ml 200 mM = 14 mg/ml water AcNi Acetonitril lab 3055 ABC Ammonium BiCarbonate lab 3055 79 50 mM = 0.2 g / 50 ml water AmAc Ammonium Acetate lab 3055 77 10 mM = 38.5 mg / 50 ml water Cystein Fluka 30090, >99% lab 3055 121 125 mM = 15 mg/ml 200 mM = 24 mg/ml water DTT Dithiotreitol (4°C) FRESH! 154 20 mM = 3.1 mg/ml 200 mM = 31 mg/ml water IAA Iodoacetamide (4°C) FRESH! 185 20 mM = 3.7 mg/ml 200 mM = 37 mg/ml water ME β-MercaptoEthanol (4°C) FRESH! 14.3 M 78 20 mM = 1.6 ul/ml = 39ul / 25ml ABC TFE TriFluoroEthanol lab 3055 Safety cupboard MS stuff - TFA TriFluoro-Acetic acid lab 3055 Safety cupboard MS stuff dilute in fume cupboard only TCEP Tris(CarboxyEthyl)Phosphine -20°C 287 100 mM = 29 mg/ml water Tris Stock 10*. pH 8 with HCl weighing room 121 1 M = 121 g/l 6.0 g / 50 ml water
Trypsin we have a stock solution of Bovine Sequencing grade Trypsin (Roche 11 047 841 001) of 0.5 ug/ul (500 ng/ul) in 1 mM HCl. Generally dilute 100* in ABC before use unless stated otherwise
Urea Make FRESH weighing room Do not warm up Tris
UT 8 M urea (Sigma, U0631) weighing room 60 100 ul 1M Tris + 0.48 g urea made up to 1.0 ml pH will increase to 8.2 due to the addition of urea
ST buffer 4%(w/v) SDS in 100 mM lab 3055 100 ul 1M Tris pH8 + 0.04 g SDS made up to 1.0 ml SDT-lysis 50 mM DTT in ST buffer Fresh! 154 7.7 mg / 1 ml ST
- 0.5 ml protein LoBind tube: order# eppe0030108.094 - 2.0 ml protein LoBind tube: order# eppe0030108.132 - Pall 3K or 10K omega filter (20kDa / 50kDa cutoff) order# Pall OD003C34 = Sigma-Aldrich Z722049-100EA
1.3 Tips and ways to reduce the amount of Keratins in your samples. 1. DO: Use commercial electrophoresis gels. They contain less keratin than your own ones.
Use Eppendorf low binding tubes to minimize protein losses (see figure below). Keep gels covered as much as possible. Put them into a new square large petri dish for staining.
2. Use Nitril gloves, not Latex ones. 3. Wash your hands under running tap water before you start and as often as possible in between handlings. 4. Do not work in a standard flow cabinet intended for microbiological work. Due to the large air flow, they increase the amount of keratin passing your vials resulting in more keratin in your samples. 5. Do not wear clothes of wool. 6. Try not to lean over the samples too much. 7. Never ever use glass vials for proteins. You will lose a lot protein. 8. Use new (or only used for proteomics) throw away (polypropylene) plastics. 8. Do not use hand creams when preparing samples for MS. 9. Do not use any glassware that has been cleaned with detergent (e.g. in a washing machine). 10. Cheap (non-Eppendorf) micro tubes may contain polymers, mold release agents, plasticizers, etc. 11. Do not use pipet tips that have been sterilized by heating them. The heat may release plasticizer compounds. 12. Use Eppendorf LowBind tubes, not siliconized tubes.
Eppendorf LoBind tubes bind much less viruses then other brand LoBind tubes. From: E.I. Trilisky, A.M. Lenhoff: Sorption processes in ion-exchange chromatography of viruses. J. Chromatogr. A 1142 (2007) 2 - 12.
Sample preparation for proteomics by MS [email protected], Laboratory of Biochemistry, Wageningen UR Biochemistry Lab.
3
1.4 Recommended procedures
Protein Identification
Label free relative Quantitation
Silac labeled Relative Quantitation
Dimethyl labeled Relative Quantitation
Absolute Quantitation
FASP + + + + + In Gel Digestion (IGD) + + + In Stage Tip (iST) + + + + + On column Dimethyl labeling - - - + -
Ovalbumin Standard addition - Possible but not
advised - - -
Peptide (labeled) Standard addition - - - - +
Peptide fractionation + (always possible e.g. with High pH RP on µColumns) Measurement nLC-MS/MS by Proxeon LTQ – Orbitrap XL Raw Data handling MaxQuant (Protein identification and relative quantitation of peptides larger than 7 AA)
pNOVO+ (deNovoGUI) for peptide de NOVO sequencing (of peptides smaller than 8 AA) QualBrowser + MaxQuant
MQ data handling Perseus (extra filtering of MQ result, statistics and intensity or ratio based clustering of proteins) Bioinformatics (Not all software mentioned has been tested by me)
Overview of GO tools (but not complete): http://geneontology.org/ --> Tools. First pathway analysis can be done with eg: Reactome (www.reactome.org), PathVisio (http://www.pathvisio.org/), KEGG (http://www.genome.jp/kegg/tool/map_pathway2.html), Biocyc (Subscription needed! Biocyc.org e.g. HumanCyc Change organism and select xxx. Tools Cellular Overview). GO enrichment analysis can be done within: - Internet resources like DAVID (Database for Annotation, Visualization and Integrated Discovery, https://david.ncifcrf.gov/, very easy), or (InterProScan)/PloGO (see below) + WeGO. - Cytoscape (www.cytoscape.org) with plugins like BinGO or ClueGO (or EnrichmentMap). - Use the “R project” environment e.g. PloGO (includes abundance information = more advanced). Interactome studies may benefit from database contained information e.g. in STRING-db.org/ but also from Cytoscape plugins like Bionetbuilder or Bisogenet. Alternatives: commercial software like ProteinCenter, Ingenuity or Metacor (these commercial softwares are unfortunately not available at WUR Biochemistry).
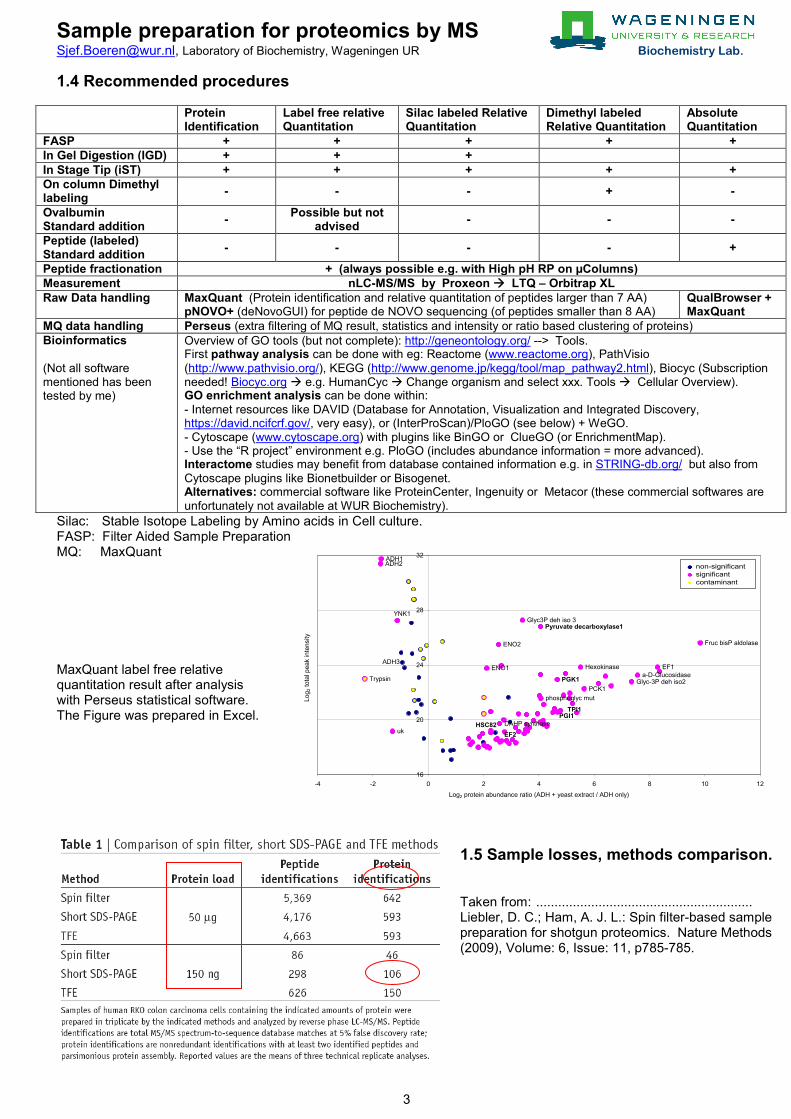
Silac: Stable Isotope Labeling by Amino acids in Cell culture. FASP: Filter Aided Sample Preparation MQ: MaxQuant MaxQuant label free relative quantitation result after analysis with Perseus statistical software. The Figure was prepared in Excel.
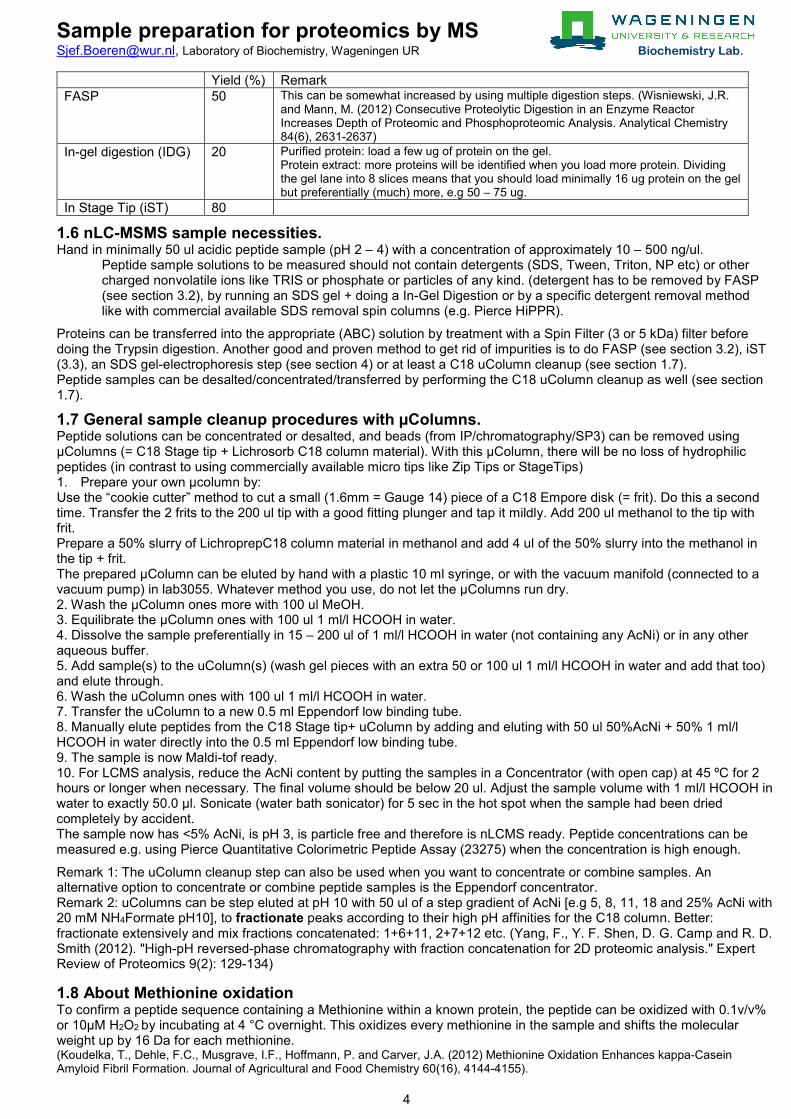
1.5 Sample losses, methods comparison. Taken from: ........................................................... Liebler, D. C.; Ham, A. J. L.: Spin filter-based sample preparation for shotgun proteomics. Nature Methods (2009), Volume: 6, Issue: 11, p785-785.
Trypsin
Fruc bisP aldolase
EF1
a-D-GlucosidaseGlyc-3P deh iso2
PCK1
Hexokinase
TPI1PGI1
PGK1
phosphoglyc mut
Pyruvate decarboxylase1
Glyc3P deh iso 3
DAHP synthase
ENO2
EF2
ENO1
HSC82
YNK1
uk
ADH1ADH2
ADH3
16
20
24
28
32
-4 -2 0 2 4 6 8 10 12
Log2 protein abundance ratio (ADH + yeast extract / ADH only)
Log 2
tota
l pea
k in
tens
ity .
non-significantsignificantcontaminant
Sample preparation for proteomics by MS [email protected], Laboratory of Biochemistry, Wageningen UR Biochemistry Lab.
4
Yield (%) Remark FASP 50 This can be somewhat increased by using multiple digestion steps. (Wisniewski, J.R.
and Mann, M. (2012) Consecutive Proteolytic Digestion in an Enzyme Reactor Increases Depth of Proteomic and Phosphoproteomic Analysis. Analytical Chemistry 84(6), 2631-2637)
In-gel digestion (IDG) 20 Purified protein: load a few ug of protein on the gel. Protein extract: more proteins will be identified when you load more protein. Dividing the gel lane into 8 slices means that you should load minimally 16 ug protein on the gel but preferentially (much) more, e.g 50 – 75 ug.
In Stage Tip (iST) 80
1.6 nLC-MSMS sample necessities. Hand in minimally 50 ul acidic peptide sample (pH 2 – 4) with a concentration of approximately 10 – 500 ng/ul.
Peptide sample solutions to be measured should not contain detergents (SDS, Tween, Triton, NP etc) or other charged nonvolatile ions like TRIS or phosphate or particles of any kind. (detergent has to be removed by FASP (see section 3.2), by running an SDS gel + doing a In-Gel Digestion or by a specific detergent removal method like with commercial available SDS removal spin columns (e.g. Pierce HiPPR).
Proteins can be transferred into the appropriate (ABC) solution by treatment with a Spin Filter (3 or 5 kDa) filter before doing the Trypsin digestion. Another good and proven method to get rid of impurities is to do FASP (see section 3.2), iST (3.3), an SDS gel-electrophoresis step (see section 4) or at least a C18 uColumn cleanup (see section 1.7). Peptide samples can be desalted/concentrated/transferred by performing the C18 uColumn cleanup as well (see section 1.7).
1.7 General sample cleanup procedures with µColumns. Peptide solutions can be concentrated or desalted, and beads (from IP/chromatography/SP3) can be removed using µColumns (= C18 Stage tip + Lichrosorb C18 column material). With this µColumn, there will be no loss of hydrophilic peptides (in contrast to using commercially available micro tips like Zip Tips or StageTips) 1. Prepare your own µcolumn by: Use the “cookie cutter” method to cut a small (1.6mm = Gauge 14) piece of a C18 Empore disk (= frit). Do this a second time. Transfer the 2 frits to the 200 ul tip with a good fitting plunger and tap it mildly. Add 200 ul methanol to the tip with frit. Prepare a 50% slurry of LichroprepC18 column material in methanol and add 4 ul of the 50% slurry into the methanol in the tip + frit. The prepared µColumn can be eluted by hand with a plastic 10 ml syringe, or with the vacuum manifold (connected to a vacuum pump) in lab3055. Whatever method you use, do not let the µColumns run dry. 2. Wash the µColumn ones more with 100 ul MeOH. 3. Equilibrate the µColumn ones with 100 ul 1 ml/l HCOOH in water. 4. Dissolve the sample preferentially in 15 – 200 ul of 1 ml/l HCOOH in water (not containing any AcNi) or in any other aqueous buffer. 5. Add sample(s) to the uColumn(s) (wash gel pieces with an extra 50 or 100 ul 1 ml/l HCOOH in water and add that too) and elute through. 6. Wash the uColumn ones with 100 ul 1 ml/l HCOOH in water. 7. Transfer the uColumn to a new 0.5 ml Eppendorf low binding tube. 8. Manually elute peptides from the C18 Stage tip+ uColumn by adding and eluting with 50 ul 50%AcNi + 50% 1 ml/l HCOOH in water directly into the 0.5 ml Eppendorf low binding tube. 9. The sample is now Maldi-tof ready. 10. For LCMS analysis, reduce the AcNi content by putting the samples in a Concentrator (with open cap) at 45 ºC for 2 hours or longer when necessary. The final volume should be below 20 ul. Adjust the sample volume with 1 ml/l HCOOH in water to exactly 50.0 µl. Sonicate (water bath sonicator) for 5 sec in the hot spot when the sample had been dried completely by accident. The sample now has <5% AcNi, is pH 3, is particle free and therefore is nLCMS ready. Peptide concentrations can be measured e.g. using Pierce Quantitative Colorimetric Peptide Assay (23275) when the concentration is high enough.
Remark 1: The uColumn cleanup step can also be used when you want to concentrate or combine samples. An alternative option to concentrate or combine peptide samples is the Eppendorf concentrator. Remark 2: uColumns can be step eluted at pH 10 with 50 ul of a step gradient of AcNi [e.g 5, 8, 11, 18 and 25% AcNi with 20 mM NH4Formate pH10], to fractionate peaks according to their high pH affinities for the C18 column. Better: fractionate extensively and mix fractions concatenated: 1+6+11, 2+7+12 etc. (Yang, F., Y. F. Shen, D. G. Camp and R. D. Smith (2012). "High-pH reversed-phase chromatography with fraction concatenation for 2D proteomic analysis." Expert Review of Proteomics 9(2): 129-134) 1.8 About Methionine oxidation To confirm a peptide sequence containing a Methionine within a known protein, the peptide can be oxidized with 0.1v/v% or 10µM H2O2 by incubating at 4 °C overnight. This oxidizes every methionine in the sample and shifts the molecular weight up by 16 Da for each methionine. (Koudelka, T., Dehle, F.C., Musgrave, I.F., Hoffmann, P. and Carver, J.A. (2012) Methionine Oxidation Enhances kappa-Casein Amyloid Fibril Formation. Journal of Agricultural and Food Chemistry 60(16), 4144-4155).
Sample preparation for proteomics by MS [email protected], Laboratory of Biochemistry, Wageningen UR Biochemistry Lab.
5
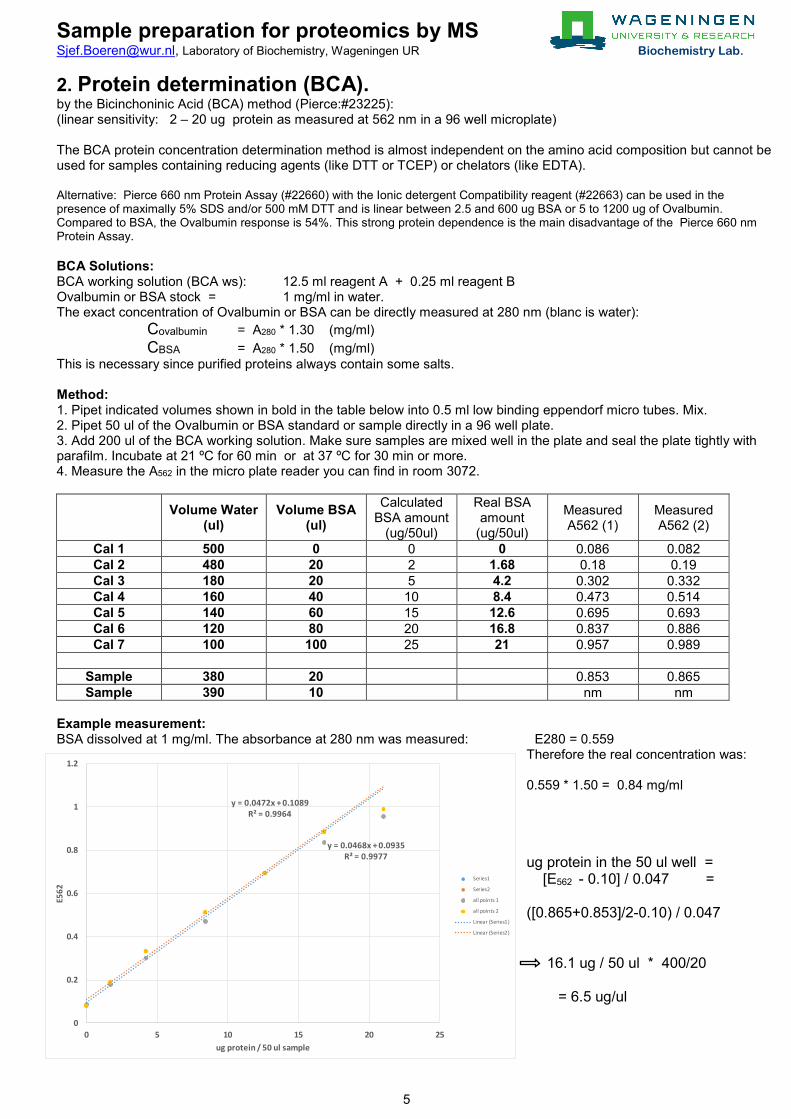
2. Protein determination (BCA). by the Bicinchoninic Acid (BCA) method (Pierce:#23225): (linear sensitivity: 2 – 20 ug protein as measured at 562 nm in a 96 well microplate) The BCA protein concentration determination method is almost independent on the amino acid composition but cannot be used for samples containing reducing agents (like DTT or TCEP) or chelators (like EDTA). Alternative: Pierce 660 nm Protein Assay (#22660) with the Ionic detergent Compatibility reagent (#22663) can be used in the presence of maximally 5% SDS and/or 500 mM DTT and is linear between 2.5 and 600 ug BSA or 5 to 1200 ug of Ovalbumin. Compared to BSA, the Ovalbumin response is 54%. This strong protein dependence is the main disadvantage of the Pierce 660 nm Protein Assay. BCA Solutions: BCA working solution (BCA ws): 12.5 ml reagent A + 0.25 ml reagent B Ovalbumin or BSA stock = 1 mg/ml in water. The exact concentration of Ovalbumin or BSA can be directly measured at 280 nm (blanc is water): Covalbumin = A280 * 1.30 (mg/ml) CBSA = A280 * 1.50 (mg/ml) This is necessary since purified proteins always contain some salts. Method: 1. Pipet indicated volumes shown in bold in the table below into 0.5 ml low binding eppendorf micro tubes. Mix. 2. Pipet 50 ul of the Ovalbumin or BSA standard or sample directly in a 96 well plate. 3. Add 200 ul of the BCA working solution. Make sure samples are mixed well in the plate and seal the plate tightly with parafilm. Incubate at 21 ºC for 60 min or at 37 ºC for 30 min or more. 4. Measure the A562 in the micro plate reader you can find in room 3072.
Volume Water (ul)
Volume BSA (ul)
Calculated BSA amount
(ug/50ul)
Real BSA amount
(ug/50ul)
Measured A562 (1)
Measured A562 (2)
Cal 1 500 0 0 0 0.086 0.082 Cal 2 480 20 2 1.68 0.18 0.19 Cal 3 180 20 5 4.2 0.302 0.332 Cal 4 160 40 10 8.4 0.473 0.514 Cal 5 140 60 15 12.6 0.695 0.693 Cal 6 120 80 20 16.8 0.837 0.886 Cal 7 100 100 25 21 0.957 0.989
Sample 380 20 0.853 0.865 Sample 390 10 nm nm
Example measurement: BSA dissolved at 1 mg/ml. The absorbance at 280 nm was measured: E280 = 0.559
Therefore the real concentration was: 0.559 * 1.50 = 0.84 mg/ml ug protein in the 50 ul well = [E562
- 0.10] / 0.047 = ([0.865+0.853]/2-0.10) / 0.047 16.1 ug / 50 ul * 400/20 = 6.5 ug/ul
y = 0.0468x + 0.0935R² = 0.9977
y = 0.0472x + 0.1089R² = 0.9964
0
0.2
0.4
0.6
0.8
1
1.2
0 5 10 15 20 25
E562
ug protein / 50 ul sample
Series1
Series2
all points 1
all points 2
Linear (Series1)
Linear (Series2)
Sample preparation for proteomics by MS [email protected], Laboratory of Biochemistry, Wageningen UR Biochemistry Lab.
6
3. Gel free protein digestion methods. 3.1 Filter aided sample preparation (FASP, 20-30 ug protein1, easy and reliable = preferred) Modified from ref: Wisniewski, J. R.; Zougman, A.; Nagaraj, N.; Mann, M.: Universal sample preparation method for proteome analysis. Nature Methods (2009) Volume: 6, Issue: 5, Pages: 359-360 Remark 1: 20 ug protein is intended to be used with the normal (1h) gradiënt, 30 ug for the (2h) intermediate gradiënt. Remark 2: All centrifugation steps should be done at 12 kRPM in the Eppendorf 5424 centrifuge in lab 3055 (≤14000 *g) Remark 3: Instead of using 100 mM Tris pH8 only, it is possible to use 1% Sodium Deoxycholate/100 mM Tris pH8. 0. Before use, it is advised to clean the Pall nanosep filters with 750 ul ethanol + centrifugation at 12 kRPM for 45’ first. 1. Sample lysis: make a concentrated protein sample.
e.g. by sonicating 10 mg wet weight cells in 100 ul 100 mM Tris pH8 in a 0.5 ml low binding Eppendorf tube for 30 sec with a probe sonicator with a thoroughly cleaned metal tip.
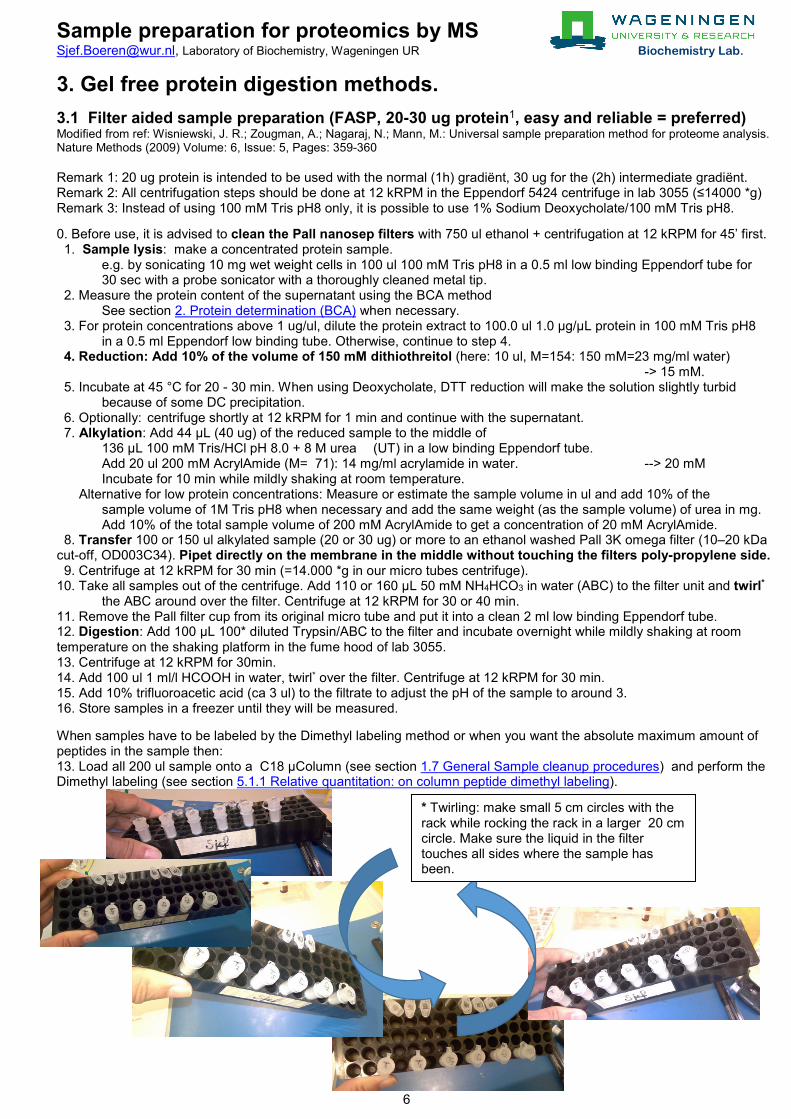
2. Measure the protein content of the supernatant using the BCA method See section 2. Protein determination (BCA) when necessary. 3. For protein concentrations above 1 ug/ul, dilute the protein extract to 100.0 ul 1.0 μg/μL protein in 100 mM Tris pH8 in a 0.5 ml Eppendorf low binding tube. Otherwise, continue to step 4. 4. Reduction: Add 10% of the volume of 150 mM dithiothreitol (here: 10 ul, M=154: 150 mM=23 mg/ml water) -> 15 mM. 5. Incubate at 45 °C for 20 - 30 min. When using Deoxycholate, DTT reduction will make the solution slightly turbid because of some DC precipitation. 6. Optionally: centrifuge shortly at 12 kRPM for 1 min and continue with the supernatant. 7. Alkylation: Add 44 μL (40 ug) of the reduced sample to the middle of 136 μL 100 mM Tris/HCl pH 8.0 + 8 M urea (UT) in a low binding Eppendorf tube. Add 20 ul 200 mM AcrylAmide (M= 71): 14 mg/ml acrylamide in water. --> 20 mM Incubate for 10 min while mildly shaking at room temperature. Alternative for low protein concentrations: Measure or estimate the sample volume in ul and add 10% of the sample volume of 1M Tris pH8 when necessary and add the same weight (as the sample volume) of urea in mg. Add 10% of the total sample volume of 200 mM AcrylAmide to get a concentration of 20 mM AcrylAmide. 8. Transfer 100 or 150 ul alkylated sample (20 or 30 ug) or more to an ethanol washed Pall 3K omega filter (10–20 kDa cut-off, OD003C34). Pipet directly on the membrane in the middle without touching the filters poly-propylene side. 9. Centrifuge at 12 kRPM for 30 min (=14.000 *g in our micro tubes centrifuge). 10. Take all samples out of the centrifuge. Add 110 or 160 μL 50 mM NH4HCO3 in water (ABC) to the filter unit and twirl* the ABC around over the filter. Centrifuge at 12 kRPM for 30 or 40 min. 11. Remove the Pall filter cup from its original micro tube and put it into a clean 2 ml low binding Eppendorf tube. 12. Digestion: Add 100 μL 100* diluted Trypsin/ABC to the filter and incubate overnight while mildly shaking at room temperature on the shaking platform in the fume hood of lab 3055. 13. Centrifuge at 12 kRPM for 30min. 14. Add 100 ul 1 ml/l HCOOH in water, twirl* over the filter. Centrifuge at 12 kRPM for 30 min. 15. Add 10% trifluoroacetic acid (ca 3 ul) to the filtrate to adjust the pH of the sample to around 3. 16. Store samples in a freezer until they will be measured. When samples have to be labeled by the Dimethyl labeling method or when you want the absolute maximum amount of peptides in the sample then: 13. Load all 200 ul sample onto a C18 µColumn (see section 1.7 General Sample cleanup procedures) and perform the Dimethyl labeling (see section 5.1.1 Relative quantitation: on column peptide dimethyl labeling).
* Twirling: make small 5 cm circles with the rack while rocking the rack in a larger 20 cm circle. Make sure the liquid in the filter touches all sides where the sample has been.
Sample preparation for proteomics by MS [email protected], Laboratory of Biochemistry, Wageningen UR Biochemistry Lab.
7
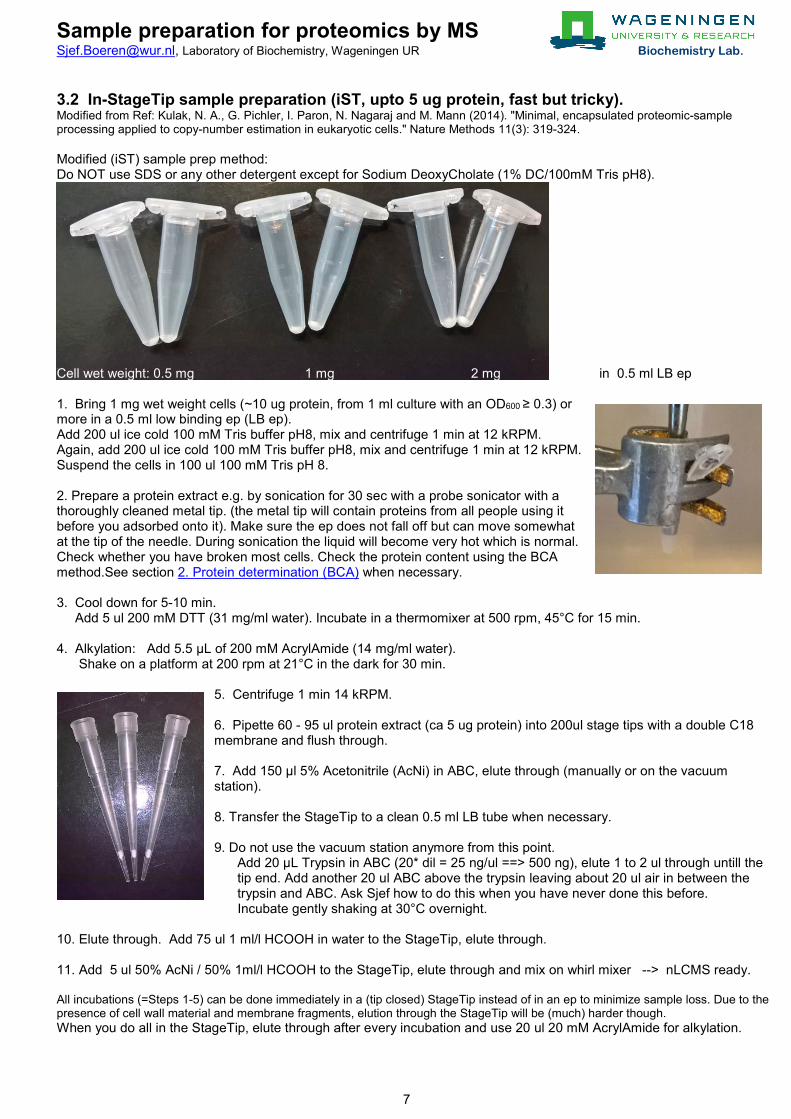
3.2 In-StageTip sample preparation (iST, upto 5 ug protein, fast but tricky). Modified from Ref: Kulak, N. A., G. Pichler, I. Paron, N. Nagaraj and M. Mann (2014). "Minimal, encapsulated proteomic-sample processing applied to copy-number estimation in eukaryotic cells." Nature Methods 11(3): 319-324. Modified (iST) sample prep method: Do NOT use SDS or any other detergent except for Sodium DeoxyCholate (1% DC/100mM Tris pH8). Cell wet weight: 0.5 mg 1 mg 2 mg in 0.5 ml LB ep 1. Bring 1 mg wet weight cells (~10 ug protein, from 1 ml culture with an OD600 ≥ 0.3) or more in a 0.5 ml low binding ep (LB ep). Add 200 ul ice cold 100 mM Tris buffer pH8, mix and centrifuge 1 min at 12 kRPM. Again, add 200 ul ice cold 100 mM Tris buffer pH8, mix and centrifuge 1 min at 12 kRPM. Suspend the cells in 100 ul 100 mM Tris pH 8. 2. Prepare a protein extract e.g. by sonication for 30 sec with a probe sonicator with a thoroughly cleaned metal tip. (the metal tip will contain proteins from all people using it before you adsorbed onto it). Make sure the ep does not fall off but can move somewhat at the tip of the needle. During sonication the liquid will become very hot which is normal. Check whether you have broken most cells. Check the protein content using the BCA method.See section 2. Protein determination (BCA) when necessary. 3. Cool down for 5-10 min. Add 5 ul 200 mM DTT (31 mg/ml water). Incubate in a thermomixer at 500 rpm, 45°C for 15 min. 4. Alkylation: Add 5.5 μL of 200 mM AcrylAmide (14 mg/ml water). Shake on a platform at 200 rpm at 21°C in the dark for 30 min.
5. Centrifuge 1 min 14 kRPM. 6. Pipette 60 - 95 ul protein extract (ca 5 ug protein) into 200ul stage tips with a double C18 membrane and flush through. 7. Add 150 μl 5% Acetonitrile (AcNi) in ABC, elute through (manually or on the vacuum station). 8. Transfer the StageTip to a clean 0.5 ml LB tube when necessary. 9. Do not use the vacuum station anymore from this point.
Add 20 μL Trypsin in ABC (20* dil = 25 ng/ul ==> 500 ng), elute 1 to 2 ul through untill the tip end. Add another 20 ul ABC above the trypsin leaving about 20 ul air in between the trypsin and ABC. Ask Sjef how to do this when you have never done this before. Incubate gently shaking at 30°C overnight.
10. Elute through. Add 75 ul 1 ml/l HCOOH in water to the StageTip, elute through. 11. Add 5 ul 50% AcNi / 50% 1ml/l HCOOH to the StageTip, elute through and mix on whirl mixer --> nLCMS ready. All incubations (=Steps 1-5) can be done immediately in a (tip closed) StageTip instead of in an ep to minimize sample loss. Due to the presence of cell wall material and membrane fragments, elution through the StageTip will be (much) harder though. When you do all in the StageTip, elute through after every incubation and use 20 ul 20 mM AcrylAmide for alkylation.
Sample preparation for proteomics by MS [email protected], Laboratory of Biochemistry, Wageningen UR Biochemistry Lab.
8
3.3 Normal “In solution” trypsin digestion 1. Dissolve 1-10 ug protein in 100 ul 50 mM ABC (pH 8) (10 ug BSA = 0.15 nmol = 5.3 nmol Cys) 2. Add 5 ul 200 mM DTT dissolved into 50 mM ABC (pH 8.5 with NH3, 1.0 umol). Incubate at 60 ºC for 1 hour. 3. Check the pH. Make pH 8.5 with 10* diluted NH3. (Usually not necessary!) 4. Add 7.5 ul 200 mM AcrylAmide dissolved into 50 mM ABC (pH 8.5 with NH3, 1.5 umol). Incubate at 20 ºC in the
dark for 0.5 hour exactly. 5. Add 8 ul 200 mM cysteine dissolved into 50 mM ABC to remove the excess acrylamide. 6. For procedure 3.4 only (below), add another 360 ul ABC to decrease the TFE or MeOH concentration to 10%. 7. Add 5 ul trypsin sequencing grade 20* diluted in ABC to 25 ng/ul (125 ng). 8. Incubate gently shaking at room temperature overnight or at 37 °C for 4-6 h or at 45 °C for 2-3 h. 9. After digestion, add 2.5 ul 10* diluted TFA to decrease the pH to 2 - 3. Add more 10* diluted TFA when
necessary. 10. Perform the sample cleanup with uColumns as described in: 1.7 General sample cleanup procedures with
µColumns. In solution digested samples that have not been cleaned by this procedure cannot be measured. 3.4 Methanol and TriFluoroEthanol (TFE) sample preparation method With Cysteine reduction and CarboxAmidoMethylation (to prevent auto-oxidation) = +57 Da per cysteine. Ref. Wang, H. X, Qian, W. J.; Mottaz, H. M.; …. , Smith, R. D.: Development and evaluation of a micro- and nanoscale proteomic sample preparation method. Journal of Proteome Research (2005) 4 (6) p2397-2403 3.4.1. Sonicate in a 2 ml low binding ep 1 mg (or less) of the wet cell sample in 99 ul (or less) of either:
a. 50 mM ABC (pH 8) b. MeOH/50 mM ABC (60:40 v/v) c. TFE/50 mM ABC (50:50 v/v) d. detergent containing buffer ( detergent has to be removed by FASP (see section 3.1. Filter aided sample preparation), by running an SDS gel (also see chapter 4 In-Gel Digestion method) or by a specific detergent removal method like with commercial available SDS removal spin columns (e.g. Pierce HiPPR).
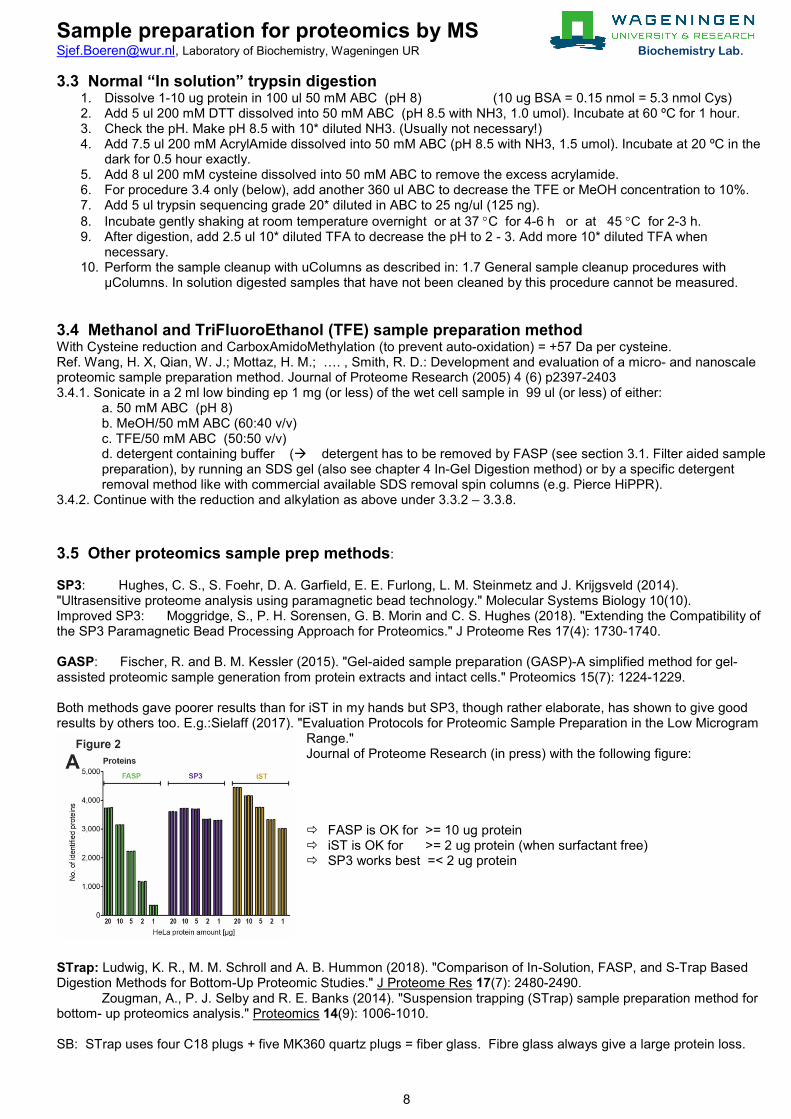
3.4.2. Continue with the reduction and alkylation as above under 3.3.2 – 3.3.8. 3.5 Other proteomics sample prep methods: SP3: Hughes, C. S., S. Foehr, D. A. Garfield, E. E. Furlong, L. M. Steinmetz and J. Krijgsveld (2014). "Ultrasensitive proteome analysis using paramagnetic bead technology." Molecular Systems Biology 10(10). Improved SP3: Moggridge, S., P. H. Sorensen, G. B. Morin and C. S. Hughes (2018). "Extending the Compatibility of the SP3 Paramagnetic Bead Processing Approach for Proteomics." J Proteome Res 17(4): 1730-1740. GASP: Fischer, R. and B. M. Kessler (2015). "Gel-aided sample preparation (GASP)-A simplified method for gel-assisted proteomic sample generation from protein extracts and intact cells." Proteomics 15(7): 1224-1229. Both methods gave poorer results than for iST in my hands but SP3, though rather elaborate, has shown to give good results by others too. E.g.:Sielaff (2017). "Evaluation Protocols for Proteomic Sample Preparation in the Low Microgram
Range." Journal of Proteome Research (in press) with the following figure: FASP is OK for >= 10 ug protein iST is OK for >= 2 ug protein (when surfactant free) SP3 works best =< 2 ug protein
STrap: Ludwig, K. R., M. M. Schroll and A. B. Hummon (2018). "Comparison of In-Solution, FASP, and S-Trap Based Digestion Methods for Bottom-Up Proteomic Studies." J Proteome Res 17(7): 2480-2490. Zougman, A., P. J. Selby and R. E. Banks (2014). "Suspension trapping (STrap) sample preparation method for bottom- up proteomics analysis." Proteomics 14(9): 1006-1010.
SB: STrap uses four C18 plugs + five MK360 quartz plugs = fiber glass. Fibre glass always give a large protein loss.
Sample preparation for proteomics by MS [email protected], Laboratory of Biochemistry, Wageningen UR Biochemistry Lab.
9
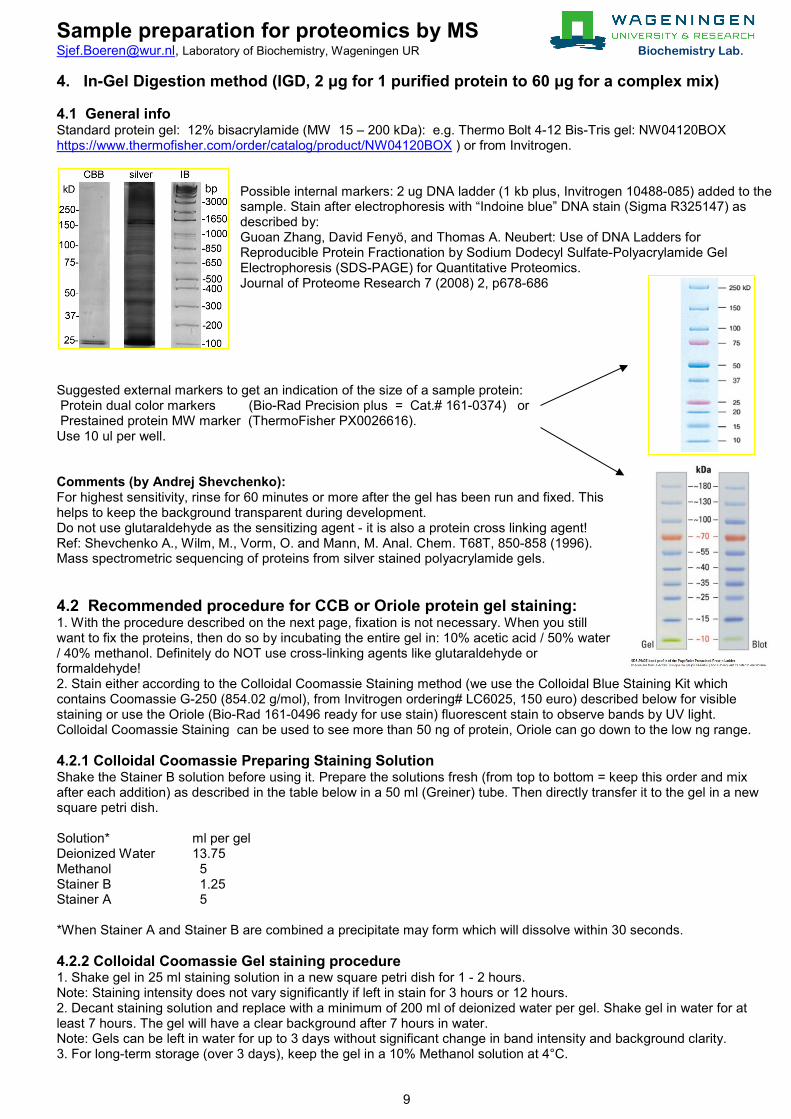
4. In-Gel Digestion method (IGD, 2 μg for 1 purified protein to 60 μg for a complex mix) 4.1 General info Standard protein gel: 12% bisacrylamide (MW 15 – 200 kDa): e.g. Thermo Bolt 4-12 Bis-Tris gel: NW04120BOX https://www.thermofisher.com/order/catalog/product/NW04120BOX ) or from Invitrogen.
Possible internal markers: 2 ug DNA ladder (1 kb plus, Invitrogen 10488-085) added to the sample. Stain after electrophoresis with “Indoine blue” DNA stain (Sigma R325147) as described by: Guoan Zhang, David Fenyö, and Thomas A. Neubert: Use of DNA Ladders for Reproducible Protein Fractionation by Sodium Dodecyl Sulfate-Polyacrylamide Gel Electrophoresis (SDS-PAGE) for Quantitative Proteomics. Journal of Proteome Research 7 (2008) 2, p678-686
Suggested external markers to get an indication of the size of a sample protein: Protein dual color markers (Bio-Rad Precision plus = Cat.# 161-0374) or Prestained protein MW marker (ThermoFisher PX0026616). Use 10 ul per well. Comments (by Andrej Shevchenko): For highest sensitivity, rinse for 60 minutes or more after the gel has been run and fixed. This helps to keep the background transparent during development. Do not use glutaraldehyde as the sensitizing agent - it is also a protein cross linking agent! Ref: Shevchenko A., Wilm, M., Vorm, O. and Mann, M. Anal. Chem. T68T, 850-858 (1996). Mass spectrometric sequencing of proteins from silver stained polyacrylamide gels. 4.2 Recommended procedure for CCB or Oriole protein gel staining: 1. With the procedure described on the next page, fixation is not necessary. When you still want to fix the proteins, then do so by incubating the entire gel in: 10% acetic acid / 50% water / 40% methanol. Definitely do NOT use cross-linking agents like glutaraldehyde or formaldehyde! 2. Stain either according to the Colloidal Coomassie Staining method (we use the Colloidal Blue Staining Kit which contains Coomassie G-250 (854.02 g/mol), from Invitrogen ordering# LC6025, 150 euro) described below for visible staining or use the Oriole (Bio-Rad 161-0496 ready for use stain) fluorescent stain to observe bands by UV light. Colloidal Coomassie Staining can be used to see more than 50 ng of protein, Oriole can go down to the low ng range. 4.2.1 Colloidal Coomassie Preparing Staining Solution Shake the Stainer B solution before using it. Prepare the solutions fresh (from top to bottom = keep this order and mix after each addition) as described in the table below in a 50 ml (Greiner) tube. Then directly transfer it to the gel in a new square petri dish. Solution* ml per gel Deionized Water 13.75 Methanol 5 Stainer B 1.25 Stainer A 5 *When Stainer A and Stainer B are combined a precipitate may form which will dissolve within 30 seconds. 4.2.2 Colloidal Coomassie Gel staining procedure 1. Shake gel in 25 ml staining solution in a new square petri dish for 1 - 2 hours. Note: Staining intensity does not vary significantly if left in stain for 3 hours or 12 hours. 2. Decant staining solution and replace with a minimum of 200 ml of deionized water per gel. Shake gel in water for at least 7 hours. The gel will have a clear background after 7 hours in water. Note: Gels can be left in water for up to 3 days without significant change in band intensity and background clarity. 3. For long-term storage (over 3 days), keep the gel in a 10% Methanol solution at 4°C.
Sample preparation for proteomics by MS [email protected], Laboratory of Biochemistry, Wageningen UR Biochemistry Lab.
10
4.3 In Gel Digestion protocol 4.3.1 Remarks Proteins visible in a SDS gel after Colloidal Coomassie Staining can be measured by Proxeon nLC-LTQ-Orbitrap XL MS-MSMS provided you read and follow the remarks concerning Keratin in section 1.3 Reduce the amount of Keratins in your samples as much as possible by… . 4.3.2 Procedure 1. Sample preparation. a. Make a concentrated protein sample in a suitable buffer e.g. by sonication. E.g. 50 mg washed cells in 450 ul SDT-lysis buffer pH 8 (= maximally 5 ug protein/ul) or 2 ul 2.0 ug/ul BSA in 398 ul SDT-lysis buffer pH 8 (= 10 ng BSA/ul) b. Sonicate and incubate at 95°C (heating block) for 10 min. Cool down to room temperature. Centrifuge at 12 kRPM for 10 min. e. Pipet 80 ul of sample supernatant in an ep and add 20 ul of Sample loading buffer (e.g. Pierce 39000 or [50% glycerol/50% water + 1 g/l bromophenol blue]). Incubate shaking at 95°C for 10 min. Centrifuge. The sample will now have circa 1 - 4 ug protein/ul from 50 mg cells or 8 ng BSA/ul from 2 ug BSA f. Apply 2 μg (one purified protein) to 60 μg (protein mix) or even more protein per sample well. Each sample well holds maximally 40μL (but then you have to pipet very, very carefully, 30 ul is more safe). As a protocol control, use 100 ng of BSA exactly ( = 12.5 ul as prepared above). 2. Run the gel as described by the manufacturer. For 12% gels, run at 120V for about 55 min = ca 5.5 cm. This is fine for 8 gel slices. If you want to prepare less slices from one sample, then run the gel shorter (ca 5 min per gel slice). Use gloves. Open the gel cassette with a thin spatula and put it into a large clean square petri dish. Keep the gel covered with the lid as much as possible to prevent extra keratin contamination. Stain for 1 - 2 hours (see 5.2) and then de-stain with water for 1 to 20 hours. Refresh the water a few times. Remark: Some (most) in-gel digestion protocols use a 50% acetonitril to wash away the Coomassie but this is not necessary when the sample is measured by LC-MSMS. The Coomassie stain will be released from the protein during the digestion procedure and will elute from the RP column after the peptides at acetonitril percentages higher than 40% but generally is poorly soluble in 1 ml/l HCOOH in water which is used to dissolve the peptides before injection onto the nLC. 3. Cysteines reduction and alkylation. a. Add 25 ml 50 mM NH4HCO3 + 20 mM reductor: 39 mg DTT or 35 ul 2-MercaptoEthanol (smelly, keep in fumehood). Gently shake for 1 h or more at room temperature to reduce all disulfide bridges. b. Wash with water and add 22.5 ml water + 2.5 ml 1M Tris pH 8 + 0.036 g AcrylAmide (= 20 mM AA pH 8). Incubate at room temperature in the dark while gently shaking for 0.5 hour. Wash with water thoroughly. 4. Gel cutting. (If the gel gets a bit dry and starts jumping around, than add a small drop of water on top of the gel). Cut out the gel bands or slices (1 – 8) and cut them into small pieces of ca. 1 mm2. Use a sharp clean scalpel from lab 3055 on a clean piece of parafilm. Transfer the gel pieces to clean 0.5 ml low binding micro centrifuge tubes. 5. Enzymatic digestion. At this point you may store the samples in a freezer or freeze + de-freeze the gel pieces to further increase the Trypsin accessible area. Add 50 ul cold freshly prepared Trypsin solution (5 ng/ul = 100* diluted into ABC). When there is still some gel piece sticking out of the solution, then add extra ABC (but NO Trypsin) to completely cover the gel pieces. Preferentially incubate overnight while shaking at room temperature (20 °C) or 4-6 hours at 37 °C or 2-3 hours at 45 °C. 6. Extraction of peptides. a. Add 10% TFA up to a pH between 2 and 4 (measure the pH with pH paper, ca. 3.5 ul is needed per 50 ul of ABC). Mix. b. Perform the µColumn cleanup procedure with a C18 uColumn as described in section 1.7 “General sample cleanup procedures with µColumns”. After loading the first peptide extract to the µColumn, add 100 ul 1 ml/l HCOOH in water to the remaining gel pieces, mix, and add the liquid to the µColumn as well. The µColumn cleanup step can also be used when you want to concentrate or combine samples. An alternative option to concentrate or combine peptide samples is the Eppendorf concentrator.
Sample preparation for proteomics by MS [email protected], Laboratory of Biochemistry, Wageningen UR Biochemistry Lab.
11
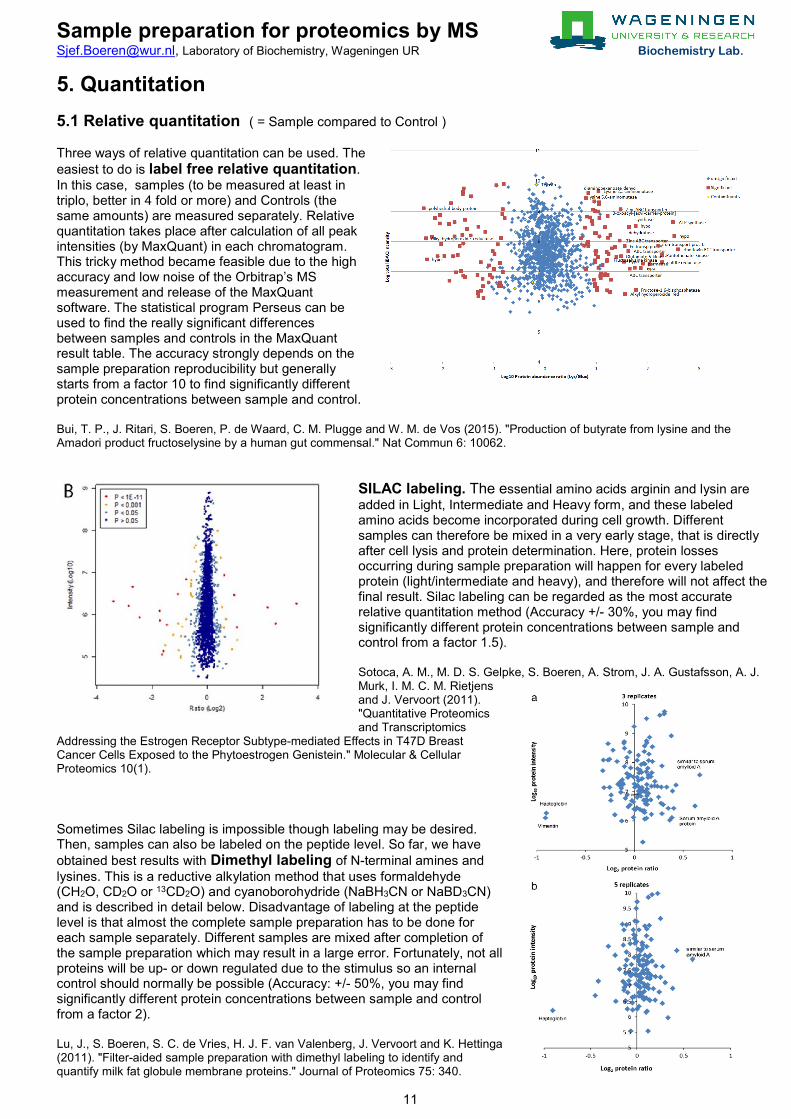
5. Quantitation 5.1 Relative quantitation ( = Sample compared to Control ) Three ways of relative quantitation can be used. The easiest to do is label free relative quantitation. In this case, samples (to be measured at least in triplo, better in 4 fold or more) and Controls (the same amounts) are measured separately. Relative quantitation takes place after calculation of all peak intensities (by MaxQuant) in each chromatogram. This tricky method became feasible due to the high accuracy and low noise of the Orbitrap’s MS measurement and release of the MaxQuant software. The statistical program Perseus can be used to find the really significant differences between samples and controls in the MaxQuant result table. The accuracy strongly depends on the sample preparation reproducibility but generally starts from a factor 10 to find significantly different protein concentrations between sample and control. Bui, T. P., J. Ritari, S. Boeren, P. de Waard, C. M. Plugge and W. M. de Vos (2015). "Production of butyrate from lysine and the Amadori product fructoselysine by a human gut commensal." Nat Commun 6: 10062.
SILAC labeling. The essential amino acids arginin and lysin are added in Light, Intermediate and Heavy form, and these labeled amino acids become incorporated during cell growth. Different samples can therefore be mixed in a very early stage, that is directly after cell lysis and protein determination. Here, protein losses occurring during sample preparation will happen for every labeled protein (light/intermediate and heavy), and therefore will not affect the final result. Silac labeling can be regarded as the most accurate relative quantitation method (Accuracy +/- 30%, you may find significantly different protein concentrations between sample and control from a factor 1.5). Sotoca, A. M., M. D. S. Gelpke, S. Boeren, A. Strom, J. A. Gustafsson, A. J. Murk, I. M. C. M. Rietjens and J. Vervoort (2011). "Quantitative Proteomics and Transcriptomics
Addressing the Estrogen Receptor Subtype-mediated Effects in T47D Breast Cancer Cells Exposed to the Phytoestrogen Genistein." Molecular & Cellular Proteomics 10(1). Sometimes Silac labeling is impossible though labeling may be desired. Then, samples can also be labeled on the peptide level. So far, we have obtained best results with Dimethyl labeling of N-terminal amines and lysines. This is a reductive alkylation method that uses formaldehyde (CH2O, CD2O or 13CD2O) and cyanoborohydride (NaBH3CN or NaBD3CN) and is described in detail below. Disadvantage of labeling at the peptide level is that almost the complete sample preparation has to be done for each sample separately. Different samples are mixed after completion of the sample preparation which may result in a large error. Fortunately, not all proteins will be up- or down regulated due to the stimulus so an internal control should normally be possible (Accuracy: +/- 50%, you may find significantly different protein concentrations between sample and control from a factor 2). Lu, J., S. Boeren, S. C. de Vries, H. J. F. van Valenberg, J. Vervoort and K. Hettinga (2011). "Filter-aided sample preparation with dimethyl labeling to identify and quantify milk fat globule membrane proteins." Journal of Proteomics 75: 340.

Sample preparation for proteomics by MS [email protected], Laboratory of Biochemistry, Wageningen UR Biochemistry Lab.
12
5.1.1 Relative quantitation by on column peptide dimethyl labelling protocol Ref. Boersema, P.J. et al., Nature Protocols (2009) 4, 4, p484-494: Protocol: Dimethyl labeling for relative quantitation. Reductive amination of NH2 on N-terminus and lysines with aldehyde: R-NH2 + 2. H2CO/D2CO + NaBH3CN R-N[CHD2]2 + CO2 + H3O+ ΔM = + C2H4 = + 28.0313 + C2D4 = + 32.0564 + 13C2D6 = + 36.0757 dΔM = 4 / 8 Da per group Stock solutions 500 mM NaH2PO4.1 H2O (M= 138) 6.9 g/l 3.45 g / 50 ml 500 mM Na2HPO4 (M= 142) 7.1 g/l 3.55 g / 50 ml 35% or 20% (vol/vol) formaldehyde in water (CH2O, CD2O or 13CD2O) 0.6 M cyanoborohydride in water (NaBH3CN or NaBD3CN): (M= 64.8) 3.9 mg / 100 ul Labeling reagent Prepare per sample/label: 10 ul 500 mM NaH2PO4.1 H2O + 35 ul 500 mM Na2HPO4 + 425 ul H2O (= 50 mM pH 7.5) + 2.9 ul 35% or 5 ul of 20% (vol/vol) formaldehyde in water (CH2O, CD2O or 13CD2O). + 25 ul of 0.6 M cyanoborohydride in water (NaBH3CN or NaBD3CN) or 1 mg. CAUTION Formaldehyde solutions and formaldehyde vapors are toxic, prepare solutions in a fume hood. CRITICAL Labeling reagent mixtures should be kept at 4 ºC and not stored longer than 24 h to ensure labeling efficiency. Light: CH2O + NaBH3CN Intermediate: CD2O + NaBH3CN Heavy: 13CD2O + NaBD3CN On-column stable isotope dimethyl labeling (TIMING: 1 h): (i) Make C18+ Stage tips by: Use the “cookie cutter” method to put a small (1.6mm) piece of a C18 Empore disk into a plastic 200 ul tip. Do this by cutting the Empore disk with a large metal needle and transfer it to the 200 ul tip with a good fitting plunger from a syringe. Add 200 ul of methanol to this Stage tip. Add 5 ul of a 50% LichroprepC18 slurry in methanol to the Stage tip to create a C18+ Stage tip. (ii) Wash the C18+ Stage tip column with 200 ul of methanol. (iii) Condition the C18+ Stage tip column with 100 ul of 1 ml/l HCOOH in water. (iv) Load the acidified peptide sample in water (maximally 10 ug peptide, detergent free) on a C18+ Stage tip column. (v) Wash the C18+ Stage tip column with 100 ul of 1 ml/l HCOOH in water. (vi) Put 2 ml Eppendorf tubes under the columns to catch reagent that runs through the column. (vii) In 10 min. time (not faster), flush each of the C18+ Stage tip columns with 100 ul of the respective labeling reagent (light, intermediate or heavy). CRITICAL STEP To allow for complete labeling, make sure that Step vii takes at least 10 min. (viii) Wash the C18+ Stage tip columns with 200 ul of 1 ml/l HCOOH in water. (ix) Add 10 ul 1 M Tris to the eps under the columns to destroy remaining reagent. Peptide recovery Manually (= with a syringe) elute and collect the labeled samples in new 0.5 ml low binding eps from the C18 Stage tip columns with 50 ul of 50% AcNi/50% 1 ml/l HCOOH in water. CRITICAL STEP When performing the protocol for the first time or with a new sample, it is advised to check the labeling efficiency and sample amounts by measuring a fraction of the sample by LC-MS before mixing differentially labeled samples. For LCMS analysis, reduce the AcNi content by putting the samples in a Concentrator (with open cap) at 45 ºC for 2 hours or longer when necessary. The final volume should be below 20 ul. Adjust the sample volume with 1 ml/l HCOOH in water to exactly 100.0 ul. Sonicate (water bath sonicator) for 5 sec in the hot spot when the sample had been dried completely by accident. The sample now has <5% AcNi, is pH 3 and is particle free. Mix the samples in the appropriate ratio (light/intermediate/heavy) to make them nLCMS ready.
Sample preparation for proteomics by MS [email protected], Laboratory of Biochemistry, Wageningen UR Biochemistry Lab.
13
5.2 Absolute quantitation
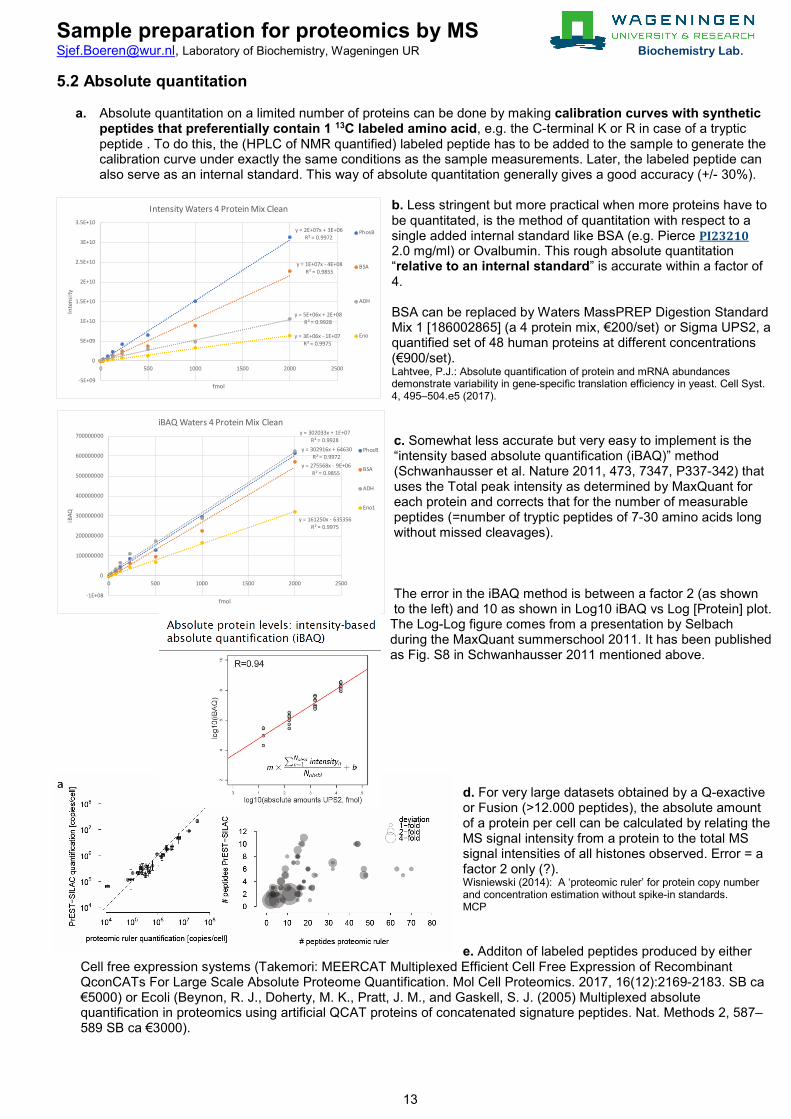
a. Absolute quantitation on a limited number of proteins can be done by making calibration curves with synthetic peptides that preferentially contain 1 13C labeled amino acid, e.g. the C-terminal K or R in case of a tryptic peptide . To do this, the (HPLC of NMR quantified) labeled peptide has to be added to the sample to generate the calibration curve under exactly the same conditions as the sample measurements. Later, the labeled peptide can also serve as an internal standard. This way of absolute quantitation generally gives a good accuracy (+/- 30%).
b. Less stringent but more practical when more proteins have to be quantitated, is the method of quantitation with respect to a single added internal standard like BSA (e.g. Pierce PI23210 2.0 mg/ml) or Ovalbumin. This rough absolute quantitation “relative to an internal standard” is accurate within a factor of 4. BSA can be replaced by Waters MassPREP Digestion Standard Mix 1 [186002865] (a 4 protein mix, €200/set) or Sigma UPS2, a quantified set of 48 human proteins at different concentrations (€900/set). Lahtvee, P.J.: Absolute quantification of protein and mRNA abundances demonstrate variability in gene-specific translation efficiency in yeast. Cell Syst. 4, 495–504.e5 (2017). c. Somewhat less accurate but very easy to implement is the “intensity based absolute quantification (iBAQ)” method (Schwanhausser et al. Nature 2011, 473, 7347, P337-342) that uses the Total peak intensity as determined by MaxQuant for each protein and corrects that for the number of measurable peptides (=number of tryptic peptides of 7-30 amino acids long without missed cleavages). The error in the iBAQ method is between a factor 2 (as shown to the left) and 10 as shown in Log10 iBAQ vs Log [Protein] plot. The Log-Log figure comes from a presentation by Selbach during the MaxQuant summerschool 2011. It has been published as Fig. S8 in Schwanhausser 2011 mentioned above.
d. For very large datasets obtained by a Q-exactive or Fusion (>12.000 peptides), the absolute amount of a protein per cell can be calculated by relating the MS signal intensity from a protein to the total MS signal intensities of all histones observed. Error = a factor 2 only (?). Wisniewski (2014): A ‘proteomic ruler’ for protein copy number and concentration estimation without spike-in standards. MCP e. Additon of labeled peptides produced by either
Cell free expression systems (Takemori: MEERCAT Multiplexed Efficient Cell Free Expression of Recombinant QconCATs For Large Scale Absolute Proteome Quantification. Mol Cell Proteomics. 2017, 16(12):2169-2183. SB ca €5000) or Ecoli (Beynon, R. J., Doherty, M. K., Pratt, J. M., and Gaskell, S. J. (2005) Multiplexed absolute quantification in proteomics using artificial QCAT proteins of concatenated signature peptides. Nat. Methods 2, 587–589 SB ca €3000).
y = 2E+07x + 3E+06R² = 0.9972
y = 1E+07x - 4E+08R² = 0.9855
y = 5E+06x + 2E+08R² = 0.9928
y = 3E+06x - 1E+07R² = 0.9975
-5E+09
0
5E+09
1E+10
1.5E+10
2E+10
2.5E+10
3E+10
3.5E+10
0 500 1000 1500 2000 2500
Inte
nsity
fmol
Intensity Waters 4 Protein Mix Clean
PhosB
BSA
ADH
Eno
y = 302916x + 64630R² = 0.9972
y = 275568x - 9E+06R² = 0.9855
y = 302033x + 1E+07R² = 0.9928
y = 161250x - 635356R² = 0.9975
-1E+08
0
100000000
200000000
300000000
400000000
500000000
600000000
700000000
0 500 1000 1500 2000 2500
iBAQ
fmol
iBAQ Waters 4 Protein Mix Clean
PhosB
BSA
ADH
Eno1
Sample preparation for proteomics by MS [email protected], Laboratory of Biochemistry, Wageningen UR Biochemistry Lab.
14
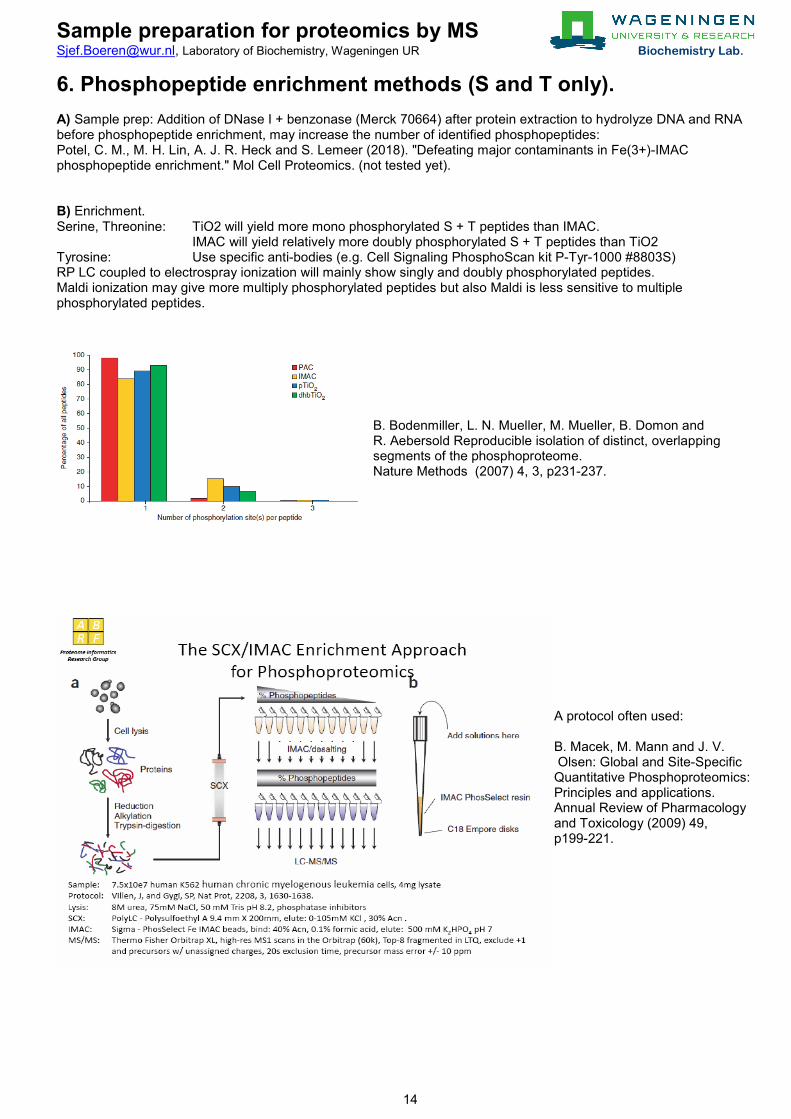
6. Phosphopeptide enrichment methods (S and T only). A) Sample prep: Addition of DNase I + benzonase (Merck 70664) after protein extraction to hydrolyze DNA and RNA before phosphopeptide enrichment, may increase the number of identified phosphopeptides: Potel, C. M., M. H. Lin, A. J. R. Heck and S. Lemeer (2018). "Defeating major contaminants in Fe(3+)-IMAC phosphopeptide enrichment." Mol Cell Proteomics. (not tested yet). B) Enrichment. Serine, Threonine: TiO2 will yield more mono phosphorylated S + T peptides than IMAC.
IMAC will yield relatively more doubly phosphorylated S + T peptides than TiO2 Tyrosine: Use specific anti-bodies (e.g. Cell Signaling PhosphoScan kit P-Tyr-1000 #8803S) RP LC coupled to electrospray ionization will mainly show singly and doubly phosphorylated peptides. Maldi ionization may give more multiply phosphorylated peptides but also Maldi is less sensitive to multiple phosphorylated peptides.
B. Bodenmiller, L. N. Mueller, M. Mueller, B. Domon and R. Aebersold Reproducible isolation of distinct, overlapping segments of the phosphoproteome. Nature Methods (2007) 4, 3, p231-237.
A protocol often used: B. Macek, M. Mann and J. V. Olsen: Global and Site-Specific Quantitative Phosphoproteomics: Principles and applications. Annual Review of Pharmacology and Toxicology (2009) 49, p199-221.
Sample preparation for proteomics by MS [email protected], Laboratory of Biochemistry, Wageningen UR Biochemistry Lab.
15
6.1 Phosphopeptides (S, T) enrichment by Titanium Dioxide (TiO2) Chromatography. 6.1.1. Enrichment with normal TiO2 in uColumns. Aryal, U. K. and A. R. S. Ross (2010). "Enrichment and analysis of phosphopeptides under different experimental conditions using titanium dioxide affinity chromatography and mass spectrometry." Rapid Communications in Mass Spectrometry 24(2): 219-231. Zhou, H. J., T. Y. Low, M. L. Hennrich, H. van der Toorn, T. Schwend, H. F. Zou, S. Mohammed and A. J. R. Heck (2011). "Enhancing the Identification of Phosphopeptides from Putative Basophilic Kinase Substrates Using Ti (IV) Based IMAC Enrichment." Molecular & Cellular Proteomics 10(10). Humphrey, S. J., S. B. Azimifar and M. Mann (2015). "High-throughput phosphoproteomics reveals in vivo insulin signaling dynamics." Nat Biotechnol 33(9): 990-995. Modified procedure: 1. To 90 ul of the centrifuged digested peptide solution (Mix after each addition): 2. Add 10 μL TriFluoroEthanol 3. Add: 114 μL Acetonitril samples may become slightly turbid 4. Add: 14 μL TriFluoroAcetic acid 50% ACN, 6% TFA 5. Mix peptide solutions at room temperature for 1 min in a ThermoMixer at 300 rpm. 6. Centrifuge at high speed (≥16,000 xg for 15 min). 7. Prepare ca 5 mm uColumns with 10 ul TiO2 beads slurry (50% beads in 100% MeOH, GL Sciences #5010-21315)
pipetted into 200 ul AcNi using a 200 ul tip fitted with a C8 filter. With 5 mg TiO2 beads you can use 25 to 50 ug of peptide solution te be enriched.
8. Wash the TiO2 column with 100 ul ultrapure AcNi (e.g. HPLC gradient grade). 9. Equilibrate the TiO2 column with 200 ul Loading buffer (80% ACN, 6% TFA). 10. Add sample to the TiO2 column and slowly elute in 5 min at 18 bar Hg. 11. Non-specifically bound peptides are washed from the TiO2 beads with: 12. 1* 200 ul Loading buffer (80% ACN, 6% TFA) and 13. 2* 200 μL Wash buffer (60% ACN, 1% TFA). In the last step, elute until the column runs just dry. 14. Elute Phosphopeptides into low-binding tubes slowly with 50 μL Elution buffer (40% ACN, 15% NH4OH (25%, HPLC
grade) added, prepare immediately before use). Pulsed (20 ul, 30 ul) with 5’ on shaker in between pulses. 15. Concentrate samples in a concentrator for 30 min at 45°C. 16. Add 10 μL 10% TFA or more until the samples are acidic. 17. Perform the general C18 uColumn cleanup as in 1.7. 6.1.2. Enrichment with magnetic Ti4+ beads Vu, L. D., E. Stes, M. Van Bel, H. Nelissen, D. Maddelein, D. Inze, F. Coppens, L. Martens, K. Gevaert and I. De Smet (2016). "Up-to-Date Workflow for Plant (Phospho)proteomics Identifies Differential Drought-Responsive Phosphorylation Events in Maize Leaves." J Proteome Res. Alternatively use a magnetic resin for more convenient phosphopeptide enrichment. Here a MagReSyn Ti-IMAC microspheres (ReSyn Biosciences) is used which is stable for 6 months when kept cold. Beads can be obtained from Mark Roosjen who tested this method.
1. Mix the beads thoroughly and pipet 50 ul = 1 mg of MagReSyn Ti-IMAC microspheres (ReSyn Biosciences) into a 2 ml low binding ep. Clear the suspension by putting it on the magnet and remove the supernatant.
2. Wash the beads with 200 μl of 70% ethanol, and remove the sup. 3. Just before loading with sample, wash the beads with 100 ul of loading solvent (80% acetonitrile, 5% TFA).
Remove the sup. 4. Dissolve the desalted and dried trypsin phosphopeptides containing digest into 100 μL of loading solvent (80%
acetonitrile, 5% TFA). 5. Incubated with 1 mg of MagReSyn Ti-IMAC washed and equilibrated beads for 20 min at room temperature. 6. Wash once with 100 ul wash solvent 1 (80% acetonitrile, 1% TFA, 200 mM NaCl). 7. Wash twice with solvent 2 (80% acetonitrile, 1% TFA). 8. Elute the bound phosphopeptides with 80 μL of a fresh 1% NH4OH solution. 9. Immediately acidify the eluate to pH ca 3 with 10% TFA. Check the pH by putting 0.1 ul on a piece of pH paper.
Sample preparation for proteomics by MS [email protected], Laboratory of Biochemistry, Wageningen UR Biochemistry Lab.
16
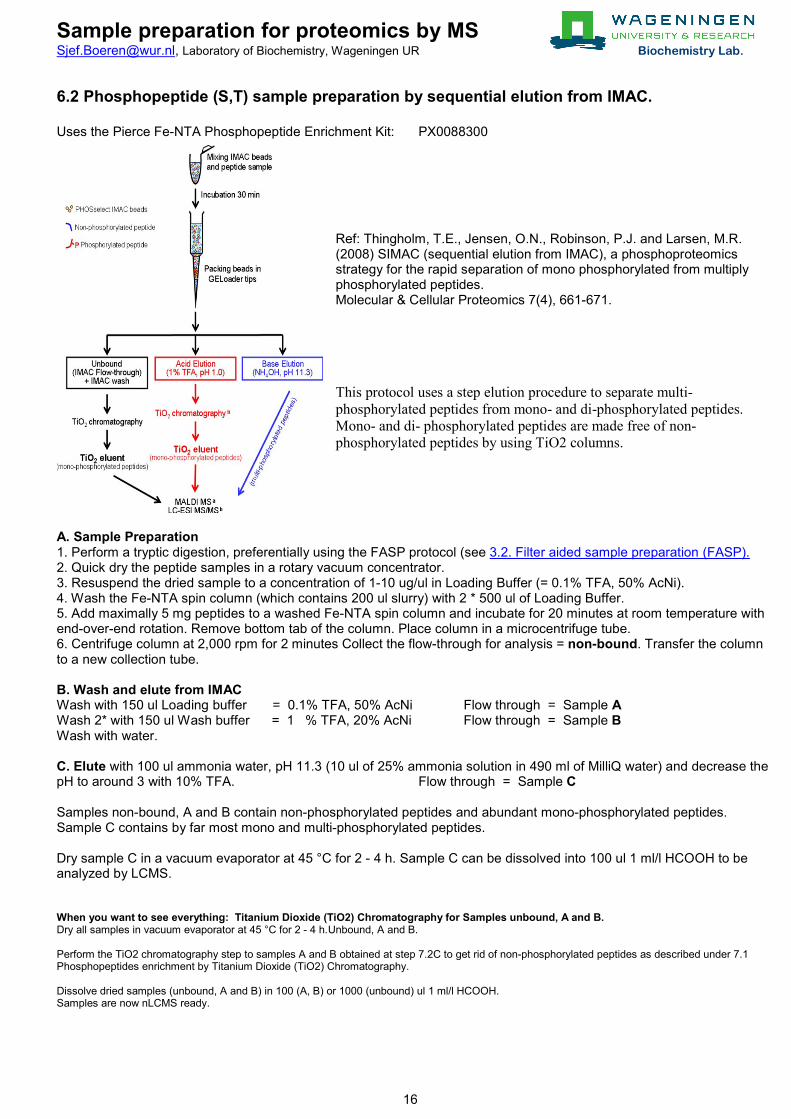
6.2 Phosphopeptide (S,T) sample preparation by sequential elution from IMAC. Uses the Pierce Fe-NTA Phosphopeptide Enrichment Kit: PX0088300
Ref: Thingholm, T.E., Jensen, O.N., Robinson, P.J. and Larsen, M.R. (2008) SIMAC (sequential elution from IMAC), a phosphoproteomics strategy for the rapid separation of mono phosphorylated from multiply phosphorylated peptides. Molecular & Cellular Proteomics 7(4), 661-671. This protocol uses a step elution procedure to separate multi-phosphorylated peptides from mono- and di-phosphorylated peptides. Mono- and di- phosphorylated peptides are made free of non- phosphorylated peptides by using TiO2 columns.
A. Sample Preparation 1. Perform a tryptic digestion, preferentially using the FASP protocol (see 3.2. Filter aided sample preparation (FASP). 2. Quick dry the peptide samples in a rotary vacuum concentrator. 3. Resuspend the dried sample to a concentration of 1-10 ug/ul in Loading Buffer (= 0.1% TFA, 50% AcNi). 4. Wash the Fe-NTA spin column (which contains 200 ul slurry) with 2 * 500 ul of Loading Buffer. 5. Add maximally 5 mg peptides to a washed Fe-NTA spin column and incubate for 20 minutes at room temperature with end-over-end rotation. Remove bottom tab of the column. Place column in a microcentrifuge tube. 6. Centrifuge column at 2,000 rpm for 2 minutes Collect the flow-through for analysis = non-bound. Transfer the column to a new collection tube. B. Wash and elute from IMAC Wash with 150 ul Loading buffer = 0.1% TFA, 50% AcNi Flow through = Sample A Wash 2* with 150 ul Wash buffer = 1 % TFA, 20% AcNi Flow through = Sample B Wash with water. C. Elute with 100 ul ammonia water, pH 11.3 (10 ul of 25% ammonia solution in 490 ml of MilliQ water) and decrease the pH to around 3 with 10% TFA. Flow through = Sample C Samples non-bound, A and B contain non-phosphorylated peptides and abundant mono-phosphorylated peptides. Sample C contains by far most mono and multi-phosphorylated peptides. Dry sample C in a vacuum evaporator at 45 °C for 2 - 4 h. Sample C can be dissolved into 100 ul 1 ml/l HCOOH to be analyzed by LCMS. When you want to see everything: Titanium Dioxide (TiO2) Chromatography for Samples unbound, A and B. Dry all samples in vacuum evaporator at 45 °C for 2 - 4 h. Unbound, A and B. Perform the TiO2 chromatography step to samples A and B obtained at step 7.2C to get rid of non-phosphorylated peptides as described under 7.1 Phosphopeptides enrichment by Titanium Dioxide (TiO2) Chromatography. Dissolve dried samples (unbound, A and B) in 100 (A, B) or 1000 (unbound) ul 1 ml/l HCOOH. Samples are now nLCMS ready.