Embed Size (px)
Citation preview

COVER SHEET
SEC Registration Number
C S 2 0 1 6 1 9 7 3 4
Company Name
C H E L S E A L O G I S T I C S H O L D I N G S
C O R P .
Principal Office (No./Street/Barangay/City/Town/Province)
S T E L L A H I Z O N R E Y E S R O A D ,
B O . P A M P A N G A , D A V A O C I T Y
P H I L I P P I N E S 8 0 0 0
Form Type Department requiring the report Secondary License Type, if applicable
1 7 - Q N A
COMPANY INFORMATION
Company’s Email Address Company’s Telephone Number/s Mobile Number
www.chelsealogistics.ph +632 403-4015 N/A
No. of Stockholders Annual Meeting
Month/Day Fiscal Year Month/Day
` Last Monday of March 12/31
CONTACT PERSON INFORMATION
The designated contact person MUST be an Officer of the Corporation
Name of Contact Person Email Address Telephone Number/s Mobile Number
IGNACIA S. BRAGA IV [email protected] +632 403-4015
Contact Person’s Address
26th Floor, Fort Legend Tower, 3rd Ave. corner 31st St., Bonifacio Global City 1634 Taguig City
Note: In case of death, resignation or cessation of office of the officer designated as contact person, such incident shall be reported to the Commission within thirty (30) calendar
days from the occurrence thereof with information and complete contact details of the new contact person designate

SECURITIES AND EXCHANGE COMMISSION
SEC FORM 17-Q
QUARTERLY REPORT PURSUANT TO SECTION 17 OF THE SECURITIES
REGULATION CODE AND SRC RULE 17(2)(b) THEREUNDER
1. For the quarterly period ended 31 March 2018
2. Commission identification number CS201619734
3. BIR Tax Identification No 009-393-167-000
4. Exact name of issuer as specified in its charter CHELSEA LOGISTICS HOLDINGS CORP.
5. Province, country or other jurisdiction of incorporation or organization Davao City, Philippines 6. Industry Classification Code: (SEC Use Only) 7. Address of issuer's principal office Postal Code
Stella Hizon Reyes Road, Bo. Pampanga, Davao City, Philippines 8000
8. Issuer's telephone number, including area code +63 82 224 5373
9. Former name, former address and former fiscal year, if changed since last report
Formerly CHELSEA LOGISTICS CORP. 10. Securities registered pursuant to Sections 8 and 12 of the Code, or Sections 4 and 8 of the RSA
Title of each class Number of shares outstanding
COMMON 1,821,977,615
Amount of debt outstanding: PHP11,643,319,347 11. Are any or all of the securities listed on a Stock Exchange? Yes [] No [ ]
If yes, state the name of such Stock Exchange and the class/es of securities listed therein:
PHILIPPINE STOCK EXCHANGE COMMON SHARES
12. Indicate by check mark whether the registrant:
(a) has filed all reports required to be filed by Section 17 of the Code and SRC Rule 17 thereunder or Sections 11 of the RSA and RSA Rule 11(a)-1 thereunder, and Sections 26 and 141 of the Corporation Code of the Philippines, during the preceding twelve (12) months (or for such shorter period the registrant was required to file such reports)
Yes [] No [ ] (b) has been subject to such filing requirements for the past ninety (90) days. Yes [] No [ ]

TABLE OF CONTENTS
PART I FINANCIAL INFORMATION
Item 1. Financial Statements 3
Item 2. Management’s Discussion and Analysis of Financial Condition and Results of Operations 85
PART II OTHER INFORMATION 91
SIGNATURES 92

March 31, December 31,
2018 2017
Notes (Unaudited) (Audited)
CURRENT ASSETS
Cash and cash equivalents 4 962,856,357 P 1,441,704,190 P
Trade and other receivables - net 5 1,202,401,012 876,420,381
Financial assets at fair value through
profit or loss 6 3,947,736 3,947,736
Inventories 7 296,381,669 184,863,983
Advances to related parties 20 2,806,673,000 2,488,434,793
Other current assets 8 2,607,242,182 1,926,336,910
Total Current Assets 7,879,501,956 6,921,707,993
NON-CURRENT ASSETS
Property and equipment - net 9 11,895,565,953 10,999,596,427
Investments in an associate and a joint venture 10 2,280,028,898 2,268,935,614
Goodwill 24 5,637,918,869 5,637,918,869
Post-employment benefit asset 17 8,147,831 8,190,054
(Amounts in Philippine Pesos)
A S S E T S
CHELSEA LOGISTICS HOLDINGS CORP. AND SUBSIDIARIES
(Formerly Chelsea Logistics Corp.)
(A Subsidiary of Udenna Corporation)
CONSOLIDATED STATEMENTS OF FINANCIAL POSITION
MARCH 31, 2018 AND DECEMBER 31, 2017
- 3 -
Post-employment benefit asset 17 8,147,831 8,190,054
Deferred tax assets 19 201,970,440 215,516,180
Other non-current assets - net 11 351,294,819 327,749,182
Total Non-current Assets 20,374,926,810 19,457,906,326
TOTAL ASSETS 28,254,428,766 P 26,379,614,319 P

March 31, December 31,
2018 2017
Notes (Unaudited) (Audited)
CURRENT LIABILITIES
Trade and other payables 13 1,727,142,865 P 1,380,849,406 P
Interest-bearing loans 12 5,002,537,287 3,434,490,978
Advances from related parties 20 1,144,901,912 1,040,772,152
Advances from customers 2 14,484,000 14,521,850
Deposits for future stock subscription 14 180,000,000 180,000,000
Income tax payable 84,998,221 50,809,743
Total Current Liabilities 8,154,064,285 6,101,444,129
NON-CURRENT LIABILITIES
Interest-bearing loans 12 6,640,782,060 6,897,669,657
Post-employment benefit obligation 17 36,588,880 36,588,880
Deferred tax liabilities - net 19 132,156,048 170,537,584
Other non-current liabilities 18,348,483 15,985,657
Total Non-current Liabilities 6,827,875,471 7,120,781,778
Total Liabilities 14,981,939,756 13,222,225,907
EQUITY
Capital stock 21 1,821,977,615 1,821,977,615
Additional paid-in capital 9,998,370,157 9,998,370,157
Revaluation reserves 21 1,408,423,382 1,429,917,004
LIABILITIES AND EQUITY
- 4 -
Revaluation reserves 21 1,408,423,382 1,429,917,004
Other reserves 21 1,058,033,280 )( 1,058,033,280 )(
Retained earnings 1,101,751,136 965,156,916
Total Equity 13,272,489,010 13,157,388,412
TOTAL LIABILITIES AND EQUITY 28,254,428,766 P 26,379,614,319 P
See Notes to Consolidated Financial Statements.

2018 2017
Notes (Unaudited) (Audited)
REVENUES
Passage 385,695,609 P 124,688,041
Charter fees 20 392,763,800 242,621,266
Freight 217,971,141 159,085,523
Tugboat fees 83,268,362 63,944,044
Rendering of services 73,508,804 363,431
Standby charges 20 18,159,361 19,692,086
Sale of goods 8,360,345 6,283,084
1,179,727,422 616,677,475
COST OF SALES AND SERVICES 15 758,670,669 448,661,948
GROSS PROFIT 421,056,753 168,015,527
OTHER OPERATING EXPENSES 16 173,887,237 69,629,221
OPERATING INCOME 247,169,516 98,386,306
OTHER INCOME (CHARGES) - Net
Finance costs 18 165,095,574 )( 105,338,139 )(
Share in net income of an associate 10 11,093,284 -
Finance income 18 1,614,316 1,904,713
CHELSEA LOGISTICS HOLDINGS CORP. AND SUBSIDIARIES
CONSOLIDATED STATEMENTS OF PROFIT OR LOSS
FOR THE THREE MONTHS ENDED MARCH 31, 2018 AND 2017
(Amounts in Philippine Pesos)
(Formerly Chelsea Logistics Corp.)
(A Subsidiary of Udenna Corporation)
- 5 -
P
Finance income 18 1,614,316 1,904,713
Gain on bargain purchase 2 - -
Other income 18 30,239,261 43,033,685
122,148,713 )( 60,399,741 )(
PROFIT BEFORE TAX 125,020,803 37,986,565
TAX EXPENSE 19 9,920,205 10,850,154
NET PROFIT 115,100,598 P 27,136,411 P
Earnings Per Share (Basic and Diluted) 22 0.06 P 0.05 P
See Notes to Consolidated Financial Statements.

2018 2017
Notes (Unaudited) (Audited)
NET PROFIT 115,100,598 P 27,136,411 P
OTHER COMPREHENSIVE INCOME (LOSS)
Items that will not be reclassified subsequently
to profit or loss:
Remeasurement of post-employment benefit obligation 17 - 1,930,731 )(
Tax income 19 - 579,219
Currency exchange differences on translating financial
statements of foreign operations 21 - 81,660 )(
Other Comprehensive Income - net of tax - 1,433,172 )(
TOTAL COMPREHENSIVE INCOME 115,100,598 P 25,703,239 P
See Notes to Consolidated Financial Statements.
(Amounts in Philippine Pesos)
FOR THE THREE MONTHS ENDED MARCH 31, 2018 AND 2017
CONSOLIDATED STATEMENTS OF COMPREHENSIVE INCOME
CHELSEA LOGISTICS HOLDINGS CORP. AND SUBSIDIARIES
- 6 -
(Formerly Chelsea Logistics Corp.)
(A Subsidiary of Udenna Corporation)

Additional paid-in Revaluation Other Retained
Note Capital Stock Capital Reserves Reserves Earnings Total
Balance at January 1, 2018 21 1,821,977,615 P 9,998,370,157 P 1,429,917,004 P 1,058,033,280 )( P 965,156,916 P 13,157,388,412 P
Issuance of shares during the period 10, 21 - - - - - -
Total comprehensive income for the period - - - - 115,100,598 115,100,598
Transfer of revaluation reserves through
depreciation, net of tax 21 - - 21,493,622 )( - 21,493,622 -
Balance at March 31, 2018 (Unaudited) 1,821,977,615 P 9,998,370,157 P 1,408,423,382 P 1,058,033,280 )( P 1,101,751,136 P 13,272,489,010 P
Balance at January 1, 2017 500,000,000 - 1,370,998,267 P 1,058,033,280 )( P 747,704,000 P 1,560,668,987 P
Issuance of shares during the period 21 775,384,615 5,272,615,385 - - - 6,048,000,000
Total comprehensive income for the period 1,433,172 )( - 27,136,411 25,703,239
Transfer of revaluation reserves through
depreciation, net of tax - - 6,780,434 )( - 6,780,434 -
CHELSEA LOGISTICS HOLDINGS CORP. AND SUBSIDIARIES
CONSOLIDATED STATEMENTS OF CHANGES IN EQUITY
FOR THE THREE MONTHS ENDED MARCH 31, 2018 AND 2017
(Amounts in Philippine Pesos)
- 7 -
(Formerly Chelsea Logistics Corp.)
(A Subsidiary of Udenna Corporation)
P PP
Balance at March 31, 2017 (Audited) 1,275,384,615 P 5,272,615,385 P 1,362,784,661 P 1,058,033,280 )( P 781,620,845 P 7,634,372,226 P
See Notes to Consolidated Financial Statements.

2018 2017
Notes (Unaudited) (Audited)
CASH FLOWS FROM OPERATING ACTIVITIES
Profit before tax 125,020,803 P 37,986,565 P
Adjustments for:
Depreciation and amortization 9, 11 224,013,404 166,406,676
Interest expense 18 130,306,595 86,801,327
Unrealized foreign currency loss - net 18 34,169,768 17,312,593
Share in net income of an associate 10 11,093,284 )( -
Interest income 18 1,614,316 )( 684,726 )(
Operating profit before working capital changes 500,802,970 307,822,435
Increase in trade and other receivables 325,980,631 )( 11,731,185 )(
Increase in inventories 111,517,686 )( 117,846,866 )(
Decrease (increase) in advances to related parties 318,238,207 )( 194,446,078
Increase in other current assets 681,426,800 )( 61,168,251 )(
Decrease in post-employment benefit asset 42,223 2,919,518
Decrease (increase) in other non-current assets 4,058,682 )( 8,369,089
Increase in trade and other payables 333,275,137 183,171,624
Decrease in advances from customers 37,850 )( -
Increase in other non-current liabilities 2,362,826 1,186,864
Cash generated from (used in) operations 604,776,700 )( 507,169,306
Interest received 1,614,316 684,726
Cash paid for income taxes 45,994 )( 75,923,029 )(
Net Cash From (Used in) Operating Activities 603,208,378 )( 431,931,003
CASH FLOWS FROM INVESTING ACTIVITIES
Acquisitions of property and equipment 9 1,066,750,760 )( 347,968,527 )(
Additions to drydocking costs 11 74,894,484 )( 22,341,186 )(
Proceeds from disposal of property and equipment 9 3,526,827 966,751
Additions to interest in a joint venture 10 - 5,000,000 )(
Net Cash Used in Investing Activities 1,138,118,417 )( 374,342,962 )(
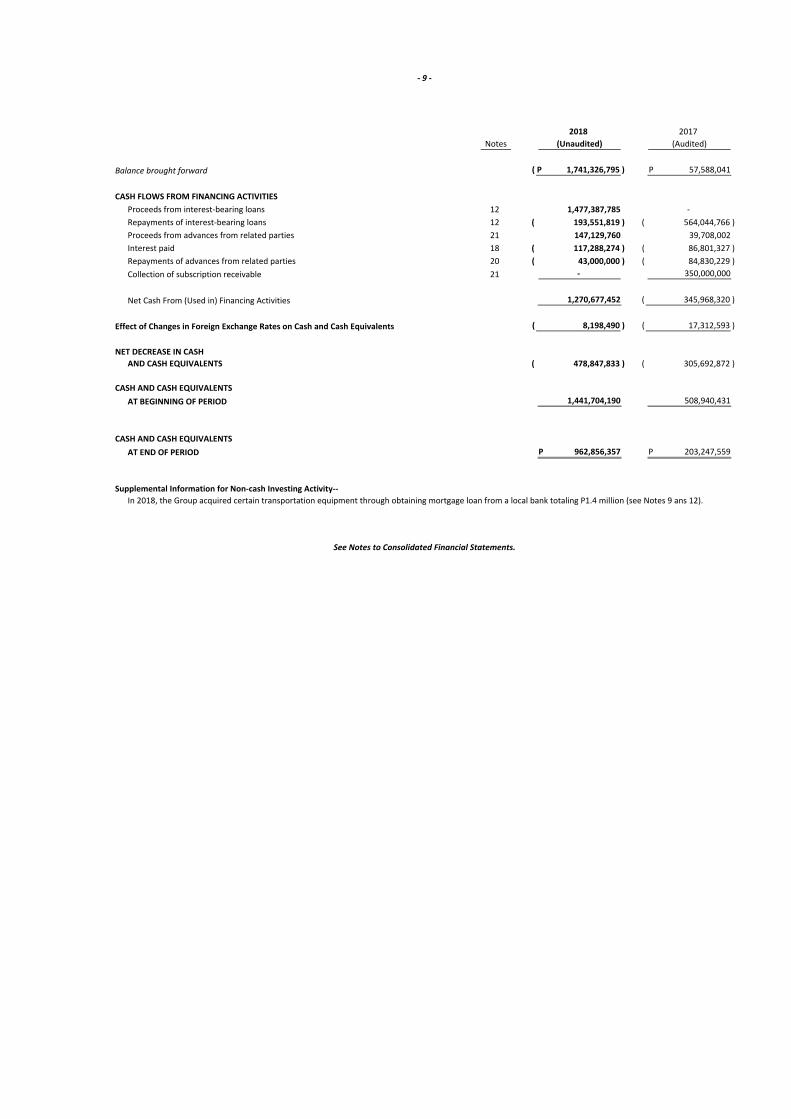
Balance carried forward 1,741,326,795 )( P 57,588,041 P
(Amounts in Philippine Pesos)
CHELSEA LOGISTICS HOLDINGS CORP. AND SUBSIDIARIES
CONSOLIDATED STATEMENT OF CASH FLOWS
FOR THE THREE MONTHS ENDED MARCH 31, 2018 AND 2017
(Formerly Chelsea Logistics Corp.)
(A Subsidiary of Udenna Corporation)
- 8 -
2018 2017
Notes (Unaudited) (Audited)
Balance brought forward 1,741,326,795 )( P 57,588,041 P
CASH FLOWS FROM FINANCING ACTIVITIES
Proceeds from interest-bearing loans 12 1,477,387,785 -
Repayments of interest-bearing loans 12 193,551,819 )( 564,044,766 )(
Proceeds from advances from related parties 21 147,129,760 39,708,002
Interest paid 18 117,288,274 )( 86,801,327 )(
Repayments of advances from related parties 20 43,000,000 )( 84,830,229 )(
Collection of subscription receivable 21 - 350,000,000
Net Cash From (Used in) Financing Activities 1,270,677,452 345,968,320 )(
Effect of Changes in Foreign Exchange Rates on Cash and Cash Equivalents 8,198,490 )( 17,312,593 )(
NET DECREASE IN CASH
AND CASH EQUIVALENTS 478,847,833 )( 305,692,872 )(
CASH AND CASH EQUIVALENTS
AT BEGINNING OF PERIOD 1,441,704,190 508,940,431
CASH AND CASH EQUIVALENTS
AT END OF PERIOD 962,856,357 P 203,247,559 P
Supplemental Information for Non-cash Investing Activity--
In 2018, the Group acquired certain transportation equipment through obtaining mortgage loan from a local bank totaling P1.4 million (see Notes 9 ans 12).
See Notes to Consolidated Financial Statements.
- 9 -

CHELSEA LOGISTICS HOLDINGS CORP. AND SUBSIDIARIES
(Formerly Chelsea Logistics Corp.)
(A Subsidiary of Udenna Corporation)
NOTES TO INTERIM CONSOLIDATED
FINANCIAL STATEMENTS
MARCH 31, 2018 AND DECEMBER 31, 2017
(Amounts in Philippine Pesos)
1. CORPORATE INFORMATION
1.1 Information and Operations
Chelsea Logistics Holdings Corp. (CLC or the Company) was incorporated and registered with the
Philippine Securities and Exchange Commission (SEC) as Chelsea Shipping Group Corp. on
August 26, 2016 primarily to subscribe for, invest and re-invest in, purchase, or otherwise
acquire, own, hold, use, sell, assign, transfer, mortgage, pledge, exchange, deal in and hold
investment or otherwise, any and all properties of every kind and description and wherever
situated, including but not limited to shares of stocks, bonds, debentures, notes, evidences of
indebtedness, promissory notes, or other securities or obligations, created, negotiated or issued
by any corporation, association, or other entity, including, but not limited to, securities in
corporations engaged in shipping and logistics.
On November 28, 2016 and May 12, 2017, the Company’s Board of Directors (BOD) and
stockholders approved the change in the corporate name of the Company from Chelsea
Shipping Group Corp. to Chelsea Logistics Corp. and from Chelsea Logistics Corp. to Chelsea
Logistics Holdings Corp., respectively, and for this purpose, to amend the Company’s Articles of
Incorporation and By-laws, which amendments were approved by the SEC on December 21,
2016 and June 27, 2017, respectively.
On August 8, 2017, the shares of stock of the Company were initially listed at the Philippine
Stock Exchange (PSE).
The Company is a subsidiary of Udenna Corporation (Udenna), a company primarily organized to
purchase, acquire, take over and manage all or any part of the rights, assets, business and
property; undertake and assume the liabilities of any person, firm, association, partnership,
syndicate of corporation; and to engage in the distribution, selling, importation, installation of
pollution control devices, units and services, and all other pollution control related products and
emission test servicing.
The registered office of the Company and Udenna, which is also their principal place of business,
is located at Stella Hizon Reyes Road, Bo. Pampanga, Davao City.
1.2 Subsidiaries and their Operations
As of December 31, the Company holds ownership interests in the following subsidiaries:
Explanatory Percentage of ownership
Subsidiaries Notes 2018 2017
Direct interest:
Chelsea Shipping Corporation (CSC) (a) 100% 100%
Trans-Asia Shipping Lines
Corporation (Trans-Asia) (b) 100% 100%
Udenna Investments B. V. (UIBV) (c) 100% 100%

- 11 -
Explanatory Percentage of ownership
Subsidiaries and associate Notes 2018 2017
Direct interest:
Starlite Ferries, Inc. (Starlite) (d) 100% 100%
Work-link Services, Inc. (WSI) (e) 100% 100%
Indirect interest:
Bunkers Manila, Inc. (BMI) 1
(f) 100% 100%
Michael, Inc. (MI) 1
(g) 100% 100%
PNX-Chelsea Shipping Corp.
(PNX-Chelsea) 1
(h) 100% 100%
Chelsea Ship Management & Marine
Services Corp. (CSMMSC) 1 (i) 100% 100%
Fortis Tugs Corporation (FTC) 1
(j) 100% 100%
Davao Gulf Marine Services, Inc.
(DGMSI) 2
(k) 100% 100%
Chelsea Marine Manpower
Resources, Inc. (CMMRI) 1
(l) 100% 100%
Chelsea Dockyard Corporation (CDC) 1
(m) 100% -
CD Ship Management & Marine
Services Corp. (CDSMMSC) 1 (n) 100% -
Quality Metals & Shipworks, Inc.
(QMSI) 3
(o) 100% 100%
Oceanstar Shipping, Inc (Oceanstar) 3
(p) 100% 100%
Dynamic Cuisine, Inc (DCI) 3
(q) 100% 100%
Starsy Shoppe, Inc. (SSI) 3
(r) 100% 100%
KGLI-NM Holdings, Inc. (KGLI-NM)
Preferred C shares (s) 80% 80%
1Wholly owned subsidiary of CSC
2Wholly owned subsidiary of FTC
3Wholly owned subsidiary of Trans-Asia
Except for UIBV, all the subsidiaries and associate were organized and incorporated in the
Philippines.
(a) Incorporated on July 17, 2006 and is engaged in the business of maritime trade through
conveyance, carriage, loading, transportation, discharging and storage of petroleum
products, goods and merchandise of every kind, over waterways in the Philippines.
(b) Incorporated on March 25, 1974 and is engaged in the transport of passengers and
cargoes within Philippine territorial waters and/or in the high seas.
(c) Incorporated on August 25, 1994 under the laws of the Netherlands, having its corporate
seat in Amsterdam, and is incorporated to participate in, to administer, to finance, to
conduct the management of and to render advice and services to other companies and
enterprises. UIBV is formerly known as KGL Investment B.V, a private company with
limited liability.
(d) Incorporated on August 25, 1994 and is primarily engaged in general business of
domestic shipping, to own and operate vessels of any class, type of description for
domestic trade, to charter in and out any such vessel.

- 12 -
(e) Incorporated on June 2, 1994 and is engaged in logistics services such as but not limited
to cargo freight forwarding (air, land & sea), cargo consolidation, courier services,
distribution, trucking, warehousing, customs brokerage, packing and crafting, etc.
(f) Incorporated on March 7, 2000 and is established to serve the growing demand of marine
fuel (bunker) of foreign vessels calling on the ports of the Philippines and hauling of
marine fuel and petroleum products for major oil companies.
(g) Incorporated on December 26, 1957 and is engaged in the business of acquiring and
operating floating equipment for charter or hire and for the conveyance and carriage of
goods, wares, and merchandise of every description in the Philippines coastwise traffic
without any fixed schedule.
(h) Incorporated on February 2, 2011 and is engaged in the ownership and operation of
vessels for domestic trade for the purpose of conveyance or carriage of petroleum
products, goods, wares and merchandise of every kind and description.
(i) Incorporated on March 30, 2012 and is engaged in the business of ship management and
to act as agent, broker, ship handler or representative of foreign/domestic shipping
corporations and individuals for the purpose of managing, operating, supervising,
administering and developing the operation of vessels.
(j) Incorporated on April 8, 2013 and is engaged in the towage and salvage of marine vessels
and other crafts including their cargoes upon seas, lakes, rivers, canals, bays, harbours,
and other waterways between the various ports of the Philippines.
(k) Incorporated on January 18, 2012 and is engaged in, operates, conducts, and provides tug
and marine services to all vessels, foreign or coastwise that dock and undock in the
District Port of Davao and all other ports in the Philippines.
On December 15, 2016, FTC acquired 100% of the outstanding capital stock of DGMSI, a
Davao-based tug service provider.
(l) Incorporated on June 9, 2016 and is primarily engaged in the business of providing full
and partial crewing for domestic and foreign vessels, to act as the authorized
representative and crew manager of shipping companies, and to provide allied maritime
services for said vessels and companies.
(m) Incorporated on January 8, 2018 and is engaged in the general business of building and
repair of ships, boats and other kinds of vessels as well as in ship breaking activities.
(n) Incorporated on March 14, 2018 and is engaged to carry on the business of ship
management and to act as agent, broker, ship chandler or representative of
foreign/domestic shipping corporations and individuals for the purpose of managing,
operating, supervising, administering and developing the operation of vessels belonging
to or which are or may be leased or operated by said shipping corporations and
individuals and for such purpose, to act as principal in and hire the services of a local
manning agent for the overseas employment for seamen, and to equip any and all kinds
of ships, barges and vessels of every class and description owned by any shipping
corporation.
(o) Incorporated on November 28, 2007 and is engaged in machining and mechanical works
on ship machineries and industrial plants.

- 13 -
(p) Incorporated on July 6, 2006 primarily to engage in the business of domestic shipping for
the transportation of passengers and cargoes with territorial waters and/or in the high
seas and is presently engaged in the charter or lease of maritime vessels.
(q) Incorporated on June 21, 2000 primarily to establish and maintain restaurant, coffee
shops, refreshment parlors, cocktail lounges and cater goods, drinks, refreshments and
other food commonly served in such establishments.
(r) Incorporated on March 31, 2005 and is engaged in the purchase of all kinds of food and
beverage products and merchandise, except rice and corn, locally and/or through
importation for purposes of selling the same on retail or wholesale, either local and/or
through importation.
(s) Organized under Philippines laws and registered with SEC on August 8, 2008 as an
investment holding company.
UIBV owns 80% economic interest and 39.97% of the voting rights in KGLI-NM, which
holds 39.85% economic interest in and owns 60% of the voting stock in Negros Navigation
Co., Inc. (Nenaco). Nenaco, in turn, owns 88.31% of 2GO Group, Inc. (2GO). Hence, CLC
has a 28.15% indirect economic interest in 2GO.
CLC together with CSC, Trans-Asia, UIBV, Starlite, WSI and their respective subsidiaries are
collectively referred herein as the Group.
1.3 Approval of Interim Consolidated Financial Statements
The interim consolidated financial statements of the Group as of and for the three months
ended March 31, 2018 (including the comparative consolidated financial statements as of
December 31, 2017 and for the three months ended March 31, 2017) were authorized for issue
by the Company’s BOD on May 7, 2018.
2. SUMMARY OF SIGNIFICANT ACCOUNTING POLICIES
These interim consolidated financial statements are presented in accordance with Philippine
Accounting Standards (PAS) 34, Interim Financial Reporting. As allowed under PAS 34, the
Company has opted to present a complete set of financial statements in conformity with PAS 1,
Presentation of Financial Statements.
The significant accounting policies that have been used in the preparation of these interim
consolidated financial statements are summarized below and in the succeeding pages. These
policies have been consistently applied to all the periods presented, unless otherwise stated.
2.1 Basis of Preparation of Interim consolidated financial Statements
(a) Statement of Compliance with Philippine Financial Reporting Standards
The interim consolidated financial statements of the Group have been prepared in
accordance with Philippine Financial Reporting Standards (PFRS). PFRS are adopted by
the Financial Reporting Standards Council (FRSC) from the pronouncements issued by the
International Accounting Standards Board and approved by the Philippine Board of
Accountancy.

- 14 -
The interim consolidated financial statements have been prepared using the
measurement bases specified by PFRS for each type of asset, liability, income and
expense. The measurement bases are more fully described in the accounting policies that
follow.
(b) Presentation of Interim consolidated financial Statements
The interim consolidated financial statements are presented in accordance with PAS 1.
The Group presents a interim consolidated statement of comprehensive income separate
from the consolidated statement of profit or loss.
The interim consolidated financial statements presented consist of consolidated balances
of the Group as of and for the three months ended March 31, 2018 (including the
comparative consolidated financial statements as of December 31, 2017 and for the three
months ended March 31, 2017).
(c) Functional and Presentation Currency
These interim consolidated financial statements are presented in Philippine pesos, the
Company’s functional and presentation currency, and all values represent absolute
amounts except when otherwise indicated.
Items included in the interim consolidated financial statements of the Group are
measured using the Company’s functional currency. Functional currency is the currency
of the primary economic environment in which the Group operates.
2.2 Adoption of New and Amended PFRS
(a) Effective in 2018 that are Relevant to the Group
The Group adopted for the first time the following amendments and annual
improvements to PFRS, which are mandatorily effective for annual periods beginning on
or after January 1, 2017:
PFRS 9 (2014) : Financial Instruments
PAS 15 : Revenue from Contract with Customers
IFRIC 22 : Revenue from Contract with Customers
: Foreign Currency Transactions and Advance
Consideration - Interpretation on Foreign
Currency Transactions and Advance
Consideration
Annual Improvements : Annual Improvements to PFRS (2014-2016 Cycle)
PAS 28 (Amendments) Investments in
Associates and Joint Ventures – Measuring an
Associate or Joint Venture at Fair Value

- 15 -
Discussed below are the relevant information about these amendments.
(i) PFRS 9 (2014), Financial Instruments. This new standard on financial instruments will
eventually replace PAS 39, Financial Instruments: Recognition and Measurement, and
PFRS 9 (2009, 2010 and 2013 versions). This standard contains, among others, the
following:
three principal classification categories for financial assets based on the business
model on how an entity is managing its financial instruments;
an expected loss model in determining impairment of all financial assets that are
not measured at fair value through profit or loss (FVTPL), which generally depends
on whether there has been a significant increase in credit risk since initial
recognition of a financial asset; and,
a new model on hedge accounting that provides significant improvements
principally by aligning hedge accounting more closely with the risk management
activities undertaken by entities when hedging their financial and non-financial
risk exposures.
In accordance with the financial asset classification principle of PFRS 9 (2014), a
financial asset is classified and measured at amortized cost if the asset is held within a
business model whose objective is to hold financial assets in order to collect the
contractual cash flows that represent solely payments of principal and interest (SPPI)
on the principal outstanding. Moreover, a financial asset is classified and
subsequently measured at fair value through other comprehensive income if it meets
the SPPI criterion and is held in a business model whose objective is achieved by both
collecting contractual cash flows and selling the financial assets. All other financial
assets are measured at FVTPL.
In addition, PFRS 9 (2014) allows entities to make an irrevocable election to present
subsequent changes in the fair value of an equity instrument that is not held for
trading in other comprehensive income.
The accounting for embedded derivatives in host contracts that are financial assets is
simplified by removing the requirement to consider whether or not they are closely
related, and, in most arrangements, does not require separation from the host
contract.
For liabilities, the standard retains most of the PAS 39 requirements which include
amortized cost accounting for most financial liabilities, with bifurcation of embedded
derivatives. The amendment also requires changes in the fair value of an entity’s own
debt instruments caused by changes in its own credit quality to be recognized in other
comprehensive income rather than in profit or loss.
- 16 -
(ii) PFRS 15, Revenue from Contract with Customers. This standard will replace PAS 18,
Revenue, and PAS 11, Construction Contracts, the related Interpretations on revenue
recognition: International Financial Reporting Interpretations Committee (IFRIC) 13,
Customer Loyalty Programmes, IFRIC 15, Agreement for the Construction of Real
Estate, IFRIC 18, Transfers of Assets from Customers and Standing Interpretations
Committee 31, Revenue – Barter Transactions Involving Advertising Services. This new
standard establishes a comprehensive framework for determining when to recognize
revenue and how much revenue to recognize. The core principle in the said
framework is for an entity to recognize revenue to depict the transfer of promised
goods or services to the customer in an amount that reflects the consideration to
which the entity expects to be entitled in exchange for those goods or services.
(iii) IFRIC 22, Foreign Currency Transactions and Advance Consideration - Interpretation on
Foreign Currency Transactions and Advance Consideration. The interpretation
provides more detailed guidance on how to account for transactions that include the
receipt or payment of advance consideration in a foreign currency. The interpretation
states that the date of the transaction, for the purpose of determining the exchange
rate, is the date of initial recognition of the non-monetary asset (arising from advance
payment) or liability (arising from advance receipt). If there are multiple payments or
receipts in advance, a date of transaction is established for each payment or receipt.
(iv) Annual Improvements to PFRS 2014 - 2016 Cycle. PAS 28 (Amendments), Investments
in Associates and Joint Ventures – Measuring an Associate or Joint Venture at Fair
Value. The amendments clarify that the option for venture capital organization,
mutual funds and other similar entities to elect the fair value through profit or loss
classification in measuring investments in associates and joint ventures shall be made
at initial recognition, separately for each associate or joint venture.
(b) Effective Subsequent to 2018 but not Adopted Early
There are new PFRS, amendments and interpretations to existing standards effective for
annual periods subsequent to 2018, which are adopted by the FRSC. Management will
adopt the following relevant pronouncements in accordance with their transitional
provisions; and, unless otherwise stated, none of these are expected to have significant
impact on the Group’s interim consolidated financial statements:
(v) PAS 28 (Amendments), Investment in Associates and Joint Ventures – Long-term
Interests in Associates and Joint Ventures (effective from January 1, 2019). The
amendments clarify that the scope exclusion in PFRS 9 (2014) applies only to
ownership interests accounted for using the equity method. Thus, the amendments
further clarify that long term interests in an associate or joint venture – to which the
equity method is not applied – must be accounted for under PFRS 9 (2014), which
shall also include long term interests that, in substance, form part of the entity’s net
investment in an associate or joint venture. Management is currently assessing the
impact of these new amendments in its interim consolidated financial statements.
(vi) PFRS 9 (Amendment), Financial Instruments – Prepayment Features with Negative
Compensation (effective from January 1, 2019). The amendment clarifies that
prepayment features with negative compensation attached to financial instruments
may still qualify under the SPPI test. As such, the financial assets containing
prepayment features with negative compensation may still be classified at amortized
cost or at FVTOCI. Management is currently assessing the impact of this amendment
in its interim consolidated financial statements.
- 17 -
(vii) PFRS 16, Leases (effective from January 1, 2019). This new standard on leases will
replace PAS 17, Leases, and three related interpretations. For lessees, it requires to
account for leases “on-balance sheet” by recognizing a “right-of-use” asset and a
lease liability. The lease liability is initially measured as the present value of future
lease payments. For this purpose, lease payments include fixed, non-cancellable
payments for lease elements, amounts due under residual value guarantees, certain
types of contingent payments and amounts due during optional periods to the extent
that extension is reasonably certain. In subsequent periods, the “right-of-use” asset is
accounted for similarly to a purchased asset and depreciated or amortized. The lease
liability is accounted for similar to a financial liability using the effective interest
method. However, the new standard provides important reliefs or exemptions for
short-term leases and leases of low value assets. If these exemptions are used, the
accounting is similar to operating lease accounting under PAS 17 where lease
payments are recognized as expenses on a straight-line basis over the lease term or
another systematic basis (if more representative of the pattern of the lessee’s
benefit).
For lessors, lease accounting is similar to PAS 17’s. In particular, the distinction
between finance and operating leases is retained. The definitions of each type of
lease, and the supporting indicators of a finance lease, are substantially the same as
PAS 17’s. The basic accounting mechanics are also similar, but with some different or
more explicit guidance in few areas. These include variable payments, sub-leases,
lease modifications, the treatment of initial direct costs and lessor disclosures.
Management is currently assessing the impact of this new standard in its interim
consolidated financial statements.
(viii) PFRS 10 (Amendments), Interim consolidated financial Statements, and PAS 28
(Amendments), Investments in Associates and Joint Ventures– Sale or Contribution of
Assets between an Investor and its Associates or Joint Venture (effective date deferred
indefinitely). The amendments to PFRS 10 require full recognition in the investor’s
financial statements of gains or losses arising on the sale or contribution of assets that
constitute a business as defined in PFRS 3, Business Combinations, between an
investor and its associate or joint venture. Accordingly, the partial recognition of
gains or losses (i.e., to the extent of the unrelated investor’s interests in an associate
or joint venture) only applies to those sale of contribution of assets that do not
constitute a business. Corresponding amendments have been made to PAS 28 to
reflect these changes. In addition, PAS 28 has been amended to clarify that when
determining whether assets that are sold or contributed constitute a business, an
entity shall consider whether the sale or contribution of those assets is part of
multiple arrangements that should be accounted for as a single transaction.

- 18 -
(ix) IFRIC 23, Uncertainty over Income Tax Treatments (effective from January 1, 2019).
The interpretation provides clarification on the determination of taxable profit, tax
bases, unused tax losses, unused tax credits, and tax rates when there is uncertainty
over income tax treatments. The core principle of the interpretation requires the
Group to consider the probability of the tax treatment being accepted by the tax
authority. When it is probable that the tax treatment will be accepted, the
determination of the taxable profit, tax bases, unused tax losses, unused tax credits,
and tax rates shall be on the basis of the accepted tax treatment. Otherwise, the
Group has to use the most likely amount or the expected value, depending on the
surrounding circumstances, in determining the tax accounts identified immediately
above. Management is currently assessing the impact of this interpretation in its
interim consolidated financial statements.
(x) Annual Improvements to PFRS 2015 - 2017 Cycle. Among the improvements, the
following amendments are relevant to the Group but had no material impact on the
Group’s interim consolidated financial statements as these amendments merely
clarify existing requirements:
PAS 12 (Amendments), Income Taxes – Tax Consequences of Dividends. The
amendments clarify that all income tax consequence of dividend payments
should be recognized in profit or loss.
PAS 23 (Amendments), Borrowing Costs – Eligibility for Capitalization. The
amendments clarify that when a specific borrowing remains outstanding after
the related qualifying asset is ready for its intended purpose, such borrowing
will then form part of an entity’s general borrowings used in calculating the
capitalization rate for capitalization purposes.
PFRS 3 (Amendments), Business Combinations and PFRS 11 (Amendments),
Joint Arrangements – Remeasurement of Previously Held Interests in a Joint
Operation. The amendments clarify that previously held interest in a joint
operation shall be remeasured when the Group obtains control of the
business. On the other hand, previously held interests in a joint operation
shall not be remeasured when the Group obtains joint control of the business.
2.3 Basis of Consolidation
The Group’s interim consolidated financial statements as of and for the three months ended
March 31, 2018 and December 31, 2017 comprise the accounts of the Company and its
subsidiaries as enumerated in Note 1.2, after the elimination of intercompany transactions. All
intercompany assets and liabilities, equity, income, expenses and cash flows relating to
transactions between entities under the Group are eliminated in full on consolidation.
Unrealized profits and losses from intercompany transactions that are recognized in assets are
also eliminated in full. Intercompany losses that indicate impairment are recognized in the
interim consolidated financial statements.
The financial statements of subsidiaries are prepared for the same reporting period as the
Company, using consistent accounting principles.

- 19 -
The Company accounts for its investments in subsidiaries, associate and joint venture as follows:
(a) Investments in Subsidiaries
Subsidiaries are entities (including structured entities) over which the Company has
control. The Company controls an entity when (i) it has power over the investee; (ii) it is
exposed, or has rights to, variable returns from its involvement with the entity; and,
(iii) has the ability to affect those returns through its power over the entity. Subsidiaries
are consolidated from the date the Company obtains control.
The Company reassesses whether or not it controls an entity if facts and circumstances
indicates that there are changes to one or more of the three elements of controls
indicated above. Accordingly, entities are deconsolidated from the date that control
ceases.
Except for acquisitions involving entities under common ownership, the acquisition
method is applied to account for acquired subsidiaries. This requires recognizing and
measuring the identifiable assets acquired, the liabilities assumed and any non-controlling
interest in the acquiree. The consideration transferred for the acquisition of a subsidiary
is the fair values of the assets transferred, the liabilities incurred to the former owners of
the acquiree and the equity interests issued by the Group, if any. The consideration
transferred also includes the fair value of any asset or liability resulting from a contingent
consideration arrangement. Acquisition-related costs are expensed as incurred and
subsequent change in the fair value of contingent consideration is recognized directly in
profit or loss.
Identifiable assets acquired and liabilities and contingent liabilities assumed in a business
combination are measured initially at their fair values at the acquisition date. On an
acquisition-by-acquisition basis, the Group recognizes any non-controlling interest in the
acquiree either at fair value or at the non-controlling interest’s proportionate share of the
recognized amounts of the acquiree’s identifiable net assets.
The excess of the consideration transferred, the amount of any non-controlling interest in
the acquiree and the acquisition-date fair value of any existing equity interest in the
acquiree over the acquisition-date fair value of identifiable net assets acquired is
recognized as goodwill. If the consideration transferred is less than the fair value of the
net assets of the subsidiary acquired in the case of a bargain purchase, the difference is
recognized directly in profit or loss (see Note 2.13).
(b) Investments in an Associate
An associate is an entity over which the Group is able to exert significant influence but not
control and which are neither subsidiaries nor interests in a joint venture. Investment in
an associate is initially recognized at cost and subsequently accounted for using the equity
method.
Acquired investment in an associate is subject to the purchase method. The purchase
method involves the recognition of the acquiree’s identifiable assets and liabilities,
including contingent liabilities, regardless of whether they were recorded in the financial
statements prior to acquisition. Goodwill represents the excess of acquisition cost over
the fair value of the Company’s share of the identifiable net assets of the acquiree at the
date of acquisition. Any goodwill or fair value adjustment attributable to the Company’s
share in the associate is included in the amount recognized as investment in an associate.

- 20 -
Impairment loss is provided when there is objective evidence that the investment in an
associate will not be recovered (see Note 2.19).
Changes resulting from other comprehensive income of the associate or items recognized
directly in the associate’s equity are recognized in other comprehensive income or equity
of the Group, as applicable. However, when the Company’s share of losses in an associate
equals or exceeds its interest in the associate, including any other unsecured receivables,
the Company does not recognize further losses, unless it has incurred obligations or made
payments on behalf of the associate. If the associate subsequently reports profits, the
investor resumes recognizing its share of those profits only after its share of the profits
exceeds the accumulated share of losses that has previously not been recognized.
Distributions received from the associates are accounted for as a reduction of the carrying
value of the investment.
(c) Investment in a Joint Venture
A joint venture pertains to a joint arrangement whereby the parties that have joint
control of the arrangement have rights to the net assets of the arrangement. A joint
venture entity pertains to an entity whose economic activities are controlled jointly by the
Group and by other venturers independent of the Group (joint venturers). Investment in
joint venture is accounted for under the equity method of accounting. Under this
method, on initial recognition the investment in joint venture is recognized at cost, and
the carrying amount is increased or decreased to recognize the investor’s share in the
profit or loss of the investee after the date of the acquisition. The investor’s share of the
investee’s profit or loss is recognized in the investor’s profit or loss. Distributions received
from an investee reduce the carrying amount of the investment. Adjustments to the
carrying amount may also be necessary for a change in the investor’s proportionate
interest in the investee arising from changes in the investee’s other comprehensive
income.
The investments in joint ventures are subject to impairment testing (see Note 2.19).
2.4 Segment Reporting
Operating segments are reported in a manner consistent with the internal reporting provided to
the Group’s Executive Committee, its chief operating decision-maker. The Executive Committee
is responsible for allocating resources and assessing performance of the operating segments.
In identifying its operating segments, management generally follows the Group’s products and
service lines as disclosed in Note 26, which represent the main products and services provided
by the Group.
Each of these operating segments is managed separately as each of these service lines requires
different technologies and other resources as well as marketing approaches. All intersegment
transfers are carried out at arm’s length prices.
The measurement policies the Group uses for segment reporting under PFRS 8, Operating
Segments, are the same as those used in its interim consolidated financial statements.
There have been no changes from prior periods in the measurement methods used to
determine reported segment profit or loss.

- 21 -
2.5 Financial Assets
Financial assets are recognized when the Group becomes a party to the contractual terms of the
financial instrument. For purposes of classifying financial assets, an instrument is considered as
an equity instrument if it is non-derivative and meets the definition of equity for the issuer in
accordance with the criteria of PAS 32, Financial Instruments: Disclosure. All other
non-derivative financial instruments are treated as debt instruments.
(a) Classification and Measurement of Financial Assets
Financial assets, other than those designated and effective as hedging instruments, are
classified into the following categories: financial assets at FVTPL, loans and receivables,
held-to-maturity investments and available-for-sale (AFS) financial assets. Financial assets
are assigned to the different categories by management on initial recognition, depending
on the purpose for which the investments were acquired.
Regular purchases and sales of financial assets are recognized on their trade date. All
financial assets that are not classified as at FVTPL are initially recognized at fair value plus
any directly attributable transaction costs. Financial assets carried at FVTPL are initially
recorded at fair value and the related transaction costs are recognized in profit or loss.
(i) Financial Assets at FVTPL
This category includes financial assets that are either classified as held for trading or
that meets certain conditions and are designated by the entity to be carried at fair
value through profit or loss upon initial recognition. All derivatives fall into this
category, except for those designated and effective as hedging instruments. Assets in
this category are classified as current if they are either held for trading or are
expected to be realized within 12 months from the end of each reporting period.
Financial assets at FVTPL are measured at fair value, and changes therein are
recognized in profit or loss. Financial assets (except derivatives and financial
instruments originally designated as financial assets at fair value through profit or
loss) may be reclassified out of FVTPL category if they are no longer held for the
purpose of being sold or repurchased in the near term.
(ii) Loans and Receivables
Loans and receivables are non-derivative financial assets with fixed or determinable
payments that are not quoted in an active market. They arise when the Group
provides money, goods or services directly to a debtor with no intention of trading the
receivables. They are included in current assets, except for those with maturities
greater than 12 months after the end of each reporting period, which are classified as
non-current assets.
The Group’s financial assets categorized as loans and receivables are presented as
Cash and Cash Equivalents, Trade and Other Receivables (excluding Advances to
officers and employees), Subscription Receivables, Advances to Related Parties and
Security deposits and Restricted cash, presented as part of Other Current Assets and
Other Non-current Assets accounts, in the consolidated statement of financial
position. Cash and cash equivalents are defined as cash on hand, demand deposits
and short-term, highly liquid investments with original maturities of three months or
less, readily convertible to known amounts of cash and which are subject to
insignificant risk of changes in value.

- 22 -
Loans and receivables are subsequently measured at amortized cost using the
effective interest method, less impairment loss, if any.
(iii) AFS Financial Assets
This category includes non-derivative financial assets that are either designated to this
category or do not qualify for inclusion in any of the other categories of financial
assets. They are included in non-current assets presented as Available-for-sale
Financial Assets account in the consolidated statement of financial position unless
management intends to dispose of the investment within 12 months from the
reporting period. The Group’s AFS financial assets include equity securities.
All financial assets within this category are subsequently measured at fair value,
except for equity instruments that do not have a quoted market price in an active
market and whose fair value cannot be reliably measured which are measured at cost,
less impairment loss, if any. Gains and losses are recognized in other comprehensive
income, net of any income tax effects, and are reported as part of the Revaluation
Reserves account in equity, except for interest and dividend income, impairment
losses and foreign exchange differences on monetary assets, which are recognized in
profit or loss.
When the financial asset is disposed of or is determined to be impaired, that is, when
there is a significant or prolonged decline in the fair value of the security below its
cost, the cumulative fair value gains or losses recognized in other comprehensive
income is reclassified from equity to profit or loss and is presented as reclassification
adjustment within other comprehensive income even though the financial asset has
not been derecognized.
(b) Impairment of Financial Assets
The Group assesses at the end of each reporting period whether there is objective
evidence that a financial asset or group of financial assets is impaired. The Group
recognizes impairment loss based on the category of financial assets as follows:
(i) Carried at Amortized Cost – Loans and Receivables
Impairment loss is provided when there is objective evidence that the Group will not
be able to collect all amounts due to it in accordance with the original terms of the
agreement. If there is objective evidence that an impairment loss on loans and
receivables carried at amortized cost has been incurred, the amount of the
impairment loss is determined as the difference between the assets’ carrying amount
and the present value of estimated future cash flows (excluding future credit losses
that have not been incurred), discounted at the financial asset’s original effective
interest rate or current effective interest rate determined under the contract if the
loan has a variable interest rate.
The carrying amount of the asset shall be reduced either directly or through the use of
an allowance account. The amount of the loss shall be recognized in profit or loss.

- 23 -
If in a subsequent period, the amount of the impairment loss decreases and the
decrease can be related objectively to an event occurring after the impairment was
recognized (such as an improvement in the debtor’s credit rating), the previously
recognized impairment loss is reversed by adjusting the allowance account. The
reversal shall not result in a carrying amount of the financial asset that exceeds what
the amortized cost would have been had the impairment not been recognized at the
date the impairment is reversed. The amount of the reversal is recognized in profit or
loss.
(ii) Carried at Fair Value – AFS Financial Assets
When a decline in the fair value of an AFS financial asset has been recognized in other
comprehensive income and there is objective evidence that the asset is impaired, the
cumulative loss – measured as the difference between the acquisition cost (net of any
principal repayment and amortization) and current fair value, less any impairment
loss on that financial asset previously recognized in profit or loss – is reclassified from
Revaluation Reserves to profit or loss as a reclassification adjustment even though the
financial asset has not been derecognized.
Impairment losses recognized in profit or loss on equity instruments are not reversed
through profit or loss. Reversal of impairment losses are recognized in other
comprehensive income, except for financial assets that are debt securities which are
recognized in profit or loss only if the reversal can be objectively related to an event
occurring after the impairment loss was recognized.
(iii) Items of Income and Expenses Related to Financial Assets
All income and expenses, including impairment losses, relating to financial assets that
are recognized in profit or loss are presented as part of Finance income or Finance
costs account in the consolidated statement of profit or loss.
Non-compounding interest and other cash flows resulting from holding financial
assets are recognized in profit or loss when earned, regardless of how the related
carrying amount of financial assets is measured.
(iv) Derecognition of Financial Assets
The financial assets (or where applicable, a part of a financial asset or part of a group
of financial assets) are derecognized when the contractual rights to receive cash flows
from the financial instruments expire, or when the financial assets and all substantial
risks and rewards of ownership have been transferred to another party. If the Group
neither transfers nor retains substantially all the risks and rewards of ownership and
continues to control the transferred asset, the Group recognizes its retained interest
in the asset and an associated liability for amounts it may have to pay. If the Group
retains substantially all the risks and rewards of ownership of a transferred financial
asset, the Group continues to recognize the financial asset and also recognizes a
collateralized borrowing for the proceeds received.
2.6 Inventories
Inventories are carried at the lower of cost or net realizable value. Cost, which includes all costs
directly attributable to acquisitions, such as purchase price and other taxes that are not
subsequently recoverable from taxing authority is determined using the first-in, first-out
method.

- 24 -
Net realizable value is the estimated selling price in the ordinary course of business, less the
estimated costs necessary to make the sale. The net realizable value of fuel and spare parts
inventories is the current replacement cost.
2.7 Property and Equipment
Vessels are measured at fair value less accumulated depreciation and accumulated impairment
losses, if any. Land is measured at cost less any accumulated impairment losses. All other items
of property and equipment are stated at cost less accumulated depreciation, amortization and
any impairment in value.
The cost of an asset comprises its purchase price and directly attributable costs of bringing the
asset to working condition for its intended use. Expenditures for additions, major
improvements and renewals are capitalized while expenditures for repairs and maintenance are
charged to expense as incurred, except for periodic drydocking costs performed at least every
two periods on the vessel which are capitalized (see Note 2.8).
Following initial recognition at cost, vessels are carried at revalued amounts, which are the fair
values at the date of revaluations less subsequent accumulated depreciation and any
accumulated impairment losses.
Revalued amounts represent fair values determined based on appraisals performed by external
professional appraiser every after drydocking, which is done once every two periods. In
addition, appraisal of vessels is conducted more frequently if market factors indicate a material
change in fair value (see Note 29.4).
Any revaluation surplus is recognized in other comprehensive income and credited to the
Revaluation Reserves account in the consolidated statement of financial position. Any
revaluation deficit directly offsetting a previous surplus in the same asset is charged to other
comprehensive income to the extent of any revaluation surplus in equity relating to this asset
and the remaining deficit, if any, is recognized in profit or loss. Annually, an amount from the
Revaluation Reserves is transferred to Retained Earnings for the related depreciation relating to
the revaluation increment. Upon disposal of the revalued assets, amount included in
Revaluation Reserves is transferred to Retained Earnings.
Depreciation is computed on the straight-line basis over the estimated useful lives of the assets
as follows:
Vessels and vessel equipment 5 to 30 years
Building 20 years
Office furniture, fixtures and equipment 2 to 10 years
Transportation equipment 2 to 5 years
Building and leasehold improvements are amortized over the estimated useful lives of the
assets of five periods or the lease term, whichever is shorter.
Fully depreciated and fully amortized assets are retained in the accounts until they are no
longer in use and no further charge for depreciation and amortization is made in respect of
these assets.
Construction-in-progress (CIP) represents vessels and properties under construction and
on-going major repair works and is stated at cost. This includes cost of construction, applicable
borrowing costs (see Note 2.21) and other direct costs. The account is not depreciated until
such time that the assets are completed and available for use.

- 25 -
An asset’s carrying amount is written down immediately to its recoverable amount when the
asset’s carrying amount is greater than its estimated recoverable amount (see Note 2.19).
The residual values, estimated useful lives and method of depreciation and amortization of
property and equipment are reviewed, and adjusted, if appropriate, at the end of each
reporting period.
An item of property and equipment, including the related accumulated depreciation and
amortization and any impairment losses, is derecognized upon disposal or when no future
economic benefits are expected to arise from the continued use of the asset. Any gain or loss
arising on derecognition of the asset (calculated as the difference between the net disposal
proceeds and the carrying amount of the item) is included in profit or loss in the year the item is
derecognized.
2.8 Drydocking Costs
Drydocking costs are considered major repairs that preserve the life of the vessels. As an
industry practice, costs associated with drydocking are amortized on the straight-line basis over
two periods or until the next drydocking occurs, whichever comes earlier. When significant
drydocking expenditures occur prior to their expiry of this period, any remaining unamortized
balance of the original drydocking costs is expensed in the month of subsequent drydocking.
Amortization of drydocking costs starts only when the process has been completed and the
related vessel is ready for use.
The carrying amount of drydocking costs, presented as part of the Other Non-current Assets
account in the consolidated statement of financial position, is written down immediately to its
recoverable amount if the carrying amount is greater than its estimated recoverable amount
(see Note 2.19).
The carrying amount of drydocking costs is derecognized upon derecognition of the related
vessels. The computed gain or loss arising on derecognition of the vessel takes into
consideration the carrying amount of drydocking costs and is included in profit or loss in the
year the related vessel is derecognized (see Note 2.7).
2.9 Other Assets
Other current assets pertain to other resources controlled by the Group as a result of past
events. They are recognized in the interim consolidated financial statements when it is
probable that the future economic benefits will flow to the Group and the asset has a cost or
value that can be measured reliably.
Other recognized assets of similar nature, where future economic benefits are expected to flow
to the Group beyond one year after the end of the reporting period (or in the normal operating
cycle of the business, if longer), are classified as non-current assets.
2.10 Financial Liabilities
Financial liabilities, which include interest-bearing loans, trade and other payables [except
output value-added tax (VAT) and other tax-related liabilities], advances from related parties
and obligations under finance lease are recognized when the Group becomes a party to the
contractual terms of the instrument.

- 26 -
Interest-bearing loans are raised for support of the investing activities and working capital
requirements of the Group. Finance charges, including direct issue costs, are charged to profit
or loss, except for capitalized borrowing costs, on an accrual basis using the effective interest
method and are added to the carrying amount of the instrument to the extent that these are
not settled in the period in which they arise.
Interest charges that are attributable to the acquisition, construction or production of a
qualifying asset (i.e., an asset that takes a substantial period of time to get ready for its intended
use or sale) are capitalized as part of the cost of such asset (see Note 2.21). All other
interest-related charges incurred on a financial liability are recognized as an expense in the
consolidated statement of profit or loss.
Trade and other payables and advances from related parties are initially recognized at their fair
values and subsequently measured at amortized cost, using effective interest method for
maturities beyond one year, less settlement payments.
Obligations under finance lease are recognized at amounts equal to the fair value of the leased
property or, if lower, at the present value of the minimum lease payments, at the inception of
the lease (see Notes 2.17 and 24.2).
Financial liabilities are classified as current liabilities if payment is due to be settled within one
year or less after the reporting period (or in the normal operating cycle of the business, if
longer), or does not have an unconditional right to defer settlement of the liability for at least
12 months after the end of the reporting period. Otherwise, these are presented as
non-current liabilities.
Financial liabilities are derecognized from the consolidated statement of financial position only
when the obligations are extinguished either through discharge, cancellation or expiration. The
difference between the carrying amount of the financial liability derecognized and the
consideration paid or payable is recognized in profit or loss.
2.11 Deposits for Future Stock Subscriptions
Deposits for future stock subscription refer to the amount of money or property received by the
Group with the purpose of applying the same as payment for future issuance of stocks which
may or may not materialize. A company should not consider a deposit for stock subscription as
an equity instrument unless all of the following elements are present:
(i) There is a lack or insufficiency of authorized unissued shares of stock to cover the deposit;
(ii) The Group’s BOD and stockholders have approved an increase in capital stock to cover the
shares corresponding to the amount of the deposit; and,
(iii) An application for the approval of the increase in capital stock has been presented for
filing or filed with the SEC.
If any or all of the foregoing elements are not present, the transaction should be recognized as a
liability. The amount of deposits for future stock subscription will be reclassified to equity
accounts when the company meets the foregoing criteria.

- 27 -
2.12 Offsetting Financial Instruments
Financial assets and financial liabilities are offset and the resulting net amount, considered as a
single financial asset or financial liability, is reported in the consolidated statement of financial
position when the Group currently has legally enforceable right to set off the recognized
amounts and there is an intention to settle on a net basis, or realize the asset and settle the
liability simultaneously. The right of set-off must be available at the end of the reporting period,
that is, it is not contingent on future event. It must also be enforceable in the normal course of
business, in the event of default, and in the event of insolvency or bankruptcy; and must be
legally enforceable for both entity and all counterparties to the financial instruments.
2.13 Business Combinations
Business combination involving entities under common control are accounted for under the
pooling of interest method. Under this method, the assets and liabilities of the combining
entities are reflected in the interim consolidated financial statements at their carrying amounts.
No adjustments are made to reflect fair values, or recognize new assets and liabilities.
All other business combinations are accounted for using the acquisition method. The
acquisition method involves the recognition of the acquiree’s identifiable assets and liabilities,
including contingent liabilities, regardless of whether they are recorded in the interim
consolidated financial statements prior to acquisition. On initial recognition, the assets and
liabilities of the acquired subsidiary are included in the consolidated statement of financial
position at their fair values, which are also used as the bases for the subsequent measurement
in accordance with the Group’s accounting policies.
Goodwill represents the excess of the cost of an acquisition over the fair value of the Group’s
share of the net identifiable assets of the acquired subsidiary at the date of acquisition.
Subsequent to initial recognition, goodwill is measured at cost less any accumulated impairment
losses. Goodwill is tested annually for impairment and carried at cost less accumulated
impairment losses. Impairment losses on goodwill are not reversed (see Note 2.19).
Negative goodwill, which is the excess of the Group’s interest in the net fair value of net
identifiable assets acquired over acquisition costs, is charged directly to profit or loss.
For the purpose of impairment testing, goodwill is allocated to cash-generating units or groups
of cash-generating units that are expected to benefit from the business combination in which
the goodwill arose. The cash-generating units or groups of cash-generating units are identified
according to operating segment.
Gains and losses on the disposal of an interest in a subsidiary include the carrying amount of
goodwill relating to it.
If the business combination is achieved in stages, the acquirer is required to remeasure its
previously held equity interest in the acquiree at its acquisition-date fair value and recognize the
resulting gain or loss, if any, in profit or loss or other comprehensive income, as appropriate.
Any contingent consideration to be transferred by the Group is recognized at fair value at the
acquisition date. Subsequent changes to the fair value of the contingent consideration that is
deemed to be an asset or liability is recognized in accordance with PAS 37, Provisions,
Contingent Liabilities and Contingent Assets, either in profit or loss or as a change to other
comprehensive income. Contingent consideration that is classified as equity is not remeasured,
and its subsequent settlement is accounted for within equity.

- 28 -
2.14 Advances from Customers
Advances from customers are measured at the amount of cash received from the customers
and are derecognized once the related revenue transactions are consummated.
2.15 Provisions and Contingencies
Provisions are recognized when present obligations will probably lead to an outflow of
economic resources and they can be estimated reliably even if the timing or amount of the
outflow may still be uncertain. A present obligation arises from the presence of a legal or
constructive obligation that has resulted from past events.
Provisions are measured at the estimated expenditure required to settle the present obligation,
based on the most reliable evidence available at the end of the reporting period, including the
risks and uncertainties associated with the present obligation. Where there are a number of
similar obligations, the likelihood that an outflow will be required in settlement is determined
by considering the class of obligations as a whole. When time value of money is material,
long-term provisions are discounted to their present values using a pretax rate that reflects
market assessments and the risks specific to the obligation. The increase in the provision due to
passage of time is recognized as interest expense. Provisions are reviewed at the end of each
reporting period and adjusted to reflect the current best estimate.
In those cases where the possible outflow of economic resource as a result of present
obligations is considered improbable or remote, or the amount to be provided for cannot be
measured reliably, no liability is recognized in the financial statements. Similarly, possible
inflows of economic benefits to the Group that do not yet meet the recognition criteria of an
asset are considered contingent assets, hence, are not recognized in the interim consolidated
financial statements. On the other hand, any reimbursement that the Group can be virtually
certain to collect from a third party with respect to the obligation is recognized as a separate
asset not exceeding the amount of the related provision.
2.16 Revenue and Expense Recognition
Revenue comprises revenue from sale of goods and rendering of services measured by
reference to the fair value of consideration received or receivable by the Group for services
rendered, excluding VAT and discounts.
Revenue is recognized to the extent that the revenue can be reliably measured; it is probable
that future economic benefits will flow to the Group; and the costs incurred or to be incurred
can be measured reliably. In addition, the following specific recognition criteria must also be
met before revenue is recognized:
(a) Charter fees – Revenue, which consists mainly of charter income arising from the charter
hire of its vessels, is recognized based on the type of charter arrangement entered into,
either under a time charter (TC), a continuing voyage charter (CVC), or bareboat
agreement (BB) [see Note 3.1(a)]. Under a TC and BB, revenue is recognized based on the
terms of the contract, with the distinction that in a BB, no administration or technical
maintenance is included as part of the agreement. Under a CVC, revenue is recognized
upon completion of the voyage; however, appropriate accrual of revenue is made at the
end of the reporting period.
(b) Passage – Revenue is recognized upon completion of the route and is based on the
published tariff rates per passenger and route of the vessel.

- 29 -
(c) Freight – Revenue is recognized when services have been completed and is generally
based on a rate per cubic meter or weight of the cargo, whichever is higher, while rates
for containerized cargo are based on a fixed rate per container.
(d) Tugboat fees – Revenue, which consist of fees arising from docking, undocking, shifting,
towing, ferry services, tugboat usage and delivery services to marine vessels and other
crafts, is recognized upon the completion of contractually agreed services.
(e) Standby charges – Revenue is recognized upon failure of customer to utilize/dispatch the
tanker within the allotted lay-time initially agreed upon with the counterparty.
(f) Logistics services – Revenue is recognized when contractually-agreed tasks have been
substantially performed. Service fees are also recognized when cargoes are received by
either the shipper or consignee for export and import transactions.
(g) Sale of goods – Revenue is recognized when the risks and rewards of ownership of the
goods have passed to the buyer. This is generally when the customer has taken
undisputed delivery of goods.
(h) Rentals – Revenue from rentals arising from the short-term lease of office space is
recognized at the agreed rates over the lease term [see Note 2.17(b)].
(i) Interest – Revenue is recognized as the interest accrues taking into account the effective
yield on the asset.
Costs and expenses are recognized in profit or loss upon receipt of goods or utilization of the
service or at the date they are incurred. All finance costs are reported in profit or loss on an
accrual basis, except capitalized borrowing costs which are included as part of the cost of the
related qualifying asset (see Note 2.21).
2.17 Leases
The Group accounts for its leases as follows:
(a) Group as Lessee
Leases which transfer to the Group substantially all risks and benefits incidental to
ownership of the leased item are classified as finance leases and are recognized as assets
and liabilities in the statement of financial position at amounts equal to the fair value of
the leased property at the inception of the lease or, if lower, at the present value of
minimum lease payments. Lease payments are apportioned between the finance costs
and reduction of the lease liability so as to achieve a constant rate of interest on the
remaining balance of the liability.
Finance costs are recognized in profit or loss. Capitalized leased assets are depreciated
over the shorter of the estimated useful life of the asset or the lease term.
Finance lease obligations, net of finance charges, are presented as Obligations under
Finance Lease in the consolidated statement of financial position.
Leases, which do not transfer to the Group substantially all the risks and benefits of
ownership of the asset are classified as operating leases. Operating lease payments
(net of any incentive received from the lessor) are recognized as expense in profit or loss
on a straight-line basis over the lease term. Associated costs, such as maintenance and
insurance, are expensed as incurred.

- 30 -
(b) Group as Lessor
Leases, which do not transfer to the lessee substantially all the risks and benefits of
ownership of the asset are classified as operating leases. Lease income from
short-term operating lease is recognized at the agreed rates over the lease term
[see Note 2.16(h)].
The Group determines whether an arrangement is, or contains a lease based on the substance
of the arrangement. It makes an assessment of whether the fulfillment of the arrangement is
dependent on the use of a specific asset or assets and the arrangement conveys a right to use
the asset.
2.18 Functional Currency and Foreign Currency Transactions
(a) Transactions and Balances
The accounting records of the Group, except UIBV, are maintained in Philippine pesos.
Foreign currency transactions during the period are translated into the functional
currency at exchange rates which approximate those prevailing on transaction dates. The
accounting records of UIBV are maintained in United States (U.S.) dollar.
Foreign currency exchange gains and losses resulting from the settlement of such
transactions and from the translation at year-end exchange rates of monetary assets and
liabilities denominated in foreign currencies are recognized in the consolidated statement
of profit or loss as part of Finance Income or Finance Costs.
(b) Translation of Financial Statements of Foreign Subsidiary
The operating results and financial position of UIBV are translated to Philippine pesos, the
Group’s functional and presentation currency, as presented below.
(i) Assets and liabilities for each consolidated statement of financial position presented
are translated at the closing rate at the end of the reporting period;
(ii) Income and expenses for each profit or loss account are translated at average
exchange rates over the reporting period (unless this average is not a reasonable
approximation of the cumulative effect of the rates prevailing on the transaction
dates, in which case income and expenses are translated at the dates of the
transactions); and,
(iii) All resulting exchange differences are recognized as a separate component of other
comprehensive income under currency exchange differences on translating financial
statements of foreign operations, which is included under items that will be
reclassified subsequently to profit or loss.
When a foreign operation is partially disposed of or sold, such exchange differences are
recognized in the statement of comprehensive income as part of the gain or loss on sale.
Goodwill and fair value adjustments arising on the acquisition of a foreign entity are
treated as assets and liabilities of the foreign entity and translated at the closing rate.
The translation of the financial statements into Philippine peso should not be construed as
a representation that the U.S. dollar amounts could be converted into Philippine peso
amounts at the translation rates or at any other rates of exchange.

- 31 -
2.19 Impairment of Non-financial Assets
Goodwill is tested for impairment at least annually. All other non-financial assets are subject to
impairment testing whenever events or changes in circumstances indicate that the carrying
amount of those assets may not be recoverable.
For purposes of assessing impairment, assets are grouped at the lowest levels for which there
are separately identifiable cash flows (cash-generating units). As a result, assets are tested for
impairment either individually or at the cash-generating unit level.
Impairment loss is recognized in profit or loss for the amount by which the asset’s or
cash-generating unit’s carrying amount exceeds its recoverable amounts which is the higher of
its fair value less costs to sell and its value in use. In determining value in use, management
estimates the expected future cash flows from each cash-generating unit and determines the
suitable interest rate in order to calculate the present value of those cash flows. The data used
for impairment testing procedures are directly linked to the Group’s latest approved budget,
adjusted as necessary to exclude the effects of asset enhancements. Discount factors are
determined individually for each cash-generating unit and reflect management’s assessment of
respective risk profiles, such as market and asset-specific risk factors.
All assets are subsequently reassessed for indications that an impairment loss previously
recognized may no longer exist. Except for impairment losses on goodwill, an impairment loss is
reversed if the asset’s or cash generating unit’s recoverable amount exceeds its carrying
amount.
2.20 Employee Benefits
The Group provides post-employment benefits to employees through a defined benefit plan and
defined contribution plan, and other employee benefits which are recognized as follows:
(a) Post-employment Defined Benefit Plan
A defined benefit plan is a post-employment plan that defines an amount of
post-employment benefit that an employee will receive on retirement, usually dependent
on one or more factors such as age, periods of service and salary. The legal obligation for
any benefits from this kind of post-employment plan remains with the Group, even if plan
assets for funding the defined benefit plan have been acquired. Plan assets may include
assets specifically designated to a long-term benefit fund, as well as qualifying insurance
policies. The Group’s defined benefit post-employment plan covers all regular full-time
employees. The pension plan is tax-qualified, non-contributory and administered by a
trustee.
The liability or asset recognized in the consolidated statement of financial position for a
defined benefit plan is the present value of the defined benefit obligation less the fair
value of plan assets at the end of the reporting period. The defined benefit obligation is
calculated regularly by independent actuaries using the projected unit credit method. The
present value of the defined benefit obligation is determined by discounting the
estimated future cash outflows for expected benefit payments using a discount rate
derived from the interest rates of zero coupon government bonds as published by
Philippine Dealing & Exchange Corp., that are denominated in the currency in which the
benefits will be paid and that have terms to maturity approximating to the terms of the
related post-employment liability.

- 32 -
Remeasurements, comprising of actuarial gains and losses arising from experience
adjustments and changes in actuarial assumptions and the return on plan assets
(excluding amount included in net interest) are reflected immediately in the consolidated
statement of financial position with a charge or credit recognized in other comprehensive
income in the period in which they arise. Net interest is calculated by applying the
discount rate at the beginning of the period, taking account of any changes in the net
defined benefit liability or asset during the period as a result of contributions and benefit
payments. Net interest is reported as part of Finance costs or Finance income account in
the consolidated statement of profit and loss.
Past service costs are recognized immediately in profit or loss in the period of a plan
amendment and curtailment.
(b) Post-employment Defined Contribution Plan
A defined contribution plan is a post-employment plan under which the Group pays fixed
contributions into an independent entity. The Group has no legal or constructive
obligations to pay further contributions after payment of the fixed contribution. The
contributions recognized in respect of defined contribution plans are expensed as they fall
due. Liabilities or assets may be recognized if underpayment or prepayment has occurred
and are included in current liabilities or current assets as they are normally of a
short-term nature.
(c) Termination Benefits
Termination benefits are payable when employment is terminated by the Group before
the normal retirement date, or whenever an employee accepts voluntary redundancy in
exchange for these benefits. The Group recognizes termination benefits at the earlier of
when it can no longer withdraw the offer of such benefits and when it recognizes costs for
a restructuring that is within the scope of PAS 37 and involves the payment of termination
benefits. In the case of an offer made to encourage voluntary redundancy, the
termination benefits are measured based on the number of employees expected to
accept the offer. Benefits falling due more than 12 months after the reporting period are
discounted to their present value.
(d) Profit-sharing and Bonus Plans
The Group recognizes a liability and an expense for bonuses and profit-sharing, based on a
formula that takes into consideration the profit attributable to the Group’s shareholders
after certain adjustments. The Group recognizes a provision where it is contractually
obliged to pay the benefits, or where there is a past practice that has created a
constructive obligation.
(e) Compensated Absences
Compensated absences are recognized for the number of paid leave days (including
holiday entitlement) remaining at the end of each reporting period. They are included in
Trade and Other Payables account in the consolidated statement of financial position at
the undiscounted amount that the Group expects to pay as a result of the unused
entitlement.

- 33 -
2.21 Borrowing Costs
Borrowing costs are recognized as expense in the period in which they are incurred, except to
the extent that they are capitalized. Borrowing costs that are directly attributable to the
acquisition, construction or production of a qualifying asset are capitalized as part of the cost of
such asset. The capitalization of borrowing costs commences when expenditures for the asset
and borrowing costs are being incurred and activities that are necessary to prepare the asset for
its intended use or sale are in progress. Capitalization ceases when substantially all such
activities are complete.
Investment income earned on the temporary investment of specific borrowings pending their
expenditure on qualifying assets is deducted from the borrowing costs eligible for capitalization.
For income tax purposes, interest and other borrowing costs are charged to expense when
incurred.
2.22 Income Taxes
Tax expense recognized in profit or loss comprises the sum of deferred tax and current tax not
recognized in other comprehensive income or directly in equity, if any.
Current tax assets or liabilities comprise those claims from, or obligations to, fiscal authorities
relating to the current or prior reporting period, that are uncollected or unpaid at the end of the
reporting period. They are calculated using the tax rates and tax laws applicable to the fiscal
periods to which they relate, based on the taxable profit for the year. All changes to current tax
assets or liabilities are recognized as a component of tax expense in profit or loss.
Deferred tax is accounted for, using the liability method, on temporary differences at the end of
each reporting period between the tax base of assets and liabilities and their carrying amounts
for financial reporting purposes. Under the liability method, with certain exceptions, deferred
tax liabilities are recognized for all taxable temporary differences and deferred tax assets are
recognized for all deductible temporary differences and the carryforward of unused tax losses
and unused tax credits to the extent that it is probable that taxable profit will be available
against which the deductible temporary differences can be utilized. Unrecognized deferred tax
assets are reassessed at the end of each reporting period and are recognized to the extent that
it has become probable that future taxable profit will be available to allow such deferred tax
assets to be recovered.
Deferred tax assets and liabilities are measured at the tax rates that are expected to apply in the
period when the asset is realized or the liability is settled provided such tax rates have been
enacted or substantively enacted at the end of the reporting period.
The carrying amount of deferred tax assets is reviewed at the end of each reporting period and
reduced to the extent that it is probable that sufficient taxable profit will be available to allow
all or part of the deferred tax asset to be utilized.
The measurement of deferred tax liabilities and assets reflects the tax consequences that would
follow from the manner in which the Group expects, at the end of the reporting period, to
recover or settle the carrying amount of its assets and liabilities.
Most changes in deferred tax assets or liabilities are recognized as a component of tax expense
in profit or loss, except to the extent that it relates to items recognized in other comprehensive
income or directly in equity. In this case, the tax is also recognized in other comprehensive
income or directly in equity, respectively.

- 34 -
Deferred tax assets and deferred tax liabilities are offset if the Group has a legally enforceable
right to set off current tax assets against current tax liabilities and the deferred taxes relate to
the same entity and the same taxation authority.
2.23 Related Party Transactions and Relationships
Related party transactions are transfers of resources, services or obligations between the Group
and its related parties, regardless whether a price is charged.
Parties are considered to be related if one party has the ability to control the other party or
exercise significant influence over the other party in making financial and operating decisions.
These parties include: (a) individuals owning, directly or indirectly through one or more
intermediaries, control or are controlled by, or under common control with the Group;
(b) associates; (c) individuals owning, directly or indirectly, an interest in the voting power of the
Group that gives them significant influence over the Group and close members of the family of
any such individual; and, (d) the Group’s funded retirement plan.
In considering each possible related party relationship, attention is directed to the substance of
the relationship and not merely on the legal form.
2.24 Equity
Capital stock represents the nominal value of shares that have been issued.
Additional paid-in capital includes any premium received on the issuance of capital stock. Any
transaction costs associated with the issuance of shares are deducted from additional paid-in
capital, net of any related income tax benefits.
Revaluation reserves comprise gains and losses arising from the revaluation of the Group’s
vessels, remeasurements of post-employment defined benefit plan, cumulative translation
adjustments on financial statements of foreign subsidiaries and unrealized fair value gains
(losses) arising from the revaluation of certain AFS financial assets, net of applicable taxes.
Other reserves pertain to the difference between the Group’s cost of investment and the capital
stock of the acquired entities in a business combination accounted for under the pooling-of-
interest method.
Retained earnings represent all current and prior period results of operations as reported in the
consolidated statement of profit or loss.
2.25 Earnings Per Share
Basic earnings per share is computed by dividing net profit attributable to the Company’s
stockholders by the weighted average number of shares issued and outstanding, adjusted
retroactively for any stock dividends declared, stock split and reverse stock split declared during
the current period.
Diluted earnings per share is computed by adjusting the weighted average number of ordinary
shares outstanding to assume conversion of potential dilutive shares. Currently, the Company
does not have potentially dilutive shares outstanding; hence, the diluted earnings per share is
equal to the basic earnings per share.

- 35 -
2.26 Events After the End of the Reporting Period
Any post-year-end event that provides additional information about the Group’s interim
consolidated financial position at the end of the reporting period (adjusting event) is reflected in
the interim consolidated financial statements. Post-year-end events that are not adjusting
events, if any, are disclosed when material to the interim consolidated financial statements.
3. SIGNIFICANT ACCOUNTING JUDGMENTS AND ESTIMATES
The preparation of the Group’s interim consolidated financial statements in accordance with
PFRS requires management to make judgments and estimates that affect the amounts reported
in the interim consolidated financial statements and related notes. Judgments and estimates
are continually evaluated and are based on historical experience and other factors, including
expectations of future events that are believed to be reasonable under the circumstances.
Actual results may ultimately differ from these estimates.
3.1 Critical Management Judgments in Applying Accounting Policies
In the process of applying the Group’s accounting policies, management has made the following
judgments, apart from those involving estimation, which have the most significant effect on the
amounts recognized in the interim consolidated financial statements:
(a) Revenue Recognition for Charter Arrangements
In determining the appropriate method to use in recognizing the Group’s revenue from
TC, CVC and BB agreements, management considers the following criteria:
(1) whether the fulfillment of the arrangement is dependent on the use of a specific
vessel; and, (2) whether the arrangement conveys a right to use the vessel. Management
determined that if both criteria are met, the revenue should be recognized using the
straight-line method over the term of the contract [see Note 2.16(a)].
(b) Distinction Between Operating and Finance Leases
The Group has entered into various lease agreements as either a lessor or lessee. Critical
judgment was exercised by management to distinguish each lease agreement as either an
operating or a finance lease by looking at the transfer or retention of significant risk and
rewards of ownership of the properties covered by the agreements. Failure to make the
right judgment will result in either overstatement or understatement of assets and
liabilities.
As of March 31, 2018 and December 31, 2017, management has determined that its
current lease agreements are all operating leases.
(c) Capitalization of Borrowing Costs
The Group determines whether the amount of borrowing costs qualify for capitalization
as part of the cost of the qualifying asset, or should be expensed outright. The accounting
treatment for the finance costs is determined by assessing whether the asset is a
qualifying asset taking into consideration the period of time to bring the asset ready for its
intended use. Failure to make the right judgment will result in misstatement of assets and
net profit.

- 36 -
(d) Recognition of Provisions and Contingencies
Judgment is exercised by management to distinguish between provisions and
contingencies. Policies on recognition of provisions and contingencies are discussed in
Note 2.15 and relevant disclosures are presented in Note 23.
(e) Impairment of AFS Financial Assets
The determination when an investment is other-than-temporarily impaired requires
significant judgment. In making this judgment, the Group evaluates, among other factors,
the duration and extent to which the fair value of an investment is less than it cost, and
the financial health of and near-term business outlook for the investee, including factors
such as industry and sector performance, changes in technology and operational and
financing cash flows.
Based on the recent evaluation of information and circumstances affecting the Group’s
AFS financial assets, management has not recognized any impairment loss on its AFS
financial assets in 2016. Future changes in those information and circumstances might
significantly affect the carrying amount of the assets.
3.2 Key Sources of Estimation Uncertainty
The following are the key assumptions concerning the future, and other key sources of
estimation uncertainty at the end of the reporting period, that have a significant risk of causing
a material adjustment to the carrying amounts of assets and liabilities within the next reporting
period:
(a) Impairment of Trade and Other Receivables, Subscription Receivable, Advances to Related
Parties and Security deposits
Adequate amount of allowance for impairment is made and provided for specific and
groups of accounts where objective evidence of impairment exists. The Group evaluates
the amount of allowance for impairment based on available facts and circumstances
affecting the collectibility of the accounts, including, but not limited to, the length of the
Group’s relationship with its counterparties, their current credit status, average age of
accounts, collection experience and historical loss experience. The methodology and
assumptions used in estimating future cash flows are reviewed regularly by the Group to
reduce any differences between loss estimates and actual loss experience.
The carrying value of trade and other receivables and the analysis of allowance for
impairment on such financial assets are shown in Note 5. Meanwhile, based on
management assessment, no impairment loss on subscription receivable, advances to
related parties and security deposits is required to be recognized in 2018 and 2017
(see Notes 8, 11, 20.4, and 23.3).
(b) Determination of Net Realizable Value of Inventories
In determining the net realizable value of inventories, management takes into account the
most reliable evidence available at the dates the estimates are made. Future realization of
the carrying amounts of inventories as presented in Note 7 is affected by price changes
and action from the competitors. These are considered key sources of estimation
uncertainty and may cause significant adjustments to the Group’s inventories within the
next financial reporting period.

- 37 -
(c) Estimating Useful Lives of Property and Equipment and Drydocking Costs
The Group estimates the useful lives of property and equipment and drydocking costs
based on the period over which the assets are expected to be available for use. The
estimated useful lives of property and equipment and drydocking costs are reviewed
periodically and are updated if expectations differ from previous estimates due to physical
wear and tear, technical or commercial obsolescence and legal or other limits on the use
of the assets.
The carrying amounts of property and equipment and drydocking costs are analyzed in
Notes 9 and 11, respectively. Based on management’s assessment as at March 31, 2018
and December 31, 2017, there is no change in the estimated useful lives of property and
equipment and drydocking costs during those periods. Actual results, however, may vary
due to changes in estimates brought about by changes in factors mentioned above.
(d) Fair Value Measurement of Vessels
The Group’s vessels, included as part of Property and Equipment, are carried at revalued
amounts at the end of the reporting period. In determining the fair value of these assets,
the Group engages the services of professional and independent appraisers applying the
relevant methodologies as discussed in Note 28.4.
For the Group’s vessels with appraisal conducted prior to the end of the current reporting
period, management determines whether there are significant circumstances during the
intervening period that may require adjustments or changes in the disclosure of fair value
of those assets.
A significant change in these elements may affect prices and the value of the assets. The
amounts of revaluation recognized on the Group’s vessels are disclosed in Note 9.
(e) Determining Realizable Amount of Deferred Tax Assets
The Group reviews its deferred tax assets at the end of each reporting period and reduces
the carrying amount to the extent that it is no longer probable that sufficient taxable
profit will be available to allow all or part of the deferred tax assets to be utilized.
Management assessed that the deferred tax assets recognized as at March 31, 2018 and
December 31, 2017 will be fully utilized in the coming periods. The carrying value of
deferred tax assets as of March 31, 2018 and December 31, 2017 is disclosed in Note 19.2.
(f) Impairment of Non-financial Assets
In assessing impairment, management estimates the recoverable amount of each asset or
a cash-generating unit based on expected future cash flows and uses an interest rate to
calculate the present value of those cash flows. Estimation uncertainty relates to
assumptions about future operating results and the determination of a suitable discount
rate (see Note 2.19). Though management believes that the assumptions used in the
estimation of fair values reflected in the interim consolidated financial statements are
appropriate and reasonable, significant changes in these assumptions may materially
affect the assessment of recoverable values and any resulting impairment loss could have
a material adverse effect on the results of operations.
Management has assessed that no impairment losses are required to be recognized on
the Group’s non-financial assets in 2018 and 2017.

- 38 -
(g) Valuation of Post-employment Defined Benefit Obligation
The determination of the Group’s obligation and cost of post-employment defined benefit
is dependent on the selection of certain assumptions used by actuaries in calculating such
amounts. Those assumptions include, among others, discount rates and expected salary
increase rates. A significant change in any of these actuarial assumptions may generally
affect the recognized expense, other comprehensive income or losses and the carrying
amount of the post-employment benefit obligation in the next reporting period.
The amounts of post-employment benefit obligation and expense and an analysis of the
movements in the estimated present value of post-employment benefit, as well as the
significant assumptions used in estimating such obligation are presented in Note 19.2.
4. CASH AND CASH EQUIVALENTS
Cash and cash equivalents include the following components as of:
March 31, December 31,
2018 2017
(Unaudited) (Audited)
Cash on hand and in banks P 948,738,899 P 1,426,064,323
Short-term placements 14,117,458 15,639,867
P 962,856,357 P 1,441,704,190
Cash in banks generally earn interest based on daily bank deposit rates. Short-term placements
are made for varying periods from 30 to 90 days and earn effective interest ranging from 1.00%
to 3.50% both in 2018 and 2017.
The balances of cash on hand and in banks as of December 31, 2017 did not include an amount
of P31.0 million which is shown as Restricted cash under the Other Current Assets in the 2017
consolidated statement of financial position (see Note 8). Such amount is not available for the
general use of the Group.
5. TRADE AND OTHER RECEIVABLES
This account is composed of the following as of:
March 31, December 31,
2018 2017
Note (Unaudited) (Audited)
Trade receivables 20.1, 20.3 P 1,102,684,060 P 802,786,761
Due from agencies 62,247,146 54,229,144
Advances to officers and employees 29,449,092 19,001,031
Claims receivables 15,856,139 15,794,361
Others 9,766,350 2,210,859
1,220,002,787 894,022,156
Allowance for doubtful accounts ( 17,601,775 ) ( 17,601,775 )
P 1,202,401,012 P 876,420,381

- 39 -
All of the Group’s trade and other receivables have been reviewed for indications of
impairment. Certain trade and other receivables were found to be impaired; hence, adequate
amount of allowance for impairment has been provided.
A reconciliation of the allowance for impairment at the beginning and end of March 31, 2018
and December 31, 2017 is shown below.
March 31, December 31,
2018 2017
(Unaudited) (Audited)
Balance at beginning of period P 17,601,775 P 14,566,313
Impairment losses during
the period - 3,035,462
Balance at end of period P 17,601,775 P 17,601,775
Trade and other receivables are unsecured and do not bear any interest. All receivables, except
for advances to officers and employees, are subject to credit risk exposure (see Note 26.2).
Due from agencies represent claims from authorized agencies for tickets issued to customers.
Claims receivables include charges made by the customer to the Group for claims on damages
due to handling of items. These are reimbursable from the transacting agency.
Advances to officers and employees represent unsecured, non-interest bearing cash advances
for business-related expenditures and are subject to liquidation.
Certain trade receivables amounting to P32.3 million and P28.3 million as of March 31, 2018 and
December 31, 2017, respectively, were used as collateral to secure the payment of the Group’s
interest-bearing loans and borrowings (see Note 12.1).
6. FINANCIAL ASSETS AT FAIR VALUE THROUGH PROFIT OR LOSS
This account represents investments in equity securities that are listed in the PSE and in the
New York Stock Exchange that have been designated by management as financial assets at
FVTPL upon initial recognition.
The fair values of equity securities have been determined directly by reference to quoted bid
prices in active markets (see Note 28.2). The carrying amounts of the above financial assets are
designated as at FTVPL on initial recognition.
In 2015, the Group purchased 8,800 preference shares of San Miguel Corporation, a publicly
listed company. Additional preference shares were purchased in 2016 at par with quantity of
29,400 and 93,400 shares. All investments stated herein are held by the Group with the
intention of selling in the near term.
There were no changes in the fair value of financial assets at FVTPL for the periods ended
March 31, 2018 and December 31, 2017.

- 40 -
7. INVENTORIES
This account includes the following:
March 31, December 31,
2018 2017
Note (Unaudited) (Audited)
Spare parts P 138,670,436 P 87,620,499
Fuel and lubricants 20.2 88,901,414 49,034,701
Shipping supplies 64,812,731 39,829,380
Food, beverage and other supplies 3,470,053 5,350,929
Electrical parts 527,035 3,028,474
P 296,381,669 P 184,863,983
As of March 31, 2018 and December 31, 2017, based on management’s assessment, the net
realizable value of inventories is higher than its cost.
8. OTHER CURRENT ASSETS
The breakdown of this account as of March 31, 2018 and December 31, 2017 follows:
March 31, December 31,
2018 2017
Notes (Unaudited) (Audited)
Advances to suppliers P 2,064,653,736 P 1,477,527,421
Deferred input VAT 167,798,149 185,770,148
Input VAT 124,604,257 69,644,935
Creditable withholding taxes 93,035,076 96,556,752
Prepayments 85,385,447 31,937,943
Deferred charges 38,845,093 29,780,327
Deferred loss on sale and leaseback 24,309,821 -
Security deposits 20.3, 23.3 5,122,339 5,122,339
Restricted cash 4 - 29,406,231
Others 3,488,264 590,814
P 2,607,242,182 P 1,926,336,910
Advances to suppliers include down payments made to suppliers for the acquisition of vessels,
supply of spare parts, parcels of land and other services. It also includes advances for land
acquisitions pertaining to Trans-Asia’s advance payments for the purchase of certain parcels of
land, which are bought for use in operations as container yards.

- 41 -
9. PROPERTY AND EQUIPMENT
The gross carrying amounts and accumulated depreciation, amortization and impairment loss of
property and equipment at the beginning and end of March 31, 2018 and December 31, 2017,
are shown below.
A reconciliation of the carrying amounts of property and equipment at the beginning and end of
March 31, 2018 and December 31, 2017 is shown below and in the succeeding page.
Building and Office Furniture,
Vessels and Transportation Leasehold Fixture and
Land Vessel Equipment Equipment Improvements Equipment CIP Total
March 31, 2018
Cost or reva lued a mounts 211,673,989 P 12,838,670,322 P 116,068,485 P 56,424,183 P 113,859,392 P 1,644,728,822 P 14,981,425,193 P
Accumula ted depreciation
a nd a morti za tion - 2,926,858,175 )( 50,228,018 )( 31,645,504 )( 74,912,923 )( - 3,083,644,620 )(
Accumula ted impa i rment loss - 2,214,620 )( - - - - 2,214,620 )(
Net ca rrying amount 211,673,989 P 9,909,597,527 P 65,840,467 P 24,778,679 P 38,946,469 P 1,644,728,822 P 11,895,565,953 P
December 31, 2017
Cost or reva lued a mounts 211,673,989 P 12,863,128,955 P 114,549,466 P 51,089,515 P 128,551,325 P 588,837,757 P 13,957,831,007 P
Accumula ted depreciation
a nd a morti za tion - 2,792,252,270 )( 46,095,605 )( 30,714,077 )( 86,958,008 )( - 2,956,019,960 )(
Accumula ted impa i rment loss - 2,214,620 )( - - - - 2,214,620 )(
Net ca rrying amount 211,673,989 P 10,068,662,065 P 68,453,861 P 20,375,438 P 41,593,317 P 588,837,757 P 10,999,596,427 P
January 1, 2017
Cost or reva lued a mounts 104,250,013 P 9,366,967,816 P 58,950,480 P 44,644,547 P 57,993,472 P 335,657,251 P 9,968,463,579 P
Accumula ted depreciation
a nd a morti za tion - 2,053,621,702 )( 23,075,954 )( 26,555,834 )( 44,427,026 )( - 2,147,680,516 )(
Accumula ted impa i rment loss - 2,214,621 )( - - - - 2,214,621 )(
Net ca rrying amount 104,250,013 P 7,311,131,493 P 35,874,526 P 18,088,713 P 13,566,446 P 335,657,251 P 7,818,568,442 P
Building and Office Furniture,
Vessels and Transportation Leasehold Fixture and
Land Vessel Equipment Equipment Improvements Equipment CIP Total
Bala nce a t Ja nua ry 1, 2018,
net of accumulated deprecia tion
and a mortization and
impa i rment losses 211,673,989 P 10,068,662,065 P 68,453,861 P 20,375,438 P 41,593,317 P 588,837,757 P 10,999,596,427 P
Addi tions - 772,530 2,951,342 5,101,398 3,385,893 1,055,891,065 1,068,102,228
Di sposa l - 314,371 )( 984,821 )( - 2,227,635 )( - 3,526,827 )(
Depreciation a nd a morti za tion
charges for the yea r - 159,522,697 )( 4,579,915 )( 698,157 )( 3,805,106 )( - 168,605,875 )(
Bala nce a t Ma rch 31, 2018,
net of accumulated deprecia tion
and a mortization and
impa i rment losees 211,673,989 P 9,909,597,527 P 65,840,467 P 24,778,679 P 38,946,469 P 1,644,728,822 P 11,895,565,953 P
Bala nce a t Ja nua ry 1, 2017,
net of accumulated deprecia tion
and a mortization and
impa i rment losses 104,250,013 P 7,311,131,493 P 35,874,526 P 18,088,713 P 13,566,446 P 335,657,251 P 7,818,568,442 P
Bala nce from acqui red subs idiaries
at Janua ry 1, 2017, net of
accumula ted deprecia tion
and a mortization - 1,825,913,470 14,089,612 - 12,377,408 - 1,852,380,490
Addi tions 107,423,976 P 1,268,178,847 44,002,428 3,682,827 30,191,753 433,531,471 1,887,011,302
Revaluation increment - 67,317,920 - - - - 67,317,920
Recla ss ifi ca tion - 180,118,385 - - 232,580 P 180,350,965 )( -
Di sposa l - 9,335,148 )( 8,507,385 )( - 1,606,112 )( - 19,448,645 )(
Depreciation a nd a morti za tion
charges for the yea r - 574,662,902 )( 17,005,320 )( 1,396,102 )( 13,168,758 )( - 606,233,082 )(
Bala nce a t December 31, 2017,
net of accumulated deprecia tion
and a mortization and
impa i rment losees 211,673,989 P 10,068,662,065 P 68,453,861 P 20,375,438 P 41,593,317 P 588,837,757 P 10,999,596,427 P

- 42 -
The fair values of the Group’s vessels were based on the latest appraisal reports as shown
below.
Net Appraised
Name of Vessel Date of Report Values
MV Starlite Reliance November 22, 2017 P 450,000,000
MT Denise November 11, 2017 195,000,000
MT Jasaan July 7, 2017 43,000,000
MT Excellence June 14, 2017 150,000,000
MT BMI Patricia June 5, 2017 56,000,000
MV Trans-Asia 3 February 11, 2017 207,385,000
M/Tug Pindasan January 6, 2017 40,419,000
M/Tug Samal January 6, 2017 33,451,000
M/Tug Sigaboy January 6, 2017 28,880,000
M/Tug Fortis II November 11, 2016 80,090,000
MT Chelsea Charlize June 27, 2016 470,000,000
MT Chelsea Endurance June 8, 2016 347,422,000
MT Great Princess May 31, 2016 1,450,000,000
MV Trans-Asia 5 May 17, 2016 114,000,000
MV Asia Philippines May 17, 2016 71,000,000
MV Trans-Asia 2 May 7, 2016 90,000,000
MV Trans-Asia 8 April 28, 2016 90,000,000
MV Trans-Asia 10 April 27, 2016 85,500,000
MV Asia Pacific April 27, 2016 71,000,000
MV Trans-Asia 9 April 25, 2016 86,000,000
MV Starlite Annapolis April 4, 2016 34,869,000
MV Starlite Blue Sea March 31, 2016 5,495,000
MV Starlite Jupiter March 31, 2016 29,568,000
MV Starlite Navigator March 31, 2016 29,674,000
MV Starlite Pacific March 31, 2016 17,956,000
MV Starlite Polaris March 31, 2016 10,065,000
MV Starlite Ferry March 31, 2016 19,675,000
MV Starlite Tamaraw March 31, 2016 25,270,000
MT Chelsea Resolute March 28, 2016 242,000,000
MT Chelsea Intrepid March 17, 2016 120,000,000
MT Chelsea Enterprise March 4, 2016 135,000,000
MV Starlite Pioneer February 24, 2016 462,265,000
MT Chelsea Denise II December 23, 2015 487,000,000
M/Tug Fortis I November 17, 2015 85,000,000
MT Ernesto Uno November 10,2015 150,000,000
MT Great Diamond August 5, 2015 1,021,886,700
MT Chelsea Cherylyn December 29, 2014 880,000,000
Bui ldi ng and Office Furni ture,
Vess el s a nd Trans portation Lea sehol d Fi xture and
Land Vess el Equipment Equipment Improvements Equi pment CIP Total
Ba lance of CSC a t Ja nua ry 1, 2016,
net of accumul ated deprecia ti on
and a morti zati on
and i mpa irment los s es - 4,576,445,613 P 7,002,013 P 394,715 P 2,861,561 P 129,613,034 P 4,716,316,936 P
Ba lance from acqui red s ubsi di aries
at December 31, 2016, net of
accumula ted depreci ation
and a morti zati on 104,250,013 1,082,671,008 768,677 17,836,662 10,099,512 327,543,911 1,543,169,783
Additions - 1,073,870,174 34,183,273 190,018 2,618,283 5,983,585 1,116,845,333
Revaluati on i ncrement - 801,886,530 - - - - 801,886,530
Reclas s i fica tion - 72,873,835 - - - 126,932,888 )( 54,059,053 )(
Dis posa l - - 1,082,142 )( - 29,762 )( 550,391 )( 1,662,295 )(
Depreci ation a nd
amorti zation charges for the year - 296,615,667 )( 4,997,295 )( 332,682 )( 1,983,148 )( - 303,928,792 )(
Ba lance at December 31, 2016,
net of accumul ated deprecia ti on
and a morti zati on
and i mpa irment los s es 104,250,013 P 7,311,131,493 P 35,874,526 P 18,088,713 P 13,566,446 P 335,657,251 P 7,818,568,442 P
P

- 43 -
Management believes that there is no significant change in the fair values of the Group’s vessels
since the dates of last appraisals. Further, no appraisal report was obtained for MV San Pedro
Calungsod, MV San Lorenzo Ruiz Uno, MV St. Nicholas of Myra, MT Chelsea Dominance, MTug
Fortis III, MTug Fortis V, MTug Fortis VII, MV Starlite Saturn, MV Starlite Eagle, MV Starlite
Archer and MV Trans-Asia 12 as the Group has newly-acquired the vessels towards the end of
2016 and early 2017; hence, management believes that the acquisition costs approximate their
fair values.
In 2017, the Group acquired new vessels namely, MV San Pedro Calungsod, MV San Lorenzo
Ruiz Uno, MV St. Nicholas of Myra, MV Archer, Fortis V and Fortis VII.
In 2016, CSC acquired new vessels namely, MT Chelsea Charlize, MT Chelsea Endurance and MT
Chelsea Dominance, which commenced operations in March 2016, August 2016 and November
2016, respectively. Total capitalized borrowing costs for these tankers amounted to P6.1 million
for the year ended December 31, 2016. The capitalization rates used range from 4.32% to 4.50%
per annum.
If the Group’s vessels and vessel equipment were measured under the cost model, the cost,
accumulated depreciation and net carrying amount as of March 31, 2018 and December 31,
2017 are as follows:
March 31, December 31,
2018 2017
(Unaudited) (Audited)
Cost P 10,151,501,164 P 10,096,699,931
Accumulated depreciation ( 1,849,833,715 ) ( 1,768,872,688 )
Net carrying amount P 8,301,667,449 P 8,327,827,243
Depreciation and amortization is classified in the consolidated statements of profit and loss as
follows:
2018 2017
Notes (Unaudited) (Audited)
Cost of sales and services 15 P 161,930,121 P 120,492,558
Other operating expenses 6,675,754 3,446,185
16 P 168,605,875 P 123,938,743
The Group’s vessels with a net carrying amount of P8,916.3 million and P8,755.6 million as of
March 31, 2018 and December 31, 2017, respectively, were used to secure the payment of
certain interest-bearing loans and borrowings (see Note 13).

- 44 -
10. INVESTMENTS IN AN ASSOCIATE AND A JOINT VENTURE
The carrying value of the Group’s investment in an associate and a joint venture as of the end of
the reporting periods is as follows:
March 31, December 31,
2018 2017
(Unaudited) (Audited)
Associate – KGLI-NM
Cost P 2,210,299,689 P 2,104,212,296
Equity share in other comprehensive
income of an associate - 108,049,607
Equity share in net profit (loss) of an associate 11,093,284 ( 1,962,214 )
2,221,392,973 2,210,299,689
Jointly controlled entity –
Meridian Maritime Training Center
Center (Meridian) 58,635,925 58,635,925
P 2,280,028,898 P 2,268,935,614
On March 27, 2017, CLC acquired all of UIBV’s outstanding capital stock through a share swap
agreement with Udenna wherein Udenna transferred to CLC 18,200 UIBV shares. In exchange,
the Company issued 775,384,615 new common shares from its authorized and unissued capital
stock in favor of Udenna. UIBV owns 80% economic interest and 39.97% of the voting rights in
KGLI-NM, which holds 39.85% economic interest in and owns 60% of the voting stock in Nenaco.
Nenaco, in turn owns 88.31% of 2Go. Hence, the Company has a 28.15% indirect economic
interest in 2Go.
In 2016, CSC entered into a Memorandum of Agreement with Meridian whereby both parties
agree to establish and operate a training facility on a parcel of land at the Calaca Seaport
(formerly Phoenix Petroterminals Industrial Park) in Calaca, Batangas. The training facility shall
be called the Meridian Maritime Training Center. The establishment of the facility shall have a
total project cost of P50.0 million, which includes the acquisition of the site, construction costs
of the structures of the facility and government taxes, assessments and fees related thereto.
In 2017, CSC made additional investment in the Meridian amounting to P13.1 million.
As of March 31, 2018 and December 31, 2017, management believes that the investments in an
associate and a joint venture are not impaired.

- 45 -
11. OTHER NON-CURRENT ASSETS
This account is composed of the following as of:
March 31, December 31,
2018 2017
Notes (Unaudited) (Audited)
Drydocking costs – net P 322,996,209 P 303,509,254
Security deposits 20.3, 23.3 17,061,254 12,730,611
Other investments 8,615,100 8,272,236
Restricted cash 4 - 1,637,081
Software 1,600,000 1,600,000
Others 1,022,255 -
P 351,294,818 P 327,749,182
A reconciliation of the net carrying amount of drydocking costs at the beginning and end of
March 31, 2018 and December 31, 2017 is shown below.
March 31, December 31,
2018 2017
Note (Unaudited) (Audited)
Balance at beginning of period P 303,509,254 P 169,125,830
Additions 74,894,484 325,647,628
Balance from acquired subsidiaries - 21,259,891
Amortization charges for the period ( 55,407,529 ) ( 212,524,095)
Balance at end of period P 322,996,209 P 303,509,254
Amortization of drydocking costs is presented as part of the Cost of Sales and Services account
in the consolidated statements of profit and loss (see Note 15).

- 46 -
12. INTEREST-BEARING LOANS
The short-term and long-term interest-bearing loans are broken down as follows as of
December 31:
March 31, December 31,
2018 2017
Note (Unaudited) (Audited)
Current:
Bank loans 12.2 P 3,291,061,290 P 2,445,380,253
Term loans 12.1 1,649,300,174 968,128,892
Mortgage loans 12.3 50,652,047 20,981,833
Obligations under finance lease 12.3 11,523,776 20,981,833
5,002,537,287 3,434,490,978
Non-current:
Term loans 12.1 6,487,735,415 6,746,237,521
Mortgage loans 12.3 106,738,186 140,997,812
Obligations under finance lease 12.4 44,111,557 -
Bank loans 12.2 2,196,902 10,434,324
6,640,782,060 6,897,669,657
P 11,643,319,347 P 10,332,160,635
A reconciliation of the carrying amounts of interest-bearing loans at the beginning and end of
March 31, 2018 and December 31, 2017 is shown below.
Obligations under
Term loans Bank loans Mortgage loans finance lease
(see Note 12.1) (see Note 12.2) (see Note 12.3) (see Note 12.4) Total
Balance as of January 1, 2018 7,714,366,413 P 2,455,814,577 P 161,979,645 P - 10,332,160,635 P
Additions 575,000,000 845,547,385 1,351,468 56,840,400 1,478,739,253
Repayments 178,302,102 )( 8,103,770 )( 5,940,880 )( 1,205,067 )( 193,551,819 )(
Restatement of foreign currency
denominated loans 25,971,278 - - - 25,971,278
Balance at March 31, 2018 8,137,035,589 P 3,293,258,192 P 157,390,233 P 55,635,333 P 11,643,319,347 P
Balance as of January 1, 2017 2,596,979,367 P 4,576,345,754 P 199,457,057 P - 7,372,782,178 P
Balance from acquired subsidiaries 2,446,689,650 7,561,112 - - 2,454,250,762
Additions 1,404,093,151 1,184,823,399 40,735,902 - 2,629,652,452
Repayments 559,970,152 )( 1,512,915,688 )( 78,213,314 )( - 2,151,099,154 )(
Reclassification 1,800,000,000 1,800,000,000 )( - - -
Conversion from USD to PHP 20,298,400 - - - 20,298,400
Restatement of foreign currency
denominated loans 6,275,997 - - - 6,275,997
Balance at December 31, 2017 7,714,366,413 P 2,455,814,577 P 161,979,645 P - 10,332,160,635 P
P
P
P

- 47 -
13.1 Term Loans
The details of the Group’s term loans as of March 31, 2018 and December 31, 2017 are as
follows:
(a) Omnibus Loan and Security Agreement (OLSA) with BDO – MT Great Princess and MT
Chelsea Denise II
In 2013, PNX-Chelsea entered into a MOA with China Shipbuilding & Exports Corporation
(CSEC) for the acquisition of one unit of oil tank (MT Great Princess) in the amount of
US$21,187,500. In connection with the acquisition of an oil tank vessel, PNX-Chelsea
entered into an OLSA amounting to US$14 million with BDO, the proceeds of which was
used to partly finance the importation of the vessel. In September 2013, BDO granted the
loan and released the first tranche amounting to US$4 million. The second tranche was
availed by PNX in February 2014. The loan is payable for a period of five periods from
initial drawdown date in US$560,000 quarterly principal installments and any unpaid
balance on the maturity date, with two quarter grace period, commencing after the
second tranche. The loan bears effective interest rate of 5.25% per annum.
In 2014, PNX-Chelsea entered into a MOA with CSEC for the importation of one unit of oil
tank vessel (MT Chelsea Denise II) from China for a total cost of US$7,300,000. In
connection with the MOA, PNX-Chelsea entered in another OLSA with the same local bank
for P300.0 million to finance the acquisition of MT Chelsea Denise II in 2014. The loan is
subject to effective interest rate of 6.46% per annum and is payable for a quarterly basis
for five periods commencing at the end of the fourth quarter of 2015.
Interest incurred on these loans amounted to P8.1 million and P12.2 million in 2018 and
2017, respectively, and are presented as part of Finance costs under the Other Income
(Charges) account in the consolidated statements of profit or loss (see Note 18.1).
March 31, December 31,
Interest 2018 2017
Security Terms Rates (Unaudited) (Audi ted)
China Banking Corporation (CBC) Continuing Suretyship 6 years 4.50% 1,800,000,000 P 1,800,000,000 P
Phi l ippine Bus iness Ba nk (PBB) MV Ea gle, MV Na viga tor
MV Archer, MV Sa turn 10 years 7.50% 1,029,944,850 1,037,444,850
PBB Uns ecured 15 years 7.00% 800,000,000 800,000,000
Development Ba nk of the Phi l ippines (DBP) MV Pioneer, MV Rel ia nce 15 years 6.95% 606,000,000 606,000,000
DBP MV Sa n Pedro Ca lungsod
MV Sa n Lorenzo Ruis Uno
MV St. Nichola s of Myra 15 years 6.50% 575,000,000 -
CBC MT Chelsea Cha rl i ze 7 years 3.25% 365,449,000 366,102,000
PBB MT Chelsea Domina nce 7 years 6.06% 356,791,050 373,008,825
BDO Uniba nk, Inc. (BDO) MT Grea t Princess 5 years 5.25% 321,595,120 335,482,560
PBB MT Chelsea Endurance 7 years 6.06% 302,623,750 316,379,375
BDO Tra ns - As ia 1, Trans - As ia 10 10 years 4.25% 297,155,113 299,361,844
Mega Interna tional Commercial Bank Co. (MICBC) Conti nuing Suretyship 5 years 6.10% 292,500,000 296,250,000
Robinsons Bank Corporation (RBC) Continuing Suretyship 5 years 6.10% 292,500,000 296,250,000
CTBC Bank (Phi l s ) Inc. (CTBC) Continuing Suretyship 5 years 4.09% 292,500,000 296,250,000
Fi rs t Commercial Ba nk, Ltd. (FCB) Continuing Suretys hip 5 years 6.10% 195,000,000 197,500,000
BDO MT Chels ea Denis e I I 5 years 6.46% 196,140,000 196,140,000
BDO Trans - As ia 1 10 years 5.00% 131,000,000 179,959,247
BDO MT Great Dia mond 7 years One yea r LIBOR
plus 3.50% 112,148,372 134,052,501
BDO Cha ttel Mortgage 8 years 4.50% 88,118,410 88,118,410
As ia Uni ted Ba nk (AUB) Mtug Fortis I I I and Mtug
Forti s V 7 years 5.56% 64,533,519 67,114,859
Uni ted Coconut Pla nters Ba nk (UCPB) and Mtug Pinda san, Mtug Sa ma l 6.00% to
Phi l ippine Ba nk of Communica tions (PBComm) Mtug Siga boy 5 years 6.50% 20,633,872 25,696,844
AUB Mtug Forti s I and Mtug
Fortis I I 5 years 7.00% 16,666,667 22,222,222 BDO Tra ns - As ia 10 9.38 yea rs 4.25% 38,021 39,584
8,156,337,744 7,733,373,121
Dis count on loa ns pa yable 19,302,155 )( 19,006,708 )(
8,137,035,589 P 7,714,366,413 P
Outstanding Balance

- 48 -
Debt issuance costs amounted to P0.8 million (first tranche) and P2.2 million
(second tranche), of which P0.2 million and P0.7 million, respectively, were amortized in
2018 and 2017 using the effective interest rates of 5.54% and 5.58% for each tranche.
Amortized debt issuance costs were recognized as part of Interest expense on Interest-
bearing loans under the Finance Costs account of the consolidated statement of profit or
loss (see Note 18.1). Unamortized debt issuance costs are deducted against the current
and non-current portion of the related interest-bearing loans.
The loans are secured by a chattel mortgage of MT Great Princess and MT Chelsea
Denise II, respectively (see Note 9). The carrying amounts of these vessels, presented as
part of the Property and Equipment account, amounted to P1,876.8 million and
P1,894.5 million as of March 31, 2018 and December 31, 2017, respectively.
The OLSA requires PNX-Chelsea to maintain debt to equity ratio of not more than
2.00:1.00 and debt service coverage ratio (DSCR) of at least 1.20, except on drydocking
year where minimum DSCR shall be 1.00. As of March 31, 2018 and December 31, 2017,
the Company has complied with these covenants.
(b) OLSA with BDO – MT Chelsea Great Diamond
On April 26, 2011, CSC entered into a MOA with CSEC for the acquisition of one unit of oil
tank (MT Chelsea Great Diamond) in the amount of US$19.8 million.
In connection with the MOA, CSC entered into an OLSA amounting to
US$14.5 million with BDO, the proceeds of which was used to partly finance the
importation of the vessel. The loan is payable in 27 consecutive equal quarterly principal
installments starting in August 2012. The loan is subject to quarterly repricing of interest
computed at one-year LIBOR plus applicable margin of 3.5% per annum.
Related debt issuance costs amounted to P8.2 million, of which P0.1 million and
P2.7 million was amortized in 2018 and 2017, respectively, using the effective interest
rate of 4.65%. Amortized debt issuance costs were recognized as part of Interest expense
on Interest-bearing loans under the Finance Costs account of the consolidated statement
of profit or loss (see Note 19.1). The unamortized debt issuance costs are included as part
of the current and non-current portion of the related loan.
The loan is secured by a chattel mortgage on certain vessels of CSC with a total net
carrying amount of P904.6 million and P914.0 million as of March 31, 2018 and December
31, 2017, respectively (see Note 9). The loan is also secured by collateral on certain
receivables under the Group’s Assignment of Charter Party with BDO and guaranteed by
certain stockholders of the Group (see Notes 5 and 20.8).
The OLSA requires CSC to maintain debt-to-equity ratio of not more than 1.50:1.00 and
DSCR of at least 2.50. As of December 31, 2017, CSC has breached these covenants. CSC’s
management, however, believes that the breach has no material impact in the interim
consolidated financial statements as the loan is due for settlement in 2018; hence, the
current classification.
(c) Term Loan Agreement (TLA) with CBC – MT Chelsea Charlize
On May 23, 2016, PNX-Chelsea entered into loan agreement with CBC amounting to
US$8.0 million to finance the acquisition of MT Chelsea Charlize. The loan is subject to
annual interest rate of 3.25% and is payable in 24 equal quarterly installments
commencing on August 23, 2017.

- 49 -
Interest incurred on this loan amounting to 3.2 million and P3.3 million in 2018 and 2017,
respectively, and is included as part of Finance costs under the Other Income
(Charges) – net section of the consolidated statements of profit or loss (see Note 18.1).
The related unpaid interest as of March 31, 2018 and December 31, 2017 amounted to
P0.9 million and P1.3 million, respectively, and is presented as part of Accrued expenses
under the Trade and Other Payables account in the consolidated statements of financial
position.
The loan is secured by a chattel mortgage on MT Chelsea Charlize with net carrying
amount of P441.1 million and P445.1 million as of March 31, 2018 and December 31,
2017, respectively (see Note 9).
(d) TLA with PBB – MT Chelsea Endurance and MT Chelsea Dominance
On July 25, 2016 and August 18, 2016, PNX-Chelsea entered into term loan agreements
with PBB amounting to US$6.5 million and US$7.6 million to finance the acquisition of
MT Chelsea Endurance and MT Chelsea Dominance, respectively. On the anniversary
year, these loans were converted into Php loans. The loans are subject to annual effective
interest rate of 6.06% and are payable in 24 equal quarterly installments with one-year
grace period from date of each release.
Interest incurred on these loans totaling P15.7 million and P8.0 million, excluding
capitalized borrowing costs of P6.1 million (see Note 9), in 2018 and 2017, respectively,
and is included as part of Finance costs under the Other Income (Charges) – net section of
the consolidated statements of profit or loss (see Note 19.1). The related unpaid interest
as of March 31, 2018 and December 31, 2017 amounted to P5.1 million and P6.6 million,
respectively, and is presented as part of Accrued expenses under the Trade and Other
Payables account in the consolidated statements of financial position (see Note 13).
The loans are secured by a chattel mortgage on MT Chelsea Endurance and
MT Chelsea Dominance with net carrying amounts totaling P724.9 million and
P731.2 million, respectively, as of March 31, 2018 and December 31, 2017 (see Note 9).
(e) TLA with AUB – MTug Fortis I, MTug Fortis II, MTug Fortis III and MTug Fortis V
In 2013, FTC obtained interest-bearing loans from a bank to partially finance the
acquisition of tugboats amounting to P100.0 million. The loan bears fixed interest rate at
7.0% for the first three periods from the initial drawdown date, and shall be repriced at
the end of the third year from the initial drawdown date (the “Repricing Date”). The
repriced rate shall be based on the relevant 2Y PDST-F as of the Repricing Date, plus a
spread of 2.0% subject to a floor of 7.0%. The loan is payable in 18 quarterly installments
over a period of five periods. The first payment will commence on the third interest
payment date from the initial drawdown date. The last quarterly installment of the loan is
due on November 6, 2018.
On April 12, 2017, FTC obtained additional interest-bearing loans amounting to
P69.7 million from the same bank to partially refinance the acquisition of MTug Fortis III
and MTug Fortis V and for working capital requirements. The loan bears fixed interest rate
of 5.56% and the principal is payable in 28 monthly installments.

- 50 -
Interest expense related to these loans amounted to P1.4 million and P0.8 million in 2018
and 2017, respectively, and is presented as part of Finance costs under the Other Income
(Charges) – net section of the consolidated statements of profit or loss (see Note 18.1).
Certain trade receivables amounting to P32.3 million and P27.5 million as of
March 31, 2018 and December 31, 2017, respectively, were assigned to secure the
payment of these interest-bearing loans (see Note 5). Moreover, certain tugboats of FTC
with net carrying amounts of P248.2 million and P247.0 million as of March 31, 2018 and
December 31, 2017, respectively, were used as collateral to secure the payment of these
loans (see Note 9).
(f) TLA with BDO – Trans-Asia 10, 8 and 9
In 2014, Trans-Asia availed loans from BDO for the acquisition of MV Trans-Asia 10
totaling to P120.0 million at an interest rate of 4.5% per annum. Also, a loan amounting
to P79.7 million was obtained from BDO to provide financing to Oceanstar for the
purchase of MV Trans-Asia 8 and 9. Principal and interest payments on these loans are
made monthly.
Trans-Asia made additional loans from BDO totaling to P263.5 million in 2016 at an
interest rate of 4.25% per annum. Principal payments are made monthly with a grace
period of one year and interest on these loans is payable monthly in arrears.
(g) TLA with CBC – Trans-Asia
Trans-Asia Shipping secured borrowings from CBC in 2010 in the amount of
P135.0 million. This loan is payable for a term of ten periods inclusive of two periods
grace period at 5.00% per annum. Interest is to be paid quarterly in arrears based on
diminishing balance.
In addition, a loan from CBC amounting to P71.1 million was availed in 2015 at an interest
rate of 4.50% per annum. Principal is payable monthly with a grace period of two periods
and interest is payable monthly in arrears based on diminishing balance. This loan was
used to partially finance the purchase of MV Trans-Asia 12, a vessel owned by one of its
subsidiaries, Oceanstar. These loans have been fully settled as of December 31, 2017.
(h) TLA with UCPB and PBComm – DGMSI
In 2014, DGMSI obtained loans from UCPB and PBComm to fund its acquisition of
secondhand tugboats imported from Japan and Korea for use in the expansion of its
business activity. The same loans are collateralized with three of its tugboats acquired
and a time deposit placement amounting to P5.0 million. These loans have interest rates
of ranging from 6.00% to 6.50% per annum, and are subject to annual resetting. These
loans will mature on various dates in 2019.
(i) TLA with CBC – CLC
In 2016, the Company obtained a P1.8 billion loan from CBC to finance the acquisition of
the outstanding shares of CSC. The loan is subject to annual interest rate of 4.50% and is
payable on a lump sum basis in 181 days. The loan is secured by means of mortgage,
pledge, assignment or any other form of encumbrance upon any and all properties or
assets of the Company’s President and Chairman of the BOD (see Note 20.8).

- 51 -
In 2017, the Company converted its P1.8 billion bank loan to a six-year term loan from
China Bank with a grace period of four quarters which commenced on the date of
conversion. The principal is payable per quarter amounting to P45 million with balloon
payment at maturity and shall commence on the quarter after the grace period and the
interest shall be paid on arrears. The loan is secured by the same properties as mentioned
in the initial bank loan.
(j) TLA with CTBC, MICBC, RBC and FCB – Trans-Asia
In 2017, Trans-Asia entered into a five-year loan facility agreement amounting to
P300.0 million each with CTBC, MICBC and RBC and P200.0 million with FCB to bridge the
facility obtained by CSC to fund the acquisition of Trans-Asia and for general working
capital purposes. In the same year, Trans-Asia made a drawdown of P1,100.0 million loan
to bridge the loan obtained by CSC in 2016. The loan is subject to annual interest rate of
6.10% and is payable on quarterly basis. Principal repayments shall be 5% of the loan in
the first and second year, 15% in the third and fourth year and 60% in the fifth year of the
drawdown. The loan is secured by Trans-Asia shares, a corporate guarantee by Udenna
and individual surety of the Company’s chairman of the BOD (see Note 20.8).
Interest expense incurred on these loans amounted to P3.6 million and is presented as
part of Finance costs under the Other Income (Charges) account in the 2018 consolidated
statement of profit or loss (see Note 18.1).
(k) TLA with PBB – Starlite
In 2015, Starlite entered into a 10-year term loan agreement amounting to
P1,037.4 million with PBB to finance the acquisition of MV Eagle, MV Archer and MV
Saturn. The loans are subject to a fixed interest rate of 7.5% and the principal is payable
in arrears.
In 2017, Starlite obtained a 15-year term loan agreement amounting to P800.0 million
with PBB. The loan is subject to annual interest rate of 7.0% and principal repayments
including the interest shall commence on the first quarter after a grace period of one year
from the date of availment.
Interest incurred on these loans amounted to P34.1 million in 2018 and is presented as
part of Finance costs under the Other Income (Charges) account in the 2018 consolidated
statement of profit or loss (see Note 18.1).
Certain vessels of Starlite with net carrying amounts of P1,285.0 million and P1,283.4
million as of March 31, 2018 and December 31, 2017 were used as collateral to secure the
payment of these loans (see Note 9).
(l) TLA with DBP - Starlite
In 2016 and 2015, Starlite entered into a 15-year term loan agreement amounting to
P306.0 million and P300.0 million, respectively, with DBP to finance the acquisition of MV
Pioneer and MV Reliance. The loan is subject to annual interest rate of 6.95% and is
payable on a quarterly basis. Principal repayments shall commence after the grace period
of three periods.
Interest incurred on these loans amounted to P10.5 million in 2018 and is presented as
part of Finance costs under the Other Income (Charges) account in the 2018 consolidated
statement of profit or loss (see Note 18.1).

- 52 -
Certain vessels of Starlite with net carrying amounts of P791.4 million and P735.9 million
as of March 31, 2018 and December 31, 2017 were used as collateral to secure the
payment of these loans (see Note 9).
(m) TLA with DBP – PNX-Chelsea
On January 25, 2018, PNX-Chelsea entered into a loan agreement with DBP amounting to
P575.0 million to refinance the acquisition of MV San Pedro Calungsod, MV San Lorenzo
Ruiz Uno and MV St. Nicholas of Myra. The loan is subject to annual interest rate of 6.50%
and is payable in 60 equal quarterly installments commencing on the first quarter from
the initial drawdown.
Certain vessels of PNX-Chelsea with net carrying amounts of P562.1 million of March 31,
2018 were used as collateral to secure the payment of these loans (see Note 9).
13.2 Bank Loans
The details of the Group’s bank loans are as follows:
The bank loans were obtained to finance the drydocking of certain vessels and to support the
Group’s working capital requirements. These loans are secured by certain vessels owned by the
Group with total net carrying amount of P1,626.9 million and P1,637.4 million as of March 31,
2018 and December 31, 2017, respectively (see Notes 9 and 20.8).
Interest expense on these bank loans is presented as part of Finance costs under the Other
Income (Charges) account in the 2017 consolidated statement of profit and loss (see Note 18.1).
March 31, December 31,
Interest 2018 2017
Security Terms Rates (Unaudited) (Audited)
Primary Ins ti tutional Lenders 30 t0 96 days 4.25% to 5.00% 1,057,443,591 P 923,290,258 P
UCPB MT Chelsea Intrepid
MT BMI Patricia 90 days 5.00% to 5.75% 898,900,000 890,502,192
DBP MT Chelsea Cherylyn 180 days 4.00 to 4.25% 298,500,000 300,000,000
Chinabank TA 15, CY1 and Main Bui lding 360 days 4.50% 278,427,397 -
Union Bank of the Phi l ippines Uns ecured 360 days 4.50% 200,000,000 -
Unicapi ta l Uns ecured 90 days 5.50% 199,000,000 140,000,000
PBCom MT Ernesto Uno 180 to 270 days 4.75% 186,650,625 130,765,000
Robinsons Bank Corporation MT Chels ea Denis e 180 days 5.50% 78,900,000 57,300,000
BDO Uns ecured 1 year 7.00% 48,459,247 -
PVB Uns ecured 180 days 4.18% 39,623,975 -
Securi ty Bank Corporation (SBC) Chattel Mortgage 5 years 6.50% 4,173,730 10,434,324
BPI Uns ecured 48 days 9.47% to 10.28% 2,198,808 2,436,125 Chinabank Savings Uns ecured 48 days 0.71% 980,819 1,086,678
3,293,258,192 P 2,455,814,577 P
Outstanding Balance

- 53 -
13.3 Mortgage Payables
Mortgage loans pertain to loans obtained by the Group to finance the acquisition of certain
properties and transportation equipment. These loans bear average effective interest rates
ranging from 4.25% to 8.50% both in 2018 and 2017. Interest incurred on these loans are
included as part of Finance costs under the Other Income (Charges) – net section of the
consolidated statement of profit or loss (see Note 18.1).
These loans are secured by certain properties and transportation equipment with total carrying
amount of P58.0 million and P57.6 million as of March 31, 2018 and December 31, 2017,
respectively (see Note 9).
13.4 Obligations Under Finance Lease
In 2018, the Group entered into a finance lease agreement through sale and leaseback
arrangement with a local bank to seek additional funding and accommodate expenses for the
acquisition of certain machinery and equipment. These finance lease agreements have effective
interest rates of 6.49% to 6.76% per annum, payable in 48 equal monthly payments and are
secured by a chattel mortgage on the Company’s machinery and equipment. Total interest
expense incurred amounted to P0.3 million for the three months ended March 31, 2018 and is
shown as part of Finance Costs in the 2018 consolidated statement of profit or loss
(see Note 18.1).
March 31, December 31,
Interest 2018 2017
Security Terms Rates (Unaudited) (Audited)
BDO Rea l Es ta te Mortga ge 10 yea rs 4.25% 117,500,000 P 120,000,000 P
AUB Cha ttel Mortgage on
Tra ns portation Equipment 3 to 5 yea rs 7.00% to 8.50% 26,828,593 27,411,954
CBC Cha ttel Mortgage on
Tra ns portation Equipment 3 yea rs 7.00% 3,388,406 3,839,567
RCBC Cha ttel Mortgage on
Tra ns portation Equipment 3 yea rs 7.00% 3,275,706 3,996,246
BDO Cha ttel Mortgage on
Tra ns portation Equipment 3 yea rs 7.30% 3,017,973 3,129,183
PNB Cha ttel Mortgage on
Tra ns portation Equipment 1 yea r 7.30% 2,341,193 2,358,952
BDO Cha ttel Mortgage on
Tra ns portation Equipment 3 yea rs 6.90% to 7.53% 1,038,362 1,243,743
CBC Rea l Es ta te Mortga ge 10 yea rs 6.00% - -
157,390,233 P 161,979,645 P
Outstanding Balance

- 54 -
13. TRADE AND OTHER PAYABLES
This account consists of:
March 31, December 31,
2018 2017
Notes (Unaudited) (Audited)
Trade payables 20.2, 20.6 P 1,389,816,585 P 1,053,282,818
Accrued expenses 12 142,145,167 168,041,389
Deferred output VAT 93,188,447 69,258,421
Output VAT 15,856,565 19,601,544
Deposits payable 978,830 885,112
Provisions 23.4 800,000 801,086
Others 84,357,271 68,979,036
P 1,727,142,865 P 1,380,849,406
Accrued expenses comprise amounts to be paid in relation to repairs and maintenance, fuel and
lubricants, interest expense arising from loans, and professional fees rendered to the Group
during the year.
Deferred output VAT pertains to taxes payable based on VATable revenues from services
rendered which remained uncollected as of the end of the reporting periods.
Others include withholding taxes payable and other government-related liabilities.
14. DEPOSITS FOR FUTURE STOCK SUBSCRIPTION
An analysis of the movements in the balance of deposits on future stock subscription is
presented below.
March 31, December 31,
2018 2017
(Unaudited) (Audited)
Balance at beginning of period P 180,000,000 P 50,000,000
Addition during the period - 180,000,000
Reversal to advances - ( 50,000,000 )
Balance at end of period P 180,000,000 P 180,000,000
The balance as at March 31, 2018 and December 31, 2017 represents preferred shares
subscription of certain individuals in Trans-Asia. These are presented as current liability in the
consolidated statements of financial position as the requirements of SEC Financial Reporting
Bulletin No. 006 (as revised in 2013) for classification as equity has not been complied with as
of the end of the reporting period.

- 55 -
15. COST OF SALES AND SERVICES
The details of this account are shown below.
2018 2017
Notes (Unaudited) (Audited)
Bunkering 20.2 P 218,204,394 P 69,628,578
Depreciation and amortization 9, 11 217,337,650 162,960,491
Salaries and employee benefits 17.1 127,690,476 65,039,571
Port expenses 40,484,171 34,846,268
Repairs and maintenance 33,105,069 16,886,189
Insurance 30,275,042 21,849,480
Supplies 18,388,414 16,579,612
Outside services 15,001,749 18,191,032
Charter hire fees 14,986,458 26,934,356
Delivery 11,206,531 -
Rentals 23.3 8,461,887 -
Taxes and licenses 4,446,428 3,819,028
Utilities and communication 4,291,037 2,185,273
Transportation and travel 3,860,629 3,524,305
Technology 2,031,455 -
Cost of inventories sold 1,861,671 1,915,635
Professional fees 986,797 100,514
Commission 601,915 966,097
Representation and entertainment 53,993 189,456
Miscellaneous 5,394,903 3,046,063
P 758,670,669 P 448,661,948

- 56 -
16. OPERATING EXPENSES BY NATURE
The details of operating expenses by nature for the three months ended March 31 are
presented below.
2018 2017
Notes (Unaudited) (Audited)
Depreciation and amortization 9, 11 P 224,013,404 P 166,406,676
Bunkering 20.2 218,204,394 69,856,761
Salaries and employee benefits 17.1 181,664,021 89,184,230
Taxes and licenses 45,524,447 14,336,606
Port expenses 40,487,571 34,846,268
Repairs and maintenance 35,504,612 17,694,533
Insurance 31,032,093 22,501,673
Outside services 25,079,809 24,477,753
Supplies 22,770,017 20,008,296
Rentals 20.3, 23.3 18,136,872 6,516,759
Charter hire fees 14,986,458 26,934,356
Transportation and travel 11,359,291 7,727,680
Delivery 11,206,531 -
Utilities and communication 8,369,197 4,444,697
Professional fees 8,264,050 2,413,273
Commission 2,600,831 966,097
Representation and entertainment 2,104,203 1,654,321
Technology 2,031,455 -
Cost of inventories sold 1,861,671 -
Advertising and promotions 126,003 -
Miscellaneous 20.8(b) 27,230,976 14,417,097
P 932,557,906 P 518,291,169
These expenses are classified in the consolidated statements of profit or loss as follows:
2018 2017
Note (Unaudited) (Audited)
Cost of sales and services 15 P 758,670,669 P 448,661,948
Other operating expense 173,887,237 69,629,221
P 932,557,906 P 518,291,169

- 57 -
17. SALARIES AND EMPLOYEE BENEFITS
17.1 Salaries and Employee Benefits
The details of salaries and employee benefits are presented below.
2018 2017
Notes (Unaudited) (Audited)
Short-term employee benefits P 176,400,724 P 86,171,463
Other employee benefits 5,263,297 332,025
Post-employment benefits 17.2(b) - 2,680,742
16 P 181,664,021 P 89,184,230
These expenses are classified in the consolidated statements of profit or loss as follows:
2018 2017
Notes (Unaudited) (Audited)
Cost of sales and services 15 P 127,690,476 P 65,039,571
Other operating expense 53,973,544 24,144,659
16 P 181,664,021 P 89,184,230
17.2 Post-employment Defined Benefits
(a) Characteristics of Post-employment Defined Benefit Plan
The Group maintains a funded, non-contributory post-employment defined benefit plan
that is being administered by a trustee bank that is legally separated from the Group. The
trustee bank managed the fund in coordination with the Group’s management who acts
in the best interest of the plan assets and is responsible for setting the investment
policies. The post-employment plan covers all regular full-time employees.
The normal retirement age is 60 with a minimum of five periods of credited service.
Normal retirement benefit is an amount equivalent to 22.5 days’ pay for every year of
credited service.
The post-employment defined benefit plan of Trans-Asia also provides for an early
retirement for employees who have served or worked continuously for a period
equivalent to the last salary for every year of service as shown below.
(i) For regular employees who were hired before December 1, 2006
more than two periods to five periods – 7.5 days per year of service
five periods and nine months to ten periods – 15 days per year of service
ten periods and nine months to 15 periods – 22.5 days per year of service
15 periods and nine months and above – 30 days per year of service
(ii) For regular employees who were hired starting December 1, 2006
five periods and nine months to nine periods – 7.5 days per year of service
nine periods and nine months to 15 periods – 15 days per year of service
15 periods and five months to 20 periods – 22.5 days per year of service
20 periods and nine months and above – 30 days per year of service
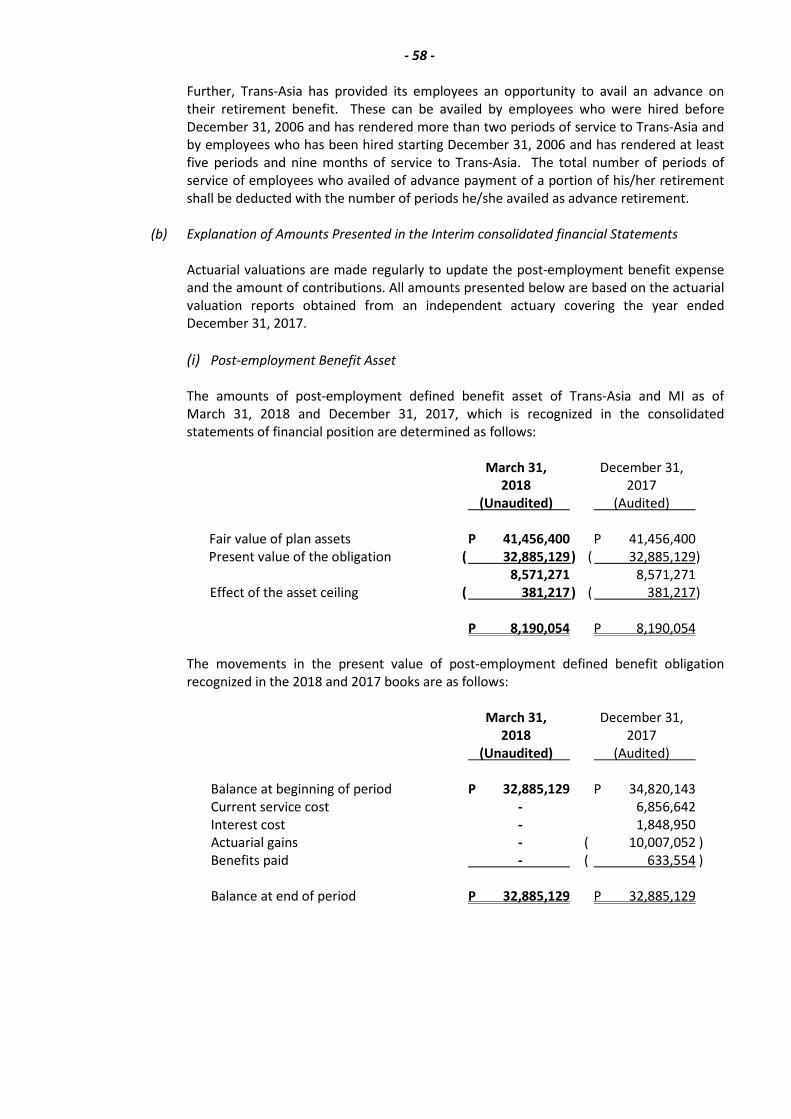
- 58 -
Further, Trans-Asia has provided its employees an opportunity to avail an advance on
their retirement benefit. These can be availed by employees who were hired before
December 31, 2006 and has rendered more than two periods of service to Trans-Asia and
by employees who has been hired starting December 31, 2006 and has rendered at least
five periods and nine months of service to Trans-Asia. The total number of periods of
service of employees who availed of advance payment of a portion of his/her retirement
shall be deducted with the number of periods he/she availed as advance retirement.
(b) Explanation of Amounts Presented in the Interim consolidated financial Statements
Actuarial valuations are made regularly to update the post-employment benefit expense
and the amount of contributions. All amounts presented below are based on the actuarial
valuation reports obtained from an independent actuary covering the year ended
December 31, 2017.
(i) Post-employment Benefit Asset
The amounts of post-employment defined benefit asset of Trans-Asia and MI as of
March 31, 2018 and December 31, 2017, which is recognized in the consolidated
statements of financial position are determined as follows:
March 31, December 31,
2018 2017
(Unaudited) (Audited)
Fair value of plan assets P 41,456,400 P 41,456,400
Present value of the obligation ( 32,885,129 ) ( 32,885,129 )
8,571,271 8,571,271
Effect of the asset ceiling ( 381,217 ) ( 381,217 )
P 8,190,054 P 8,190,054
The movements in the present value of post-employment defined benefit obligation
recognized in the 2018 and 2017 books are as follows:
March 31, December 31,
2018 2017
(Unaudited) (Audited)
Balance at beginning of period P 32,885,129 P 34,820,143
Current service cost - 6,856,642
Interest cost - 1,848,950
Actuarial gains - ( 10,007,052 )
Benefits paid - ( 633,554 )
Balance at end of period P 32,885,129 P 32,885,129

- 59 -
The movements in the fair value of plan assets in 2018 and 2017 are presented below.
March 31, December 31,
2018 2017
(Unaudited) (Audited)
Balance at beginning of period P 41,456,400 P 39,693,662
Balance from MI - 1,502,033
Interest income - 2,090,913
Return on plan assets (excluding
amounts included in net interest) - ( 1,196,654 )
Benefits paid - ( 633,554 )
Balance at end of period P 41,456,400 P 41,456,400
The composition of the fair value of plan assets as at March 31, 2018 and
December 31, 2017 by category and risk characteristics is shown below.
March 31, December 31,
2018 2017
(Unaudited) (Audited)
Cash and cash equivalents P 22,866,053 P 22,866,053
Debt securities:
Philippine government bonds 11,373,808 11,373,808
Corporate bonds 6,140,132 6,140,132
Equity securities 332,850 332,850
Unit investment trust funds 743,292 743,292
Others 265 265
P 41,456,400 P 41,456,400
(ii) Post-employment Benefit Obligation
The amounts of post-employment defined benefit obligation recognized in the
consolidated statements of financial position are determined as follows:
March 31, December 31,
2018 2017
(Unaudited) (Audited)
Present value of the obligation P 42,261,263 P 42,261,263
Fair value of plan assets ( 5,672,383 ) ( 5,672,383 )
P 36,588,880 P 36,588,880

- 60 -
The movements in the present value of post-employment defined benefit obligation
recognized in the books are as follows:
March 31, December 31,
2018 2017
(Unaudited) (Audited)
Balance at beginning of period P 11,078,452 P 11,078,452
Balance from acquired subsidiaries 15,709,900 15,709,900
Actuarial gains 10,209,258 10,209,258
Current service cost 9,154,718 9,154,718
Interest cost 1,234,567 1,234,567
Benefits paid ( 5,125,632 ) ( 5,125,632 )
Balance at end of period P 42,261,263 P 42,261,263
The movements in the fair value of plan assets are presented below.
March 31, December 31,
2018 2017
(Unaudited) (Audited)
Balance at beginning of period P 5,672,383 P 7,031,908
Balance of MI reclassified to asset - ( 1,502,033 )
Interest income - 296,954
Return on plan assets (excluding
amounts included in net interest) - ( 154,446 )
Balance at end of period P 5,672,383 P 5,672,383
The composition of the fair value of plan assets at the end of the reporting periods by
category and risk characteristics is shown below.
March 31, December 31,
2018 2017
(Unaudited) (Audited)
Cash and cash equivalents P 9,923 P 9,923
Equity securities 1,689,378 1,689,378
Debt securities 1,956,795 1,956,795
Unit investment trust funds 2,011,278 2,011,278
Others 5,009 5,009
P 5,672,383 P 5,672,383
The fair values of the above equity and debt securities are determined based on quoted
market prices in active markets (classified as Level 1 of the fair value hierarchy).
The plan assets earned a return of P1.0 million in 2017 and P0.1 million in 2016.
Plan assets do not comprise any of the Group’s own financial instruments or any of its
assets occupied and/or used in its operations.

- 61 -
(iii) Post-employment benefit expense
The amounts of post-employment benefit expense recognized in the 2017 consolidated
statement of profit or loss and consolidated statements of comprehensive income in
respect of the defined benefit post-employment plan are as follows:
Recognized in profit or loss:
Current service cost P 2,680,742
Net interest income ( 268,783 )
P 2,421,959
Recognized in other comprehensive loss –
Return on plan assets (excluding amounts
included in net interest expense) P 1,930,731
Current service cost is allocated and presented in the 2017 consolidated statements of
profit or loss under the following accounts:
Notes
Cost of sales and services 15 P 1,875,881
Other operating expenses 805,861
17.1 P 2,680,742
The net interest expense incurred related to the post-employment defined benefit
obligation is presented as part of Finance costs under the Other Income (Charges) – net
section of the consolidated statements of profit or loss (see Note 18.1).
Amounts recognized in other comprehensive income were included within items that will
not be reclassified subsequently to profit or loss.
In determining the retirement benefit obligation, the following actuarial assumptions
were used:
March 31, December 31,
2018 2017
(Unaudited) (Audited)
Discount rates 5.70% 5.70%
Expected rate of salary increase 5.00% - 8.00% 5.00% - 8.00%
Assumptions regarding future mortality experience are based on published statistics and
mortality tables. The average remaining working lives of an individual retiring at the age
of 60 is 21 for both males and females. These assumptions were developed by
management with the assistance of an independent actuary. Discount factors are
determined close to the end of each reporting period by reference to the interest rates of
a zero coupon government bond with terms to maturity approximating to the terms of
the post-employment obligation. Other assumptions are based on current actuarial
benchmarks and management’s historical experience.

- 62 -
(c) Risks Associated with the Retirement Plan
The plan exposes the Group to actuarial risks such as investment risk, interest rate risk,
longevity risk and salary risk.
(i) Investment and Interest Risks
The present value of the defined benefit obligation is calculated using a discount rate
determined by reference to market yields of government bonds. Generally, a decrease in
the interest rate of a reference government bond will increase the plan obligation.
However, this will be partially offset by an increase in the return on the plan’s investments
in debt securities and if the return on plan asset falls below this rate, it will create a deficit
in the plan. Currently, the plan has investments in cash and cash equivalents, debt and
equity securities and UITF. Due to the long-term nature of the plan obligation, a level of
continuing equity investments is an appropriate element of the Group’s long-term
strategy to manage the plan efficiently.
(ii) Longevity and Salary Risks
The present value of the defined benefit obligation is calculated by reference to the best
estimate of the mortality of the plan participants both during and after their employment,
and to their future salaries. Consequently, increases in the life expectancy and salary of
the plan participants will result in an increase in the plan obligation.
(d) Other Information
The information on the sensitivity analysis for certain significant actuarial assumptions,
the Group’s asset-liability matching strategy, and the timing and uncertainty of future
cash flows related to the retirement plan are described below and in the succeeding page.
(i) Sensitivity Analysis
The table in the succeeding page summarizes the effects of changes in the significant
actuarial assumptions used in the determination of the defined benefit obligation as of
March 31, 2018 and December 31, 2017.
Impact on Post-employment Benefit Obligation
Change in Increase in Decrease in
Assumption Assumption Assumption
Discount rate +/- 1.0% ( P 7,316,857 ) P 8,852,349
Salary growth rate +/- 1.0% 7,960,557 ( 6,748,143 )
The sensitivity analysis is based on a change in an assumption while holding all other
assumptions constant. This analysis may not be representative of the actual change in the
defined benefit obligation as it is unlikely that the change in assumptions would occur in
isolation of one another as some of the assumptions may be correlated. Furthermore, in
presenting the above sensitivity analysis, the present value of the defined benefit
obligation has been calculated using the projected unit credit method at the end of the
reporting period, which is the same as that applied in calculating the retirement benefit
obligation recognized in the consolidated statements of financial position. The methods
and types of assumptions used in preparing the sensitivity analysis did not change
compared to the previous period.

- 63 -
(ii) Asset-liability Matching Strategies
To efficiently manage the retirement plan, the Group through its BOD, ensures that the
investment positions are managed in accordance with its asset-liability matching strategy
to achieve that long-term investments are in line with the obligations under the
retirement scheme. This strategy aims to match the plan assets to the retirement
obligations by investing in long-term fixed interest securities (i.e., government or
corporate bonds) with maturities that match the benefit payments as they fall due and in
the appropriate currency. The Group actively monitors how the duration and the
expected yield of the investments are matching the expected cash outflows arising from
the retirement obligations.
In view of this, investments are made in reasonably diversified portfolio, such that the
failure of any single investment would not have a material impact on the overall level of
assets.
A large portion of the plan assets as of March 31, 2018 and December 31, 2017 consists of
cash and cash equivalents and equity and debt securities, although the Group also invests
in UITF. The Group believes that equity securities offer the best returns over the long
term with an acceptable level of risk. The majority of equity securities are in a diversified
portfolio of local blue chip entities.
There has been no change in the Group’s strategies to manage its risks from the previous
period.
(iii) Funding Arrangements and Expected Contributions
As of March 31, 2018, the plan is underfunded by P36.6 million based on the latest
actuarial valuation. While there are no minimum funding requirements in the country,
the size of the underfunding may pose a cash flow risk in about 21 periods’ time when a
significant number of employees is expected to retire.
The Group expects to make contribution of P2.4 million to the plan during the next
reporting period.
The maturity profile of undiscounted expected benefit payments from the plan within
the next ten periods follows:
March 31, December 31,
2018 2017
(Unaudited) (Audited)
Within one year P 6,573,460 P 6,573,460
More than one year but not
more than five years 29,145,966 29,145,966
More than five periods but not
more than ten years 40,137,840 40,137,840
P 75,857,266 P 75,857,266
The weighted average duration of the defined benefit obligation at the end of the
reporting period is not presented since the Group had not engaged the services of a
qualified actuary in the measurement of its post-employment defined benefit obligation
as of December 31, 2017.

- 64 -
18. OTHER INCOME (CHARGES)
18.1 Finance Costs
The details of this account follow:
2018 2017
Notes (Unaudited) (Audited)
Interest expense on -
Interest-bearing loans 12 P 130,306,595 P 86,691,820
Bank charges 619,211 113,739
Foreign currency exchange
losses – net 34,169,768 18,532,580
P 165,095,574 P 105,338,139
18.2 Finance Income
The breakdown of this account is shown below.
2018 2017
(Unaudited) (Audited)
Foreign currency exchange gains P - P 1,219,987
Interest income 1,614,316 684,726
P 1,614,316 P 1,904,713
18.3 Other Income
Presented below are the details of other income for the periods ended March 31, 2018 and
2017.
2018 2017
Note (Unaudited) (Audited)
Handling and tracking 13,685,860 25,532,543
Rebates 8,000,000 11,601,568
Rental income 20.3, 23.2 1,950,734 1,757,849
Miscellaneous 6,602,667 4,141,725
P 30,239,261 P 43,033,685
Handling and trucking pertains to excess customer charges over amounts payable to various
truckers.
Rebates pertain to the share of Trans-Asia on all cargo handling charges based on the Cebu Port
Authority Tariff rates.
Miscellaneous includes gain on sale of scrap materials, excess customer charges over baggage,
beddings and other services.

- 65 -
19. TAXES
19.1 Registration with the Board of Investments (BOI)
On November 23, 2011 and December 10, 2008, CSC had registered its activity for
MT Great Diamond and MT Chelsea Cherylyn, respectively, with the BOI under Executive Order
No. 226, otherwise known as the Omnibus Investments Code of 1987 as a new operator of
domestic/interisland shipping on a pioneer status. As a registered entity, the Group is entitled
to tax and non-tax incentives, which include a six-year income tax holiday (ITH). For MT Chelsea
Cherylyn, the related tax incentives started in April 2009. Meanwhile, the tax incentive for
MT Great Diamond started in November 2011. ITH incentives shall be limited only to the
revenues generated by the registered activities.
Starlite had also registered MV Archer, MV Saturn, MV Eagle, MV Reliance and MV Pioneer
which commenced on March 2017, August 2016, May 2016, April 2016 and December 2015,
respectively, for a period of four periods. As a registered entity, Starlite is entitled to tax and
non-tax incentives, which includes a four-year ITH. ITH incentives shall be limited only to the
revenues generated by the registered activities.
In 2018 and 2017, the PNX’s BOI registration of MT Chelsea Dominance and MT Chelsea
Charlize, which commenced in November 2016 and September 2015, respectively, for a period
of four periods, was transferred to the Company following its acquisition. The tax and non-tax
incentives of MT Chelsea Dominance and MT Chelsea Charlize are similar to that of MT Great
Princess and MT Chelsea Denise II.
19.2 Current and Deferred Taxes
The components of tax expense as reported in the consolidated statements of profit and loss
and other comprehensive income are shown below.
2018 2017
(Unaudited) (Audited)
Recognized in profit or loss:
Regular corporate income tax P 34,389,531 P 39,133,328
Minimum corporate income tax (MCIT) 320,475 -
Final tax at 20% and 7.5% 45,994 21,168
34,756,000 39,154,496
Deferred tax income relating to
origination and reversal of
temporary differences ( 24,835,795 ) ( 28,304,342 )
P 9,920,205 P 10,850,154
Recognized in other comprehensive income:
Deferred tax expense relating
to origination and reversal
of temporary differences P - P 579,219

- 66 -
The reconciliation of tax on pretax profit computed at the applicable statutory rate to tax
expense reported in the consolidated statements of profit or loss for the periods ended
March 31 is as follows:
2018 2017
(Unaudited) (Audited)
Tax on pretax profit (loss) at 30% P 37,506,241 P 11,395,970
Adjustments for income subjected
to lower tax rates ( 27,948 ) ( 7,003 )
Tax effects of:
Net profit on BOI-registered activities ( 32,781,803 ) ( 5,844,379 )
Nontaxable income ( 4,242,700 ) ( 4,990,549 )
Nondeductible expenses 6,714,180 9,155,346
Unrecognized DTA on Net Operating
Loss Carry Over (NOLCO) 2,681,515 5,698,744
Excess of optional standard deduction 70,720 ( 649,543 )
OSD - ( 213,966 )
P 9,920,205 P 10,850,154
The net deferred tax assets of the Group and certain subsidiaries pertain to the following:
March 31, December 31,
2018 2017
(Unaudited) (Audited)
NOLCO P 191,690,679 P 205,236,419
Retirement benefit obligation 7,826,009 7,826,009
Impairment losses on trade and
other receivables 1,829,076 1,829,076
Impairment losses on property
and equipment 611,054 611,054
MCIT 482,989 482,989
Accrued expenses 90,000 90,000
Revaluation reserves on property
and equipment ( 559,367 ) ( 559,367 )
P 201,970,440 P 215,516,180

- 67 -
The net deferred tax liabilities (DTL) of the Group are as follows:
March 31, December 31,
2018 2017
(Unaudited) (Audited)
Revaluation reserves on property
and equipment ( P 247,559,158) (P 250,001,452 )
NOLCO 109,002,138 73,383,371
MCIT 8,360,599 8,040,180
Capitalized borrowing costs ( 7,165,158) ( 7,165,158 )
Revaluation surplus on disposed vessel ( 3,036,983 ) ( 3,036,983 )
Impairment losses on long-term
financial assets 2,721,268 2,721,268
Provision on estimated liability 2,659,620 2,659,620
Loss on contamination 2,057,831 2,057,831
Post-employment benefit obligation 1,975,112 1,975,112
Impairment losses on trade and
other receivables 730,189 730,189
Unrealized foreign currency loss – net ( 403,390 ) 403,390
Others ( 1,498,116 ) ( 1,498,116 )
(P 132,156,048 ) ( P 170,537,584 )
The net deferred tax expense (income) reported in the consolidated statements of profit or loss
and consolidated statements of comprehensive income is shown below.
The Group is subject to the MCIT, which is computed at 2% of gross income, as defined under
the tax regulations or regular corporate income tax, whichever is higher.
Other Other
Profit or Loss Comprehensive Income Profit or Loss Comprehensive Income
Deferred tax expense (income):
NOLCO 22,073,027 )( P - 16,608,872 )( P -
Revaluation reserves of vessels 2,442,294 )( - 15,926,585 )( -
Unrealized foreign currency loss – net - - 6,891,535 -
Post-employment benefit obligation - - 923,688 )( 579,219 )(
Impairment loss on receivables - - 2,057,831 )( -
MCIT 320,475 )( - - -
Impairment loss on property and
equipment - - 13,333 -
Others - - 307,766 -
24,835,796 )( P - 28,304,342 )( P 579,219 )( P
(Unaudited) (Audited)
20172018
P P

- 68 -
The details of the Group’s NOLCO and MCIT are shown below.
Except for Trans-Asia, DGMSI and FTC, which opted to claim OSD, the Group opted to claim
itemized deductions in computing for its income tax due in 2017. In 2016, the Group opted to
claim itemized deductions in computing for its income tax due.
20. RELATED PARTY TRANSACTIONS
The Group’s related parties include its parent company, related parties under common
ownership, the Group’s key management personnel and stockholders.
A summary of the Group’s transactions with its related parties for the periods ended
March 31, 2018 and 2017 and the related outstanding balances as of March 31, 2018 and
December 31, 2017 is presented below.
Unless otherwise stated, the outstanding receivables and payables from and to related parties
are unsecured, noninterest-bearing and are generally settled in cash upon demand or through
offsetting arrangement with the related parties.
Original Applied in Applied in Expired Remaining Valid
Year Amount Previous Periods Current Period Balance Balance Until
NOLCO:
2018 39,869,943 P - - - 39,869,943 P 2021
2017 906,451,769 - 23,067,992 )( - 929,519,761 2020
2016 10,638,820 - 10,638,820 )( - 21,277,640 2019
2015 11,642,046 - - - 11,642,046 2018
968,602,578 P - 33,706,812 )( P - 1,002,309,390 P
MCIT:
2018 320,475 P - - - 320,475 P 2021
2017 772,955 - - - 772,955 2020
2016 4,392,543 - - - 4,392,543 2019
2015 3,357,615 - - - 3,357,615 2018
8,843,588 P - - - 8,843,588 P
P P P
P
P P
P P
P
P P
March 31, March 31, March 31, December 31,
2018 2017 2018 2017
Related Party Category Notes (Unaudited) (Audited) (Unaudited) (Audited)
Udenna --
Cash advances granted 20.4 117,618,775 P 10,000,000 2,545,852,784 P 2,428,234,009
Cash advances obtained 20.4 - 39,708,002 - -
P-H-O-E-N-I-X Petroleum
Philippines, Inc. (PPPI)
Chartering of services rendered 20.1 148,076,862 114,651,167 285,689,471 271,054,727
Fuel purchases 20.2 28,700,002 9,922,105 50,437,618 )( 77,121,463 )(
Cash advances obtained 20.4 - - 929,026 )( 929,026 )(
Repayment of advances 20.4 - 84,830,229 - -
Acquisition of CSC's shares 20.6 - - 500,000,000 )( 500,000,000 )(
Related party under
common ownership
Rental income 20.3 1,267,241 1,243,859 1,704,124 1,131,385
Rental expense 20.3 683,273 591,974 378,191 )( 378,191 )(
Donation 20.7 90,000 90,000 60,000 )( 90,000 )(
Cash advances granted 33,382,044 - 93,582,828 60,200,784
Cash advances obtained 20.4 1,038,914,100 - 929,026 )( 1,039,843,126 )(
Outstanding BalancesAmounts of Transactions
PP

- 69 -
20.1 Charter Fees and Standby Charges
The Group entered into chartering agreements with PPPI, which are made on the same terms as
those transactions with third parties. The amounts of revenue recognized are presented as part
of Charter fees and Standby charges under the Revenues section of the consolidated statements
of profit or loss. The related outstanding receivable as of March 31, 2018 and December 31,
2017, is presented as part of Trade receivables under the Trade and Other Receivables account
in the consolidated statements of financial position (see Note 5).
The outstanding receivables from related parties are unsecured and do not bear any interest.
Further, no impairment loss was recognized on the outstanding receivables from related parties
in 2018 and 2017 based on management’s assessment.
20.2 Fuel Purchases
The Group purchases fuel and lubes from PPPI. Fuel consumed is included as part of Bunkering
under the Cost of Sales and Services account in the consolidated statements of profit and loss
(see Note 15) while the remaining fuel and lubricants inventory amounting to P88.9 million and
P49.0 million as of March 31, 2018 and December 31, 2017, respectively, are included as part of
the Inventories account in the consolidated statements of financial position (see Note 7). The
outstanding liability arising from these transactions as of March 31, 2018 and December 31,
2017 is presented as part of Trade under the Trade and Other Payables account in the
consolidated statements of financial position (see Note 13). The outstanding liability is
unsecured and non-interest bearing.
20.3 Rentals
The Group entered into a one-year contract of lease covering vehicles with Valueleases, Inc., a
related party under common ownership. Related rent expense is presented as part of Rentals
under Other Operating Expenses in the consolidated statements of profit or loss
(see Note 16). The outstanding security deposit arising from this transaction is presented as
part of Security deposits under the Other Current Assets account in the consolidated statements
of financial position (see Notes 8 and 11).
Furthermore, the Group bills certain related parties under common ownership for their
corresponding share on the office space rent. Income from this transaction is presented as
Other Income under the Other Income (Charges) – net section of the consolidated statements of
profit or loss (see Note 18.3). The related receivable as of March 31, 2018 and December 31,
2017, is presented as part of Trade receivables under the Trade and Other Receivables account
in the consolidated statements of financial position (see Note 5).
The outstanding receivables from related parties are unsecured and do not bear any interest.
No impairment loss was recognized on the outstanding receivables from these transactions as
management has determined that such financial assets are fully collectible.
20.4 Advances to and from Related Parties
In the normal course of business, the Group grants to and obtains unsecured,
noninterest-bearing cash advances from its related parties mainly for working capital
requirements and other purposes. As of March 31, 2018 and December 31, 2017, the
outstanding receivable and payable balances from these advances are shown as Advances to
Related Parties and Advances from Related Parties, respectively, in the consolidated statements
of financial position. These advances have no repayment terms and are generally payable in
cash on demand or through offsetting arrangement with the related parties.

- 70 -
The movement of Advances to Related Parties in 2018 and 2017 follows:
March 31, December 31,
2018 2017
(Unaudited) (Audited)
Balance at beginning of period P 2,488,434,793 P 194,446,078
Net advances during the period 318,238,207 2,293,988,715
Balance at end of period P 2,806,673,000 P 2,488,434,793
Based on management’s assessment, no impairment loss is recognized in 2018 and 2017 related
to the advances granted to related parties.
The movement in the Advances from Related Parties account in 2018 and 2017 follows:
March 31, December 31,
2018 2017
(Unaudited) (Audited)
Balance at beginning of period P 1,040,772,152 P 85,759,255
Net advances during the period 104,129,760 955,012,897
Balance at end of period P 1,144,901,912 P 1,040,772,152
20.5 Transactions with Post-employment Benefit Plan
The Group’s retirement fund is a multi-employer retirement plan, which is administered by a
trustee bank. The retirement fund includes investments in cash and cash equivalents, equity
and debt securities, and UITF with fair value totaling P47.1 million as of March 31, 2018 and
December 31, 2017.
The details of the contributions of the Group and benefits paid out by the plan to employees are
presented in Note 17.2.
20.6 Acquisition of CSC’s Shares
On November 24, 2016, the Company acquired all of the outstanding shares of CSC from PPPI, a
related party under common ownership, for a total consideration of P2.0 billion.
As of March 31, 2018 and December 31, 2017, the outstanding liability to PPPI arising from this
transaction amounted to P500.0 million, which is presented as part of Trade payables under the
Trade and Other Payables account in the consolidated statement of financial position
(see Note 13).
20.7 Key Management Personnel Compensation
The Group’s key management personnel compensation includes short-term benefits and
post-employment defined benefit and are included as part of Salaries and employee benefits
under the Other Operating Expenses account in the consolidated statements of profit or loss
(see Note 16).

- 71 -
20.8 Others
(a) Certain interest-bearing loans of the Group were secured by a corporate guarantee of
Udenna and by certain stockholders through a continuing surety agreement with the
respective banks (see Note 12).
(b) The Group granted donations amounting to P0.1 million in 2018 and 2017 to Udenna
Foundation, Inc., a non-stock, non-profit organization, established by Udenna. This is
presented as part of Miscellaneous under the Other Operating Expenses account in the
consolidated statement of profit and loss (see Note 16).
21. EQUITY
21.1 Capital Stock
Capital stock consists of:
Shares Amount
March 31, December 31, March 31, March 31,
2018 2017 2018 2017
(Unaudited) (Audited) (Unaudited) (Audited)
Authorized - P1 par value: 2,000,000,000 2,000,000,000 P 2,000,000,000 P 2,000,000,000
Issued and outstanding –
Balance at beginning of period 1,821,977,615 500,000,000 P 1,821,977,615 P 500,000,000
Issuance and subscription during the period - 1,321,977,615 - 1,321,977,615
Balance at end of period 1,821,977,615 1,821,977,615 P 1,821,977,615 P 1,821,977,615
As of December 31, 2016, 500,000,000 shares have been subscribed amounting to
P500.0 million, of which P150.0 million have already been collected. Subscription receivable
amounting to P350.0 million as of December 31, 2016 is presented under current assets in the
2016 consolidated statement of financial position and was collected in full in 2017.
On March 27, 2017, CLC acquired all of UIBV’s outstanding capital stock through a share swap
agreement with Udenna wherein Udenna transferred to CLC 18,200 UIBV shares. In exchange,
the Company issued 775,384,615 new common shares from its authorized and unissued capital
stock in favor of Udenna (see Note 10).
On July 11, 2017, the SEC issued an Order approving the Registration Statement covering the
securities which comprised the Company’s outstanding capital stock. On August 8, 2017, the
Company’s shares were listed in the PSE and the trading of offer shares commenced. The
Company offered to the public 546,593,000 primary shares at an offer price of P10.68 per share.
In addition, the Group recognized the APIC amounting to P9,998,370,157, net of issuance costs
amounting to P565,265,468, in the 2017 consolidated statement of financial position. As at
March 31, 2018, the Company’s listed shares closed at P8.02 per share.

- 72 -
21.2 Revaluation Reserves
The components and reconciliation of items of other comprehensive income presented in the
consolidated statements of changes in equity at their aggregate amount under the Revaluation
Reserves account are shown below.
21.3 Other Reserves
Other reserves pertain to the excess of the acquisition price over the net identifiable assets of
CSC amounting to P1.0 billion. The business combination entered on December 12, 2016 is
accounted for under the pooling-of-interest method (see Note 20.6).
22. EARNINGS PER SHARE
Basic and diluted earnings for profit attributable to the Company’s stockholders are computed
as follows:
2018 2017
(Unaudited) (Audited)
Net profit P 115,100,598 P 27,136,411
Divided by weighted average shares outstanding 1,821,977,615 500,000,000
Earnings per share – basic and diluted P 0.06 P 0.05
There were no outstanding convertible preferred shares and bonds or other stock equivalents
as of March 31, 2018 and December 31, 2017; hence, diluted earnings per share is equal to the
basic earnings per share.
Post-employment Investment in
Property and Benefit Associate and a Cumulative
Equipment AFS Financial Obligation Joint Venture translation
(see Note 9) Assets (see Note 17.2) (see Note 10) adjustments Total
Balance as of January 1, 2017 1,287,281,993 P - 34,808,921 P 108,049,607 P 223,517 )( P 1,429,917,004 P
Depreciation transferred to retained -
earnings - revalued tankers 30,705,174 )( - - - - 30,705,174 )(
Other comprehensive income before tax 30,705,174 )( - - - - 30,705,174 )(
Tax income 9,211,552 - - - - 9,211,552
Other comprehensive income after tax 21,493,622 )( - - - - 21,493,622 )(
Balance at March 31, 2018 1,265,788,371 P - 34,808,921 P 108,049,607 P 223,517 )( P 1,408,423,382 P
Balance as of January 1, 2017 1,335,232,117 P 34,725 P 35,731,425 P - - 1,370,998,267 P
Remeasurements of post-employment
benefit obligation - - 1,317,864 )( - - 1,317,864 )(
Disposal of AFS financial assets - 49,607 )( 49,607 )(
Gain on revaluation of tankers 67,317,920 - - 108,049,607 - 175,367,527
Pre-acquisition other comprehensive income 55,484,964 )( - - - 55,484,964 )(
Currency exchange differences on translating
financial statements of foreign operations - - - - 223,517 )( 223,517 )(
Depreciation transferred to retained -
earnings - revalued tankers 65,518,941 )( - - - - 65,518,941 )(
Other comprehensive income before tax 53,685,985 )( 49,607 )( 1,317,864 )( 108,049,607 223,517 )( 52,772,634
Tax income (expense) 5,735,861 14,882 395,360 - - 6,146,103
Other comprehensive income after tax 47,950,124 )( 34,725 )( 922,504 )( 108,049,607 223,517 )( 58,918,737
Balance at December 31, 2017 1,287,281,993 P - 34,808,921 P 108,049,607 P 223,517 )( P 1,429,917,004 P
PP
P
P
P

- 73 -
23. COMMITMENTS AND CONTINGENCIES
The following are the significant commitments and contingencies involving the Group:
24.1 Charter Agreements
The Group has existing commitments to charterers under TC, CVC, and BB agreements for the
use of its vessels in transporting oil products for a fixed period. Also associated with these
charter agreements is the obligation to keep the Group’s vessels in good working condition and
compliant with all the shipping regulations as required by the Maritime Industry Authority.
24.2 Operating Lease Commitments – Group as Lessor
The Group is a lessor under several operating leases covering certain office space. The leases
have terms ranging from one to five years, with renewal options, and include annual escalation
from 5.00% to 10.00%. The future minimum lease receivables under these agreements are
presented below.
March 31, December 31,
2018 2017
(Unaudited) (Audited)
Within one year P 919,465 P 919,465
More than one year but not
more than five years 635,685 635,685
P 1,555,150 P 1,555,150
Rent income amounted to P1.9 million and P1.8 million in 2018 and 2017, respectively, and is
presented as part of Other income account under Other Income (Charges) – net section of the
consolidated statement of profit and loss(see Note 18.3).
24.3 Operating Lease Commitments – Group as Lessee
The Company has finance leases covering certain machinery and equipment with terms
maturing in 2021. The future minimum lease payment (MLP) under finance leases together
with the present value (PV) of net minimum lease payments (NMLP) as of March 31, 2018
follows:
MLP PV of NMLP
Within one year P 15,046,656 P 11,523,776
After one year but not more than five years 48,086,552 44,111,557
P 63,133,208 P 55,635,333

- 74 -
The Group is a lessee under an operating lease covering certain office and warehouse spaces.
The lease has a term of five years commencing on June 10, 2009, with renewal options, and
includes annual escalation rate of 3.0% on the second year and 6.0% from third to fifth year.
The future minimum lease payables under this operating lease are as follows as of:
March 31, December 31,
2018 2017
(Unaudited) (Audited)
Within one year P 20,217,519 P 4,177,691
More than one year but not
more than five years 111,492,038 -
P 131,709,557 P 4,177,691
Total rentals from these operating leases amounted to P18.1 million and P6.5 million and is
included as part of Rentals under the Cost of Sales and Services and Other Operating Expenses
account in the consolidated statement of profit or loss (see Notes 15 and 16).
The related security deposit on this operating lease amounted to P5.7 million and
P5.1 million as of March 31, 2018 and December 31, 2017, respectively, and is shown as Security
deposits under the Other Current Assets and Other Non-current Assets accounts in the
consolidated statements of financial position (see Notes 8 and 11).
24.4 Legal Claims
Trans-Asia is a defendant in an ongoing litigation related to the sinking of MV Asia South Korea.
The Regional Trial Court had provided a decision to award the plaintiffs of the case a total of
P8.9 million for four casualties and 11 survivors. The Group’s legal counsel has advised that it is
probable that Trans-Asia will be found liable; hence, a provision for the claim has been made in
the interim consolidated financial statements. The related liability is presented as part of
Provisions under Trade and Other Payables account in the consolidated statements of financial
position (see Note 13).
Various legal and labor claims were brought against the Trans-Asia in 2017. Management
considers these claims to be unjustified and the probability that these will require settlement at
the Trans-Asia’s expense is remote.
24.5 Unused Lines of Credit
As of March 31, 2018 and December 31, 2017, the Group has unused lines of credit amounting
to P497.0 million and P236.0 million, respectively.
24.6 Others
There are other commitments and contingent liabilities that arise in the normal course of the
Group’s operations which have not been reflected in the Group’s interim consolidated financial
statements. Management is of the opinion that losses, if any, from other commitments and
contingencies will not have material effects on the Group’s interim consolidated financial
statements.
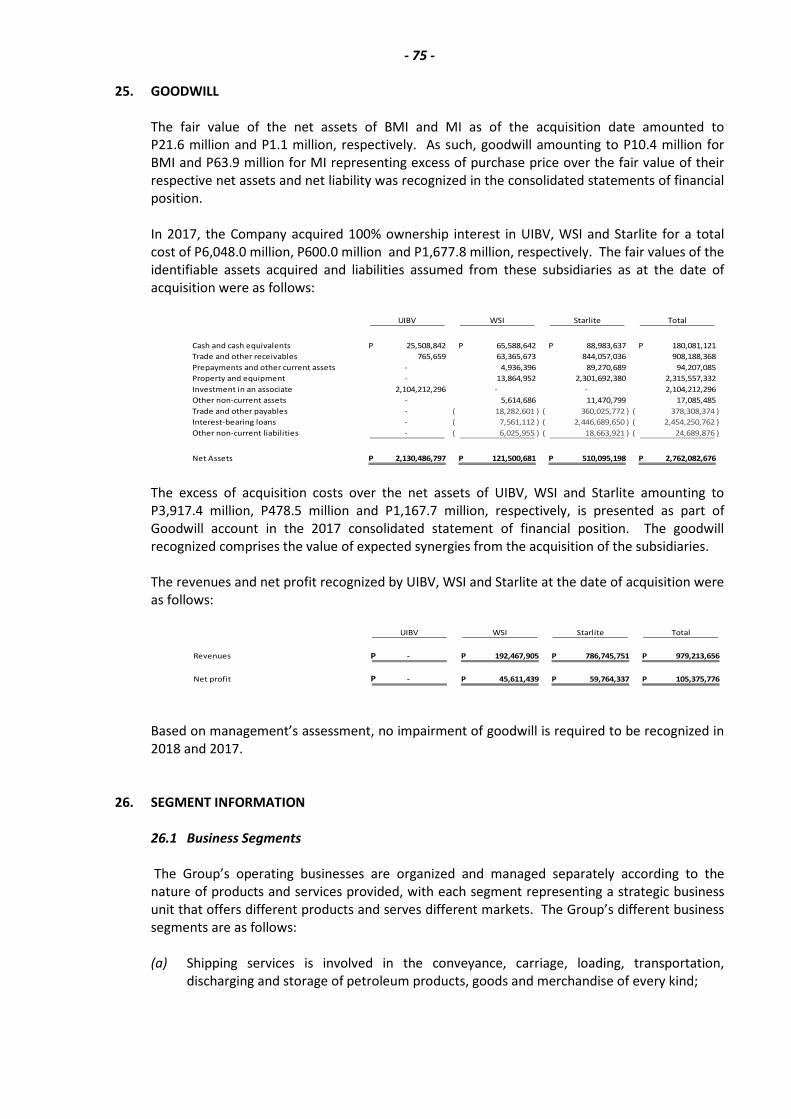
- 75 -
25. GOODWILL
The fair value of the net assets of BMI and MI as of the acquisition date amounted to
P21.6 million and P1.1 million, respectively. As such, goodwill amounting to P10.4 million for
BMI and P63.9 million for MI representing excess of purchase price over the fair value of their
respective net assets and net liability was recognized in the consolidated statements of financial
position.
In 2017, the Company acquired 100% ownership interest in UIBV, WSI and Starlite for a total
cost of P6,048.0 million, P600.0 million and P1,677.8 million, respectively. The fair values of the
identifiable assets acquired and liabilities assumed from these subsidiaries as at the date of
acquisition were as follows:
The excess of acquisition costs over the net assets of UIBV, WSI and Starlite amounting to
P3,917.4 million, P478.5 million and P1,167.7 million, respectively, is presented as part of
Goodwill account in the 2017 consolidated statement of financial position. The goodwill
recognized comprises the value of expected synergies from the acquisition of the subsidiaries.
The revenues and net profit recognized by UIBV, WSI and Starlite at the date of acquisition were
as follows:
Based on management’s assessment, no impairment of goodwill is required to be recognized in
2018 and 2017.
26. SEGMENT INFORMATION
26.1 Business Segments
The Group’s operating businesses are organized and managed separately according to the
nature of products and services provided, with each segment representing a strategic business
unit that offers different products and serves different markets. The Group’s different business
segments are as follows:
(a) Shipping services is involved in the conveyance, carriage, loading, transportation,
discharging and storage of petroleum products, goods and merchandise of every kind;
UIBV WSI Starlite Total
Cash and cash equivalents 25,508,842 P 65,588,642 P 88,983,637 P 180,081,121 P
Trade and other receivables 765,659 63,365,673 844,057,036 908,188,368
Prepayments and other current assets - 4,936,396 89,270,689 94,207,085
Property and equipment - 13,864,952 2,301,692,380 2,315,557,332
Investment in an associate 2,104,212,296 - - 2,104,212,296
Other non-current assets - 5,614,686 11,470,799 17,085,485
Trade and other payables - 18,282,601 )( 360,025,772 )( 378,308,374 )(
Interest-bearing loans - 7,561,112 )( 2,446,689,650 )( 2,454,250,762 )(
Other non-current liabilities - 6,025,955 )( 18,663,921 )( 24,689,876 )(
Net Assets 2,130,486,797 P 121,500,681 P 510,095,198 P 2,762,082,676 P
UIBV WSI Starlite Total
Revenues - 192,467,905 P 786,745,751 P 979,213,656 P
Net profit - 45,611,439 P 59,764,337 P 105,375,776 P
P
P

- 76 -
(b) Tugboats services is involved in the towage and salvage of marine vessels and other crafts
including their cargoes upon seas, lakes, rivers, canals, bays, harbors and other waterways
between the various ports of the Philippines;
(c) Roll-on/roll of passenger shipping services is involved in the transport of passengers and
cargoes within Philippine territorial waters and/or high seas;
(d) Distribution and warehousing services is involved in the logistics services such as but not
limited to cargo freight forwarding (air, land and sea), cargo consolidation, courier
services, distribution, trucking, warehousing, customs brokerage, packing and crating, etc.
(e) Ship management and crewing services is involved in the business of ship management
and in providing full and partial crewing for domestic and foreign vessels; and,
(f) Investing and other activities include holding companies.
Segment accounting policies are the same as the policies described in Note 2.4.
26.2 Segment Assets and Segment Liabilities
Segment assets include all operating assets used by each business segment and consist
principally of operating cash, receivables, inventories and property and equipment, net of
allowances and provisions. Similar to segment assets, segment liabilities include all operating
liabilities used by each segment and consist principally of accounts, wages, taxes currently
payable and accrued liabilities.
26.3 Intersegment Transactions
Segment revenues, expenses and performance include sales and purchases between business
segments. Such sales and purchases are eliminated in consolidation and combination in 2017.
26.4 Analysis of Segment Information
The tables presented in the succeeding page present revenue and profit information regarding
business segments for the periods ended March 31, 2018 and 2017 and certain asset and
liability information regarding segments as at March 31, 2018 and December 31, 2017.

- 77 -
27. RISK MANAGEMENT OBJECTIVES AND POLICIES
The Group is exposed to a variety of financial risks in relation to its financial instruments. The
Group’s financial assets and financial liabilities by category are summarized in
Note 28. The main types of risks are market risk, credit risk and liquidity risk.
The Group’s risk management is coordinated with its parent Group, in close cooperation with
the BOD, and focuses on actively securing the Group’s short to medium-term cash flows by
minimizing the exposure to financial markets.
The Group does not actively engage in the trading of financial assets for speculative purposes
nor does it write options. The relevant financial risks to which the Group is exposed to are
described in the succeeding paragraphs.
27.1 Market Risks
The Group is exposed to market risk through its use of financial instruments and specifically to
foreign currency risk, interest rate risk and certain other price risk which result from both its
operating, investing and financing activities.
(a) Foreign Currency Risk
Most of the Group’s transactions are carried out in Philippine pesos, its functional
currency. Exposures to currency exchange rates arise from the Group’s cash, trade and
other receivables and interest-bearing loans, which are primarily denominated in U.S.
dollars.
Investing and Roll-on/ Distribution and Ship Management
Other Activities Tankering Tugboats Roll-off Passenger Warehousing and Crewing Elimination Consolidated
2018
SEGMENT RESULTS
Sales to external customers - 427,613,678 P 83,268,362 P 610,888,064 P 57,957,318 P - - 1,179,727,422 P
Intersegment sales 68,146,523 - - - - 73,037,911 141,184,434 )( -
Total revenues 68,146,523 427,613,678 83,268,362 610,888,064 57,957,318 73,037,911 141,184,434 )( 1,179,727,422
Cost of sales and services - 254,138,590 42,676,747 433,664,754 29,704,643 71,523,846 73,037,911 )( 758,670,669
Other operating expenses 45,696,164 71,608,938 14,221,595 86,046,549 12,650,503 11,810,011 68,146,523 )( 173,887,237
Operating profit (loss) 22,450,359 101,866,150 26,370,020 91,176,761 15,602,172 10,295,946 )( - 247,169,516
Finance costs 15,533,813 )( 83,708,631 )( 2,958,078 )( 66,746,628 )( 1,115,548 )( 133,443 )( - 170,196,142 )(
Finance income 5,253,695 89,973 153,768 201,342 1,013,427 2,679 - 6,714,884
Share in net income of an associate 11,093,284 - - - - - - 11,093,284
Other income - 2,413,691 - 27,825,570 - - - 30,239,261
Profit (loss) before tax 23,263,525 20,661,182 23,565,710 52,457,045 15,500,051 10,426,710 )( - 125,020,803
Tax expense (income) 10,140,801 22,581,245 )( 7,140,046 10,210,476 4,650,016 360,111 - 9,920,205
Net profit (loss) 13,122,724 P 43,242,427 P 16,425,664 P 42,246,569 P 10,850,035 P 10,786,821 )( P - 115,100,598 P
SEGMENT ASSETS AND
LIABILITIES
Total assets 17,059,018,159 P 12,917,070,946 P 1,084,807,545 P 7,161,966,545 P 185,137,230 P 83,679,964 P 10,237,251,623 )( P 28,254,428,766 P
Total liabilities 2,892,596,162 P 9,074,220,757 P 729,089,214 P 6,044,086,871 P 47,626,616 P 80,984,063 P 3,886,663,927 )( P 14,981,939,756 P
2017
Sales to external customers - 262,807,995 P 63,944,044 P 289,925,436 P - - - 616,677,475 P
Intersegment sales - 14,123,546 2,913,214 - - 47,576,243 64,613,003 )( -
Total revenues - 276,931,541 66,857,258 289,925,436 - 47,576,243 64,613,003 )( 616,677,475
Cost of sales and services - 266,657,221 32,584,717 159,020,306 - 40,889,161 50,489,457 )( 448,661,948
Other operating expenses - 38,109,223 9,582,056 33,374,519 - 9,615,401 21,051,978 )( 69,629,221
Operating profit (loss) - 27,834,903 )( 24,690,485 97,530,611 - 2,928,319 )( 6,928,432 98,386,306
Finance costs - 95,760,511 )( 1,545,242 )( 7,885,483 )( - 146,903 )( - 105,338,139 )(
Finance income - 1,010,892 320,841 570,699 - 2,281 - 1,904,713
Other income - 9,096,031 - 40,624,785 - 241,301 6,928,432 )( 43,033,685
Profit (loss) before tax - 113,488,491 )( 23,466,084 130,840,612 - 2,831,640 )( - 37,986,565
Tax expense (income) - 24,930,888 )( 6,176,245 30,163,255 - 558,458 )( - 10,850,154
Net profit (loss) - 88,557,603 )( P 17,289,839 P 100,677,357 P - 2,273,182 )( P - 27,136,411 P
SEGMENT ASSETS AND
LIABILITIES
Total assets 18,951,605,041 P 11,412,401,836 P 853,196,994 P 6,338,410,534 P 168,650,550 P 64,814,514 P 11,409,465,150 )( P 26,379,614,319 P
Total liabilities 4,684,787,143 P 7,772,852,340 P 516,755,576 P 5,261,321,618 P 37,821,516 P 64,171,046 P 5,115,483,332 )( P 13,222,225,907 P
P
PP P
P P P P
P

- 78 -
To mitigate the Group’s exposure to foreign currency risk, non-Philippine peso cash flows
are monitored.
U.S. dollar denominated financial assets and financial liabilities, translated into Philippine
pesos at the March 31, 2018 and December 31, 2017 closing rates follow:
March 31, December 31,
2018 2017
(Unaudited) (Audited)
Financial assets P 156,300,728 P 191,301,896
Financial liabilities ( 799,192,492 ) ( 834,908,373 )
Net exposure ( P 642,891,764 ) ( P 643,606,477 )
If the Philippine peso had strengthened against the U.S. dollar, profit before tax would
have increased by P47.1 million and P69.3 million in 2018 and 2017, respectively. If the
Philippine peso had weakened against the U.S. dollar, then this would have decreased
profit before tax in 2018 and 2017 by the same amount. This sensitivity of the net result
for the period assumes a +/- 7.33% and +/-10.77% change of the Philippine peso/U.S.
dollar exchange rate for the periods ended March 31, 2018 and December 31, 2017,
respectively. These percentages have been determined based on the average market
volatility in exchange rates, using standard deviation, in the previous three months for
2018 and twelve months in 2017 estimated at 99% level of confidence. The sensitivity
analysis is based on the Group’s foreign currency financial instruments held at the end of
the reporting period.
Exposures to foreign exchange rates vary during the year depending on the volume of
transactions. Nonetheless, the analysis above is considered to be representative of the
Group’s foreign currency risk.
(b) Interest Rate Sensitivity
The Group’s policy is to minimize interest rate cash flow risk exposures on long-term
financing. At March 31, 2018 and December 31, 2017, the Group is exposed to changes in
market interest rates through cash in bank and certain bank borrowings which are subject
to variable interest rates (see Note 12). All other financial assets and liabilities have either
fixed interest rates or noninterest-bearing.
Cash in banks are tested on a reasonably possible change of +/- 0.64% and +/- 0.54% in
2018 and 2017, respectively. Banks loans, which vary with certain foreign interest rates,
are tested on a reasonably possible change of +/- 0.24% and +/- 0.23% in 2018 and 2017,
respectively. These percentages have been determined based on the average market
volatility of interest rates, using standard deviation, in the previous nine months
estimated at 99% level of confidence. The sensitivity analysis is based on the Group’s
financial instruments held at the end of each reporting period, with effect estimated from
the beginning of the year. All other variables are held constant.
The changes in percentages would affect profit or loss before tax by +/- P1.0 million and
+/-P18.6 million for the periods ended March 31, 2018 and December 31, 2017,
respectively.

- 79 -
27.2 Credit Risk
Credit risk is the risk that a counterparty may fail to discharge an obligation to the Group. The
Group is exposed to this risk for various financial instruments, for example, by granting
advances and rendering services to customers and related parties and by placing deposits with
banks.
The Group continuously monitors defaults of customers and other counterparties, identified
either individually or by group, and incorporate this information into its credit risk controls. The
Group’s policy is to deal only with creditworthy counterparties. Also, it is the Group’s policy
that all customers are subject to credit verification procedures.
The maximum credit risk exposure of financial assets is the carrying amount of the financial
assets as shown in the consolidated statements of financial position as summarized below.
Notes 2018 2017
Cash and cash equivalents 4 P 962,856,356 P 1,441,704,190
Trade and other receivables – net
(excluding advances to officers
and employees) 5 1,172,951,920 857,419,350
Restricted cash 8, 11 - 31,043,312
Security deposits 8, 11 22,183,593 17,852,950
Advances to related parties 20.4 2,806,673,000 2,488,434,793
P 4,964,664,869 P 4,836,454,595
None of the financial assets are secured by collateral or other credit enhancements, except for
cash as described below.
The credit risk for cash is considered negligible, since the counterparties are reputable banks
with high quality external credit ratings. Included in cash are cash and cash equivalents which
are insured by the Philippine Deposit Insurance Corporation up to a maximum coverage of
P0.5 million for every depositor per banking institution.
In respect of trade and other receivables, 37.20% and 31.61% of the Group’s outstanding
receivables as of March 31, 2018 and December 31, 2017, respectively, represent claims from
related parties. Based on historical information about default rates, management considers the
credit quality of trade and other receivables that are not past due or impaired to be good.
Financial assets that are past due but not impaired pertain only to trade and other receivables
as detailed below.
2018 2017
Not more than three months P 569,538,998 P 271,416,774
More than three months but
not more than one year 64,281,655 77,355,212
More than one year 134,117,212 118,815,142
P 767,937,865 P 467,587,128
The credit risk for security and other deposits is also considered negligible as the Group has
ongoing lease agreements with the counterparty and the latter is considered to be with sound
financial condition.

- 80 -
27.3 Liquidity Risk
The Group manages its liquidity needs by carefully monitoring scheduled debt servicing
payments for long-term financial liabilities as well as cash outflows due in a day-to-day business.
Liquidity needs are monitored in various time bands, on a day-to-day and
week-to-week basis, as well as on the basis of a rolling 30-day projection. Long-term liquidity
needs for a six-month and one-year period are identified monthly.
The Group maintains cash to meet its liquidity requirements for up to 60-day periods. Funding
for long-term liquidity needs is additionally secured by an adequate amount of committed credit
facilities and the ability to sell long-term financial assets.
As at March 31, 2018, the Group’s financial liabilities have contractual maturities which are
presented below.
As at December 31, 2017, the Group’s financial liabilities have contractual maturities which are
presented below.
These contractual maturities reflect the gross cash flows, which may differ from the carrying
values of the liabilities at the end of the reporting periods.
Within Six to Twelve One to Five More than
Notes Six Months Months Years Five Years
Interest-bearing loans 12 2,769,765,833 P 1,551,958,701 P 6,846,018,596 P 815,503,270 P
Trade and other payables (except for
government-related obligations) 13 1,532,940,582 - - -
Advances from related parties 20.4 572,450,956 572,450,956 - -
4,875,157,371 P 2,124,409,657 P 6,846,018,596 P 815,503,270 P
Current Non-current
Within Six to Twelve One to Five More thanNotes Six Months Months Years Five Years
Interest-bearing loans 12 2,852,209,328 P 1,626,989,697 P 6,652,104,772 P 805,378,747 P
Trade and other payables (except for
government-related obligations) 13 1,222,209,318 - - - Advances from related parties 20.4 520,386,076 520,386,076 - -
4,594,804,722 P 2,147,375,773 P 6,652,104,772 P 805,378,747 P
Current Non-current
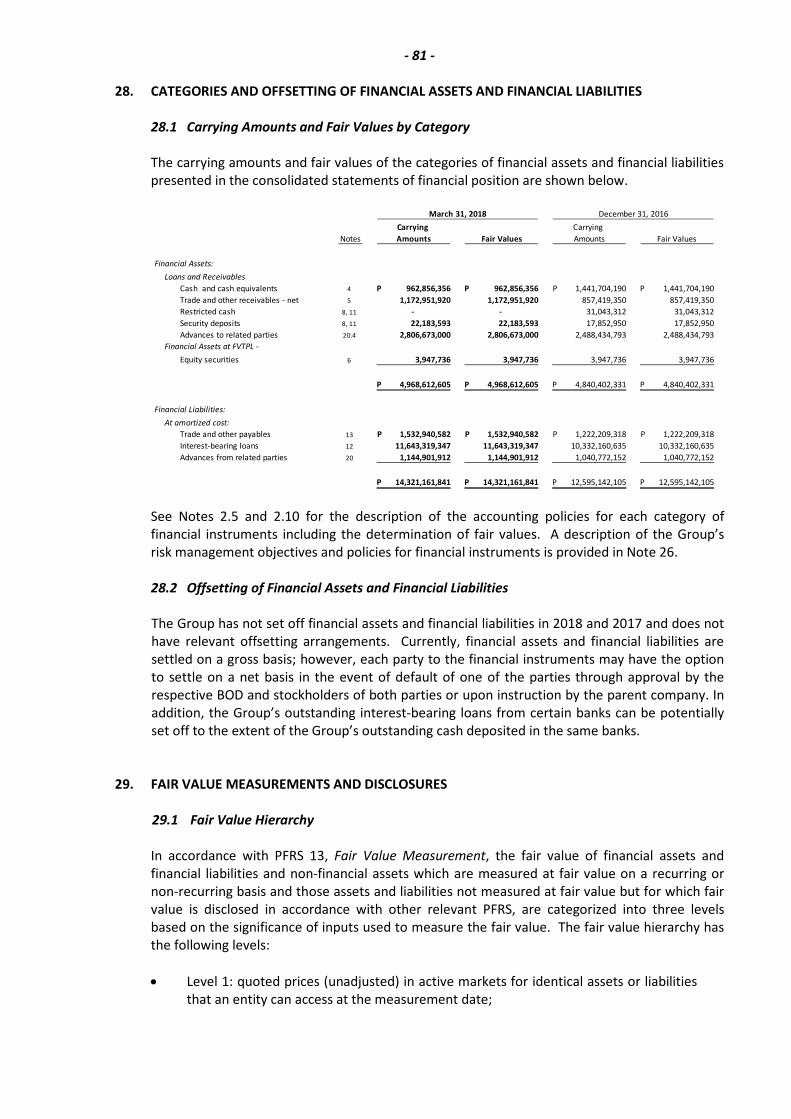
- 81 -
28. CATEGORIES AND OFFSETTING OF FINANCIAL ASSETS AND FINANCIAL LIABILITIES
28.1 Carrying Amounts and Fair Values by Category
The carrying amounts and fair values of the categories of financial assets and financial liabilities
presented in the consolidated statements of financial position are shown below.
See Notes 2.5 and 2.10 for the description of the accounting policies for each category of
financial instruments including the determination of fair values. A description of the Group’s
risk management objectives and policies for financial instruments is provided in Note 26.
28.2 Offsetting of Financial Assets and Financial Liabilities
The Group has not set off financial assets and financial liabilities in 2018 and 2017 and does not
have relevant offsetting arrangements. Currently, financial assets and financial liabilities are
settled on a gross basis; however, each party to the financial instruments may have the option
to settle on a net basis in the event of default of one of the parties through approval by the
respective BOD and stockholders of both parties or upon instruction by the parent company. In
addition, the Group’s outstanding interest-bearing loans from certain banks can be potentially
set off to the extent of the Group’s outstanding cash deposited in the same banks.
29. FAIR VALUE MEASUREMENTS AND DISCLOSURES
29.1 Fair Value Hierarchy
In accordance with PFRS 13, Fair Value Measurement, the fair value of financial assets and
financial liabilities and non-financial assets which are measured at fair value on a recurring or
non-recurring basis and those assets and liabilities not measured at fair value but for which fair
value is disclosed in accordance with other relevant PFRS, are categorized into three levels
based on the significance of inputs used to measure the fair value. The fair value hierarchy has
the following levels:
Level 1: quoted prices (unadjusted) in active markets for identical assets or liabilities
that an entity can access at the measurement date;
Carrying Carrying
Notes Amounts Fair Values Amounts Fair Values
Financial Assets:
Loans and Receivables
Cash and cash equivalents 4 962,856,356 P 962,856,356 P 1,441,704,190 P 1,441,704,190 P
Trade and other receivables - net 5 1,172,951,920 1,172,951,920 857,419,350 857,419,350
Restricted cash 8, 11 - - 31,043,312 31,043,312
Security deposits 8, 11 22,183,593 22,183,593 17,852,950 17,852,950
Advances to related parties 20.4 2,806,673,000 2,806,673,000 2,488,434,793 2,488,434,793
Financial Assets at FVTPL -
Equity securities 6 3,947,736 3,947,736 3,947,736 3,947,736
4,968,612,605 P 4,968,612,605 P 4,840,402,331 P 4,840,402,331 P
Financial Liabilities:
At amortized cost:
Trade and other payables 13 1,532,940,582 P 1,532,940,582 P 1,222,209,318 P 1,222,209,318 P
Interest-bearing loans 12 11,643,319,347 11,643,319,347 10,332,160,635 10,332,160,635
Advances from related parties 20 1,144,901,912 1,144,901,912 1,040,772,152 1,040,772,152
14,321,161,841 P 14,321,161,841 P 12,595,142,105 P 12,595,142,105 P
December 31, 2016March 31, 2018

- 82 -
Level 2: inputs other than quoted prices included within Level 1 that are observable
for the asset or liability, either directly (i.e., as prices) or indirectly (i.e., derived from
prices); and,
Level 3: inputs for the asset or liability that are not based on observable market data
(unobservable inputs).
The level within which the asset or liability is classified is determined based on the lowest level
of significant input to the fair value measurement.
For purposes of determining the market value at Level 1, a market is regarded as active if
quoted prices are readily and regularly available from an exchange, dealer, broker, industry
group, pricing service, or regulatory agency, and those prices represent actual and regularly
occurring market transactions on an arm’s length basis.
When the Group uses valuation technique, it maximizes the use of observable market data
where it is available and relies as little as possible on entity specific estimates. If all significant
inputs required to determine the fair value of an instrument are observable, the instrument is
included in Level 2. Otherwise, it is included in Level 3.
29.2 Financial Instruments Measured at Fair Value
The Group’s financial instruments measured at fair value includes the Financial assets at FVTPL
amounting to P3.9 million and is presented in the consolidated statements of financial position
on a recurring basis.
These are included in Level 1 as the prices of the shares were valued based on their market
prices quoted in the Philippines and U.S. stock exchanges at the end of each reporting period.
The Group has no financial liabilities measured at fair value as of December 31, 2017 and
December 31, 2016.
29.3 Financial Instruments Measured at Amortized Cost but for which Fair Value is Disclosed
The tables below summarize the fair value hierarchy of the Group’s financial assets and financial
liabilities as of March 31, 2018 and December 31, 2017, which are not measured at fair value in
the consolidated statements of financial position but for which fair value is disclosed.
Level 1 Level 2 Level 3 Total
Financial Assets:
Loans and Receivables
Cash and cash equivalents 962,856,356 P - - 962,856,356 P
Trade and other receivables - net - - 1,172,951,920 1,172,951,920
Restricted cash - - - -
Security deposits - - 22,183,593 22,183,593
Advances to related parties - - 2,806,673,000 2,806,673,000
962,856,356 P - 4,001,808,513 P 4,964,664,869 P
Financial Liabilities:
At amortized cost:
Trade and other payables - - 1,532,940,582 P 1,532,940,582 P
Interest-bearing loans - - 11,643,319,347 11,643,319,347
Advances from related parties - - 1,144,901,912 1,144,901,912
Obligations under finance lease - - - -
- - 14,321,161,841 P 14,321,161,841 P
2018
PP
PP
P
PP P

- 83 -
For financial assets with fair values included in Level 1, management considers that the carrying
amounts of these financial instruments approximate their fair values due to their short
duration.
The fair values of the financial assets and financial liabilities included in Level 3, which are not
traded in an active market, are determined based on the expected cash flows of the underlying
net asset or liability based on the instrument where the significant inputs required to determine
the fair value of such instruments.
29.4 Fair Value Measurements of Non-financial Assets
The fair values of the Group’s vessels, included as part of Property and Equipment account,
were determined based on the appraisal reports of a professional and independent appraiser
with appropriate qualifications and recent experience in the valuation of similar properties in
the relevant locations (see Note 10). To some extent, the valuation process was conducted by
the appraiser in discussion with the Group’s management with respect to the determination of
the inputs such as the size, age, and condition of the vessels. In estimating the fair value of
these vessels, management takes into account the market participant’s ability to generate
economic benefits by using the assets in their highest and best use. Based on management’s
assessment, the best use of the Group’s non-financial assets indicated above is their current
use.
The Level 3 fair value of vessels was determined using the cost approach that reflects the cost to
a market participant to construct an asset of comparable usage, construction standards, design
and layout, adjusted for obsolescence. The more significant inputs used in the valuation include
direct and indirect costs of construction such as but not limited to, labor and contractor’s profit,
materials and equipment, surveying and permit costs, electricity and utility costs, architectural
and engineering fees, insurance and legal fees. These inputs were derived from various
suppliers and contractor’s quotes, price catalogues, and construction price indices. Under this
approach, higher estimated costs used in the valuation will result in higher fair value of the
properties.
There has been no change to the valuation techniques used by the Group during the year for its
non-financial assets. Also, there were no transfers into or out of Level 3 fair value hierarchy in
2018 and 2017.
Level 1 Level 2 Level 3 Total
Financial Assets:
Loans and Receivables
Cash and cash equivalents 1,441,704,190 P - - 1,441,704,190 P
Trade and other receivables - net - - 857,419,350 857,419,350
Restricted cash 31,043,312 - - 31,043,312
Security deposits - - 17,852,950 17,852,950
Advances to related parties - - 2,488,434,793 2,488,434,793
1,472,747,502 P - 3,363,707,093 P 4,836,454,595 P
Financial Liabilities:
At amortized cost:
Trade and other payables - - 1,222,209,318 P 1,222,209,318 P
Interest-bearing loans - - 10,332,160,635 10,332,160,635
Advances from related parties - - 1,040,772,152 1,040,772,152
- - 12,595,142,105 P 12,595,142,105 P
2017
P
P
PP
P
PP

- 84 -
30. CAPITAL MANAGEMENT OBJECTIVES, POLICIES AND PROCEDURES
The Group’s capital management objectives are to ensure the Group’s ability to continue as a
going concern and to provide an adequate return to shareholders by pricing products and
services commensurate with the level of risk.
The Group monitors capital on the basis of the carrying amount of equity as presented in the
consolidated statements of financial position. Capital for the reporting periods under review is
summarized as follows:
2018 2017
Total liabilities P 14,981,939,756 P13,222,225,907
Total equity 13,272,489,010 13,157,388,412
Debt-to-equity ratio 1.13 : 1.00 1.00 : 1.00
The Group’s goal in capital management is to maintain a debt-to-equity structure ratio of not
more than 3.00 : 1.00. This is in line with the Group’s bank covenants related to its borrowings.
The Group sets the amount of capital in proportion to its overall financing structure, i.e., equity
and total liabilities. The Group manages the capital structure and makes adjustments to it in the
light of changes in economic conditions and the risk characteristics of the underlying assets. In
order to maintain or adjust the capital structure, the Group may adjust the amount of dividends
paid to shareholders, issue new shares or sell assets to reduce debt.

- 85 -
Item 2. Management's Discussion and Analysis of Financial Condition and Results of Operations
Comparable discussion on Material Changes in Results of Operations for the Three Months Ended
March 31, 2018 vs. March 31, 2017.
Chelsea Logistics Holdings Corp. and subsidiaries (CLC or the Group) posted a Net Profit of
₱115 million for the 1st quarter of 2018. This represents a 326% increase to the Net Profit of ₱27
million during the same period in 2017. The improvement in CLC’s profitability is a result of the
consolidation of the acquired subsidiaries, namely: Worklink Services, Inc. (Worklink) and Starlite
Ferries, Inc. (Starlite) in November 2017 following the Group’s initial public offering on August 8,
2017.
Similarly, EBITDA grew by 65% from ₱290 million in 2017 to ₱478 million in 2018.
Revenues
Presented below is the comparison of the Group’s consolidated revenues for the three (3) months
ended March 31, 2018 as compared to the pro-forma combined revenues for the same period in
2017.
Amounts in millions Q1 2018 % Change
Revenues 1,180 P 617 P 91%
Costs of Sales and Services 759 449 69%
Gross Profit 421 168 151%
Other Operating Expenses 174 70 149%
Operating Income 247 98 152%
Other Charges 122 )( 60 )( 103%
Profit Before Tax 125 38 229%
Tax Expense 10 11 -9%
Net Profit 115 P 27 P 326%
Add back:
Tax Expense 10 11 -9%
Interest Expense 130 87 49%
Depreciation and Amortization 224 166 35%
Less: Interest Income 1 )( 1 )( 0%
EBITDA 478 P 290 P 65%
Consolidated
Pro-Forma
Combined
Amounts in millions Q1 2018 Q1 2017 % Change
Freight 490 P 270 P 81%
Tankering 307 262 17%
Passage 218 192 14%
Tugboats 83 64 30%
Logistics 58 56 4%
Others 24 6 300%
1,180 P 850 P 39%

- 86 -
Based on the comparison of actual first quarter 2018 performance against pro-forma of first quarter
2017, the Group’s revenues increased by ₱330 million or 39% to ₱1.18 billion from ₱850 million.
Each business segment of the Group showed robust growth and improved profitability. The freight
segment increased by 81% from ₱270 million for the first three (3) months of 2017 to ₱490 million
during the same period in 2018 as a result of the acquisition of three freighters in November 2017.
Similarly, the chartering revenues increased from ₱262 million to ₱307 million as a result of higher
freight rates charged for farther distance of port calls during the same period. On the other hand,
passage revenues increased by 14% which was attributable to the operations of MV Starlite Eagle
which started commercial operations in April 2017 plying the Roxas – Caticlan route.
Tugboat fees improved by 30% for the three (3) months ended March 31, 2018 from ₱64 million to
₱83 million. The increase in tugboat fees was primarily due to additional customers acquired during
the last quarter of 2017.
Costs and Expenses
A breakdown of the Group’s consolidated Costs of Sales and Services for the three (3) months ended
March 31, 2018 as compared to the pro-forma combined costs of sales and services for the same
period in 2017 is shown below.
As can be seen from the table above, the most significant increases in Costs of Sales and Services
came from increased bunkering costs, depreciation and amortization and crew salaries and
employee benefits. Bunkering costs grew 66% from ₱131 million to ₱218 million due to additional
vessels deployed and increased prices of fuels. Depreciation and amortization and crew salaries and
employee benefits increased as a result of the acquisition of four (4) additional vessels.
Consolidated
Pro-Forma
Combined
Amounts in millions Q1 2018 Q1 2017 % Change
Bunkering 218 P 131 P 66%
Depreciation and amortization 217 191 14%
Salaries and employee benefits 128 86 49%
Port expenses 41 40 3%
Repairs and maintenance 33 24 38%
Insurance 30 31 -3%
Supplies 18 20 -10%
Charter hire costs 15 27 -44%
Outside services 15 20 -25%
Delivery 11 10 10%
Rentals 9 4 125%
Taxes and licenses 5 5 0%
Utilities and communication 4 4 0%
Transportation and travel 4 5 -20%
Cost of inventories sold 2 2 0%
Technology 2 1 100%
Professional fees 1 - 100%
Commission 1 2 -50%
Miscellaneous 5 7 -29%
759 P 610 P 24%
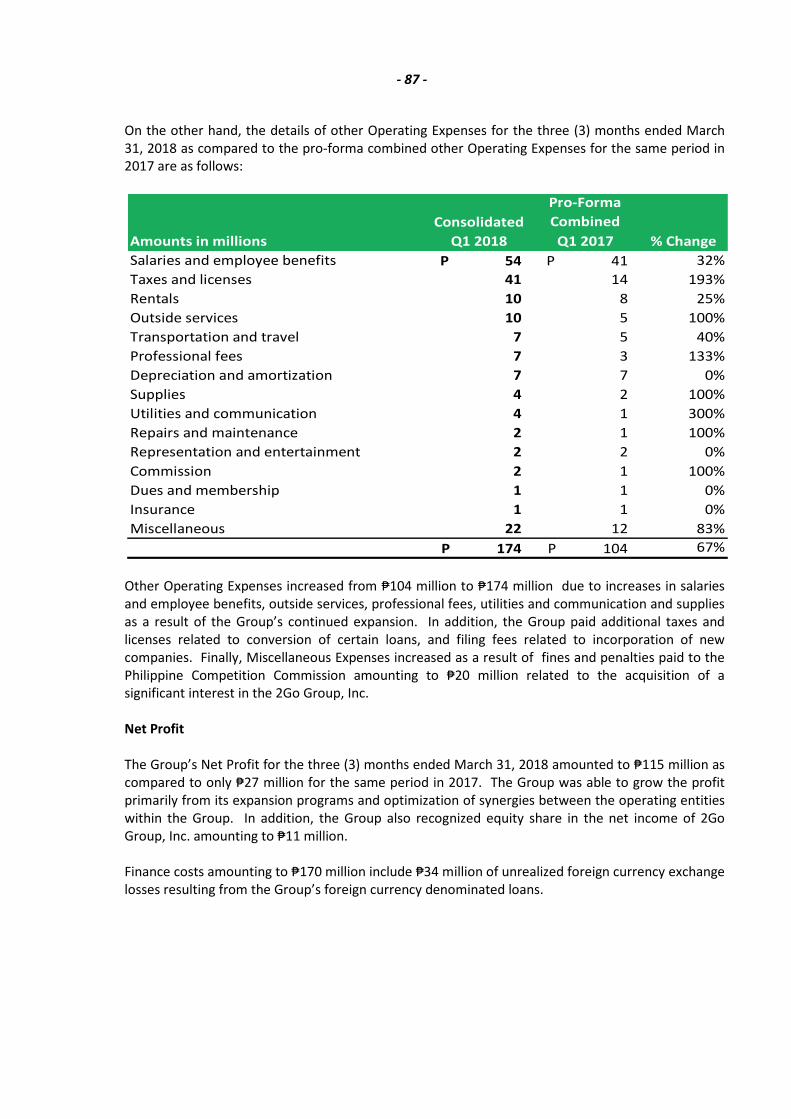
- 87 -
On the other hand, the details of other Operating Expenses for the three (3) months ended March
31, 2018 as compared to the pro-forma combined other Operating Expenses for the same period in
2017 are as follows:
Other Operating Expenses increased from ₱104 million to ₱174 million due to increases in salaries
and employee benefits, outside services, professional fees, utilities and communication and supplies
as a result of the Group’s continued expansion. In addition, the Group paid additional taxes and
licenses related to conversion of certain loans, and filing fees related to incorporation of new
companies. Finally, Miscellaneous Expenses increased as a result of fines and penalties paid to the
Philippine Competition Commission amounting to ₱20 million related to the acquisition of a
significant interest in the 2Go Group, Inc.
Net Profit
The Group’s Net Profit for the three (3) months ended March 31, 2018 amounted to ₱115 million as
compared to only ₱27 million for the same period in 2017. The Group was able to grow the profit
primarily from its expansion programs and optimization of synergies between the operating entities
within the Group. In addition, the Group also recognized equity share in the net income of 2Go
Group, Inc. amounting to ₱11 million.
Finance costs amounting to ₱170 million include ₱34 million of unrealized foreign currency exchange
losses resulting from the Group’s foreign currency denominated loans.
Consolidated
Pro-Forma
Combined
Amounts in millions Q1 2018 Q1 2017 % Change
Salaries and employee benefits 54 P 41 P 32%
Taxes and licenses 41 14 193%
Rentals 10 8 25%
Outside services 10 5 100%
Transportation and travel 7 5 40%
Professional fees 7 3 133%
Depreciation and amortization 7 7 0%
Supplies 4 2 100%
Utilities and communication 4 1 300%
Repairs and maintenance 2 1 100%
Representation and entertainment 2 2 0%
Commission 2 1 100%
Dues and membership 1 1 0%
Insurance 1 1 0%
Miscellaneous 22 12 83%
174 P 104 P 67%

- 88 -
Financial Condition
(March 31, 2018 vs. December 31, 2017)
Total resources of the Group grew to ₱28,255 million as of March 31, 2018 from
₱26,380 million as of December 31, 2017. The increase was brought about by the Group’s continued
expansion programs through the acquisition of various capital asset expenditures.
Cash and cash equivalents declined by 33% from ₱1,442 million as of December 31, 2017 to
only ₱963 million as of March 31, 2018 as a result of continued disbursement of the Group’s
proceeds from its initial public offering in August 2017.
Trade and other receivables surged by 37% from ₱876 million as of December 31, 2017 to
₱1,202 million as of March 31, 2018 primarily as a result of timing of collections from customers.
Increase in inventories of approximately ₱111 million was due to acquisition of spare parts
inventories in preparation for drydocking of certain vessels, and additional fuel and lubricants
inventory in anticipation of increased fuel prices as a result of the implementation of the Tax Reform
for Acceleration and Inclusion. Spare parts inventories rose from ₱88 million as of December 31,
2017 to ₱139 million as of March 31, 2018 while fuel and lubricants rose from ₱49 million to
₱89 million as of the end of the reporting period.
Advances to related parties increased significantly from ₱2,488 million as of December 31, 2017 to
₱2,807 million as of March 31, 2018 as a result of additional advances granted to related parties for
working capital requirements and other purposes. These advances are expected to be settled in
cash or through offsetting arrangements with the related parties.
The increase in Other Current Assets from ₱1,926 million as of December 31, 2017 to
₱2,607 million as of March 31, 2018 was primarily the result of advance payments paid for the
acquisition of a medium-range tanker. The medium-range tanker was subsequently delivered on
April 25, 2018.
Property and equipment grew from ₱11,000 million as of December 31, 2017 to ₱11,896 million as a
result of additional vessel acquisitions during the first quarter of 2018. These vessels are currently
undergoing repairs and/or drydocking and are expected to be in operations starting the second
quarter of the current year.
The increase in Investments in an associate and a joint venture from ₱2,269 million as of
December 31, 2017 to ₱2,280 million as of March 31, 2018 was due to the recognition of the
Company’s share in net income of 2Go Group, Inc.
Amounts in millions Mar. 31, 2018 Dec. 31, 2017 % Change
Current Assets 7,880 P 6,922 P 14%
Non-Current Assets 20,375 19,458 5%
Total Assets 28,255 P 26,380 P 7%
Current Liabilities 7,885 P 6,101 P 29%
Non-Current Liabilities 7,097 7,121 0%
Total Liabilities 14,982 P 13,222 P 13%
Total Equity 13,273 P 13,158 P 1%

- 89 -
Trade and other payables increased by ₱368 million from ₱1,381 million as of
December 31, 2017 to ₱1,749 million as of March 31, 2018. The increase in Trade and other
payables was primarily due to timing of payment of trade payables.
Interest-bearing loans significantly increased by 12% from ₱10,332 million as of December 31, 2017
to ₱11,643 million as of March 31, 2018 primarily as a result of additional loan drawdown during the
period as part of the Group’s continued expansion programs.
The slight increase in Advances from Related Parties was due to unsecured, noninterest-bearing cash
advances from entities under common ownership.
The increase in Income Tax Payable was primarily due to the tax due for the first quarter of 2018.
Note that income tax payable for the year ended December 31, 2017 remains unpaid as of March 31,
2018 as these were only paid in April 2018.
The significant decline in deferred tax liabilities by 35% was mainly due to the tax effect of
depreciation on revaluation increment related to vessels.
The increase in equity, primarily retained earnings, was due to the results of the Company’s financial
performance for the three (3) months ended March 31, 2018.
Key Performance Indicators and Relevant Ratios
The Group’s key performance indicators and relevant ratios and how they are computed are listed
below.
March 31, 2018 December 31, 2017
Current ratio 1.00 1.13
Debt-to-equity ratio 1.13 1.00
Book value per share 7.28 7.22
EBITDA margin 41% 44%
Return on equity 0.87%
Earnings per share 0.06
These key indicators were chosen to provide Management with a measure of the Group’s financial
strength (Current Ratio and Debt to Equity) and the Group’s ability to maximize the value of its
stockholders’ investment in the Group (Return on Equity, Net Book Value Per Share and Earnings Per
Share). Likewise, these ratios are used to compare the Group’s performance with similar companies.
Known Trends or Demands, Commitments, Events or Uncertainties that will impact Liquidity
The Company is not aware of any known trends, demands, commitments, events or uncertainties
that will materially impact on its liquidity.
Events that will trigger Direct or Contingent Financial Obligation that is material to the Company,
including any default or acceleration of an obligation
As discussed in the Note 13 of the interim consolidated financial statements, certain subsidiaries of
the Company have breached its financial covenants with lender banks. Management, however,

- 90 -
believes that such breach will not have an adverse effect on the Company’s financial condition given
their history of prompt payment and Management’s excellent relationships with the lender banks.
Except for contingencies, the Company is not aware of other events that will materially trigger direct
or contingent financial obligation.
Material Off-Balance Sheet Transactions, Arrangements, Obligations (including contingent
obligations), and Other Relationships of the Company with Unconsolidated Entities or Other
Persons Created during the Reporting Period
The Company has no material off-balance sheet transactions, arrangements, obligations and other
relationships with unconsolidated entities or other persons created during the period that is not
included in the Financial Statements.
Material Commitments for Capital Expenditures, the General Purpose of the Commitment and
Expected Sources of Funds
The Company estimates capital expenditures for the year 2018 to amount to ₱4,500 million for
various acquisition of land and related development costs, acquisition of vessels, vessel equipment
and upgrade of facilities. The purchase and/or construction of these capital expenditures will be
financed primarily through the proceeds from the Company’s initial public offering and through
debt.
Known Trends, Events or Uncertainties that will impact Sales / Revenues / Income from
Continuing Operations
The Company is not aware of any known trends, events or uncertainties that will impact sales and/or
income from continuing operations.
Significant Elements of Income or Loss that Did Not Arise from Continuing Operations
The Company is not aware of any element of income or loss that did not arise from continuing
operations.
Seasonal Aspects that had Material Effect on the Financial Condition or Results of Operations
The RoPax segment transports passengers and cargoes within Philippine territorial waters and/or on
the high seas. Due to the seasonal nature of this segment, higher passage revenues and operating
profits are usually experienced in the summer months of the year (March, April and May), school
holidays (October and November) and Christmas holidays (December and January) rather than in the
other months of the year. Freight revenues, on the other hand, are higher at the last quarter of the
year rather than in the early months.
The seasons of the year have no or little effect on the operations of the tanker and tugboat
segments.

- 91 -
PART II OTHER INFORMATION
1. Fortis Tugs Corporation accepted the delivery of MTug Ena Sumo, MTug Hae Kang and MTug Yun
Tong on 10 February, 22 February and 12 April, respectively. These tugboats will be renamed as
Fortis X, Fortis VIII and, Fortis IX, respectively.
2. On 17 February 2018, Trans-Asia Shipping Lines, Incorporated (Trans-Asia) accepted the delivery
of MV Sakura, which was renamed MV Trans-Asia 18.
3. On 23 March 2018, Trans-Asia accepted the delivery of MV Meratus Tangguh 2 (renamed MV
Trans-Asia 17). Subsequently, on 20 April 2018, Trans-Asia accepted its sister vessel, MV
Meratus Tangguh 1 (renamed MV Trans-Asia 16).
4. On 31 March 2018, Chelsea Shipping Corp. accepted the delivery of Floating Dock Wan Ho to be
renamed as Chelsea Exuberance.
5. On 19 March 2018, the Company’s Board of Directors and shareholders approved the (1)
expansion of the Primary Purpose of the Corporation as stated in its Articles of Incorporation to
include the authority to engage in the business of development, management and operation of
infrastructure facilities and systems; (2) creation of Preferred Shares; and, (3) amendment of the
Second and Seventh Articles of the Articles of Incorporation for these purposes.
6. On 25 April 2018, Chelsea Shipping Corp. accepted delivery of a medium range tanker with a t
29,877 GRT. This medium-range tanker will be renamed as MT Chelsea Providence and will
primarily handle the importation requirements of Phoenix Petroleum Philippines, Inc.