Embed Size (px)
Citation preview

Samsung SmartCentreReports
Samsung Telecommunications America reserves the right without prior notice to revise infor-mation in this guide for any reason. Samsung Telecommunications America also reserves theright without prior notice to make changes in design or components of equipment as engi-neering and manufacturing may warrant. Samsung Telecommunications America disclaims allliabilities for damages arising from the erroneous interpretation or use of information present-ed in this guide. All rights reserved.

Produced and distributed under license from Sension Limited, UK. Copyright 2000 Sension Limited,UK. Licensed material. Unauthorized use, duplication or distribution strictly prohibited.
Table of Contents1 Introduction 1-1
2 Report Concepts and Terminology 2-12.1 Devices . . . . . . . . . . . . . . . . . . . . . . . . . . . . . . . . . . . . . . . . . . . . . . . . . .2-1
2.2 Shifts . . . . . . . . . . . . . . . . . . . . . . . . . . . . . . . . . . . . . . . . . . . . . . . . . .2-2
2.3 Filters . . . . . . . . . . . . . . . . . . . . . . . . . . . . . . . . . . . . . . . . . . . . . . . . . .2-2
2.3.1 Filter Elements Supported . . . . . . . . . . . . . . . . . . . . . . . . . . . . . . . . .2-2
2.4 Report Templates . . . . . . . . . . . . . . . . . . . . . . . . . . . . . . . . . . . . . . . . . . . .2-3
3 What Type of Report? 3-1
4 Which Report Template? 4-14.1 Event Reports . . . . . . . . . . . . . . . . . . . . . . . . . . . . . . . . . . . . . . . . . . . . . .4-1
4.1.1 Agent Event Report . . . . . . . . . . . . . . . . . . . . . . . . . . . . . . . . . . . . .4-1
4.1.2 Extension Event Report . . . . . . . . . . . . . . . . . . . . . . . . . . . . . . . . . . .4-2
4.1.3 Line Group Event Report . . . . . . . . . . . . . . . . . . . . . . . . . . . . . . . . . .4-3
4.2 Traffic Reports . . . . . . . . . . . . . . . . . . . . . . . . . . . . . . . . . . . . . . . . . . . . . .4-3
4.2.1 Traffic Reports for Agents . . . . . . . . . . . . . . . . . . . . . . . . . . . . . . . . .4-3
4.2.1.1 Agent Group Traffic Report . . . . . . . . . . . . . . . . . . . . . . . . . .4-4
4.2.1.2 Agent Group Traffic Profile Report . . . . . . . . . . . . . . . . . . . . . .4-5
4.2.1.3 Agent Traffic Report . . . . . . . . . . . . . . . . . . . . . . . . . . . . . . .4-5
4.2.1.4 Agent Traffic Profile Report . . . . . . . . . . . . . . . . . . . . . . . . . .4-6
4.2.2 Traffic Reports for Extensions . . . . . . . . . . . . . . . . . . . . . . . . . . . . . . .4-7
4.2.2.1 Extension Group Traffic Report . . . . . . . . . . . . . . . . . . . . . . . .4-8
4.2.2.2 Extension Group Traffic Profile . . . . . . . . . . . . . . . . . . . . . . . .4-8
4.2.2.3 Extension Traffic Report . . . . . . . . . . . . . . . . . . . . . . . . . . . .4-9
4.2.2.4 Extension Traffic Profile Report . . . . . . . . . . . . . . . . . . . . . . .4-10
4.2.3 Traffic Reports for DIDs . . . . . . . . . . . . . . . . . . . . . . . . . . . . . . . . . .4-11
4.2.3.1 DID Group Traffic Report . . . . . . . . . . . . . . . . . . . . . . . . . . .4-11
4.2.3.2 DID Group Traffic Profile . . . . . . . . . . . . . . . . . . . . . . . . . . .4-12
4.2.3.3 DID Traffic Report . . . . . . . . . . . . . . . . . . . . . . . . . . . . . . .4-13
4.2.3.4 DID Traffic Profile Report . . . . . . . . . . . . . . . . . . . . . . . . . . .4-14
Table of Contents
4.2.4 Traffic Reports for Lines . . . . . . . . . . . . . . . . . . . . . . . . . . . . . . . . . .4-14
4.2.4.1 Line Group Traffic Report . . . . . . . . . . . . . . . . . . . . . . . . . . .4-15
4.2.4.2 Line Group Traffic Profile . . . . . . . . . . . . . . . . . . . . . . . . . . .4-16
4.2.4.3 Line Traffic Report . . . . . . . . . . . . . . . . . . . . . . . . . . . . . . . .4-9
4.3 Utilization Reports . . . . . . . . . . . . . . . . . . . . . . . . . . . . . . . . . . . . . . . . . .4-17
4.3.1 Agent Utilization Report . . . . . . . . . . . . . . . . . . . . . . . . . . . . . . . . .4-14
4.3.2 Agent Utilization Profile Report . . . . . . . . . . . . . . . . . . . . . . . . . . . . .4-18
4.3.3 Extension Utilization Report . . . . . . . . . . . . . . . . . . . . . . . . . . . . . . .4-19
4.3.4 Extension Utilization Profile Report . . . . . . . . . . . . . . . . . . . . . . . . . .4-19
4.4 Contention Report . . . . . . . . . . . . . . . . . . . . . . . . . . . . . . . . . . . . . . . . . .4-17
4.4.1 Contention Report (Standard) . . . . . . . . . . . . . . . . . . . . . . . . . . . . . .4-20
4.4.2 Contention Profile Report . . . . . . . . . . . . . . . . . . . . . . . . . . . . . . . . .4-21
4.5 Wait Time Distribution Report . . . . . . . . . . . . . . . . . . . . . . . . . . . . . . . . . . .4-21
4.6 Sample Reports . . . . . . . . . . . . . . . . . . . . . . . . . . . . . . . . . . . . . . . . . . . .4-22
5 Using MIS Reports to Improve Performance 5-15.1 Queue Problems . . . . . . . . . . . . . . . . . . . . . . . . . . . . . . . . . . . . . . . . . . . . .5-1
5.1.1 Abandoned Calls and Long Waits . . . . . . . . . . . . . . . . . . . . . . . . . . . . .5-1
5.1.2 Complaints of Busy Signals . . . . . . . . . . . . . . . . . . . . . . . . . . . . . . . .5-2
5.2 Other Problems . . . . . . . . . . . . . . . . . . . . . . . . . . . . . . . . . . . . . . . . . . . . .5-2
5.2.1 Unexpected Out-of-Hours Customer Demand . . . . . . . . . . . . . . . . . . . . .5-2
5.2.2 Complaints About Too Many Transfers . . . . . . . . . . . . . . . . . . . . . . . . . .5-3
6 Glossary of Reporter Terminology 6-1
Table of Contents
Introduction
One of the components that comes with the SmartCentre VR and VAR is the SmartCentreReporter. This is a separate program that can be used to collate, view, print and export historicalreports.
This document is designed to give the user a more in-depth understanding of the architecture ofthe Reporter module which will enable them to create the appropriate report template and under-stand how to interpret the information provided. To maximize the benefit of this document, usersshould understand how the programming in the Configurator in SmartCentre could affect theReporter. The key here is that the Configurator must mirror the telephone system configuration,otherwise the information collated by the Reporter will be inaccurate.
While SmartCentre is running, the Reporter logs all monitored telephone traffic to hard disk foranalysis.
To simplify the process of reporting, SmartCentre Reporter provides the concept of a "report tem-plate" to define the contents of a report. You can create any number of report templates. Once cre-ated the report template handles most of the details concerning the collation of an individualreport.
Reports can be collated with respect to any number of defined weekly shifts. For example if twosets of agents manage the call center at different times during each day of the week, thenSmartCentre Reporter can generate reports for each shift as necessary.
Once collated you can either view the report on screen or send a copy to the printer. Note that ifyou have a color printer, SmartCentre Reporter can produce color printouts if required.SmartCentre VAR allows you to export the contents of a report to a text file in comma-delimitedformat suitable for import into many commercial spreadsheet programs.
Page 1-1
1

Report Concepts and Terminology
To understand the SmartCentre Reporter is vital to understand some of the key concepts and ter-minology used in the product. Reference is made to devices, templates, shifts and filters, which areall described in this section.
Further terminology is found in the Glossary of Reporter Terminology, section 6 of this document.
2.1 DevicesSmartCentre refers to lines, DIDs, extensions and agents as devices. The user can create "groups"and "super groups" of devices. A group is simply a collection of devices and a super group is agroup of groups.
The SmartCentre Reporter reports on individual devices, groups and super groups.
To ensure the accuracy of the reports it is vital that the configuration of the telephone system isreflected in the programming of SmartCentre. The following devices can be configured using theConfigurator:
a) Lines
In the context of SmartCentre, a line represents either one of your external trunks connectedto the switch being monitored or one of your network tie lines connecting the monitoredswitch to some other external switch.
Each line can handle only one telephone call at any one time. These calls are denoted as incom-ing or outgoing calls depending on whether the call was originated outside or inside the mon-itored switch.
b) DIDs
A Direct Inward Dial (DID) number is a dynamic numeric attribute assigned to a line on anincoming call. A DID call can be routed to groups of extensions/agents or to an individualextension/agents depending how the call routing software within the switch has been pro-grammed. If configured correctly, SmartCentre MIS can monitor in real time and historicallythe activity of inbound calls associated with DID numbers.
c) Extensions
An extension is the physical telephone handset at which an agent can receive incoming calls,make outgoing calls or handle other forms of internal telephony traffic.
d) Agent - UCD Members on 400siAn agent is the telephone operator who handles calls at an extension. Agents are identifiedfrom the extension number they log in to the group from switch. These agents are typicallymembers of a UCD group within the 400si.
Page 2-1
2
2.2 ShiftsBefore a report can be created the user must program SmartCentre with shifts. These are used tofilter data collected outside the times the user is interested in. In addition to being used to createreports during real working shifts, other shifts can be used to allow the user to understand whathappens outside normal working hours or perhaps at certain times of the week (e.g. Mondays) orat certain times of the day (e.g. lunch time). This way it is possible, for example, to create a reportover a six-month period only looking at the activity on Mondays.
2.3 FiltersThe standard items that make up a report template tend to analyze your call center from one pointof view only. For example, consider the DID Traffic Report and the Agent Traffic Report, thesetwo reports analyze DID traffic and the associated agent traffic in isolation.
What if your call center is set up to route a series of DID numbers to the same group of agents.To obtain the performance of each agent on a per DID basis you need to attach report filters tothe afore-mentioned report items.
In this example you could either create a series of DID traffic reports, each filtered to a differentagent, or you could create a series of agent traffic reports each filtered to a different DID number.
2.3.1 Filter Elements SupportedA report filter is made up of a logical combination of filter elements. Each report item within areport template can have a different report filter attached to it if necessary. The following filter ele-ments are supported:
a) Line Filter Element
This filter element accepts only calls that were connected to a specific line.
b) DID Filter Element
This filter element accepts only calls that were associated with a specific DID number.
c) Extension Filter Element
This filter element accepts only calls that were connected to a specific extension.
d) Agent Filter Element
This filter element accepts only calls that were connected to a specific agent.
e) Line Group Filter ElementThis filter accepts only calls that were connected to lines within a specified line group.
f) DID Group Filter ElementThis filter element accepts only calls that were associated with DID numbers within a speci-fied DID group.
g) Extension Group Filter Element
This filter element accepts only calls that were connected to extensions within a specifiedextension group.
Page 2-2

h) Agent Group Filter Element
This filter element accepts only calls that were connected to agents within a specified agentgroup.
i) Extension Queue Group Filter ElementThis filter element accepts only inbound calls that were finally queued to a specific extensiongroup.
j) Agent Queue Group Filter Element
This filter element accepts only inbound calls that were finally queued to a specific agentgroup.
k) Dialed Digits Filter Element
This filter element accepts only calls whose inbound/outbound dialed digits match a specifiedstring. Note that the character * may be used at any point to denote that the filter will acceptdialed digit strings which are identical up to that point but differ afterwards.
2.4 Report TemplatesIn order to run a report over a given time period there are a number of pieces of informationrequired before the report can be run. We have already covered the importance of the accurate con-figuration of SmartCentre and the need to create shifts. The other thing that the user needs tounderstand is the structure of a report template.
Templates are created by the user to provide relevant information for the selected devices beingmonitored. Templates contain user-selected report items that can be added to a template. Thesereport items can also be configured by the user to include or exclude certain event or traffic types.
Bear in mind the fact that Event Reports are highly detailed and therefore it is unlikely that youwould want to run an Event Report over long periods of time. Similarly Profile Reports that aresuitable for daily use (say with hourly resolution) would not make sense if the report were beingcompiled over a six-month time frame. This being the case you will be advised to create many tem-plates all designed for specific use and each containing appropriate report items.
Page 2-3
What Type of Report?
This section is designed to help users understand which types of report to use to display the infor-mation they require. The terms used on the reports are explained in the next section.
Your SmartCentre product may not have all of the reports listed. Refer to the Product Descriptionto check which reports your SmartCentre product supports.
There are six groups of reports:
a) Event Reports
These are very detailed essentially giving a step-by-step account of what happened on a par-ticular device or group of devices. Event Reports are available for Agents, Extensions and LineGroups.
b) Traffic Reports
Traffic Reports are designed to give an overview of activity and performance against certainparameters. Traffic Reports are available for Agents and Agent Groups, Extensions andExtension Groups, Lines and Line Groups and DIDs and DID Groups. There are two formatsfor Traffic Reports: "standard" and "profile". All Traffic Reports can be presented in a standardformat but some Traffic Reports are also available profiled over flexible time periods.
c) Utilization Reports
Utilization Reports can be used to measure how a resource is being used. This information isdisplayed as the percentage of time that a device or device group has been involved in certaintypes of activity. Utilization Reports can be presented as standard or profiled over flexible timeperiods.
d) Contention Reports
Contention Reports are used to show how much time a resource (line/agent) is unused.Contention Reports can be presented as standard or profiled over flexible time periods.
e) Wait Time Distribution Reports
Wait Time Distribution Reports are used to profile the wait time to show the distribution ofeither answered, abandoned calls or both combined in a single chart.
Page 3-1
3

Which Report Template?
Having established the type of report you need, use this section to help choose exactly the rightreport for your needs. This section includes a list of the available report items that can be includ-ed in a report template for your reference.
4.1 Event ReportsThere are three types of event reports, each recording all events that occur on the specified device(agent, extension or line group). Events are caused by the device, such as an agent, receiving anincoming call, accepting a call, dialing an intercom or outgoing call, among others.
4.1.1 Agent Event ReportThis report shows exactly what an individual agent has been doing over a period by examining allevents caused by the agent's activities.
The following types of agent events and call types are supported:
• Agent logs on.• Agent logs off.• Agent has gone into wrap-up.• Agent is unavailable to take calls.• Agent is available to take calls again.• Agent has received an incoming call.• Agent has received a ring on call (a call that rang at the agent but was not answered at the
agent).• Agent has made an outgoing call.• Agent has made/received an internal/intercom call.
The following call statistics information is provided for each call event:
• The number/name of the extension the agent is logged on at.• The start time and date of the call.• The total duration of the call.• The amount of time the call rang at the agent (only applicable to incoming calls).• The amount of talk time.• The amount of call handling time (includes talk, held and wrap-up time).• The amount of time the call was held at the agent.• The amount of wrap-up time the call required.• The device number, name and group name of the device that the agent was connected to.• The device number and name of the extension/agent the call was transferred from.
Page 4-1
4
• The transfer position number indicating whether this extension was the first/second/third, etc.to receive the transferred call.
• The device number and name of the extension/agent the call was transferred to.• The dialed digits for the call. In the case of incoming calls the CLI for call will be displayed
here.
The report is presented in a call event per row format. Pagination of the report will occur if eitherthere are too many call events to fit in the height of a page or there are too many statistics param-eters to fit in the width of a page.
4.1.2 Extension Event ReportAn extension event report provides an event/call trace for a selected extension.
The following type of extension events and call types are supported:
• Extension logs on as an agent.• Extension logs off.• Extension has gone into wrap-up.• Extension is unavailable to take calls.• Extension is available to take calls again.• Extension has received an incoming call.• Extension has received a ring on call (a call that rang at the extension but was not answered at
the extension).• Extension has made an outgoing call.• Extension has made/received an internal/intercom call.
The following call statistics information is provided for each call event:
• The agent number/name if the extension is logged on.• The start time and date of the call.• The total duration of the call.• The amount of time the call rang at the extension (only applicable to incoming calls).• The amount of call handling time (includes talk, held and wrap-up time).• The amount of talk time.• The amount of time the call was held at the extension.• The amount of wrap-up time the call required.• The device number, name and group name of the device that the extension was connected to.• The device number and name of the extension/agent the call was transferred from.• The transfer position number indicating whether this extension was the first/second/third etc.
to receive the transferred call.• The device number and name of the extension/agent the call was transferred to.• The dialed digits for the call. In the case of incoming calls the CLI for call will be displayed
here.
The report is presented in a call event per row format. Pagination of the report will occur if eitherthere are too many call events to fit in the height of a page or there are too many statistics param-eters to fit in the width of a page.
Page 4-2
4.1.3 Line Group Event ReportA line group event report provides an event/call trace for a selected line group. You can select thecall types in which you are interested, for example, incoming, outgoing or abandoned calls. Forexample to see a list of all abandoned calls the call center experienced, compile a line group eventreport for all lines, selecting abandoned calls only. This report can be useful in finding out theCalling Line Identity (CLI) of the customers who abandoned, so their calls may be returned.
The following type of line events and call types are supported:
• Line went busy on an incoming call.• Line went busy on an abandoned call.• Line went busy on an outgoing call.
The following call statistics information is provided for each call event.
• The number/name of the Line that call appeared on.• The number/name of the DID that was associated with the line.• The start time and date of the call.• The total duration of the call.• The amount of time the line was ringing.• The amount of call handling time (includes ring, talk, and held time).• The amount of talk time.• The amount of time the line was put on hold.• The device number, name and group name of the device that the line was connected to.• The transfer count, i.e. how many times this call was transferred between agents/extensions.• The dialed digits for the call. In the case of incoming calls the CLI for call will be displayed
here.
The report is presented in a call event per row format. Pagination of the report will occur if eitherthere are too many call events to fit in the height of a page or there are too many statistics param-eters to fit in the width of a page.
4.2 Traffic ReportsThere are 15 types of traffic reports, including those relating to agents, extensions, lines and DIDs.
4.2.1 Traffic Reports for AgentsThere are four different report templates available on SmartCentre for traffic reporting on agents:
• Agent Group Traffic Report - provides a breakdown of traffic information for all agent groupswithin an agent super group (group of groups), such as "All Agents".
• Agent Group Traffic Profile Report - provides a profile of traffic information for an agentgroup, such as "Sales" or "Support", over a number of time periods.
• Agent Traffic Report - provides a breakdown of the traffic for individual agents within anagent group.
• Agent Traffic Profile Report - provides a profile of traffic information for an individual agentover a number of time periods.
Page 4-3
For each of these reports, refer to "Configuring Agent Groups" in the help file to configure thestatistics analysis thresholds that control the calculation of GOS (Grade of Service).
On all these reports types there is an opportunity for the user to choose between displaying "aver-age" or "total" statistics. When editing the report item the user checks a box to indicate whetherto show "average" or "total" values. All values on the report item can either be "average" or "total"values, but not a mixture of both. If "averages" and "total" values are both required, it is done bycreating two report items, identical except that one is for "average" values and one is for "total"values.
4.2.1.1 Agent Group Traffic ReportAn agent group traffic report provides historical call statistics data for each agent group within aselected agent super group. The call statistics parameters available are as follows:
• Number of incoming calls that were answered.• Number of internal/intercom calls made/received by agents.• Number of outgoing calls.• Average/total call time of the answered calls (includes wrap-up time).• Average/total talk time of the answered calls.• Average/total wrap-up time of the answered calls.• Average/total call time of the internal/intercom calls.• Average/total call time of the outgoing calls.• Average/total talk time of the outgoing calls.• Number of answered calls that were transferred from another extension/agent.• Number of answered calls that were transferred to another extension/agent.• Number of answered calls that were placed on inquiry hold.• Average/total holding time of these held calls.• Longest holding time of these held calls.• Number of calls that rang at an agent but was not answered at the agent.• Average/total ringing time of these ring-on calls.• Longest ringing time of these ring-on calls.• Longest call time of the answered calls (includes wrap-up time).• Longest talk time of the answered calls.• Longest wrap-up time of the answered calls.• Longest call time of the internal/intercom calls.• Longest call time of the outgoing calls.• Longest talk time of the outgoing calls.• Number of incoming and outgoing calls whose call time was below a short call analysis thresh-
old.• Number of incoming and outgoing calls whose call time was above a long call analysis thresh-
old.• The GOS (Grade of Service) for the agent group.
The report is presented in an agent group per column format. Pagination of the report will occurif either there are too many agent groups to fit in the width of a page or there are too many sta-tistics parameters to fit in the height of a page.
Page 4-4
4.2.1.2 Agent Group Traffic Profile ReportAn agent group traffic profile report provides historical call statistics data for a selected agent grouppresented in a series of uniform time bands. The interval time governing the time bands can beanything from 1 minute up to 999 weeks.
The call statistics parameters available are as follows:
• Number of incoming calls that were answered.• Number of internal/intercom calls made/received by agents.• Number of outgoing calls.• Average/total call time of the answered calls (includes wrap-up time).• Average/total talk time of the answered calls.• Average/total wrap-up time of the answered calls.• Average/total call time of the internal/intercom calls.• Average/total call time of the outgoing calls.• Average/total talk time of the outgoing calls.• Number of answered calls that were transferred from another extension/agent.• Number of answered calls that were transferred to another extension/agent.• Number of answered calls that were placed on inquiry hold.• Average/total holding time of these held calls.• Longest holding time of these held calls.• Number of calls that rang at an agent but was not answered at the agent.• Average/total ringing time of these ring-on calls.• Longest ringing time of these ring-on calls.• Longest call time of the answered calls (includes wrap-up time).• Longest talk time of the answered calls. • Longest wrap-up time of the answered calls.• Longest call time of the internal/intercom calls.• Longest call time of the outgoing calls.• Longest talk time of the outgoing calls.• Number of incoming and outgoing calls whose call time was below a short call analysis thresh-
old.• Number of incoming and outgoing calls whose call time was above a long call analysis thresh-
old.• The GOS (Grade of Service) for the agent group.
The report is presented in a time band per column format. Pagination of the report will occur ifeither there are too many time bands to fit in the width of a page or there are too many statisticsparameters to fit in the height of a page.
4.2.1.3 Agent Traffic ReportAn agent traffic report provides historical call statistics data for each agent within a selected agentgroup. The call statistics parameters available are as follows:
• Total number of calls (this is a summation of the selected call categories within the report).• Average/total handling time of these calls.
Page 4-5

• Percentage of time the agent was busy on these calls. Note that this percentage is based on theshift that you collated the report.
• Calls per hour for the time that the agent is logged on.• Number of incoming calls that were answered.• Average/total call time of these answered calls (this includes wrap-up time).• Average/total talk time of these answered calls.• Average/total wrap-up time of these answered calls.• Number of answered calls per hour for the time that the agent is logged on.• Number of incoming calls that were transferred from another extension/agent.• Number of incoming calls that were transferred to another extension/agent.• Number of incoming calls that were placed on inquiry hold.• Average/total holding time of these held calls.• Number of calls that rang at the extension but were not answered at the extension.• Average/total ringing time of these ring-on calls.• Number of internal/intercom calls made/received by the agent.• Average/total call time of these intercom calls.• Number of intercom calls per hour for the time that the agent is logged on.• Number of outgoing calls made by the extension.• Average/total call time of these outgoing calls.• Average/total talk time of these outgoing calls.• Number of outgoing calls per hour for the time that the agent is logged on.• Number of incoming and outgoing calls whose call time was below the short call analysis
threshold.• Number of incoming and outgoing calls whose call time was above the long call analysis
threshold.• The GOS (Grade of Service) for the agent.• Number of times the agent logged on during the period of analysis.• The percentage of time the agent was logged on during the period of analysis.• Number of times the agent went unavailable during the period of analysis.• The percentage of time the agent was unavailable during the period of analysis.• Call rates per hour logged on for the call categories answered, intercom and outgoing.
The report is presented in an agent per row format with a "totals" entry for the whole group beingpresented at the bottom of the report. Pagination of the report will occur if either there are toomany agents to fit in the height of a page or there are too many statistics parameters to fit in thewidth of a page.
4.2.1.4 Agent Traffic Profile ReportAn agent traffic profile report provides historical call statistics data for a selected agent presentedin a series of uniform time bands. The interval time governing the time bands can be anythingfrom 1 minute up to 999 weeks.
The call statistics parameters available are as follows:
• Total number of calls (this is a summation of the selected call categories within the report).• Average/total handling time of these calls.• Percentage of time the agent was busy on these calls during each time band.
Page 4-6
• Number of incoming calls that were answered.• Average/total call time of these answered calls (this includes wrap-up time).• Average/total talk time of these answered calls.• Average/total wrap-up time of these answered calls.• Number of incoming calls that were transferred from another extension/agent.• Number of incoming calls that were transferred to another extension/agent.• Number of incoming calls that were placed on inquiry hold.• Average/total holding time of these held calls.• Number of calls that rang at the extension but were not answered at the extension.• Average/total ringing time of these ring-on calls.• Number of internal/intercom calls made/received by the agent.• Average/total call time of these intercom calls.• Number of outgoing calls made by the extension.• Average/total call time of these outgoing calls.• Number of incoming and outgoing calls whose call time was below the short call analysis
threshold.• Number of incoming and outgoing calls whose call time was above the long call analysis
threshold.• The GOS (Grade of Service) for the agent.• Number of times the agent logged on during each time band.• The percentage of time the agent was logged on during each time band.• Number of times the agent went unavailable during each time band.• The percentage of time the agent was unavailable during each time band.
The report is presented in a time band per row format. Pagination of the report will occur if eitherthere are too many time bands to fit in the height of a page or there are too many statistics param-eters to fit in the width of a page.
4.2.2 Traffic Reports for ExtensionsThere are four different report templates available on SmartCentre for traffic reporting on exten-sions. They give similar information to the traffic reports for agents. Depending on how your callcenter is run you may choose to use one or the other. Templates available are as follows:
• Extension Group Traffic Report - provides a breakdown of traffic information for all extensiongroups within an extension super group (group of groups), such as "All Extensions".
• Extension Group Traffic Profile Report - provides a profile of traffic information for an agentgroup, such as "Sales Extensions" or "Support Extensions", over a number of time periods.
• Extension Traffic Report - provides a breakdown of the traffic for individual extensions with-in an extension group.
• Extension Traffic Profile Report - provides a profile of traffic information for an individualextension over a number of time periods.
On each of these reports, to configure the statistics analysis thresholds that control the calculationof GOS refer to "Configuring extension groups" in the help file.
Page 4-7
4.2.2.1 Extension Group Traffic Report
An extension group traffic report provides historical call statistics data for each extension groupwithin a selected extension super group. The call statistics parameters available are as follows:
• Number of incoming calls that were answered.• Number of internal/intercom calls made/received by extensions.• Number of outgoing calls.• Average call time of the answered calls (includes wrap-up time).• Average wrap-up time of the answered calls.• Average call time of the internal/intercom calls.• Average call time of the outgoing calls.• Number of answered calls that were transferred from another extension/agent.• Number of answered calls that were transferred to another extension/agent.• Number of answered calls that were placed on inquiry hold.• Average holding time of these held calls.• Longest holding time of these held calls.• Number of calls that rang at an extension but was not answered at the extension.• Average ringing time of these ring-on calls.• Longest ringing time of these ring-on calls.• Longest call time of the answered calls (includes wrap-up time).• Longest wrap-up time of the answered calls.• Longest call time of the internal/intercom calls.• Longest call time of the outgoing calls.• Number of incoming and outgoing calls whose call time was below a short call analysis thresh-
old.• Number of incoming and outgoing calls whose call time was above a long call analysis thresh-
old.• The GOS for the extension group.
The report is presented in an extension group per column format. Pagination of the report willoccur if either there are too many extension groups to fit in the width of a page or there are toomany statistics parameters to fit in the height of a page.
4.2.2.2 Extension Group Traffic ProfileAn extension group traffic profile report provides historical call statistics data for a selected exten-sion group presented in a series of uniform time bands. The interval time governing the time bandscan be anything from 1 minute up to 999 weeks.
The call statistics parameters available are as follows:
• Number of incoming calls that were answered.• Number of internal/intercom calls made/received by extensions.• Number of outgoing calls.• Average call time of the answered calls (includes wrap-up time).• Average wrap-up time of the answered calls.• Average call time of the internal/intercom calls.• Average call time of the outgoing calls.
Page 4-8
• Number of answered calls that were transferred from another extension/agent.• Number of answered calls that were transferred to another extension/agent.• Number of answered calls that were placed on inquiry hold.• Average holding time of these held calls.• Longest holding time of these held calls.• Number of calls that rang at an extension but was not answered at the extension.• Average ringing time of these ring-on calls.• Longest ringing time of these ring-on calls.• Longest call time of the answered calls (includes wrap-up time).• Longest wrap-up time of the answered calls.• Longest call time of the internal/intercom calls.• Longest call time of the outgoing calls.• Number of incoming and outgoing calls whose call time was below a short call analysis thresh-
old.• Number of incoming and outgoing calls whose call time was above a long call analysis thresh-
old.• The GOS for the extension group.
The report is presented in a time band per column format. Pagination of the report will occur ifeither there are too many time bands to fit in the width of a page or there are too many statisticsparameters to fit in the height of a page.
4.2.2.3 Extension Traffic ReportAn extension traffic report provides historical call statistics data for each extension within a select-ed extension group. The call statistics parameters available are as follows:
• Total number of calls (this is a summation of the selected call categories within the report).• Average handling time of these calls.• Percentage of time the extension was busy on these calls. Note that this percentage is based on
the shift that you collated the report.• Number of incoming calls that were answered.• Average call time of these answered calls (this includes wrap-up time).• Average wrap-up time of these answered calls.• Number of incoming calls that were transferred from another extension/agent.• Number of incoming calls that were transferred to another extension/agent.• Number of incoming calls that were placed on inquiry hold.• Average holding time of these held calls.• Number of calls that rang at the extension but were not answered at the extension.• Average ringing time of these ring-on calls.• Number of internal/intercom calls made/received by the extension.• Average call time of these intercom calls.• Number of outgoing calls made by the extension.• Average call time of these outgoing calls.• Number of incoming and outgoing calls whose call time was below the short call analysis
threshold.• Number of incoming and outgoing calls whose call time was above the long call analysis
threshold.
Page 4-9
• The GOS (Grade of Service) for the extension.• Number of times the extension logged on as an agent during the period of analysis.• The percentage of time the extension was logged on as an agent during the period of analysis.• Number of times the extension went unavailable during the period of analysis.• The percentage of time the extension was unavailable during the period of analysis.
The report is presented in an extension per row format with a "totals" entry for the whole groupbeing presented at the bottom of the report. Pagination of the report will occur if either there aretoo many extensions to fit in the height of a page or there are too many statistics parameters to fitin the width of a page.
4.2.2.4 Extension Traffic Profile ReportAn extension traffic profile report provides historical call statistics data for a selected extension pre-sented in a series of uniform time bands. The interval time governing the time bands can be any-thing from 1 minute up to 999 weeks.
The call statistics parameters available are as follows:
• Total number of calls (this is a summation of the selected call categories within the report).• Average handling time of these calls.• Percentage of time the extension was busy on these calls during each time band.• Number of incoming calls that were answered.• Average call time of these answered calls (this includes wrap-up time).• Average wrap-up time of these answered calls.• Number of incoming calls that were transferred from another extension/agent.• Number of incoming calls that were transferred to another extension/agent.• Number of incoming calls that were placed on inquiry hold.• Average holding time of these held calls.• Number of calls that rang at the extension but were not answered at the extension.• Average ringing time of these ring-on calls.• Number of internal/intercom calls made/received by the extension.• Average call time of these intercom calls.• Number of outgoing calls made by the extension.• Average call time of these outgoing calls.• Number of incoming and outgoing calls whose call time was below the short call analysis
threshold.• Number of incoming and outgoing calls whose call time was above the long call analysis
threshold.• The GOS (Grade of Service) for the extension.• Number of times the extension logged on as an agent during each time band.• The percentage of time the extension was logged on as an agent during each time band.• Number of times the extension went unavailable during each time band.• The percentage of time the extension was unavailable during each time band.
The report is presented in a time band per row format. Pagination of the report will occur if eitherthere are too many time bands to fit in the height of a page or there are too many statistics param-eters to fit in the width of a page.
Page 4-10

4.2.3 Traffic Reports for DIDsThere are four different report templates available on SmartCentre for traffic reporting on DIDs:
• DID Group Traffic Report - provides a breakdown of traffic information for all DID groupswithin a DID super group (group of groups), such as "All DIDs".
• DID Group Traffic Profile Report - provides a profile of traffic information for a DID group,such as "Sales DIDs" or "Support DIDs", over a number of time periods.
• DID Traffic Report - provides a breakdown of the traffic for individual DIDs within a DIDgroup.
• DID Traffic Profile Report - provides a profile of traffic information for an individual DIDover a number of time periods.
For each of these reports, to configure the statistics analysis thresholds that control the calculationof GOS refer to "Configuring DID groups" in the help file.
On all these report items types there is an opportunity for the user to choose between displaying"average" or "total" statistics. When editing the report item the user checks a box to indicatewhether to show "average" or "total" values. All values on the report item can either be "average"or "total" values, but not mixture of both. If "averages" and "total" values are both required, it isdone by creating two report items, identical except that one is for "average" values and one is for"total" values.
4.2.3.1 DID Group Traffic ReportA DID group traffic report provides historical call statistics data for each DID group within aselected DID super group. The call statistics parameters available are as follows:
• Number of calls offered.• Number of incoming calls that were answered.• Number of incoming calls that abandoned before being answered.• Percentage of incoming calls abandoned.• Average/total call time of the answered calls.• Average/total talk time of the answered calls.• Average/total waiting time of the answered calls.• Average/total waiting time of the abandoned calls.• Number of answered calls that were transferred to other extensions/agents.• Number of answered calls that were placed on inquiry hold.• Average/total holding time of these held calls.• Longest holding time of these held calls.• Of those calls that were transferred, the average number of times the calls were transferred.• Of those calls that were transferred, the maximum number of times a call was transferred.• Longest call time of the answered calls.• Longest talk time of the answered calls.• Longest waiting time of the answered calls.• Longest waiting time of the abandoned calls.• Target answer times.
Page 4-11
• Number of calls whose waiting time exceeded the long wait analysis threshold including thosecalls that were abandoned.
• Number of calls whose waiting time exceeded the long wait analysis threshold excluding thosecalls that were abandoned.
• The GOS for each DID group (abandoned calls included).• The GOS for each DID group (abandoned calls excluded).• Number of Erlangs of traffic on each DID group.
The report is presented in a DID group per column format. Pagination of the report will occur ifeither there are too many line groups to fit in the width of a page or there are too many statisticsparameters to fit in the height of a page.
4.2.3.2 DID Group Traffic Profile ReportA DID group traffic profile report provides historical call statistics data for a selected DID grouppresented in a series of uniform time bands. The interval time managing the time bands can beanything from 1 minute up to 999 weeks.
The call statistics parameters available are as follows:
• Number of calls offered.• Number of incoming calls that were answered.• Number of incoming calls that abandoned before being answered.• Percentage of incoming calls abandoned.• Average/total call time of the answered calls.• Average/total talk time of the answered calls.• Average/total waiting time of the answered calls.• Average/total waiting time of the abandoned calls.• Number of answered calls that were transferred to other extensions/agents.• Number of answered calls that were placed on inquiry hold.• Average/total holding time of these held calls.• Longest holding time of these held calls.• Of those calls that were transferred, the average number of times the calls were transferred.• Of those calls that were transferred, the maximum number of times a call was transferred.• Longest call time of the answered calls.• Longest talk time of the answered calls.• Longest waiting time of the answered calls.• Longest waiting time of the abandoned calls.• Target answer time.• Number of calls whose waiting time exceeded the long wait analysis threshold including those
calls that were abandoned.• Number of calls whose waiting time exceeded the long wait analysis threshold excluding those
calls that were abandoned.• The GOS for the DID group (abandoned calls included).• The GOS for the DID group (abandoned calls excluded).• Number of Erlangs of traffic on the DID group.
Page 4-12

The report is presented in a time band per column format. Pagination of the report will occur ifeither there are too many time bands to fit in the width of a page or there are too many statisticsparameters to fit in the height of a page.
4.2.3.3 DID Traffic ReportA DID traffic report provides historical call statistics data for each DID number within a selectedDID group. The call statistics parameters available are as follows:
• Number of calls offered.• Number of incoming calls that were answered.• Number of incoming calls that abandoned before being answered.• Percentage of incoming calls abandoned.• Average/total call time of the answered calls.• Average/total talk time of the answered calls.• Average/total waiting time of the answered calls.• Average/total waiting time of the abandoned calls.• Number of answered calls that were transferred to other extensions/agents.• Number of answered calls that were placed on inquiry hold.• Average/total holding time of these held calls.• Longest holding time of these held calls.• Of those calls that were transferred, the average number of times the calls were transferred.• Of those calls that were transferred, the maximum number of times a call was transferred.• Longest call time of the answered calls.• Longest talk time of the answered calls.• Longest waiting time of the answered calls.• Longest waiting time of the abandoned calls.• Target answer time.• Number of calls whose waiting time exceeded the long wait analysis threshold including those
calls that were abandoned.• Number of calls whose waiting time exceeded the long wait analysis threshold excluding those
calls that were abandoned.• The GOS for each DID number (abandoned calls included).• The GOS for each DID number (abandoned calls excluded).• Number of Erlangs of traffic on each DID number.
The report is presented in a DID number per column format with a "totals" column for the wholegroup being presented as the first column. Pagination of the report will occur if either there aretoo many DID numbers to fit in the width of a page or there are too many statistics parametersto fit in the height of a page.
Page 4-13
4.2.3.4 DID Traffic Profile ReportA DID traffic profile report provides historical call statistics data for a selected DID number pre-sented in a series of uniform time bands. The interval time governing the time bands can be any-thing from 1 minute up to 999 weeks.
The call statistics parameters available are as follows:
• Number of calls offered.• Number of incoming calls that were answered.• Number of incoming calls that abandoned before being answered.• Percentage of incoming calls abandoned.• Average/total call time of the answered calls.• Average/total talk time of the answered calls.• Average/total waiting time of the answered calls.• Average/total waiting time of the abandoned calls.• Number of answered calls that were transferred to other extensions/agents.• Number of answered calls that were placed on inquiry hold.• Average/total holding time of these held calls.• Longest holding time of these held calls.• Of those calls that were transferred, the average number of times the calls were transferred.• Of those calls that were transferred, the maximum number of times a call was transferred.• Longest call time of the answered calls.• Longest talk time of the answered calls.• Longest waiting time of the answered calls.• Longest waiting time of the abandoned calls.• Target answer times.• Number of calls whose waiting time exceeded the long wait analysis threshold including those
calls that were abandoned.• Number of calls whose waiting time exceeded the long wait analysis threshold excluding those
calls that were abandoned.• The GOS for the DID number (abandoned calls included).• The GOS for the DID number (abandoned calls excluded).• Number of Erlangs of traffic on the DID number.
The report is presented in a time band per column format. Pagination of the report will occur ifeither there are too many time bands to fit in the width of a page or there are too many statisticsparameters to fit in the height of a page.
4.2.4 Traffic Reports for LinesThere are three different report templates available on SmartCentre for traffic reporting on lines:
• Line Group Traffic Report - provides a breakdown of traffic information for all line groupswithin a line super group (group of groups), such as "All lines".
• Line Group Traffic Profile Report - provides a profile of traffic information for a line group,such as "Lines from Service Provider 'A'" or "Lines from Service Provider 'B'", over a numberof time periods.
Page 4-14
• Line Traffic Report - provides a breakdown of the traffic for individual lines within a linegroup.
For all these reports, to configure the statistics analysis thresholds that control the calculation ofGOS refer to "Configuring line groups" or "Configuring lines" in the help file.
On all these report item types there is an opportunity for the user to choose between displaying"average" or "total" statistics. When editing the report item the user checks a box to indicatewhether to show "average" or "total" values. All values on the report item can either be "average"or "total" values, but not a mixture of both. If "averages" and "total" values are both required, itis done by creating two report items, identical except that one is for "average" values and one isfor "total" values.
4.2.4.1 Line Group Traffic ReportA line group traffic report provides historical call statistics data for each line group within a select-ed line super group. The call statistics parameters available are as follows:
• Number of calls offered.• Number of incoming calls that were answered.• Number of incoming calls that abandoned before being answered.• Percentage of incoming calls abandoned.• Number of outgoing calls.• Average/total call time of the answered calls.• Average/total talk time of the answered calls.• Average/total waiting time of the answered calls.• Average/total waiting time of the abandoned calls.• Average/total call time of the outgoing calls.• Average/total talk time of the outgoing calls.• Number of answered calls that were transferred to other extensions/agents.• Number of answered calls that were placed on inquiry hold.• Average/total holding time of these held calls.• Longest holding time of these held calls.• Of those calls that were transferred, the average number of times the calls were transferred.• Of those calls that were transferred, the maximum number of times a call was transferred.• Longest call time of the answered calls.• Longest talk time of the answered calls.• Longest waiting time of the answered calls.• Longest waiting time of the abandoned calls.• Longest call time of the outgoing calls.• Longest talk time of the outgoing calls.• Target answer times.• Number of calls whose waiting time exceeded the long wait analysis threshold including those
calls that were abandoned.• Number of calls whose waiting time exceeded the long wait analysis threshold excluding those
calls that were abandoned.• The GOS for each line group (abandoned calls included).
Page 4-15
• The GOS for each line group (abandoned calls excluded).• Number of Erlangs of traffic on each line group.
The report is presented in a line group per column format. Pagination of the report will occur ifeither there are too many line groups to fit in the width of a page or there are too many statisticsparameters to fit in the height of a page.
4.2.4.2 Line Group Traffic Profile ReportA line group traffic profile report provides historical call statistics data for a selected line group pre-sented in a series of uniform time bands. The interval time managing the time bands can be any-thing from 1 minute up to 999 weeks.
The call statistics parameters available are as follows:
• Number of calls offered.• Number of incoming calls that were answered.• Number of incoming calls that abandoned before being answered.• Percentage of incoming calls abandoned.• Number of outgoing calls.• Average/total call time of the answered calls.• Average/total talk time of the answered calls.• Average/total waiting time of the answered calls.• Average/total waiting time of the abandoned calls.• Average/total call time of the outgoing calls.
Number of answered calls that were transferred to other extensions/agents.• Number of answered calls that were placed on inquiry hold.• Average/total holding time of these held calls.• Longest holding time of these held calls.• Of those calls that were transferred, the average number of times the calls were transferred.• Of those calls that were transferred, the maximum number of times a call was transferred.• Longest call time of the answered calls.• Longest talk time of the answered calls.• Longest waiting time of the answered calls.• Longest waiting time of the abandoned calls.• Longest call time of the outgoing calls.• Longest talk time of the outgoing calls.• Target answer time.• Number of calls whose waiting time exceeded the long wait analysis threshold including those
calls that were abandoned.• Number of calls whose waiting time exceeded the long wait analysis threshold excluding those
calls that were abandoned.• The GOS for the line group (abandoned calls included).• The GOS for the line group (abandoned calls excluded).• Number of Erlangs of traffic on the line group.
The report is presented in a time band per column format. Pagination of the report will occur ifeither there are too many time bands to fit in the width of a page or there are too many statisticsparameters to fit in the height of a page.
Page 4-16
4.2.4.3 Line Traffic ReportA line traffic report provides historical call statistics data for each line within a selected line group.The call statistics parameters available are as follows:
• Total number of calls (this is a summation of the selected call categories within the report).• Average/total handling time of these calls.• Percentage of time the line was allocated to these calls. Note that this percentage is based on
the shift that you collated the report.• Number of incoming calls that were answered.• Average/total waiting time of these answered calls.• Average/total call time of these answered calls.• Average/total talk time of these answered calls.• Number of answered calls that were put on hold.• Average/total holding time of these held calls.• Number of incoming calls that abandoned before being answered.• Average/total waiting time of these abandoned calls.• Number of outgoing calls.• Average/total call time of these outgoing calls.• Average/total talk time of these outgoing calls.
The report is presented in a line per row format with a "Totals" entry for the whole group beingpresented at the bottom of the report. Pagination of the report will occur if either there are toomany lines to fit in the height of a page or there are too many statistics parameters to fit in thewidth of a page.
4.3 Utilization ReportsUtilization reports apply to agents and extensions and are available in two formats: standard andprofile. There are four utilization reports in all.
4.3.1 Agent Utilization ReportAn agent utilization report provides historical time utilization data for each agent within a select-ed agent group. Note that the times are shown as a percentage based on the shift that you collat-ed the report. The parameters available are as follows:
• The time spent handling incoming calls. This time includes the talk time plus any time spenton hold. This time does not include the amount of time calls were ringing at the agent beforebeing answered.
• The time spent handling outgoing calls. This time includes the talk time plus any time spenton hold.
• The time spent handling internal/intercom calls. This time includes the talk time plus anytime spent on hold. This time does not include the amount of time calls were ringing at theagent before being answered.
• The time spent with incoming calls on hold.• The time spent with outgoing calls on hold.• The time spent with internal/intercom calls on hold.
Page 4-17

• The time spent in wrap-up.• The time spent unavailable.• The time spent being busy, i.e. unavailable for some reason to take calls. This is usually due to
setting up an outgoing call or leaving the handset off hook.• The time spent free.• The time spent with external calls ringing at the agent (% Ring On, Inc).• The time spent with internal calls ringing at the agent (% Ring On, Int).• The time spent logged on.* The time spent logged off.
The report is presented in an agent per row format with a "totals" entry for the whole group beingpresented at the bottom of the report. Note that the "totals" entry for each column is the averagefor all the agents in the group. Pagination of the report will occur if either there are too manyagents to fit in the height of a page or there are too many statistics parameters to fit in the widthof a page.
Utilization percentages can be calculated with respect to either the total reporting period or theamount of time each agent had spent logged on.
4.3.2 Agent Utilization Profile ReportAn agent utilization profile report provides historical time utilization data for a selected agent pre-sented in a series of uniform time bands. The interval time managing the time bands can be any-thing from 1 minute up to 999 weeks.
Note that the times are shown as a percentage based on the shift that you collated the report. Theparameters available are as follows:
• The time spent handling incoming calls. This time includes the talk time plus any time spenton hold. This time does not include the amount of time calls were ringing at the agent beforebeing answered.
• The time spent handling outgoing calls. This time includes the talk time plus any time spenton hold.
• The time spent handling internal/intercom calls. This time includes the talk time plus anytime spent on hold. This time does not include the amount of time calls were ringing at theagent before being answered.
• The time spent with incoming calls on hold.• The time spent with outgoing calls on hold.• The time spent with internal/intercom calls on hold.• The time spent in wrap-up.• The time spent unavailable.• The time spent being busy, i.e. unavailable for some reason to take calls. This is usually due to
setting up an outgoing call or leaving the handset off hook.• The time spent free.• The time spent with external calls ringing at the agent (% Ring On, Inc).• The time spent with internal calls ringing at the agent (% Ring On, Int).• The time spent logged on.• The time spent logged off.
Page 4-18

The report is presented in a time band per column format. Pagination of the report will occur ifeither there are too many time bands to fit in the height of a page or there are too many statisticsparameters to fit in the width of a page.
Utilization percentages can be calculated with respect to either each profile interval or the amountof time each agent had spent logged on in each profile interval.
4.3.3 Extension Utilization ReportAn extension utilization report provides historical time utilization data for each extension withina selected extension group. Note that the times are shown as a percentage based on the shift thatyou collated the report. The parameters available are as follows:
• The time spent handling incoming calls. This time includes the talk time plus any time spenton hold. This time does not include the amount of time calls were ringing at the extensionbefore being answered.
• The time spent handling outgoing calls. This time includes the talk time plus any time spenton hold.
• The time spent handling internal/intercom calls. This time includes the talk time plus anytime spent on hold. This time does not include the amount of time calls were ringing at theextension before being answered.
• The time spent with incoming calls on hold.• The time spent with outgoing calls on hold.• The time spent with internal/intercom calls on hold• The time spent in wrap-up.• The time spent unavailable.• The time spent being busy, i.e. unavailable for some reason to take calls. This is usually due to
setting up an outgoing call or leaving the handset off hook.• The time spent free.• The time spent with external calls ringing at the extension (% Ring On, Inc.).• The time spent with internal calls ringing at the extension (% Ring On, Inc)• The time spent logged on.• The time spent logged off.
The report is presented in an extension per row format with a "totals" entry for the whole groupbeing presented at the bottom of the report. Note that the "totals" entry for each column is theaverage of all the extensions in the group. Pagination of the report will occur if either there are toomany extensions to fit in the height of a page or there are too many statistics parameters to fit inthe width of a page.
4.3.4 Extension Utilization Profile ReportAn extension utilization profile report provides historical time utilization data for a selected exten-sion presented in a series of uniform time bands. The interval time managing the time bands canbe anything from 1 minute up to 999 weeks.
Note that the times are shown as a percentage based on the shift that you collated the report with.The parameters available are as follows:
Page 4-19
• The time spent handling incoming calls. This time includes the talk time plus any time spenton hold. This time does not include the amount of time calls were ringing at the extensionbefore being answered.
• The time spent handling outgoing calls. This time includes the talk time plus any time spenton hold.
• The time spent handling internal/intercom calls. This time includes the talk time plus anytime spent on hold. This time does not include the amount of time calls were ringing at theextension before being answered.
• The time spent with incoming calls on hold.• The time spent with outgoing calls on hold.• The time spent with internal/intercom calls on hold.• The time spent in wrap-up.• The time spent unavailable.• The time spent being busy, i.e. unavailable for some reason to take calls. This is usually due to
setting up an outgoing call or leaving the handset off hook.• The time spent free.• The time spent with external calls ringing at the extension (% Ring On, Inc).• The time spent with internal calls ringing at the extension (% Ring On, Int).• The time spent logged on.• The time spent logged off.
The report is presented in a time band per column format. Pagination of the report will occur ifeither there are too many time bands to fit in the height of a page or there are too many statisticsparameters to fit in the width of a page.
4.4 Contention ReportsContention reports are available as standard or profiled over flexible time periods.
4.4.1 Contention Report (Standard)A contention report provides the percentage of time a variable number of members in a group weresimultaneously free/busy. The statistics are presented either as non-cumulative or cumulative.
• Non-cumulative - Each line of the report gives the percentage of time that exactly that num-ber of members were free.
• Cumulative - The first line of the report gives the percentage of time zero members were free.The second line gives the percentage that up to one member was free. The third line gives thepercentage that up to two members were free and so on until the number of members in thegroup or Max Items has been reached.
A series of either line groups, extension groups, or agent groups can be analyzed within a singlereport.
The report is presented in a group member per row format. Pagination of the report will occur ifeither there are too many group members to fit in the height of a page or there are too manygroups to fit in the width of a page.
Page 4-20
4.4.2 Contention Profile ReportA contention profile report provides historical time data for the percentage of time a variable num-ber of members in a group were simultaneously free/busy. The statistics are presented either asnon-cumulative or cumulative.
• Non-cumulative - Each line of the report gives the percentage of time that exactly that num-ber of members were free.
• Cumulative - The first line of the report gives the percentage of time zero members were free.The second line gives the percentage that up to one member was free. The third line gives thepercentage that up to two members were free and so on until the number of members in thegroup or Max Items has been reached.
A single report can analyze either a line group, an extension group, or an agent group.
The report is presented in a time band per column format. Pagination of the report will occur ifeither there are too many time bands to fit in the height of a page or there are too many statisticsparameters to fit in the width of a page.
4.5 Wait Time Distribution ReportA wait time distribution report provides the number of calls and percentage of calls whose waittime fell within a series of user configurable time bands. The report can analyze the waiting timedistribution of either answered or abandoned calls or both together if required. A series of eitherline groups, DID numbers or DID groups can be analyzed within a single report.
The report is presented in a wait time band per row format. Pagination of the report will occur ifeither there are too many time bands to fit in the height of a page or there are too manygroups/DID numbers to fit in the width of a page.
Page 4-21
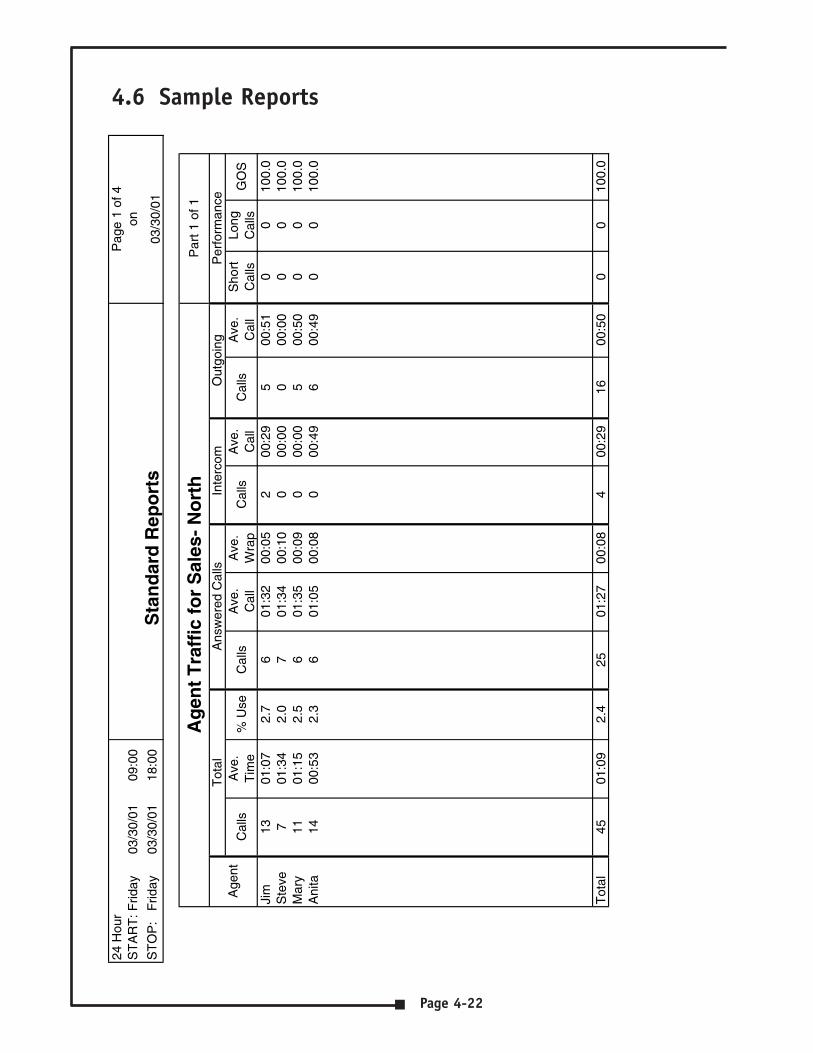
4.6 Sample Reports24
Hou
rS
TA
RT
: Frid
ay03
/30/
0109
:00
ST
OP
: F
riday
03/3
0/01
18:0
0
Cal
lsA
ve.
Tim
e%
Use
Cal
lsA
ve.
Cal
lA
ve.
Wra
pC
alls
Ave
.C
all
Cal
lsA
ve.
Cal
lS
hort
Cal
lsLo
ngC
alls
GO
S
Jim
1301
:07
2.7
601
:32
00:0
52
00:2
95
00:5
10
010
0.0
Ste
ve7
01:3
42.
07
01:3
400
:10
000
:00
000
:00
00
100.
0M
ary
1101
:15
2.5
601
:35
00:0
90
00:0
05
00:5
00
010
0.0
Ani
ta14
00:5
32.
36
01:0
500
:08
000
:49
600
:49
00
100.
0
Tot
al45
01:0
92.
425
01:2
700
:08
400
:29
1600
:50
00
100.
0
Age
ntA
nsw
ered
Cal
lsIn
terc
omO
utgo
ing
Sta
nd
ard
Rep
ort
s
Par
t 1 o
f 1
Per
form
ance
Tot
al
Pag
e 1
of 4
on
03/3
0/01
Ag
ent
Tra
ffic
fo
r S
ales
- N
ort
h
Page 4-22
Page 4-23

Page 4-24
Page 4-25
Using SmartCentre Reports toImprove Performance
Now that you are able to create report templates to provide you with the reports for the periodsof interest what do they all mean? This section deals with some of the potential problems identi-fied using the reporting package and possible solutions to those problems. As with many thingsthere could be a number of ways to improve performance and increase productivity so you mayneed to try different things to see which work the best.
5.1 Queue Problems
5.1.1 Abandoned Calls and Long WaitsYou may identify a problem of too many abandoned calls and complaints of long waits.
Here are some solutions to this problem:
a) Solution A
Try to increase to extend the average wait time to abandon by playing a recorded announce-ment using facilities provided by Voice Processing Systems or Recorded AnnouncementDevices. Contact your system provider for more information. Well-worded messages played tocallers in the queue have proved to be very successful in this area. Avoid repeating the samemessage over and over and consider playing music or other recorded information betweengreetings.
b) Solution B
Consider giving callers in the queue the option to leave the queue and leave a message in VoiceMail. This way you can then return the call at a less busy time.
c) Solution C
If your staff make outgoing calls at the same time as they receive inbound calls considerrestricting the outbound activity to a less busy time of day. Use Profile Reports to identify thepeak times and the quietest times.
d) Solution DConsider overflowing calls to other members of staff in other areas of the business. Althoughthis could be less than ideal it could eliminate the lost order or lost customer. Research hasshown that 60% of callers who abandon do not call back.
e) Solution E
If you do not use headsets, consider introducing them. Headset use will speed up calls if key-board work is involved.
Page 5-1
5
f) Solution F
Use Profile Reports to identify peaks and troughs in terms of activity. Rarely will the level oftraffic be constant. Having identified the peak hours consider changing the working hours ofstaff and maybe consider part time employees.
5.1.2 Complaints of Busy SignalsUse the Contention or Contention Profile Report to identify the size and timing of the problem.Avoid rushing out and renting some more lines, even though they are relatively inexpensive theadditional lines could result in periods where callers go unanswered due to lack of staff availableto take more incoming calls.
a) Solution A
Assuming you have staff available to answer the extra volume, add more lines to your system.
b) Solution BIf your staff make outgoing calls at the same time as they receive inbound calls considerrestricting the outbound activity to a less busy time of day. Use Profile Reports to identify thepeak times and the quietest times.
c) Solution C
Find out if it is possible to reduce the duration of calls. If you can achieve this without reduc-ing the quality of service then this will allow you to answer more calls with the same numberof lines and people. Before embarking on a call time reduction campaign consider the profileof the "best agent". Maybe when you look at this person you may consider training your staffto increase the call duration.
d) Solution D
Check out the wrap-up time associated with telephone calls. If the time is excessive, find outwhy. It could be, for example, that quotations have to be sent out, perhaps faxing from the PCcould speed up the process thereby increasing the volume of calls that can be handled. Oneclient established that the average time spent in wrap-up where an order was placed took overten minutes because the sales agent had to print off an order confirmation and take it to themail room for processing. Now the printer is located in the mailroom and wrap-up time isreduced by 75%.
5.2 Other Problems
5.2.1 Unexpected Out-of-Hours Customer DemandUsing the Out of Hours shift for reports, you establish that there is a demand for your serviceswhen you are closed.
a) Solution A
Using Profile Reports identify the demand and the timing and consider opening at this timeto handle the calls. If this is not possible consider giving callers the option to leave a messageto be dealt with as a priority when you start work. The third option could be to overflow to a
Page 5-2

bureau. In all cases it is recommended to play an out of hours message apologizing for the factyou are closed, stating your opening times and if alternatives are available state what they are.
5.2.2 Complaints About Too Many TransfersYou may have customers who complain their call gets passed around the organization before theyget the person who can deal with their problem.
a) Solution AUse the Group Traffic Reports to identify the guilty parties in terms of who transfers callersthe most and then the Event Reports to find out the details. This may indicate trainingrequirements to give the guilty members of staff the skills and knowledge to handle the callsthemselves. Inquiry calls could also indicate a similar problem. If high proportions of calls aretransferred because they are not dealt with by the receiving department consider other meth-ods of routing the calls into the correct department without human intervention. Ideas hereinclude using DID numbers to route calls into appropriate departments. This is ideal if youare in a position to educate your callers. The ideal caller here would be a field employee,employees at other locations and customers. Another idea would be to answer all calls with anAuto-Attendant (AA) and make the user select from a menu. The AA would then route thecall according to the selection made.
Page 5-3

Glossary of Reporter Terminology
In addition to the glossary of terms in the SmartCentre User Guide, this glossary will help the userto understand some of the terminology specific to the Reporter.
Average Answered Call Time - The average time taken during the call time.
Average Transfer Count - Of those calls that were transferred, the average number of times thecalls were transferred.
Call Rate - The number of calls (of all types) handled by the device per hour of logged on time.
Calls Inquired - Number of inquiry calls (calls that have been held and retrieved by the sameagent) made by all agents within the group.
Call Time (for agents) - The time from the moment the call was answered until the call ended,including the wrap-up time.
Call Time (for lines) - The time from the moment the call was answered until the line was freed.
Connect Device - Displays the device to which the agent's extension is connected to complete thespeech path. Can refer to the incoming DID number, if available (default), or to the line if pre-ferred.
Connect Group - Displays the name of the group assigned to the DID or line number to whichthe extension is connected during a call.
Dialed Digits - Displays phone numbers of incoming and outgoing calls.
Inquiry Hold - When an extension/agent places a call on hold and then reconnects to the callwithout transferring it.
Erlang - An Erlang is a measure of traffic. An instantaneous traffic of ten Erlangs means that tencalls are in progress at a defined time.
GOS, Grade of Service (for Line Groups and DIDs) - Percentage of calls answered within the tar-get answer time. Options are available to include or exclude abandoned calls.
GOS, Grade of Service (for Extensions and Agents) - Percentage of calls whose handling time wasbetween a short call threshold and a long call threshold. The concept is also applicable to exten-sion groups and agent groups.
Held Time - The time for which a call was on hold.
Intercom Call - A telephone call internal to the telephone system.
Long Call - A long call is one that lasts for more time than the long call threshold.
Page 6-1
6

Long Waits - Number of calls whose waiting time exceeded the long wait analysis threshold.Options are available to include or exclude abandoned calls.
Maximum Agents Logged On - Maximum number of agents logged on during the profile peri-od.
Maximum Transfer Count - Of those calls that were transferred, the maximum number of timesthe call was transferred.
Minimum Agents Logged On - Minimum number of agents logged on during the profile period.
No. Logon - Number of times the agent logged on during the period.
No. Unavailable - Number of times the device became unavailable during the period.
Ring on Call - Ring on call is a call which rings on a device and then stops ringing before it isanswered.
Short Call - A short call is one that lasts for less time than the short call threshold.
Talk Time - The time the agent was actually speaking to the caller.
Target Answer Time - A reminder of the answer time the agents are aiming to achieve.
Transfer From - Displays the agents name and number (or extension, if preferred) from whom acall has been transferred.
Transfer Pos - Transfer position is the number of times a call has been transferred before it reachedthis agent.
Transfer To - Displays the agents name and number (or extension, if preferred) to whom a call hasbeen transferred.
Unavailable - When an agent is logged on but needs to stop taking incoming calls temporarily,they can go into the unavailable (out of group) state. When the agent is ready to take calls againthey can go available (in group) again.
Wait Time - Shows the time a call was waiting to be answered.
Wrap Time - The length of time the agent was in wrap-up.
% Logon - Percentage of time for which the agent was logged on.
% Use (of activity) - Percentage of time each device was allocated to a particular activity, such asanswering incoming calls or making outgoing calls.
Page 6-2


![Untitled Document [pdf.textfiles.com]](https://img.pdfslide.net/doc/110x75/6169d23211a7b741a34bbcd3/untitled-document-pdf-.jpg)