Embed Size (px)
Citation preview
2
San Bernardino County Homeless Count and Subpopulation Survey: Final Report
Acknowledgements
The San Bernardino County Homeless Partnership wishes to thank all of the individuals and organizations that contributed to the preparation, implementation, and success of the 2019 Point-In-Time Count and Subpopulation Survey. Such an endeavor would not be possible without the collaboration and efforts of many volunteers, community groups, faith- and community-based organizations, county departments, city representatives and staff, homeless service providers, law enforcement and elected officials. Your hard work, time and dedication to ending homelessness are greatly appreciated.
▪ Special thanks to approximately 600 community volunteers from all across San Bernardino county who
canvassed areas identified as “green count zones” the morning of January 24th, to complete the 2019 Point-In-Time-Count and Subpopulation Survey.
▪ Special thanks to the following agencies and community organizations that contributed staff time, support and resources, and office space for planning, training and development activities to help make the 2019 Point-In-Time Count and Subpopulation Survey a success:
211-United Way San Bernardino County
American Round Table to Abolish Homelessness
Assembly Member Eloise Gomez-Reyes, District 47
California Department of Transportation
California State University – San Bernardino
Church for Whosoever – Apple Valley
Church of Latter Day Saints – Redlands
City of Big Bear Lake
City of Barstow
City of Chino
City of Chino Hills
City of Colton
City of Fontana
City of Grand Terrace
City of Highland
City of Loma Linda
City of Needles
City of Montclair
City of Ontario
City of Rancho Cucamonga
City of Redlands
City of Rialto
City of San Bernardino
City of Twentynine Palms
City of Upland
City of Victorville
City of Yucaipa
ESRI
Family Assistance Program
3
Good Shepherd Lutheran Church – Yucaipa
Mercy House – Ontario
Morongo Basin Haven
Mountain Homeless Coalition
New Hope Village
San Bernardino County Administrative Office
San Bernardino County Board of Supervisors
San Bernardino County Council of Governments
San Bernardino County Department of Behavioral Health
San Bernardino County Child Support Services
San Bernardino County Human Resources
San Bernardino County Information Services Department
San Bernardino County Sheriff’s Department
San Bernardino County Sheriff’s Department – Homeless Outreach Proactive Enforcement (HOPE) Team
St. John of God – Victorville
St. Richards Episcopal Church – Skyforest
Step Up on Second
Town of Apple Valley
Town of Yucca Valley
United States Veterans Administration – Loma Linda Healthcare System
Water of Life Community Church/CityLink
Youth Hope Foundation
Alma Hernandez Ana Lizzeth Ordenez
Andre Bossieux Andrea Buttner
Angela Pasco Anna Ulibarri
Bonnie Shaffer Brandon Fahey
Brent Rolf Brigette Martinez
Corporal Catherine Grieg Daniel Flores Darryl Evey
Deanna Luttrell Deborah Caruso
Deputy Aaron Halloway Deputy Jeff Collins
Deputy Mike Catalano Deputy Mike Jones
Deputy Vince Balsitis Diane Podolske, Ph.D.
Doug Story Elisa Cox
Eric Gavin Erika Lewis-Huntley
Erika Willhite Gary Madden
4
Gretel Nobel Heidi Mayer Jesse Smith Joyce Haniff Judy Cannon Judy Conner
Karchana Karthikeyan Karen Bell
Karen Resendez Katryna Gonzalez
Kent Paxton Lawrence Mainez
Liliana Collins Lindsay King
Lois Levitt Maria Gallegos
Maribel Gutierrez Marisela Manzo
Mary Douglas Mayra Pratt
Michael Flores Nancy Stewart
Natalie Campos Nicole Van Winkle Officer Cecil Smith Officer C. Walton
Officer D. Rice Officer Gabe Fondario Officer J. Rutherford
Officer Robert Hargett Paul Fournier Perry Brents Phil Mosley
Philip F. Mangano Raquel Henry Raychel Smith Regina Cruise
Sam Matranga Shaheen Zakaria Shannon Kendall
Shelley Licata Sheree Lewis Sue Walker Tanya Perry
Ted Bistarkey Tina McPherson
Tracey Rick Tricia Gonzales
Wayne Hamilton Wendell Wilson
5
▪ Special thanks for the San Bernardino County Information Services for their expertise and guidance concerning the design and implementation of the homeless count mobile app, providing targeted mapping, and for data cleaning.
Brent Rolfe, Systems Development Team Leader Natalie M. Campos, Business System Analyst III
Lindsay King, GIS Business System Analyst ▪ Special thanks to our research consultants, the Institute for Urban Initiatives, for their expertise and guidance
through the entire Point-In-Time Count and Subpopulation Survey process, including methodology development and implementation, planning coordination and guidance, and production of the final report.
Joe Colletti, PhD, Executive Director Sofia Herrera, PhD, Research Director
Thelma Herrera, Graphic Designer
6
Table of Contents
Page
I. Executive Summary 7
Unsheltered Persons 9
Sheltered Persons 12
We Upgraded Our Methodologies and Found
More of Our Homeless Neighbors 15
Next Steps and Recommendations 19
II. Background Information 23
When was the count conducted? 24 Who was counted? 24
Who was not counted? 24 Who carried out the Count 25
III. Methodology 27
IV. Unsheltered Subpopulation Summaries 37
V. Connection to Cities 50
Appendix A: Findings for Each Jurisdiction for
Unsheltered Adults Only 100
Addendum 1: Letter from Dennis Culhane, PhD regarding
changes in methodology. 151
7
I. Executive Summary
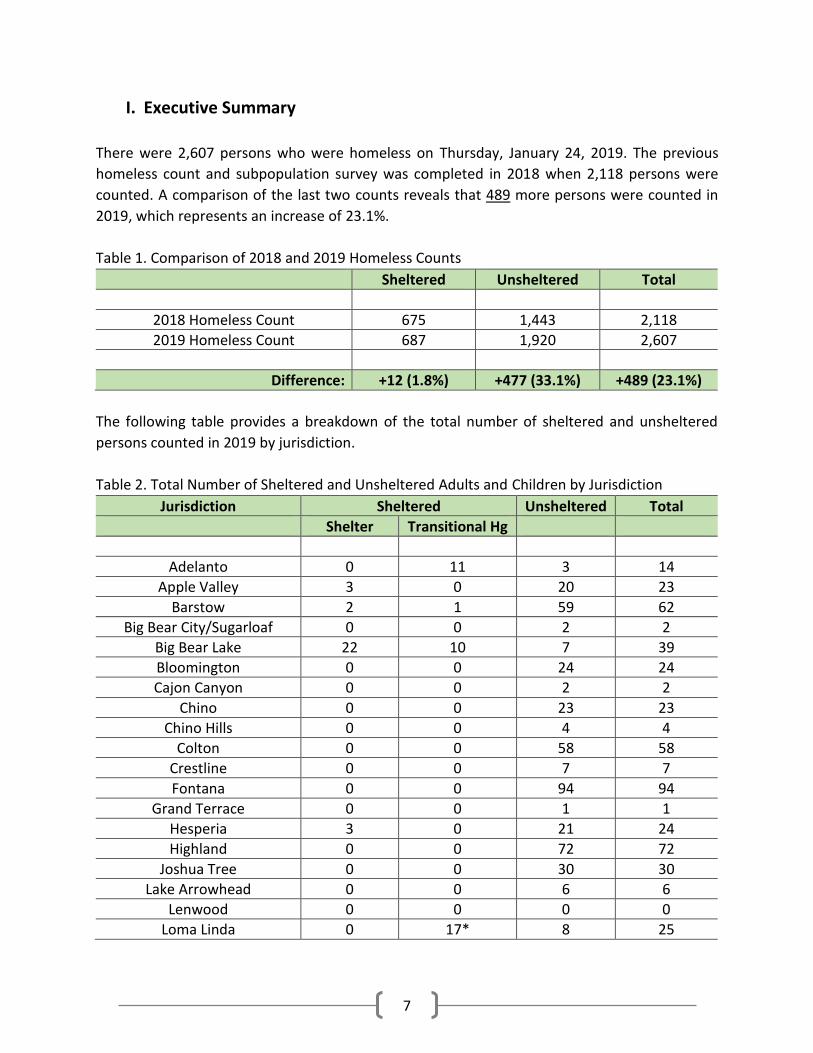
There were 2,607 persons who were homeless on Thursday, January 24, 2019. The previous
homeless count and subpopulation survey was completed in 2018 when 2,118 persons were
counted. A comparison of the last two counts reveals that 489 more persons were counted in
2019, which represents an increase of 23.1%.
Table 1. Comparison of 2018 and 2019 Homeless Counts
Sheltered Unsheltered Total
2018 Homeless Count 675 1,443 2,118
2019 Homeless Count 687 1,920 2,607
Difference: +12 (1.8%) +477 (33.1%) +489 (23.1%)
The following table provides a breakdown of the total number of sheltered and unsheltered
persons counted in 2019 by jurisdiction.
Table 2. Total Number of Sheltered and Unsheltered Adults and Children by Jurisdiction
Jurisdiction Sheltered Unsheltered Total
Shelter Transitional Hg
Adelanto 0 11 3 14
Apple Valley 3 0 20 23
Barstow 2 1 59 62
Big Bear City/Sugarloaf 0 0 2 2
Big Bear Lake 22 10 7 39
Bloomington 0 0 24 24
Cajon Canyon 0 0 2 2
Chino 0 0 23 23
Chino Hills 0 0 4 4
Colton 0 0 58 58
Crestline 0 0 7 7
Fontana 0 0 94 94
Grand Terrace 0 0 1 1
Hesperia 3 0 21 24
Highland 0 0 72 72
Joshua Tree 0 0 30 30
Lake Arrowhead 0 0 6 6
Lenwood 0 0 0 0
Loma Linda 0 17* 8 25
8
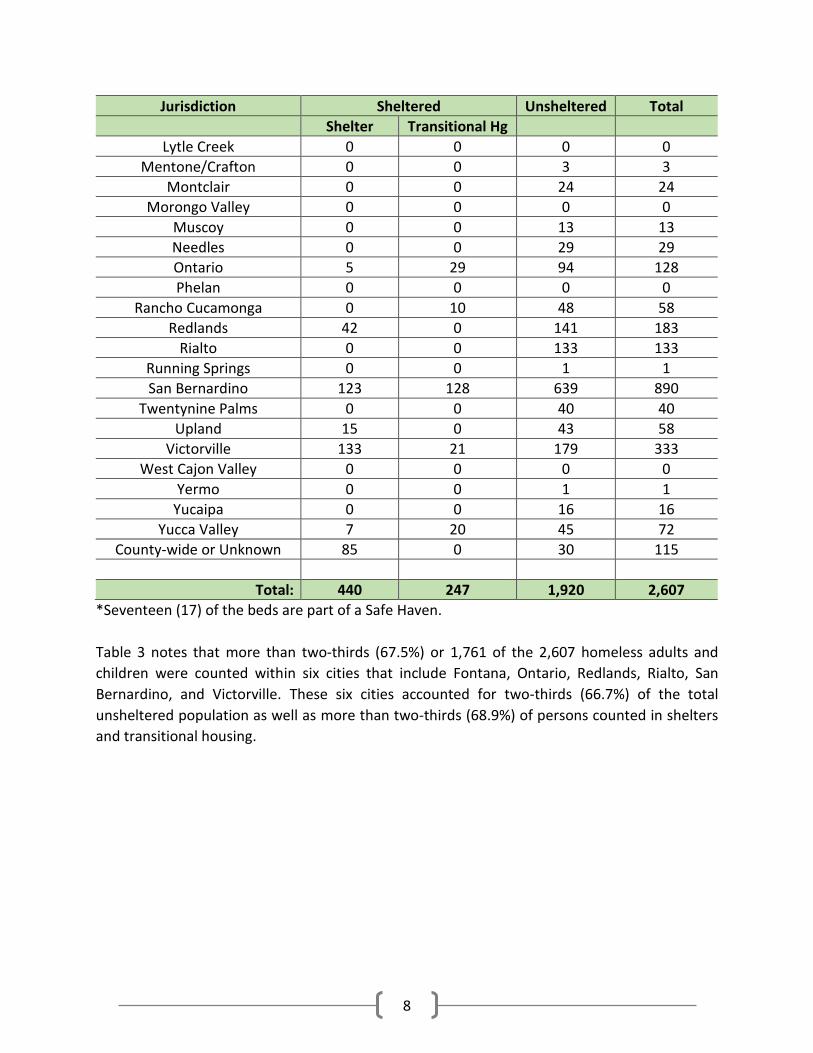
Jurisdiction Sheltered Unsheltered Total
Shelter Transitional Hg
Lytle Creek 0 0 0 0
Mentone/Crafton 0 0 3 3
Montclair 0 0 24 24
Morongo Valley 0 0 0 0
Muscoy 0 0 13 13
Needles 0 0 29 29
Ontario 5 29 94 128
Phelan 0 0 0 0
Rancho Cucamonga 0 10 48 58
Redlands 42 0 141 183
Rialto 0 0 133 133
Running Springs 0 0 1 1
San Bernardino 123 128 639 890
Twentynine Palms 0 0 40 40
Upland 15 0 43 58
Victorville 133 21 179 333
West Cajon Valley 0 0 0 0
Yermo 0 0 1 1
Yucaipa 0 0 16 16
Yucca Valley 7 20 45 72
County-wide or Unknown 85 0 30 115
Total: 440 247 1,920 2,607
*Seventeen (17) of the beds are part of a Safe Haven.
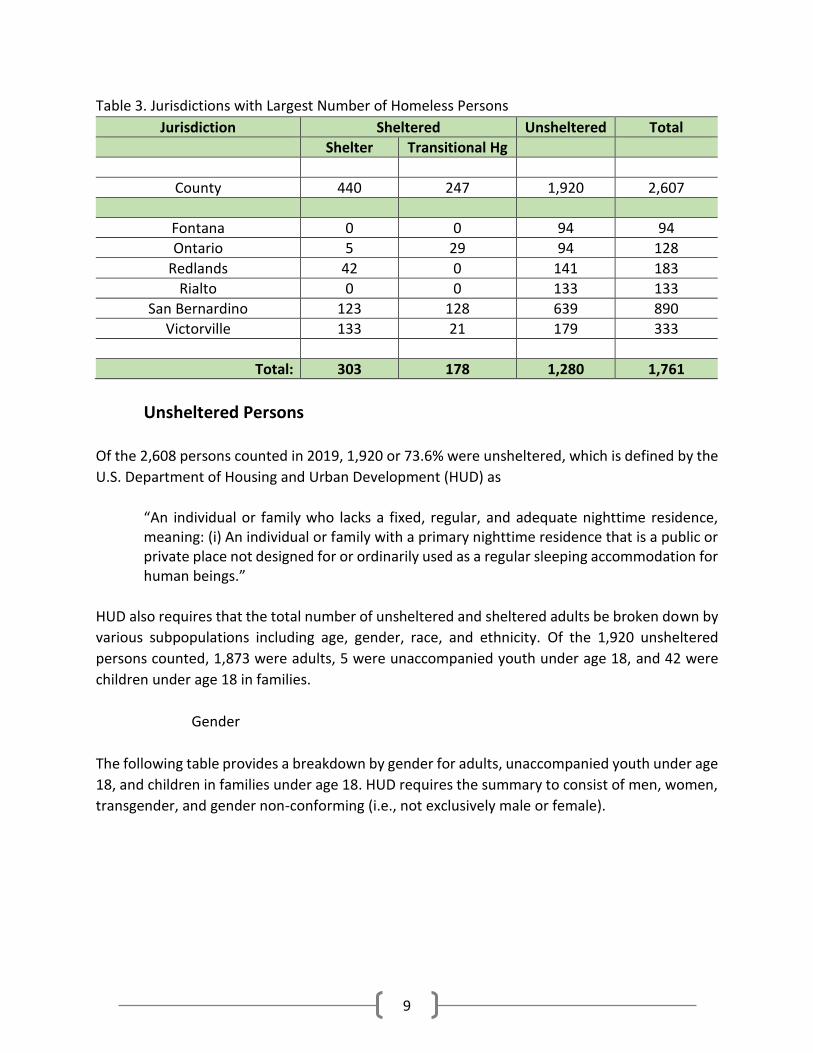
Table 3 notes that more than two-thirds (67.5%) or 1,761 of the 2,607 homeless adults and
children were counted within six cities that include Fontana, Ontario, Redlands, Rialto, San
Bernardino, and Victorville. These six cities accounted for two-thirds (66.7%) of the total
unsheltered population as well as more than two-thirds (68.9%) of persons counted in shelters
and transitional housing.
9
Table 3. Jurisdictions with Largest Number of Homeless Persons
Jurisdiction Sheltered Unsheltered Total
Shelter Transitional Hg
County 440 247 1,920 2,607
Fontana 0 0 94 94
Ontario 5 29 94 128
Redlands 42 0 141 183
Rialto 0 0 133 133
San Bernardino 123 128 639 890
Victorville 133 21 179 333
Total: 303 178 1,280 1,761
Unsheltered Persons
Of the 2,608 persons counted in 2019, 1,920 or 73.6% were unsheltered, which is defined by the
U.S. Department of Housing and Urban Development (HUD) as
“An individual or family who lacks a fixed, regular, and adequate nighttime residence, meaning: (i) An individual or family with a primary nighttime residence that is a public or private place not designed for or ordinarily used as a regular sleeping accommodation for human beings.”
HUD also requires that the total number of unsheltered and sheltered adults be broken down by
various subpopulations including age, gender, race, and ethnicity. Of the 1,920 unsheltered
persons counted, 1,873 were adults, 5 were unaccompanied youth under age 18, and 42 were
children under age 18 in families.
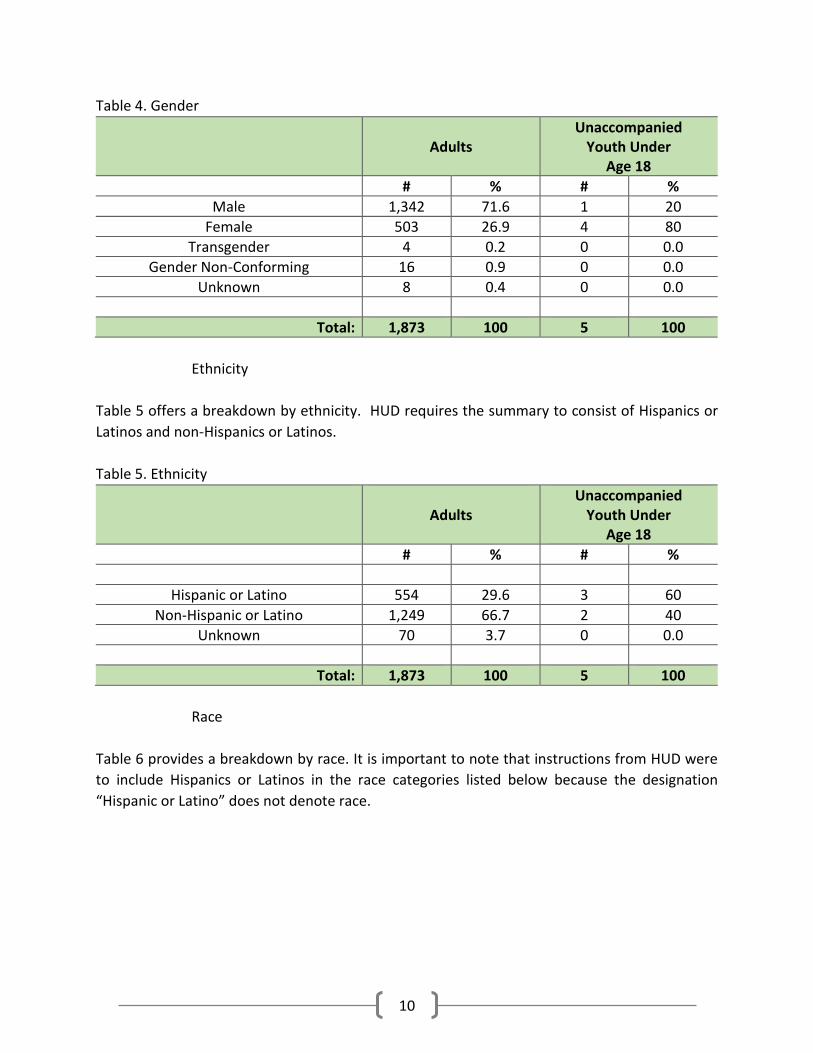
Gender
The following table provides a breakdown by gender for adults, unaccompanied youth under age
18, and children in families under age 18. HUD requires the summary to consist of men, women,
transgender, and gender non-conforming (i.e., not exclusively male or female).
10
Table 4. Gender
Adults
Unaccompanied Youth Under
Age 18
# % # %
Male 1,342 71.6 1 20
Female 503 26.9 4 80
Transgender 4 0.2 0 0.0
Gender Non-Conforming 16 0.9 0 0.0
Unknown 8 0.4 0 0.0
Total: 1,873 100 5 100
Ethnicity
Table 5 offers a breakdown by ethnicity. HUD requires the summary to consist of Hispanics or
Latinos and non-Hispanics or Latinos.
Table 5. Ethnicity
Adults
Unaccompanied Youth Under
Age 18
# % # %
Hispanic or Latino 554 29.6 3 60
Non-Hispanic or Latino 1,249 66.7 2 40
Unknown 70 3.7 0 0.0
Total: 1,873 100 5 100
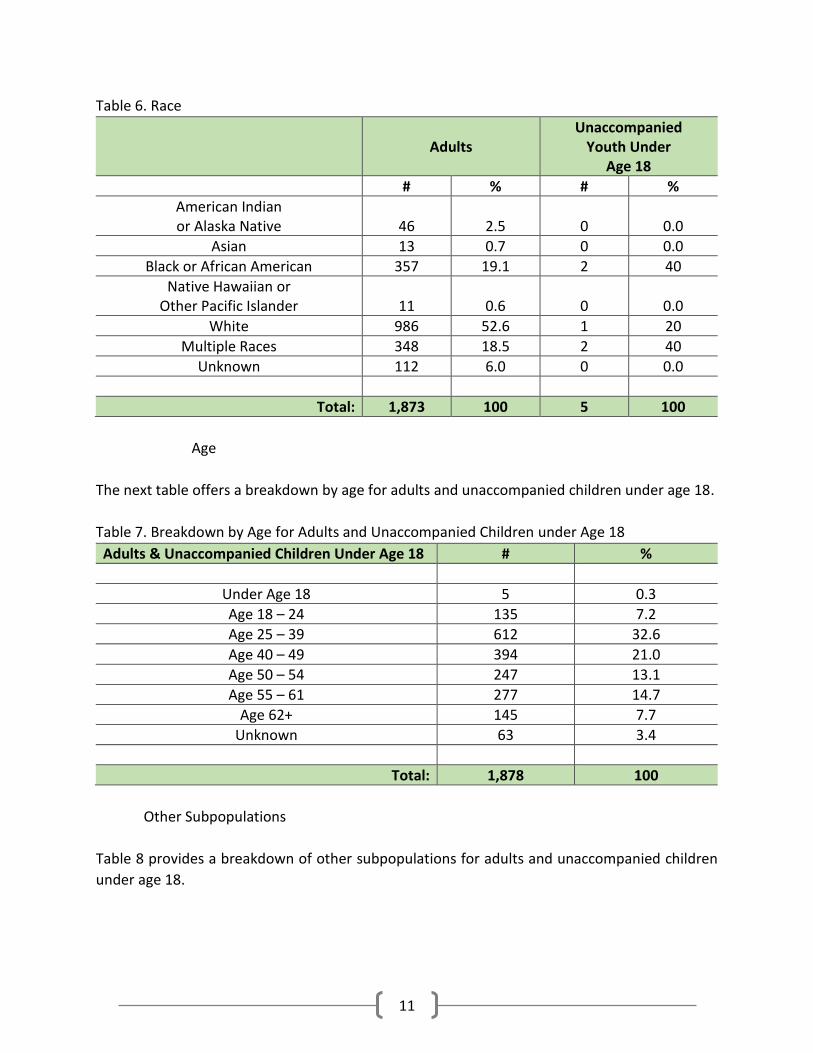
Race
Table 6 provides a breakdown by race. It is important to note that instructions from HUD were
to include Hispanics or Latinos in the race categories listed below because the designation
“Hispanic or Latino” does not denote race.
11
Table 6. Race
Adults
Unaccompanied Youth Under
Age 18
# % # %
American Indian or Alaska Native
46
2.5
0
0.0
Asian 13 0.7 0 0.0
Black or African American 357 19.1 2 40
Native Hawaiian or Other Pacific Islander
11
0.6
0
0.0
White 986 52.6 1 20
Multiple Races 348 18.5 2 40
Unknown 112 6.0 0 0.0
Total: 1,873 100 5 100
Age
The next table offers a breakdown by age for adults and unaccompanied children under age 18.
Table 7. Breakdown by Age for Adults and Unaccompanied Children under Age 18
Adults & Unaccompanied Children Under Age 18 # %
Under Age 18 5 0.3
Age 18 – 24 135 7.2
Age 25 – 39 612 32.6
Age 40 – 49 394 21.0
Age 50 – 54 247 13.1
Age 55 – 61 277 14.7
Age 62+ 145 7.7
Unknown 63 3.4
Total: 1,878 100
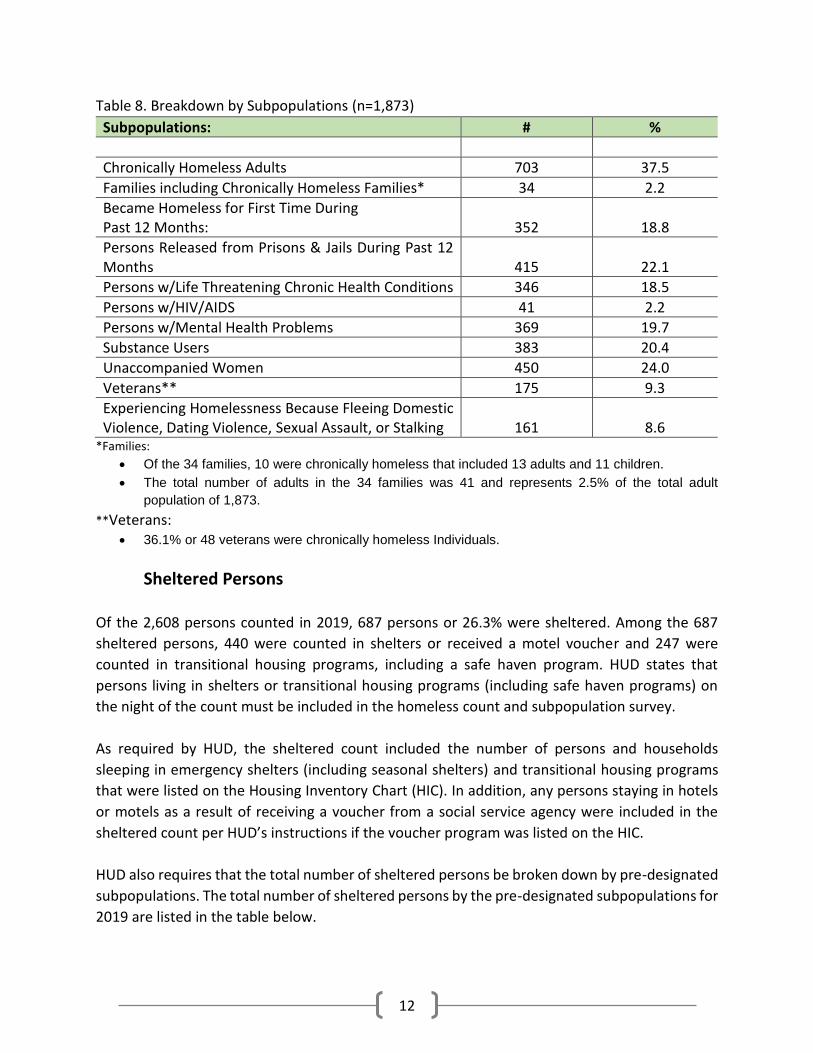
Other Subpopulations
Table 8 provides a breakdown of other subpopulations for adults and unaccompanied children
under age 18.
12
Table 8. Breakdown by Subpopulations (n=1,873)
Subpopulations: # %
Chronically Homeless Adults 703 37.5
Families including Chronically Homeless Families* 34 2.2
Became Homeless for First Time During Past 12 Months:
352
18.8
Persons Released from Prisons & Jails During Past 12 Months
415
22.1
Persons w/Life Threatening Chronic Health Conditions 346 18.5
Persons w/HIV/AIDS 41 2.2
Persons w/Mental Health Problems 369 19.7
Substance Users 383 20.4
Unaccompanied Women 450 24.0
Veterans** 175 9.3
Experiencing Homelessness Because Fleeing Domestic Violence, Dating Violence, Sexual Assault, or Stalking
161
8.6
*Families:
• Of the 34 families, 10 were chronically homeless that included 13 adults and 11 children.
• The total number of adults in the 34 families was 41 and represents 2.5% of the total adult
population of 1,873.
**Veterans: • 36.1% or 48 veterans were chronically homeless Individuals.
Sheltered Persons
Of the 2,608 persons counted in 2019, 687 persons or 26.3% were sheltered. Among the 687
sheltered persons, 440 were counted in shelters or received a motel voucher and 247 were
counted in transitional housing programs, including a safe haven program. HUD states that
persons living in shelters or transitional housing programs (including safe haven programs) on
the night of the count must be included in the homeless count and subpopulation survey.
As required by HUD, the sheltered count included the number of persons and households
sleeping in emergency shelters (including seasonal shelters) and transitional housing programs
that were listed on the Housing Inventory Chart (HIC). In addition, any persons staying in hotels
or motels as a result of receiving a voucher from a social service agency were included in the
sheltered count per HUD’s instructions if the voucher program was listed on the HIC.
HUD also requires that the total number of sheltered persons be broken down by pre-designated
subpopulations. The total number of sheltered persons by the pre-designated subpopulations for
2019 are listed in the table below.
13
The Homeless Inventory Count (HIC) was submitted by the Office of Homeless Services (OHS)
staff to HUD in April 2018. Prior to the homeless count, the HIC was specifically undated to
include any new programs or exclude any programs no longer operational by OHS staff and Key
Person Task Force members. A few changes were made to the HIC prior to the count.
HUD encourages the use of Homeless Management Information Services (HMIS) data to generate
sheltered counts and subpopulation data for programs with 100% of beds participating in HMIS.
Therefore, HMIS was used to gather the total number of occupied beds and the number of
persons for each subpopulation. A “Data Collection Instrument” was used to collect the total
number of occupied beds and the number of persons for each subpopulation for non-
participating HMIS programs and for HMIS participating agencies that do not have their HMIS
data complete and correct. The same questions used to collect subpopulation data through HMIS
were used for the data collection instrument. Thus, sheltered count data for all sheltered
programs was gathered either through a data collection sheet or HMIS.
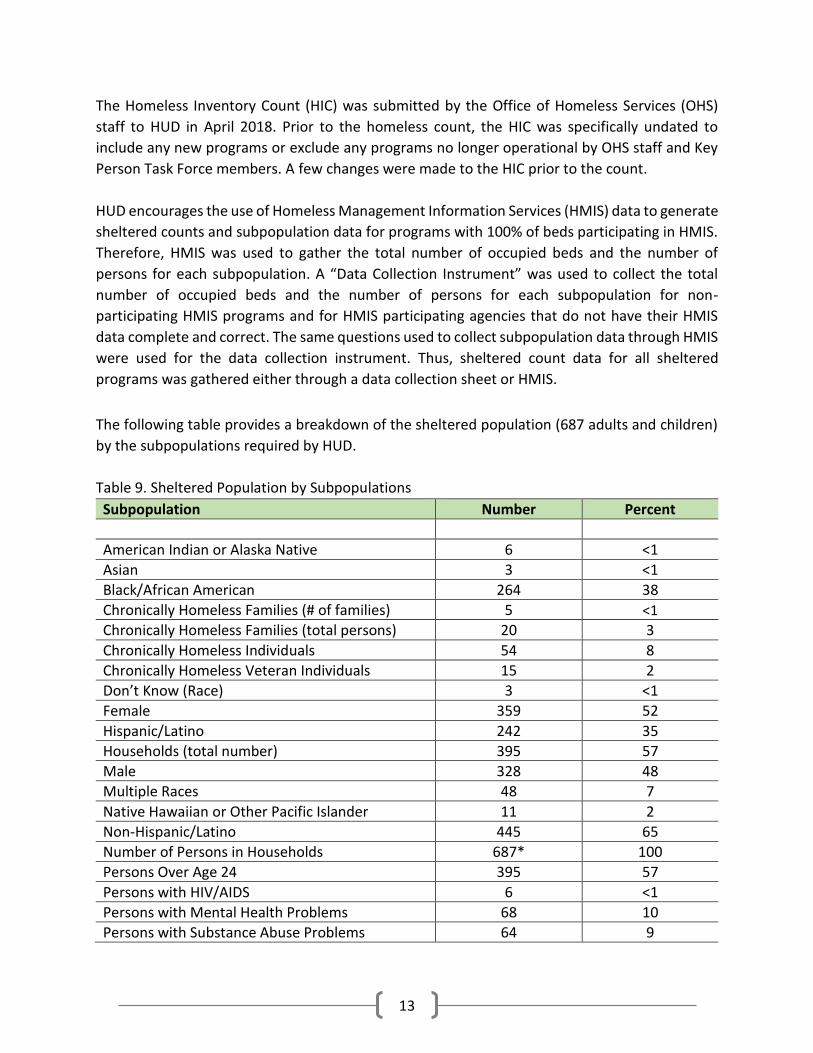
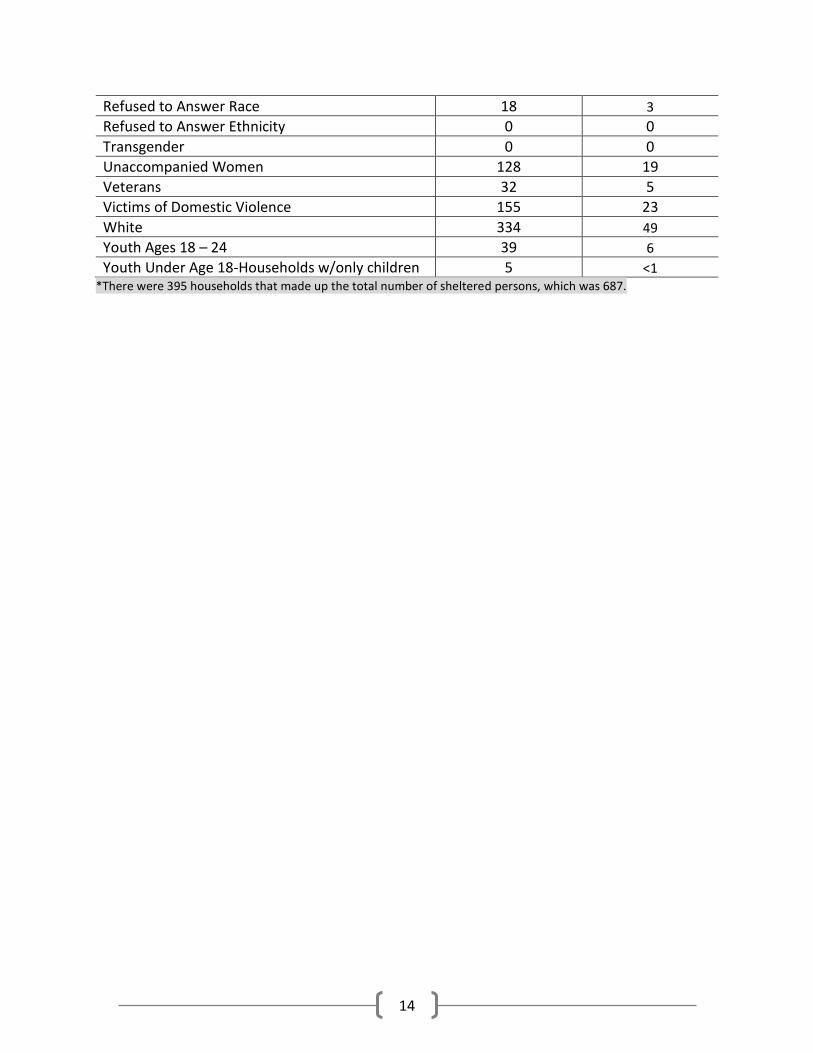
The following table provides a breakdown of the sheltered population (687 adults and children)
by the subpopulations required by HUD.
Table 9. Sheltered Population by Subpopulations
Subpopulation Number Percent
American Indian or Alaska Native 6 <1
Asian 3 <1
Black/African American 264 38
Chronically Homeless Families (# of families) 5 <1
Chronically Homeless Families (total persons) 20 3
Chronically Homeless Individuals 54 8
Chronically Homeless Veteran Individuals 15 2
Don’t Know (Race) 3 <1
Female 359 52
Hispanic/Latino 242 35
Households (total number) 395 57
Male 328 48
Multiple Races 48 7
Native Hawaiian or Other Pacific Islander 11 2
Non-Hispanic/Latino 445 65
Number of Persons in Households 687* 100
Persons Over Age 24 395 57
Persons with HIV/AIDS 6 <1
Persons with Mental Health Problems 68 10
Persons with Substance Abuse Problems 64 9
14
Refused to Answer Race 18 3
Refused to Answer Ethnicity 0 0
Transgender 0 0
Unaccompanied Women 128 19
Veterans 32 5
Victims of Domestic Violence 155 23
White 334 49
Youth Ages 18 – 24 39 6
Youth Under Age 18-Households w/only children 5 <1 *There were 395 households that made up the total number of sheltered persons, which was 687.
15
We Upgraded Our Methodologies and Found More of Our Homeless
Neighbors
In a recent letter from Dennis Culhane, Ph.D., a renowned social science researcher with primary expertise in the area of homelessness and assisted housing policy, to San Bernardino County officials, Dr. Culhane noted
“While a better count isn’t necessarily going to yield a higher count, it very often does. In the case of San Bernardino, the most recent year included a number of improvements intended to increase coverage, and efficiency. These improvements no doubt contributed to the increase in observed persons who were unsheltered on the night of the enumeration. Simply put, broader coverage alone will yield a higher count, if one uses a hot spot (known location) methodology, as San Bernardino has done, and as is an approved method by HUD.”
See Addendum 1 for a copy of the entire letter. Dr. Culhane is also a Senior Research Associate at the Center for Population Studies, and served
as the Director of Research for the National Center on Homelessness among Veterans at the
United States Department of Veterans Affairs from 2009 – 2018.
The San Bernardino County 2019 Homeless Count and Survey was a “better count” than in past years for several reasons and “no doubt contributed to the increase in observed persons who were unsheltered on the night of the enumeration” as noted by Dr. Culhane. Methodological Changes Methodological changes in 2019 included:
1. Change in homeless count methodology as a result of implementing the ESRI Survey 123
app.
Rather than fill out surveys using a pen, paper, and clipboard, volunteers instead used Suvey123
for ArcGIS. The digital survey form was designed to simplify the surveyor’s experience; only
relevant questions were displayed based on the answers already entered, eliminating the need
for surveyors to devote time and effort to determining which questions to ask, and resulting in a
simpler linear surveying experience. This led to a more systematic count of homeless persons.
Also, in the past, at times two volunteers may count and survey one person when appropriate.
One person would ask questions and the other record the answers. This year each volunteer had
their own mobile device and counted and asked survey questions within a one-on-one
experience.
16
2. Targeted mapping
The use of the ESRI application provided for the instant pinpoint mapping of homeless individuals the day of the count, which was a methodological change from previous years in which mapping of homeless concentrations were pre-determined. This contributed to areas being more thoroughly canvassed and more homeless individuals potentially being counted.
Locations of homeless persons and encampments from the HOPE Team Homeless Contact app
were layered on the printout maps given to teams of volunteer counters, which was not done
last year.
Maps of zones within jurisdictions were provided again this year to teams of volunteer counters
and included the known locations provided by key persons within the jurisdictions. This year,
however, these maps included known locations from the HOPE Team Homeless Contact app.
These locations are the result of professional HOPE Team members mapping homeless persons
that they assist throughout the year.
The zone maps given to teams of volunteers this year were created by:
• creating a map of a jurisdiction;
• marking the know locations of homeless persons provided by key persons within the
jurisdiction;
• marking the known locations from the HOPE Team Homeless Contact app.
The known locations from the HOPE Team Homeless Contact app were pinpoint locations. For
example, a pinpoint could be behind a building or between buildings. This helped guide teams of
volunteers to more exact locations within their zone this year.
3. Closer monitoring of undercounted areas
The ESRI Survey 123 app provides the ability for a homeless count dashboard, which was used to
monitor results of the Point-in-Time Count in real time. This provided instant viewing of data
points on the dash board in the command center during the time of the count. Each data point
represented a household counted.
If data points did not appear in areas where homeless persons were known to live during the day
of the count, volunteers were sent to the area to count and persons counted were included in
the total count if they were not previously counted.
If data points did not appear in areas where homeless persons were known to live the next day,
professional outreach workers were sent to these areas and persons counted were included in
17
the total count if they were not counted the day before. HUD allows for next day counting based
upon two conditions: 1) any homeless persons encountered have to be asked if they were
homeless on the day of the count and 2) a unique identifier has to be created for that person.
A unique identifier was created for all persons counted on the day of the count and the day after
the count. If the same unique identifier appears twice it is assumed that it is the same person
and the person is only included once in the total count if the person stated “yes” when asked “if
they were homeless on the day of the count,” which was Thursday, January 24th.
4. Increase in volunteers
The number of volunteers increased in 2019 when compared to 2018. There were 579 volunteers
in 2019 and 501 in 2018, which represents an increase of 78 volunteers or 15.6%.
Other Findings Potentially Related to Numbers Found
Other findings potentially related to numbers found include:
5. Significant number of persons are becoming homeless for the first time
First Time Homelessness
The following question was included as part of the 2018 and 2019 unsheltered counts: “Did you
become homeless for the first time during the past 12 months?”
a. 438 or 31.7% of unsheltered adults stated “yes” in 2018; and
b. 352 or 18.8% of unsheltered adults stated “yes” in 2019.
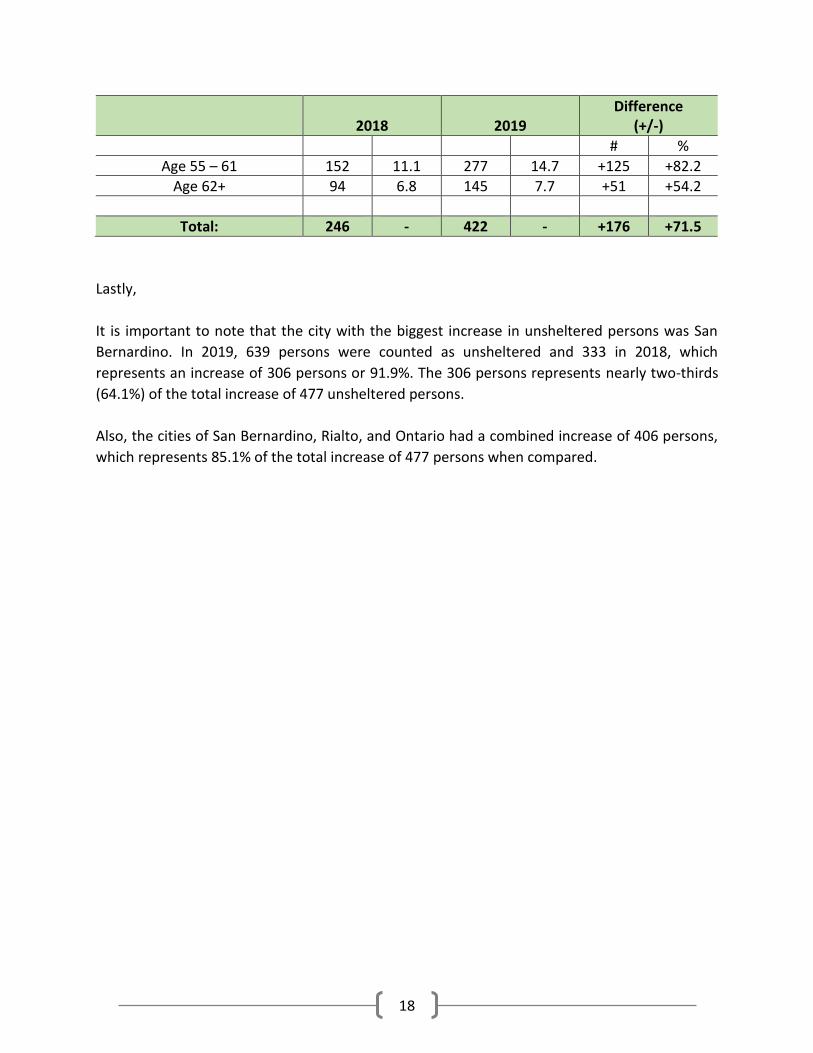
6. Significant number of persons are aging on the streets
Persons age 55+
a. The number of persons counted as unsheltered who were age 55+ was 422, which
represents a significant increase when compared to the number of persons
counted as unsheltered who were age 55+ in 2018.
18
2018
2019
Difference (+/-)
# %
Age 55 – 61 152 11.1 277 14.7 +125 +82.2
Age 62+ 94 6.8 145 7.7 +51 +54.2
Total: 246 - 422 - +176 +71.5
Lastly,
It is important to note that the city with the biggest increase in unsheltered persons was San
Bernardino. In 2019, 639 persons were counted as unsheltered and 333 in 2018, which
represents an increase of 306 persons or 91.9%. The 306 persons represents nearly two-thirds
(64.1%) of the total increase of 477 unsheltered persons.
Also, the cities of San Bernardino, Rialto, and Ontario had a combined increase of 406 persons,
which represents 85.1% of the total increase of 477 persons when compared.
19
Next Steps and Recommendations
This section outlines nine (9) steps that the San Bernardino County Continuum of Care should
take to help end homelessness. These steps are aligned with several evidence-based and best
practices that have helped achieve unprecedented decreases in the total number of homeless
persons, particularly among families, chronic homeless persons, and veterans across the country.
The nine (9) steps include:
1. Develop a multi-jurisdictional strategic plan that will be initiated and implemented
by the County of San Bernardino, cities, and the San Bernardino County Continuum
of Care (CoC).
A multi-jurisdictional strategic plan is currently under development. This strategic plan will be
initiated and implemented by the County of San Bernardino, cities, and the San Bernardino
County Continuum of Care (CoC). The Action Plan will consist of various data-driven steps that
the County of San Bernardino, cities, and the CoC will take in order to commit to, align, and
implement core requirements and practices that have been nationally recognized as necessary
actions to prevent and end homelessness. Participation and input from all jurisdictions and
community partners will be critical in developing a plan that can be implemented. A multi-
jurisdictional strategic plan is required for upcoming state funding opportunities.
2. Encourage each city to adopt its unsheltered homeless count numbers as baseline
numbers.
Each city should be encouraged to adopt the results of the unsheltered homeless count in its
jurisdiction as noted in Appendix A. After the cities adopting their numbers, each city should be
encouraged to implement the other steps below.
3. Increase the Number of Permanent Supportive Housing Units.
Each jurisdiction should consider increasing its number of permanent supportive housing units in
order to meet the needs of those homeless persons with disabling conditions who were counted
within its neighborhoods. These persons are noted by jurisdiction in Appendix A and include
persons with mental illness, substance abuse, and physical disabilities. Jurisdictions with
significant numbers of chronic homeless persons, veterans, and persons recently released from
correctional institutions after serving a court-mandated sentence should also consider increasing
their number of permanent supportive housing units. Increases in units should be based on
evidence-based practices to ensure success.
20
Permanent Supportive Housing provides long-term affordable rental housing and a broad range
of on-site and/or off-site wrap-around supportive services. The goal is to increase independent
living skills of residents who pay no more than 30% of their monthly income for rent so that they
are able to maintain their housing. Those persons without permanent disabling conditions may
ultimately become self-sufficient while living in affordable housing and may eventually pay 100%
of their rent and may or may not need supportive services.
4. Set an annual quantifiable number of permanent supportive housing units to be
developed based on the number of unsheltered chronically homeless individuals
identified in the recent Point-in-Time homeless count, Homeless Management
Information System (HMIS), and Coordinated Entry System (CES)
An annual quantifiable number of permanent supportive housing units should be set based on
the number of unsheltered chronically homeless households in the recent Point-in-Time
homeless count, Homeless Management Information System (HMIS), and Coordinated Entry
System (CES). Once annual numbers have been set, progress towards achieving each year’s goal
should be reported regularly.
Persons with Life-threatening Chronic Health Conditions
Particular attention should be given to those persons who are languishing on the streets and who
have life-threatening chronic health conditions. During the recent point-in-time count, persons
counted were asked “Has a doctor or other medical professional ever told you that you have a
chronic health condition that is life-threatening such as heart, lung, liver, kidney or cancerous
disease? Three hundred and forty-six (346) unsheltered persons or 18.5% of all unsheltered
adults stated “yes”
Persons Aging on the Streets
Particular attention should also be given to persons aging on the streets. There is a significant
number of persons who are aging on the streets.
In 2019, the number of persons counted as unsheltered who were age 55+ was 422. In 2018, the
number of persons counted as unsheltered who were age 55+ was 246. This represents an
increase of 176 persons or 71.5%.
According to the preponderance of research in this area, the growth of elder homelessness can
be attributed to the aging of existing chronically homeless individuals. Thus, targeting the needs
of the elderly homeless by making sure that housing that is accessible with persons with
disabilities and transportation to medical appointments is available is important.
21
Persons Recently Released from Correctional Institutions
Particular attention should also be given to persons recently released from correctional
institutions since realignment has resulted in thousands of prisoners being released or
transferred to county jails. As noted in Table 8, nearly one-fourth (22.1%) of persons counted
answered “yes” when asked if they were released from a correctional institution such as a jail or
prison during the past 12 months after serving a court-ordered sentence.
Permanent supportive housing for ex-offenders should be based on evidence-based practices
that have resulted in optimal outcomes for homeless ex-offenders reentering communities.
These practices include the provision of housing with appropriate wrap-around services such as
substance abuse counseling and treatment and life coping skills that help ex-offenders
successfully transition into local communities. These practices also include a clear path to career
development and/or employment and reunification with family members including children.
Optimal outcomes include reductions in recidivism and recurrence of homelessness. The chances
of recidivism significantly lessen when offenders are reengaged with family members and in
particular with their children. The chances of recidivism also significantly lessen when offenders
develop marketable skills that lead to on-going employment. Employment also encourages ex-
offenders to take the initial steps to reunite with family members. The chances of ex-offenders
becoming homeless again also significantly lessen with on-going employment and efforts to
foster relationships with family members after reunification.
5. Prioritize through the Coordinated Entry System the most vulnerable and frail
persons who are languishing on the streets including those with life-threatening
health conditions and/or who are aging on the streets
The most vulnerable and frail persons who are languishing on the streets should be prioritized
for permanent supportive housing through the Coordinated Entry System (CES). Such persons
should include those with life-threatening health conditions and/or who are aging on the streets.
Related language in the written standards and the policy and procedures for the CES should be
updated to reflect this prioritization.
6. Completely align with a Housing First model and low barrier approach for
chronically homeless individuals and families consistent with federal, state, and
local approaches.
Aligning a coordinated system with a Housing First and low barrier approach will help chronically
homeless households obtain and maintain permanent affordable housing, regardless of their
22
service needs or challenges, by removing barriers that hinder them from obtaining and
maintaining permanent affordable housing.
Chronically homeless persons can achieve stability in permanent housing, regardless of their
service needs or challenges, if provided with appropriate levels of services. Through this
approach, barriers are removed that have hindered homeless persons from obtaining housing
such as too little income or no income; active or history of substance use; criminal record, with
exceptions for state-mandated restrictions, and history of having been or currently a victim of
domestic violence (e.g., lack of a protective order, period of separation from abuser, or law
enforcement involvement). Furthermore, through this approach barriers that have hindered
homeless persons from maintaining housing are removed, such as failure to participate in
supportive services; failure to make progress on a service plan; loss of income or failure to
improve income; and fleeing domestic violence.
7. Completely align with a rapid rehousing and low barrier approach for non-
chronically homeless individuals and families.
Aligning a coordinated system with a rapid rehousing and low barrier approach will help non-
chronically homeless households obtain and maintain permanent affordable housing regardless
of their service needs or challenges by removing barriers that hinder them from obtaining and
maintaining permanent affordable housing.
Rapid rehousing assistance helps individuals and families quickly exit homelessness to permanent
housing. Rapid rehousing assistance is offered without preconditions (such as employment,
income, absence of criminal record, or sobriety), and the resources and services provided are
typically tailored to the unique needs of the household. The core components of a rapid re-
housing program include housing identification services, financial assistance for rent and move-
in, and accompanying case management and supportive services. While the program has all
three-core components available, it is not required that a household utilize them all.
8. Align the current homeless services delivery system with a goal of ending
homelessness among unaccompanied women.
Unaccompanied women experiencing homelessness often present with complex histories of
cumulative trauma exposure, substance use, mental illness, and chronic disease among other
conditions and circumstances. However, despite evidence that housing along with supportive
services is the best intervention to end homelessness, continuums of care across the country
have yet to identify the nature of specific interventions through a gender lens. Identifying
interventions that benefit and maximize women’s access to services as well as housing with
supportive services is an overdue priority. Trauma-informed care should be a top priority.
23
There is room for innovation. Identifying factors that promote housing retention and housing
stability among women is highly encouraged. This includes interventions aligned with a Housing
First approach that work best to support the ultimate goals of housing, promotion of wellbeing,
and the promotion of thriving or human flourishing for women who have experienced
homelessness.
9. Increase Rapid Rehousing Assistance
Efforts to rapidly rehouse households should include a focus on households living in vehicles. The
2019 homeless count and survey included the question, “Where did you sleep last night.” One
hundred and fifty-seven (157) households slept in a car, truck, van, of an RV that was in disrepair.
As it was stated before, Rapid rehousing assistance helps individuals and families quickly exit
homelessness to permanent housing. Rapid rehousing assistance is offered without
preconditions (such as employment, income, absence of criminal record, or sobriety), and the
resources and services provided are typically tailored to the unique needs of the household. The
core components of a rapid re-housing program include housing identification services, financial
assistance for rent and move-in, and accompanying case management and supportive services.
While a rapid re-housing program has all three-core components available, it is not required that
a household utilize them all.
24
II. Background Information
HUD, as part of its requirements for local jurisdictions to continue to receive continuum of care
funding for homeless persons, asks local jurisdictional applicants to conduct a “one-day point-in-
time” homeless count every other year during the last 10 days of January. The County of San
Bernardino is one of more than 400 jurisdictions that submit an annual application to HUD for
continuum of care funding.
When was the count conducted?
The homeless count was conducted on the streets during the hours of 6 a.m. and 10 a.m. on
January 24, 2019. The count was also conducted on the same day in shelters and transitional
housing programs throughout the county for persons who slept in these programs beginning the
night before.
HUD does allow counting under certain circumstances such as hard-to-reach and remote places
up to a week after the count as long as persons were asked if they were homeless on the day of
the count and a unique identifier is used to prevent duplication. A limited amount of counting
occurred during the Monday and Tuesday following the count in a few hard-to-reach and remote
places. Persons were asked if they were homeless on the day of the count and a unique identifier
was used to prevent duplication as described in the Methodology section below.
Who was counted?
Per HUD’s instructions, a person was considered homeless, and thus counted, only when he/she fell within the HUD-based definition by residing in one of the places described below:
• In places not meant for human habitation, such as cars, parks, sidewalks, and abandoned buildings;
• In an emergency shelter; and
• In transitional housing for homeless persons.
Who was not counted? Per HUD’s instructions, a person was not considered homeless if the person resided in one of the following places noted below
• Medical facilities, such as hospitals, psychiatric facilities, and nursing homes;
• Jails, prisons or juvenile detention facilities;
• Chemical dependency facilities, such as substance abuse treatment facilities and detox centers;
• Foster care homes or foster care group homes.
25
Also, per HUD’s instructions, children identified by McKinney-Vento Homeless Coordinators at schools as homeless should not be counted. Children may be counted during the count if they live in an emergency shelter or transitional housing program, or if they are unsheltered.
Lastly, HUD does not consider the following persons to be homeless—persons who are “doubled up,” or persons who are “near homelessness”—but considers them to be at risk of becoming homeless. Thus, such persons were not included in the homeless count.
The County of San Bernardino, like many other counties, has a substantial number of households that are at risk of becoming homeless. The Census Bureau noted that 18 percent or nearly 132,000 households consisting of about 400,000 residents in San Bernardino County were living below poverty level as reported in the 2017 American Community Survey. Also, according to the U.S. Census Bureau there were more than 120,000 households consisting of about 400,000 persons (nearly one of every five residents) in San Bernardino County who were members of a household whose annual income was less than $25,000 in 2017. There were approximately 65,000 households consisting of approximately 200,000 persons whose annual income was less than $15,000 a year. Many of these persons can become homeless because of social structural issues such as increases in rent, loss of job, and rising health care costs. In addition, personal experiences such as domestic violence, physical disabilities, mental illness, and substance abuse can cause members of a low-income household or an entire household to become homeless. Often, one or more of these experiences factor into a household’s homelessness experience.
Who carried out the count?
The homeless count and subpopulation survey were a joint effort of the San Bernardino County Homeless Partnership, the San Bernardino County Office of Homeless Services, and the Institute for Urban Initiatives. Over 700 community volunteers were recruited to implement the count and subpopulation survey. As noted in the Acknowledgements section of this report, there were nearly 30 agencies that contributed staff time and office space for training and deployment of counters and there were 24 law enforcement agencies that provided their time, knowledge, and expertise concerning locations of homeless persons. Also, there were nearly 30 additional agencies that helped with the planning process, including the San Bernardino County Information Services Department, which created maps to guide counters.
The San Bernardino County Homeless Partnership (SBCHP) was formed to provide a more focused approach to issues of homelessness within the County. Its primary purpose is to develop a countywide public and private partnership and to coordinate services and resources to end homelessness in San Bernardino County. The Partnership consists of community and faith-based organizations, educational institutions, non-profit organizations, private industry, and federal, state, and local governments. SBCHP was developed to promote a strong collaboration between agencies to direct the planning, development, and implementation of the County’s 10-year Strategy to end chronic homelessness. The Partnership provides leadership in creating a
26
comprehensive countywide network of service delivery to the homeless and near homeless families and individuals through facilitating better communication, planning, coordination, and cooperation among all entities that provide services and/or resources to relieve homelessness.
The San Bernardino County Office of Homeless Services (OHS) serves as a “clearing house” of
homeless issues for all County departments. Any homeless issues encountered by County staff
can be referred to this office for resolution. OHS staff plays a vital role in the San Bernardino
County Homeless Partnership as the administrative support unit to the organization. OHS insures
that the vision, mission and goals of the Partnership are carried into effect.
The Institute for Urban Initiatives consists of several community-based and faith-based institutes that respond to the economic, housing, and social needs of neighborhoods, cities, and counties from local community, regional, national, international, and faith-based perspectives and has completed over 50 assessments for local government and private organizations throughout Southern California that have focused on affordable housing, business development and education for micro-businesses, fair housing, homelessness, migrant farming, and street vending. For more information visit www.urban-initiatives.org.
27
III. Methodology
Unsheltered Count and Subpopulation Survey
There was a significant change in methodology concerning the unsheltered count and
subpopulation survey. As in past years, the following activities were conducted: 1) organizing the
count and subpopulation survey; 2) coordinating the count and subpopulation survey; 3)
implementing the count and subpopulation survey; and 4) analyzing the sub-population data.
However, the third activity, implementing the count and subpopulation survey, significantly
changed as described in sub-section 3 below. Also, the fourth activity, analyzing the sub-
population data, significantly changed as a result of a much lower number of completed surveys
compared to past years described in sub-section 4 below.
1. Organizing the Count and Subpopulation Survey
Organizing the count consisted of the following four activities: a) the county was divided into
organizational regions; b) the organizational regions were divided into planning communities; c)
the planning communities were divided into implementation areas; and d) the implementation
areas were divided into count zones.
a. County was Divided into Organizational Regions The County was divided into the following organizational regions:
• West Valley which consisted of the area west of the City of San Bernardino including the cities of Chino, Chino Hills, Colton, Fontana, Montclair, Ontario, Rancho Cucamonga, Rialto, Upland and the surrounding unincorporated areas.
• East Valley which consisted of the City of San Bernardino and all areas south and east including the cities of Grand Terrace, Highland, Loma Linda, Redlands, Twenty-nine Palms, Yucaipa, Yucca Valley and the surrounding unincorporated communities along with the San Bernardino Mountain communities.
• High Desert which consisted of the area north of the San Bernardino Mountains including the cities of Adelanto, Apple Valley, Barstow, Hesperia, Needles, Victorville and the surrounding unincorporated communities.
b. Organizational Regions were Divided into Planning Communities
Each of the three Organizational Regions was divided into 20 planning communities of
incorporated cities and/or unincorporated jurisdictions in order to plan and implement the
activities below. The County consists of 24 incorporated cities and over three dozen
unincorporated communities. However, not all of these cities and counties were included in the
28
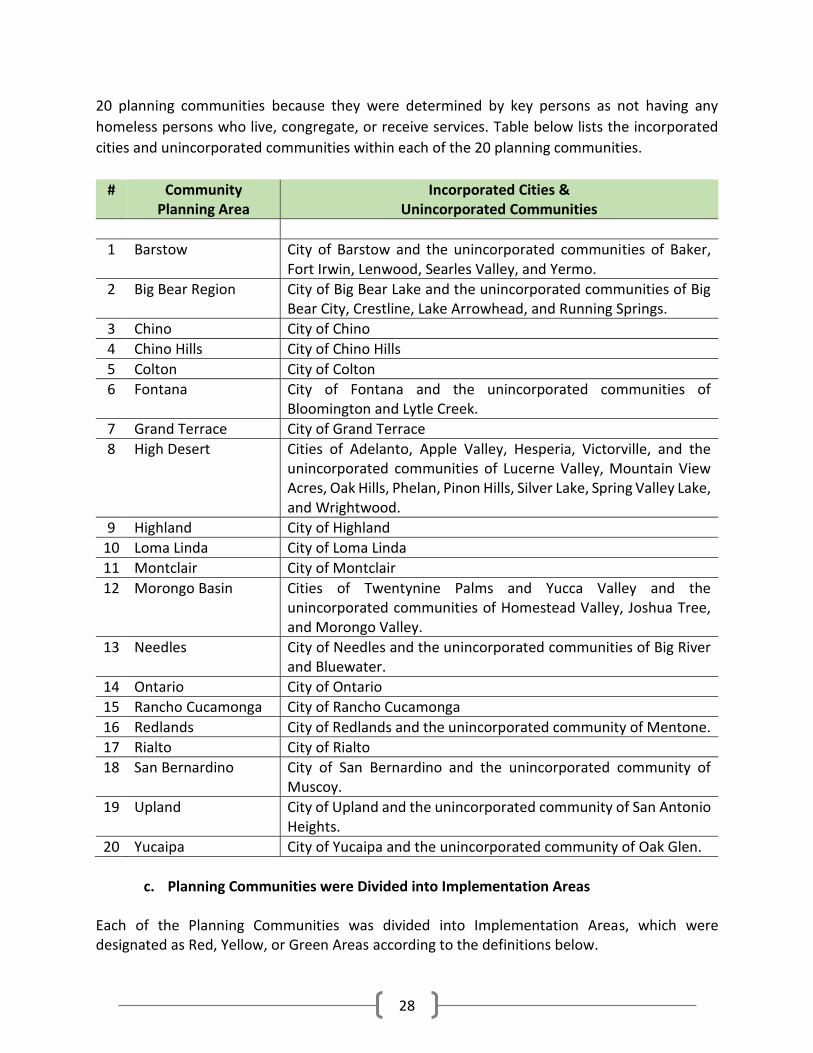
20 planning communities because they were determined by key persons as not having any
homeless persons who live, congregate, or receive services. Table below lists the incorporated
cities and unincorporated communities within each of the 20 planning communities.
# Community Planning Area
Incorporated Cities & Unincorporated Communities
1 Barstow City of Barstow and the unincorporated communities of Baker, Fort Irwin, Lenwood, Searles Valley, and Yermo.
2 Big Bear Region City of Big Bear Lake and the unincorporated communities of Big Bear City, Crestline, Lake Arrowhead, and Running Springs.
3 Chino City of Chino
4 Chino Hills City of Chino Hills
5 Colton City of Colton
6 Fontana City of Fontana and the unincorporated communities of Bloomington and Lytle Creek.
7 Grand Terrace City of Grand Terrace
8 High Desert Cities of Adelanto, Apple Valley, Hesperia, Victorville, and the unincorporated communities of Lucerne Valley, Mountain View Acres, Oak Hills, Phelan, Pinon Hills, Silver Lake, Spring Valley Lake, and Wrightwood.
9 Highland City of Highland
10 Loma Linda City of Loma Linda
11 Montclair City of Montclair
12 Morongo Basin Cities of Twentynine Palms and Yucca Valley and the unincorporated communities of Homestead Valley, Joshua Tree, and Morongo Valley.
13 Needles City of Needles and the unincorporated communities of Big River and Bluewater.
14 Ontario City of Ontario
15 Rancho Cucamonga City of Rancho Cucamonga
16 Redlands City of Redlands and the unincorporated community of Mentone.
17 Rialto City of Rialto
18 San Bernardino City of San Bernardino and the unincorporated community of Muscoy.
19 Upland City of Upland and the unincorporated community of San Antonio Heights.
20 Yucaipa City of Yucaipa and the unincorporated community of Oak Glen.
c. Planning Communities were Divided into Implementation Areas
Each of the Planning Communities was divided into Implementation Areas, which were designated as Red, Yellow, or Green Areas according to the definitions below.
29
• Red Areas were defined as implementation areas where there are no homeless persons as determined by local community representatives and stakeholders;
Red areas included those areas that are either remote and/or uninhabitable, which were primarily small rural communities that are spread throughout the desert and mountain regions of the county.
• Yellow Areas were defined as implementation areas where only professional outreach workers might go. These areas may prove too difficult to cover and/or unsafe for volunteer counters, such as community representatives or stakeholders, in their effort to count and survey homeless persons. Immediately prior to, or immediately after the count, local professional representatives involved in the homeless count such as law enforcement or street outreach workers verified if homeless persons lived in these areas and determined the number of homeless persons who were included in the count;
• Green Areas were defined as implementation areas where homeless persons can be found as determined by local community representatives.
All of the incorporated cities in the county, along with significant areas within their surrounding unincorporated territory, were identified by local key person teams as Green Areas.
d. Implementation Areas were Divided into Count Zones
Implementation Areas that were designated as Green Areas were divided into Count Zones.
Teams of Counters were deployed to designated count zones within each of the Green Areas.
Teams of Counters were not deployed to Yellow or Red Areas.
2. Coordinating the Count and Subpopulation Survey
Coordinating the count and subpopulation survey included implementing the following activities in each local Planning Community: 1) establishing a key-persons’ team; 2) distinguishing areas within the planning community where homeless people live; 3) identifying places where homeless people live within the identified areas; 4) identifying places where homeless people receive social services; 5) raising public awareness and community involvement; and Implementing the Count and Subpopulation Survey.
a. Establishing a Community Key-Persons’ Team A Community Key Person Team was established for each planning community and consisted of
representatives from public and private organizations who were knowledgeable about
homelessness and where homeless persons live. Such key persons included representation from
30
business, civic, educational, faith-based, law enforcement, local government, neighborhood, and
nonprofit organizations. Homeless and formerly homeless persons were also encouraged to join.
b. Distinguishing Implementation Areas within the Planning Community Each Community Key-Persons’ Team distinguished implementation areas within their planning community where homeless people could be found. Such areas included a quadrant or section of a city or unincorporated area or an entire neighborhood. Those sections of the planning community where homeless persons could be found were designated as Green Areas. Conversely, those sections where homeless persons are known not to live or spend time were designated Red Areas.
c. Identifying Verifiable Places where Homeless People Live/Congregate Each Community Key Person Team also identified specific locations where homeless people live and/or congregate within their designated Green Areas. Such places included abandoned buildings, commercial areas, parks, sidewalks, vacant lots and vehicles. Known encampments were also specifically identified within Green Areas. Other places included a whole neighborhood or a specific length of a street. Such information remains confidential.
d. Identifying Places where Homeless People Receive Social Services Each Community Key Person Team also identified non-residential locations and/or programs where homeless people go to receive social services and other forms of assistance. Programs included locations that distributed packaged food and/or clothing, serve meals, and provide shower or laundry services, including those operated by faith-based organizations. Other program sites included those that were known to provide domestic violence, health care, mental health care, substance abuse, transportation, and veteran services for homeless persons.
e. Raising Public Awareness and Community Involvement The primary purpose of raising public awareness and community involvement was to recruit volunteers to help implement the count in each planning community. Volunteers were recruited both locally and countywide from a wide-range of sources including city and county employees, homeless service providers, other social service agencies, non-profit organizations, faith-based institutions, local businesses, civic organizations, educational institutions, currently and formerly homeless individuals and other interested community stakeholders. Flyers and other materials were developed for distribution at community meetings and forums,
media outlets and various public facilities, service locations, churches, college campuses and
other public locations. A project website was established with general project information and
volunteer outreach materials. Volunteer registration was also promoted through the web site
during the months leading up to the day of the count.
31
Community involvement included creating teams of volunteers to count homeless persons in
designated Green zones. Teams included persons who were involved in community service or
interested in community service. Teams also included persons who had considerable exposure
as well as little exposure to homelessness.
3. Implementing the Count and Subpopulation Survey
After a pilot program was conducted in the Morongo Basin in 2018, the decision was made to
transition from a paper survey to a digital survey County-wide in 2019 using Esri’s ArcGIS software
platform. The 2019 Homeless Point-in-Time Count was a configuration of Survey 123 for ArcGIS
and Operations Dashboard for ArcGIS that was used by the County’s Office of Homeless Services
in partnership with the Information Services Department to conduct the 2019 homeless count
and survey.
The Homeless Point-in-Time Count solution included the following applications:
• Homeless count survey, which included nearly 30 questions to meet HUD requirements
concerning the collection of data for designated subpopulations and to meet local
requests for additional information about the homeless population;
• Homeless count dashboard, which was used to monitor results of a Point-in-Time Count
in real time;
• Homeless count results application that provided for instant viewing of data and tables
that detailed point-in-time results.
Rather than fill out surveys using a pen, paper, and clipboard, volunteers instead used Suvey123
for ArcGIS. The digital survey form was designed to simplify the surveyor’s experience; only
relevant questions were displayed based on the answers already entered, eliminating the need
for surveyors to devote time and effort to determining which questions to ask, and resulting in a
simpler linear surveying experience.
Additional logic was built into the form to perform calculations behind-the-scenes. For example,
the form combined the answers from a subset of questions to determine whether the respondent
met HUD’s definition of chronically homeless, and calculated the result instantly as the survey
was completed. Extensive testing was conducted to ensure the various combinations of factors
all successfully calculated to a correct result. These calculations allowed for real-time monitoring
of such metrics as the count was taking place using an Operations Dashboard, and ultimately
eliminated the need for them to be calculated after the count was completed.
32
An added benefit of using digital surveys was the capture of location information. When a survey
was conducted, the GPS location of the surveyor’s mobile device was captured, providing a
geographic location of where the survey took place, and opening up opportunities for mapping
and analyses not possible in previous years. (For safety and privacy reasons, location information
was not captured for surveys of sheltered homeless persons.) Upon completion of the count, the
data were examined and scrubbed to remove any invalid records, such as practice surveys
submitted before the official start of the count. Steps were also taken to ensure that duplicate
records – instances where the same individual was surveyed more than once in the same location
– were identified and removed.
Two Significant Changes
There were two significant changes that took place this year when compared to past years as a
result of the activities noted above. One was targeted mapping and the other was closer
monitoring of undercounted areas.
Targeted mapping
The use of the ESRI application provided for the instant pinpoint mapping of homeless individuals
on the day of the count, which was a methodological change from previous years in which
mapping of homeless concentrations were pre-determined. This contributed to the assigned
areas being more thoroughly canvassed than in past years and to potentially counting more
homeless individuals.
Locations of homeless persons and encampments from the HOPE Team Homeless Contact app
were layered on the printout maps given to teams of volunteer counters, which was not done
last year.
Maps of zones and specific areas within jurisdictions were provided again this year to teams of
volunteer counters and included the known locations provided by key persons within the
jurisdictions. This year, however, these maps included known locations from the HOPE Team
Homeless Contact app. These locations are the result of professional HOPE Team members
mapping homeless persons that they assist throughout the year.
The zone maps given to teams of volunteers this year were created by:
• creating a map of a jurisdiction;
• marking the known locations of homeless persons provided by key persons within the
jurisdiction;
• marking the known locations from the HOPE Team Homeless Contact app.
33
The known locations from the HOPE Team Homeless Contact app were pinpoint locations. For
example, a pinpoint could be behind a building or between buildings. This helped guide teams of
volunteers to more exact locations within their zone this year.
Closer monitoring of undercounted areas
As previously noted, the ESRI Survey 123 app provided the ability for a homeless count
dashboard, which was used to monitor results of the Point-in-Time Count in real time. This
provided instant viewing of data points on the dash board in the command center during the
time of the count. Each data point represented a household counted.
If data points did not appear in areas where homeless persons were known to live during the day
of the count, volunteers were sent to the area to count and persons counted were included in
the total count if they were not previously counted.
If data points did not appear in areas where homeless persons were known to live, professional
outreach workers were sent there the next day to these areas and persons counted were
included in the total count if they were not counted the day before. HUD allows for next day
counting based upon two conditions: 1) any homeless persons encountered have to be asked if
they were homeless on the day of the count and 2) a unique identifier has to be created for that
person.
A unique identifier was created for all persons counted on the day of the count and the day after
the count. If the same unique identifier appeared twice it was assumed that it was the same
person; also, a person was only included once in the total count if the person stated “yes” when
asked “if they were homeless on the day of the count,” which was Thursday, January 24th.
4. Analyzing the subpopulation data
How some of the subpopulation data was analyzed changed as a result of a much lower number
of completed surveys compared to past years. Only adults and unaccompanied teenage children
who are counted are surveyed, accompanied children in families were not. Of the 1,878 adults
and unaccompanied teenage children counted, 1,186 or 63.1% were surveyed and 692 or 36.9%
were observed. Counters were instructed that if they believed there was a safety issue, or if a
person was sleeping, or if a person refused to be interviewed, they were to record “no” in the
digital survey form for question 4, which was “Are you able to interview this person” and then to
give the best guess-estimate for questions 5 – 8, which asked for gender, age, ethnicity, and race.
34
The current 36.9% of observed persons was much higher than in past years, which had
observation rates of 20% or lower. As a result, representatives of the San Bernardino Continuum
of Care conferred with HUD regarding the much higher observation rate for this year and how
best to determine the number of the HUD required subpopulations that CoCs have to report to
HUD. HUD recommended a stratified extrapolation, which was done.
NOTE: Stratified extrapolation was only used to determine subpopulations and not the total
number of unsheltered persons, which was solely based on the number of adults and
unaccompanied teenage children surveyed and observed (1,878) and the 42 accompanied
children under age 18, which equals 1,920 unsheltered adults and children.
Stratified extrapolation focused on determining the numbers within the 692 observed adults that
were chronically homeless, veterans, had mental illness, had a substance use disorder, and had
HIV/AIDS. HUD requires CoCs to submit this subpopulation information and Congress requires
HUD to use this information to help provide nationwide estimates of homelessness in the Annual
Homeless Assessment Report (AHAR), which is a report that HUD is required to submit to
Congress.
Following HUD’s instructions, stratified extrapolation involved:
• determining how many of the 1,186 adults were surveyed in each city and unincorporated
area;
• calculating the percent of surveyed adults for each of the subpopulations based on their
answers for each city and unincorporated area;
• applying the same percent of surveyed adults for each of the subpopulations to the 692
observed adults after determining how many of the 692 adults were observed in each city
and unincorporated area.
For example, if in a given city, 30% of the adults surveyed were chronically homeless, the same
percent was applied to the adults observed in the given city. In other words, if 100 persons were
counted as unsheltered in the given city and 60% were surveyed and 40 percent were observed,
30% of the 60% would equal 18 chronically homeless adults and 30% of the 40% would equal 12
chronically homeless persons for a total of 30 chronically homeless adults, which is 30% of the
100 adults who were either surveyed or observed.
Sheltered Count and Subpopulation Survey
As required by HUD, the sheltered count included the number of persons and households
sleeping in emergency shelters (including seasonal shelters), transitional housing, and Safe Haven
programs (of which the County has none) that were listed on the Housing Inventory Chart (HIC).
35
In addition, any persons staying in hotels or motels as a result of receiving a voucher from a social
service agency were included in the sheltered count, per HUD’s instructions, if the voucher
program was listed on the HIC.
The HIC was submitted by the Office of Homeless Services (OHS) staff to HUD in May, 2018. Prior
to the homeless count, the HIC was specifically left undated to include any new programs or
exclude any programs no longer operational by OHS staff and Key Person Task Force members.
A few changes were made to the HIC prior to the count.
HUD encourages the use of Homeless Management Information Services (HMIS) data to generate
sheltered counts and subpopulation data for programs with 100% of beds participating in HMIS.
Thus, HMIS was used to gather the total number of occupied beds and the number of persons
for each subpopulation. A “Data Collection Instrument” was used to collect the total number of
occupied beds and the number of persons for each subpopulation for non-participating HMIS
programs and for HMIS participating agencies that do not have their HMIS data complete and
correct. The same questions used to collect subpopulation data through HMIS were used for the
data collection instrument. Thus, sheltered count data for all sheltered programs was gathered
either through a data collection sheet or HMIS.
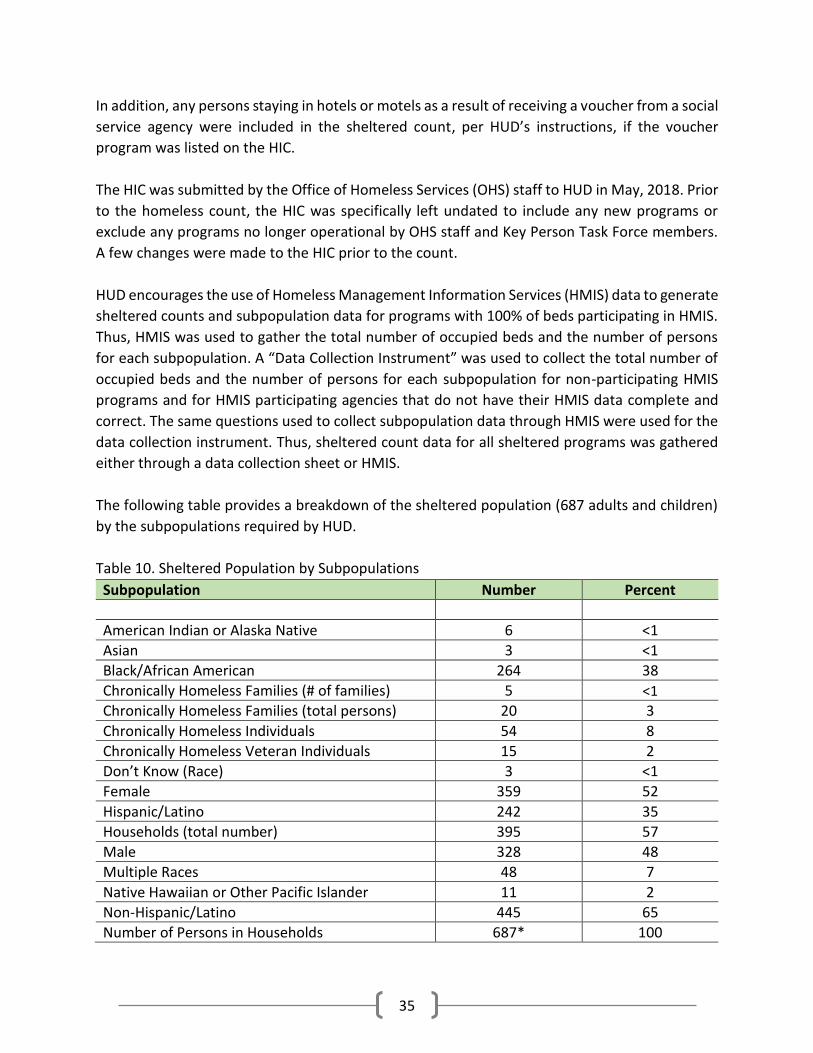
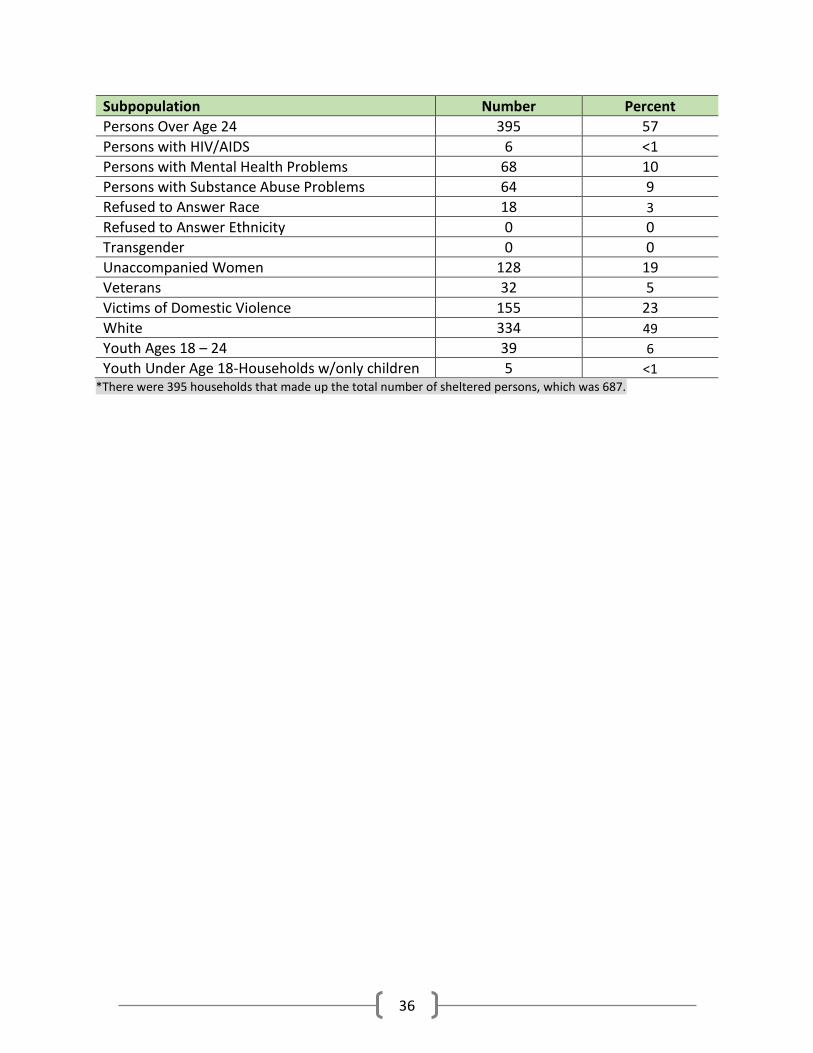
The following table provides a breakdown of the sheltered population (687 adults and children)
by the subpopulations required by HUD.
Table 10. Sheltered Population by Subpopulations
Subpopulation Number Percent
American Indian or Alaska Native 6 <1
Asian 3 <1
Black/African American 264 38
Chronically Homeless Families (# of families) 5 <1
Chronically Homeless Families (total persons) 20 3
Chronically Homeless Individuals 54 8
Chronically Homeless Veteran Individuals 15 2
Don’t Know (Race) 3 <1
Female 359 52
Hispanic/Latino 242 35
Households (total number) 395 57
Male 328 48
Multiple Races 48 7
Native Hawaiian or Other Pacific Islander 11 2
Non-Hispanic/Latino 445 65
Number of Persons in Households 687* 100
36
Subpopulation Number Percent
Persons Over Age 24 395 57
Persons with HIV/AIDS 6 <1
Persons with Mental Health Problems 68 10
Persons with Substance Abuse Problems 64 9
Refused to Answer Race 18 3
Refused to Answer Ethnicity 0 0
Transgender 0 0
Unaccompanied Women 128 19
Veterans 32 5
Victims of Domestic Violence 155 23
White 334 49
Youth Ages 18 – 24 39 6
Youth Under Age 18-Households w/only children 5 <1 *There were 395 households that made up the total number of sheltered persons, which was 687.
37
IV. Unsheltered Subpopulation Summaries
This section provides a breakdown of each of the following unsheltered subpopulations listed in
the table above by other subpopulations:
• Veterans;
• Chronically homeless;
• Families;
• Seniors 62+;
• Unaccompanied Women; and
• Youth ages 18 – 24.
38
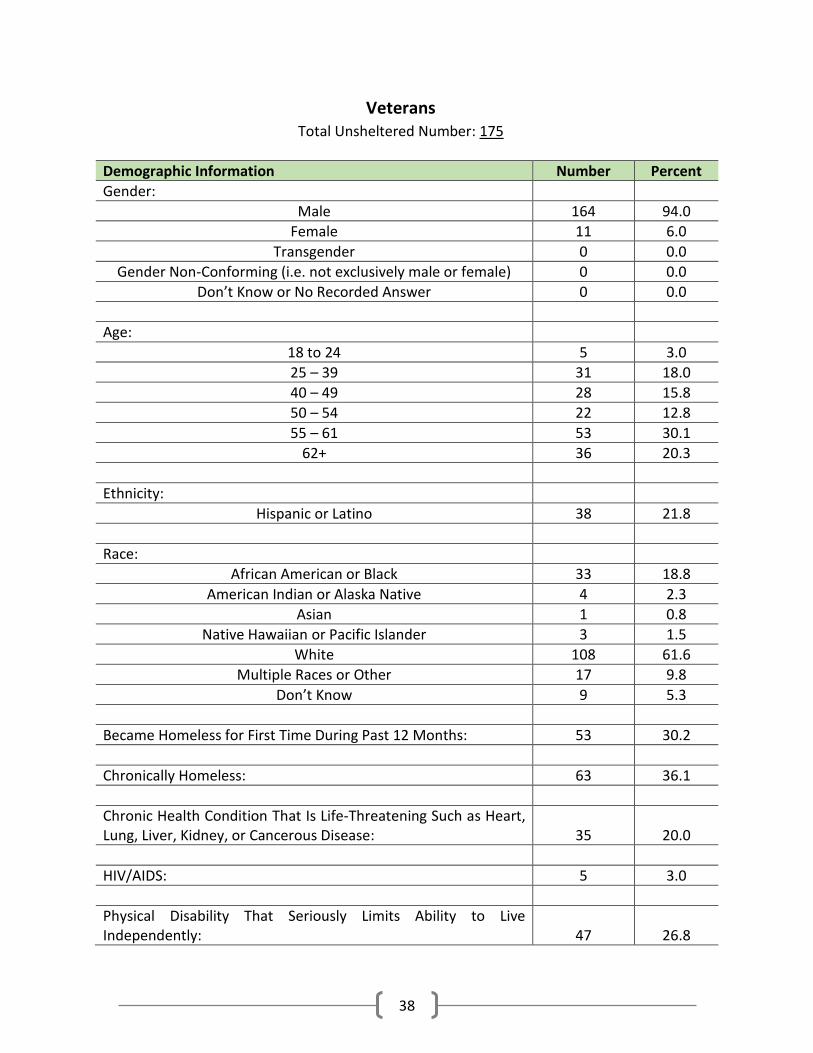
Veterans Total Unsheltered Number: 175
Demographic Information Number Percent
Gender:
Male 164 94.0
Female 11 6.0
Transgender 0 0.0
Gender Non-Conforming (i.e. not exclusively male or female) 0 0.0
Don’t Know or No Recorded Answer 0 0.0
Age:
18 to 24 5 3.0
25 – 39 31 18.0
40 – 49 28 15.8
50 – 54 22 12.8
55 – 61 53 30.1
62+ 36 20.3
Ethnicity:
Hispanic or Latino 38 21.8
Race:
African American or Black 33 18.8
American Indian or Alaska Native 4 2.3
Asian 1 0.8
Native Hawaiian or Pacific Islander 3 1.5
White 108 61.6
Multiple Races or Other 17 9.8
Don’t Know 9 5.3
Became Homeless for First Time During Past 12 Months: 53 30.2
Chronically Homeless: 63 36.1
Chronic Health Condition That Is Life-Threatening Such as Heart, Lung, Liver, Kidney, or Cancerous Disease:
35 20.0
HIV/AIDS: 5 3.0
Physical Disability That Seriously Limits Ability to Live Independently:
47 26.8
39
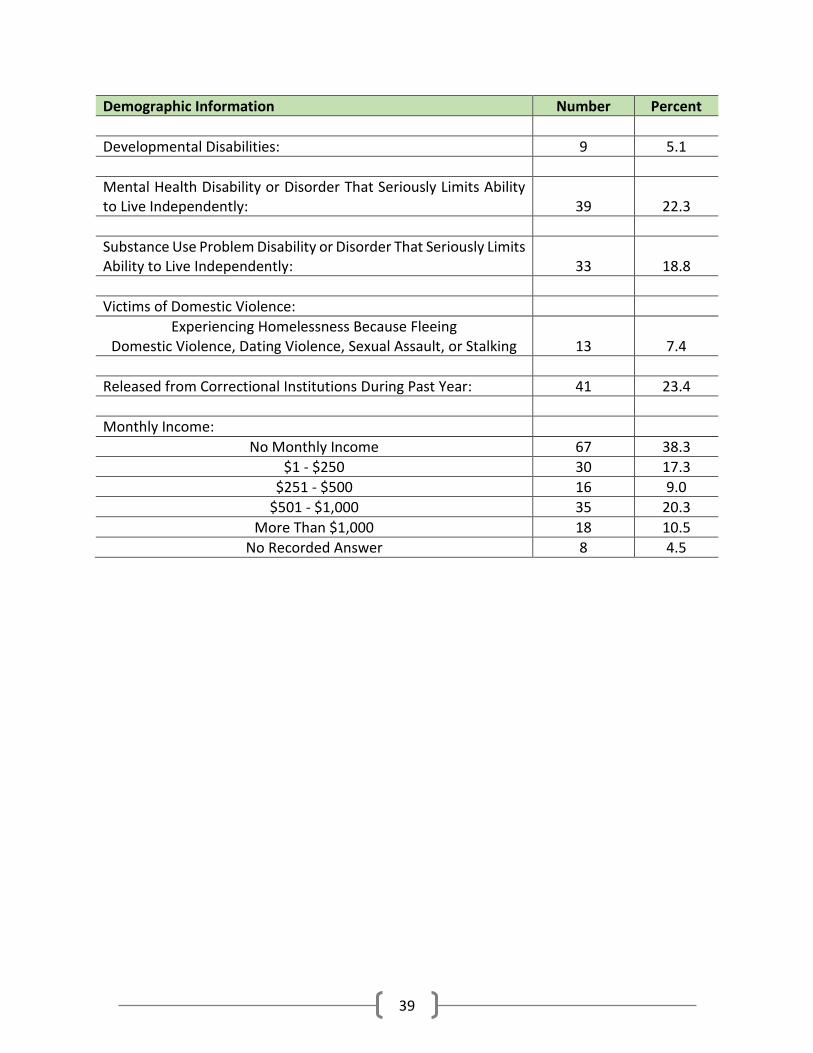
Demographic Information Number Percent
Developmental Disabilities: 9 5.1
Mental Health Disability or Disorder That Seriously Limits Ability to Live Independently:
39 22.3
Substance Use Problem Disability or Disorder That Seriously Limits Ability to Live Independently:
33 18.8
Victims of Domestic Violence:
Experiencing Homelessness Because Fleeing Domestic Violence, Dating Violence, Sexual Assault, or Stalking
13 7.4
Released from Correctional Institutions During Past Year: 41 23.4
Monthly Income:
No Monthly Income 67 38.3
$1 - $250 30 17.3
$251 - $500 16 9.0
$501 - $1,000 35 20.3
More Than $1,000 18 10.5
No Recorded Answer 8 4.5
40
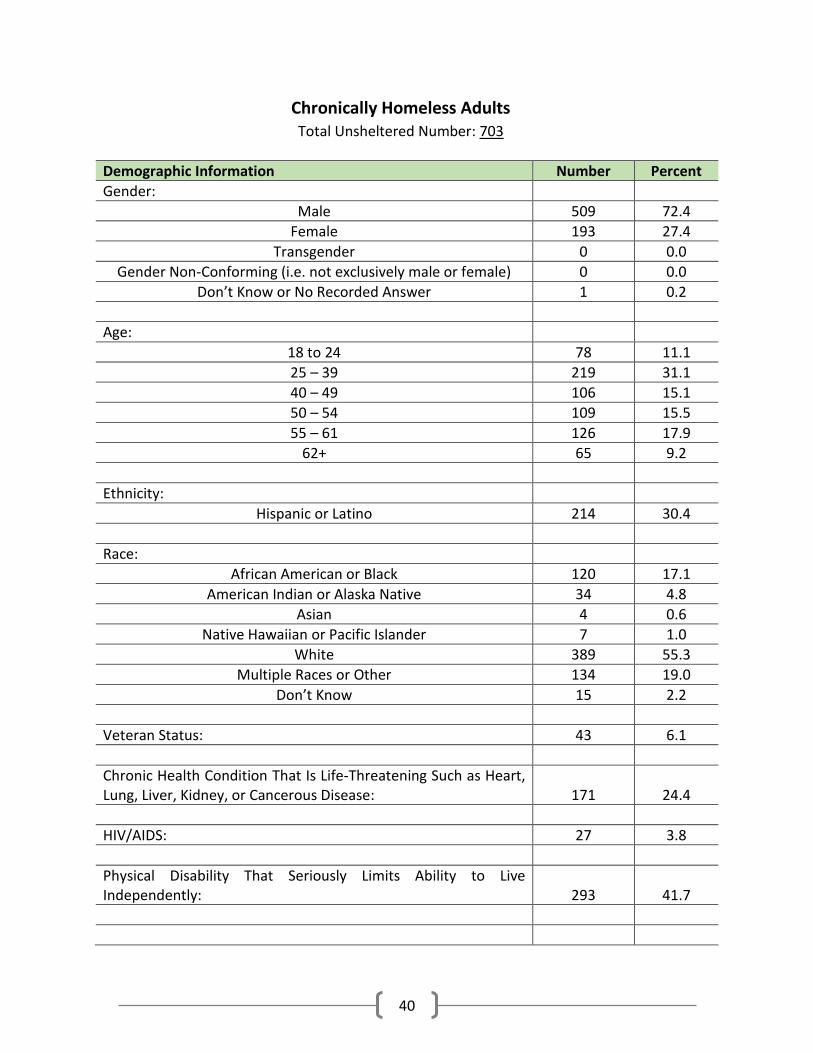
Chronically Homeless Adults Total Unsheltered Number: 703
Demographic Information Number Percent
Gender:
Male 509 72.4
Female 193 27.4
Transgender 0 0.0
Gender Non-Conforming (i.e. not exclusively male or female) 0 0.0
Don’t Know or No Recorded Answer 1 0.2
Age:
18 to 24 78 11.1
25 – 39 219 31.1
40 – 49 106 15.1
50 – 54 109 15.5
55 – 61 126 17.9
62+ 65 9.2
Ethnicity:
Hispanic or Latino 214 30.4
Race:
African American or Black 120 17.1
American Indian or Alaska Native 34 4.8
Asian 4 0.6
Native Hawaiian or Pacific Islander 7 1.0
White 389 55.3
Multiple Races or Other 134 19.0
Don’t Know 15 2.2
Veteran Status: 43 6.1
Chronic Health Condition That Is Life-Threatening Such as Heart, Lung, Liver, Kidney, or Cancerous Disease:
171 24.4
HIV/AIDS: 27 3.8
Physical Disability That Seriously Limits Ability to Live Independently:
293 41.7
41
Demographic Information Number Percent
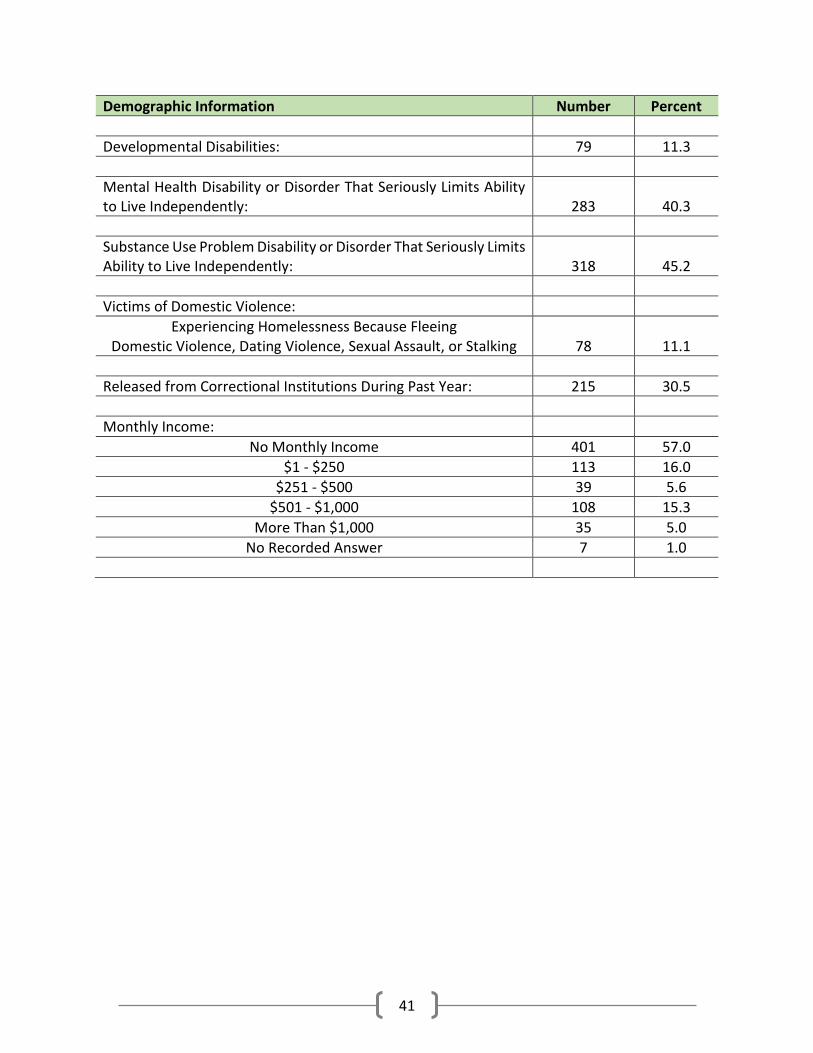
Developmental Disabilities: 79 11.3
Mental Health Disability or Disorder That Seriously Limits Ability to Live Independently:
283 40.3
Substance Use Problem Disability or Disorder That Seriously Limits Ability to Live Independently:
318 45.2
Victims of Domestic Violence:
Experiencing Homelessness Because Fleeing Domestic Violence, Dating Violence, Sexual Assault, or Stalking
78 11.1
Released from Correctional Institutions During Past Year: 215 30.5
Monthly Income:
No Monthly Income 401 57.0
$1 - $250 113 16.0
$251 - $500 39 5.6
$501 - $1,000 108 15.3
More Than $1,000 35 5.0
No Recorded Answer 7 1.0
42
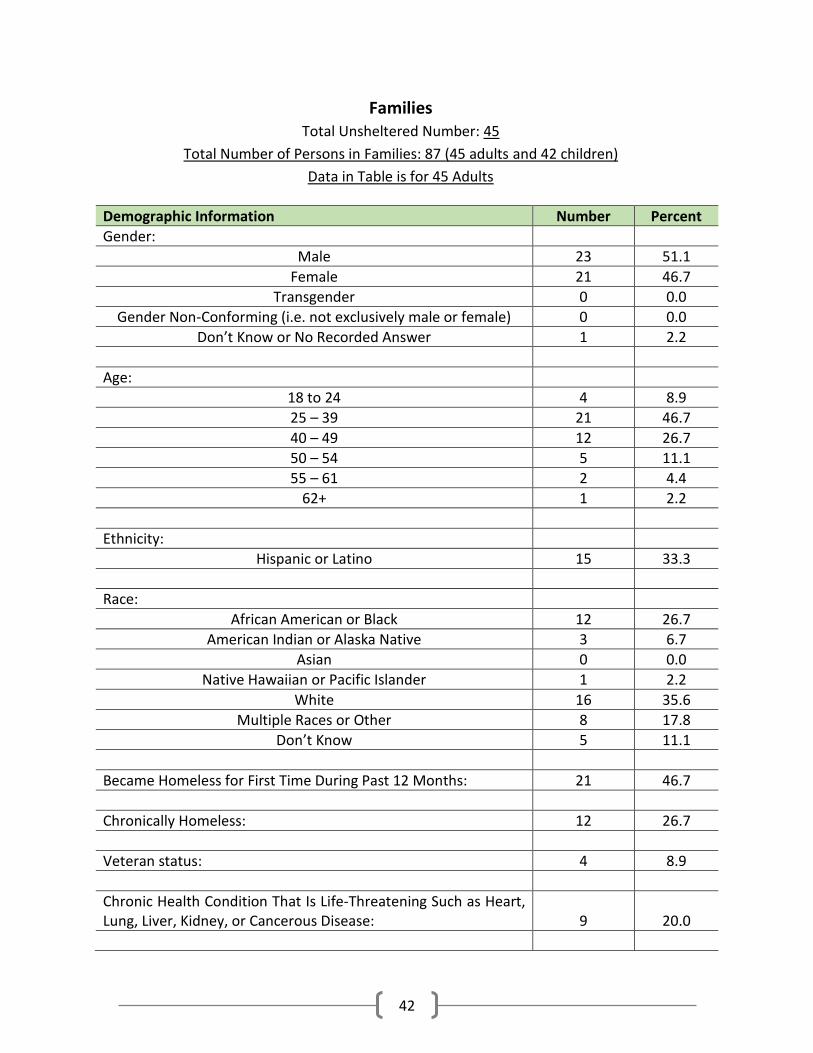
Families Total Unsheltered Number: 45
Total Number of Persons in Families: 87 (45 adults and 42 children)
Data in Table is for 45 Adults
Demographic Information Number Percent
Gender:
Male 23 51.1
Female 21 46.7
Transgender 0 0.0
Gender Non-Conforming (i.e. not exclusively male or female) 0 0.0
Don’t Know or No Recorded Answer 1 2.2
Age:
18 to 24 4 8.9
25 – 39 21 46.7
40 – 49 12 26.7
50 – 54 5 11.1
55 – 61 2 4.4
62+ 1 2.2
Ethnicity:
Hispanic or Latino 15 33.3
Race:
African American or Black 12 26.7
American Indian or Alaska Native 3 6.7
Asian 0 0.0
Native Hawaiian or Pacific Islander 1 2.2
White 16 35.6
Multiple Races or Other 8 17.8
Don’t Know 5 11.1
Became Homeless for First Time During Past 12 Months: 21 46.7
Chronically Homeless: 12 26.7
Veteran status: 4 8.9
Chronic Health Condition That Is Life-Threatening Such as Heart, Lung, Liver, Kidney, or Cancerous Disease:
9 20.0

43
Demographic Information Number Percent
HIV/AIDS: 1 2.2
Physical Disability That Seriously Limits Ability to Live Independently:
9 20.0
Developmental Disabilities: 1 2.2
Mental Health Disability or Disorder That Seriously Limits Ability to Live Independently:
3 6.7
Substance Use Problem Disability or Disorder That Seriously Limits Ability to Live Independently:
6 13.3
Victims of Domestic Violence:
Experiencing Homelessness Because Fleeing Domestic Violence, Dating Violence, Sexual Assault, or Stalking
5 11.1
Released from Correctional Institutions During Past Year: 3 6.7
Monthly Income:
No Monthly Income 24 53.3
$1 - $250 4 8.9
$251 - $500 9 20.0
$501 - $1,000 4 8.9
More Than $1,000 2 4.4
No Recorded Answer 2 4.4
44
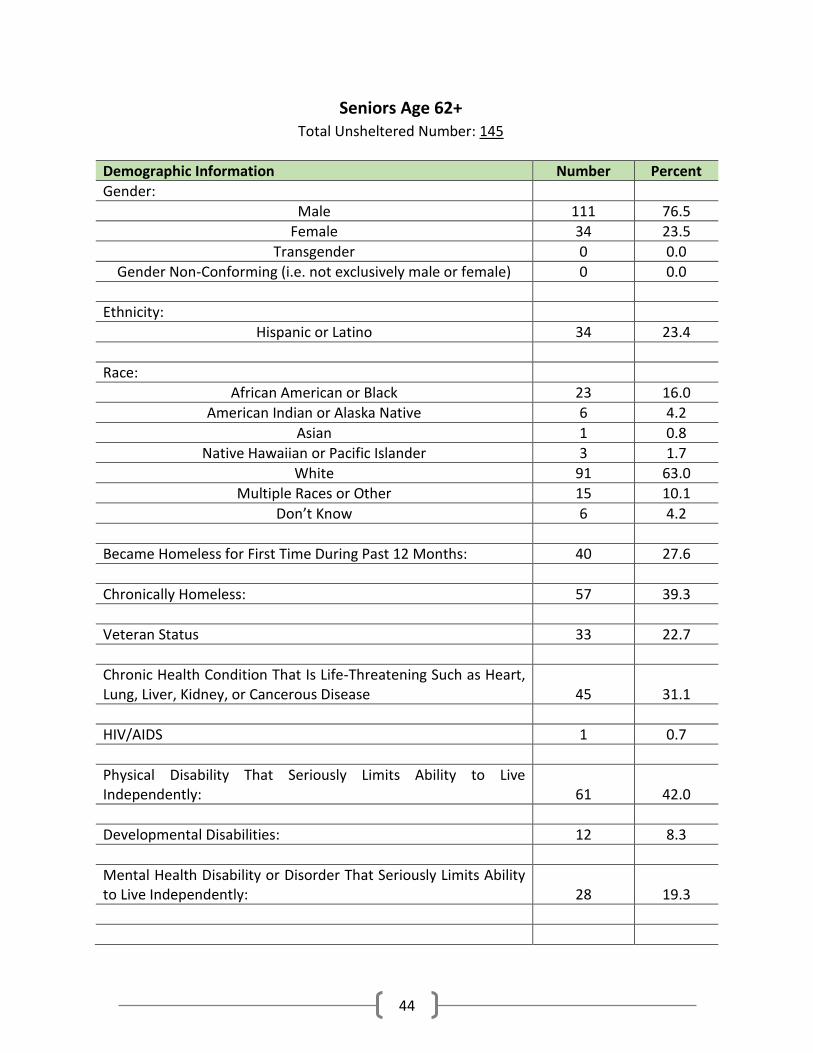
Seniors Age 62+ Total Unsheltered Number: 145
Demographic Information Number Percent
Gender:
Male 111 76.5
Female 34 23.5
Transgender 0 0.0
Gender Non-Conforming (i.e. not exclusively male or female) 0 0.0
Ethnicity:
Hispanic or Latino 34 23.4
Race:
African American or Black 23 16.0
American Indian or Alaska Native 6 4.2
Asian 1 0.8
Native Hawaiian or Pacific Islander 3 1.7
White 91 63.0
Multiple Races or Other 15 10.1
Don’t Know 6 4.2
Became Homeless for First Time During Past 12 Months: 40 27.6
Chronically Homeless: 57 39.3
Veteran Status 33 22.7
Chronic Health Condition That Is Life-Threatening Such as Heart, Lung, Liver, Kidney, or Cancerous Disease
45 31.1
HIV/AIDS 1 0.7
Physical Disability That Seriously Limits Ability to Live Independently:
61 42.0
Developmental Disabilities: 12 8.3
Mental Health Disability or Disorder That Seriously Limits Ability to Live Independently:
28 19.3
45
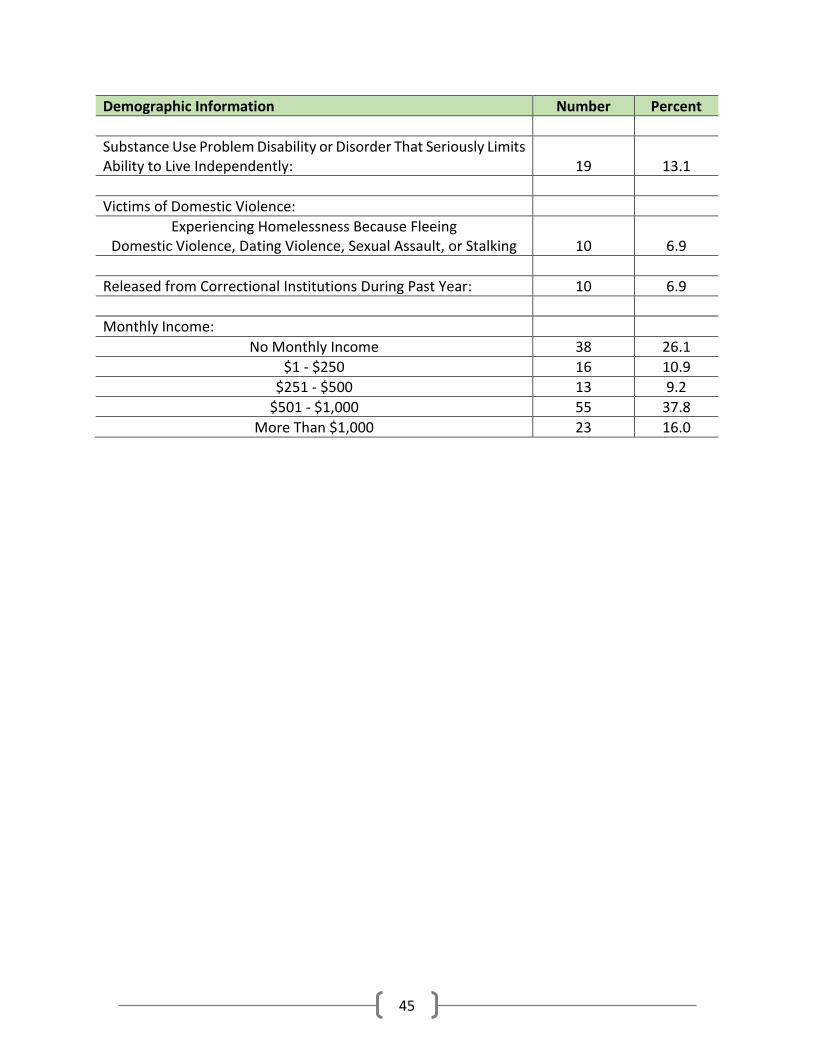
Demographic Information Number Percent
Substance Use Problem Disability or Disorder That Seriously Limits Ability to Live Independently:
19 13.1
Victims of Domestic Violence:
Experiencing Homelessness Because Fleeing Domestic Violence, Dating Violence, Sexual Assault, or Stalking
10 6.9
Released from Correctional Institutions During Past Year: 10 6.9
Monthly Income:
No Monthly Income 38 26.1
$1 - $250 16 10.9
$251 - $500 13 9.2
$501 - $1,000 55 37.8
More Than $1,000 23 16.0
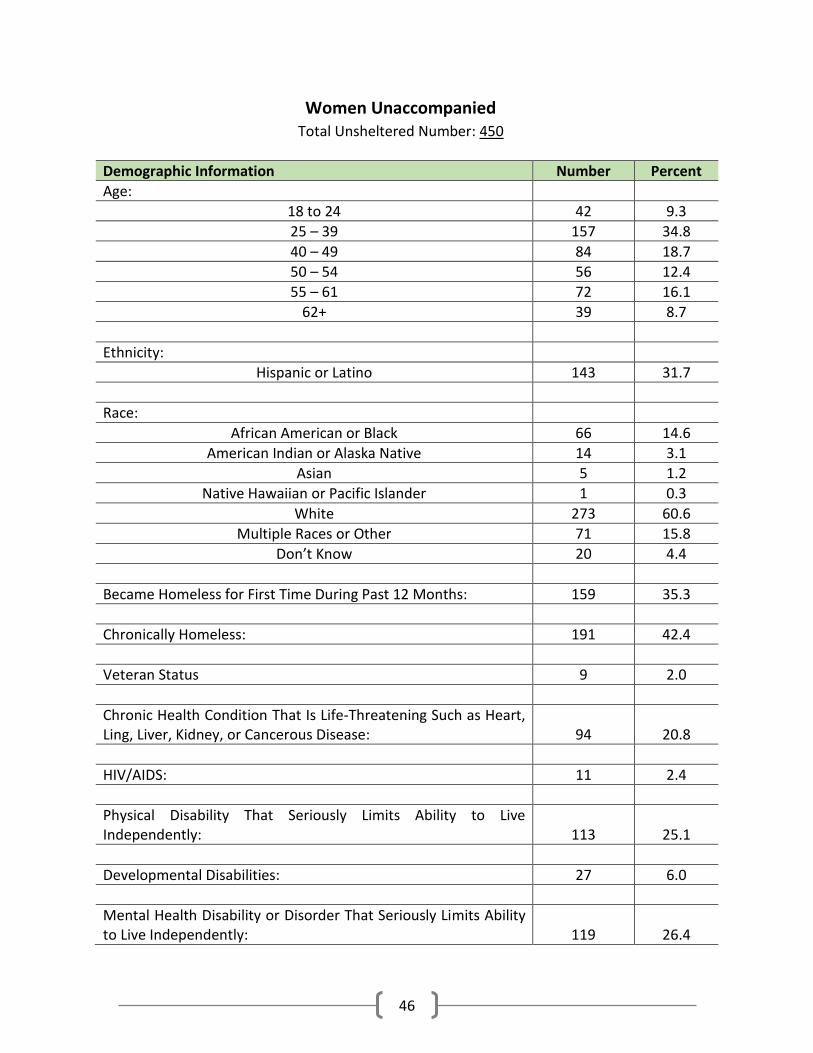
46
Women Unaccompanied Total Unsheltered Number: 450
Demographic Information Number Percent
Age:
18 to 24 42 9.3
25 – 39 157 34.8
40 – 49 84 18.7
50 – 54 56 12.4
55 – 61 72 16.1
62+ 39 8.7
Ethnicity:
Hispanic or Latino 143 31.7
Race:
African American or Black 66 14.6
American Indian or Alaska Native 14 3.1
Asian 5 1.2
Native Hawaiian or Pacific Islander 1 0.3
White 273 60.6
Multiple Races or Other 71 15.8
Don’t Know 20 4.4
Became Homeless for First Time During Past 12 Months: 159 35.3
Chronically Homeless: 191 42.4
Veteran Status 9 2.0
Chronic Health Condition That Is Life-Threatening Such as Heart, Ling, Liver, Kidney, or Cancerous Disease:
94 20.8
HIV/AIDS: 11 2.4
Physical Disability That Seriously Limits Ability to Live Independently:
113 25.1
Developmental Disabilities: 27 6.0
Mental Health Disability or Disorder That Seriously Limits Ability to Live Independently:
119 26.4
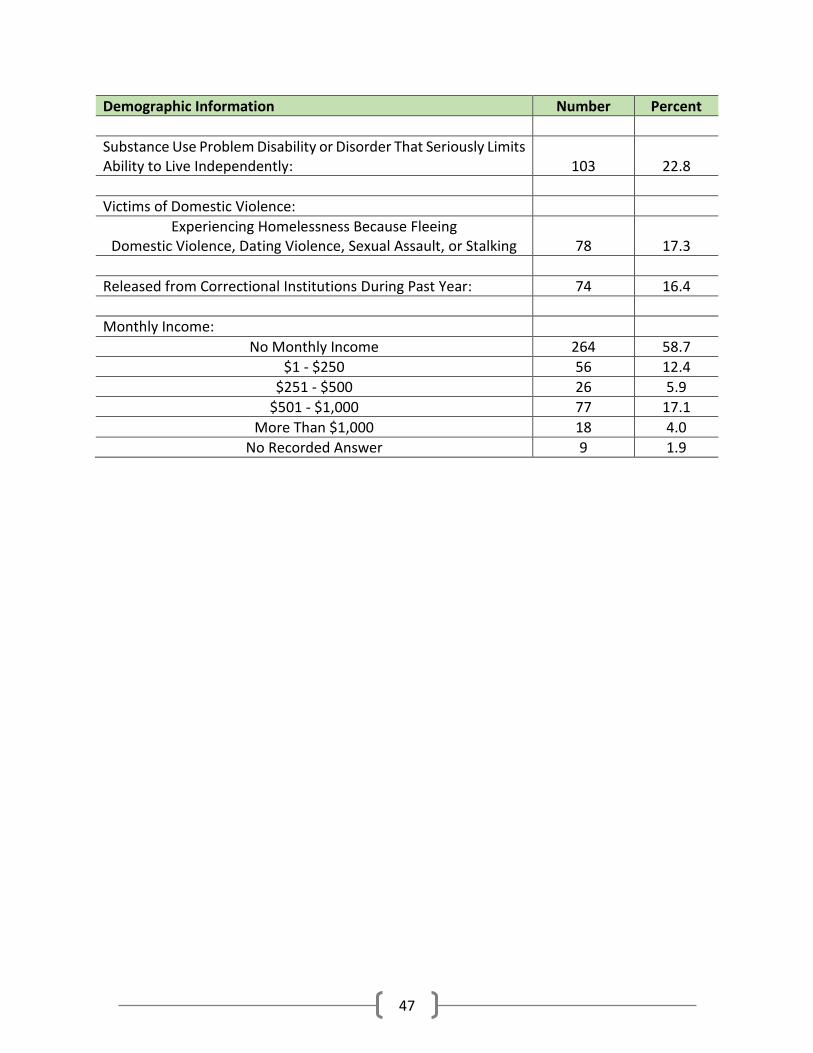
47
Demographic Information Number Percent
Substance Use Problem Disability or Disorder That Seriously Limits Ability to Live Independently:
103 22.8
Victims of Domestic Violence:
Experiencing Homelessness Because Fleeing Domestic Violence, Dating Violence, Sexual Assault, or Stalking
78 17.3
Released from Correctional Institutions During Past Year: 74 16.4
Monthly Income:
No Monthly Income 264 58.7
$1 - $250 56 12.4
$251 - $500 26 5.9
$501 - $1,000 77 17.1
More Than $1,000 18 4.0
No Recorded Answer 9 1.9
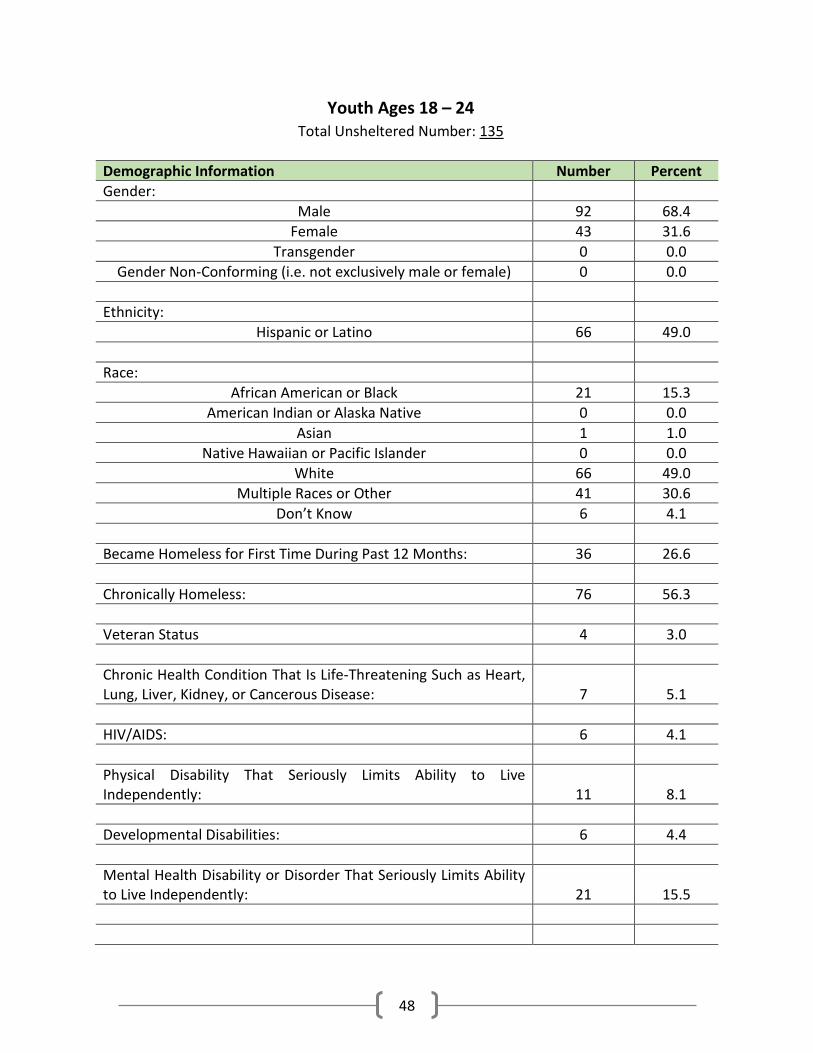
48
Youth Ages 18 – 24 Total Unsheltered Number: 135
Demographic Information Number Percent
Gender:
Male 92 68.4
Female 43 31.6
Transgender 0 0.0
Gender Non-Conforming (i.e. not exclusively male or female) 0 0.0
Ethnicity:
Hispanic or Latino 66 49.0
Race:
African American or Black 21 15.3
American Indian or Alaska Native 0 0.0
Asian 1 1.0
Native Hawaiian or Pacific Islander 0 0.0
White 66 49.0
Multiple Races or Other 41 30.6
Don’t Know 6 4.1
Became Homeless for First Time During Past 12 Months: 36 26.6
Chronically Homeless: 76 56.3
Veteran Status 4 3.0
Chronic Health Condition That Is Life-Threatening Such as Heart, Lung, Liver, Kidney, or Cancerous Disease:
7 5.1
HIV/AIDS: 6 4.1
Physical Disability That Seriously Limits Ability to Live Independently:
11 8.1
Developmental Disabilities: 6 4.4
Mental Health Disability or Disorder That Seriously Limits Ability to Live Independently:
21 15.5

49
Demographic Information Number Percent
Substance Use Problem Disability or Disorder That Seriously Limits Ability to Live Independently:
69 51.1
Victims of Domestic Violence:
Experiencing Homelessness Because Fleeing Domestic Violence, Dating Violence, Sexual Assault, or Stalking
11
8.1
Released from Correctional Institutions During Past Year: 32 23.7
Monthly Income:
No Monthly Income 89 66.3
$1 - $250 25 18.4
$251 - $500 14 10.2
$501 - $1,000 7 5.1
More Than $1,000 0 0.0
50
V. Connection to Cities
This section of the report is based upon the answers given by unsheltered adults to the following
three questions, which were included in the survey-based count:
• In what city did you first become homeless?
• In what city are you living now?
• How long have you been homeless in the city you are living in now?
While the intent of the survey-based count was to ask all unsheltered adults all survey questions,
not all of the adults were surveyed. Volunteers were told that safety comes first and that they
were to complete the observation portion of the survey as a result of the following:
• If you believe a person is homeless and the individual does not wish to speak to you;
• If you believe a person is homeless and you do not wish to disturb the person because
the person is sleeping;
• If you believe a person is homeless and if you feel it is unsafe for you to engage the person.
Thus, this section only includes the answers given by those who were surveyed, which includes
1,185 adults and five unaccompanied youth under age 18 of which four were age 17 and one was
age 16.
This section also stratifies the answers by City. The answers were based upon the unsheltered
persons counted in each city. So, for example, if 50 persons were counted as unsheltered in a
given city and 30 of them were surveyed, only the answers given by the 30 would be provided
for the given city.
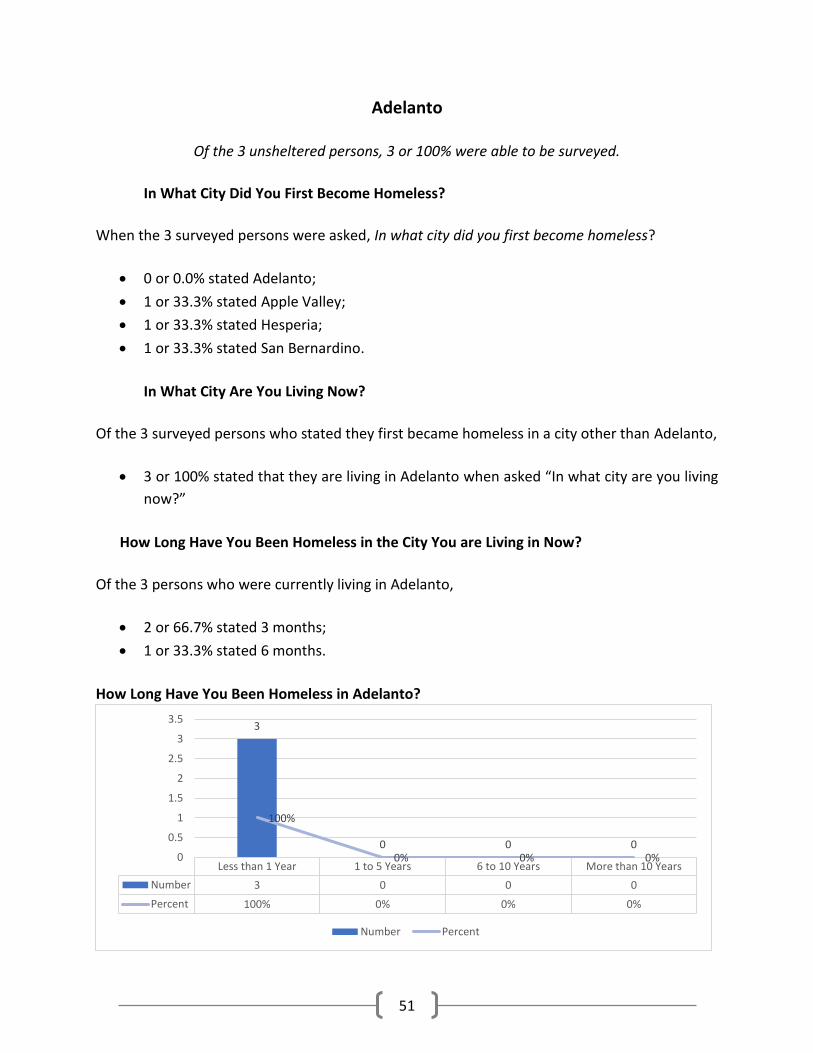
51
Adelanto
Of the 3 unsheltered persons, 3 or 100% were able to be surveyed.
In What City Did You First Become Homeless?
When the 3 surveyed persons were asked, In what city did you first become homeless?
• 0 or 0.0% stated Adelanto;
• 1 or 33.3% stated Apple Valley;
• 1 or 33.3% stated Hesperia;
• 1 or 33.3% stated San Bernardino.
In What City Are You Living Now?
Of the 3 surveyed persons who stated they first became homeless in a city other than Adelanto,
• 3 or 100% stated that they are living in Adelanto when asked “In what city are you living
now?”
How Long Have You Been Homeless in the City You are Living in Now?
Of the 3 persons who were currently living in Adelanto,
• 2 or 66.7% stated 3 months;
• 1 or 33.3% stated 6 months.
How Long Have You Been Homeless in Adelanto?
Less than 1 Year 1 to 5 Years 6 to 10 Years More than 10 Years
Number 3 0 0 0
Percent 100% 0% 0% 0%
3
0 0 0
100%
0% 0% 0%0
0.5
1
1.5
2
2.5
3
3.5
Number Percent
52
Apple Valley
Of the 20 unsheltered persons, 14 or 70% were able to be surveyed.
In What City Did You First Become Homeless?
When the 14 surveyed persons were asked, In what city did you first become homeless?
• 9 or 64.3% stated Apple Valley;
• 2 or 14.3% stated Victorville;
• 1 or 7.1% stated Hesperia;
• 1 or 7.1% stated Ontario.
There was not a response for 1 surveyed person.
In What City Are You Living Now?
Of the 9 surveyed persons who stated they first became homeless in Apple Valley,
• 9 or 100% answered Apple Valley when asked “In what city are you living now?”
Of the 4 surveyed persons who stated they first became homeless in a city other than Apple
Valley,
• 4 or 100% stated that they are living in Apple Valley when asked “In what city are you
living now?”
How Long Have You Been Homeless in the City You are Living in Now?
Of the 13 persons who were currently living in Apple Valley,
• 1 or 7.7% stated 2 months;
• 1 or 7.7% stated 3 months;
• 1 or 7.7% stated 6 months;
• 1 or 7.7% stated 9 months;
• 2 or 15.4% stated 1 year;
• 3 or 23.0% stated 2 years;
• 2 or 15.4% stated 3 years;
• 1 or 7.7% stated 4 years;
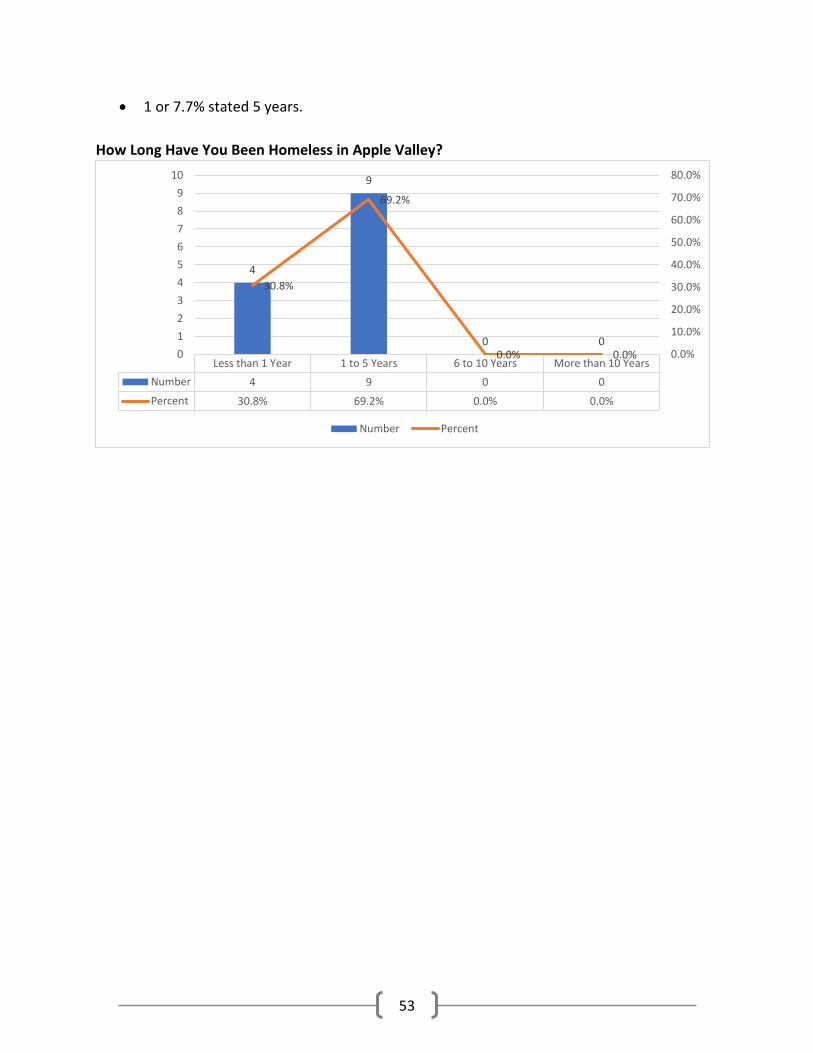
53
• 1 or 7.7% stated 5 years.
How Long Have You Been Homeless in Apple Valley?
Less than 1 Year 1 to 5 Years 6 to 10 Years More than 10 Years
Number 4 9 0 0
Percent 30.8% 69.2% 0.0% 0.0%
4
9
0 0
30.8%
69.2%
0.0% 0.0% 0.0%
10.0%
20.0%
30.0%
40.0%
50.0%
60.0%
70.0%
80.0%
0
1
2
3
4
5
6
7
8
9
10
Number Percent
54
Barstow
Of the 59 unsheltered persons, 23 or 40% were able to be surveyed.
In What City Did You First Become Homeless?
When the 23 surveyed persons were asked, In what city did you first become homeless?
• 10 or 43.5% stated Barstow;
• 6 or 26.1% stated outside of San Bernardino County;
• 1 or 4.3% stated Fontana.
There was not a response to this question for 6 surveyed persons.
In What City Are You Living Now?
Of the 10 surveyed persons who stated they first became homeless in Barstow,
• 10 or 100% answered Barstow when asked “In what city are you living now?”
Of the 7 surveyed persons who stated they first became homeless in a city other than Barstow,
• 7 or 100% stated that they are living in Barstow when asked “In what city are you living
now?”
Of the 6 surveyed persons for which there was no response to the question, In what city did you
first become homeless? one (1) did respond to the question “In what city are you living now?”
and
• 1 or 100% stated that they are living in Barstow when asked “In what city are you living
now?”
How Long Have You Been Homeless in the City You are Living in Now?
Of the 18 persons who were currently living in Barstow,
• 1 or 5.5% stated 2 weeks;
• 1 or 5.5% stated 3 weeks;
• 2 or 11.1% stated 2 months;
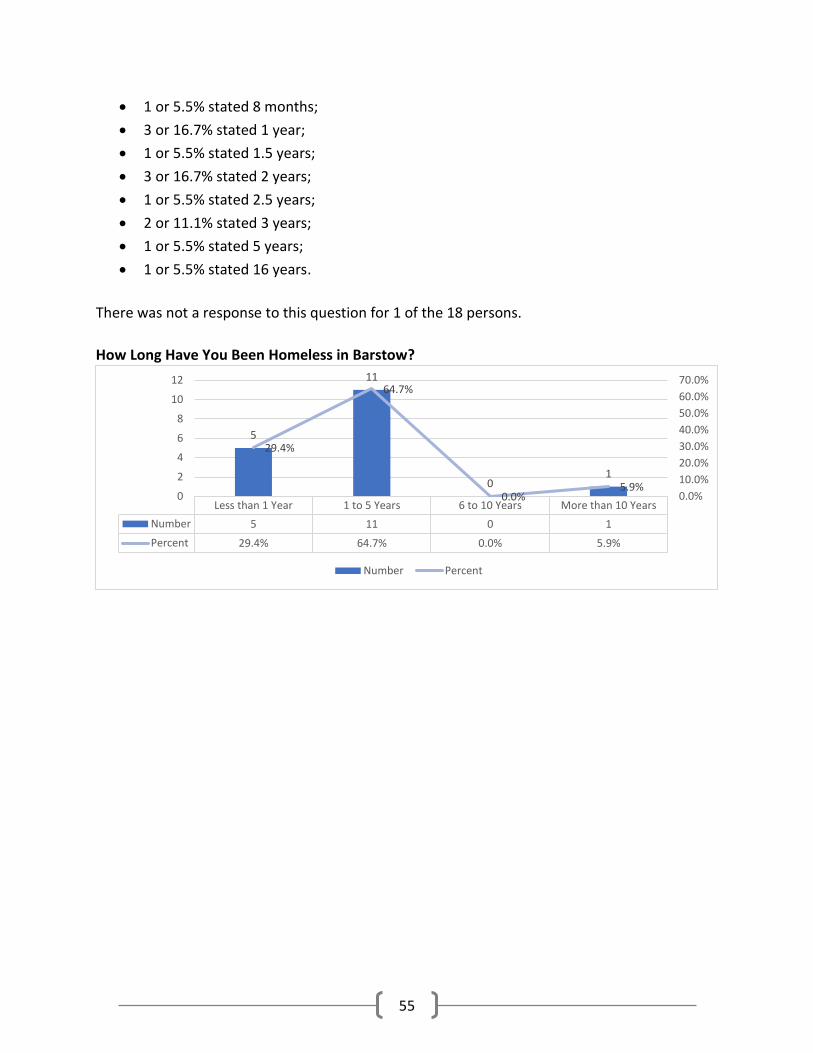
55
• 1 or 5.5% stated 8 months;
• 3 or 16.7% stated 1 year;
• 1 or 5.5% stated 1.5 years;
• 3 or 16.7% stated 2 years;
• 1 or 5.5% stated 2.5 years;
• 2 or 11.1% stated 3 years;
• 1 or 5.5% stated 5 years;
• 1 or 5.5% stated 16 years.
There was not a response to this question for 1 of the 18 persons.
How Long Have You Been Homeless in Barstow?
Less than 1 Year 1 to 5 Years 6 to 10 Years More than 10 Years
Number 5 11 0 1
Percent 29.4% 64.7% 0.0% 5.9%
5
11
01
29.4%
64.7%
0.0%5.9%
0.0%
10.0%
20.0%
30.0%
40.0%
50.0%
60.0%
70.0%
0
2
4
6
8
10
12
Number Percent
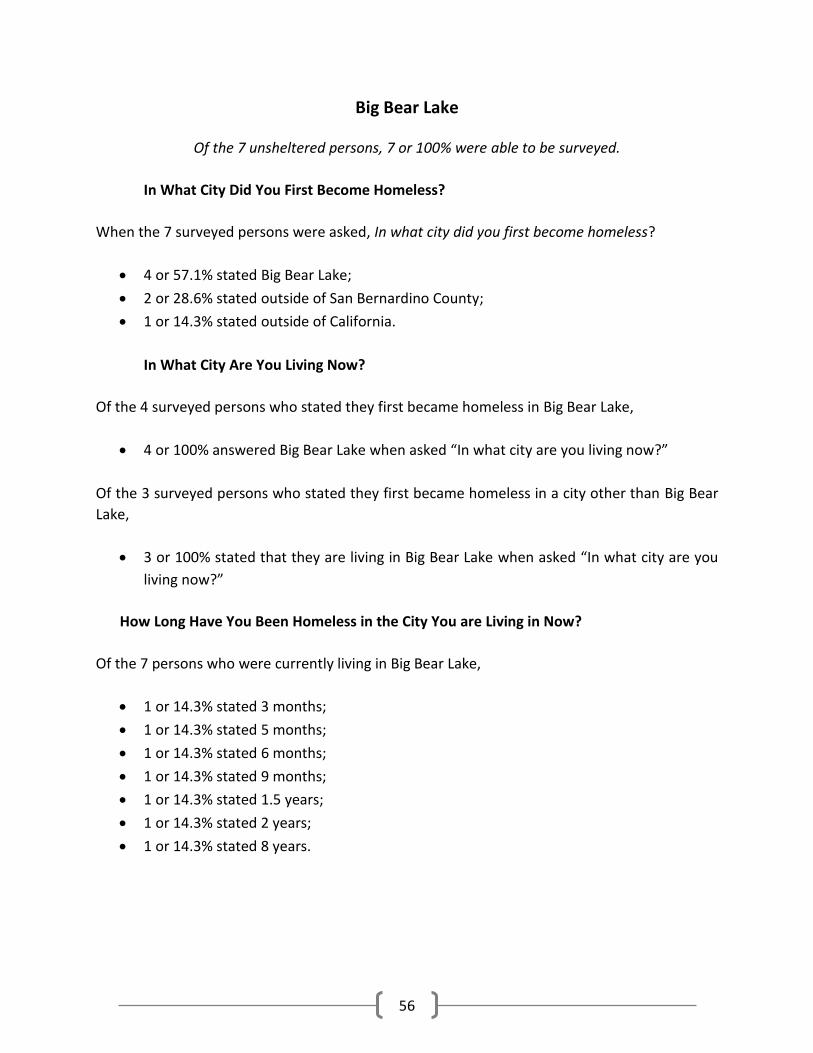
56
Big Bear Lake
Of the 7 unsheltered persons, 7 or 100% were able to be surveyed.
In What City Did You First Become Homeless?
When the 7 surveyed persons were asked, In what city did you first become homeless?
• 4 or 57.1% stated Big Bear Lake;
• 2 or 28.6% stated outside of San Bernardino County;
• 1 or 14.3% stated outside of California.
In What City Are You Living Now?
Of the 4 surveyed persons who stated they first became homeless in Big Bear Lake,
• 4 or 100% answered Big Bear Lake when asked “In what city are you living now?”
Of the 3 surveyed persons who stated they first became homeless in a city other than Big Bear
Lake,
• 3 or 100% stated that they are living in Big Bear Lake when asked “In what city are you
living now?”
How Long Have You Been Homeless in the City You are Living in Now?
Of the 7 persons who were currently living in Big Bear Lake,
• 1 or 14.3% stated 3 months;
• 1 or 14.3% stated 5 months;
• 1 or 14.3% stated 6 months;
• 1 or 14.3% stated 9 months;
• 1 or 14.3% stated 1.5 years;
• 1 or 14.3% stated 2 years;
• 1 or 14.3% stated 8 years.
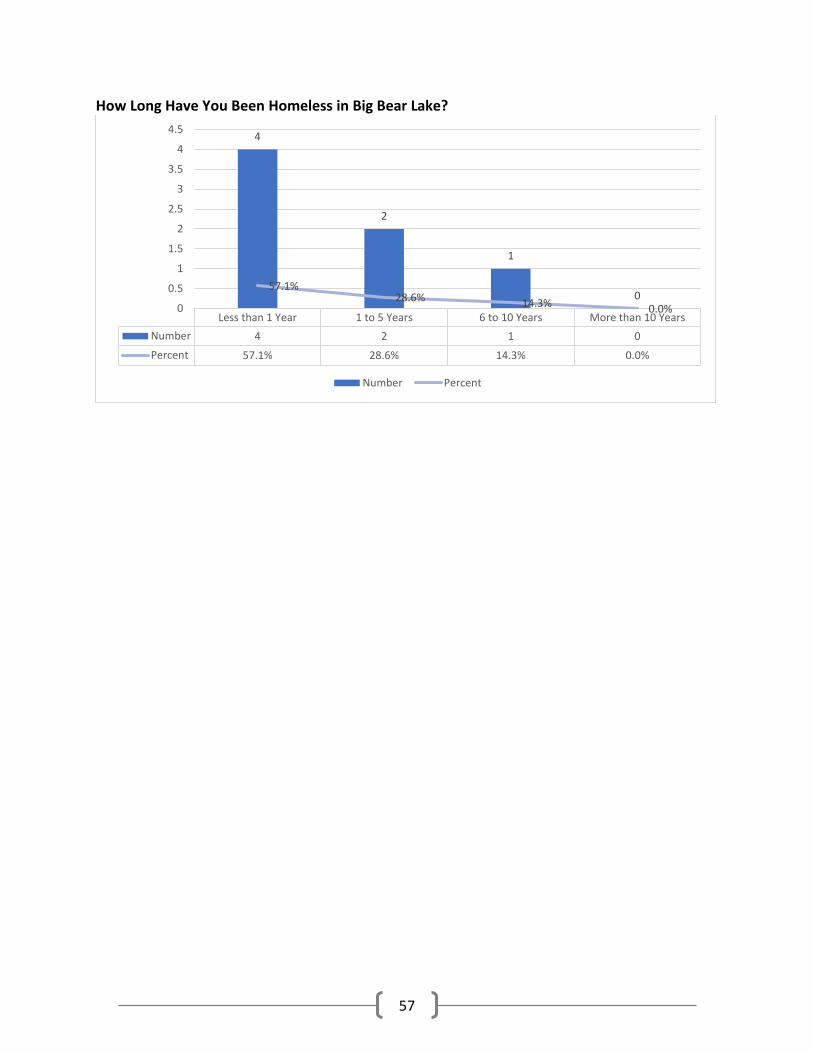
57
How Long Have You Been Homeless in Big Bear Lake?
Less than 1 Year 1 to 5 Years 6 to 10 Years More than 10 Years
Number 4 2 1 0
Percent 57.1% 28.6% 14.3% 0.0%
4
2
1
057.1%
28.6% 14.3% 0.0%0
0.5
1
1.5
2
2.5
3
3.5
4
4.5
Number Percent
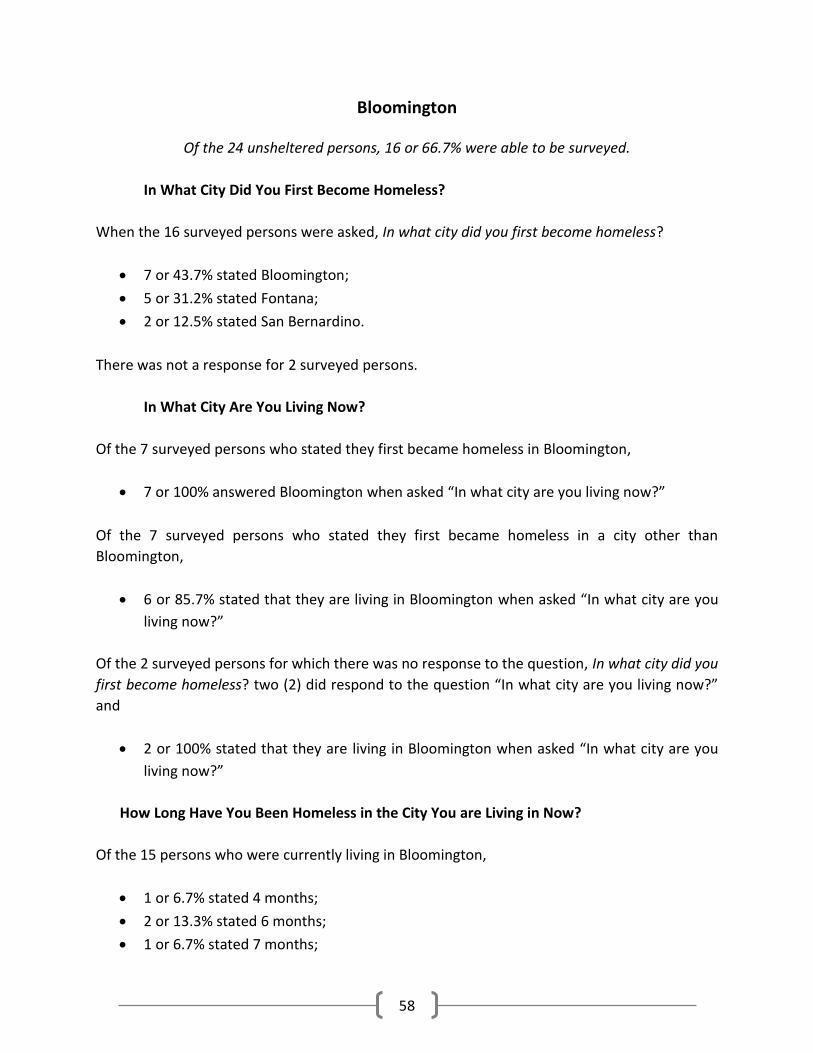
58
Bloomington
Of the 24 unsheltered persons, 16 or 66.7% were able to be surveyed.
In What City Did You First Become Homeless?
When the 16 surveyed persons were asked, In what city did you first become homeless?
• 7 or 43.7% stated Bloomington;
• 5 or 31.2% stated Fontana;
• 2 or 12.5% stated San Bernardino.
There was not a response for 2 surveyed persons.
In What City Are You Living Now?
Of the 7 surveyed persons who stated they first became homeless in Bloomington,
• 7 or 100% answered Bloomington when asked “In what city are you living now?”
Of the 7 surveyed persons who stated they first became homeless in a city other than
Bloomington,
• 6 or 85.7% stated that they are living in Bloomington when asked “In what city are you
living now?”
Of the 2 surveyed persons for which there was no response to the question, In what city did you
first become homeless? two (2) did respond to the question “In what city are you living now?”
and
• 2 or 100% stated that they are living in Bloomington when asked “In what city are you
living now?”
How Long Have You Been Homeless in the City You are Living in Now?
Of the 15 persons who were currently living in Bloomington,
• 1 or 6.7% stated 4 months;
• 2 or 13.3% stated 6 months;
• 1 or 6.7% stated 7 months;
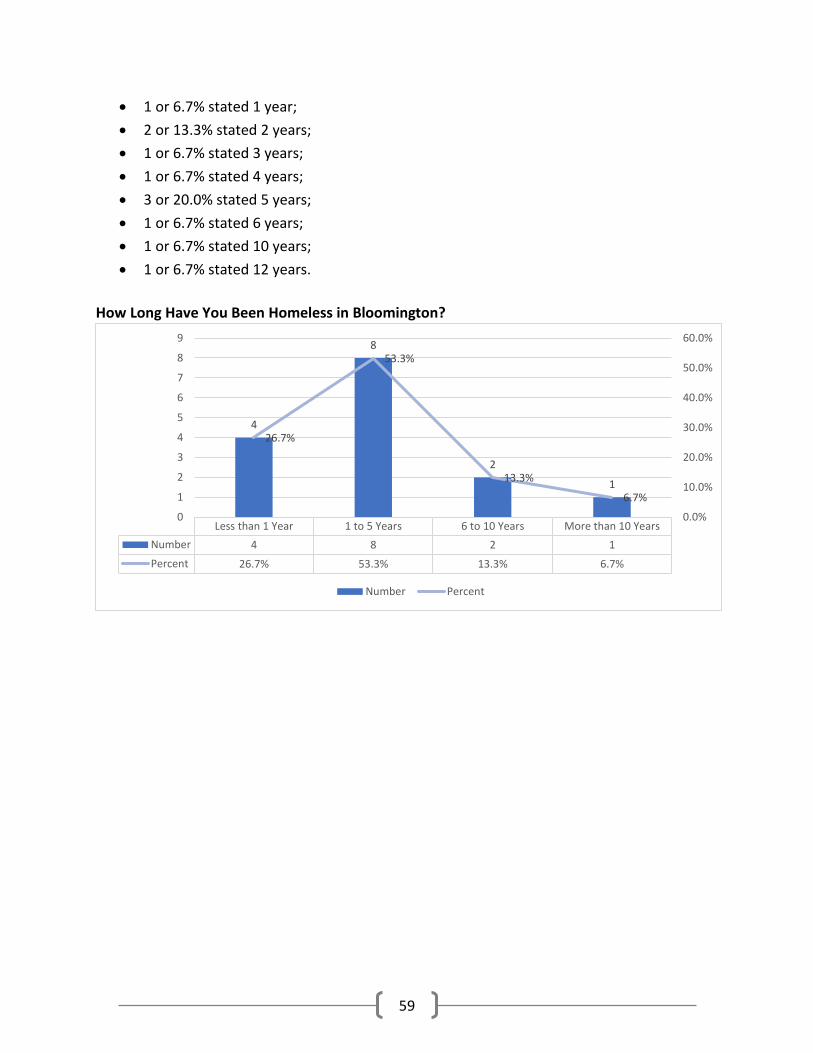
59
• 1 or 6.7% stated 1 year;
• 2 or 13.3% stated 2 years;
• 1 or 6.7% stated 3 years;
• 1 or 6.7% stated 4 years;
• 3 or 20.0% stated 5 years;
• 1 or 6.7% stated 6 years;
• 1 or 6.7% stated 10 years;
• 1 or 6.7% stated 12 years.
How Long Have You Been Homeless in Bloomington?
Less than 1 Year 1 to 5 Years 6 to 10 Years More than 10 Years
Number 4 8 2 1
Percent 26.7% 53.3% 13.3% 6.7%
4
8
2
1
26.7%
53.3%
13.3%
6.7%
0.0%
10.0%
20.0%
30.0%
40.0%
50.0%
60.0%
0
1
2
3
4
5
6
7
8
9
Number Percent
60
Chino
Of the 23 unsheltered persons, 19 or 82.6% were able to be surveyed.
In What City Did You First Become Homeless?
When the 19 surveyed persons were asked, In what city did you first become homeless?
• 15 or 78.9% stated Chino;
• 2 or 10.5% stated outside of San Bernardino County;
• 1 or 5.3% stated San Bernardino.
There was not a response for 1 surveyed person.
In What City Are You Living Now?
Of the 15 surveyed persons who stated they first became homeless in Chino,
• 15 or 100% answered Chino when asked “In what city are you living now?”
Of the 3 surveyed persons who stated they first became homeless in a city other than Chino,
• 3 or 100% stated that they are living in Chino when asked “In what city are you living
now?”
Of the 1 surveyed person for which there was no response to the question, In what city did you
first become homeless? the 1 person did respond to the question “In what city are you living
now?” and
• 1 or 100% stated that they are living in Chino when asked “In what city are you living
now?”
How Long Have You Been Homeless in the City You are Living in Now?
Of the 19 persons who were currently living in Chino,
• 1 or 5.3% stated 1 month;
• 1 or 5.3% stated 2 months;
• 1 or 5.3% stated 7 months;
• 1 or 5.3% stated 8 months;
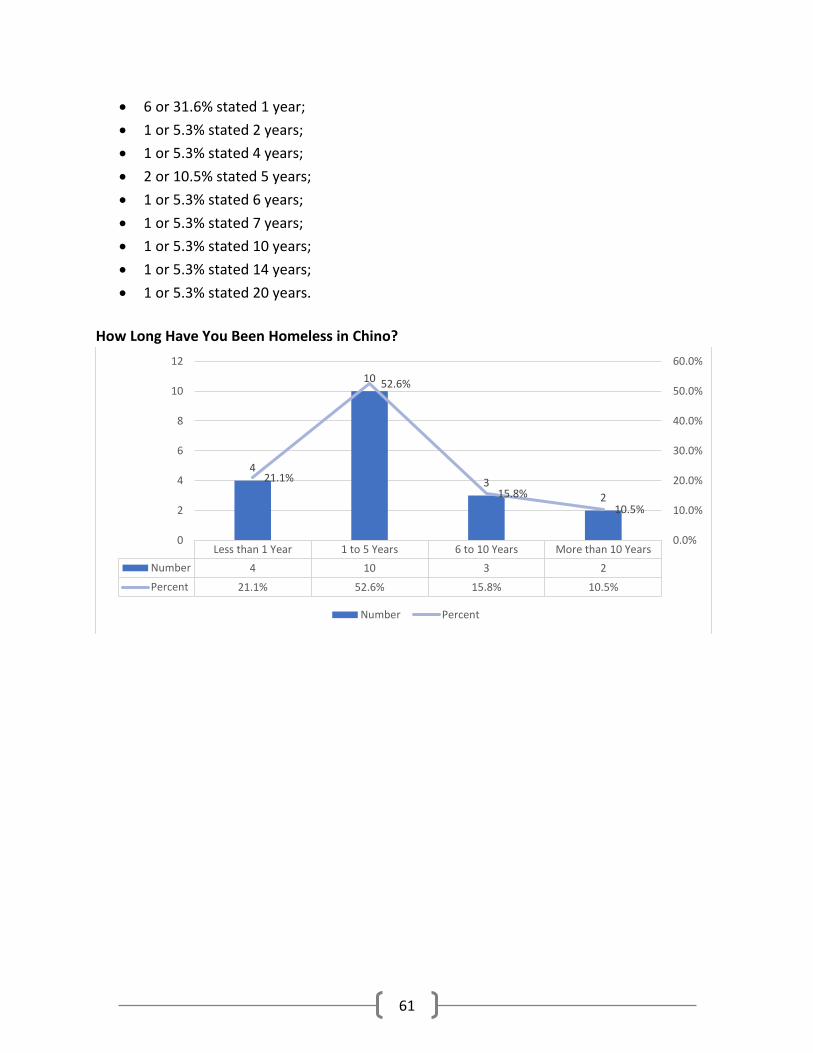
61
• 6 or 31.6% stated 1 year;
• 1 or 5.3% stated 2 years;
• 1 or 5.3% stated 4 years;
• 2 or 10.5% stated 5 years;
• 1 or 5.3% stated 6 years;
• 1 or 5.3% stated 7 years;
• 1 or 5.3% stated 10 years;
• 1 or 5.3% stated 14 years;
• 1 or 5.3% stated 20 years.
How Long Have You Been Homeless in Chino?
Less than 1 Year 1 to 5 Years 6 to 10 Years More than 10 Years
Number 4 10 3 2
Percent 21.1% 52.6% 15.8% 10.5%
4
10
32
21.1%
52.6%
15.8%
10.5%
0.0%
10.0%
20.0%
30.0%
40.0%
50.0%
60.0%
0
2
4
6
8
10
12
Number Percent
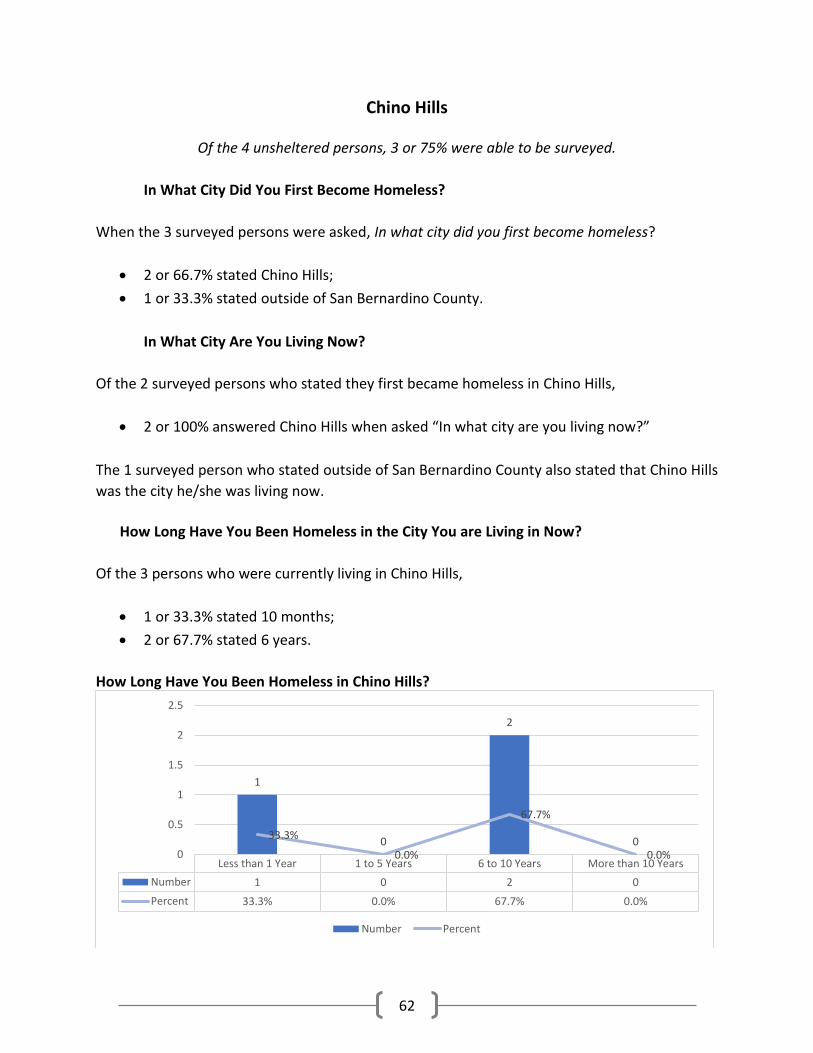
62
Chino Hills
Of the 4 unsheltered persons, 3 or 75% were able to be surveyed.
In What City Did You First Become Homeless?
When the 3 surveyed persons were asked, In what city did you first become homeless?
• 2 or 66.7% stated Chino Hills;
• 1 or 33.3% stated outside of San Bernardino County.
In What City Are You Living Now?
Of the 2 surveyed persons who stated they first became homeless in Chino Hills,
• 2 or 100% answered Chino Hills when asked “In what city are you living now?”
The 1 surveyed person who stated outside of San Bernardino County also stated that Chino Hills
was the city he/she was living now.
How Long Have You Been Homeless in the City You are Living in Now?
Of the 3 persons who were currently living in Chino Hills,
• 1 or 33.3% stated 10 months;
• 2 or 67.7% stated 6 years.
How Long Have You Been Homeless in Chino Hills?
Less than 1 Year 1 to 5 Years 6 to 10 Years More than 10 Years
Number 1 0 2 0
Percent 33.3% 0.0% 67.7% 0.0%
1
0
2
033.3%
0.0%
67.7%
0.0%0
0.5
1
1.5
2
2.5
Number Percent
63
Colton
Of the 55 unsheltered persons, 51 or 92.7% were able to be surveyed.
In What City Did You First Become Homeless?
When the 51 surveyed persons were asked, In what city did you first become homeless?,
• 21 or 41.2% stated Colton;
• 4 or 7.8% stated San Bernardino;
• 3 or 5.9% stated Rialto;
• 2 or 3.9% stated outside of San Bernardino County;
• 1 or 2.0% stated Bloomington;
• 1 or 2.0% stated Crestline;
• 1 or 2.0% stated Highland;
• 1 or 2.0% stated Ontario;
• 1 or 2.0% stated Outside of California;
• 1 or 2.0% stated Redlands;
• 1 or 2.0% stated Victorville.
There was not a response for 14 surveyed persons.
In What City Are You Living Now?
Of the 21 surveyed persons who stated they first became homeless in Colton,
• 20 or 95.2% answered Colton when asked “In what city are you living now?”
Of the 16 surveyed persons who stated they first became homeless in a city other than Colton,
• 8 or 50% stated that they are living in Colton when asked “In what city are you living
now?”
Of the 14 surveyed persons for which there was no response to the question, In what city did you
first become homeless? eight (8) did respond to the question “In what city are you living now?”
and
• 8 or 100% stated that they are living in Colton when asked “In what city are you living
now?”
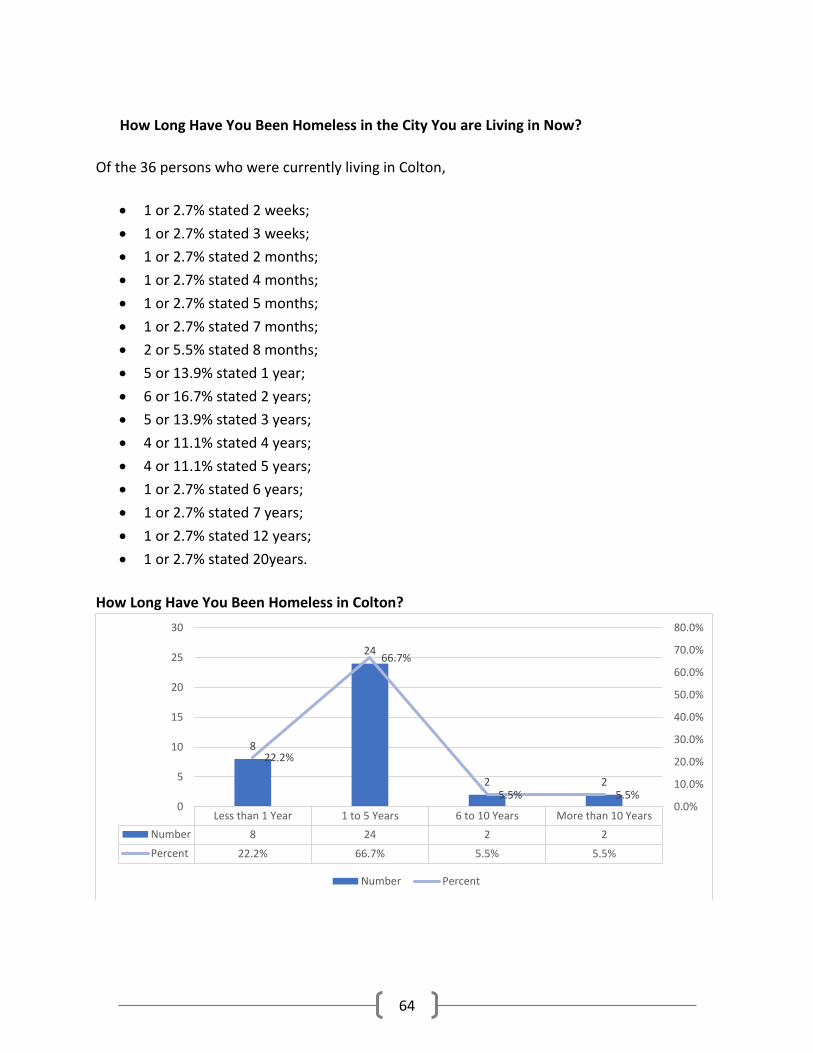
64
How Long Have You Been Homeless in the City You are Living in Now?
Of the 36 persons who were currently living in Colton,
• 1 or 2.7% stated 2 weeks;
• 1 or 2.7% stated 3 weeks;
• 1 or 2.7% stated 2 months;
• 1 or 2.7% stated 4 months;
• 1 or 2.7% stated 5 months;
• 1 or 2.7% stated 7 months;
• 2 or 5.5% stated 8 months;
• 5 or 13.9% stated 1 year;
• 6 or 16.7% stated 2 years;
• 5 or 13.9% stated 3 years;
• 4 or 11.1% stated 4 years;
• 4 or 11.1% stated 5 years;
• 1 or 2.7% stated 6 years;
• 1 or 2.7% stated 7 years;
• 1 or 2.7% stated 12 years;
• 1 or 2.7% stated 20years.
How Long Have You Been Homeless in Colton?
Less than 1 Year 1 to 5 Years 6 to 10 Years More than 10 Years
Number 8 24 2 2
Percent 22.2% 66.7% 5.5% 5.5%
8
24
2 2
22.2%
66.7%
5.5% 5.5%0.0%
10.0%
20.0%
30.0%
40.0%
50.0%
60.0%
70.0%
80.0%
0
5
10
15
20
25
30
Number Percent
65
Fontana
Of the 94 unsheltered persons, 58 or 61.7% were able to be surveyed.
In What City Did You First Become Homeless?
When the 58 surveyed persons were asked, In what city did you first become homeless?
• 29 or 50.0% stated Fontana;
• 7 or 12.1% stated San Bernardino;
• 5 or 8.6% stated outside of San Bernardino County;
• 3 or 5.2% stated Rialto;
• 2 or 3.4% stated Rancho Cucamonga;
• 1 or 1.7% stated Bloomington;
• 1 or 1.7% stated Colton;
• 1 or 1.7% stated Hesperia;
• 1 or 1.7% stated Montclair;
• 1 or 1.7% stated Ontario;
• 1 or 1.7% stated outside of California;
• 1 or 1.7% stated outside of the United States;
There was not a response for 5 surveyed persons.
In What City Are You Living Now?
Of the 29 surveyed persons who stated they first became homeless in Fontana,
• 29 or 100% answered Fontana when asked “In what city are you living now?”
Of the 24 surveyed persons who stated they first became homeless in a city other than Fontana,
• 19 or 72.2% stated that they are living in Fontana when asked “In what city are you living
now?”
Of the 5 surveyed persons for which there was no response to the question, In what city did you
first become homeless? four (4) did respond to the question “In what city are you living now?”
and
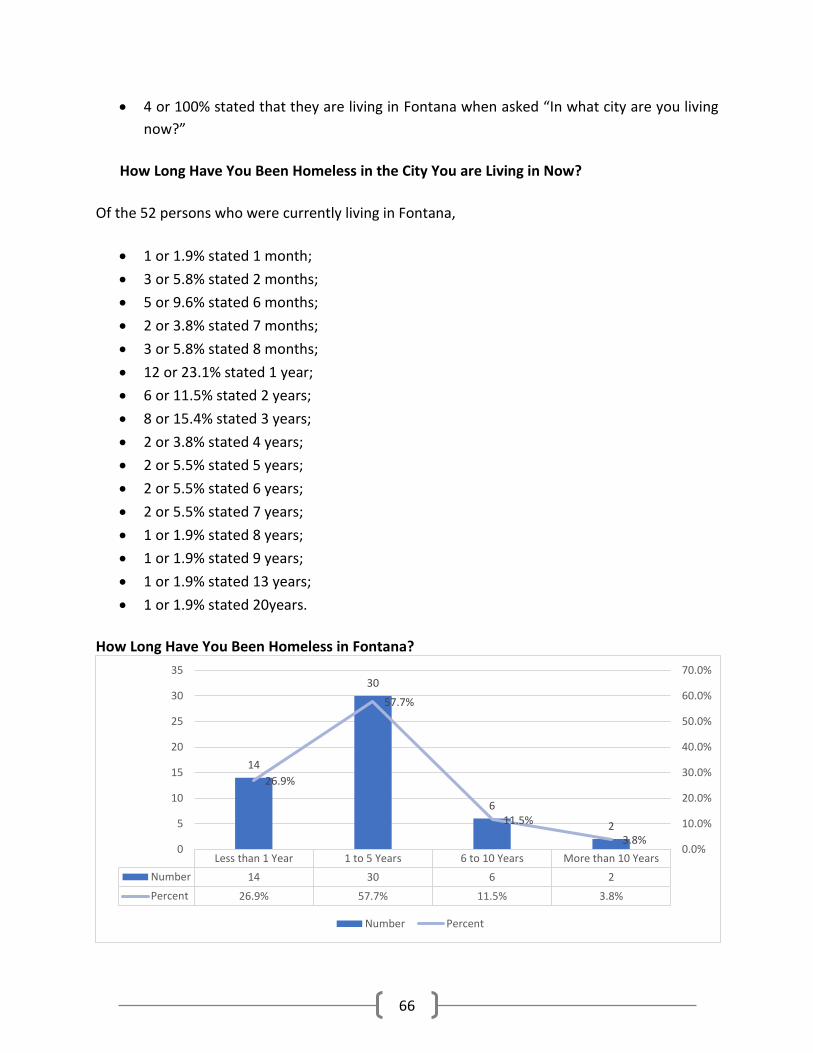
66
• 4 or 100% stated that they are living in Fontana when asked “In what city are you living
now?”
How Long Have You Been Homeless in the City You are Living in Now?
Of the 52 persons who were currently living in Fontana,
• 1 or 1.9% stated 1 month;
• 3 or 5.8% stated 2 months;
• 5 or 9.6% stated 6 months;
• 2 or 3.8% stated 7 months;
• 3 or 5.8% stated 8 months;
• 12 or 23.1% stated 1 year;
• 6 or 11.5% stated 2 years;
• 8 or 15.4% stated 3 years;
• 2 or 3.8% stated 4 years;
• 2 or 5.5% stated 5 years;
• 2 or 5.5% stated 6 years;
• 2 or 5.5% stated 7 years;
• 1 or 1.9% stated 8 years;
• 1 or 1.9% stated 9 years;
• 1 or 1.9% stated 13 years;
• 1 or 1.9% stated 20years.
How Long Have You Been Homeless in Fontana?
Less than 1 Year 1 to 5 Years 6 to 10 Years More than 10 Years
Number 14 30 6 2
Percent 26.9% 57.7% 11.5% 3.8%
14
30
6
2
26.9%
57.7%
11.5%
3.8%0.0%
10.0%
20.0%
30.0%
40.0%
50.0%
60.0%
70.0%
0
5
10
15
20
25
30
35
Number Percent
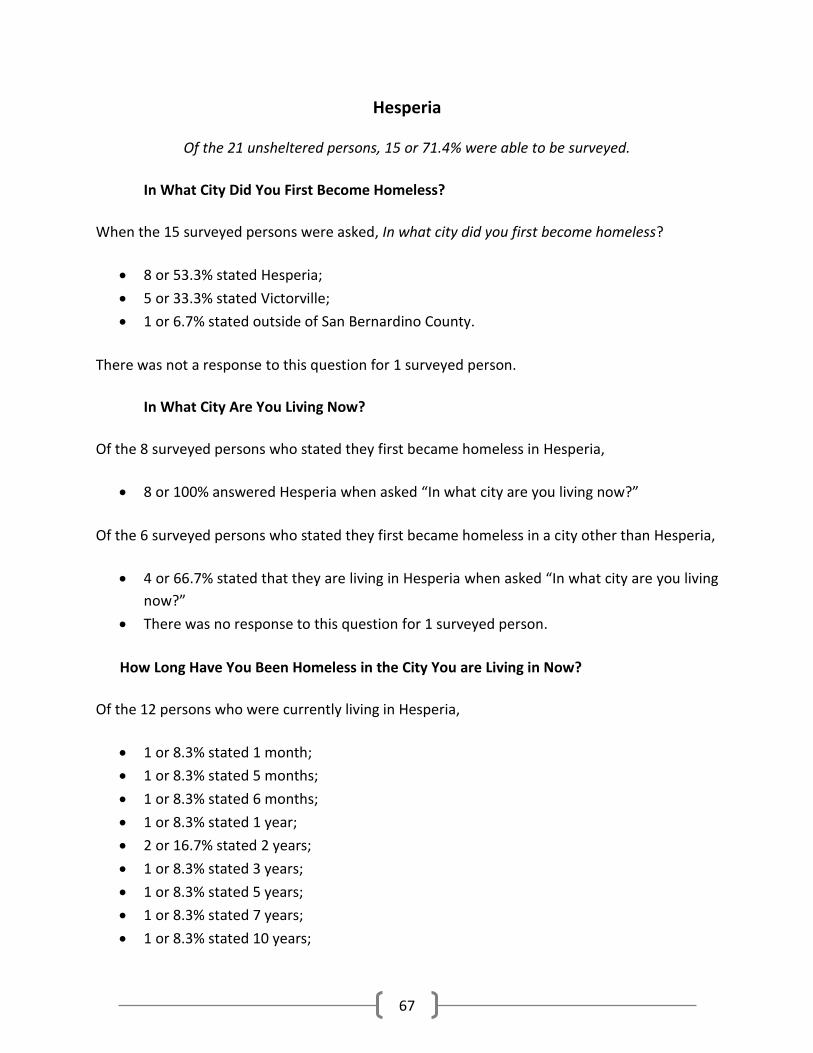
67
Hesperia
Of the 21 unsheltered persons, 15 or 71.4% were able to be surveyed.
In What City Did You First Become Homeless?
When the 15 surveyed persons were asked, In what city did you first become homeless?
• 8 or 53.3% stated Hesperia;
• 5 or 33.3% stated Victorville;
• 1 or 6.7% stated outside of San Bernardino County.
There was not a response to this question for 1 surveyed person.
In What City Are You Living Now?
Of the 8 surveyed persons who stated they first became homeless in Hesperia,
• 8 or 100% answered Hesperia when asked “In what city are you living now?”
Of the 6 surveyed persons who stated they first became homeless in a city other than Hesperia,
• 4 or 66.7% stated that they are living in Hesperia when asked “In what city are you living
now?”
• There was no response to this question for 1 surveyed person.
How Long Have You Been Homeless in the City You are Living in Now?
Of the 12 persons who were currently living in Hesperia,
• 1 or 8.3% stated 1 month;
• 1 or 8.3% stated 5 months;
• 1 or 8.3% stated 6 months;
• 1 or 8.3% stated 1 year;
• 2 or 16.7% stated 2 years;
• 1 or 8.3% stated 3 years;
• 1 or 8.3% stated 5 years;
• 1 or 8.3% stated 7 years;
• 1 or 8.3% stated 10 years;
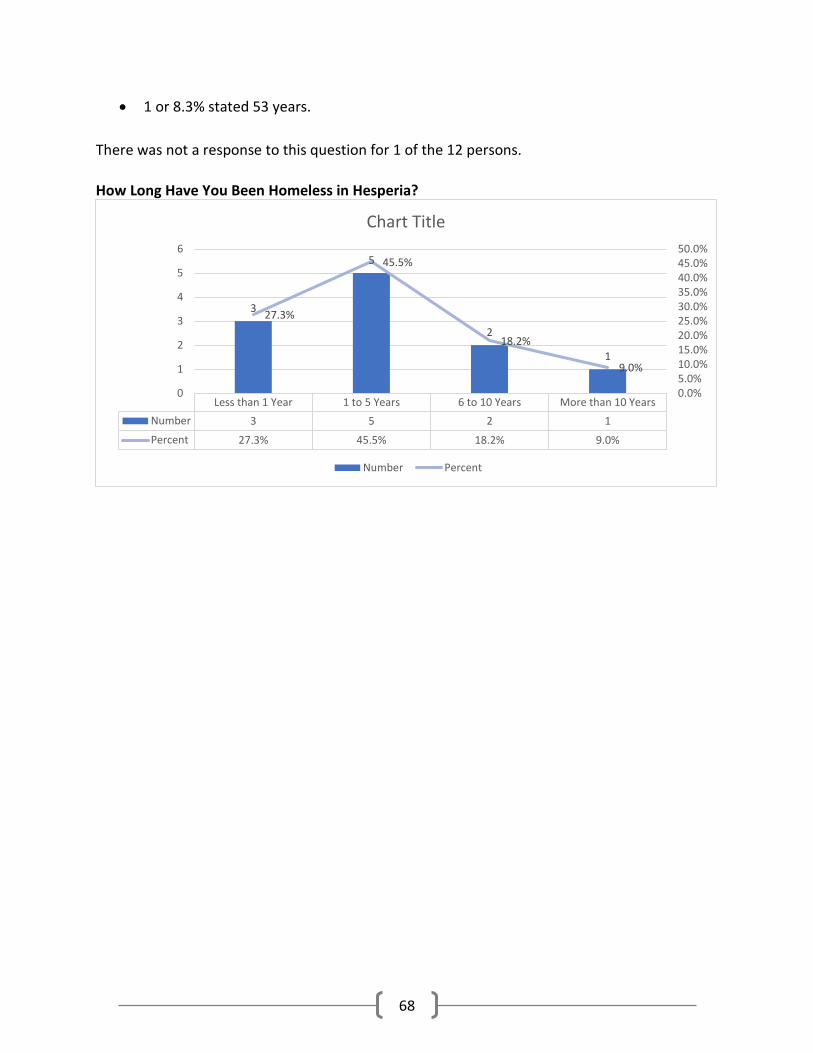
68
• 1 or 8.3% stated 53 years.
There was not a response to this question for 1 of the 12 persons.
How Long Have You Been Homeless in Hesperia?
Less than 1 Year 1 to 5 Years 6 to 10 Years More than 10 Years
Number 3 5 2 1
Percent 27.3% 45.5% 18.2% 9.0%
3
5
2
1
27.3%
45.5%
18.2%
9.0%
0.0%5.0%10.0%15.0%20.0%25.0%30.0%35.0%40.0%45.0%50.0%
0
1
2
3
4
5
6
Chart Title
Number Percent
69
Highland
Of the 72 unsheltered persons, 42 or 58.3% were able to be surveyed.
In What City Did You First Become Homeless?
When the 42 surveyed persons were asked, In what city did you first become homeless?
• 14 or 33.3% stated Highland;
• 21 or 50.0% stated San Bernardino;
• 1 or 2.3% stated Apple Valley;
• 1 or 2.3% stated Ontario;
• 1 or 2.3% stated Outside of San Bernardino County;
• 1 or 2.3% stated Outside of California.
There was not a response to this question for 3 surveyed persons.
In What City Are You Living Now?
Of the 14 surveyed persons who stated they first became homeless in Highland,
• 13 or 92.8% answered Highland when asked “In what city are you living now?”
Of the 21 surveyed persons who stated they first became homeless in San Bernardino,
• 16 or 76.2% answered Highland when asked “In what city are you living now?”
Of the 4 surveyed persons who stated they first became homeless in a city other than Highland
and San Bernardino,
• 4 or 100% stated that they are living in Highland when asked “In what city are you living
now?”
Of the 3 surveyed persons for which there was no response to the question, In what city did you
first become homeless? two (2) did respond to the question “In what city are you living now?”
and
• 2 or 66.7% stated that they are living in Highland when asked “In what city are you living
now?”
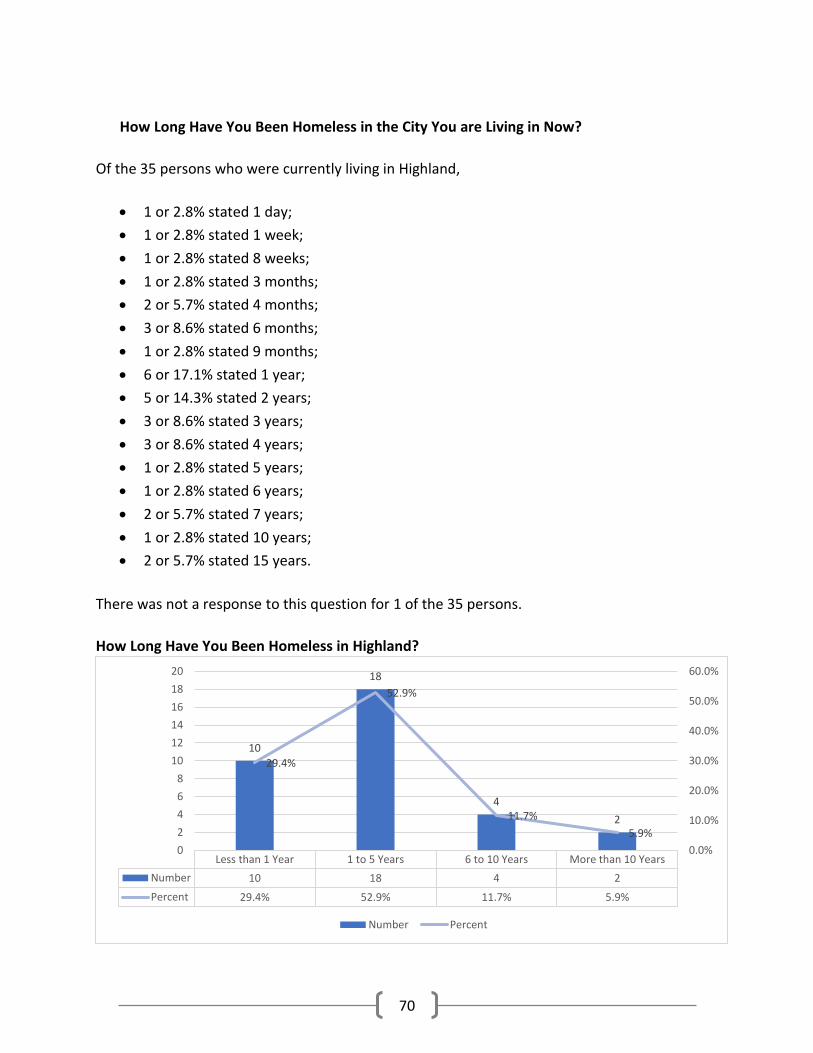
70
How Long Have You Been Homeless in the City You are Living in Now?
Of the 35 persons who were currently living in Highland,
• 1 or 2.8% stated 1 day;
• 1 or 2.8% stated 1 week;
• 1 or 2.8% stated 8 weeks;
• 1 or 2.8% stated 3 months;
• 2 or 5.7% stated 4 months;
• 3 or 8.6% stated 6 months;
• 1 or 2.8% stated 9 months;
• 6 or 17.1% stated 1 year;
• 5 or 14.3% stated 2 years;
• 3 or 8.6% stated 3 years;
• 3 or 8.6% stated 4 years;
• 1 or 2.8% stated 5 years;
• 1 or 2.8% stated 6 years;
• 2 or 5.7% stated 7 years;
• 1 or 2.8% stated 10 years;
• 2 or 5.7% stated 15 years.
There was not a response to this question for 1 of the 35 persons.
How Long Have You Been Homeless in Highland?
Less than 1 Year 1 to 5 Years 6 to 10 Years More than 10 Years
Number 10 18 4 2
Percent 29.4% 52.9% 11.7% 5.9%
10
18
4
2
29.4%
52.9%
11.7%
5.9%
0.0%
10.0%
20.0%
30.0%
40.0%
50.0%
60.0%
0
2
4
6
8
10
12
14
16
18
20
Number Percent
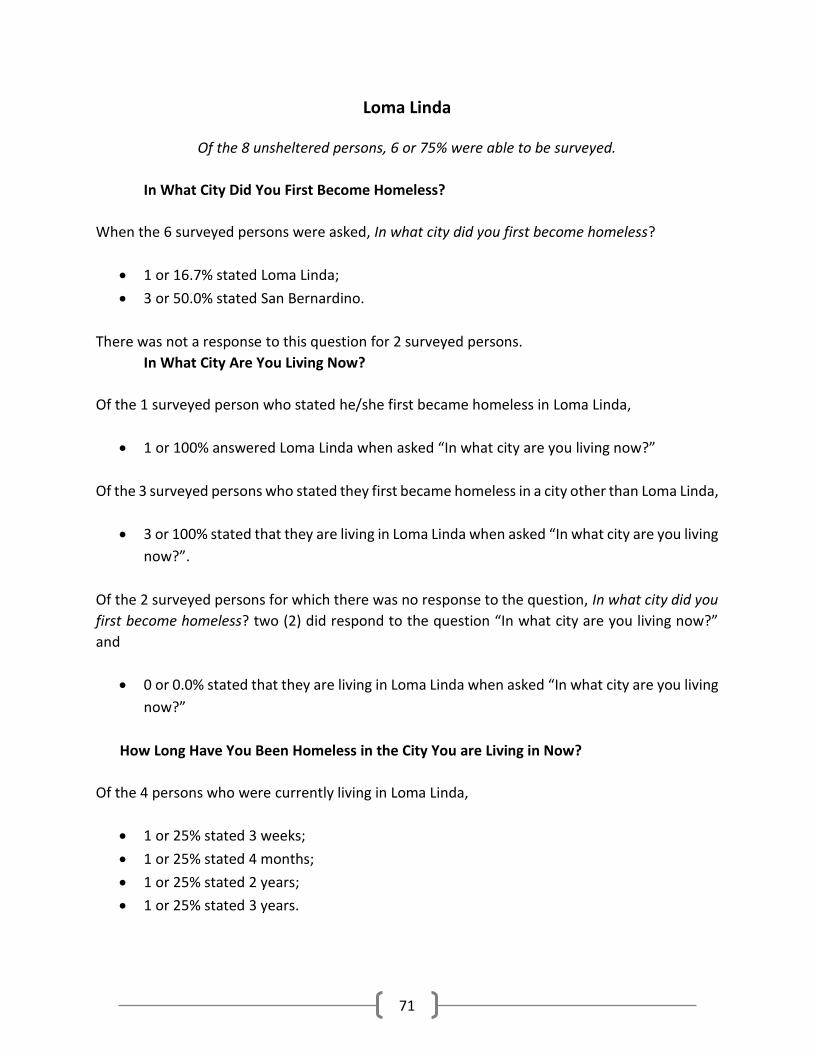
71
Loma Linda
Of the 8 unsheltered persons, 6 or 75% were able to be surveyed.
In What City Did You First Become Homeless?
When the 6 surveyed persons were asked, In what city did you first become homeless?
• 1 or 16.7% stated Loma Linda;
• 3 or 50.0% stated San Bernardino.
There was not a response to this question for 2 surveyed persons.
In What City Are You Living Now?
Of the 1 surveyed person who stated he/she first became homeless in Loma Linda,
• 1 or 100% answered Loma Linda when asked “In what city are you living now?”
Of the 3 surveyed persons who stated they first became homeless in a city other than Loma Linda,
• 3 or 100% stated that they are living in Loma Linda when asked “In what city are you living
now?”.
Of the 2 surveyed persons for which there was no response to the question, In what city did you
first become homeless? two (2) did respond to the question “In what city are you living now?”
and
• 0 or 0.0% stated that they are living in Loma Linda when asked “In what city are you living
now?”
How Long Have You Been Homeless in the City You are Living in Now?
Of the 4 persons who were currently living in Loma Linda,
• 1 or 25% stated 3 weeks;
• 1 or 25% stated 4 months;
• 1 or 25% stated 2 years;
• 1 or 25% stated 3 years.
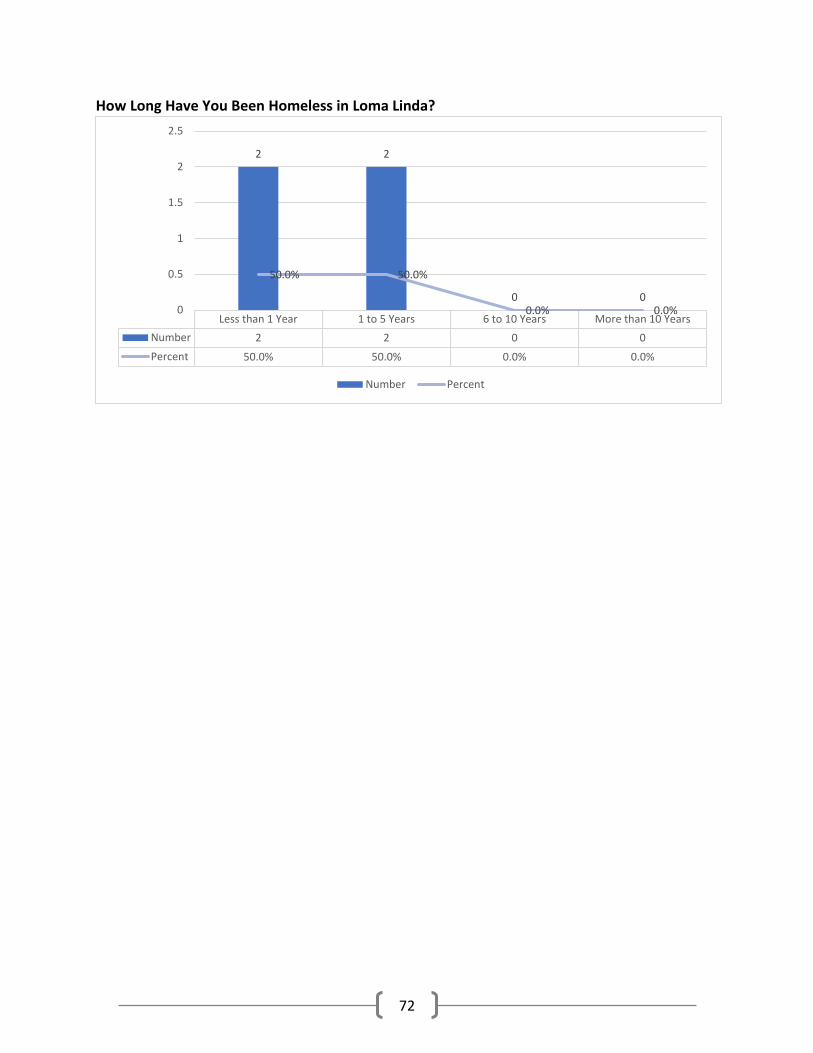
72
How Long Have You Been Homeless in Loma Linda?
Less than 1 Year 1 to 5 Years 6 to 10 Years More than 10 Years
Number 2 2 0 0
Percent 50.0% 50.0% 0.0% 0.0%
2 2
0 0
50.0% 50.0%
0.0% 0.0%0
0.5
1
1.5
2
2.5
Number Percent
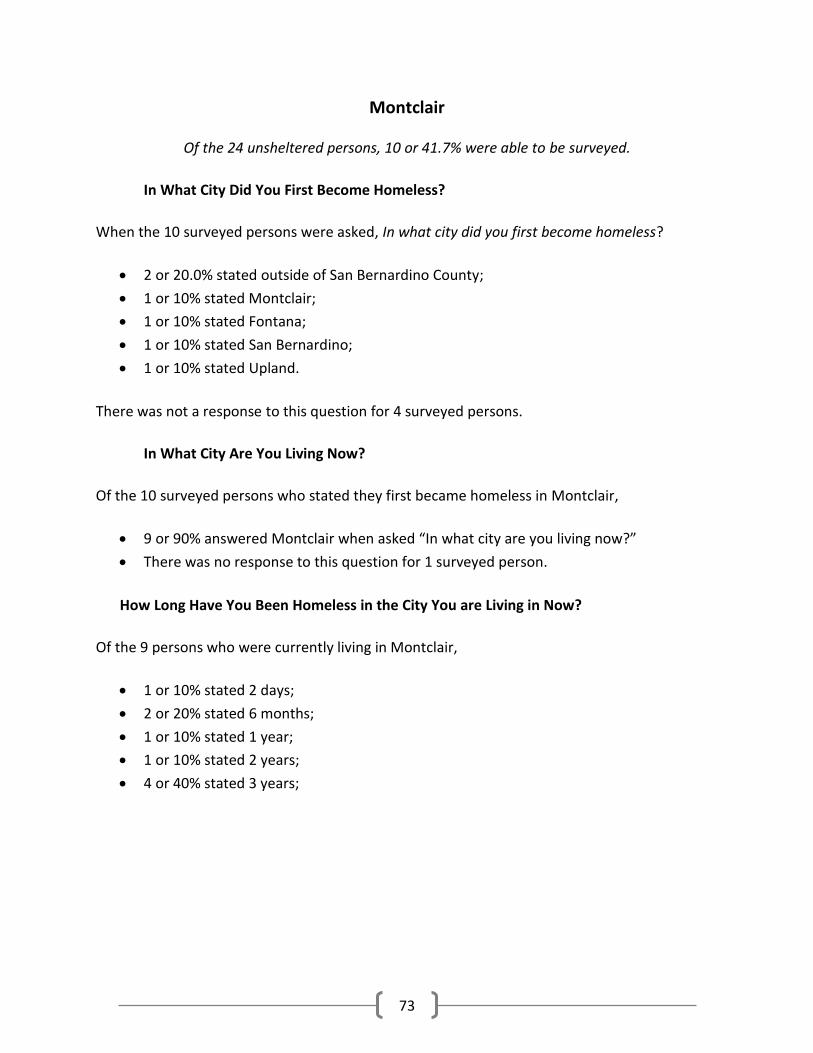
73
Montclair
Of the 24 unsheltered persons, 10 or 41.7% were able to be surveyed.
In What City Did You First Become Homeless?
When the 10 surveyed persons were asked, In what city did you first become homeless?
• 2 or 20.0% stated outside of San Bernardino County;
• 1 or 10% stated Montclair;
• 1 or 10% stated Fontana;
• 1 or 10% stated San Bernardino;
• 1 or 10% stated Upland.
There was not a response to this question for 4 surveyed persons.
In What City Are You Living Now?
Of the 10 surveyed persons who stated they first became homeless in Montclair,
• 9 or 90% answered Montclair when asked “In what city are you living now?”
• There was no response to this question for 1 surveyed person.
How Long Have You Been Homeless in the City You are Living in Now?
Of the 9 persons who were currently living in Montclair,
• 1 or 10% stated 2 days;
• 2 or 20% stated 6 months;
• 1 or 10% stated 1 year;
• 1 or 10% stated 2 years;
• 4 or 40% stated 3 years;
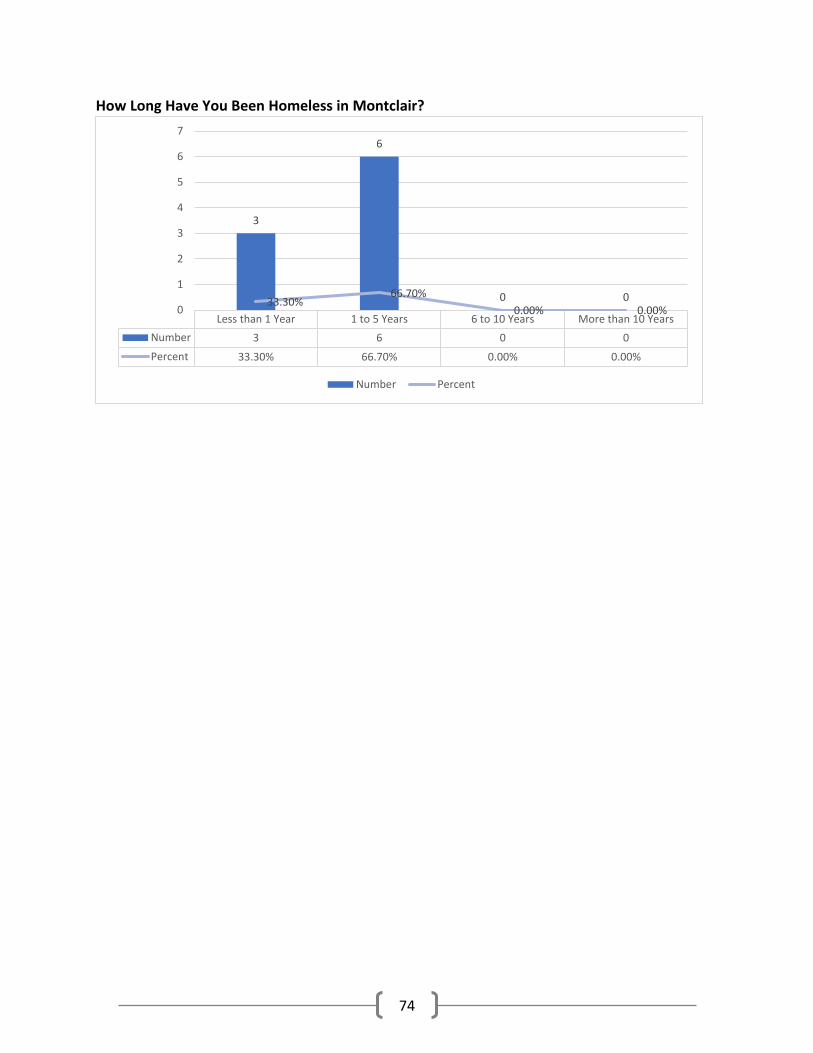
74
How Long Have You Been Homeless in Montclair?
Less than 1 Year 1 to 5 Years 6 to 10 Years More than 10 Years
Number 3 6 0 0
Percent 33.30% 66.70% 0.00% 0.00%
3
6
0 033.30%66.70%
0.00% 0.00%0
1
2
3
4
5
6
7
Number Percent
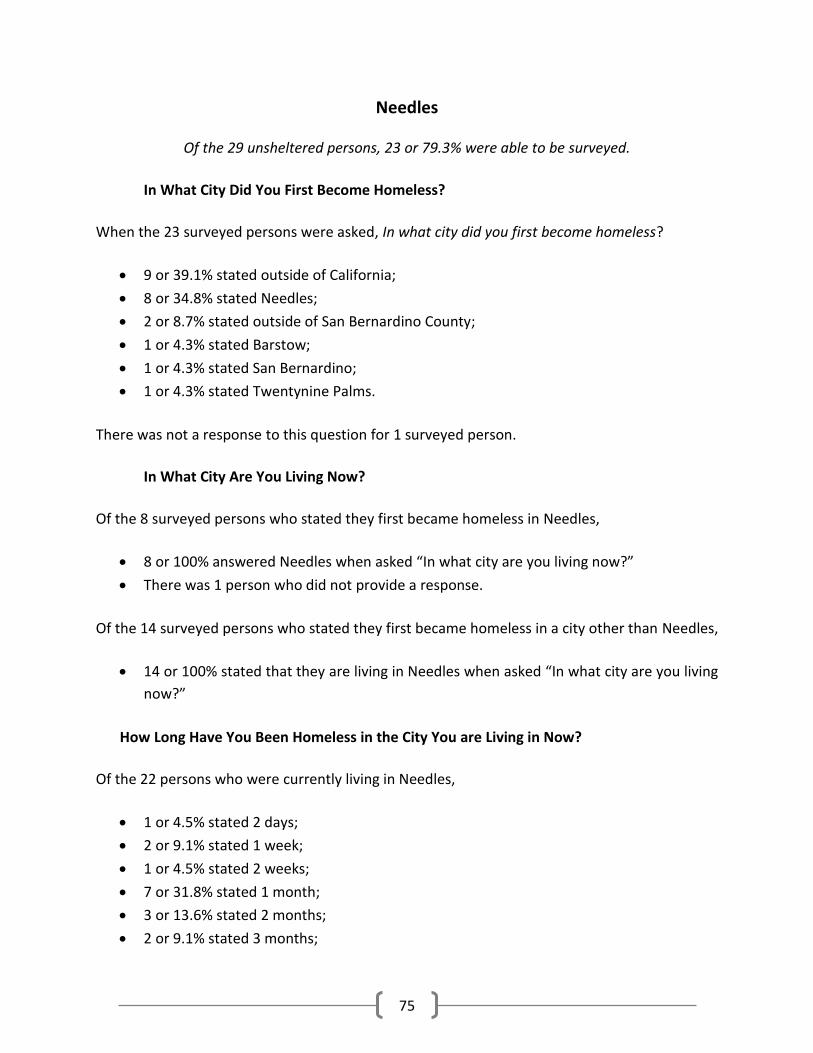
75
Needles
Of the 29 unsheltered persons, 23 or 79.3% were able to be surveyed.
In What City Did You First Become Homeless?
When the 23 surveyed persons were asked, In what city did you first become homeless?
• 9 or 39.1% stated outside of California;
• 8 or 34.8% stated Needles;
• 2 or 8.7% stated outside of San Bernardino County;
• 1 or 4.3% stated Barstow;
• 1 or 4.3% stated San Bernardino;
• 1 or 4.3% stated Twentynine Palms.
There was not a response to this question for 1 surveyed person.
In What City Are You Living Now?
Of the 8 surveyed persons who stated they first became homeless in Needles,
• 8 or 100% answered Needles when asked “In what city are you living now?”
• There was 1 person who did not provide a response.
Of the 14 surveyed persons who stated they first became homeless in a city other than Needles,
• 14 or 100% stated that they are living in Needles when asked “In what city are you living
now?”
How Long Have You Been Homeless in the City You are Living in Now?
Of the 22 persons who were currently living in Needles,
• 1 or 4.5% stated 2 days;
• 2 or 9.1% stated 1 week;
• 1 or 4.5% stated 2 weeks;
• 7 or 31.8% stated 1 month;
• 3 or 13.6% stated 2 months;
• 2 or 9.1% stated 3 months;
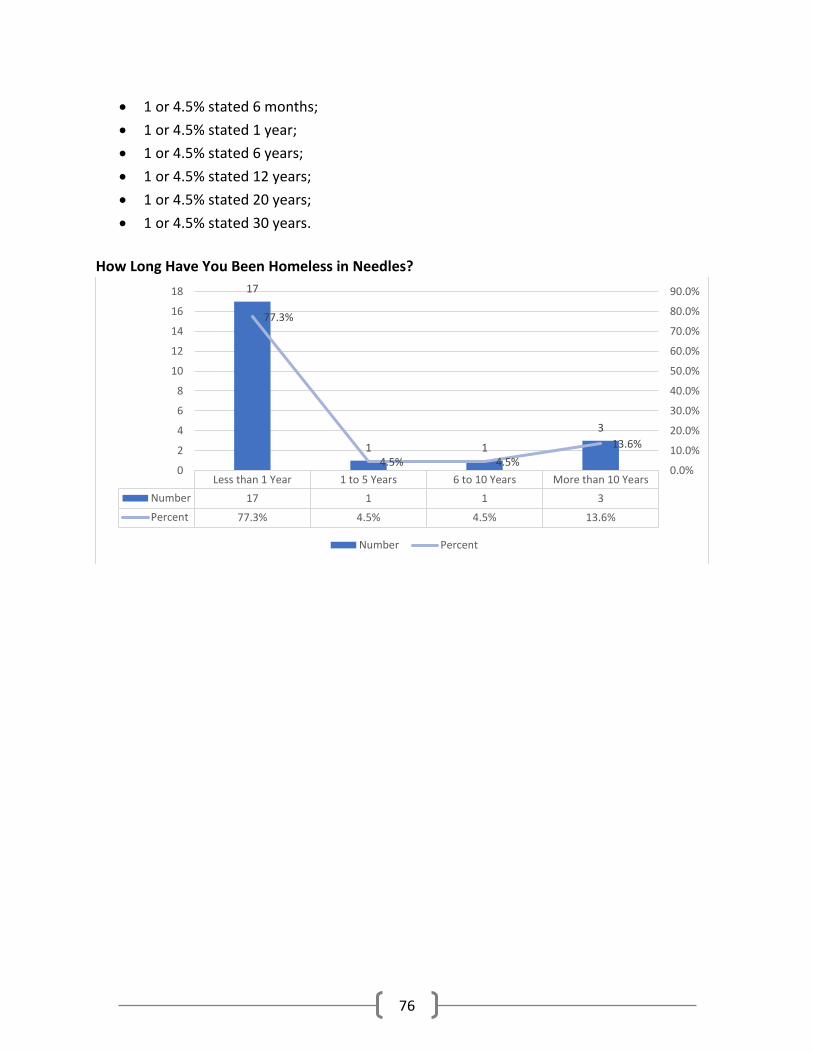
76
• 1 or 4.5% stated 6 months;
• 1 or 4.5% stated 1 year;
• 1 or 4.5% stated 6 years;
• 1 or 4.5% stated 12 years;
• 1 or 4.5% stated 20 years;
• 1 or 4.5% stated 30 years.
How Long Have You Been Homeless in Needles?
Less than 1 Year 1 to 5 Years 6 to 10 Years More than 10 Years
Number 17 1 1 3
Percent 77.3% 4.5% 4.5% 13.6%
17
1 1
3
77.3%
4.5% 4.5%
13.6%
0.0%
10.0%
20.0%
30.0%
40.0%
50.0%
60.0%
70.0%
80.0%
90.0%
0
2
4
6
8
10
12
14
16
18
Number Percent
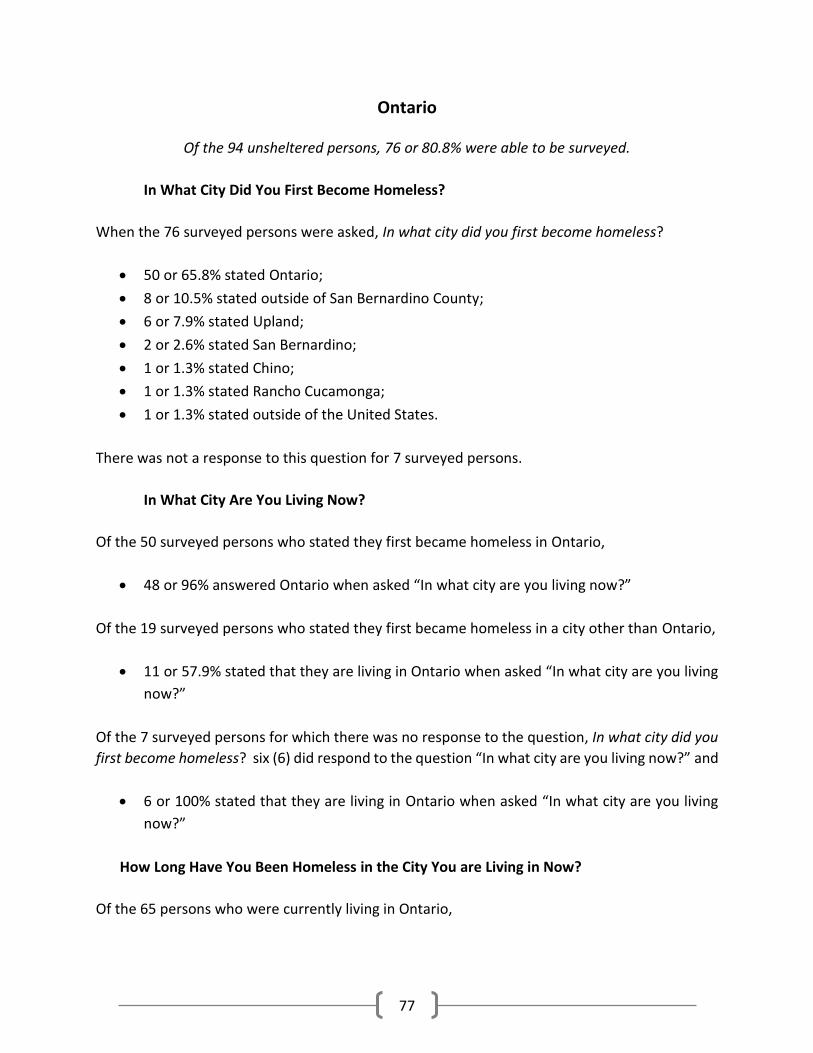
77
Ontario
Of the 94 unsheltered persons, 76 or 80.8% were able to be surveyed.
In What City Did You First Become Homeless?
When the 76 surveyed persons were asked, In what city did you first become homeless?
• 50 or 65.8% stated Ontario;
• 8 or 10.5% stated outside of San Bernardino County;
• 6 or 7.9% stated Upland;
• 2 or 2.6% stated San Bernardino;
• 1 or 1.3% stated Chino;
• 1 or 1.3% stated Rancho Cucamonga;
• 1 or 1.3% stated outside of the United States.
There was not a response to this question for 7 surveyed persons.
In What City Are You Living Now?
Of the 50 surveyed persons who stated they first became homeless in Ontario,
• 48 or 96% answered Ontario when asked “In what city are you living now?”
Of the 19 surveyed persons who stated they first became homeless in a city other than Ontario,
• 11 or 57.9% stated that they are living in Ontario when asked “In what city are you living
now?”
Of the 7 surveyed persons for which there was no response to the question, In what city did you
first become homeless? six (6) did respond to the question “In what city are you living now?” and
• 6 or 100% stated that they are living in Ontario when asked “In what city are you living
now?”
How Long Have You Been Homeless in the City You are Living in Now?
Of the 65 persons who were currently living in Ontario,
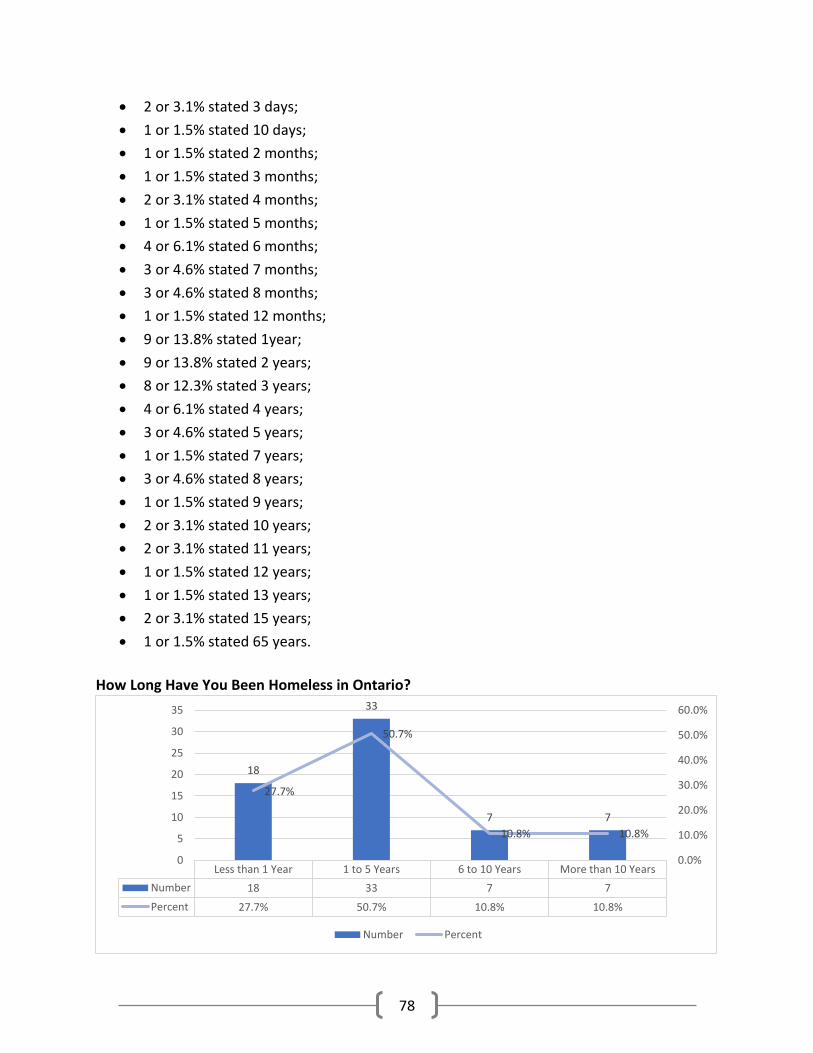
78
• 2 or 3.1% stated 3 days;
• 1 or 1.5% stated 10 days;
• 1 or 1.5% stated 2 months;
• 1 or 1.5% stated 3 months;
• 2 or 3.1% stated 4 months;
• 1 or 1.5% stated 5 months;
• 4 or 6.1% stated 6 months;
• 3 or 4.6% stated 7 months;
• 3 or 4.6% stated 8 months;
• 1 or 1.5% stated 12 months;
• 9 or 13.8% stated 1year;
• 9 or 13.8% stated 2 years;
• 8 or 12.3% stated 3 years;
• 4 or 6.1% stated 4 years;
• 3 or 4.6% stated 5 years;
• 1 or 1.5% stated 7 years;
• 3 or 4.6% stated 8 years;
• 1 or 1.5% stated 9 years;
• 2 or 3.1% stated 10 years;
• 2 or 3.1% stated 11 years;
• 1 or 1.5% stated 12 years;
• 1 or 1.5% stated 13 years;
• 2 or 3.1% stated 15 years;
• 1 or 1.5% stated 65 years.
How Long Have You Been Homeless in Ontario?
Less than 1 Year 1 to 5 Years 6 to 10 Years More than 10 Years
Number 18 33 7 7
Percent 27.7% 50.7% 10.8% 10.8%
18
33
7 7
27.7%
50.7%
10.8% 10.8%
0.0%
10.0%
20.0%
30.0%
40.0%
50.0%
60.0%
0
5
10
15
20
25
30
35
Number Percent
79
Rancho Cucamonga
Of the 48 unsheltered persons, 31 or 64.6% were able to be surveyed.
In What City Did You First Become Homeless?
When the 31 surveyed persons were asked, In what city did you first become homeless?
• 11 or 35.5% stated Rancho Cucamonga;
• 3 or 9.7% stated Upland;
• 2 or 6.5% stated Fontana;
• 2 or 6.5% stated Highland;
• 2 or 6.5% stated Victorville;
• 1 or 3.2% stated Hesperia;
• 1 or 3.2% stated Montclair;
• 1 or 3.2% stated Ontario;
• 1 or 3.2% stated outside of California;
• 1 or 3.2% stated outside of San Bernardino County;
• 1 or 3.2% stated San Bernardino.
There was not a response to this question for 5 surveyed persons.
In What City Are You Living Now?
Of the 11 surveyed persons who stated they first became homeless in Rancho Cucamonga,
• 10 or 90.9% answered Rancho Cucamonga when asked “In what city are you living now?”
Of the 15 surveyed persons who stated they first became homeless in a city other than Rancho
Cucamonga,
• 8 or 53.3% stated that they are living in Rancho Cucamonga when asked “In what city are
you living now?”
Of the 5 surveyed persons for which there was no response to the question, In what city did you
first become homeless? five (5) did respond to the question, “In what city are you living now?”
• 3 or 60% stated that they are living in Rancho Cucamonga when asked “In what city are
you living now?”
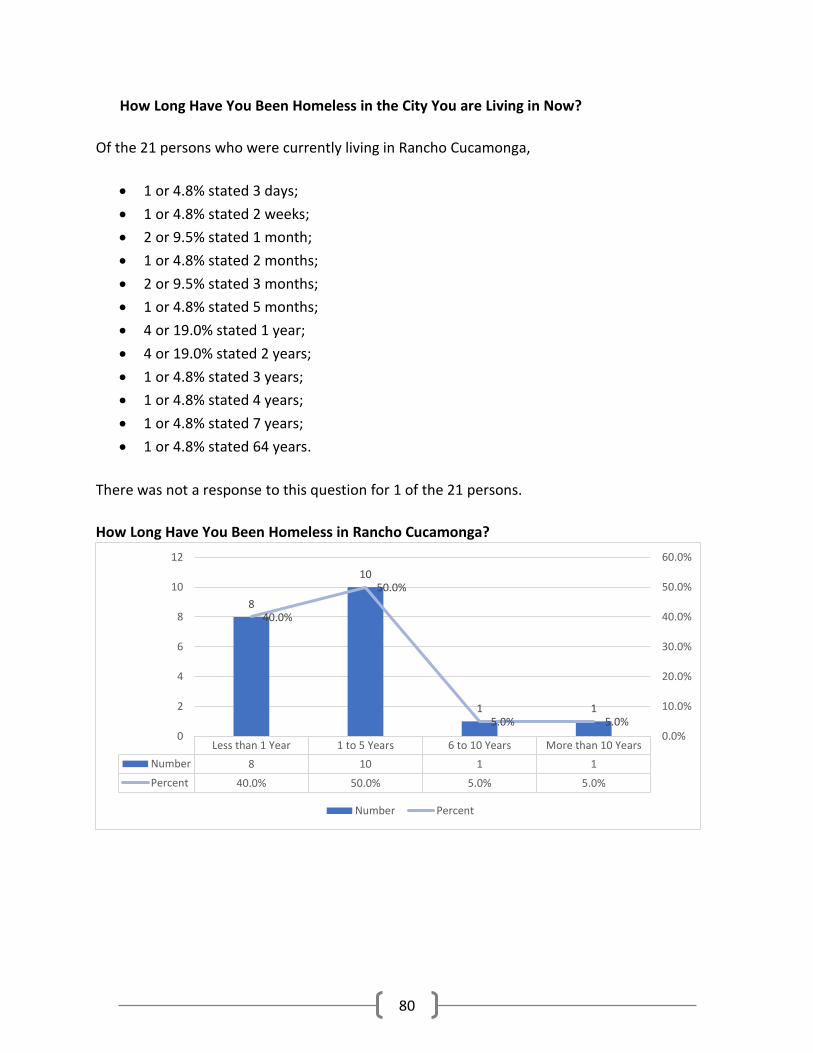
80
How Long Have You Been Homeless in the City You are Living in Now?
Of the 21 persons who were currently living in Rancho Cucamonga,
• 1 or 4.8% stated 3 days;
• 1 or 4.8% stated 2 weeks;
• 2 or 9.5% stated 1 month;
• 1 or 4.8% stated 2 months;
• 2 or 9.5% stated 3 months;
• 1 or 4.8% stated 5 months;
• 4 or 19.0% stated 1 year;
• 4 or 19.0% stated 2 years;
• 1 or 4.8% stated 3 years;
• 1 or 4.8% stated 4 years;
• 1 or 4.8% stated 7 years;
• 1 or 4.8% stated 64 years.
There was not a response to this question for 1 of the 21 persons.
How Long Have You Been Homeless in Rancho Cucamonga?
Less than 1 Year 1 to 5 Years 6 to 10 Years More than 10 Years
Number 8 10 1 1
Percent 40.0% 50.0% 5.0% 5.0%
8
10
1 1
40.0%
50.0%
5.0% 5.0%0.0%
10.0%
20.0%
30.0%
40.0%
50.0%
60.0%
0
2
4
6
8
10
12
Number Percent
81
Redlands
Of the 141 unsheltered persons, 93 or 65.9% were able to be surveyed.
In What City Did You First Become Homeless?
When the 93 surveyed persons were asked, In what city did you first become homeless?
• 63 or 67.7% stated Redlands;
• 5 or 5.4% stated San Bernardino;
• 4 or 4.3% stated outside of San Bernardino County;
• 3 or 3.2% stated Big Bear;
• 2 or 2.2% stated Colton;
• 1 or 1.1% stated Fontana;
• 1 or 1.1% stated Loma Linda;
• 1 or 1.1% stated Upland;
• 1 or 1.1% stated outside of California.
There was not a response to this question for 12 surveyed persons.
In What City Are You Living Now?
Of the 63 surveyed persons who stated they first became homeless in Redlands,
• 62 or 98.4% answered Redlands when asked “In what city are you living now?”
Of the 18 surveyed persons who stated they first became homeless in a city other than Redlands,
• 15 or 83.3% stated that they are living in Redlands when asked “In what city are you living
now?”
Of the 12 surveyed persons for which there was no response to the question, In what city did you
first become homeless? nine (9) did respond to the question “In what city are you living now?”
and
• 9 or 100% stated that they are living in Redlands when asked “In what city are you living
now?”
82
How Long Have You Been Homeless in the City You are Living in Now?
Of the 86 persons who were currently living in Redlands,
• 2 or 2.3% stated 1 day;
• 1 or 1.2% stated 4 days;
• 1 or 1.2% stated 5 days;
• 1 or 1.2% stated 7 days;
• 1 or 1.2% stated 2 months;
• 3 or 3.5% stated 3 months;
• 2 or 2.3% stated 4 months;
• 1 or 1.2% stated 6 months;
• 3 or 3.5% stated 8 months;
• 2 or 2.3% stated 9 months;
• 3 or 3.5% stated 10 months;
• 7 or 8.1% stated 1 year;
• 11 or 12.8% stated 2 years;
• 11 or 12.8% stated 3 years;
• 8 or 9.3% stated 4 years;
• 10 or 11.6% stated 5 years;
• 4 or 4.6% stated 6 years;
• 4 or 4.6% stated 7 years;
• 1 or 1.2% stated 8 years;
• 1 or 1.2% stated 10 years;
• 1 or 1.2% stated 11 years;
• 1 or 1.2% stated 12 years;
• 1 or 1.2% stated 15 years;
• 1 or 1.2% stated 35 years.
There was not a response to this question for 5 of the 86 persons.
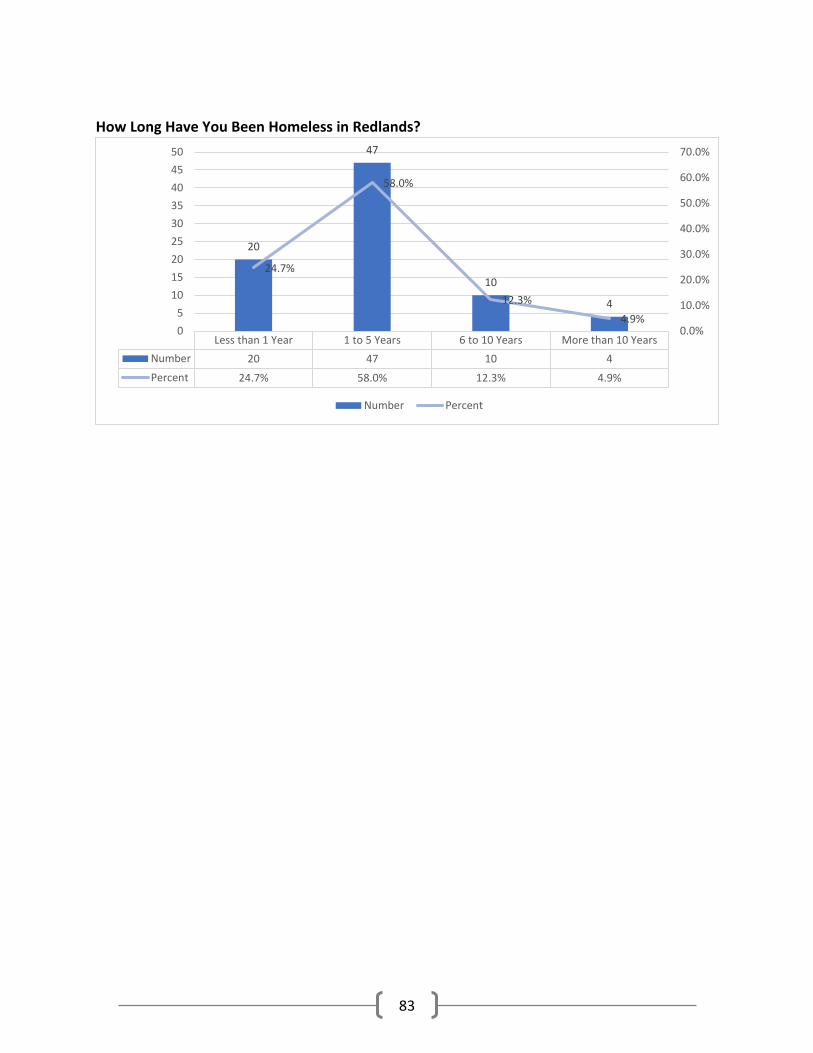
83
How Long Have You Been Homeless in Redlands?
Less than 1 Year 1 to 5 Years 6 to 10 Years More than 10 Years
Number 20 47 10 4
Percent 24.7% 58.0% 12.3% 4.9%
20
47
10
4
24.7%
58.0%
12.3%
4.9%0.0%
10.0%
20.0%
30.0%
40.0%
50.0%
60.0%
70.0%
0
5
10
15
20
25
30
35
40
45
50
Number Percent
84
Rialto
Of the 133 unsheltered persons, 88 or 66.2% were able to be surveyed.
In What City Did You First Become Homeless?
When the 88 surveyed persons were asked, In what city did you first become homeless?
• 36 or 40.9% stated Rialto;
• 11 or 12.5% stated Fontana;
• 8 or 9.1% stated San Bernardino;
• 4 or 4.5% stated Bloomington;
• 4 or 4.5% stated Colton;
• 2 or 2.3% stated outside of San Bernardino County;
• 2 or 2.3% stated Victorville;
• 1 or 1.1% stated Adelanto;
• 1 or 1.1% stated Grand Terrace;
• 1 or 1.1% stated Needles;
• 1 or 1.1% stated Upland.
There was not a response to this question for 17 surveyed persons.
In What City Are You Living Now?
Of the 36 surveyed persons who stated they first became homeless in Rialto,
• 36 or 100% answered Rialto when asked “In what city are you living now?”
Of the 35 surveyed persons who stated they first became homeless in a city other than Rialto,
• 26 or 74.3% stated that they are living in Rialto when asked “In what city are you living
now?”
Of the 17 surveyed persons for which there was no response to the question, In what city did you
first become homeless? nine (9) did respond to the question “In what city are you living now?”
and
• 9 or 100% stated that they are living in Rialto when asked “In what city are you living
now?”
85
How Long Have You Been Homeless in the City You are Living in Now?
Of the 71 persons who were currently living in Rialto,
• 1 or 1.4% stated 1 day;
• 1 or 1.4% stated 7 days;
• 1 or 1.4% stated 2 weeks;
• 4 or 5.6% stated 1 month;
• 4 or 5.6% stated 2 months;
• 1 or 1.4% stated 3 months;
• 2 or 2.8% stated 5 months;
• 1 or 1.4% stated 6 months;
• 1 or 1.4% stated 7 months;
• 1 or 1.4% stated 9 months;
• 1 or 1.4% stated 10 months;
• 7 or 9.8% stated 1 year;
• 6 or 8.4% stated 2 years;
• 5 or 7.0% stated 3 years;
• 4 or 5.6% stated 4 years;
• 2 or 2.8% stated 5 years;
• 3 or 4.2% stated 6 years;
• 3 or 4.2% stated 9 years;
• 3 or 4.2% stated 10 years;
• 3 or 4.2% stated 12 years;
• 1 or 1.4% stated 14 years;
• 1 or 1.4% stated 15 years;
• 1 or 1.4% stated 17 years;
• 1 or 1.4% stated 18 years;
• 2 or 2.8% stated 20 years.
There was not a response to this question for 11 of the 71 persons.
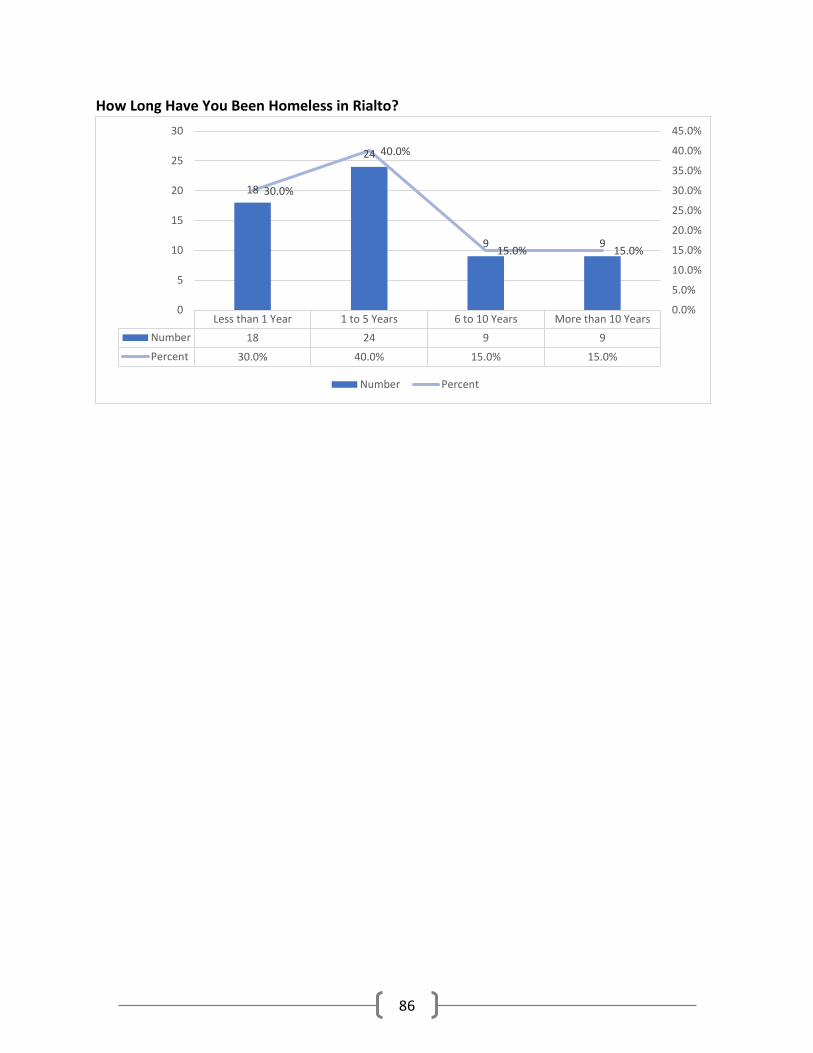
86
How Long Have You Been Homeless in Rialto?
Less than 1 Year 1 to 5 Years 6 to 10 Years More than 10 Years
Number 18 24 9 9
Percent 30.0% 40.0% 15.0% 15.0%
18
24
9 9
30.0%
40.0%
15.0% 15.0%
0.0%
5.0%
10.0%
15.0%
20.0%
25.0%
30.0%
35.0%
40.0%
45.0%
0
5
10
15
20
25
30
Number Percent
87
San Bernardino
Of the 639 unsheltered persons, 348 or 54.5% were able to be surveyed
In What City Did You First Become Homeless?
When the 348 surveyed persons were asked, In what city did you first become homeless?
• 248 or 71.3% stated San Bernardino;
• 12 or 3.4% stated outside of San Bernardino County;
• 9 or 2.6% stated outside of California;
• 6 or 1.7% stated Colton;
• 6 or 1.7% stated Highland;
• 5 or 1.4 stated Fontana;
• 3 or 0.9% stated Rialto;
• 3 or 0.9% stated Victorville;
• 2 or 0.6% stated Crestline;
• 2 or 0.6% stated Ontario;
• 2 or 0.6% stated Hesperia;
• 2 or 0.6% stated Redlands;
• 1 or 0.3% stated Bloomington;
• 1 or 3% stated Montclair;
• 1 or 3% stated Rancho Cucamonga;
• 1 or 3% stated Twentynine Palms.
There was not a response for 44 surveyed persons.
In What City Are You Living Now
Of the 248 surveyed persons who stated they first became homeless in San Bernardino,
• 241 or 97.2% answered San Bernardino when asked “In what city are you living now?”
Of the 56 surveyed persons who stated they first became homeless in a city other than San
Bernardino,
• 42 or 58.3% stated that they are living in San Bernardino when asked “In what city are
you living now?”
88
Of the 44 surveyed persons for which there was no response to the question, In what city did you
first become homeless? thirty-seven (37) did respond to the question “In what city are you living
now?” and
• 30 or 68.2% stated that they are living in San Bernardino when asked “In what city are
you living now?”
How Long Have You Been Homeless in the City You are Living in Now?
Of the 313 persons who were currently living in San Bernardino,
• 1 or 0.3% stated 4 days;
• 2 or 0.6% stated 6 days;
• 3 or 1.0% stated 7 days;
• 1 or 0.3% stated 12 days;
• 1 or 0.3% stated 15 days;
• 3 or 1.0% stated 1 week;
• 1 or 0.3% stated 2 weeks;
• 5 or 1.6% stated 1 month;
• 5 or 1.6% stated 2 months;
• 4 or 1.3% stated 3 months;
• 7 or 2.2% stated 4 months;
• 3 or 1.0% stated 5 months;
• 5 or 1.6% stated 6 months;
• 8 or 2.6% stated 7 months;
• 4 or 1.3% stated 8 months;
• 1 or 0.3% stated 9 months;
• 42 or 23.4% stated 1 year;
• 67 or 21.4% stated 2 years;
• 29 or 9.3% stated 3 years;
• 21 or 6.7% stated 4 years;
• 22 or 7.0% stated 5 years;
• 16 or 5.1% stated 6 years;
• 4 or 1.3% stated 7 years;
• 7 or 2.2% stated 8 years;
• 4 or 1.3% stated 9 years;
• 7 or 2.2% stated 10 years;
• 3 or 1.0% stated 11 years;
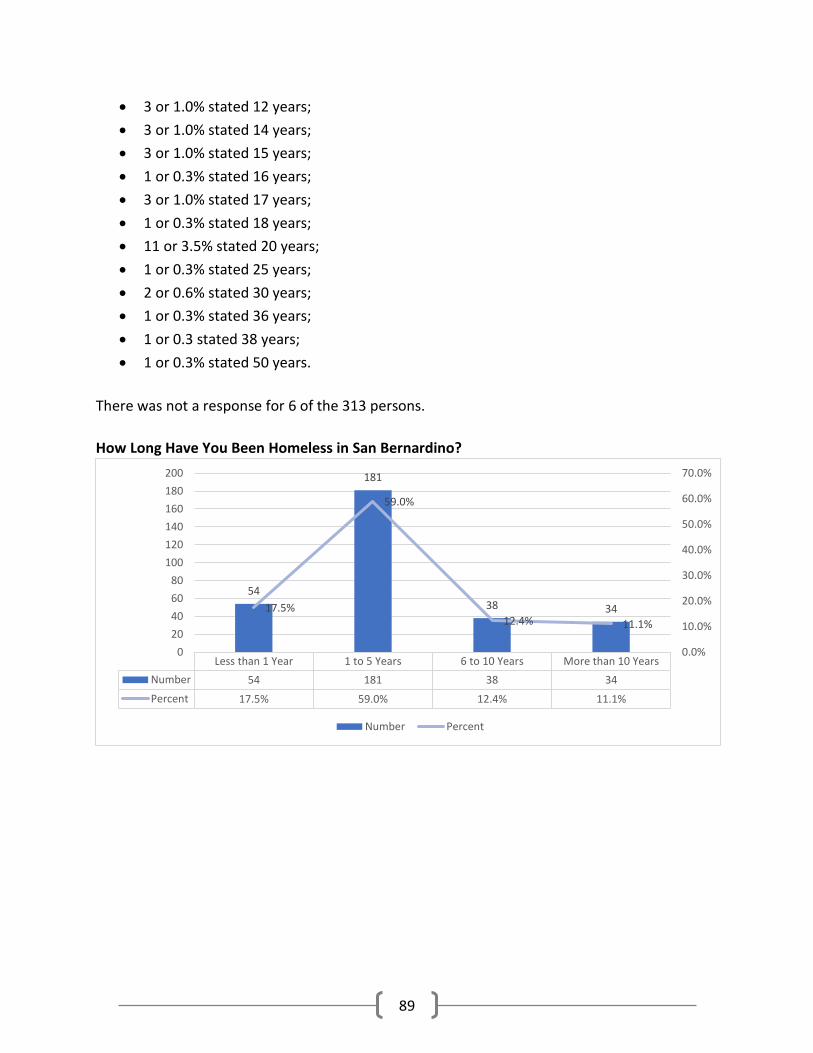
89
• 3 or 1.0% stated 12 years;
• 3 or 1.0% stated 14 years;
• 3 or 1.0% stated 15 years;
• 1 or 0.3% stated 16 years;
• 3 or 1.0% stated 17 years;
• 1 or 0.3% stated 18 years;
• 11 or 3.5% stated 20 years;
• 1 or 0.3% stated 25 years;
• 2 or 0.6% stated 30 years;
• 1 or 0.3% stated 36 years;
• 1 or 0.3 stated 38 years;
• 1 or 0.3% stated 50 years.
There was not a response for 6 of the 313 persons.
How Long Have You Been Homeless in San Bernardino?
Less than 1 Year 1 to 5 Years 6 to 10 Years More than 10 Years
Number 54 181 38 34
Percent 17.5% 59.0% 12.4% 11.1%
54
181
38 3417.5%
59.0%
12.4% 11.1%
0.0%
10.0%
20.0%
30.0%
40.0%
50.0%
60.0%
70.0%
0
20
40
60
80
100
120
140
160
180
200
Number Percent
90
Twentynine Palms
Of the 40 unsheltered persons, 24 or 60% were able to be surveyed.
In What City Did You First Become Homeless?
When the 24 surveyed persons were asked, In what city did you first become homeless?
• 12 or 50% stated Twentynine Palms;
2 or 8.3% stated Yucca Valley.
There was not a response to this question for 10 surveyed persons.
In What City Are You Living Now?
Of the 12 surveyed persons who stated they first became homeless in Twentynine Palms,
• 7 or 58.3% answered Twentynine Palms when asked “In what city are you living now?”
Of the 2 surveyed persons who stated they first became homeless in a city other than Twentynine
Palms,
• 0 or 0.0% stated that they are living in Twentynine Palms when asked “In what city are
you living now?”
Of the 10 surveyed persons for which there was no response to the question, In what city did you
first become homeless? five (5) did respond to the question “In what city are you living now?”
and
• 5 or 50% stated that they are living in Twentynine Palms when asked “In what city are you
living now?”
How Long Have You Been Homeless in the City You are Living in Now?
Of the 12 persons who were currently living in Twentynine Palms,
• 1 or 8.3% stated 16 days;
• 1 or 8.3% stated 3 months;
• 1 or 8.3% stated 9 months;
• 1 or 8.3% stated 1 year;
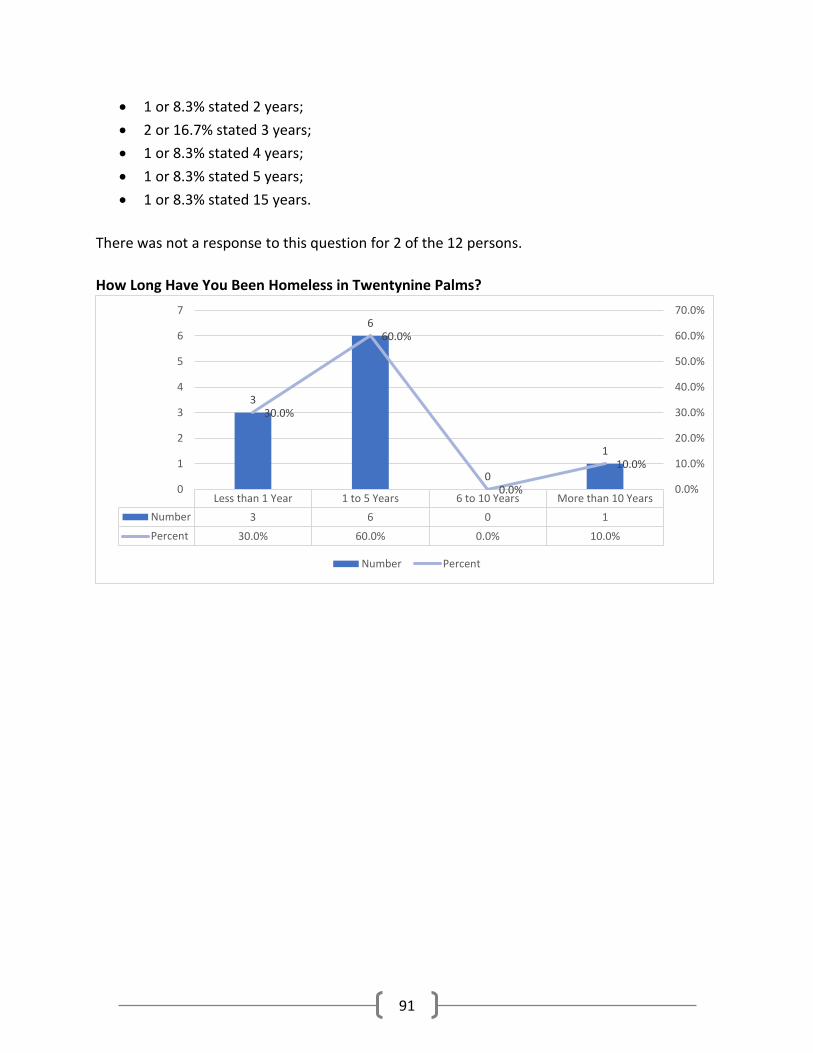
91
• 1 or 8.3% stated 2 years;
• 2 or 16.7% stated 3 years;
• 1 or 8.3% stated 4 years;
• 1 or 8.3% stated 5 years;
• 1 or 8.3% stated 15 years.
There was not a response to this question for 2 of the 12 persons.
How Long Have You Been Homeless in Twentynine Palms?
Less than 1 Year 1 to 5 Years 6 to 10 Years More than 10 Years
Number 3 6 0 1
Percent 30.0% 60.0% 0.0% 10.0%
3
6
0
1
30.0%
60.0%
0.0%
10.0%
0.0%
10.0%
20.0%
30.0%
40.0%
50.0%
60.0%
70.0%
0
1
2
3
4
5
6
7
Number Percent
92
Upland
Of the 43 unsheltered persons, 31 or 72.1% were able to be surveyed.
In What City Did You First Become Homeless?
When the 31 surveyed persons were asked, In what city did you first become homeless?
• 11 or 35.5% stated Upland;
• 5 or 16.1% stated Ontario;
• 3 or 9.7% stated Rancho Cucamonga;
• 3 or 9.7% stated outside of San Bernardino;
• 2 or 6.5% stated Fontana;
• 1 or 3.2% stated Apple Valley;
• 1 or 3.2% stated Montclair;
• 1 or 3.2% stated Victorville.
There was not a response to this question for 4 surveyed persons.
In What City Are You Living Now?
Of the 11 surveyed persons who stated they first became homeless in Upland,
• 10 or 90.9% answered Upland when asked “In what city are you living now?”
Of the 16 surveyed persons who stated they first became homeless in a city other than Upland,
• 16 or 100% stated that they are living in Upland when asked “In what city are you living
now?”
Of the 4 surveyed persons for which there was no response to the question, In what city did you
first become homeless? three (3) did respond to the question “In what city are you living now?”
and
• 3 or 75% stated that they are living in Upland when asked “In what city are you living
now?”
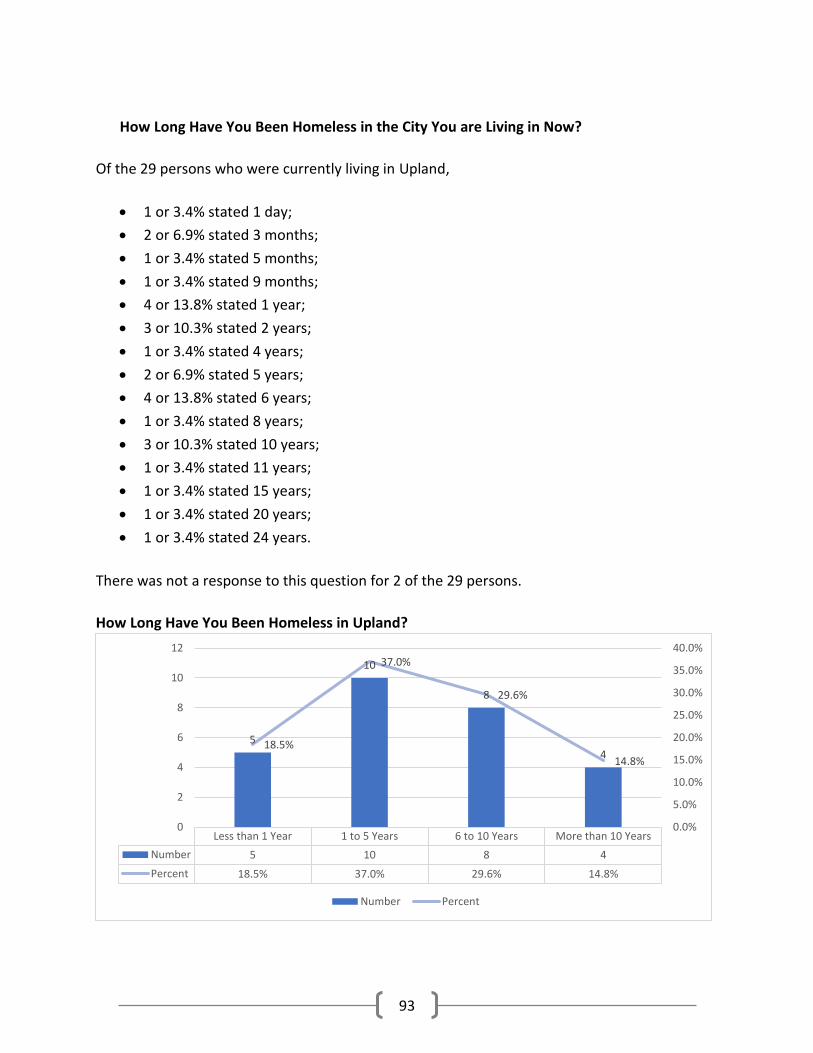
93
How Long Have You Been Homeless in the City You are Living in Now?
Of the 29 persons who were currently living in Upland,
• 1 or 3.4% stated 1 day;
• 2 or 6.9% stated 3 months;
• 1 or 3.4% stated 5 months;
• 1 or 3.4% stated 9 months;
• 4 or 13.8% stated 1 year;
• 3 or 10.3% stated 2 years;
• 1 or 3.4% stated 4 years;
• 2 or 6.9% stated 5 years;
• 4 or 13.8% stated 6 years;
• 1 or 3.4% stated 8 years;
• 3 or 10.3% stated 10 years;
• 1 or 3.4% stated 11 years;
• 1 or 3.4% stated 15 years;
• 1 or 3.4% stated 20 years;
• 1 or 3.4% stated 24 years.
There was not a response to this question for 2 of the 29 persons.
How Long Have You Been Homeless in Upland?
Less than 1 Year 1 to 5 Years 6 to 10 Years More than 10 Years
Number 5 10 8 4
Percent 18.5% 37.0% 29.6% 14.8%
5
10
8
418.5%
37.0%
29.6%
14.8%
0.0%
5.0%
10.0%
15.0%
20.0%
25.0%
30.0%
35.0%
40.0%
0
2
4
6
8
10
12
Number Percent
94
Victorville
Of the 179 unsheltered persons, 120 or 67% were able to be surveyed.
In What City Did You First Become Homeless?
When the 120 surveyed persons were asked, In what city did you first become homeless?
• 85 or 70.8% stated Victorville;
• 7 or 5.8% stated outside of California;
• 4 or 3.3% stated Hesperia;
• 3 or 2.5% stated outside of San Bernardino;
• 2 or 1.7% stated Apple Valley;
• 1 or 0.8% stated Barstow;
• 1 or 0.8% stated Fontana;
• 1 or 0.8% stated Redlands;
• 1 or 0.8% stated Rialto;
1 or 0.8% stated San Bernardino.
There was not a response to this question for 14 surveyed persons.
In What City Are You Living Now?
Of the 85 surveyed persons who stated they first became homeless in Victorville,
• 79 or 92.9% answered Victorville when asked “In what city are you living now?”
Of the 21 surveyed persons who stated they first became homeless in a city other than Victorville,
• 21 or 100% stated that they are living in Victorville when asked “In what city are you living
now?”
Of the 14 surveyed persons for which there was no response to the question, In what city did you
first become homeless? three (3) did respond to the question “In what city are you living now?”
and
• 12 or 85.7% stated that they are living in Victorville when asked “In what city are you
living now?”
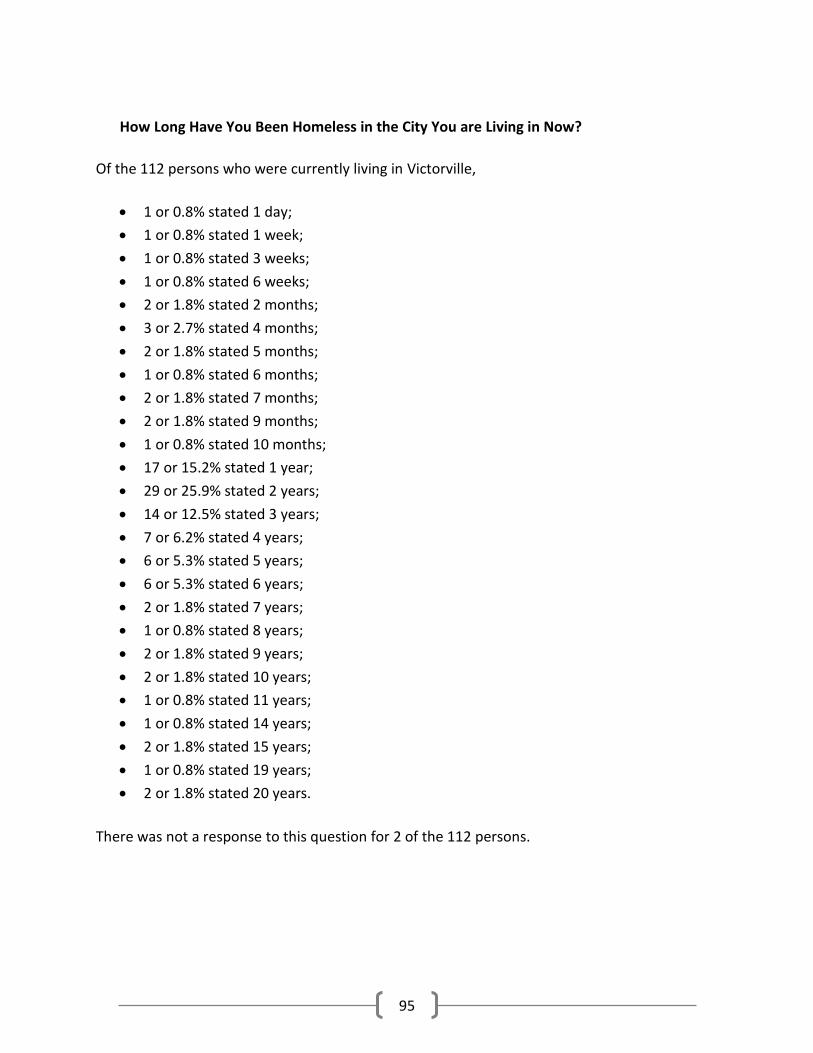
95
How Long Have You Been Homeless in the City You are Living in Now?
Of the 112 persons who were currently living in Victorville,
• 1 or 0.8% stated 1 day;
• 1 or 0.8% stated 1 week;
• 1 or 0.8% stated 3 weeks;
• 1 or 0.8% stated 6 weeks;
• 2 or 1.8% stated 2 months;
• 3 or 2.7% stated 4 months;
• 2 or 1.8% stated 5 months;
• 1 or 0.8% stated 6 months;
• 2 or 1.8% stated 7 months;
• 2 or 1.8% stated 9 months;
• 1 or 0.8% stated 10 months;
• 17 or 15.2% stated 1 year;
• 29 or 25.9% stated 2 years;
• 14 or 12.5% stated 3 years;
• 7 or 6.2% stated 4 years;
• 6 or 5.3% stated 5 years;
• 6 or 5.3% stated 6 years;
• 2 or 1.8% stated 7 years;
• 1 or 0.8% stated 8 years;
• 2 or 1.8% stated 9 years;
• 2 or 1.8% stated 10 years;
• 1 or 0.8% stated 11 years;
• 1 or 0.8% stated 14 years;
• 2 or 1.8% stated 15 years;
• 1 or 0.8% stated 19 years;
• 2 or 1.8% stated 20 years.
There was not a response to this question for 2 of the 112 persons.
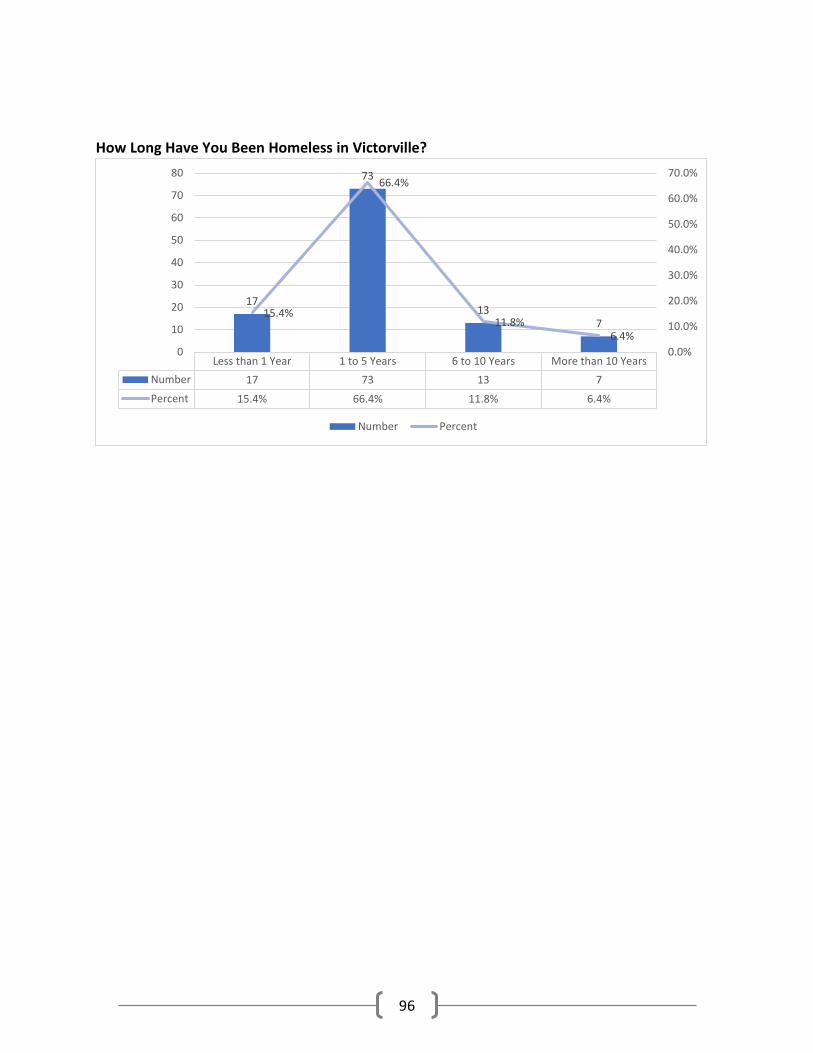
96
How Long Have You Been Homeless in Victorville?
Less than 1 Year 1 to 5 Years 6 to 10 Years More than 10 Years
Number 17 73 13 7
Percent 15.4% 66.4% 11.8% 6.4%
17
73
137
15.4%
66.4%
11.8%6.4%
0.0%
10.0%
20.0%
30.0%
40.0%
50.0%
60.0%
70.0%
0
10
20
30
40
50
60
70
80
Number Percent
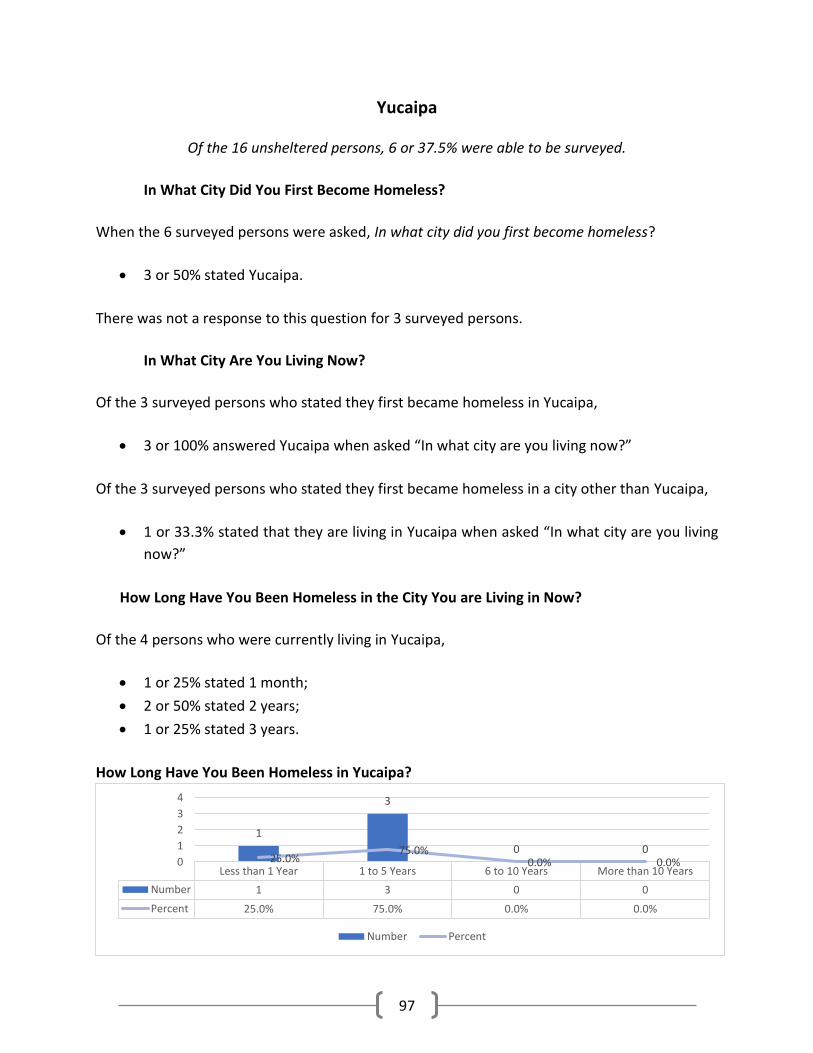
97
Yucaipa
Of the 16 unsheltered persons, 6 or 37.5% were able to be surveyed.
In What City Did You First Become Homeless?
When the 6 surveyed persons were asked, In what city did you first become homeless?
• 3 or 50% stated Yucaipa.
There was not a response to this question for 3 surveyed persons.
In What City Are You Living Now?
Of the 3 surveyed persons who stated they first became homeless in Yucaipa,
• 3 or 100% answered Yucaipa when asked “In what city are you living now?”
Of the 3 surveyed persons who stated they first became homeless in a city other than Yucaipa,
• 1 or 33.3% stated that they are living in Yucaipa when asked “In what city are you living
now?”
How Long Have You Been Homeless in the City You are Living in Now?
Of the 4 persons who were currently living in Yucaipa,
• 1 or 25% stated 1 month;
• 2 or 50% stated 2 years;
• 1 or 25% stated 3 years.
How Long Have You Been Homeless in Yucaipa?
Less than 1 Year 1 to 5 Years 6 to 10 Years More than 10 Years
Number 1 3 0 0
Percent 25.0% 75.0% 0.0% 0.0%
1
3
0 025.0%
75.0%0.0% 0.0%0
1
2
3
4
Number Percent
98
Yucca Valley
Of the 45 unsheltered persons, 32 or 71.1% were able to be surveyed.
In What City Did You First Become Homeless?
When the 32 surveyed persons were asked, In what city did you first become homeless?
• 19 or 59.4% stated Yucca Valley;
• 3 or 9.4% stated outside of San Bernardino;
• 3 or 9.4% stated San Bernardino;
• 1 or 3.1% stated Morongo;
• 1 or 3.1% stated outside of California;
1 or 3.1% stated Twentynine Palms.
There was not a response to this question for 4 surveyed persons.
In What City Are You Living Now?
Of the 19 surveyed persons who stated they first became homeless in Yucca Valley,
• 19 or 100% answered Yucca Valley when asked “In what city are you living now?”
Of the 9 surveyed persons who stated they first became homeless in a city other than Yucca
Valley,
• 8 or 88.9% stated that they are living in Yucca Valley when asked “In what city are you
living now?”
Of the 4 surveyed persons for which there was no response to the question, In what city did you
first become homeless? three (3) did respond to the question “In what city are you living now?”
and
• 1 or 25% stated that they are living in Yucca Valley when asked “In what city are you living
now?”
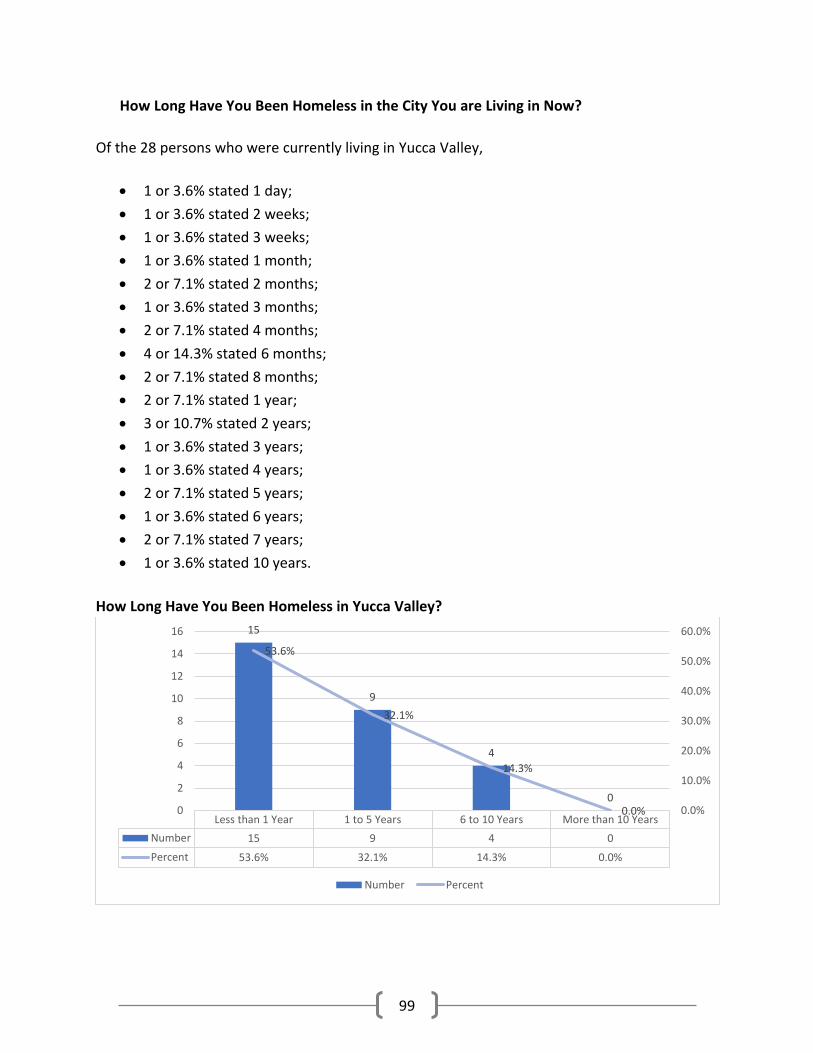
99
How Long Have You Been Homeless in the City You are Living in Now?
Of the 28 persons who were currently living in Yucca Valley,
• 1 or 3.6% stated 1 day;
• 1 or 3.6% stated 2 weeks;
• 1 or 3.6% stated 3 weeks;
• 1 or 3.6% stated 1 month;
• 2 or 7.1% stated 2 months;
• 1 or 3.6% stated 3 months;
• 2 or 7.1% stated 4 months;
• 4 or 14.3% stated 6 months;
• 2 or 7.1% stated 8 months;
• 2 or 7.1% stated 1 year;
• 3 or 10.7% stated 2 years;
• 1 or 3.6% stated 3 years;
• 1 or 3.6% stated 4 years;
• 2 or 7.1% stated 5 years;
• 1 or 3.6% stated 6 years;
• 2 or 7.1% stated 7 years;
• 1 or 3.6% stated 10 years.
How Long Have You Been Homeless in Yucca Valley?
Less than 1 Year 1 to 5 Years 6 to 10 Years More than 10 Years
Number 15 9 4 0
Percent 53.6% 32.1% 14.3% 0.0%
15
9
4
0
53.6%
32.1%
14.3%
0.0% 0.0%
10.0%
20.0%
30.0%
40.0%
50.0%
60.0%
0
2
4
6
8
10
12
14
16
Number Percent
100
Appendix A:
Findings for Each Jurisdiction for
Unsheltered Adults
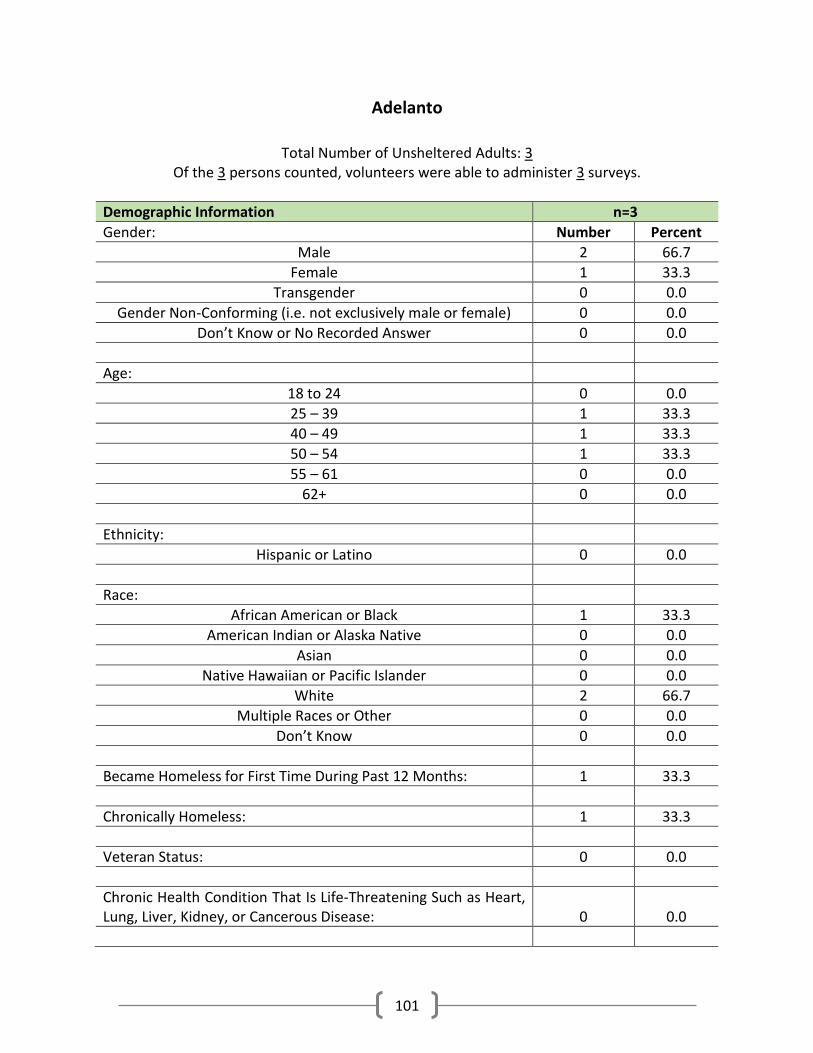
101
Adelanto
Total Number of Unsheltered Adults: 3
Of the 3 persons counted, volunteers were able to administer 3 surveys.
Demographic Information n=3
Gender: Number Percent
Male 2 66.7
Female 1 33.3
Transgender 0 0.0
Gender Non-Conforming (i.e. not exclusively male or female) 0 0.0
Don’t Know or No Recorded Answer 0 0.0
Age:
18 to 24 0 0.0
25 – 39 1 33.3
40 – 49 1 33.3
50 – 54 1 33.3
55 – 61 0 0.0
62+ 0 0.0
Ethnicity:
Hispanic or Latino 0 0.0
Race:
African American or Black 1 33.3
American Indian or Alaska Native 0 0.0
Asian 0 0.0
Native Hawaiian or Pacific Islander 0 0.0
White 2 66.7
Multiple Races or Other 0 0.0
Don’t Know 0 0.0
Became Homeless for First Time During Past 12 Months: 1 33.3
Chronically Homeless: 1 33.3
Veteran Status: 0 0.0
Chronic Health Condition That Is Life-Threatening Such as Heart, Lung, Liver, Kidney, or Cancerous Disease:
0 0.0

102
Demographic Information n=3
HIV/AIDS: 0 0.0
Physical Disability That Seriously Limits Ability to Live Independently:
0 0.0
Developmental Disabilities: 0 0.0
Mental Health Disability or Disorder That Seriously Limits Ability to Live Independently:
0 0.0
Substance Use Problem Disability or Disorder That Seriously Limits Ability to Live Independently:
2 66.7
Victims of Domestic Violence:
Experiencing Homelessness Because Fleeing Domestic Violence, Dating Violence, Sexual Assault, or Stalking
0 0.0
Released from Correctional Institutions During Past Year: 3 100.0
Monthly Income:
No Monthly Income 0 0.0
$1 - $250 2 66.7
$251 - $500 1 33.3
$501 - $1,000 0 0.0
More Than $1,000 0 0.0
No Recorded Answer 0 0.0
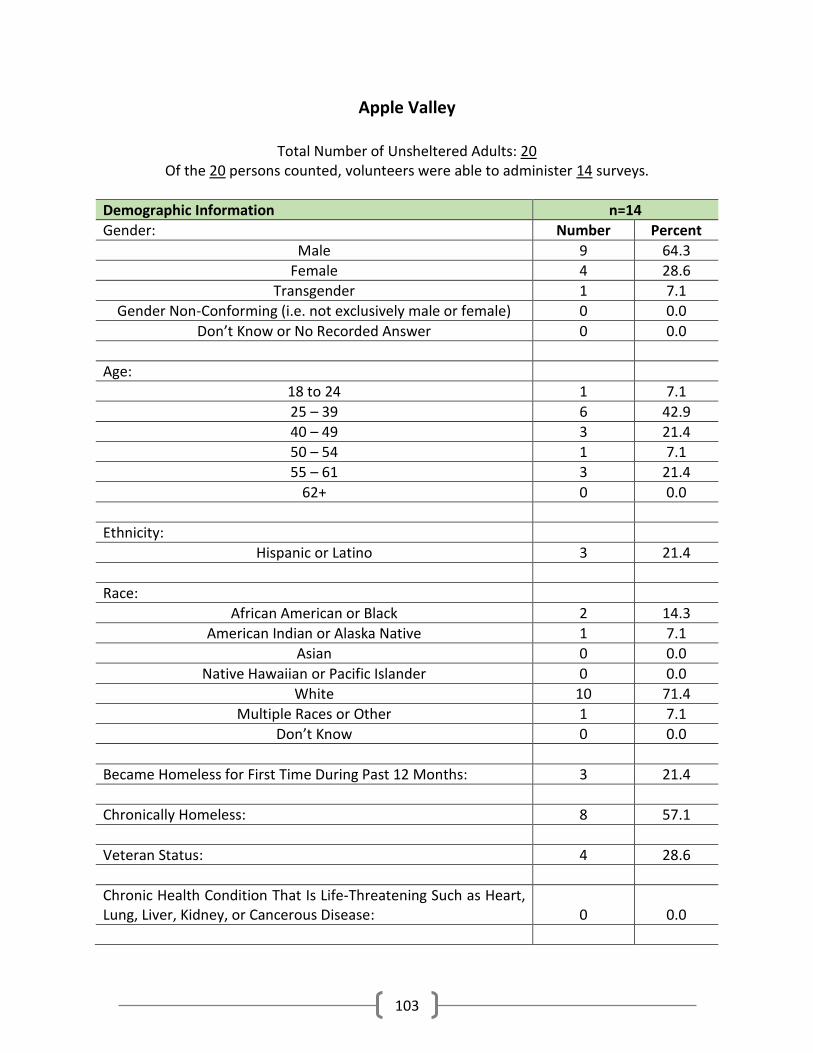
103
Apple Valley
Total Number of Unsheltered Adults: 20 Of the 20 persons counted, volunteers were able to administer 14 surveys.
Demographic Information n=14
Gender: Number Percent
Male 9 64.3
Female 4 28.6
Transgender 1 7.1
Gender Non-Conforming (i.e. not exclusively male or female) 0 0.0
Don’t Know or No Recorded Answer 0 0.0
Age:
18 to 24 1 7.1
25 – 39 6 42.9
40 – 49 3 21.4
50 – 54 1 7.1
55 – 61 3 21.4
62+ 0 0.0
Ethnicity:
Hispanic or Latino 3 21.4
Race:
African American or Black 2 14.3
American Indian or Alaska Native 1 7.1
Asian 0 0.0
Native Hawaiian or Pacific Islander 0 0.0
White 10 71.4
Multiple Races or Other 1 7.1
Don’t Know 0 0.0
Became Homeless for First Time During Past 12 Months: 3 21.4
Chronically Homeless: 8 57.1
Veteran Status: 4 28.6
Chronic Health Condition That Is Life-Threatening Such as Heart, Lung, Liver, Kidney, or Cancerous Disease:
0 0.0

104
Demographic Information n=14
HIV/AIDS: 0 0.0
Physical Disability That Seriously Limits Ability to Live Independently:
4 28.6
Developmental Disabilities: 1 7.1
Mental Health Disability or Disorder That Seriously Limits Ability to Live Independently:
3 21.4
Substance Use Problem Disability or Disorder That Seriously Limits Ability to Live Independently:
6 42.9
Victims of Domestic Violence:
Experiencing Homelessness Because Fleeing Domestic Violence, Dating Violence, Sexual Assault, or Stalking
1 7.1
Released from Correctional Institutions During Past Year: 4 28.6
Monthly Income:
No Monthly Income 9 64.3
$1 - $250 2 14.3
$251 - $500 2 14.3
$501 - $1,000 0 0.0
More Than $1,000 0 0.0
No Recorded Answer 1 7.1
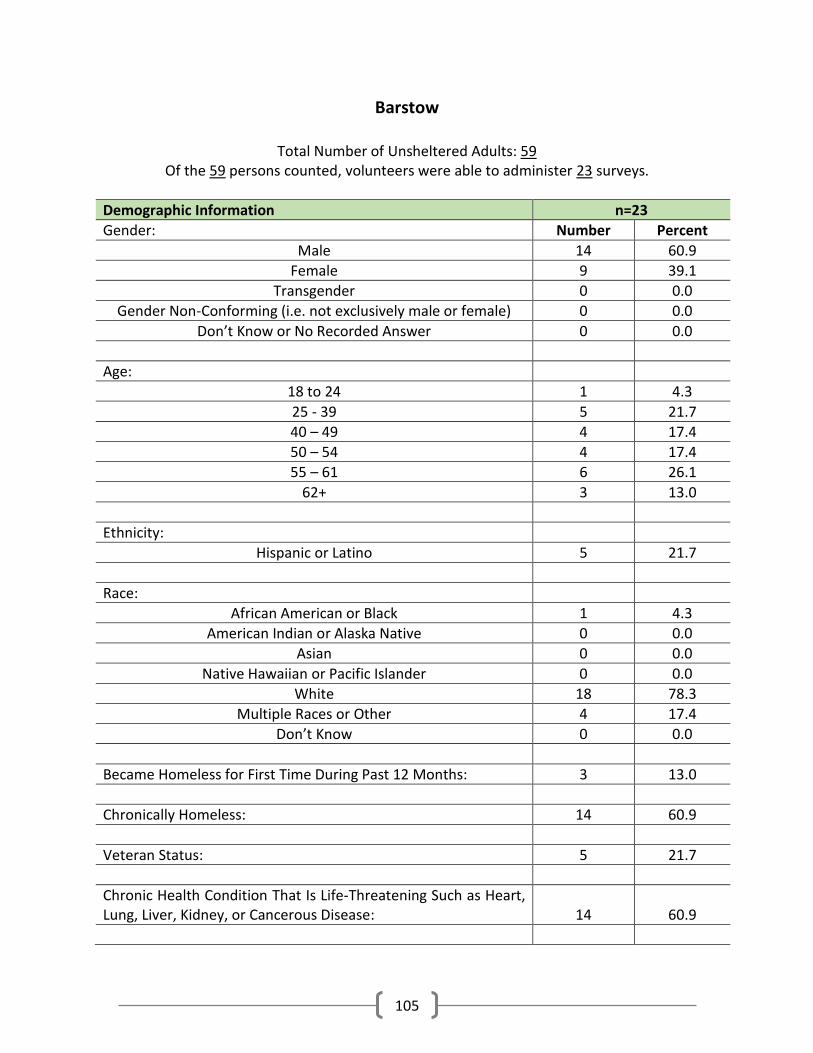
105
Barstow
Total Number of Unsheltered Adults: 59 Of the 59 persons counted, volunteers were able to administer 23 surveys.
Demographic Information n=23
Gender: Number Percent
Male 14 60.9
Female 9 39.1
Transgender 0 0.0
Gender Non-Conforming (i.e. not exclusively male or female) 0 0.0
Don’t Know or No Recorded Answer 0 0.0
Age:
18 to 24 1 4.3
25 - 39 5 21.7
40 – 49 4 17.4
50 – 54 4 17.4
55 – 61 6 26.1
62+ 3 13.0
Ethnicity:
Hispanic or Latino 5 21.7
Race:
African American or Black 1 4.3
American Indian or Alaska Native 0 0.0
Asian 0 0.0
Native Hawaiian or Pacific Islander 0 0.0
White 18 78.3
Multiple Races or Other 4 17.4
Don’t Know 0 0.0
Became Homeless for First Time During Past 12 Months: 3 13.0
Chronically Homeless: 14 60.9
Veteran Status: 5 21.7
Chronic Health Condition That Is Life-Threatening Such as Heart, Lung, Liver, Kidney, or Cancerous Disease:
14 60.9
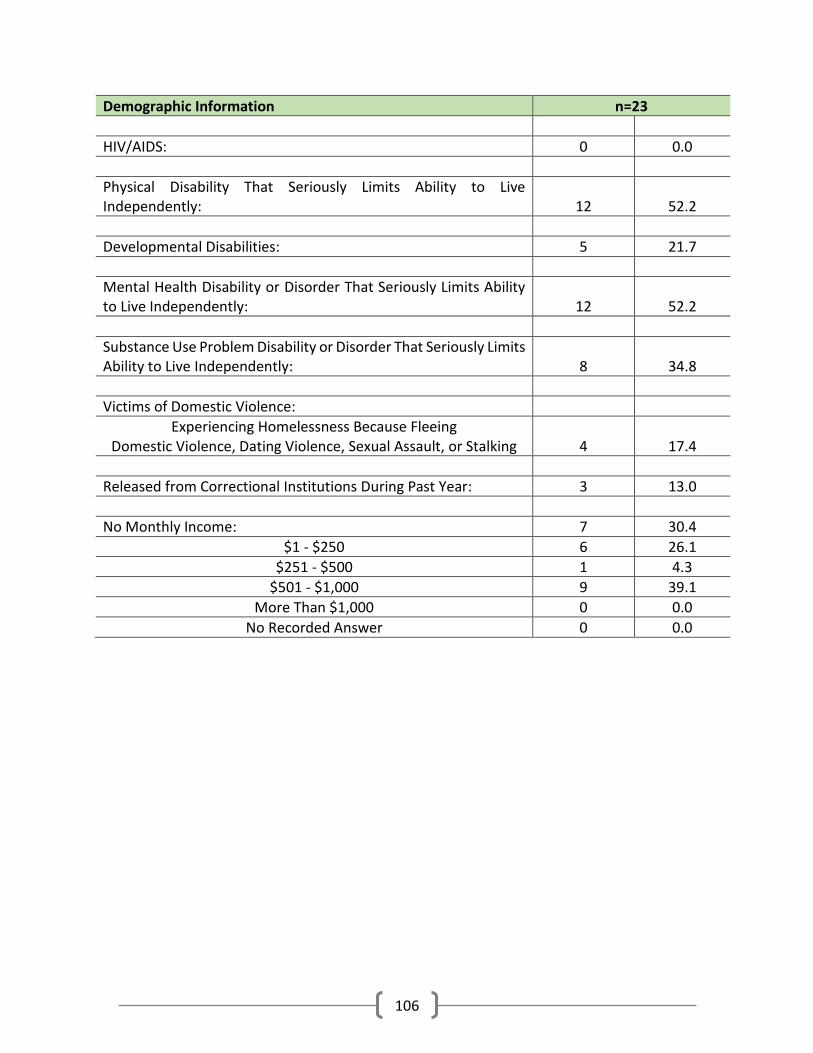
106
Demographic Information n=23
HIV/AIDS: 0 0.0
Physical Disability That Seriously Limits Ability to Live Independently:
12 52.2
Developmental Disabilities: 5 21.7
Mental Health Disability or Disorder That Seriously Limits Ability to Live Independently:
12 52.2
Substance Use Problem Disability or Disorder That Seriously Limits Ability to Live Independently:
8 34.8
Victims of Domestic Violence:
Experiencing Homelessness Because Fleeing Domestic Violence, Dating Violence, Sexual Assault, or Stalking
4 17.4
Released from Correctional Institutions During Past Year: 3 13.0
No Monthly Income: 7 30.4
$1 - $250 6 26.1
$251 - $500 1 4.3
$501 - $1,000 9 39.1
More Than $1,000 0 0.0
No Recorded Answer 0 0.0
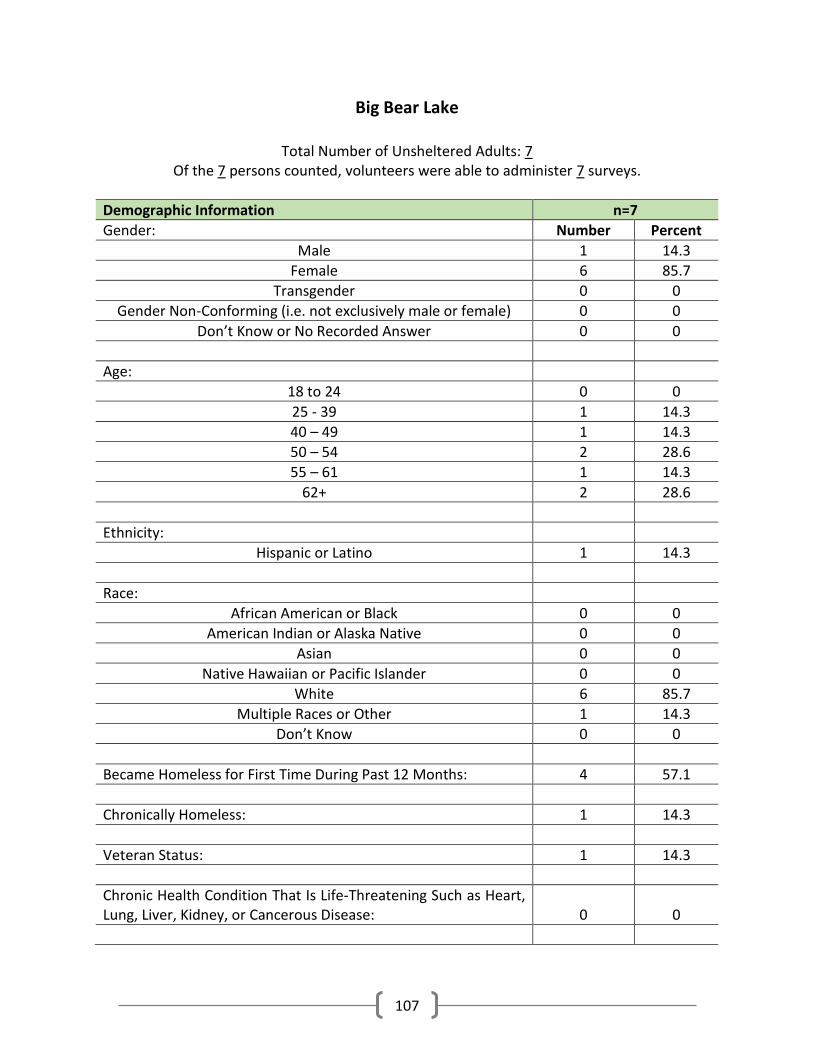
107
Big Bear Lake
Total Number of Unsheltered Adults: 7 Of the 7 persons counted, volunteers were able to administer 7 surveys.
Demographic Information n=7
Gender: Number Percent
Male 1 14.3
Female 6 85.7
Transgender 0 0
Gender Non-Conforming (i.e. not exclusively male or female) 0 0
Don’t Know or No Recorded Answer 0 0
Age:
18 to 24 0 0
25 - 39 1 14.3
40 – 49 1 14.3
50 – 54 2 28.6
55 – 61 1 14.3
62+ 2 28.6
Ethnicity:
Hispanic or Latino 1 14.3
Race:
African American or Black 0 0
American Indian or Alaska Native 0 0
Asian 0 0
Native Hawaiian or Pacific Islander 0 0
White 6 85.7
Multiple Races or Other 1 14.3
Don’t Know 0 0
Became Homeless for First Time During Past 12 Months: 4 57.1
Chronically Homeless: 1 14.3
Veteran Status: 1 14.3
Chronic Health Condition That Is Life-Threatening Such as Heart, Lung, Liver, Kidney, or Cancerous Disease:
0 0

108
Demographic Information n=7
HIV/AIDS: 0 0
Physical Disability That Seriously Limits Ability to Live Independently:
2 28.6
Developmental Disabilities: 0 0
Mental Health Disability or Disorder That Seriously Limits Ability to Live Independently:
0 0
Substance Use Problem Disability or Disorder That Seriously Limits Ability to Live Independently:
0 0
Victims of Domestic Violence:
Experiencing Homelessness Because Fleeing Domestic Violence, Dating Violence, Sexual Assault, or Stalking
0 0
Released from Correctional Institutions During Past Year: 1 14.3
Monthly Income:
No Monthly Income 5 71.4
$1 - $250 1 14.3
$251 - $500 0 0
$501 - $1,000 0 0
More Than $1,000 1 14.3
No Recorded Answer 0 0
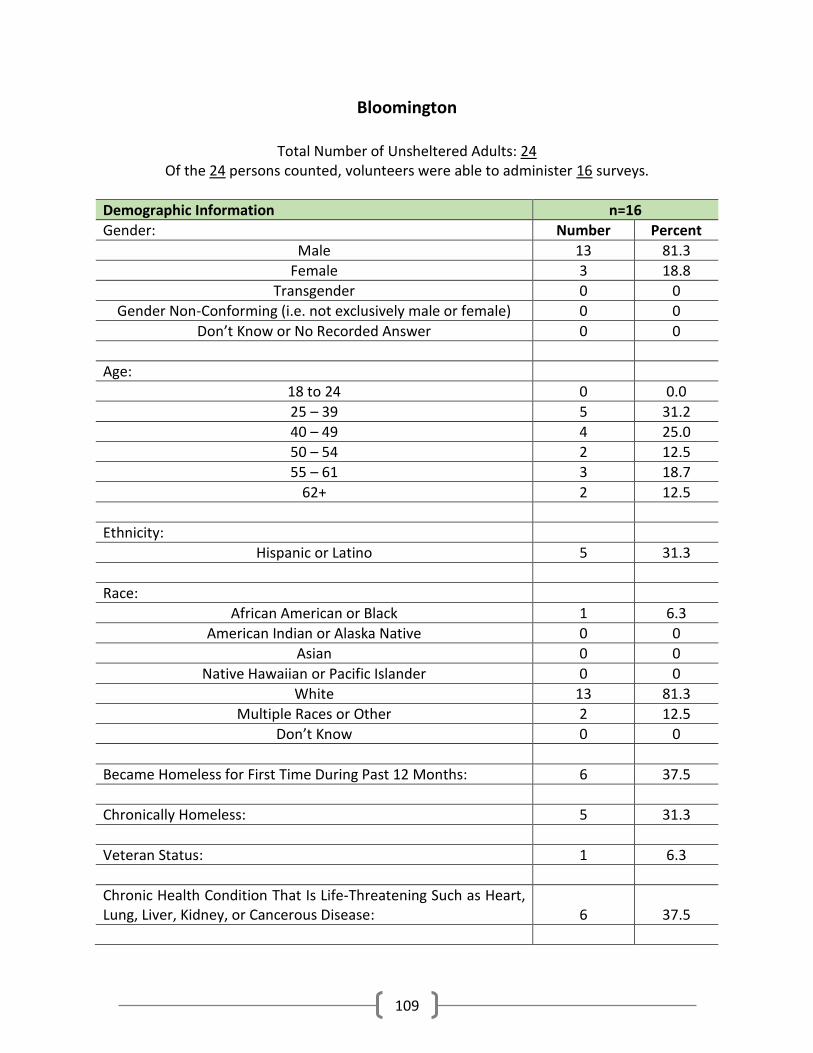
109
Bloomington
Total Number of Unsheltered Adults: 24 Of the 24 persons counted, volunteers were able to administer 16 surveys.
Demographic Information n=16
Gender: Number Percent
Male 13 81.3
Female 3 18.8
Transgender 0 0
Gender Non-Conforming (i.e. not exclusively male or female) 0 0
Don’t Know or No Recorded Answer 0 0
Age:
18 to 24 0 0.0
25 – 39 5 31.2
40 – 49 4 25.0
50 – 54 2 12.5
55 – 61 3 18.7
62+ 2 12.5
Ethnicity:
Hispanic or Latino 5 31.3
Race:
African American or Black 1 6.3
American Indian or Alaska Native 0 0
Asian 0 0
Native Hawaiian or Pacific Islander 0 0
White 13 81.3
Multiple Races or Other 2 12.5
Don’t Know 0 0
Became Homeless for First Time During Past 12 Months: 6 37.5
Chronically Homeless: 5 31.3
Veteran Status: 1 6.3
Chronic Health Condition That Is Life-Threatening Such as Heart, Lung, Liver, Kidney, or Cancerous Disease:
6 37.5
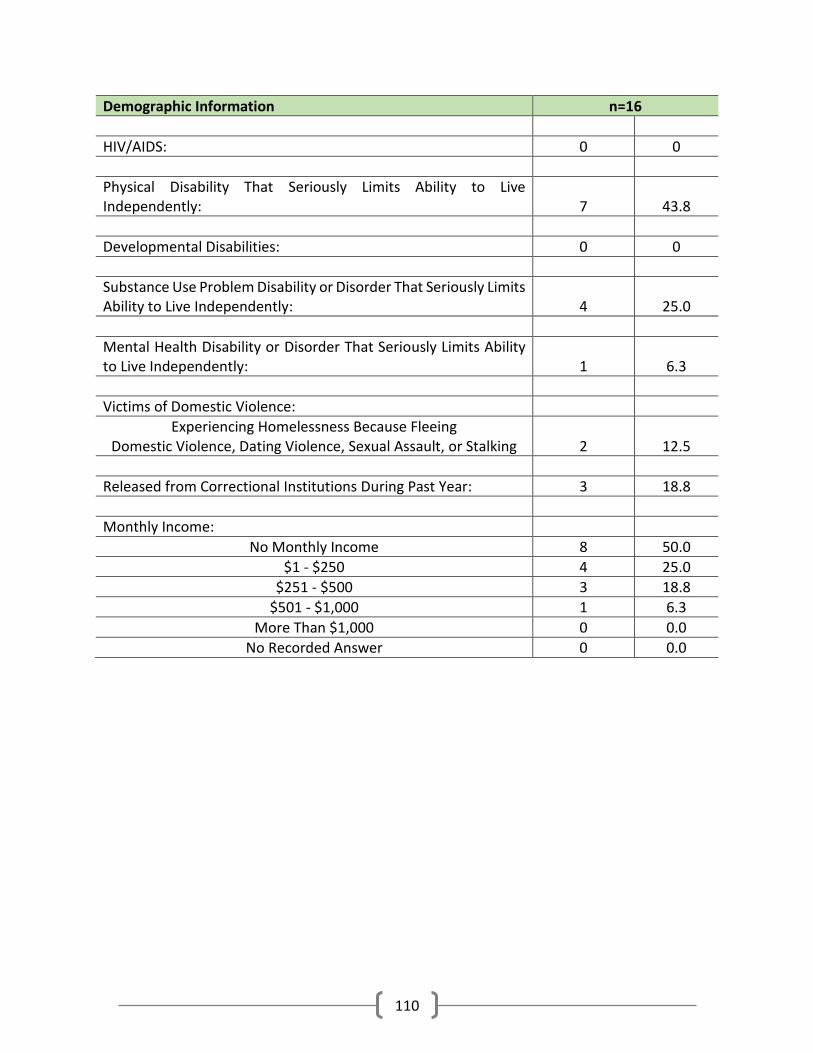
110
Demographic Information n=16
HIV/AIDS: 0 0
Physical Disability That Seriously Limits Ability to Live Independently:
7 43.8
Developmental Disabilities: 0 0
Substance Use Problem Disability or Disorder That Seriously Limits Ability to Live Independently:
4 25.0
Mental Health Disability or Disorder That Seriously Limits Ability to Live Independently:
1 6.3
Victims of Domestic Violence:
Experiencing Homelessness Because Fleeing Domestic Violence, Dating Violence, Sexual Assault, or Stalking
2 12.5
Released from Correctional Institutions During Past Year: 3 18.8
Monthly Income:
No Monthly Income 8 50.0
$1 - $250 4 25.0
$251 - $500 3 18.8
$501 - $1,000 1 6.3
More Than $1,000 0 0.0
No Recorded Answer 0 0.0
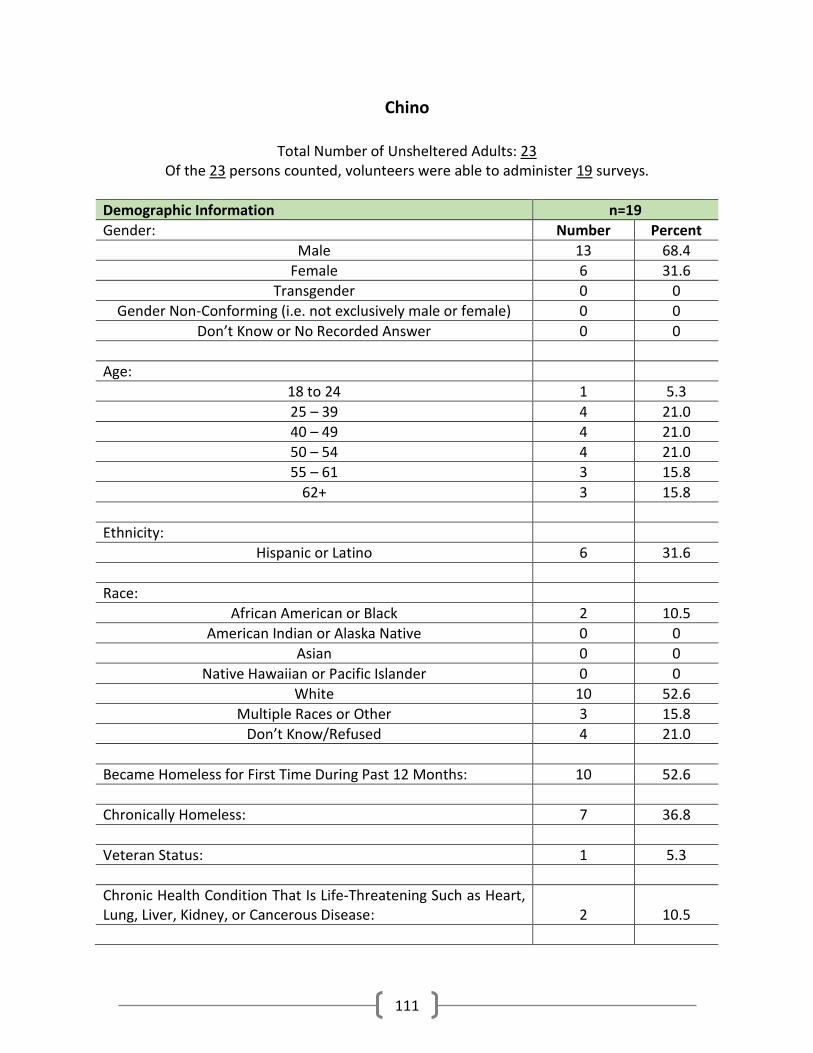
111
Chino
Total Number of Unsheltered Adults: 23 Of the 23 persons counted, volunteers were able to administer 19 surveys.
Demographic Information n=19
Gender: Number Percent
Male 13 68.4
Female 6 31.6
Transgender 0 0
Gender Non-Conforming (i.e. not exclusively male or female) 0 0
Don’t Know or No Recorded Answer 0 0
Age:
18 to 24 1 5.3
25 – 39 4 21.0
40 – 49 4 21.0
50 – 54 4 21.0
55 – 61 3 15.8
62+ 3 15.8
Ethnicity:
Hispanic or Latino 6 31.6
Race:
African American or Black 2 10.5
American Indian or Alaska Native 0 0
Asian 0 0
Native Hawaiian or Pacific Islander 0 0
White 10 52.6
Multiple Races or Other 3 15.8
Don’t Know/Refused 4 21.0
Became Homeless for First Time During Past 12 Months: 10 52.6
Chronically Homeless: 7 36.8
Veteran Status: 1 5.3
Chronic Health Condition That Is Life-Threatening Such as Heart, Lung, Liver, Kidney, or Cancerous Disease:
2 10.5

112
Demographic Information n=19
HIV/AIDS: 0 0
Physical Disability That Seriously Limits Ability to Live Independently:
5 26.3
Developmental Disabilities: 1 5.3
Mental Health Disability or Disorder That Seriously Limits Ability to Live Independently:
2 10.5
Substance Use Problem Disability or Disorder That Seriously Limits Ability to Live Independently:
1 5.3
Victims of Domestic Violence:
Experiencing Homelessness Because Fleeing Domestic Violence, Dating Violence, Sexual Assault, or Stalking
4 21.0
Released from Correctional Institutions During Past Year: 3 15.8
Monthly Income:
No Monthly Income 6 31.6
$1 - $250 4 21.0
$251 - $500 2 10.5
$501 - $1,000 2 10.5
More Than $1,000 5 26.3
No Recorded Answer 0 0
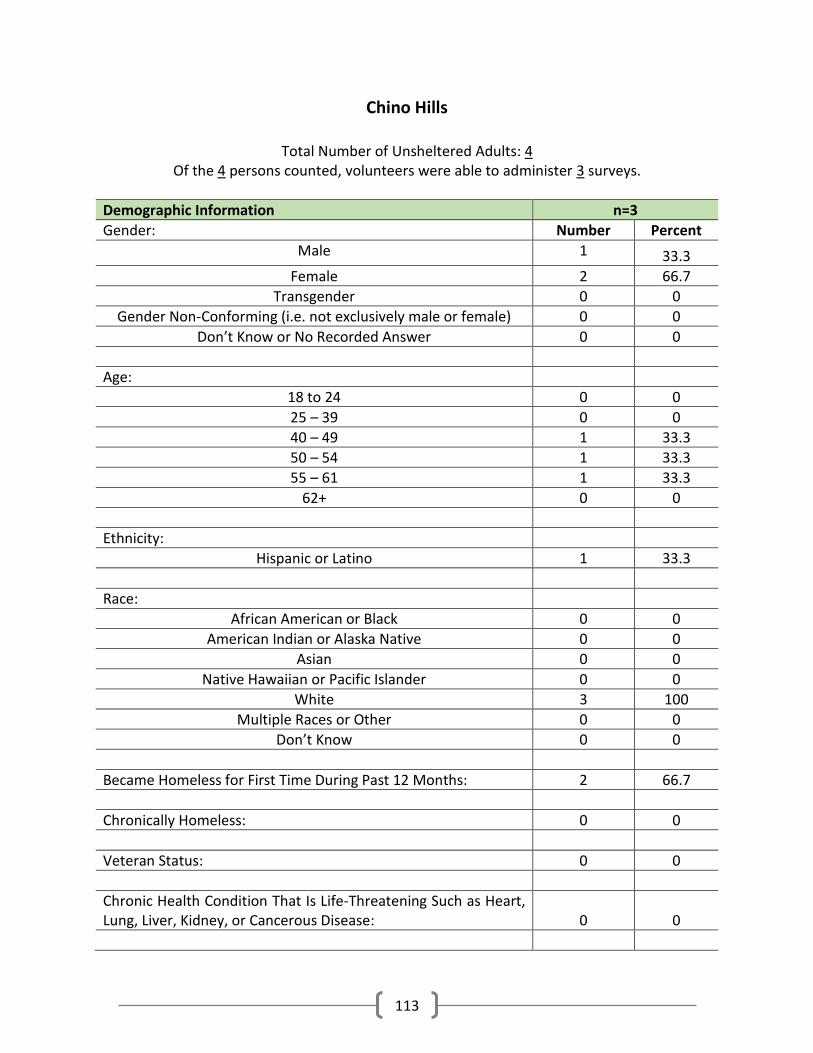
113
Chino Hills
Total Number of Unsheltered Adults: 4 Of the 4 persons counted, volunteers were able to administer 3 surveys.
Demographic Information n=3
Gender: Number Percent
Male 1 33.3
Female 2 66.7
Transgender 0 0
Gender Non-Conforming (i.e. not exclusively male or female) 0 0
Don’t Know or No Recorded Answer 0 0
Age:
18 to 24 0 0
25 – 39 0 0
40 – 49 1 33.3
50 – 54 1 33.3
55 – 61 1 33.3
62+ 0 0
Ethnicity:
Hispanic or Latino 1 33.3
Race:
African American or Black 0 0
American Indian or Alaska Native 0 0
Asian 0 0
Native Hawaiian or Pacific Islander 0 0
White 3 100
Multiple Races or Other 0 0
Don’t Know 0 0
Became Homeless for First Time During Past 12 Months: 2 66.7
Chronically Homeless: 0 0
Veteran Status: 0 0
Chronic Health Condition That Is Life-Threatening Such as Heart, Lung, Liver, Kidney, or Cancerous Disease:
0 0

114
Demographic Information n=3
HIV/AIDS: 0 0
Physical Disability That Seriously Limits Ability to Live Independently:
0 0
Developmental Disabilities: 0 0
Mental Health Disability or Disorder That Seriously Limits Ability to Live Independently:
1 33.3
Substance Use Problem Disability or Disorder That Seriously Limits Ability to Live Independently:
0 0
Victims of Domestic Violence:
Experiencing Homelessness Because Fleeing Domestic Violence, Dating Violence, Sexual Assault, or Stalking
0 0
Released from Correctional Institutions During Past Year: 0 0
Monthly Income:
No Monthly Income 3 100
$1 - $250 0 0
$251 - $500 0 0
$501 - $1,000 0 0
More Than $1,000 0 0
No Recorded Answer 0 0

115
Colton
Total Number of Unsheltered Adults: 58 Of the 58 persons counted, volunteers were able to administer 51 surveys.
Demographic Information n=51
Gender: Number Percent
Male 34 66.7
Female 17 33.3
Transgender 0 0
Gender Non-Conforming (i.e. not exclusively male or female) 0 0
Don’t Know or No Recorded Answer 0 0
Age:
18 to 24 2 4.0
25 - 39 18 35.2
40 – 49 9 17.6
50 – 54 6 11.7
55 – 61 11 21.2
62+ 5 10.0
Ethnicity:
Hispanic or Latino 18 35.3
Race:
African American or Black 4 7.8
American Indian or Alaska Native 2 4.0
Asian 1 2.0
Native Hawaiian or Pacific Islander 0 0
White 28 54.9
Multiple Races or Other 13 25.4
Don’t Know/Refused 3 5.9
Became Homeless for First Time During Past 12 Months: 15 29.4
Chronically Homeless: 16 31.4
Veteran Status: 4 7.8
Chronic Health Condition That Is Life-Threatening Such as Heart, Lung, Liver, Kidney, or Cancerous Disease:
8 15.7

116
Demographic Information n=51
HIV/AIDS: 1 2.0
Physical Disability That Seriously Limits Ability to Live Independently:
14 27.5
Developmental Disabilities: 3 5.9
Mental Health Disability or Disorder That Seriously Limits Ability to Live Independently:
12 23.5
Substance Use Problem Disability or Disorder That Seriously Limits Ability to Live Independently:
11 21.6
Victims of Domestic Violence:
Experiencing Homelessness Because Fleeing Domestic Violence, Dating Violence, Sexual Assault, or Stalking
1 2.0
Released from Correctional Institutions During Past Year: 7 13.7
Monthly Income:
No Monthly Income 34 66.7
$1 - $250 11 21.6
$251 - $500 3 5.9
$501 - $1,000 2 3.9
More Than $1,000 1 2.0
No Recorded Answer/Refused 0 0.0
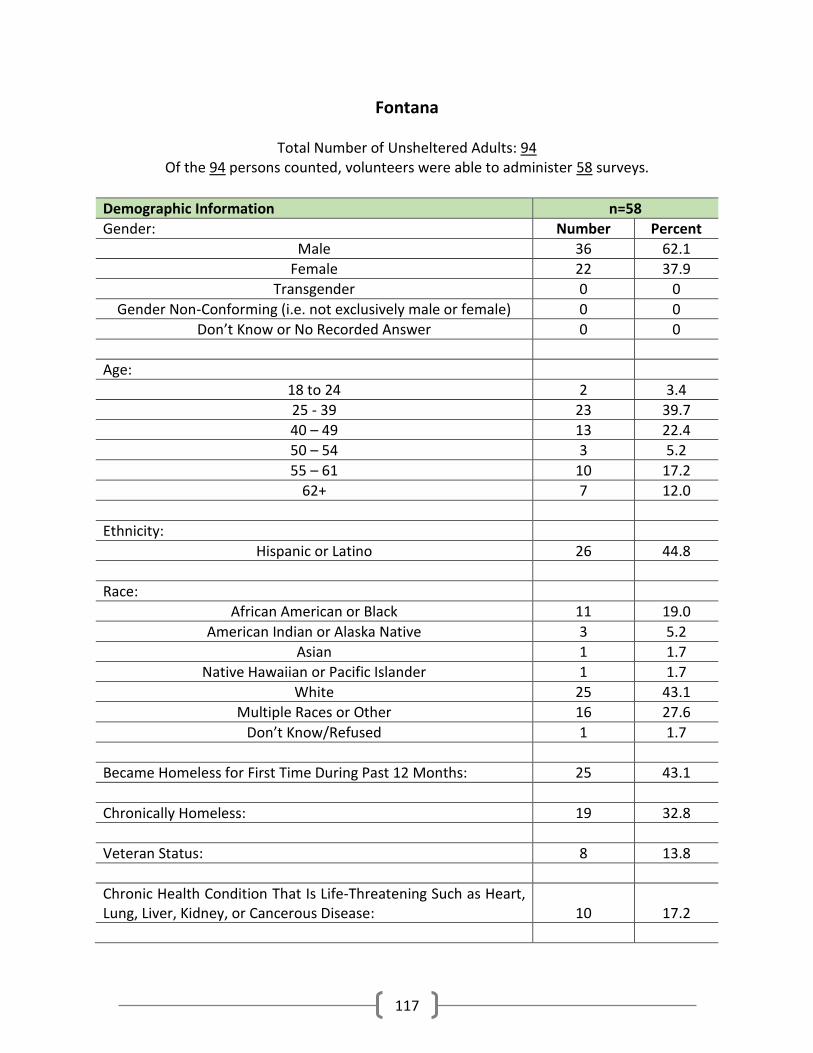
117
Fontana
Total Number of Unsheltered Adults: 94 Of the 94 persons counted, volunteers were able to administer 58 surveys.
Demographic Information n=58
Gender: Number Percent
Male 36 62.1
Female 22 37.9
Transgender 0 0
Gender Non-Conforming (i.e. not exclusively male or female) 0 0
Don’t Know or No Recorded Answer 0 0
Age:
18 to 24 2 3.4
25 - 39 23 39.7
40 – 49 13 22.4
50 – 54 3 5.2
55 – 61 10 17.2
62+ 7 12.0
Ethnicity:
Hispanic or Latino 26 44.8
Race:
African American or Black 11 19.0
American Indian or Alaska Native 3 5.2
Asian 1 1.7
Native Hawaiian or Pacific Islander 1 1.7
White 25 43.1
Multiple Races or Other 16 27.6
Don’t Know/Refused 1 1.7
Became Homeless for First Time During Past 12 Months: 25 43.1
Chronically Homeless: 19 32.8
Veteran Status: 8 13.8
Chronic Health Condition That Is Life-Threatening Such as Heart, Lung, Liver, Kidney, or Cancerous Disease:
10 17.2

118
Demographic Information n=58
HIV/AIDS: 1 1.7
Physical Disability That Seriously Limits Ability to Live Independently:
15 25.9
Developmental Disabilities: 3 5.2
Mental Health Disability or Disorder That Seriously Limits Ability to Live Independently:
8 13.8
Substance Use Problem Disability or Disorder That Seriously Limits Ability to Live Independently:
4 6.9
Victims of Domestic Violence:
Experiencing Homelessness Because Fleeing Domestic Violence, Dating Violence, Sexual Assault, or Stalking
4 6.9
Released from Correctional Institutions During Past Year: 13 22.4
Monthly Income:
No Monthly Income 34 58.6
$1 - $250 8 13.8
$251 - $500 3 5.2
$501 - $1,000 10 17.2
More Than $1,000 3 5.2
No Recorded Answer 0 0
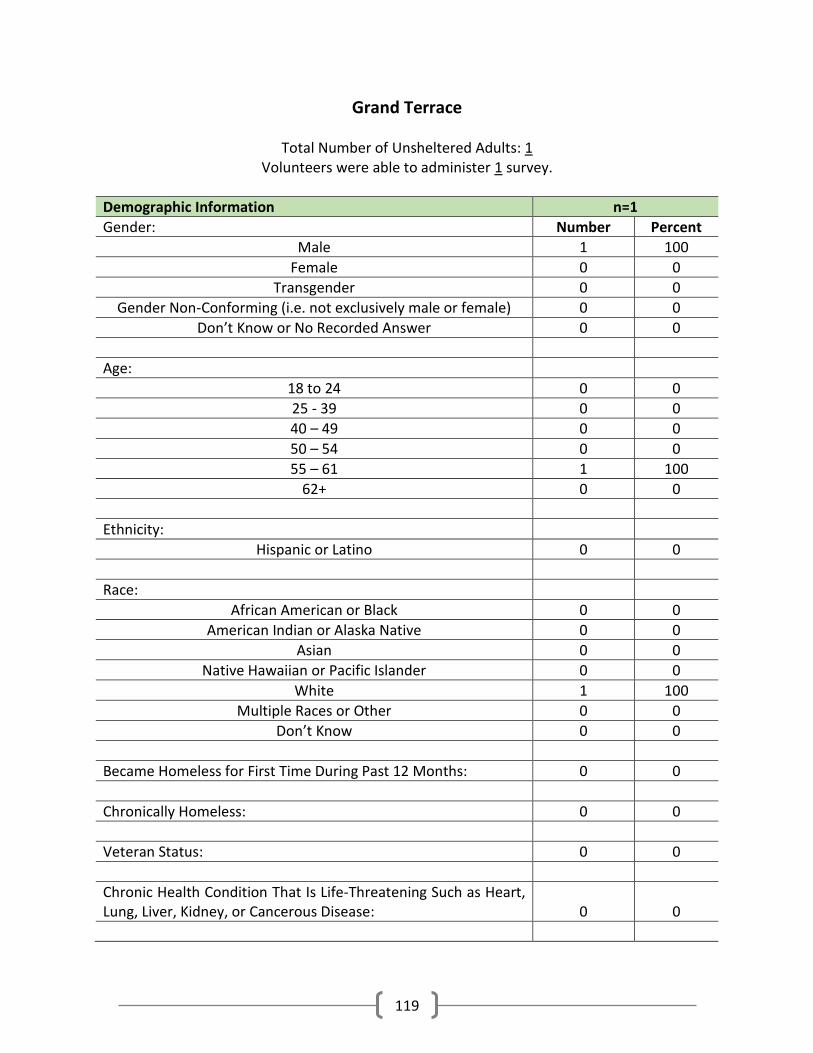
119
Grand Terrace
Total Number of Unsheltered Adults: 1 Volunteers were able to administer 1 survey.
Demographic Information n=1
Gender: Number Percent
Male 1 100
Female 0 0
Transgender 0 0
Gender Non-Conforming (i.e. not exclusively male or female) 0 0
Don’t Know or No Recorded Answer 0 0
Age:
18 to 24 0 0
25 - 39 0 0
40 – 49 0 0
50 – 54 0 0
55 – 61 1 100
62+ 0 0
Ethnicity:
Hispanic or Latino 0 0
Race:
African American or Black 0 0
American Indian or Alaska Native 0 0
Asian 0 0
Native Hawaiian or Pacific Islander 0 0
White 1 100
Multiple Races or Other 0 0
Don’t Know 0 0
Became Homeless for First Time During Past 12 Months: 0 0
Chronically Homeless: 0 0
Veteran Status: 0 0
Chronic Health Condition That Is Life-Threatening Such as Heart, Lung, Liver, Kidney, or Cancerous Disease:
0 0

120
Demographic Information n=1
HIV/AIDS: 0 0
Physical Disability That Seriously Limits Ability to Live Independently:
0 0
Developmental Disabilities: 0 0
Mental Health Disability or Disorder That Seriously Limits Ability to Live Independently:
0 0
Substance Use Problem Disability or Disorder That Seriously Limits Ability to Live Independently:
0 0
Victims of Domestic Violence:
Experiencing Homelessness Because Fleeing Domestic Violence, Dating Violence, Sexual Assault, or Stalking
0 0
Released from Correctional Institutions During Past Year: 0 0
Monthly Income:
No Monthly Income 1 100
$1 - $250 0 0
$251 - $500 0 0
$501 - $1,000 0 0
More Than $1,000 0 0
No Recorded Answer 0 0

121
Hesperia
Total Number of Unsheltered Adults: 21 Of the 21 persons counted, volunteers were able to administer 15 surveys.
Demographic Information n=15
Gender: Number Percent
Male 14 93.3
Female 1 6.7
Transgender 0 0
Gender Non-Conforming (i.e. not exclusively male or female) 0 0
Don’t Know or No Recorded Answer 0 0
Age:
18 to 24 3 20.0
25 - 39 4 26.7
40 – 49 1 6.7
50 – 54 2 13.3
55 – 61 2 13.3
62+ 3 20.0
Ethnicity:
Hispanic or Latino 4 26.7
Race:
African American or Black 2 13.3
American Indian or Alaska Native 0 0
Asian 0 0
Native Hawaiian or Pacific Islander 0 0
White 11 73.3
Multiple Races or Other 0 0
Don’t Know/refused 2 13.3
Became Homeless for First Time During Past 12 Months: 6 40
Chronically Homeless: 5 33.3
Veteran Status: 1 6.7
Chronic Health Condition That Is Life-Threatening Such as Heart, Lung, Liver, Kidney, or Cancerous Disease:
4 26.7

122
Demographic Information n=15
HIV/AIDS: 0 0
Physical Disability That Seriously Limits Ability to Live Independently:
1 6.7
Developmental Disabilities: 1 6.7
Mental Health Disability or Disorder That Seriously Limits Ability to Live Independently:
2 13.3
Substance Use Problem Disability or Disorder That Seriously Limits Ability to Live Independently:
3 20.0
Victims of Domestic Violence:
Experiencing Homelessness Because Fleeing Domestic Violence, Dating Violence, Sexual Assault, or Stalking
1 6.7
Released from Correctional Institutions During Past Year: 6 40.0
Monthly Income:
No Monthly Income 10 66.7
$1 - $250 1 6.7
$251 - $500 0 0
$501 - $1,000 1 6.7
More Than $1,000 2 13.3
No Recorded Answer 1 6.7

123
Highland
Total Number of Unsheltered Adults: 72 Of the 72 persons counted, volunteers were able to administer 42 surveys.
Demographic Information n=42
Gender: Number Percent
Male 29 69
Female 13 31
Transgender 0 0
Gender Non-Conforming (i.e. not exclusively male or female) 0 0
Don’t Know or No Recorded Answer 0 0
Age:
18 to 24 1 2.3 25 - 39 14 33.3 40 – 49 13 31.0 50 – 54 4 9.5 55 – 61 8 19.0
62+ 2 4.8
Ethnicity:
Hispanic or Latino 9 21.4
Race:
African American or Black 11 26.2
American Indian or Alaska Native 3 7.1
Asian 0 0
Native Hawaiian or Pacific Islander 0 0
White 22 52.4
Multiple Races or Other 2 4.8
Don’t Know/Refused 4 9.5
Became Homeless for First Time During Past 12 Months: 13 31.0
Chronically Homeless: 19 45.2
Veteran Status: 5 11.9
Chronic Health Condition That Is Life-Threatening Such as Heart, Lung, Liver, Kidney, or Cancerous Disease:
4 9.5
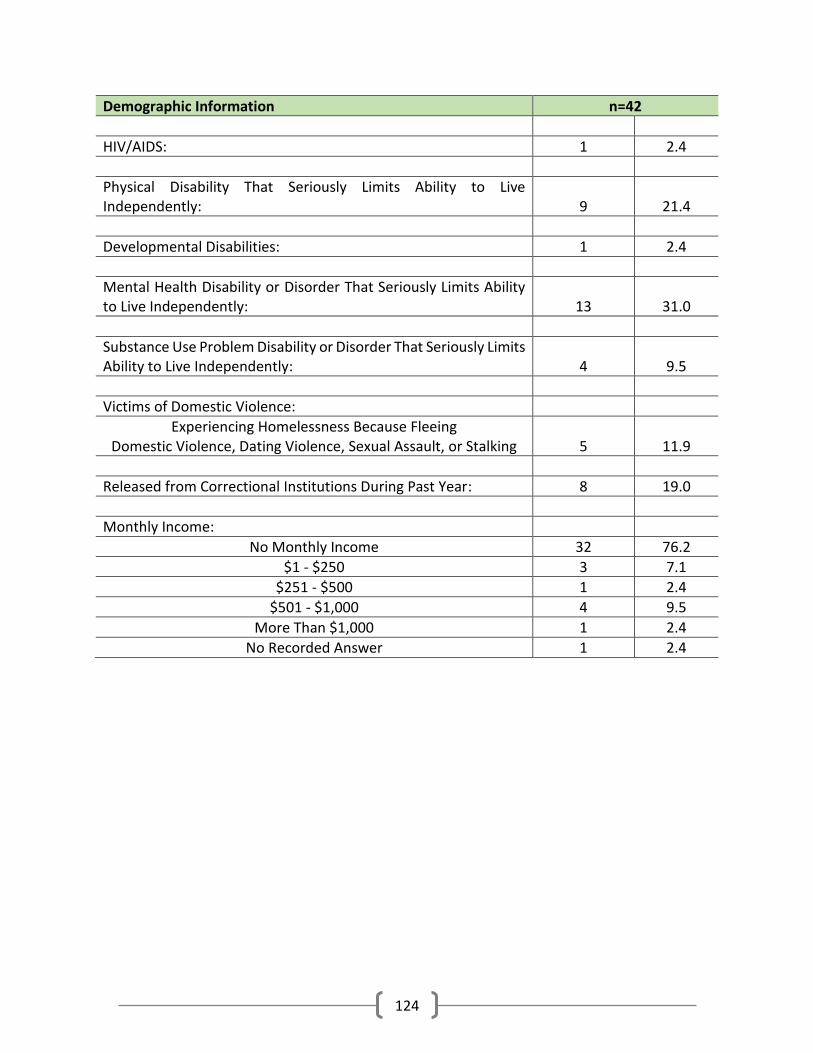
124
Demographic Information n=42
HIV/AIDS: 1 2.4
Physical Disability That Seriously Limits Ability to Live Independently:
9 21.4
Developmental Disabilities: 1 2.4
Mental Health Disability or Disorder That Seriously Limits Ability to Live Independently:
13 31.0
Substance Use Problem Disability or Disorder That Seriously Limits Ability to Live Independently:
4 9.5
Victims of Domestic Violence:
Experiencing Homelessness Because Fleeing Domestic Violence, Dating Violence, Sexual Assault, or Stalking
5 11.9
Released from Correctional Institutions During Past Year: 8 19.0
Monthly Income:
No Monthly Income 32 76.2
$1 - $250 3 7.1
$251 - $500 1 2.4
$501 - $1,000 4 9.5
More Than $1,000 1 2.4
No Recorded Answer 1 2.4
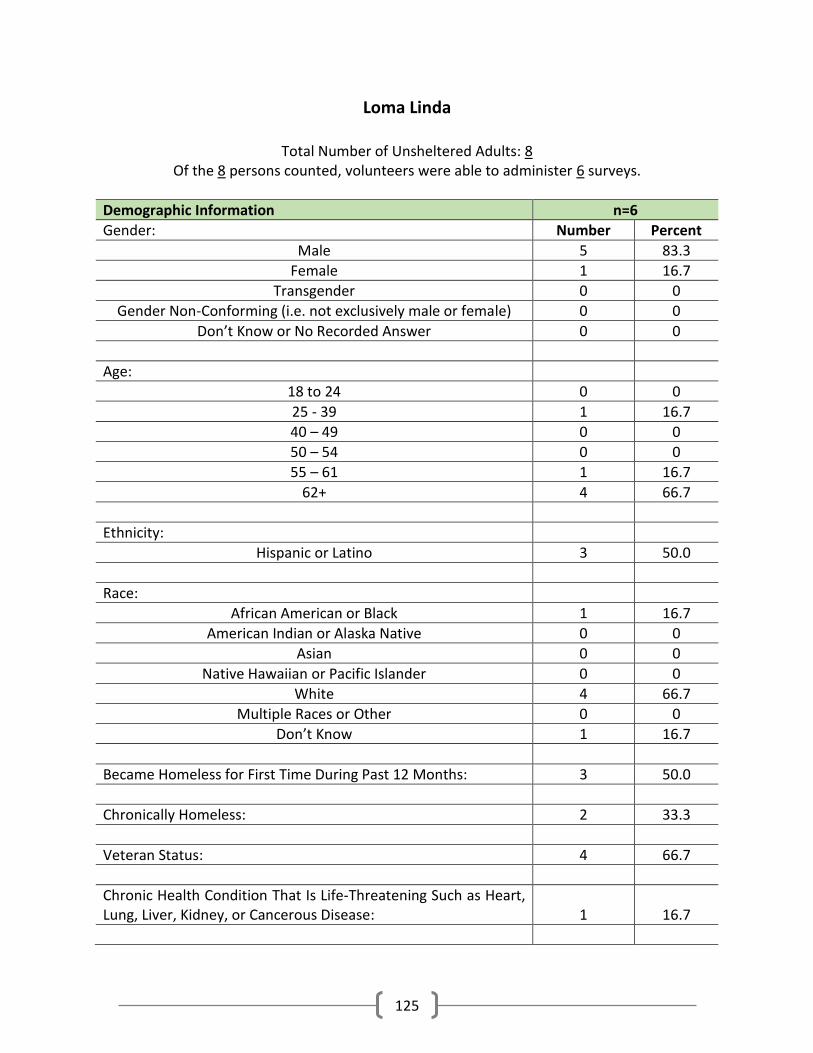
125
Loma Linda
Total Number of Unsheltered Adults: 8 Of the 8 persons counted, volunteers were able to administer 6 surveys.
Demographic Information n=6
Gender: Number Percent
Male 5 83.3
Female 1 16.7
Transgender 0 0
Gender Non-Conforming (i.e. not exclusively male or female) 0 0
Don’t Know or No Recorded Answer 0 0
Age:
18 to 24 0 0
25 - 39 1 16.7
40 – 49 0 0
50 – 54 0 0
55 – 61 1 16.7
62+ 4 66.7
Ethnicity:
Hispanic or Latino 3 50.0
Race:
African American or Black 1 16.7
American Indian or Alaska Native 0 0
Asian 0 0
Native Hawaiian or Pacific Islander 0 0
White 4 66.7
Multiple Races or Other 0 0
Don’t Know 1 16.7
Became Homeless for First Time During Past 12 Months: 3 50.0
Chronically Homeless: 2 33.3
Veteran Status: 4 66.7
Chronic Health Condition That Is Life-Threatening Such as Heart, Lung, Liver, Kidney, or Cancerous Disease:
1 16.7

126
Demographic Information n=6
HIV/AIDS: 1 16.7
Physical Disability That Seriously Limits Ability to Live Independently:
1 16.7
Developmental Disabilities: 1 16.7
Mental Health Disability or Disorder That Seriously Limits Ability to Live Independently:
1 16.7
Substance Use Problem Disability or Disorder That Seriously Limits Ability to Live Independently:
1 16.7
Victims of Domestic Violence:
Experiencing Homelessness Because Fleeing Domestic Violence, Dating Violence, Sexual Assault, or Stalking
1 16.7
Released from Correctional Institutions During Past Year: 3 50.0
Monthly Income:
No Monthly Income 3 50.0
$1 - $250 3 50.0
$251 - $500 0 0
$501 - $1,000 0 0
More Than $1,000 0 0
No Recorded Answer 0 0
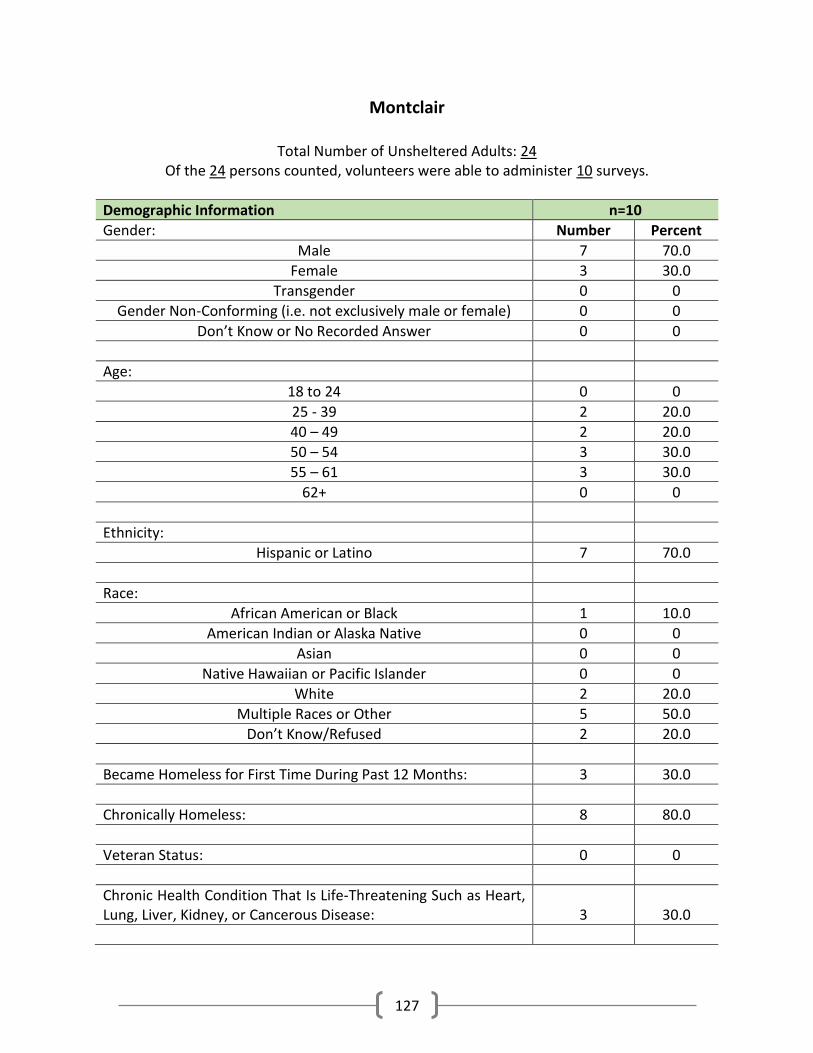
127
Montclair
Total Number of Unsheltered Adults: 24 Of the 24 persons counted, volunteers were able to administer 10 surveys.
Demographic Information n=10
Gender: Number Percent
Male 7 70.0
Female 3 30.0
Transgender 0 0
Gender Non-Conforming (i.e. not exclusively male or female) 0 0
Don’t Know or No Recorded Answer 0 0
Age:
18 to 24 0 0
25 - 39 2 20.0
40 – 49 2 20.0
50 – 54 3 30.0
55 – 61 3 30.0
62+ 0 0
Ethnicity:
Hispanic or Latino 7 70.0
Race:
African American or Black 1 10.0
American Indian or Alaska Native 0 0
Asian 0 0
Native Hawaiian or Pacific Islander 0 0
White 2 20.0
Multiple Races or Other 5 50.0
Don’t Know/Refused 2 20.0
Became Homeless for First Time During Past 12 Months: 3 30.0
Chronically Homeless: 8 80.0
Veteran Status: 0 0
Chronic Health Condition That Is Life-Threatening Such as Heart, Lung, Liver, Kidney, or Cancerous Disease:
3 30.0

128
Demographic Information n=10
HIV/AIDS: 0 0
Physical Disability That Seriously Limits Ability to Live Independently:
1 10.0
Developmental Disabilities: 0 0
Mental Health Disability or Disorder That Seriously Limits Ability to Live Independently:
4 40.0
Substance Use Problem Disability or Disorder That Seriously Limits Ability to Live Independently:
5 50.0
Victims of Domestic Violence:
Experiencing Homelessness Because Fleeing Domestic Violence, Dating Violence, Sexual Assault, or Stalking
0 0
Released from Correctional Institutions During Past Year: 6 60.0
Monthly Income:
No Monthly Income 5 50.0
$1 - $250 3 30.0
$251 - $500 1 10.0
$501 - $1,000 1 10.0
More Than $1,000 0 0
No Recorded Answer 0 0

129
Needles
Total Number of Unsheltered Adults: 29 Of the 29 persons counted, volunteers were able to administer 23 surveys.
Demographic Information n=23
Gender: Number Percent
Male 18 78.3
Female 4 17.4
Transgender 1 4.3
Gender Non-Conforming (i.e. not exclusively male or female) 0 0
Don’t Know or No Recorded Answer 0 0
Age:
18 to 24 1 4.3
25 - 39 5 21.7
40 – 49 3 13.0
50 – 54 0 0
55 – 61 8 34.8
62+ 6 26.1
Ethnicity:
Hispanic or Latino 3 13.0
Race:
African American or Black 0 0
American Indian or Alaska Native 2 8.7
Asian 0 0
Native Hawaiian or Pacific Islander 2 8.7
White 19 82.6
Multiple Races or Other 0 0
Don’t Know
Became Homeless for First Time During Past 12 Months: 7 30.4
Chronically Homeless: 17 73.9
Veteran Status: 3 13.0
Chronic Health Condition That Is Life-Threatening Such as Heart, Lung, Liver, Kidney, or Cancerous Disease:
4 17.4

130
Demographic Information n=23
HIV/AIDS: 0 0
Physical Disability That Seriously Limits Ability to Live Independently:
10 43.5
Developmental Disabilities: 6 26.1
Mental Health Disability or Disorder That Seriously Limits Ability to Live Independently:
12 52.2
Substance Use Problem Disability or Disorder That Seriously Limits Ability to Live Independently:
11 47.8
Victims of Domestic Violence:
Experiencing Homelessness Because Fleeing Domestic Violence, Dating Violence, Sexual Assault, or Stalking
1 4.3
Released from Correctional Institutions During Past Year: 2 8.7
Monthly Income:
No Monthly Income 13 56.5
$1 - $250 0 0
$251 - $500 1 4.3
$501 - $1,000 7 30.4
More Than $1,000 2 8.7
No Recorded Answer 0 0
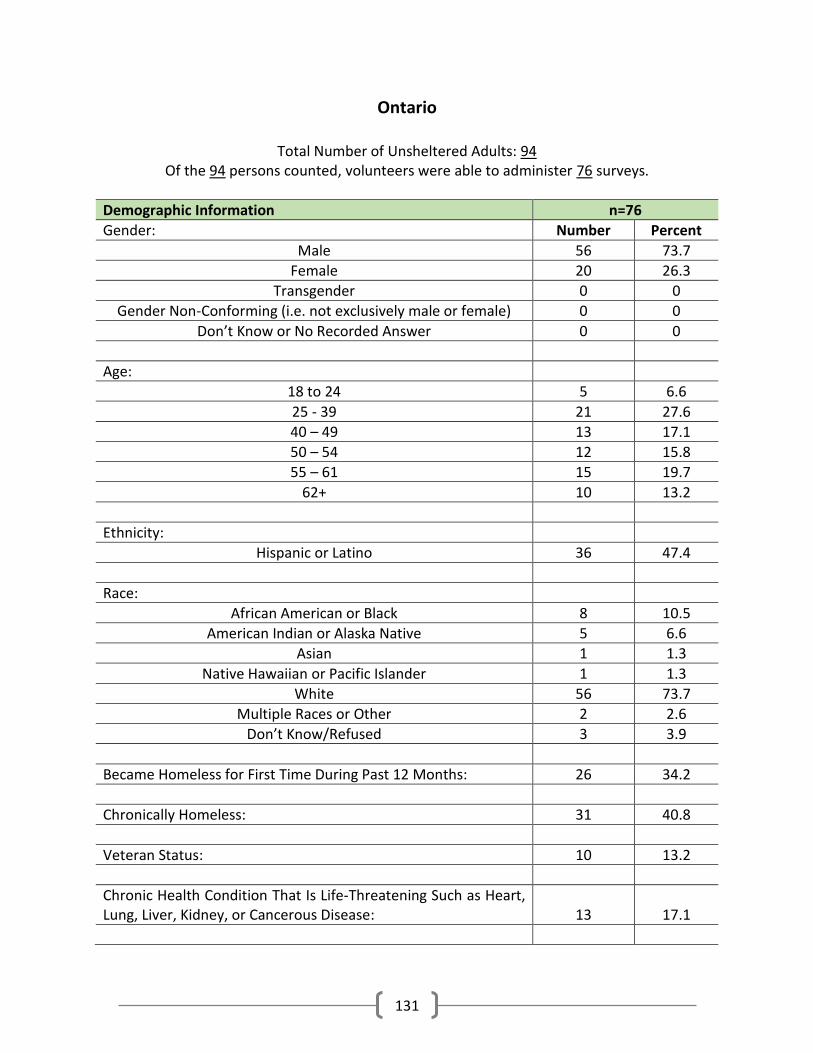
131
Ontario
Total Number of Unsheltered Adults: 94 Of the 94 persons counted, volunteers were able to administer 76 surveys.
Demographic Information n=76
Gender: Number Percent
Male 56 73.7
Female 20 26.3
Transgender 0 0
Gender Non-Conforming (i.e. not exclusively male or female) 0 0
Don’t Know or No Recorded Answer 0 0
Age:
18 to 24 5 6.6
25 - 39 21 27.6
40 – 49 13 17.1
50 – 54 12 15.8
55 – 61 15 19.7
62+ 10 13.2
Ethnicity:
Hispanic or Latino 36 47.4
Race:
African American or Black 8 10.5
American Indian or Alaska Native 5 6.6
Asian 1 1.3
Native Hawaiian or Pacific Islander 1 1.3
White 56 73.7
Multiple Races or Other 2 2.6
Don’t Know/Refused 3 3.9
Became Homeless for First Time During Past 12 Months: 26 34.2
Chronically Homeless: 31 40.8
Veteran Status: 10 13.2
Chronic Health Condition That Is Life-Threatening Such as Heart, Lung, Liver, Kidney, or Cancerous Disease:
13 17.1
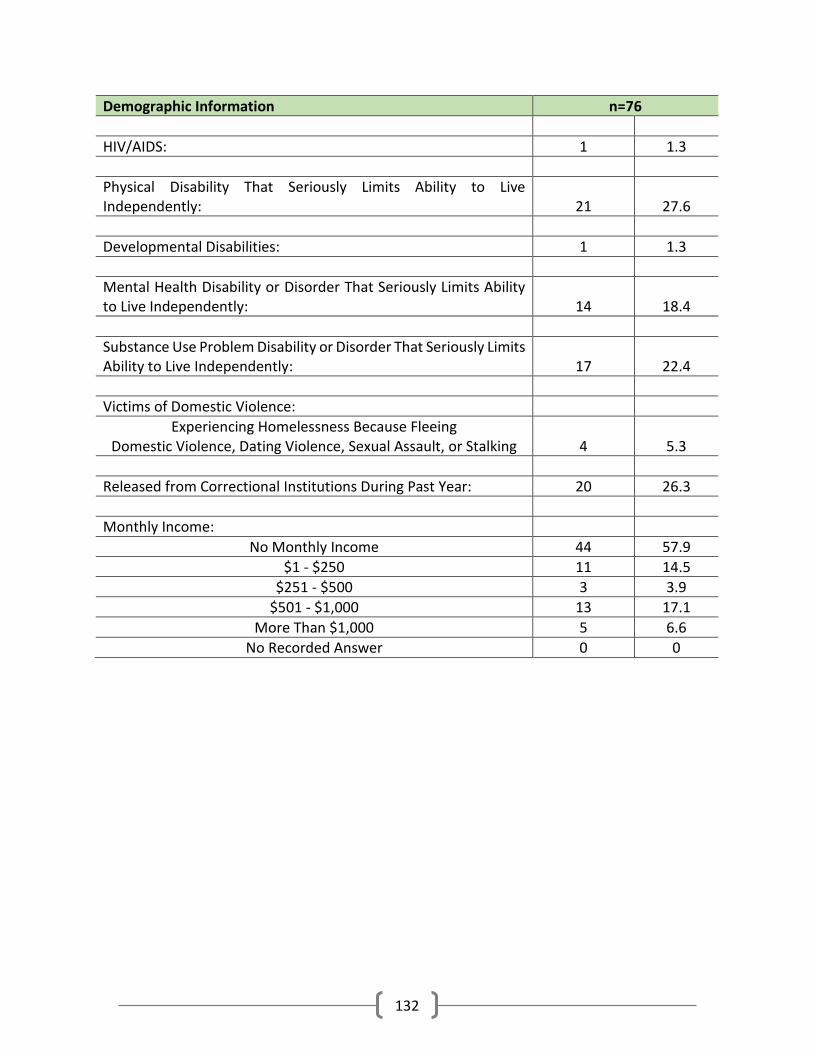
132
Demographic Information n=76
HIV/AIDS: 1 1.3
Physical Disability That Seriously Limits Ability to Live Independently:
21 27.6
Developmental Disabilities: 1 1.3
Mental Health Disability or Disorder That Seriously Limits Ability to Live Independently:
14 18.4
Substance Use Problem Disability or Disorder That Seriously Limits Ability to Live Independently:
17 22.4
Victims of Domestic Violence:
Experiencing Homelessness Because Fleeing Domestic Violence, Dating Violence, Sexual Assault, or Stalking
4 5.3
Released from Correctional Institutions During Past Year: 20 26.3
Monthly Income:
No Monthly Income 44 57.9
$1 - $250 11 14.5
$251 - $500 3 3.9
$501 - $1,000 13 17.1
More Than $1,000 5 6.6
No Recorded Answer 0 0

133
Rancho Cucamonga
Total Number of Unsheltered Adults: 48 Of the 48 persons counted, volunteers were able to administer 31 surveys.
Demographic Information n=31
Gender: Number Percent
Male 25 80.6
Female 6 19.4
Transgender 0 0
Gender Non-Conforming (i.e. not exclusively male or female) 0 0
Don’t Know or No Recorded Answer 0 0
Age:
18 to 24 1 3.2
25 - 39 14 45.1
40 – 49 4 12.9
50 – 54 3 9.7
55 – 61 5 16.1
62+ 4 12.9
Ethnicity:
Hispanic or Latino 3 9.7
Race:
African American or Black 7 22.6
American Indian or Alaska Native 0 0
Asian 1 3.2
Native Hawaiian or Pacific Islander 1 3.2
White 19 61.3
Multiple Races or Other 2 6.5
Don’t Know/Refused 1 3.2
Became Homeless for First Time During Past 12 Months: 9 29.0
Chronically Homeless: 14 45.2
Veteran Status: 3 9.7
Chronic Health Condition That Is Life-Threatening Such as Heart, Lung, Liver, Kidney, or Cancerous Disease:
6 19.4

134
Demographic Information n=31
HIV/AIDS: 0 0
Physical Disability That Seriously Limits Ability to Live Independently:
8 25.8
Developmental Disabilities: 2 6.5
Mental Health Disability or Disorder That Seriously Limits Ability to Live Independently:
6 19.4
Substance Use Problem Disability or Disorder That Seriously Limits Ability to Live Independently:
7 22.6
Victims of Domestic Violence:
Experiencing Homelessness Because Fleeing Domestic Violence, Dating Violence, Sexual Assault, or Stalking
5 16.1
Released from Correctional Institutions During Past Year: 9 29.0
Monthly Income:
No Monthly Income 15 48.4
$1 - $250 3 9.7
$251 - $500 1 3.2
$501 - $1,000 4 12.9
More Than $1,000 6 19.4
No Recorded Answer 2 6.5
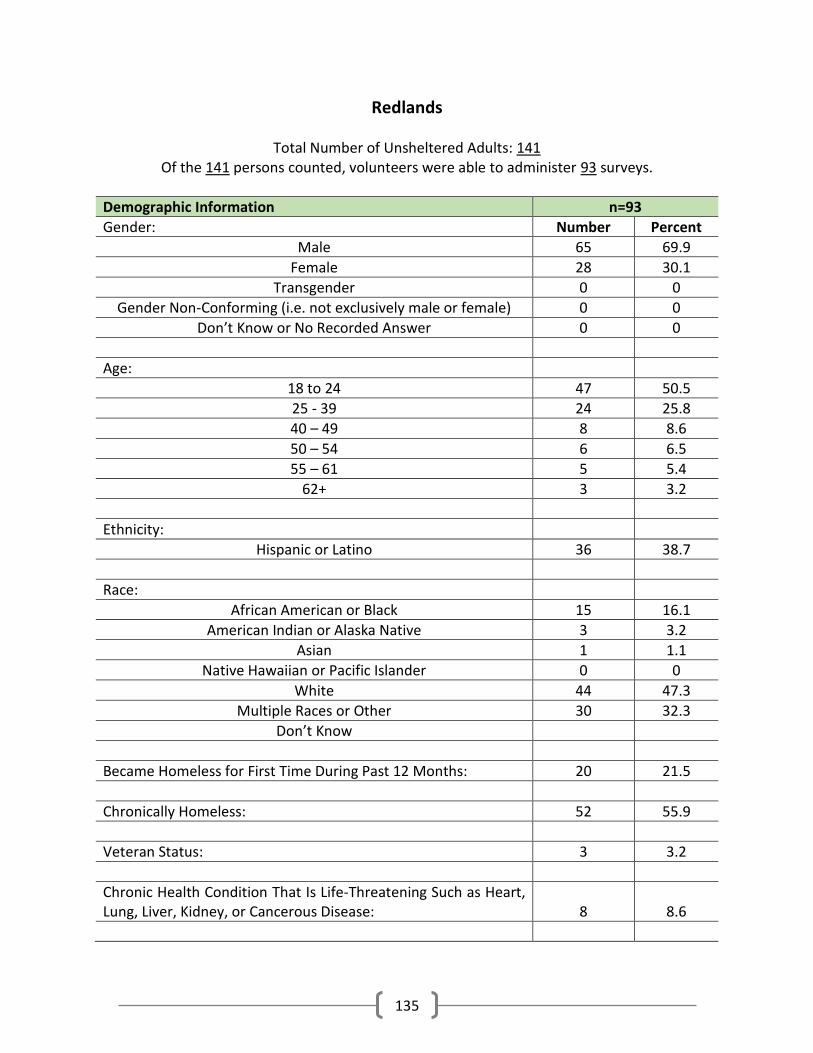
135
Redlands
Total Number of Unsheltered Adults: 141 Of the 141 persons counted, volunteers were able to administer 93 surveys.
Demographic Information n=93
Gender: Number Percent
Male 65 69.9
Female 28 30.1
Transgender 0 0
Gender Non-Conforming (i.e. not exclusively male or female) 0 0
Don’t Know or No Recorded Answer 0 0
Age:
18 to 24 47 50.5
25 - 39 24 25.8
40 – 49 8 8.6
50 – 54 6 6.5
55 – 61 5 5.4
62+ 3 3.2
Ethnicity:
Hispanic or Latino 36 38.7
Race:
African American or Black 15 16.1
American Indian or Alaska Native 3 3.2
Asian 1 1.1
Native Hawaiian or Pacific Islander 0 0
White 44 47.3
Multiple Races or Other 30 32.3
Don’t Know
Became Homeless for First Time During Past 12 Months: 20 21.5
Chronically Homeless: 52 55.9
Veteran Status: 3 3.2
Chronic Health Condition That Is Life-Threatening Such as Heart, Lung, Liver, Kidney, or Cancerous Disease:
8 8.6

136
Demographic Information n=93
HIV/AIDS: 4 4.3
Physical Disability That Seriously Limits Ability to Live Independently:
7 7.5
Developmental Disabilities: 1 1.1
Mental Health Disability or Disorder That Seriously Limits Ability to Live Independently:
8 8.6
Substance Use Problem Disability or Disorder That Seriously Limits Ability to Live Independently:
49 52.7
Victims of Domestic Violence:
Experiencing Homelessness Because Fleeing Domestic Violence, Dating Violence, Sexual Assault, or Stalking
6 6.5
Released from Correctional Institutions During Past Year: 23 24.7
Monthly Income:
No Monthly Income 58 62.3
$1 - $250 17 18.3
$251 - $500 6 6.5
$501 - $1,000 5 5.4
More Than $1,000 5 5.4
No Recorded Answer 2 2.1
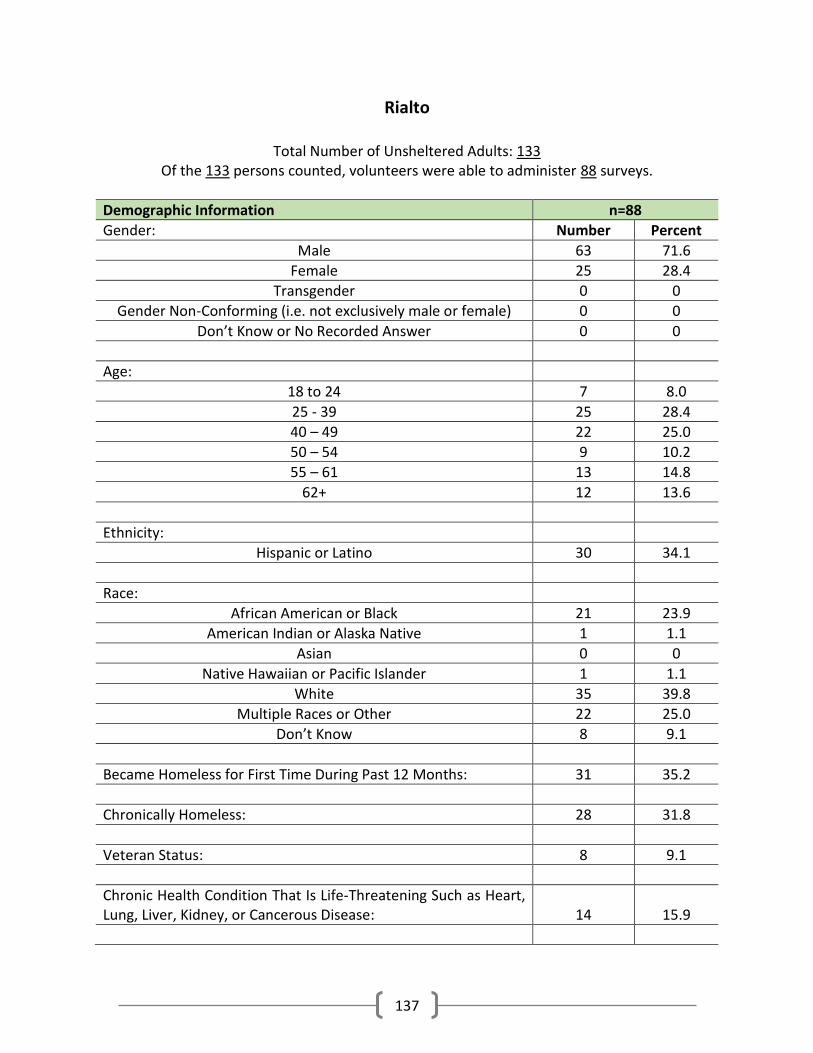
137
Rialto
Total Number of Unsheltered Adults: 133 Of the 133 persons counted, volunteers were able to administer 88 surveys.
Demographic Information n=88
Gender: Number Percent
Male 63 71.6
Female 25 28.4
Transgender 0 0
Gender Non-Conforming (i.e. not exclusively male or female) 0 0
Don’t Know or No Recorded Answer 0 0
Age:
18 to 24 7 8.0
25 - 39 25 28.4
40 – 49 22 25.0
50 – 54 9 10.2
55 – 61 13 14.8
62+ 12 13.6
Ethnicity:
Hispanic or Latino 30 34.1
Race:
African American or Black 21 23.9
American Indian or Alaska Native 1 1.1
Asian 0 0
Native Hawaiian or Pacific Islander 1 1.1
White 35 39.8
Multiple Races or Other 22 25.0
Don’t Know 8 9.1
Became Homeless for First Time During Past 12 Months: 31 35.2
Chronically Homeless: 28 31.8
Veteran Status: 8 9.1
Chronic Health Condition That Is Life-Threatening Such as Heart, Lung, Liver, Kidney, or Cancerous Disease:
14 15.9

138
Demographic Information n=88
HIV/AIDS: 2 2.3
Physical Disability That Seriously Limits Ability to Live Independently:
23 26.1
Developmental Disabilities: 4 4.5
Mental Health Disability or Disorder That Seriously Limits Ability to Live Independently:
19 21.6
Substance Use Problem Disability or Disorder That Seriously Limits Ability to Live Independently:
15 17.0
Victims of Domestic Violence:
Experiencing Homelessness Because Fleeing Domestic Violence, Dating Violence, Sexual Assault, or Stalking
6 6.8
Released from Correctional Institutions During Past Year: 24 27.2
Monthly Income:
No Monthly Income 50 56.8
$1 - $250 16 18.2
$251 - $500 9 10.2
$501 - $1,000 7 8.0
More Than $1,000 3 3.4
No Recorded Answer 3 3.4
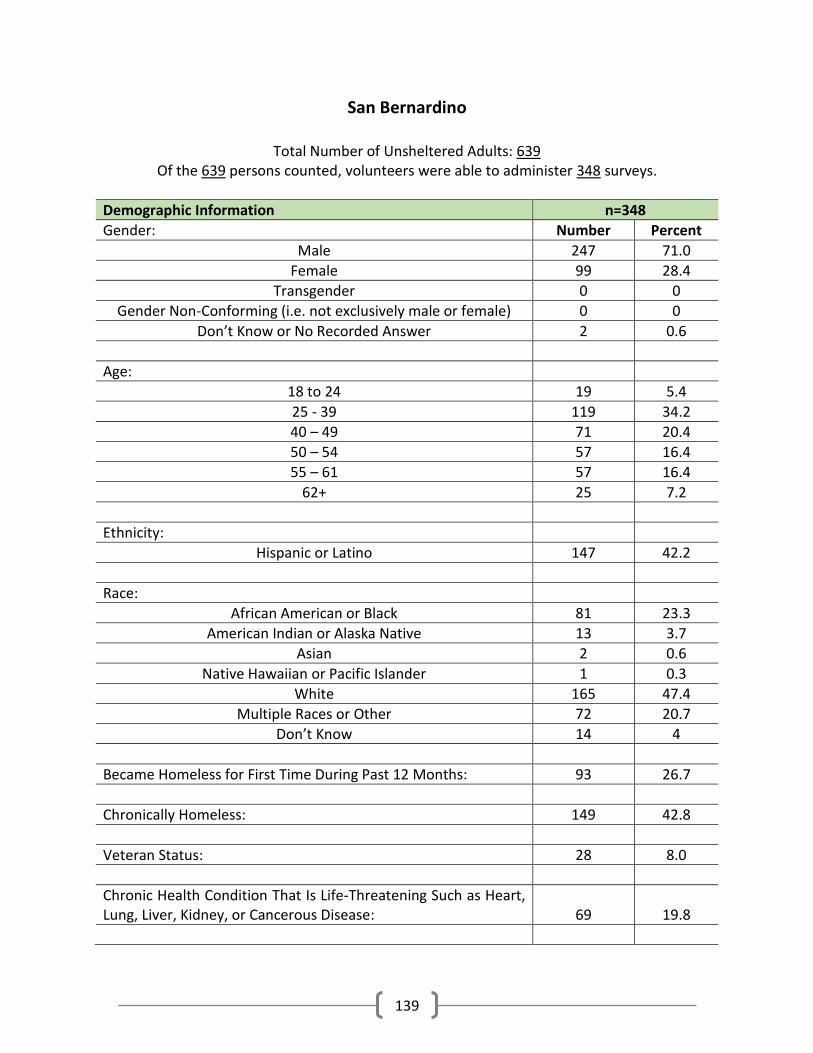
139
San Bernardino
Total Number of Unsheltered Adults: 639 Of the 639 persons counted, volunteers were able to administer 348 surveys.
Demographic Information n=348
Gender: Number Percent
Male 247 71.0
Female 99 28.4
Transgender 0 0
Gender Non-Conforming (i.e. not exclusively male or female) 0 0
Don’t Know or No Recorded Answer 2 0.6
Age:
18 to 24 19 5.4
25 - 39 119 34.2
40 – 49 71 20.4
50 – 54 57 16.4
55 – 61 57 16.4
62+ 25 7.2
Ethnicity:
Hispanic or Latino 147 42.2
Race:
African American or Black 81 23.3
American Indian or Alaska Native 13 3.7
Asian 2 0.6
Native Hawaiian or Pacific Islander 1 0.3
White 165 47.4
Multiple Races or Other 72 20.7
Don’t Know 14 4
Became Homeless for First Time During Past 12 Months: 93 26.7
Chronically Homeless: 149 42.8
Veteran Status: 28 8.0
Chronic Health Condition That Is Life-Threatening Such as Heart, Lung, Liver, Kidney, or Cancerous Disease:
69 19.8

140
Demographic Information n=348
HIV/AIDS: 11 3.2
Physical Disability That Seriously Limits Ability to Live Independently:
87 25
Developmental Disabilities: 26 7.5
Mental Health Disability or Disorder That Seriously Limits Ability to Live Independently:
79 22.7
Substance Use Problem Disability or Disorder That Seriously Limits Ability to Live Independently:
59 17.0
Victims of Domestic Violence:
Experiencing Homelessness Because Fleeing Domestic Violence, Dating Violence, Sexual Assault, or Stalking
35 10.1
Released from Correctional Institutions During Past Year: 67 19.2
Monthly Income:
No Monthly Income 226 64.9
$1 - $250 45 12.9
$251 - $500 16 4.6
$501 - $1,000 39 11.2
More Than $1,000 13 3.7
No Recorded Answer 9 2.6
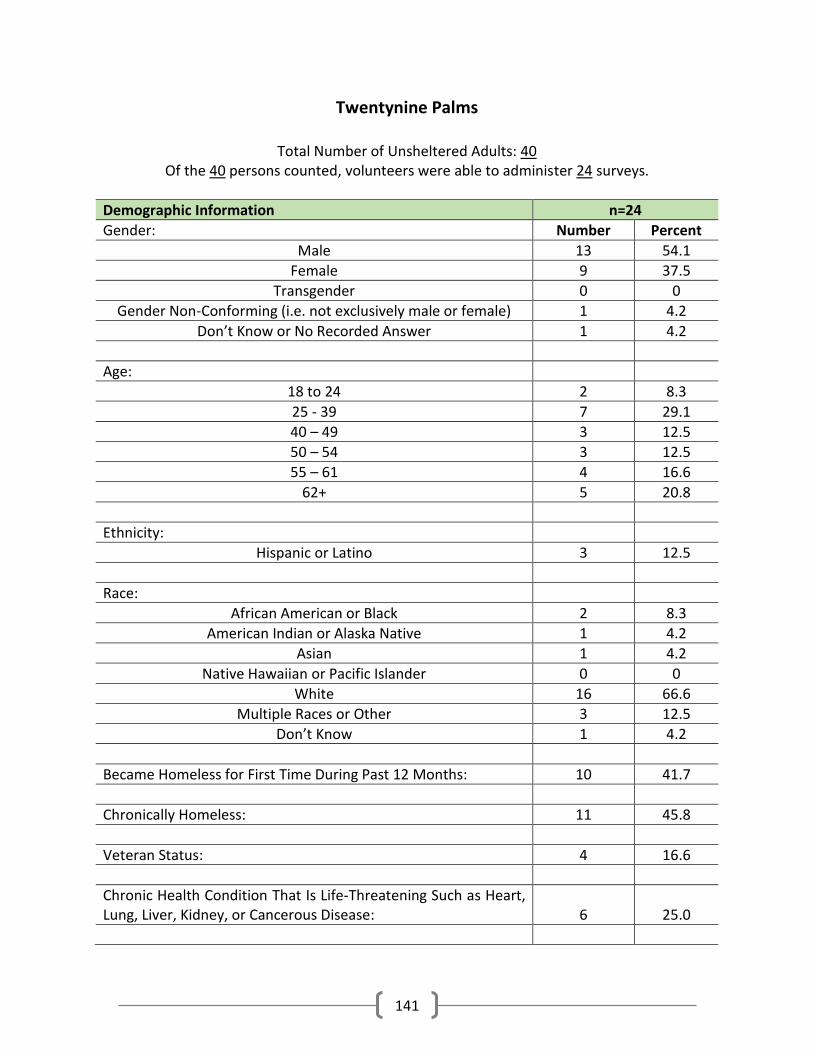
141
Twentynine Palms
Total Number of Unsheltered Adults: 40 Of the 40 persons counted, volunteers were able to administer 24 surveys.
Demographic Information n=24
Gender: Number Percent
Male 13 54.1
Female 9 37.5
Transgender 0 0
Gender Non-Conforming (i.e. not exclusively male or female) 1 4.2
Don’t Know or No Recorded Answer 1 4.2
Age:
18 to 24 2 8.3
25 - 39 7 29.1
40 – 49 3 12.5
50 – 54 3 12.5
55 – 61 4 16.6
62+ 5 20.8
Ethnicity:
Hispanic or Latino 3 12.5
Race:
African American or Black 2 8.3
American Indian or Alaska Native 1 4.2
Asian 1 4.2
Native Hawaiian or Pacific Islander 0 0
White 16 66.6
Multiple Races or Other 3 12.5
Don’t Know 1 4.2
Became Homeless for First Time During Past 12 Months: 10 41.7
Chronically Homeless: 11 45.8
Veteran Status: 4 16.6
Chronic Health Condition That Is Life-Threatening Such as Heart, Lung, Liver, Kidney, or Cancerous Disease:
6 25.0

142
Demographic Information n=24
HIV/AIDS: 0 0
Physical Disability That Seriously Limits Ability to Live Independently:
7 29.2
Developmental Disabilities: 1 4.2
Mental Health Disability or Disorder That Seriously Limits Ability to Live Independently:
5 20.8
Substance Use Problem Disability or Disorder That Seriously Limits Ability to Live Independently:
5 20.8
Victims of Domestic Violence:
Experiencing Homelessness Because Fleeing Domestic Violence, Dating Violence, Sexual Assault, or Stalking
2 8.3
Released from Correctional Institutions During Past Year: 2 8.3
Monthly Income:
No Monthly Income 11 45.8
$1 - $250 3 12.5
$251 - $500 1 4.2
$501 - $1,000 7 29.2
More Than $1,000 2 8.3
No Recorded Answer 0 0
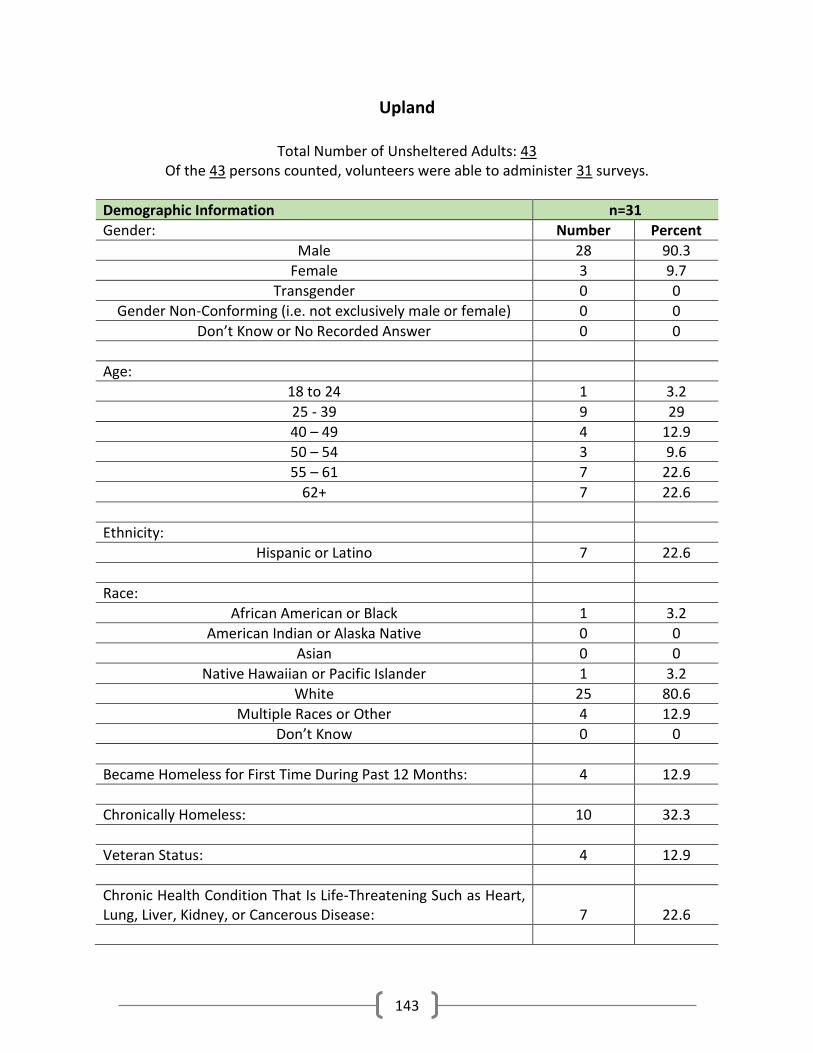
143
Upland
Total Number of Unsheltered Adults: 43 Of the 43 persons counted, volunteers were able to administer 31 surveys.
Demographic Information n=31
Gender: Number Percent
Male 28 90.3
Female 3 9.7
Transgender 0 0
Gender Non-Conforming (i.e. not exclusively male or female) 0 0
Don’t Know or No Recorded Answer 0 0
Age:
18 to 24 1 3.2
25 - 39 9 29
40 – 49 4 12.9
50 – 54 3 9.6
55 – 61 7 22.6
62+ 7 22.6
Ethnicity:
Hispanic or Latino 7 22.6
Race:
African American or Black 1 3.2
American Indian or Alaska Native 0 0
Asian 0 0
Native Hawaiian or Pacific Islander 1 3.2
White 25 80.6
Multiple Races or Other 4 12.9
Don’t Know 0 0
Became Homeless for First Time During Past 12 Months: 4 12.9
Chronically Homeless: 10 32.3
Veteran Status: 4 12.9
Chronic Health Condition That Is Life-Threatening Such as Heart, Lung, Liver, Kidney, or Cancerous Disease:
7 22.6

144
Demographic Information n=31
HIV/AIDS: 0 0
Physical Disability That Seriously Limits Ability to Live Independently:
8 25.8
Developmental Disabilities: 0 0
Mental Health Disability or Disorder That Seriously Limits Ability to Live Independently:
3 9.7
Substance Use Problem Disability or Disorder That Seriously Limits Ability to Live Independently:
12 38.7
Victims of Domestic Violence:
Experiencing Homelessness Because Fleeing Domestic Violence, Dating Violence, Sexual Assault, or Stalking
1 3.2
Released from Correctional Institutions During Past Year: 8 25.8.
Monthly Income:
No Monthly Income 16 51.6
$1 - $250 4 12.9
$251 - $500 3 9.7
$501 - $1,000 5 16.1
More Than $1,000 1 3.2
No Recorded Answer 2 6.5
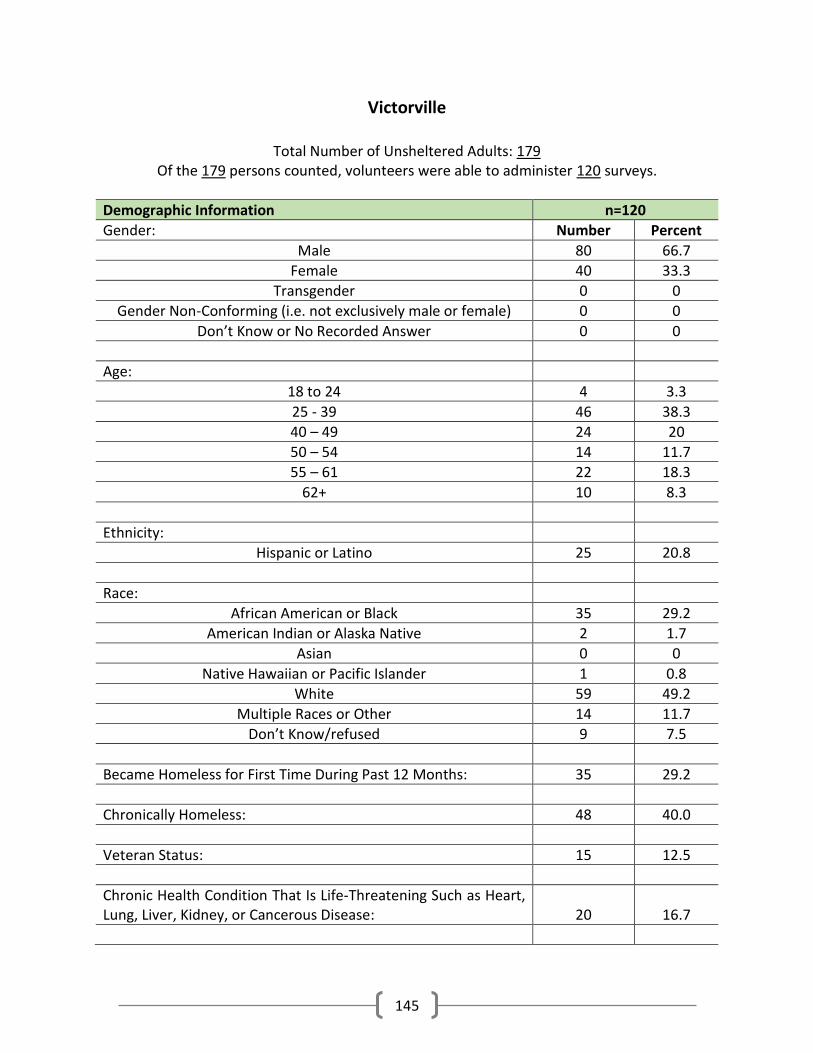
145
Victorville
Total Number of Unsheltered Adults: 179 Of the 179 persons counted, volunteers were able to administer 120 surveys.
Demographic Information n=120
Gender: Number Percent
Male 80 66.7
Female 40 33.3
Transgender 0 0
Gender Non-Conforming (i.e. not exclusively male or female) 0 0
Don’t Know or No Recorded Answer 0 0
Age:
18 to 24 4 3.3
25 - 39 46 38.3
40 – 49 24 20
50 – 54 14 11.7
55 – 61 22 18.3
62+ 10 8.3
Ethnicity:
Hispanic or Latino 25 20.8
Race:
African American or Black 35 29.2
American Indian or Alaska Native 2 1.7
Asian 0 0
Native Hawaiian or Pacific Islander 1 0.8
White 59 49.2
Multiple Races or Other 14 11.7
Don’t Know/refused 9 7.5
Became Homeless for First Time During Past 12 Months: 35 29.2
Chronically Homeless: 48 40.0
Veteran Status: 15 12.5
Chronic Health Condition That Is Life-Threatening Such as Heart, Lung, Liver, Kidney, or Cancerous Disease:
20 16.7

146
Demographic Information n=120
HIV/AIDS: 2 1.7
Physical Disability That Seriously Limits Ability to Live Independently:
26 21.7
Developmental Disabilities: 9 7.5
Mental Health Disability or Disorder That Seriously Limits Ability to Live Independently:
34 28.3
Substance Use Problem Disability or Disorder That Seriously Limits Ability to Live Independently:
34 28.3
Victims of Domestic Violence:
Experiencing Homelessness Because Fleeing Domestic Violence, Dating Violence, Sexual Assault, or Stalking
13 10.8
Released from Correctional Institutions During Past Year: 31 25.8
Monthly Income:
No Monthly Income 77 64.2
$1 - $250 19 15.8
$251 - $500 4 3.3
$501 - $1,000 13 10.8
More Than $1,000 5 4.2
No Recorded Answer 2 1.7
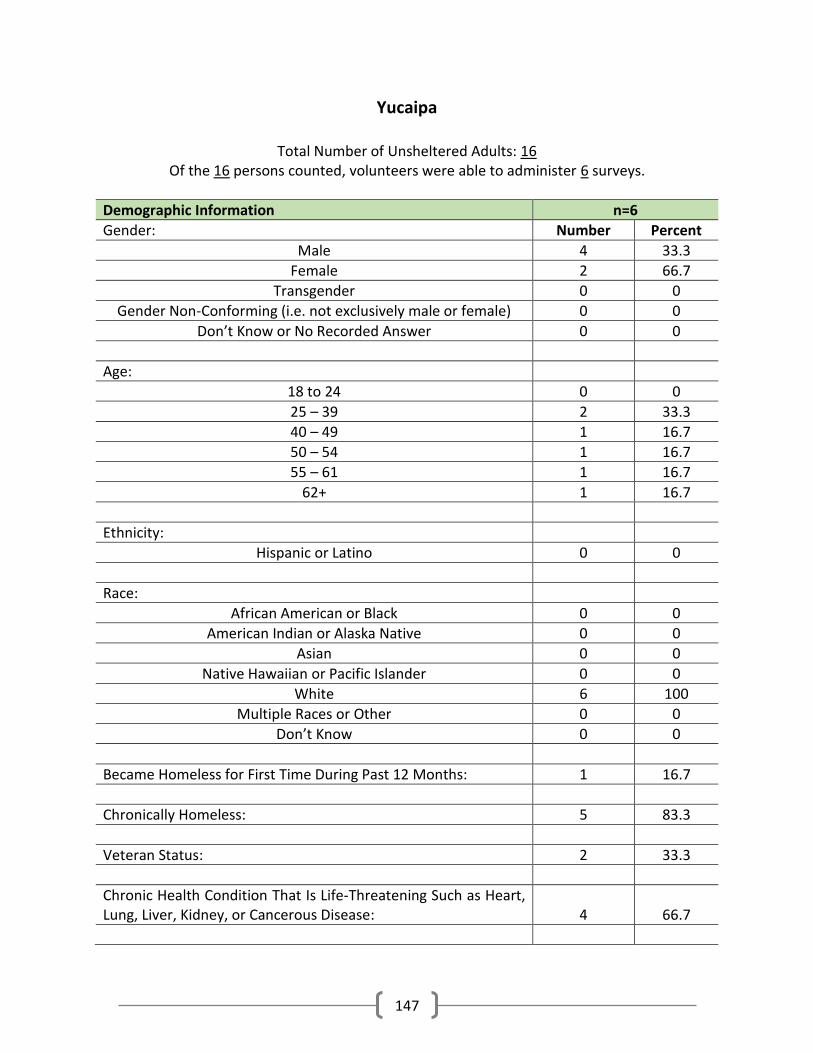
147
Yucaipa
Total Number of Unsheltered Adults: 16 Of the 16 persons counted, volunteers were able to administer 6 surveys.
Demographic Information n=6
Gender: Number Percent
Male 4 33.3
Female 2 66.7
Transgender 0 0
Gender Non-Conforming (i.e. not exclusively male or female) 0 0
Don’t Know or No Recorded Answer 0 0
Age:
18 to 24 0 0
25 – 39 2 33.3
40 – 49 1 16.7
50 – 54 1 16.7
55 – 61 1 16.7
62+ 1 16.7
Ethnicity:
Hispanic or Latino 0 0
Race:
African American or Black 0 0
American Indian or Alaska Native 0 0
Asian 0 0
Native Hawaiian or Pacific Islander 0 0
White 6 100
Multiple Races or Other 0 0
Don’t Know 0 0
Became Homeless for First Time During Past 12 Months: 1 16.7
Chronically Homeless: 5 83.3
Veteran Status: 2 33.3
Chronic Health Condition That Is Life-Threatening Such as Heart, Lung, Liver, Kidney, or Cancerous Disease:
4 66.7
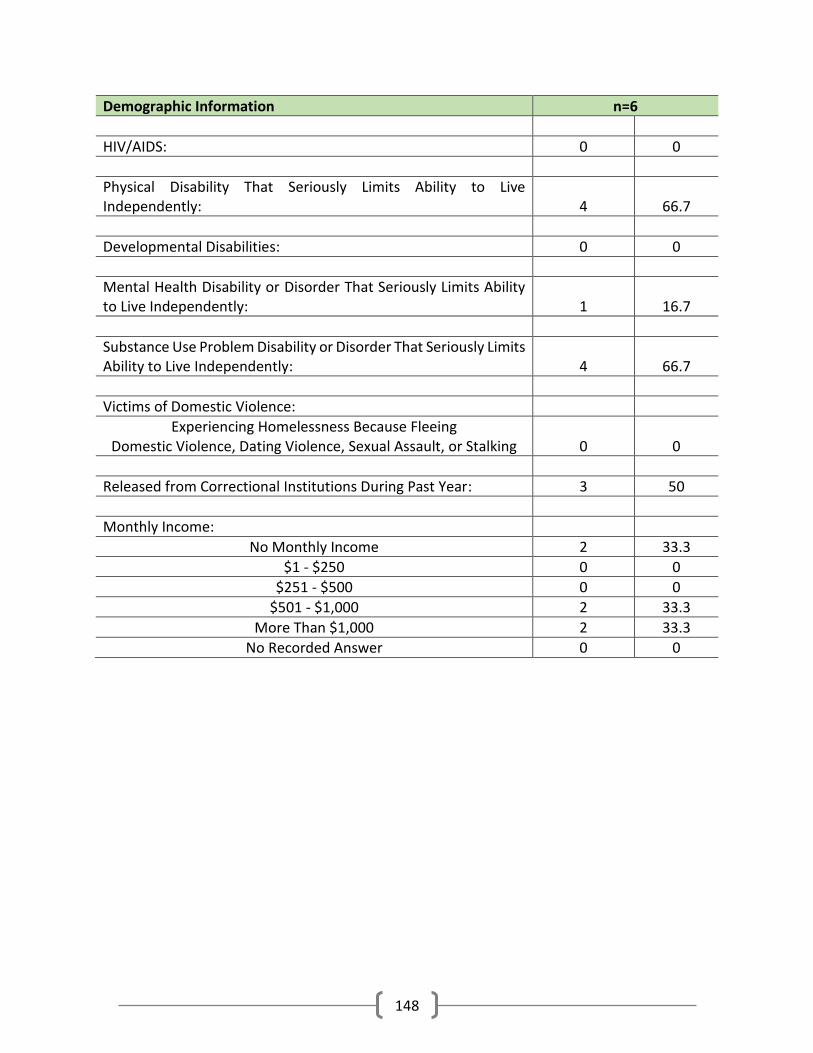
148
Demographic Information n=6
HIV/AIDS: 0 0
Physical Disability That Seriously Limits Ability to Live Independently:
4 66.7
Developmental Disabilities: 0 0
Mental Health Disability or Disorder That Seriously Limits Ability to Live Independently:
1 16.7
Substance Use Problem Disability or Disorder That Seriously Limits Ability to Live Independently:
4 66.7
Victims of Domestic Violence:
Experiencing Homelessness Because Fleeing Domestic Violence, Dating Violence, Sexual Assault, or Stalking
0 0
Released from Correctional Institutions During Past Year: 3 50
Monthly Income:
No Monthly Income 2 33.3
$1 - $250 0 0
$251 - $500 0 0
$501 - $1,000 2 33.3
More Than $1,000 2 33.3
No Recorded Answer 0 0
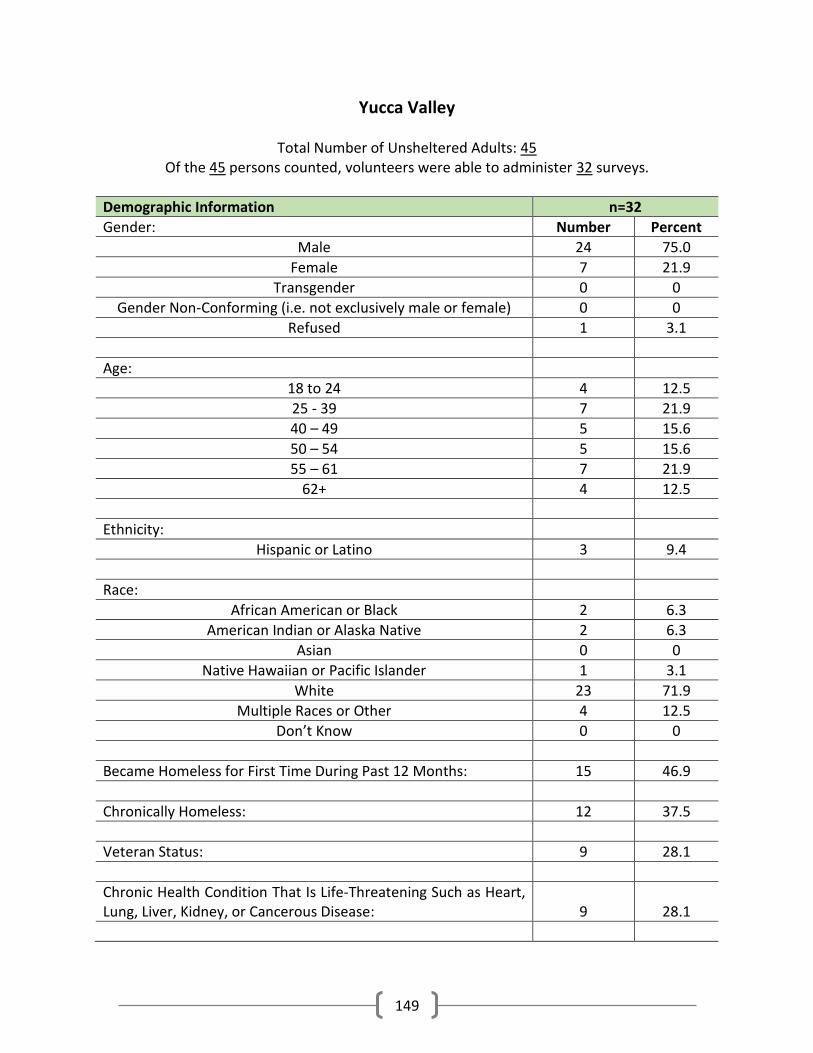
149
Yucca Valley
Total Number of Unsheltered Adults: 45 Of the 45 persons counted, volunteers were able to administer 32 surveys.
Demographic Information n=32
Gender: Number Percent
Male 24 75.0
Female 7 21.9
Transgender 0 0
Gender Non-Conforming (i.e. not exclusively male or female) 0 0
Refused 1 3.1
Age:
18 to 24 4 12.5
25 - 39 7 21.9
40 – 49 5 15.6
50 – 54 5 15.6
55 – 61 7 21.9
62+ 4 12.5
Ethnicity:
Hispanic or Latino 3 9.4
Race:
African American or Black 2 6.3
American Indian or Alaska Native 2 6.3
Asian 0 0
Native Hawaiian or Pacific Islander 1 3.1
White 23 71.9
Multiple Races or Other 4 12.5
Don’t Know 0 0
Became Homeless for First Time During Past 12 Months: 15 46.9
Chronically Homeless: 12 37.5
Veteran Status: 9 28.1
Chronic Health Condition That Is Life-Threatening Such as Heart, Lung, Liver, Kidney, or Cancerous Disease:
9 28.1

150
Demographic Information n=32
HIV/AIDS: 1 3.1
Physical Disability That Seriously Limits Ability to Live Independently:
11 34.4
Developmental Disabilities: 3 9.4
Mental Health Disability or Disorder That Seriously Limits Ability to Live Independently:
9 28.1
Substance Use Problem Disability or Disorder That Seriously Limits Ability to Live Independently:
7 21.9
Victims of Domestic Violence:
Experiencing Homelessness Because Fleeing Domestic Violence, Dating Violence, Sexual Assault, or Stalking
2 9.4
Released from Correctional Institutions During Past Year: 5 15.6
Monthly Income:
No Monthly Income 13 40.6
$1 - $250 8 25.0
$251 - $500 4 12.5
$501 - $1,000 5 15.6
More Than $1,000 2 6.3
No Recorded Answer 0 0