Embed Size (px)
Citation preview
San Jacinto River Study
September 16, 2016
Submitted by: Santa Ana Region MS4 Permittees
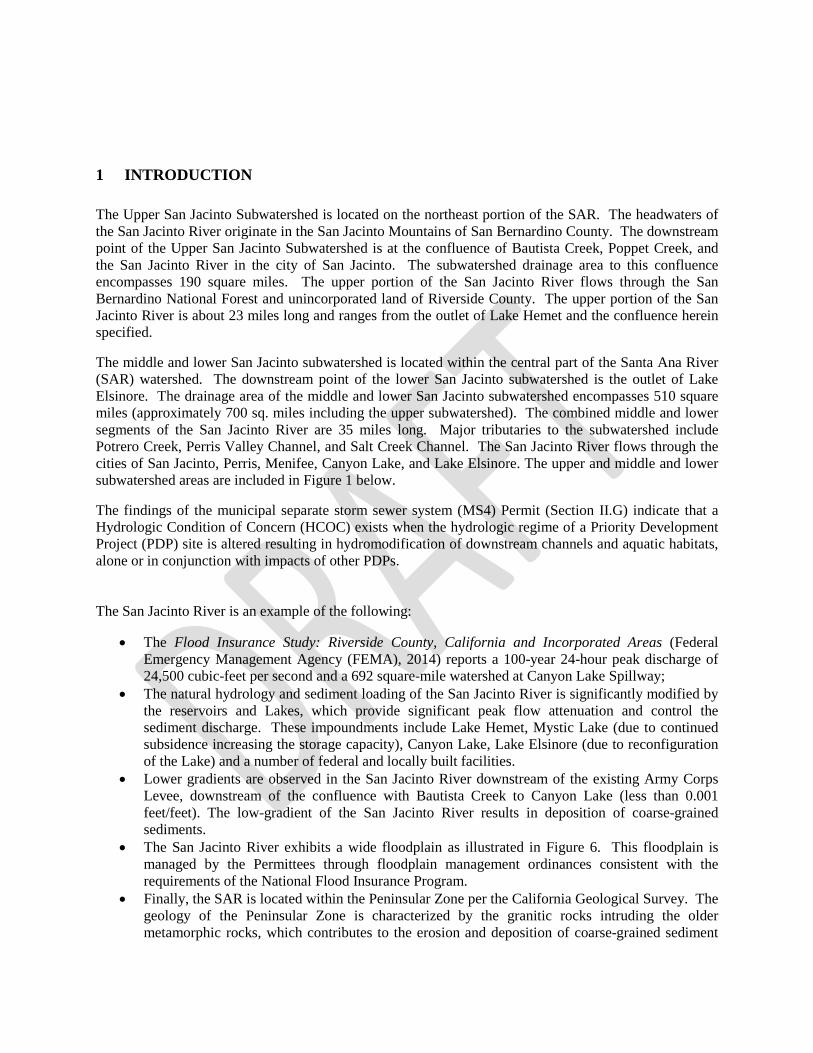
1 INTRODUCTION The Upper San Jacinto Subwatershed is located on the northeast portion of the SAR. The headwaters of the San Jacinto River originate in the San Jacinto Mountains of San Bernardino County. The downstream point of the Upper San Jacinto Subwatershed is at the confluence of Bautista Creek, Poppet Creek, and the San Jacinto River in the city of San Jacinto. The subwatershed drainage area to this confluence encompasses 190 square miles. The upper portion of the San Jacinto River flows through the San Bernardino National Forest and unincorporated land of Riverside County. The upper portion of the San Jacinto River is about 23 miles long and ranges from the outlet of Lake Hemet and the confluence herein specified.
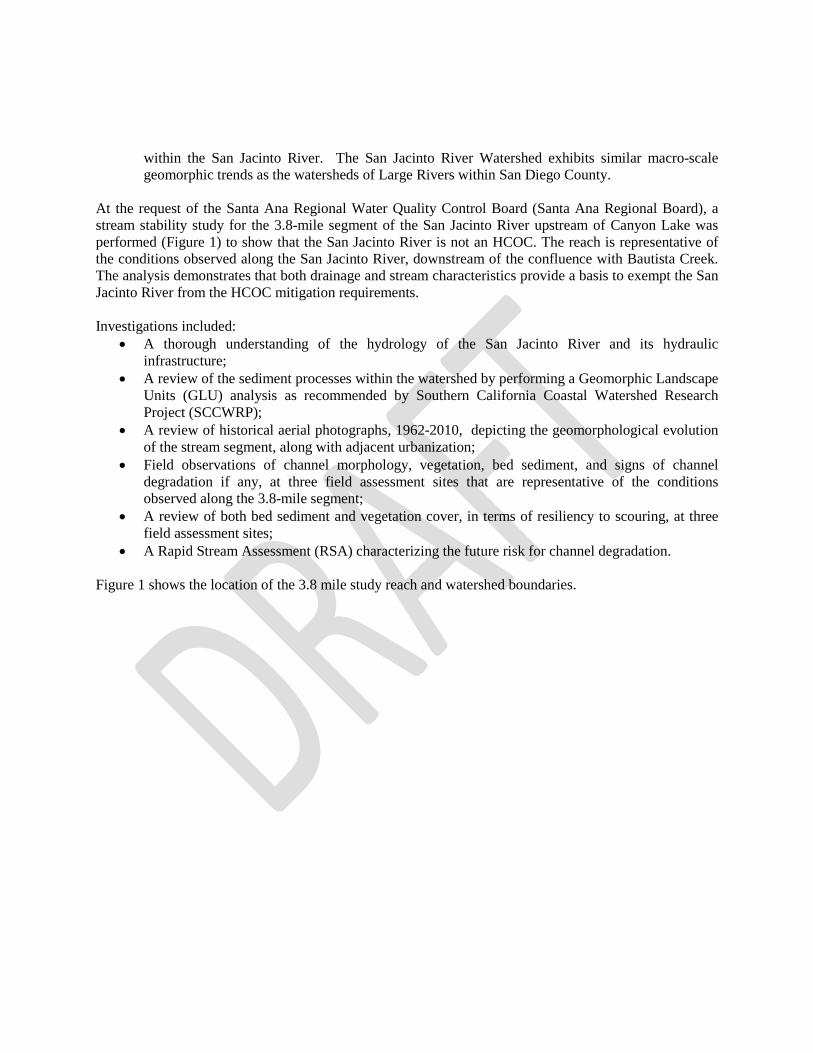
The middle and lower San Jacinto subwatershed is located within the central part of the Santa Ana River (SAR) watershed. The downstream point of the lower San Jacinto subwatershed is the outlet of Lake Elsinore. The drainage area of the middle and lower San Jacinto subwatershed encompasses 510 square miles (approximately 700 sq. miles including the upper subwatershed). The combined middle and lower segments of the San Jacinto River are 35 miles long. Major tributaries to the subwatershed include Potrero Creek, Perris Valley Channel, and Salt Creek Channel. The San Jacinto River flows through the cities of San Jacinto, Perris, Menifee, Canyon Lake, and Lake Elsinore. The upper and middle and lower subwatershed areas are included in Figure 1 below.
The findings of the municipal separate storm sewer system (MS4) Permit (Section II.G) indicate that a Hydrologic Condition of Concern (HCOC) exists when the hydrologic regime of a Priority Development Project (PDP) site is altered resulting in hydromodification of downstream channels and aquatic habitats, alone or in conjunction with impacts of other PDPs. The San Jacinto River is an example of the following:
• The Flood Insurance Study: Riverside County, California and Incorporated Areas (Federal Emergency Management Agency (FEMA), 2014) reports a 100-year 24-hour peak discharge of 24,500 cubic-feet per second and a 692 square-mile watershed at Canyon Lake Spillway;
• The natural hydrology and sediment loading of the San Jacinto River is significantly modified by the reservoirs and Lakes, which provide significant peak flow attenuation and control the sediment discharge. These impoundments include Lake Hemet, Mystic Lake (due to continued subsidence increasing the storage capacity), Canyon Lake, Lake Elsinore (due to reconfiguration of the Lake) and a number of federal and locally built facilities.
• Lower gradients are observed in the San Jacinto River downstream of the existing Army Corps Levee, downstream of the confluence with Bautista Creek to Canyon Lake (less than 0.001 feet/feet). The low-gradient of the San Jacinto River results in deposition of coarse-grained sediments.
• The San Jacinto River exhibits a wide floodplain as illustrated in Figure 6. This floodplain is managed by the Permittees through floodplain management ordinances consistent with the requirements of the National Flood Insurance Program.
• Finally, the SAR is located within the Peninsular Zone per the California Geological Survey. The geology of the Peninsular Zone is characterized by the granitic rocks intruding the older metamorphic rocks, which contributes to the erosion and deposition of coarse-grained sediment
within the San Jacinto River. The San Jacinto River Watershed exhibits similar macro-scale geomorphic trends as the watersheds of Large Rivers within San Diego County.
At the request of the Santa Ana Regional Water Quality Control Board (Santa Ana Regional Board), a stream stability study for the 3.8-mile segment of the San Jacinto River upstream of Canyon Lake was performed (Figure 1) to show that the San Jacinto River is not an HCOC. The reach is representative of the conditions observed along the San Jacinto River, downstream of the confluence with Bautista Creek. The analysis demonstrates that both drainage and stream characteristics provide a basis to exempt the San Jacinto River from the HCOC mitigation requirements. Investigations included:
• A thorough understanding of the hydrology of the San Jacinto River and its hydraulic infrastructure;
• A review of the sediment processes within the watershed by performing a Geomorphic Landscape Units (GLU) analysis as recommended by Southern California Coastal Watershed Research Project (SCCWRP);
• A review of historical aerial photographs, 1962-2010, depicting the geomorphological evolution of the stream segment, along with adjacent urbanization;
• Field observations of channel morphology, vegetation, bed sediment, and signs of channel degradation if any, at three field assessment sites that are representative of the conditions observed along the 3.8-mile segment;
• A review of both bed sediment and vegetation cover, in terms of resiliency to scouring, at three field assessment sites;
• A Rapid Stream Assessment (RSA) characterizing the future risk for channel degradation. Figure 1 shows the location of the 3.8 mile study reach and watershed boundaries.
Figure 1 - Watershed Map
2 HYDROLOGY & GEOMORPHICALLY SIGNIFICANT FLOWS Lake Hemet is the major water storage facility within this subwatershed. The dam was established in 1895 downstream of the Garner Valley Basin and operates on the principles of water supply. In addition to regulating the flow rate downstream the dam acts as a major debris basin.
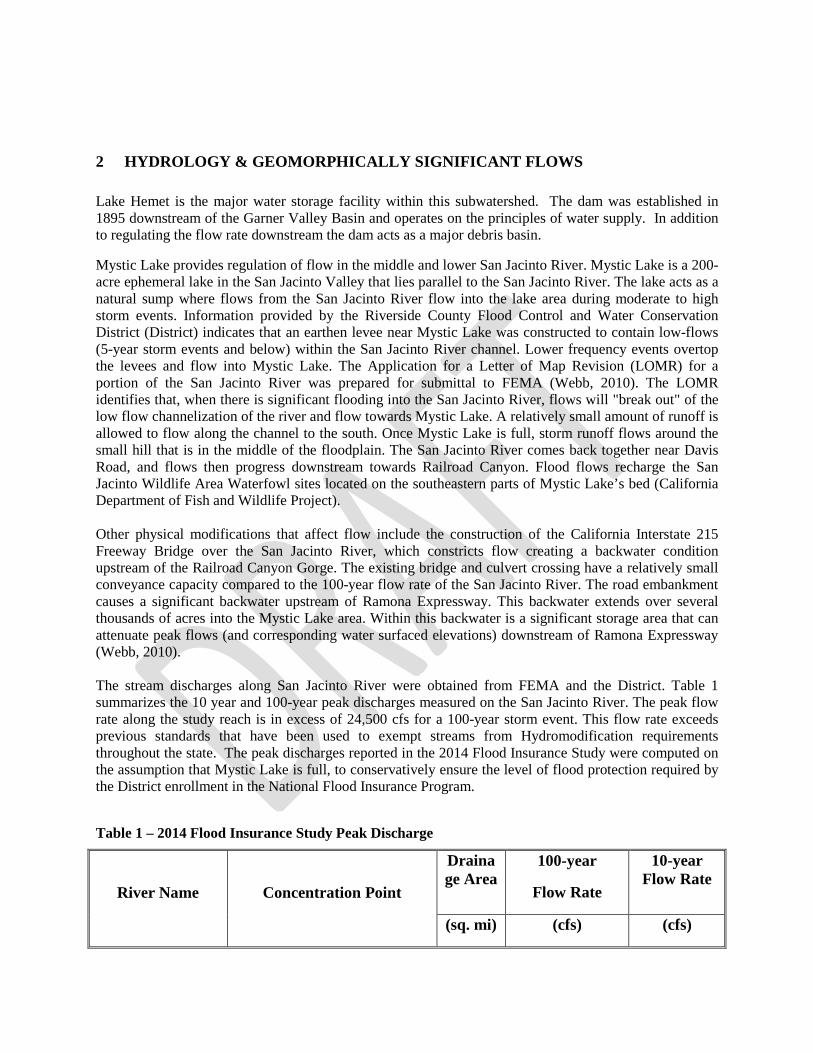
Mystic Lake provides regulation of flow in the middle and lower San Jacinto River. Mystic Lake is a 200-acre ephemeral lake in the San Jacinto Valley that lies parallel to the San Jacinto River. The lake acts as a natural sump where flows from the San Jacinto River flow into the lake area during moderate to high storm events. Information provided by the Riverside County Flood Control and Water Conservation District (District) indicates that an earthen levee near Mystic Lake was constructed to contain low-flows (5-year storm events and below) within the San Jacinto River channel. Lower frequency events overtop the levees and flow into Mystic Lake. The Application for a Letter of Map Revision (LOMR) for a portion of the San Jacinto River was prepared for submittal to FEMA (Webb, 2010). The LOMR identifies that, when there is significant flooding into the San Jacinto River, flows will "break out" of the low flow channelization of the river and flow towards Mystic Lake. A relatively small amount of runoff is allowed to flow along the channel to the south. Once Mystic Lake is full, storm runoff flows around the small hill that is in the middle of the floodplain. The San Jacinto River comes back together near Davis Road, and flows then progress downstream towards Railroad Canyon. Flood flows recharge the San Jacinto Wildlife Area Waterfowl sites located on the southeastern parts of Mystic Lake’s bed (California Department of Fish and Wildlife Project). Other physical modifications that affect flow include the construction of the California Interstate 215 Freeway Bridge over the San Jacinto River, which constricts flow creating a backwater condition upstream of the Railroad Canyon Gorge. The existing bridge and culvert crossing have a relatively small conveyance capacity compared to the 100-year flow rate of the San Jacinto River. The road embankment causes a significant backwater upstream of Ramona Expressway. This backwater extends over several thousands of acres into the Mystic Lake area. Within this backwater is a significant storage area that can attenuate peak flows (and corresponding water surfaced elevations) downstream of Ramona Expressway (Webb, 2010). The stream discharges along San Jacinto River were obtained from FEMA and the District. Table 1 summarizes the 10 year and 100-year peak discharges measured on the San Jacinto River. The peak flow rate along the study reach is in excess of 24,500 cfs for a 100-year storm event. This flow rate exceeds previous standards that have been used to exempt streams from Hydromodification requirements throughout the state. The peak discharges reported in the 2014 Flood Insurance Study were computed on the assumption that Mystic Lake is full, to conservatively ensure the level of flood protection required by the District enrollment in the National Flood Insurance Program. Table 1 – 2014 Flood Insurance Study Peak Discharge
River Name Concentration Point
Drainage Area
100-year
Flow Rate
10-year Flow Rate
(sq. mi) (cfs) (cfs)
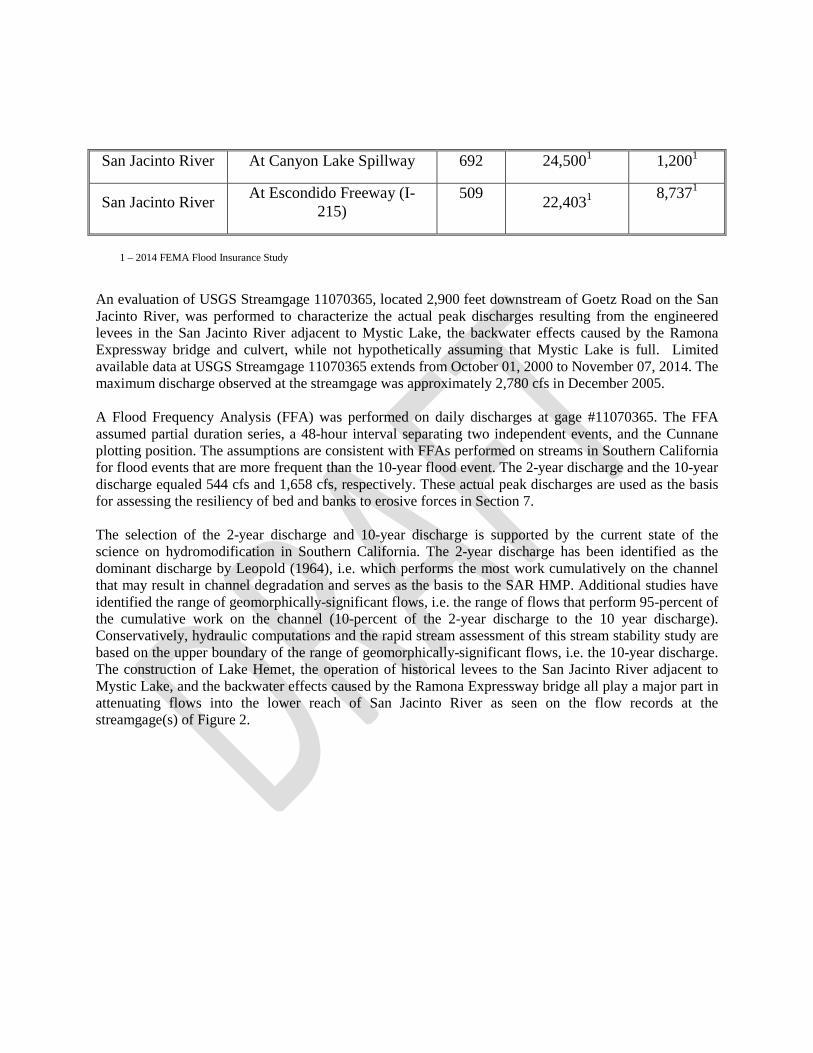
San Jacinto River At Canyon Lake Spillway 692 24,5001 1,2001
San Jacinto River At Escondido Freeway (I-215)
509 22,4031 8,7371
1 – 2014 FEMA Flood Insurance Study
An evaluation of USGS Streamgage 11070365, located 2,900 feet downstream of Goetz Road on the San Jacinto River, was performed to characterize the actual peak discharges resulting from the engineered levees in the San Jacinto River adjacent to Mystic Lake, the backwater effects caused by the Ramona Expressway bridge and culvert, while not hypothetically assuming that Mystic Lake is full. Limited available data at USGS Streamgage 11070365 extends from October 01, 2000 to November 07, 2014. The maximum discharge observed at the streamgage was approximately 2,780 cfs in December 2005. A Flood Frequency Analysis (FFA) was performed on daily discharges at gage #11070365. The FFA assumed partial duration series, a 48-hour interval separating two independent events, and the Cunnane plotting position. The assumptions are consistent with FFAs performed on streams in Southern California for flood events that are more frequent than the 10-year flood event. The 2-year discharge and the 10-year discharge equaled 544 cfs and 1,658 cfs, respectively. These actual peak discharges are used as the basis for assessing the resiliency of bed and banks to erosive forces in Section 7. The selection of the 2-year discharge and 10-year discharge is supported by the current state of the science on hydromodification in Southern California. The 2-year discharge has been identified as the dominant discharge by Leopold (1964), i.e. which performs the most work cumulatively on the channel that may result in channel degradation and serves as the basis to the SAR HMP. Additional studies have identified the range of geomorphically-significant flows, i.e. the range of flows that perform 95-percent of the cumulative work on the channel (10-percent of the 2-year discharge to the 10 year discharge). Conservatively, hydraulic computations and the rapid stream assessment of this stream stability study are based on the upper boundary of the range of geomorphically-significant flows, i.e. the 10-year discharge. The construction of Lake Hemet, the operation of historical levees to the San Jacinto River adjacent to Mystic Lake, and the backwater effects caused by the Ramona Expressway bridge all play a major part in attenuating flows into the lower reach of San Jacinto River as seen on the flow records at the streamgage(s) of Figure 2.
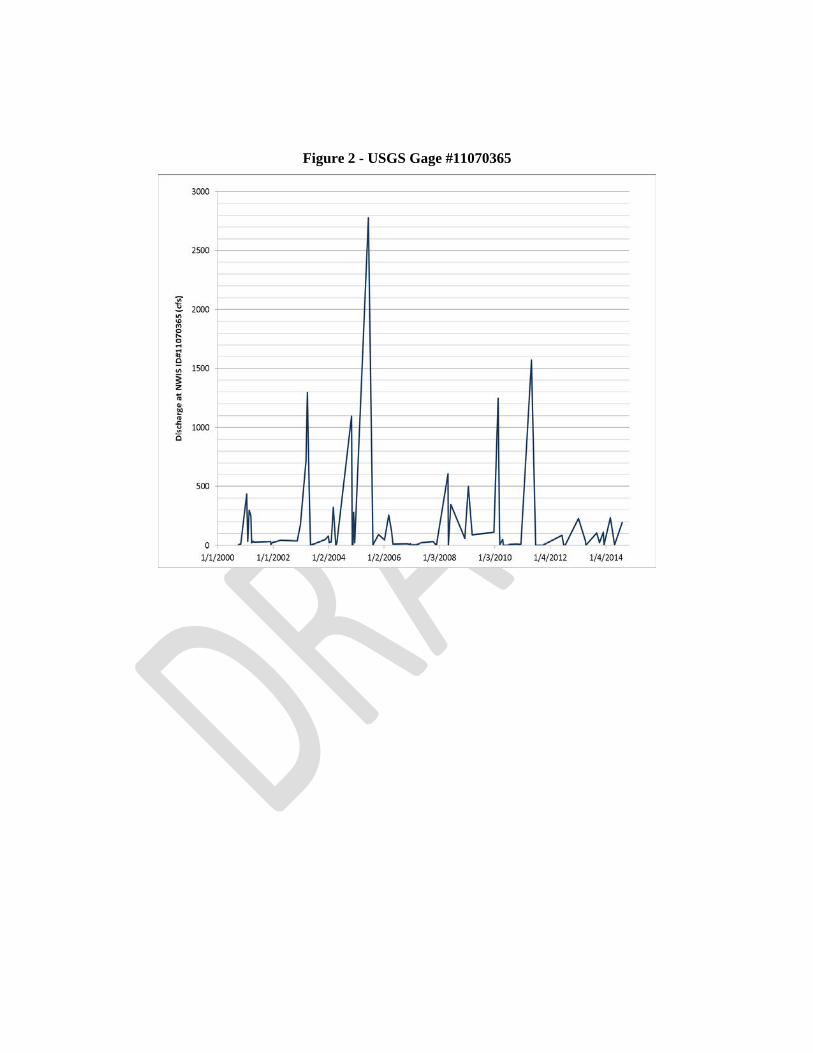
Figure 2 - USGS Gage #11070365
3 SEDIMENT DISCHARGE The evaluation of the sediment discharge along the study reach was prepared using the guideline developed by SCCWRP entitled "Hydromodification Screening Tools: GIS-Based Catchment Analyses of Potential Changes in Runoff and Sediment Discharge" dated March 2010. The report states that three factors were found to exert the greatest influence on the variability of sediment production rates in a watershed:
1. Geology Types; 2. Land Cover; and 3. Hillslope Gradient
The SCCWRP report used the three factors to create GLUs. In this study the factors were investigated separately.
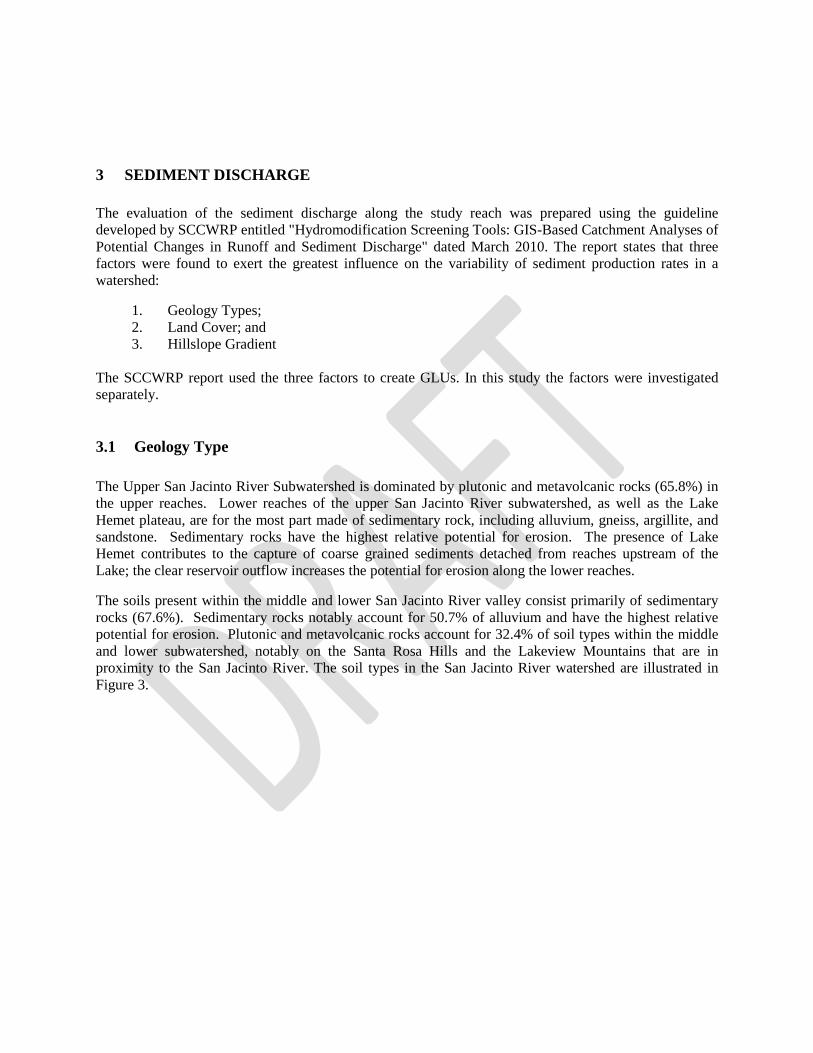
3.1 Geology Type The Upper San Jacinto River Subwatershed is dominated by plutonic and metavolcanic rocks (65.8%) in the upper reaches. Lower reaches of the upper San Jacinto River subwatershed, as well as the Lake Hemet plateau, are for the most part made of sedimentary rock, including alluvium, gneiss, argillite, and sandstone. Sedimentary rocks have the highest relative potential for erosion. The presence of Lake Hemet contributes to the capture of coarse grained sediments detached from reaches upstream of the Lake; the clear reservoir outflow increases the potential for erosion along the lower reaches.
The soils present within the middle and lower San Jacinto River valley consist primarily of sedimentary rocks (67.6%). Sedimentary rocks notably account for 50.7% of alluvium and have the highest relative potential for erosion. Plutonic and metavolcanic rocks account for 32.4% of soil types within the middle and lower subwatershed, notably on the Santa Rosa Hills and the Lakeview Mountains that are in proximity to the San Jacinto River. The soil types in the San Jacinto River watershed are illustrated in Figure 3.
Figure 3 - San Jacinto River Watershed Geology Types
3.2 Land Uses Urbanization potentially leads to reduced sediment supply to a receiving channel, increased runoff discharge and volume, and decreased infiltration. The development of several communities within the subwatershed tributary to the study segment has resulted in an increase in the imperviousness and associated increase in the frequency and flow experienced in the channel. Areas of urban land use (31.6% of the middle and lower San Jacinto River subwatershed) are concentrated within Moreno Valley, the Hemet area down gradient from the Santa Rosa Hills, Menifee and Canyon Lake, as well as the northwest side of Lake Elsinore. Agriculture and grassland remain the predominant land uses within the lowlands of the middle and lower subwatershed, constituting more than 49.1% of the area. Aerial photographs confirmed that several segments of the San Jacinto River have been channelized to convey runoff from the observed urban development.
The Upper San Jacinto Subwatershed is for the most part undeveloped. Valle Vista, along with pockets of development in the upper reaches of the subwatershed, account for 5.9% of the entire drainage area located within Riverside County. Undeveloped areas include forest (39.2%), scrub/shrub (17.5%), grassland (27.0%), and agriculture (6.5%). The low levels of development have contributed to the maintenance of the natural hydrologic response of the subwatershed. The land use types in the San Jacinto River watershed are illustrated in Figure 4.
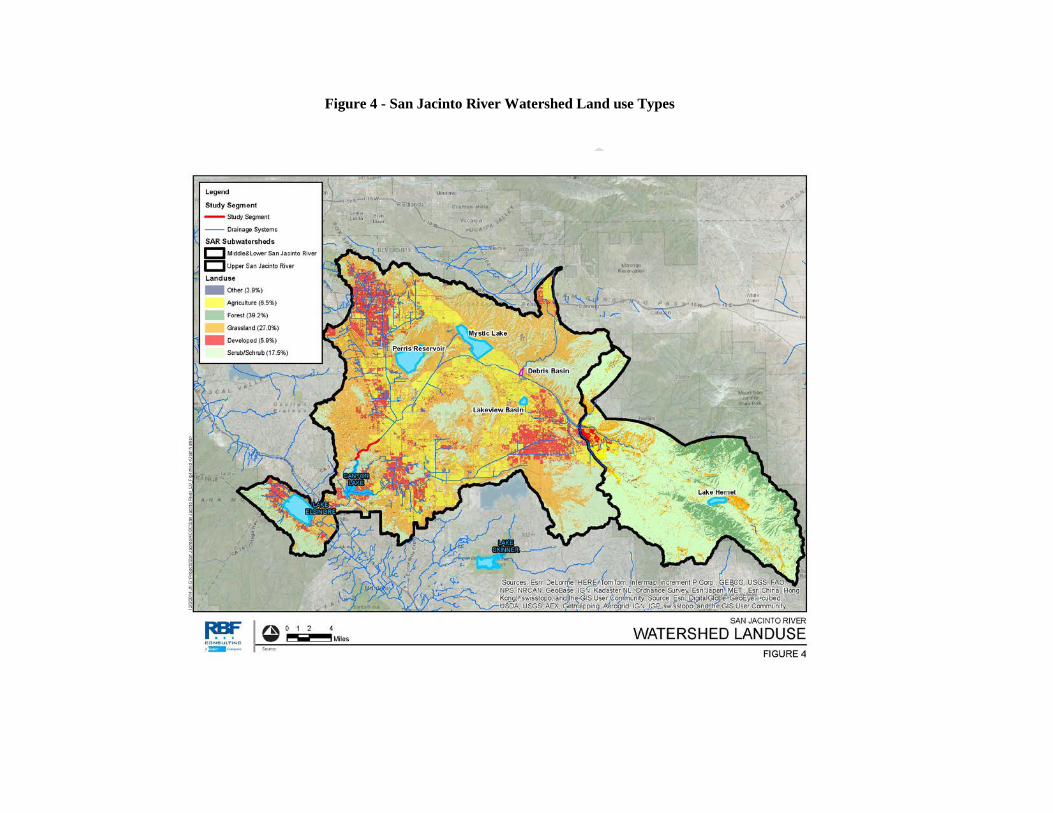
Figure 4 - San Jacinto River Watershed Land use Types
3.3 Hillslope Gradient The subwatershed areas with a hillslope gradient greater than 21% provide the highest potential for erosion. These areas are concentrated on the upper reaches of the San Jacinto River near the San Jacinto Mountains, the Santa Rosa Hills, the Lakeview Mountains, and the Santa Ana Mountains surrounding Lake Elsinore. Majority of the middle and lower subwatershed has a hillslope gradient of 0-10% and has a lower potential for sediment production. While the majority of the developed land is located in the lower sediment production areas, the construction of the impoundments mentioned in section 1 have effectively obstructed a majority of the coarse sediment produced in high yield areas from reaching the downstream watercourse. The hillslope gradients for the San Jacinto River watershed are illustrated in Figure 5.
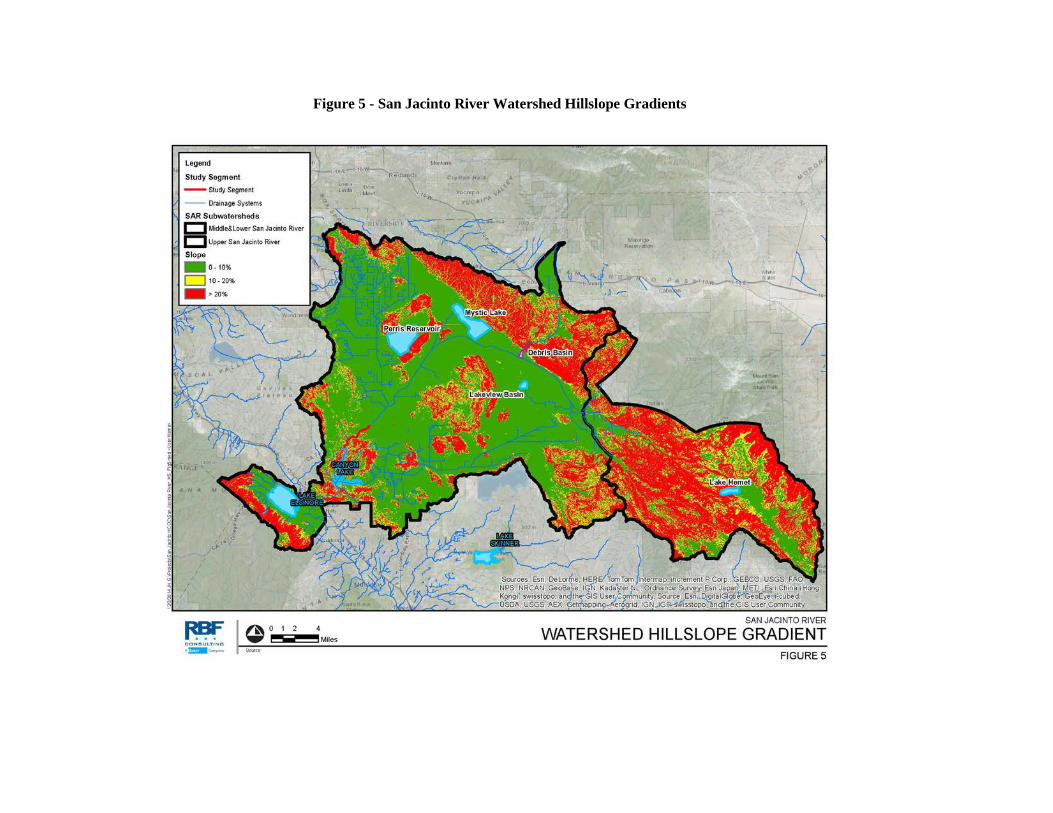
Figure 5 - San Jacinto River Watershed Hillslope Gradients
3.4 Sediment Assessment Most of the sediment within San Jacinto River watershed is produced by the upper watershed where open space land use and steeper slopes are predominant. Most of the sediment produced is captured by Lake Hemet, Mystic Lake, I-215 Freeway Bridge, and a number of federal and locally built facilitates and therefore a small fraction is transported downstream to the lower and middle reaches of the river.
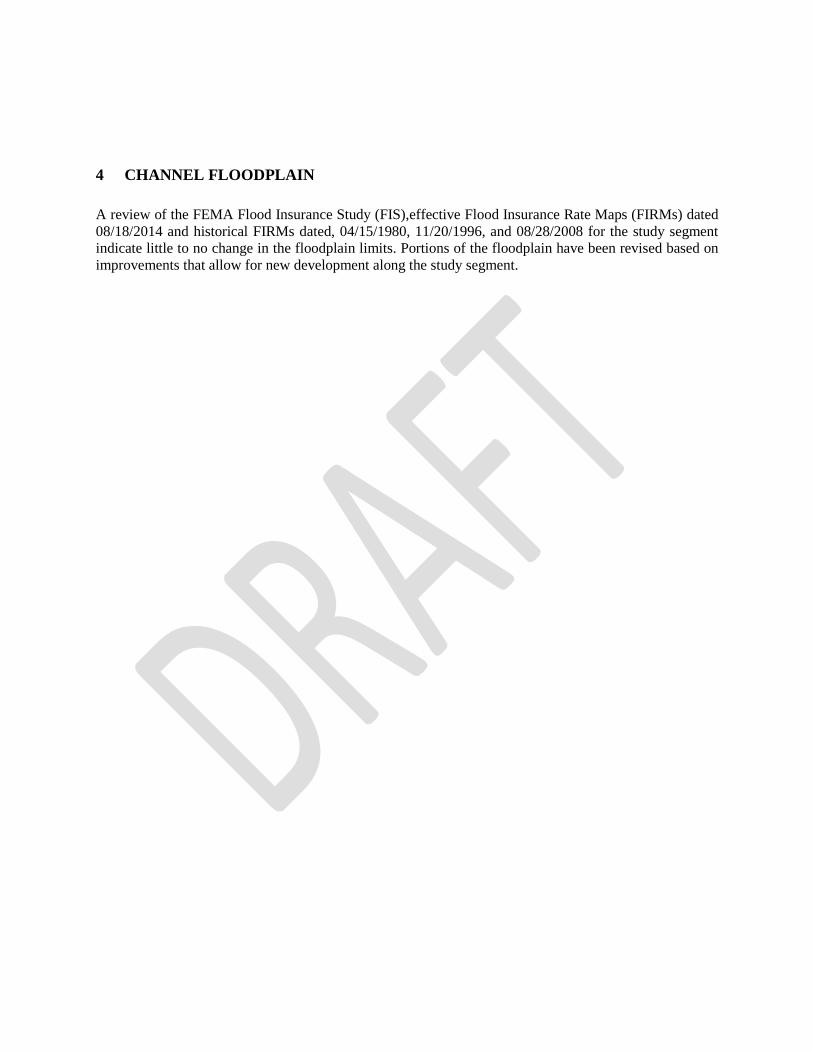
4 CHANNEL FLOODPLAIN A review of the FEMA Flood Insurance Study (FIS),effective Flood Insurance Rate Maps (FIRMs) dated 08/18/2014 and historical FIRMs dated, 04/15/1980, 11/20/1996, and 08/28/2008 for the study segment indicate little to no change in the floodplain limits. Portions of the floodplain have been revised based on improvements that allow for new development along the study segment.
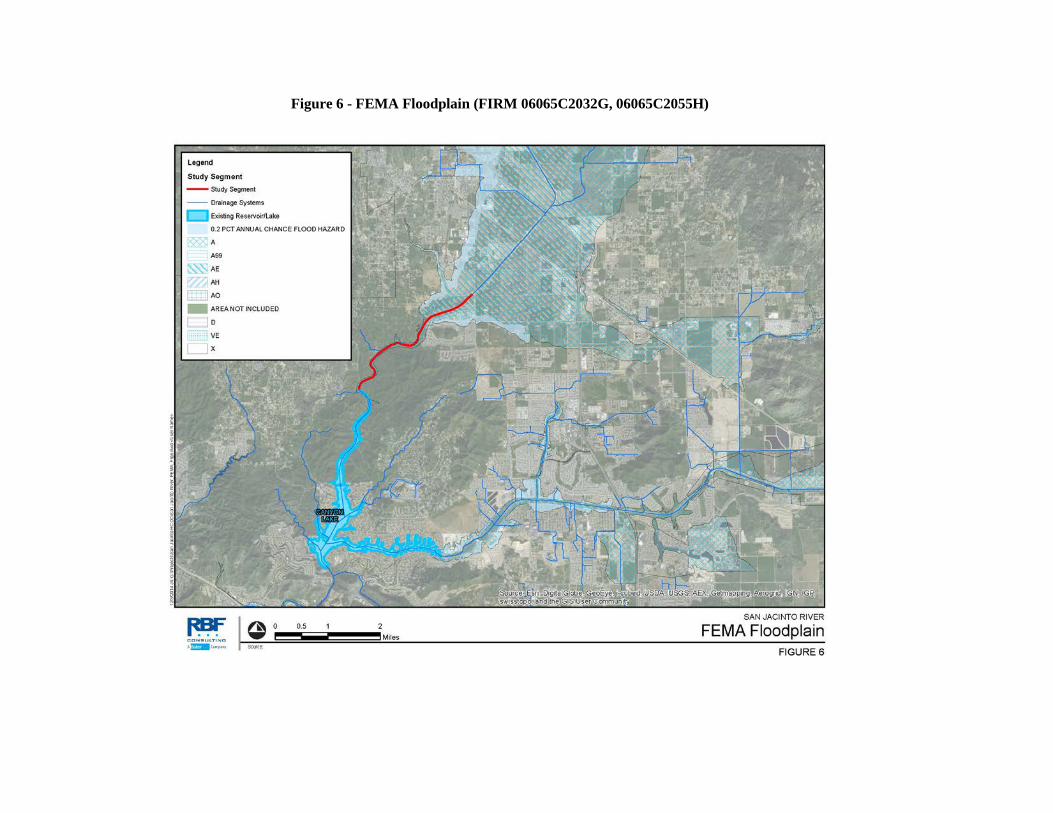
Figure 6 - FEMA Floodplain (FIRM 06065C2032G, 06065C2055H)
5 HISTORICAL EVOLUTION & LATERAL MIGRATION A qualitative overview of historical movement and trends was conducted using a sequence of historical aerial photographs (1962-2010), focusing on the planimetric form and relative width as well as the encroachment of urban development and agricultural operations. The results of this historical assessment identified the channel shape as remaining consistent, with no lateral migration being observed. The 2013 Riverside County Progress Report (RCTLMA, 2013) identifies that significant housing development has occurred within the San Jacinto River watershed between 1980 and 2013. For instance, housing has increased by a factor of 5 and a factor of 6 in the City of San Jacinto and in the City of Perris, respectively. Between 1980 and 2014, the historical aerials do not show any significant lateral migration. As illustrated in Figure 7, there is some lateral migration of the channel, which can be attributed to the ortho-rectification of the historical aerial photographs and the angle at which they were taken. Figure 8 shows that both the width of the stream and the distance to the reference marks have not changed over time. Historical aerial photographs also show no noticeable erosion on the bed and banks of the channel. In addition, the vegetation within the streambed has remained dense and consistent over time along the study reach. Historical aerial photographs are included in Appendix A.
Figure 7 - Historical Streambank Comparison
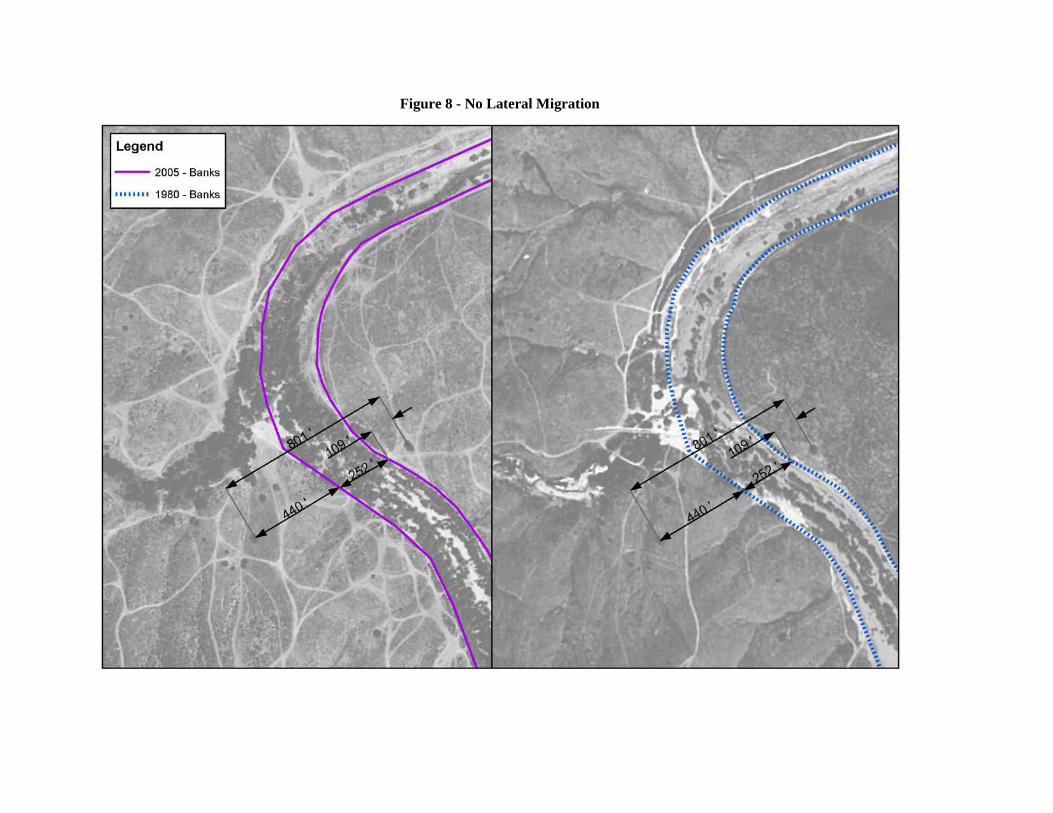
Figure 8 - No Lateral Migration
6 FIELD ASSESSMENT
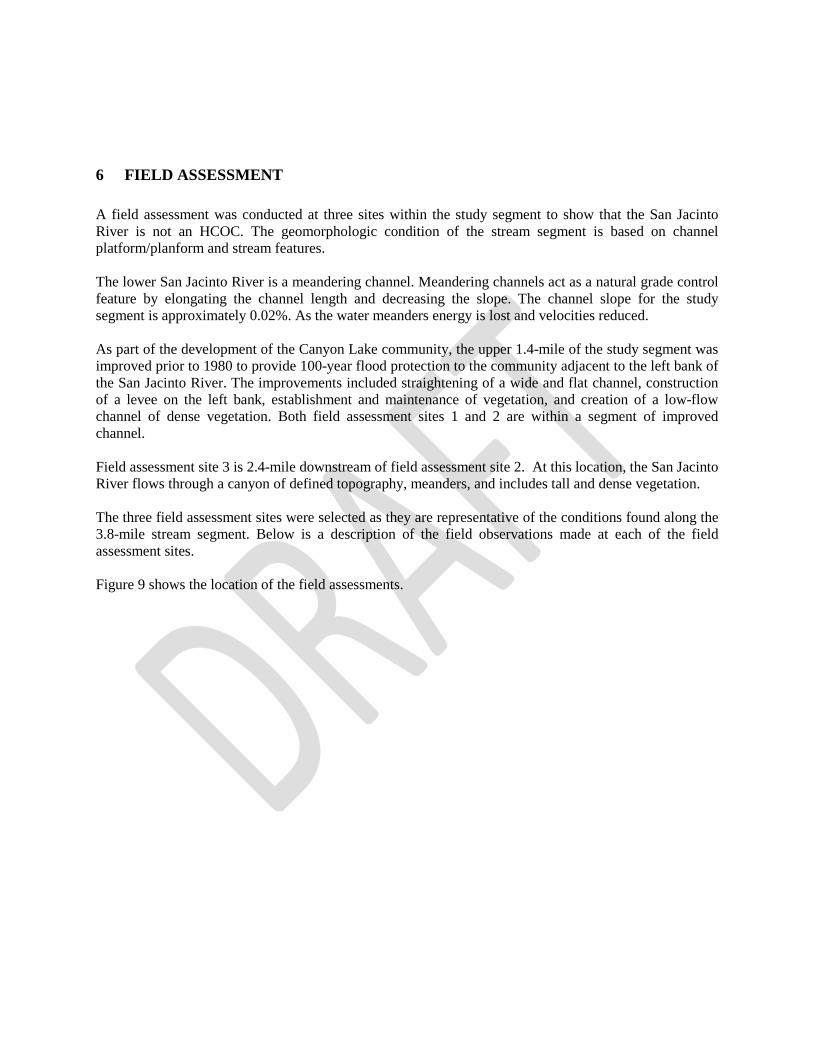
A field assessment was conducted at three sites within the study segment to show that the San Jacinto River is not an HCOC. The geomorphologic condition of the stream segment is based on channel platform/planform and stream features. The lower San Jacinto River is a meandering channel. Meandering channels act as a natural grade control feature by elongating the channel length and decreasing the slope. The channel slope for the study segment is approximately 0.02%. As the water meanders energy is lost and velocities reduced. As part of the development of the Canyon Lake community, the upper 1.4-mile of the study segment was improved prior to 1980 to provide 100-year flood protection to the community adjacent to the left bank of the San Jacinto River. The improvements included straightening of a wide and flat channel, construction of a levee on the left bank, establishment and maintenance of vegetation, and creation of a low-flow channel of dense vegetation. Both field assessment sites 1 and 2 are within a segment of improved channel. Field assessment site 3 is 2.4-mile downstream of field assessment site 2. At this location, the San Jacinto River flows through a canyon of defined topography, meanders, and includes tall and dense vegetation. The three field assessment sites were selected as they are representative of the conditions found along the 3.8-mile stream segment. Below is a description of the field observations made at each of the field assessment sites. Figure 9 shows the location of the field assessments.
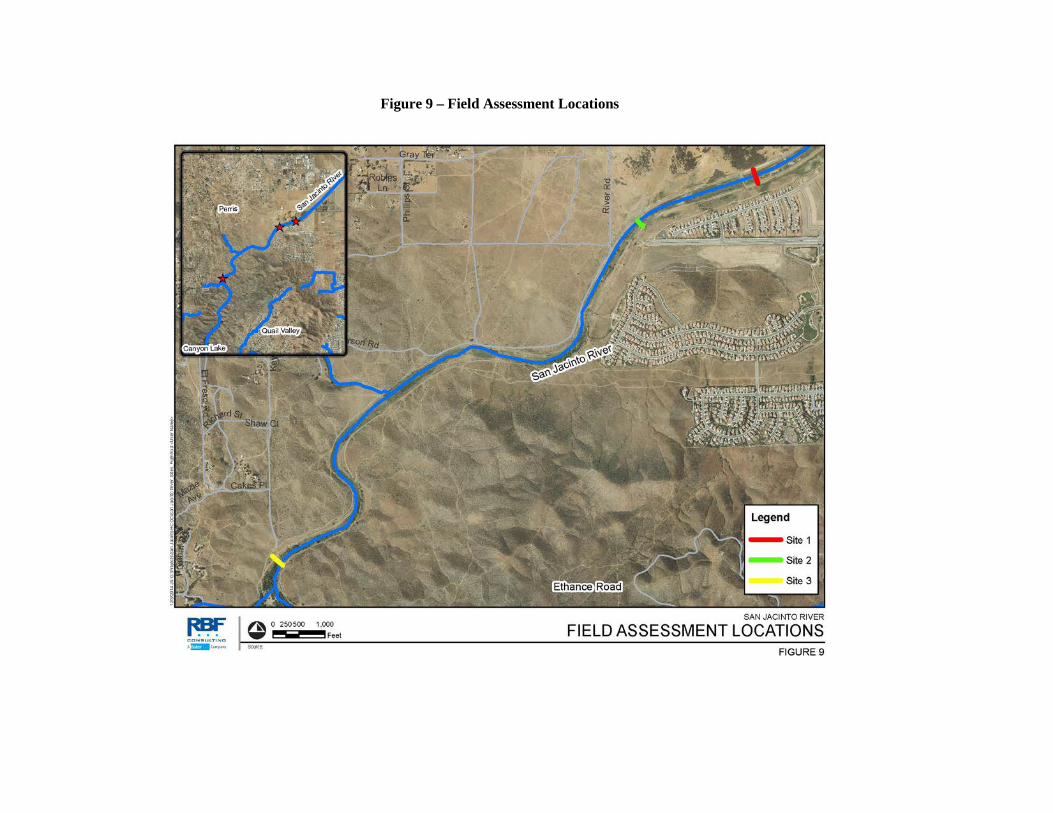
Figure 9 – Field Assessment Locations
Site 1: The channel at this field assessment site shows no signs of headcutting or channel incision. The channel is fairly vegetated with grass, and trees have grown within the low-flow channel. This location is 3,000 feet downstream of Goetz Road. There is a dip crossing roadway 200 feet downstream of this location. These features act as a hard point and resist erosive forces which help with channel stabilization. The channel width is approximately 200-ft with a bank height of approximately 20-ft. The site location is along an engineered earthen section/levee. The low-flow channel at this location has a capacity of approximately 150 cfs.
Vegetation on the channel banks
Low Flow channel – Looking upstream
Looking downstream at dip crossing

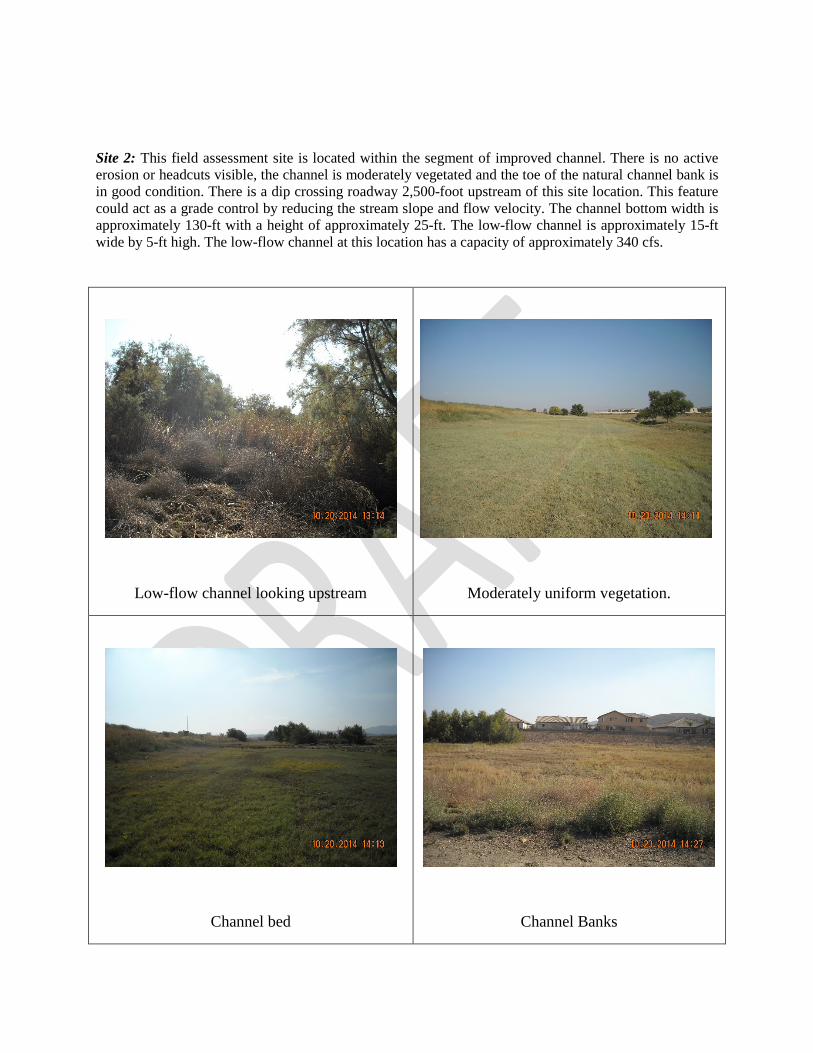
Site 2: This field assessment site is located within the segment of improved channel. There is no active erosion or headcuts visible, the channel is moderately vegetated and the toe of the natural channel bank is in good condition. There is a dip crossing roadway 2,500-foot upstream of this site location. This feature could act as a grade control by reducing the stream slope and flow velocity. The channel bottom width is approximately 130-ft with a height of approximately 25-ft. The low-flow channel is approximately 15-ft wide by 5-ft high. The low-flow channel at this location has a capacity of approximately 340 cfs.
Low-flow channel looking upstream
Moderately uniform vegetation.
Channel bed
Channel Banks

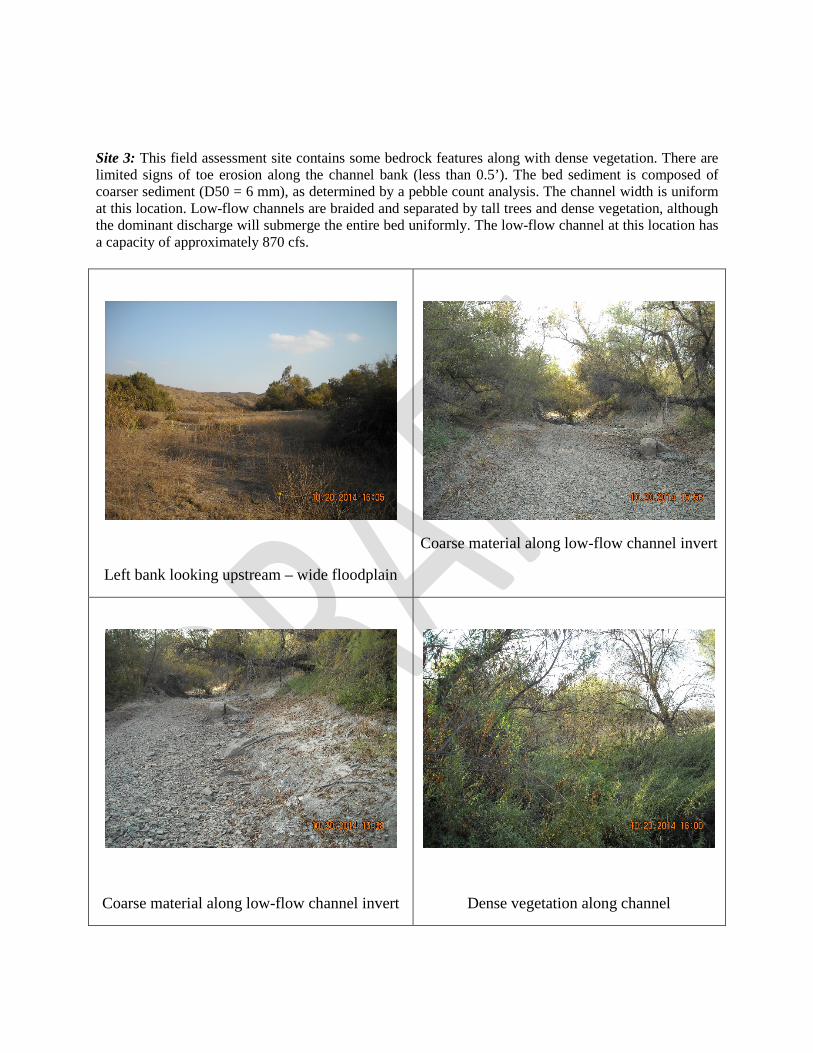
Site 3: This field assessment site contains some bedrock features along with dense vegetation. There are limited signs of toe erosion along the channel bank (less than 0.5’). The bed sediment is composed of coarser sediment (D50 = 6 mm), as determined by a pebble count analysis. The channel width is uniform at this location. Low-flow channels are braided and separated by tall trees and dense vegetation, although the dominant discharge will submerge the entire bed uniformly. The low-flow channel at this location has a capacity of approximately 870 cfs.
Left bank looking upstream – wide floodplain
Coarse material along low-flow channel invert
Coarse material along low-flow channel invert
Dense vegetation along channel
7 BANKS AND STREAMBED ASSESSMENT
7.1 Bank conditions
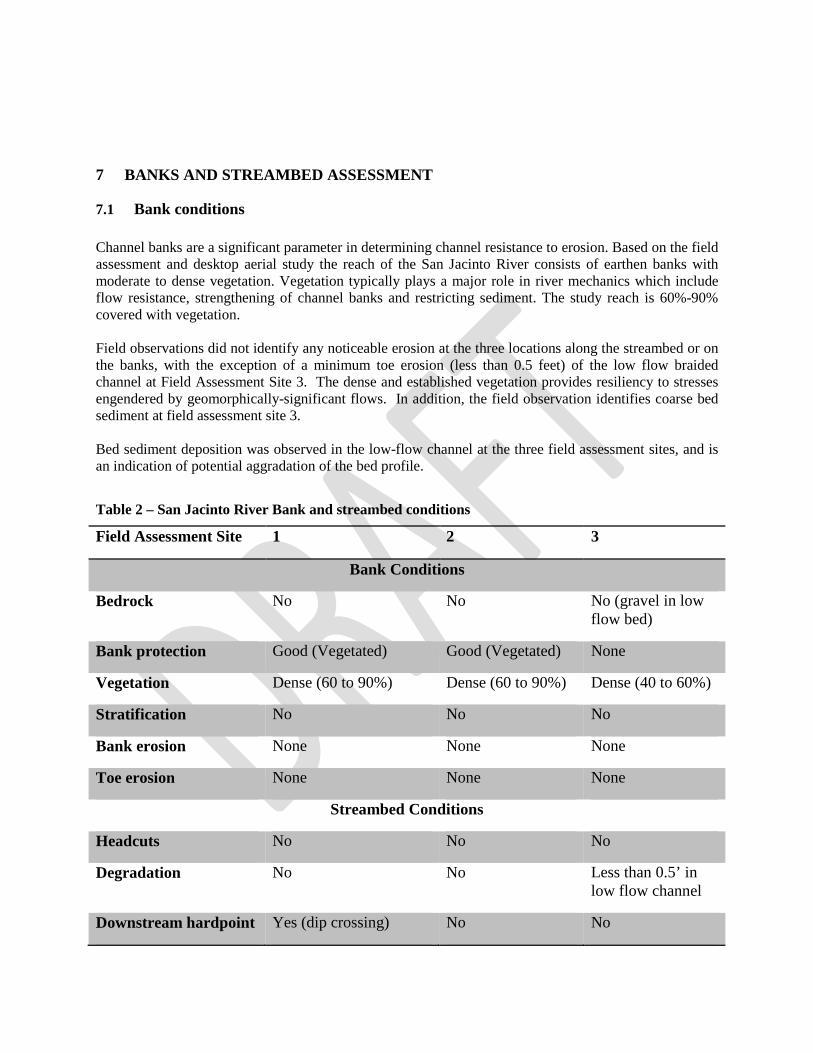
Channel banks are a significant parameter in determining channel resistance to erosion. Based on the field assessment and desktop aerial study the reach of the San Jacinto River consists of earthen banks with moderate to dense vegetation. Vegetation typically plays a major role in river mechanics which include flow resistance, strengthening of channel banks and restricting sediment. The study reach is 60%-90% covered with vegetation. Field observations did not identify any noticeable erosion at the three locations along the streambed or on the banks, with the exception of a minimum toe erosion (less than 0.5 feet) of the low flow braided channel at Field Assessment Site 3. The dense and established vegetation provides resiliency to stresses engendered by geomorphically-significant flows. In addition, the field observation identifies coarse bed sediment at field assessment site 3. Bed sediment deposition was observed in the low-flow channel at the three field assessment sites, and is an indication of potential aggradation of the bed profile. Table 2 – San Jacinto River Bank and streambed conditions
Field Assessment Site 1 2 3
Bank Conditions
Bedrock No No No (gravel in low flow bed)
Bank protection Good (Vegetated) Good (Vegetated) None
Vegetation Dense (60 to 90%) Dense (60 to 90%) Dense (40 to 60%)
Stratification No No No
Bank erosion None None None
Toe erosion None None None
Streambed Conditions
Headcuts No No No
Degradation No No Less than 0.5’ in low flow channel
Downstream hardpoint Yes (dip crossing) No No
Sediment source No No Yes
7.2 Sediment Composition and Allowable Velocity
The watershed soil characteristics were established to assess the erosion potential incorporating vegetative/land cover and soil. Surface pebble count was performed on October 20, 2014 at the three field assessment sites and found that the channel invert consisted of sand to medium cobble particles. At field assessment Site 1 (D50 = 1.5 mm) and Site 2 (D50 = 2.0 mm), bed sediment is composed primarily of very coarse sand. Uniform flow computations performed using HEC-RAS show a water surface elevation of 8.57 feet and 8.67 feet for the 10-year flow event, respectively. Uniform flow computations performed using the Flowmaster normal depth model determined a mean flow velocity of 2.40 feet per second and 2.01 feet per second for the 10-year flow event, respectively. Comparatively, the 2014 FEMA FIS for the study segment shows the velocity ranging from 6.2 feet per second to 12.1 feet per second within the 100-year floodway. At field assessment Site 3 (D50 = 6 mm), bed sediment is primarily composed of fine gravel. Uniform flow computations performed using HEC-RAS show a water surface elevation of 14.58 feet for the 10-year flow event. Uniform flow computations performed using the Flowmaster normal depth model determined a mean flow velocity of 3.36 feet per second for the 10-year flow event, respectively. The Allowable velocity-depth grain chart developed by United States Army Corp of Engineers (USACE) (1991b) identifies the allowable mean velocity of unprotected and non-vegetated stream bed that will not engender any scouring. The chart accounts for the average sediment grain size and the depth of flow. At field assessment site 3, the allowable mean velocity is of 5 feet per second, if the stream was fully unvegetated. At field assessment Sites 1 and 2, the hypothetical allowable mean velocity is of 3 feet per second. Practically, the allowable mean velocity is higher because of the established and maintained vegetation (see Section 6.3). The evaluated stream segment lies within the alluvial floodplain of the San Jacinto River watershed. Because of its topographic location, the field-verified longitudinal slopes are lower than 0.05-percent, thus the mean velocities associated with the 10-year event do not exceed the allowable mean velocities at the three field assessment sites.
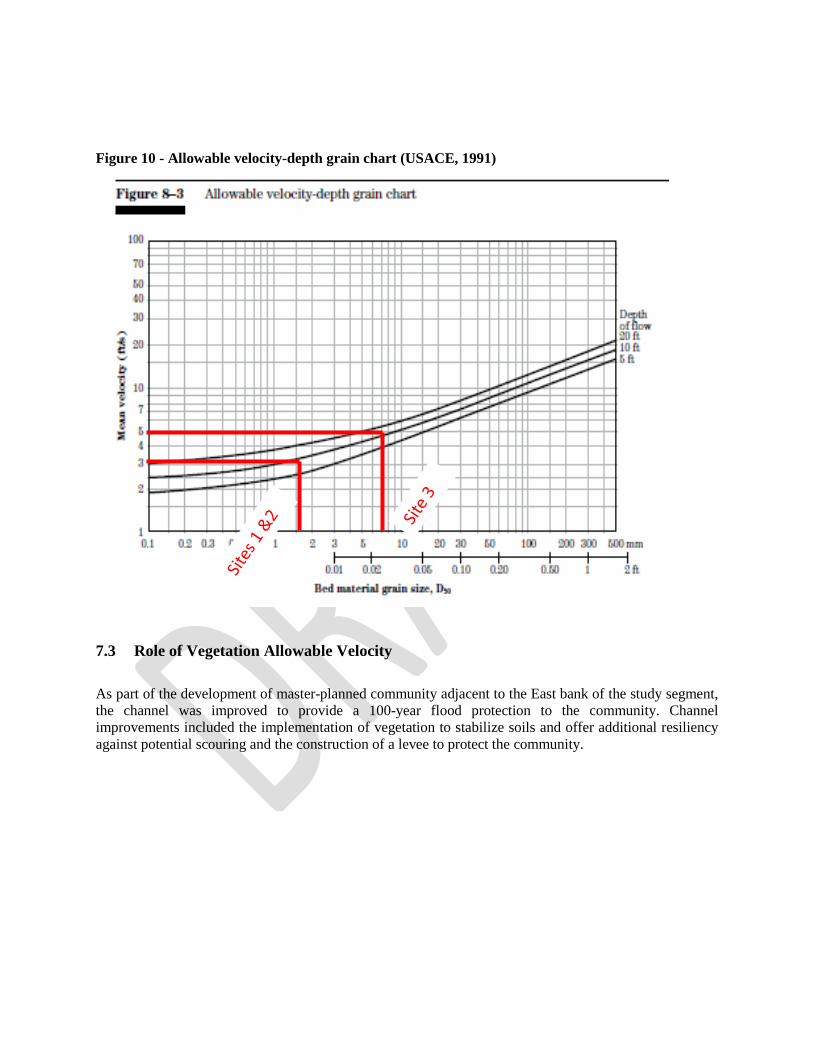
Figure 10 - Allowable velocity-depth grain chart (USACE, 1991)
7.3 Role of Vegetation Allowable Velocity
As part of the development of master-planned community adjacent to the East bank of the study segment, the channel was improved to provide a 100-year flood protection to the community. Channel improvements included the implementation of vegetation to stabilize soils and offer additional resiliency against potential scouring and the construction of a levee to protect the community.
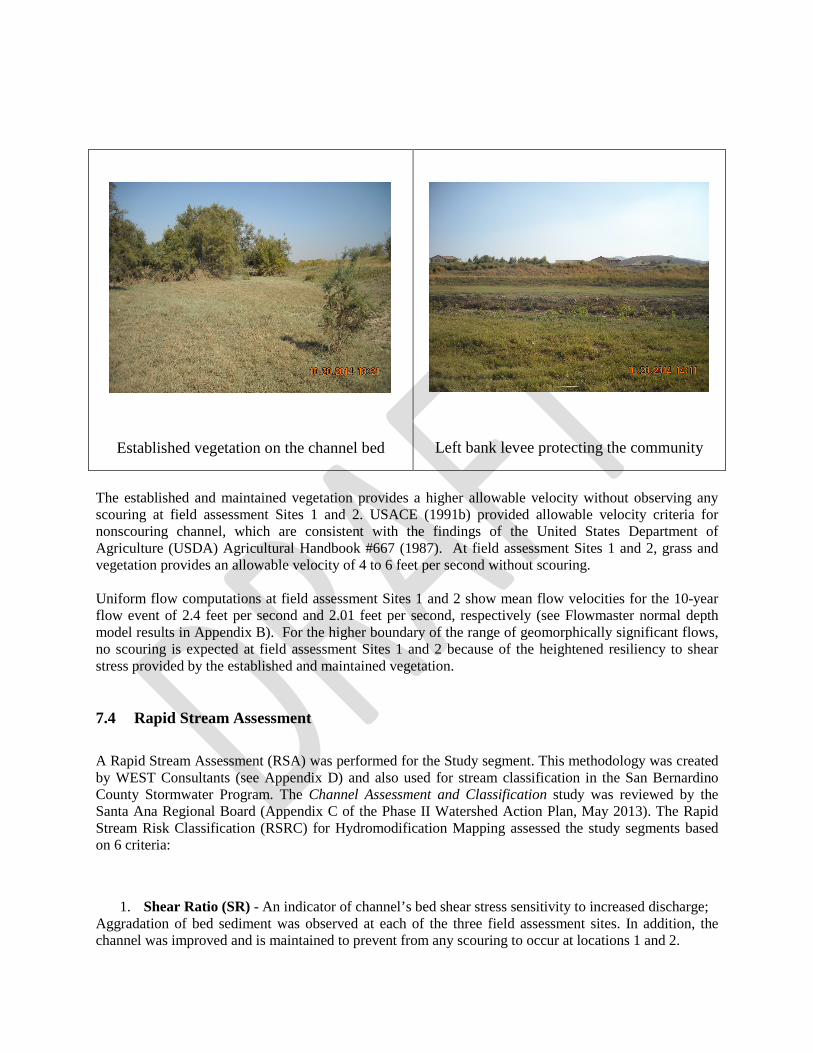
Established vegetation on the channel bed
Left bank levee protecting the community
The established and maintained vegetation provides a higher allowable velocity without observing any scouring at field assessment Sites 1 and 2. USACE (1991b) provided allowable velocity criteria for nonscouring channel, which are consistent with the findings of the United States Department of Agriculture (USDA) Agricultural Handbook #667 (1987). At field assessment Sites 1 and 2, grass and vegetation provides an allowable velocity of 4 to 6 feet per second without scouring. Uniform flow computations at field assessment Sites 1 and 2 show mean flow velocities for the 10-year flow event of 2.4 feet per second and 2.01 feet per second, respectively (see Flowmaster normal depth model results in Appendix B). For the higher boundary of the range of geomorphically significant flows, no scouring is expected at field assessment Sites 1 and 2 because of the heightened resiliency to shear stress provided by the established and maintained vegetation.
7.4 Rapid Stream Assessment
A Rapid Stream Assessment (RSA) was performed for the Study segment. This methodology was created by WEST Consultants (see Appendix D) and also used for stream classification in the San Bernardino County Stormwater Program. The Channel Assessment and Classification study was reviewed by the Santa Ana Regional Board (Appendix C of the Phase II Watershed Action Plan, May 2013). The Rapid Stream Risk Classification (RSRC) for Hydromodification Mapping assessed the study segments based on 6 criteria:
1. Shear Ratio (SR) - An indicator of channel’s bed shear stress sensitivity to increased discharge; Aggradation of bed sediment was observed at each of the three field assessment sites. In addition, the channel was improved and is maintained to prevent from any scouring to occur at locations 1 and 2.
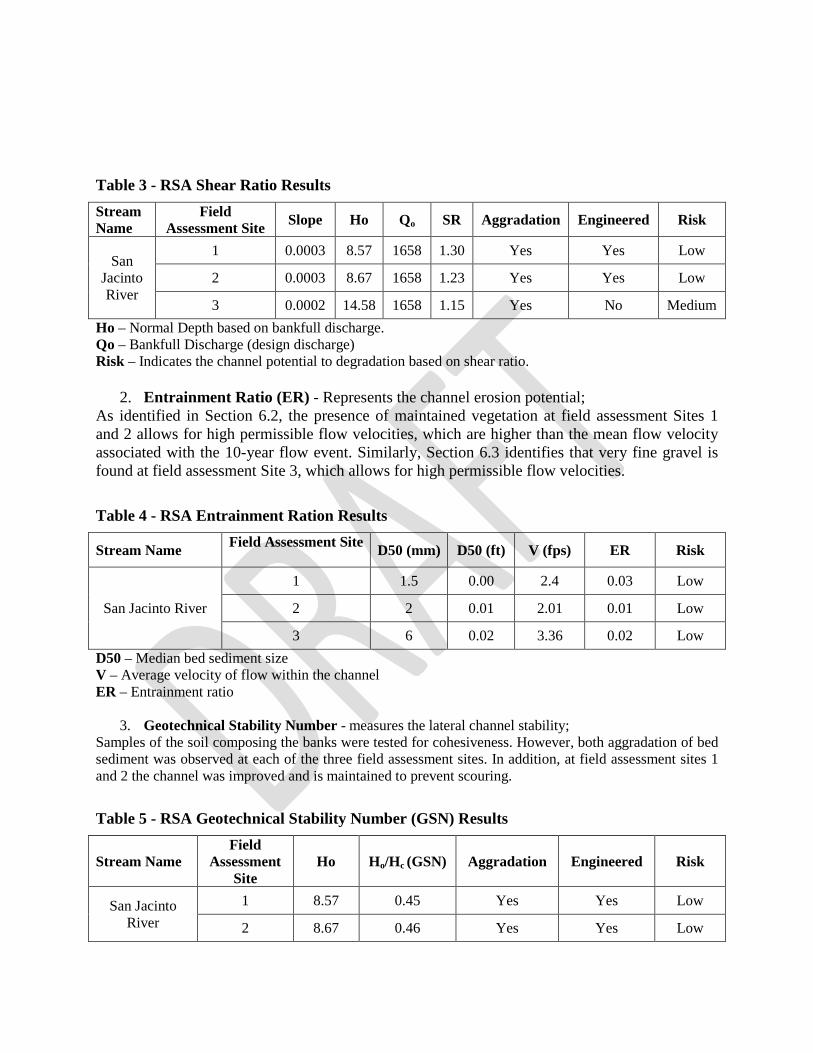
Table 3 - RSA Shear Ratio Results Stream Name
Field Assessment Site Slope Ho Qo SR Aggradation Engineered Risk
San Jacinto River
1 0.0003 8.57 1658 1.30 Yes Yes Low
2 0.0003 8.67 1658 1.23 Yes Yes Low
3 0.0002 14.58 1658 1.15 Yes No Medium Ho – Normal Depth based on bankfull discharge. Qo – Bankfull Discharge (design discharge) Risk – Indicates the channel potential to degradation based on shear ratio.
2. Entrainment Ratio (ER) - Represents the channel erosion potential; As identified in Section 6.2, the presence of maintained vegetation at field assessment Sites 1 and 2 allows for high permissible flow velocities, which are higher than the mean flow velocity associated with the 10-year flow event. Similarly, Section 6.3 identifies that very fine gravel is found at field assessment Site 3, which allows for high permissible flow velocities.
Table 4 - RSA Entrainment Ration Results
Stream Name Field Assessment Site D50 (mm) D50 (ft) V (fps) ER Risk
San Jacinto River
1 1.5 0.00 2.4 0.03 Low
2 2 0.01 2.01 0.01 Low
3 6 0.02 3.36 0.02 Low D50 – Median bed sediment size V – Average velocity of flow within the channel ER – Entrainment ratio
3. Geotechnical Stability Number - measures the lateral channel stability; Samples of the soil composing the banks were tested for cohesiveness. However, both aggradation of bed sediment was observed at each of the three field assessment sites. In addition, at field assessment sites 1 and 2 the channel was improved and is maintained to prevent scouring.
Table 5 - RSA Geotechnical Stability Number (GSN) Results
Stream Name Field
Assessment Site
Ho Ho/Hc (GSN) Aggradation Engineered Risk
San Jacinto River
1 8.57 0.45 Yes Yes Low
2 8.67 0.46 Yes Yes Low
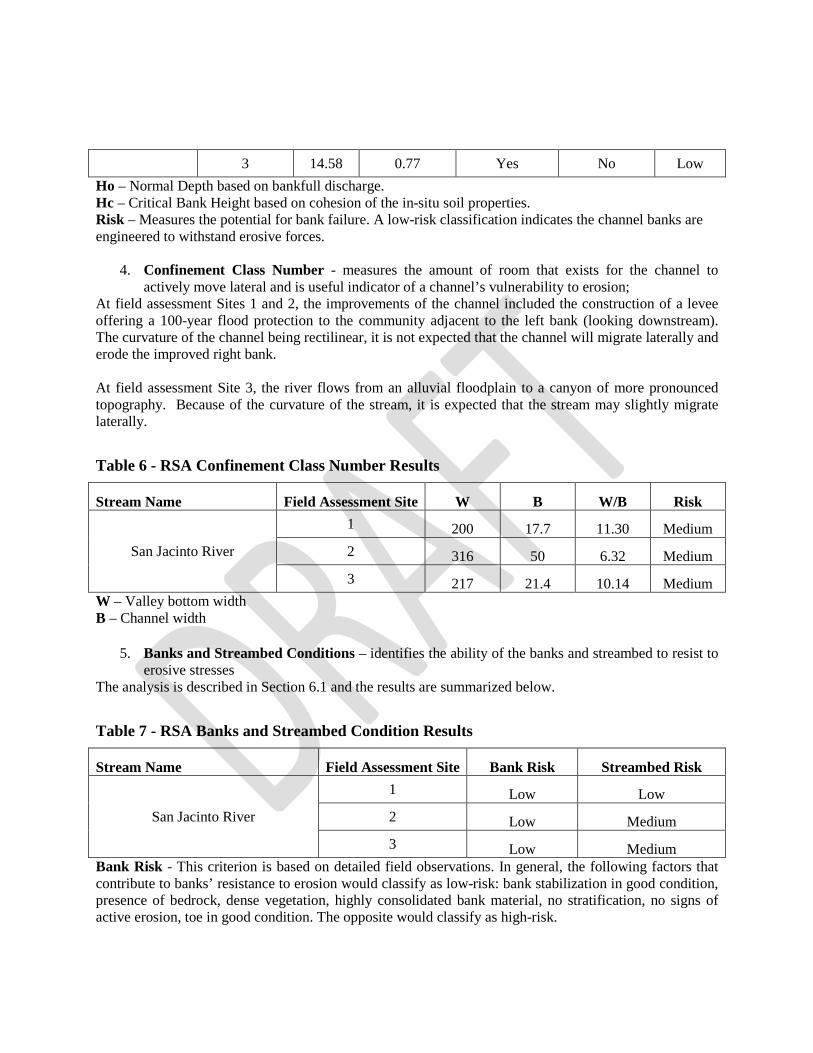
3 14.58 0.77 Yes No Low Ho – Normal Depth based on bankfull discharge. Hc – Critical Bank Height based on cohesion of the in-situ soil properties. Risk – Measures the potential for bank failure. A low-risk classification indicates the channel banks are engineered to withstand erosive forces.
4. Confinement Class Number - measures the amount of room that exists for the channel to actively move lateral and is useful indicator of a channel’s vulnerability to erosion;
At field assessment Sites 1 and 2, the improvements of the channel included the construction of a levee offering a 100-year flood protection to the community adjacent to the left bank (looking downstream). The curvature of the channel being rectilinear, it is not expected that the channel will migrate laterally and erode the improved right bank. At field assessment Site 3, the river flows from an alluvial floodplain to a canyon of more pronounced topography. Because of the curvature of the stream, it is expected that the stream may slightly migrate laterally.
Table 6 - RSA Confinement Class Number Results
Stream Name Field Assessment Site W B W/B Risk
San Jacinto River
1 200 17.7 11.30 Medium 2 316 50 6.32 Medium 3 217 21.4 10.14 Medium
W – Valley bottom width B – Channel width
5. Banks and Streambed Conditions – identifies the ability of the banks and streambed to resist to erosive stresses
The analysis is described in Section 6.1 and the results are summarized below.
Table 7 - RSA Banks and Streambed Condition Results
Stream Name Field Assessment Site Bank Risk Streambed Risk
San Jacinto River
1 Low Low 2 Low Medium 3 Low Medium
Bank Risk - This criterion is based on detailed field observations. In general, the following factors that contribute to banks’ resistance to erosion would classify as low-risk: bank stabilization in good condition, presence of bedrock, dense vegetation, highly consolidated bank material, no stratification, no signs of active erosion, toe in good condition. The opposite would classify as high-risk.
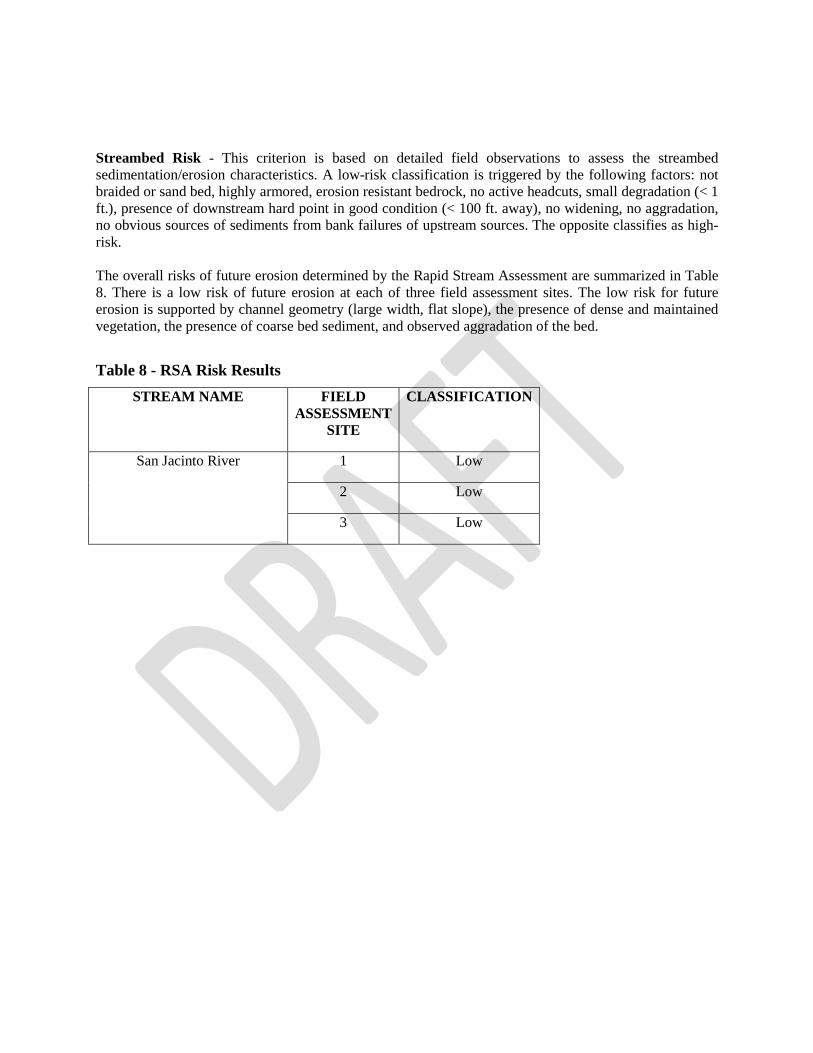
Streambed Risk - This criterion is based on detailed field observations to assess the streambed sedimentation/erosion characteristics. A low-risk classification is triggered by the following factors: not braided or sand bed, highly armored, erosion resistant bedrock, no active headcuts, small degradation (< 1 ft.), presence of downstream hard point in good condition (< 100 ft. away), no widening, no aggradation, no obvious sources of sediments from bank failures of upstream sources. The opposite classifies as high-risk. The overall risks of future erosion determined by the Rapid Stream Assessment are summarized in Table 8. There is a low risk of future erosion at each of three field assessment sites. The low risk for future erosion is supported by channel geometry (large width, flat slope), the presence of dense and maintained vegetation, the presence of coarse bed sediment, and observed aggradation of the bed.
Table 8 - RSA Risk Results STREAM NAME FIELD
ASSESSMENT SITE
CLASSIFICATION
San Jacinto River 1 Low
2 Low
3 Low
8 CONCLUSION Based on the hydrology assessment and analysis of the 3.8 mile reach of the San Jacinto River upstream of Canyon Lake, it has been determined that the San Jacinto River is a natural resistant feature that exhibits the following characteristics:
• Drainage area higher than 100 square-miles and a 100-year peak discharge higher than 20,000 cfs.
• The natural hydrology and sediment loading of different watercourses within the SAR are significantly impacted by the upstream impoundments, which regulate downstream flow.
• Permittees participate in the National Flood Insurance Program and enforce a floodplain management ordinance to regulate development in mapped flood hazard areas.
• The low-gradient of this segment of the San Jacinto River are results in deposition of coarse-grained sediments.
Under the existing and future hydrologic conditions, there will be no scouring of the bed and bank of the stream at each of the three field assessment sites. The additional lines of evidence support that the San Jacinto River is not an HCOC:
• The river has the characteristic geomorphology of a large river, including a flat slope and a wide alluvial floodplain;
• A review of historical aerial photographs did not identify lateral migration of the streambed, even though historical urbanization has occurred;
• The production of bed sediment occurs in the San Jacinto Mountain, thus future development in the alluvial floodplain will not impact the production and conveyance of bed sediment to the downstream reaches;
• Field observations at the three field assessment sites did not identify erosion within the bed and banks of the channel. Deposition of sediment within the streambed indicated that the stream exhibits aggradation;
• Dense vegetation is present within the streambed, particularly within the low-flow channel. In addition, the 1.4-mile segment of improved channel exhibits permanent and maintained vegetation over its streambed and banks. The vegetation provides a higher resiliency to erosive forces.
• Bed sediment is composed of coarse sand and very fine gravel, which are typical of large rivers in alluvial floodplain environment. At field assessment site 3, the bed is predominantly composed of very fine gravel (D50 = 6mm), which provides a high resiliency to erosive forces;
• The rapid stream assessment concluded that the 3.8-mile segment has a low-risk for future erosion.
The lower San Jacinto River watershed has a very low-gradient which limits the discharge velocity along the channel and decreases the erosive energy that would be shown in steeper streams. The 52-year (1962-2014) historical aerial photographs evaluated show no significant change and the floodplain over the study reach is fairly consistent.
9 REFERENCES
1. Riverside County Flood Control and Water Conservation District (District) 2. Hydromodification Susceptibility Documentation Report and Mapping: Santa Ana Region,
January 2012. 3. Causes of Degradation and Aggradation in the Santa Ana Region, May 6, 2014. 4. SAR Hydromodification Management Plan, January 29, 2014. 5. Hydromodification Screening Tools: Field Manual for Assessing Channel Susceptibility, March
2010. 6. Integrated Regional Watershed Management Plan for San Jacinto River Watershed, December
31, 2007. 7. Stream Restoration Design, National Engineering Handbook Part 654, USDA, August 2007 8. Engineering and design – tidal hydraulics proponent. EM 1110-2. U.S. Army Corps of Engineers,
1991 9. Stability of grass-lined open channels, Agricultural Handbook 667. U.S. Department of
Agriculture, 1987 10. San Jacinto Watershed Model Update – Final, Tetra Tech for Lake Elsinore & San Jacinto
Watersheds Authority, 2010 11. Stream Classification Methodology, Rapid Stream Risk Classification for Hydromodification
Mapping, WEST Consultants Inc., 2010 12. Instantaneous Discharge Data, National Water Information System, U.S. Geological Survey
(http://nwis.waterdata.usgs.gov/nwis) 13. Application for a Letter of Map Revision (LOMR) for a Portion of the San Jacinto River. Albert
A. Webb Associates, November 2010 14. San Jacinto Wildlife Area. California Department of Fish and Wildlife, accessed December 2014
(http://www.dfg.ca.gov/lands/wa/region6/sanjacinto/maps.html) 15. 2013 Riverside County Progress Report. County of Riverside Transportation and Land
Management Agency, accessed December 2014 (http://rctlma.org/Departments/Administrative-Services/Riverside-County-Center-for-Demographic-Research/Progress-Reports/Current-Progress-Report)