Embed Size (px)
Citation preview

BLACK BEAR DATA ANALYSIS UNIT MANAGEMENT PLAN
San Juan DAU B-18
GAME MANAGEMENT UNITS
75, 77, 78, 751, & 771 Southwest Region
Prepared for:
Colorado Parks and Wildlife
By: Brad Weinmeister
Terrestrial Wildlife Biologist Date: January 2013
Approved by the Colorado Parks and Wildlife Commission January, 2013

Page 2 of 38
DATA ANALYSIS UNIT PLAN FOR B-18
EXECUTIVE SUMMARY
GMUs: 75, 77, 78, 751, & 771 (Archuleta, and portions of La Plata, San Juan, Hinsdale and Mineral Counties)
Land Ownership: 55% USFS, 30% Private, 12% Southern Ute Tribe, 2% BLM, 1% State
Previous Management Objective: Stable, no population objective for B-18
2012 Mortality Objectives: Harvest objective - 120 Total mortality objective - 135
Strategic Goal and Objectives (adopted January 2013): A stable population following a moderate reduction in the population
Total annual mortality objective: ≤ 240 for up to five years (to 2018), then 98-146
Total annual harvest objective: ≤ 204 for up to five years (to 2018), then 83-125
Black bear Data Analysis Unit (DAU) B-18 is located in southwest Colorado. The DAU includes portions of Archuleta, La Plata, San Juan, Hinsdale, and Mineral Counties. The Game Management Units (GMUs) in B-18 are 75, 77, 78, 751, and 771. Main communities within the DAU are Pagosa Springs, Bayfield, and a portion of Durango. Over half of the DAU is public land. All of the DAU, which is 2,800 square miles, is considered overall black bear range and has quality bear habitat within it.
BACKGROUND
In general, overall annual bear mortality has increased over the last 10 years in B-18. Since 2002, total bear mortality in B-18 has ranged from a low of 40 in 2004 to a high of 135 in 2011, with an average of 81 bears annually. The 3-year and 10-year annual averages of hunting mortality are 90 and 69 bears respectively. The 30 day September high-powered rifle season has the highest average 3-year success rate (~24%) among methods of take, and is responsible for approximately 46% (33 bears) of the annual bear harvest in B-18. Archery hunters take on average 10 bears annually with a 13% success rate. Muzzleloader hunters take an average of 3 bears each year with an 8% success rate. Harvest for hunters in the 4 concurrent rifle seasons averages 21 bears per year. Harvest is disproportional between the east side and west side of the DAU with more harvest occurring on the east side in GMUs 77 and 78.
The percent females in the harvest is 33% and falls within the indices of a stable population. The percent adult female in the female portion of harvest is 44% which is on the border of stable to increasing population trend. The percent of adult males in the total harvest is 22% indicating a decreasing population trend.
Page 3 of 38
Game damage claims have averaged 7 per year in B-18 for the last 10 years. Predation to sheep, goat, and cattle are the most common claim types and the average payment is $1,716. Conflicts between bears and humans are not uncommon in B-18. Often these are the result of bears using developed habitats and food sources that are associated with people.
A suite of habitat and population models have been developed as part of the revision of the B-18 DAU plan to help provide estimates of the projected bear population in the unit. These include a general vegetation/bear density extrapolation, a use/occupancy surface extrapolation based on habitat classifications, and 2 model simulations with varying constraints (liberal and conservative). Results of these models vary greatly.
In 2012 CPW reanalyzed bear populations throughout the state using the most current data available. At that time it was realized that the B-18 population was larger than previously believed. The habitat and population models used in this plan use the most up to date data.
SIGNIFICANT ISSUES
The most significant issue regarding bear management in the San Juan Basin relates to managing conflicts between bears and people. As rural development continues to increase it will cause a decline in bear habitat and place more people in occupied bear range. The human population growth rate within B-18 exceeded the Colorado’s average growth rate over the past 10 years, with significant human development occurring in prime bear habitat. As a result, it can be expected that the amount of human-bear interactions and human-bear conflicts will increase. These conflicts can take a number of forms including game damage to agriculture producers, property damage to homeowners and direct contact between bears and humans across all landscape types. This management issue and what tools should be used to address it are complex and multifaceted. The structure of a DAU plan focuses on one specific tool, primarily hunting, out of a suite of tools including education, enforcement, and habitat modification that can also be used to manage conflicts. Unfortunately, the types of conflicts that occur with bears and the landscapes they occur in often preclude simple changes in licensing or hunting structure from completely resolving the problem. This DAU plan provides harvest related monitoring structures along with strategic goal alternatives that will be directing bear population size in B-18.
MANAGEMENT ALTERNATIVES
The B-18 DAU was managed for a stable bear population prior to 2013. This plan revision outlines three strategic goal alternatives for bear management in B-18.
Maintain a stable population: Total mortality, or off-take, as a proportion of the population should fall in the 7-13% range. Proportion of adult males in the harvest should be within 25-35%, with all females making up 30-40% of harvest. Additionally, adult females should comprise approximately 45-55% of the female harvest. Not every management index must be in complete agreement, but should point toward a stable trend. A stable population following a moderate reduction in the population: Total mortality as a proportion of the population would incrementally be increased over a three year period to 15% and then be maintained at that level for up to two years. Proportion of adult males in the harvest could be low, even below 25%, with total female harvest rates going over 40%. Additionally,
Page 4 of 38
adult female proportions in the female harvest could comprise over 55% of the female harvest. Not every management index must be in complete agreement, but most should point toward a population being held below biotic thresholds. After this period of increased harvest, management would shift to maintain a stable population as outlined above but at the new, lower population size. A stable population following an aggressive reduction in the population: Total mortality as a proportion of the population would incrementally be increased over a three year period to 20% and then be maintained at that level for up to two years. Proportion of adult males in the harvest could be low, even below 25%, with total female harvest rates going over 40%. Additionally, adult female proportions in the female harvest could comprise over 55% of the female harvest. Not every management index must be in complete agreement, but most should point toward a population being held below biotic thresholds. After this period of increased harvest, management would shift to maintain a stable population as outlined above but at the new, lower population size. Based on the input of an internet survey, a 30-day comment period, and CPW personnel, the
Colorado Parks and Wildlife Commission adopted a strategic goal of a stable population following a moderate reduction in the population. Under this management regime, off-take can be incrementally increased over a three year period to 15% and then be maintained at that level for up to two years. After that, off-take will decrease to 10% to achieve a stable population. Throughout this time age and gender proportions in the harvest will be monitored to assess whether the population is increasing, stable, or decreasing and if management goals are being met. It is also recommended by CPW staff that flexibility remains within management prescription of this plan to allow for the most current and applicable data to be used as it becomes available so long as the “spirit” of the adopted management objectives are respected.

Page 5 of 38
BEAR DATA ANALYSIS UNIT PLAN FOR B-18 (San Juan)
Table of Contents
EXECUTIVE SUMMARY - DRAFT ...........................................................................................................2
INTRODUCTION .........................................................................................................................................6
DAU PLANS AND WILDLIFE MANAGEMENT BY OBJECTIVES .......................................................6
DATA ANALYSIS UNIT DESCRIPTION ..................................................................................................7
Location.....................................................................................................................................................7 Land Use and Land Status .........................................................................................................................7 Topography & Climate ..............................................................................................................................8 Vegetation .................................................................................................................................................9
MANAGEMENT HISTORY ......................................................................................................................10
Administrative .........................................................................................................................................10 Hunting Seasons ......................................................................................................................................10 License Allocation history .......................................................................................................................11 Mortality- Harvest and Non-Harvest .......................................................................................................11 Mortality- method of take ........................................................................................................................14 Mortality- age and gender ........................................................................................................................14 Game Damage and Human Conflict Management ..................................................................................16 Current harvest and total mortality objectives .........................................................................................17
MANAGEMENT CONSIDERATIONS .....................................................................................................17
CPW Bear Study .....................................................................................................................................18 Habitat Models ........................................................................................................................................19 Mortality Density and Rates ....................................................................................................................23 Forage Condition - Mast Production Surveys ..........................................................................................24 Population Models...................................................................................................................................24 Mortality Composition and Management Criteria ...................................................................................26 Social Factors ..........................................................................................................................................29
STRATEGIC GOALS AND MANAGEMENT OBJECTIVES .................................................................29
Process for Developing Strategic Goals and Management Objectives ....................................................29 Public Process .........................................................................................................................................29 Strategic Goals ........................................................................................................................................31 Management Objectives ..........................................................................................................................34 Conclusion and preferred DAU strategic goal (with mortality objectives) ..............................................35
REFERENCES ............................................................................................................................................37

Page 6 of 38
INTRODUCTION
The Colorado Division of Parks and Wildlife (CPW) manage wildlife for the use, benefit and enjoyment of the people of the state in accordance with the CPW’s Strategic Plan and mandates from the Colorado Parks and Wildlife Commission and the Colorado Legislature. Colorado’s wildlife resources require careful and increasingly intensive management to accommodate the many and varied public demands and growing impacts from people. CPW is responsible for the maintenance of Colorado’s big game at population levels that are established through a public review process and approved by the Colorado Parks and Wildlife Commission.
DAU PLANS AND WILDLIFE MANAGEMENT BY OBJECTIVES
To manage the state’s big game populations, the CPW uses a “management by objective” approach (Figure 1). Big game populations are managed to achieve objectives established for Data Analysis Units (DAUs).
COLORADO’S BIG GAME MANAGEMENT
BY OBJECTIVE PROCESS
Figure 1. Management by objectives process used by the CPW to manage big game populations on a DAU basis.
DAUs are geographic areas that typically contain an individual big game population. For large mobile carnivores like black bears DAUs are primarily administrative constructs with generally similar habitats and/or human social considerations. DAUs are composed of smaller areas designated as game management units (GMUs), which provide a more practical framework where the management goals can be refined and applied on a finer scale, typically through hunting regulations.
The DAU plan process is designed to balance public demands, habitat and big game populations
Select Management Objectives for a
DAU
Establish Hunting Season Regulations
Evaluate Populations & Compare to DAU
Objectives
Establish Harvest Goal Compatible with
DAU Objective
Conduct Hunting Seasons
Measure Harvest & Population
Demographics

Page 7 of 38
into a management scheme for the individual DAU. The public, hunters, federal and local land use agencies, landowners and agricultural interests are involved in the determination of the plan objectives through input given during public meetings, the opportunity to comment on draft plans and when final review is undertaken by the Colorado Parks and Wildlife Commission.
The strategic goals and specific mortality objectives defined in the plan guide a long term cycle of annual information collection, information analysis and decision making. The end product of this process is a recommendation for numbers of hunting licenses for the DAU (Figure 1). The plan also specifically outlines the management techniques that will be used to reach desired objectives. CPW intends to update these plans as new information and data become available, at least once every ten years.
DATA ANALYSIS UNIT DESCRIPTION
Location
DAU B-18 for black bear (Ursus americanus) is located in the southwest corner of Colorado and contains Game Management Units (GMU’s) 75, 77, 78, 751, and 771 (Figure 2). It includes portions of La Plata, San Juan, Hinsdale, Mineral, and Archuleta counties. B-18 is bounded on the north and east by the Continental Divide, on the south by the New Mexico state line, and on the west by the Animas River and contains the towns of Bayfield, Ignacio, Arboles, Pagosa Springs and the east portion of Durango.
The DAU is 7,241 km2 (2,796 miles2). Land ownership is composed of U.S. Forest Service (55%), Bureau of Land Management (2%), private land (30%), and Southern Ute Tribal lands (12%).
The entire DUA is considered as overall black bear range. Approximately 29% of the DAU is mapped as summer concentration habitat for black bears and 32% as fall concentration areas (Figure 3).
Land Use and Land Status
Durango, Pagosa Springs and Bayfield are the major human population centers in B-18. All three towns are within prime bear habitat and bears are common within and around each. As would be expected human/bear conflicts are common, specifically in Durango and Pagosa Springs, and are related to food sources for bears with garbage being the main attractant. The remainder of the human population is scattered throughout rural communities including large farms and ranches, subdivisions and small towns. Human/bear issues are common wherever there is overlap in bear habitat and human occupation.
Over the past 10 years, the human population growth in a significant portion of B-18 was greater or equal to Colorado’s average growth rate of 16.9%. San Juan County’s growth rate was 25%, Archuleta County’s was 22%, and La Plata County’s was 17%. Hinsdale and Mineral counties growth rate was less than the State’s average and where 7% and -14% respectively (http://quickfacts.census.gov/qfd/states/). As human expansion encroaches into bear habitat, human/bear conflicts can be expected to increase.
The Southern Ute Indian Tribe has 330 square miles (856 km2) in the southern portion of the

Page 8 of 38
DAU (Figure 2). All of the tribal land is considered overall range for black bears as well as portions that are classified as fall concentration and summer concentration areas (Figure 3). Black bears are a protected species on the reservation and are not hunted. This may create a source area for black bears within the DAU.
Figure 2. Location and land management status of B-18.
Topography & Climate
The elevation in the DAU ranges from a low of 6,100 feet where the Animas River exits Colorado to a high of over 14,000 feet at several places along the north boundary of the DAU.
The climate is termed highland mountain, with cool summers at high elevations but very warm at the lowest, and with very cold winters throughout. Snowfall is very heavy throughout the mountainous areas, but is variable at lower elevations. The low elevations receive 8 inches or less of precipitation annually, but some areas in the mountains receive over 30 inches of precipitation. Snowfall can be 250-300 inches per winter at higher elevations in northern portions of the DAU.

Page 9 of 38
Figure 3. Black bear activity layers in B-18
Vegetation
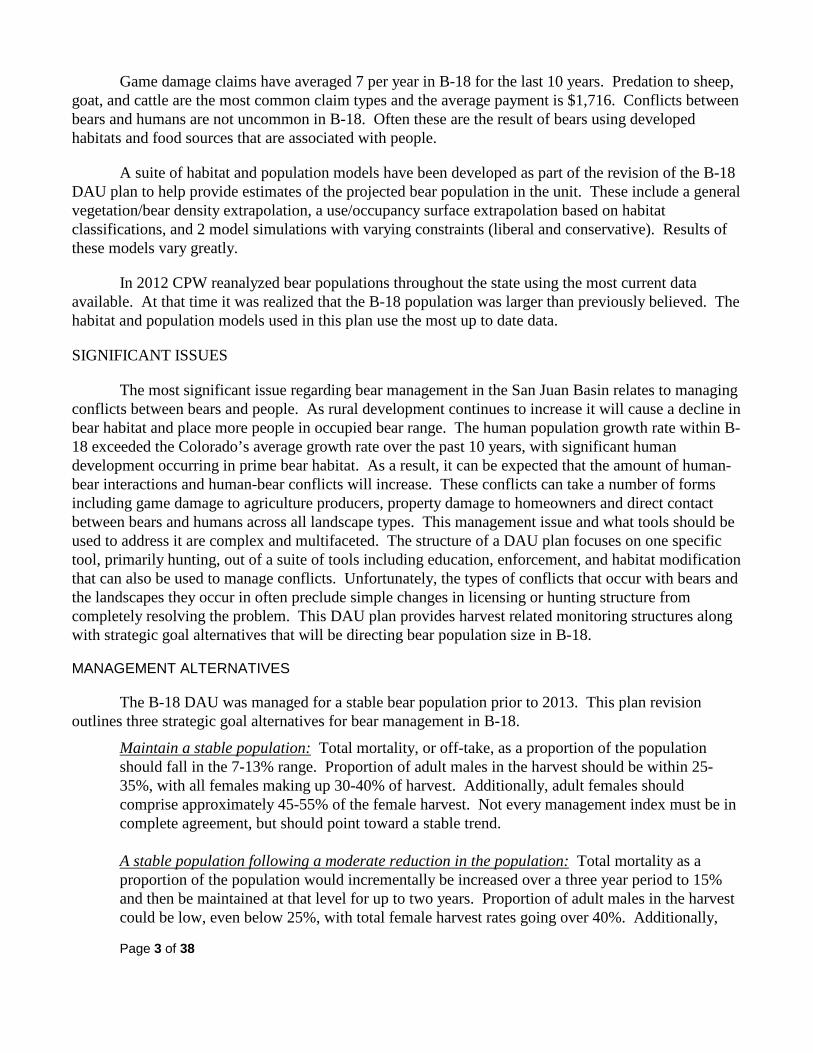
The lower elevations are primarily grassland/shrub and pinyon-juniper. As elevations increase ponderosa pine often with an oak understory, mountain shrub, aspen, and Douglas-fir become dominant. At the highest elevations, sub-alpine spruce fir and Engleman spruce lead into alpine areas of willow or grass/sedge/forbs communities above 12,000 feet (Figure 4).
Agricultural areas and cultivated croplands occur primarily in the southern portion of the DAU south of the Highway 160 corridor or along the Animas River and Pine River bottoms. Agriculture land is predominantly native hay or a mix of native hay and alfalfa. Fruit trees are popular among homeowners, but scarce for commercial production.
Page 10 of 38
Figure 4. Vegetation classes in B-18.
Natural bear habitat could be considered excellent in much of B-18 relative to other parts of Colorado. There is abundant mountain shrub communities for mast and berry forage along with plentiful aspen communities and pinyon-juniper communities. B-18 is a productive bear population.
MANAGEMENT HISTORY
Administrative
The DAU was created in 1995 and the boundary of B-18 has remained unchanged since.
Hunting Seasons
Prior to 1935, black bears were not considered a game animal, which afforded them no protection from being shot on sight if they were encountered or preyed on livestock. In 1935, they were awarded some protection by being classified by the state legislature as a game animal. This established limits on the annual harvest and on the number of licenses that an individual could possess. From 1935 to 1963,
Page 11 of 38
bears were hunted in the fall usually concurrently with the annual deer and elk seasons. In 1964, a spring hunting season was established with unlimited licenses available. This continued until 1986, when licenses for the spring season were limited (Beck 1991). The fall hunting seasons occurred concurrently with the established deer and elk seasons and licenses were unlimited until the limited September rifle seasons were established in 1989. Hunters wishing to hunt bears during the established deer and elk season still had access to unlimited licenses until 2005 when license caps were established for these licenses.
In 1992, a constitutional amendment was passed and changed bear hunting within the state by preventing bear hunting prior to September 1st and outlawed the use of bait and dogs as aids for hunting black bears. Since 1992, the annual hunting seasons have begun on September 2nd annually. Black bear hunting is currently the most restricted since European settlement in the area. This is reflected in the thriving bear populations.
Since 2000, hunting seasons have started with an early, limited, rifle season that runs from September 2nd through September 30th each year, along with concurrent archery, muzzleloader, 1st, 2nd, 3rd and 4th rifle season licenses. Under the current season structure, the 4 concurrent seasons are 5 days, 9 days, 9 days and 5 days in length. Harvest is concentrated in the limited September rifle season as it is concurrent with the initial phases of the bear hyperphagia period. Harvest and success rates decline as hunting seasons progress through the fall months (October-November) due to bears entering the initial stages of winter dormancy.
License Allocation history
License allocations in B-18 have changed some in the last 13 years. From 1999-2004 concurrent rifle (first, second, third and fourth big game rifle seasons) licenses were specified in B-18, but unlimited in number. Archery and muzzleloader bear licenses were unlimited in 1999 to 2002 and then limited in 2003. Beginning in the fall of 2005, all these licenses became over-the-counter (OTC) with caps and only the September rifle license remained limited. OTC licenses are limited (capped number) for each hunt code, but licenses could be purchased without going through the limited draw (bought first-come, first-served). Archery and muzzleloader licenses often sell out the first day they go on sale for archery and within a few days of going on sale for muzzleloader. Licenses that are concurrent with the rifle seasons are greater in number than demand allowing these licenses to be available to hunters who want them. The September rifle licenses available in B-18 have been limited and specified since 1999. In 2008 a PLO season that ran concurrent with the September rifle season was added. These licenses were limited and remain that way (Figure 5).
Mortality- Harvest and Non-Harvest
In general, overall annual bear mortality has increased over the last 10 years in B-18 (Figure 6). Since 2002, total bear mortality in B-18 has ranged from a low of 40 in 2004 to a high of 135 in 2011. While the 10-year average of annual bear mortality was 81, the 3-year average was higher at 102 bears. Mortality from hunter harvest has also increased over the past 10 years. The 10-year average hunting mortality was 69 bears per year, and the 3-year average was 90 bears. Part of the reason for the increasing trend in harvest was due to an increased number of licenses over the same time period. A record number of bears were killed in 2002. This was due to extreme drought conditions when bears

Page 12 of 38
were attempting to obtain food from any sources available, many which were anthropomorphic creating human conflicts. Bears were also more susceptible to harvest and accidental kill (such as caused by vehicle collisions) during this same time period because of their increased activity in searching for food.
Figure 5. Thirteen-year license history in B-18
Harvest mortality and total mortality vary significantly by GMU, but are proportionally consistent across the last 10 years. Game Management Unit 77 and 78 had the highest levels of harvest and total mortality in the DAU, followed by GMUs 75, 751 and 771 respectively (Figure 7). Harvest and total mortality levels appear to be roughly proportional to the amount of fall bear habitat, GMU size and hunting access. The total mortality was comprised mostly of hunter harvest in GMUs 751, 77, and 78. GMU 75 had a higher proportion of non-hunter mortality most likely due to bears within the Durango area. Because of this a higher proportion of bear mortality were road mortalities and CPW removal of conflict bears. GMU 771 also had a high rate of non-hunter mortality with road kills and removal of bears depredating livestock being the two most significant.

Page 13 of 38
Figure 6. Total black bear mortality in B-18, 2002-2011.
The proportion of females in the B-18 harvest has fluctuated over the last 15 years, but has generally remained between 30% and 40% (Figure 8). The exception to this was in 1997, 2001, 2002, and 2007 when it neared 50%. The 3-year average proportion of females in the harvest was 33%, while the 10-year average was 36%. The 3-year and 10-year average proportion of females in non-harvest mortality were both 31%.
Figure 7. Annual average hunting and total mortality by GMU (2002-2011)

Page 14 of 38
Mortality- method of take
The 30 day September rifle season takes the most bears among methods of take in B-18 with a ten year average of 34 bears per year. It accounts for approximately 50% of the annual bear harvest, and has a three year average success rate of 24% (Table 1). Archery hunters contribute an average of 10 bears per year to the harvest and have a 3-year average success rate of 13%. Muzzleloaders harvest an average of 3 bears per year in B-18 with an 8% success rate. The total harvest of all the combined rifle seasons is 21 bears per year. While always low, harvest success rates vary from 1-15% in the first, second and third rifle seasons to nearly 0% in the fourth when many bears are unavailable for harvest due to the onset of winter dormancy.
Figure 8. Proportion of females in B-18 harvest and non-harvest mortality
Mortality- age and gender
Beginning in 2007, a premolar was extracted from harvested bears and other dead bears handled by CPW. These teeth were collected and submitted annually for aging via cementum annuli sectioning. Bear age data have been collected for 4 years, with a total sample in B-18 of 288 bears.
The technique of counting annual rings in cementum of bear teeth is a reliable method for determining ages of black bears (Harshyne et al. 1998, Costello et al. 2004). This is especially true for bears less than five years of age. For bears five years of age or older, errors increased with the age of the bear (McLaughlin et al. 1990, Harshyne et al. 1998, Costello et al. 2004). Since most female black bears in Colorado do not reproduce until their fifth year, classification of females into sub-adult (non-reproducing) and adult (reproducing) age classes using cementum annuli is quite reliable. Therefore, all

Page 15 of 38
female black bears age five and over are considered adults for the purposes of harvest data analyses. Cementum analysis of female black bears in B-18 indicated that the mean age of primiparity is five years and the mean birth interval is two years. Table 1. Black bear harvest history, by method of take, in B-18 (2002-2011)
YEAR Archery Harvest
Muzzleloader Harvest
September Rifle Harvest
1st-4th Rifle Season Harvest
September PLO Rifle
2002 28 7 25 10 -- 2003 3 2 32 22 -- 2004 2 1 25 6 -- 2005 7 1 20 22 -- 2006 9 5 31 19 -- 2007 6 5 26 15 -- 2008 7 2 38 40 5 2009 8 2 32 14 3 2010 15 3 45 30 4 2011 11 4 61 27 12
Average 9.6 3.2 33.5 20.5 6.0
Below are figures showing the frequency of each bear year-class, by gender from the 2007-2010 dataset (Figure 9 & 10). Both harvest and non-harvest mortality sample sizes are greatly skewed towards the sub-adult age classes. In the case of males, the majority of black bear mortalities were in the 1.5 to 3.5-year old classes. Analysis of gender and age from harvested bears can give an indication as to
Figure 9. Age distribution of harvested bears in B-18 (2007-2010)
the population performance. B-18 data averaged over the past four years (2007-2010, 2011 data was not available) indicates this population is most likely stable. The proportion of females in the harvest is 33%

Page 16 of 38
and falls within the indices of a stable population. The proportion of adult females in the female portion of harvest is 44% which is on the border of stable to increasing population trend. The proportion of adult males in the total harvest is 22% indicating a decreasing population trend. For more on these indices refer to the further discussion in Management Considerations section.
Figure 10. Age distribution of bears from all mortality sources in B-18 (2007-2010)
Game Damage and Human Conflict Management
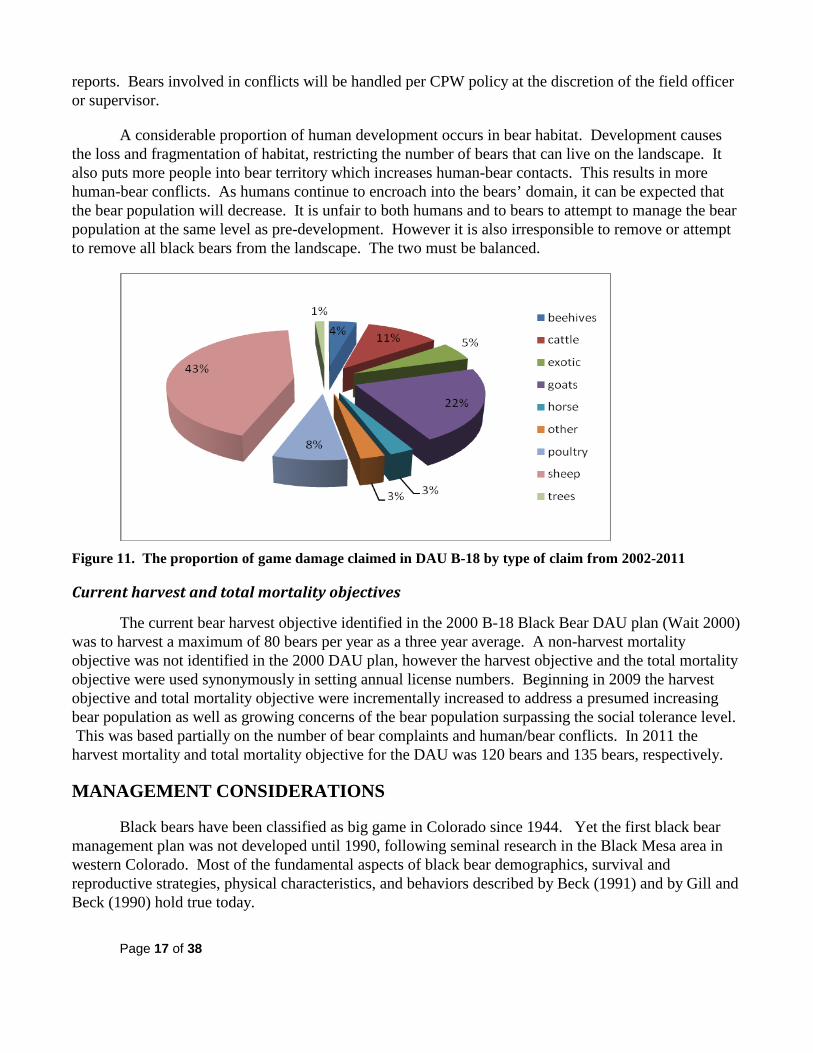
The state of Colorado is liable for damage caused by black bears to livestock and personal property used in the production of an agricultural product. Prior to 2001 the State also paid damage to any personal property incurring damage. In the past 10 years (2002-2011) there were 74 black bear claims paid out totaling $127,036 in B-18. Sheep were the most common claim (44%) followed by goats (22%) and cattle (11%) (Figure 11). The mean claim payment since 2002 was $1,716, with a range from $40 to $9,790. The majority of the claims have been in GMU 75 (52%), followed by GMU 771 (21%). GMU 75 is the only unit in the DAU that has domestic sheep grazing on US Forest Service lands which is a factor to the proportionally higher number of game damage claims in it. GMUs 78 and 751 had 12% and 11% respectively, and finally GMU 77 with 4%.
Human conflicts with black bears in B-18 are common occurrences. In many cases, human interactions with bears are reported to the CPW call centers or field staff. This subset of conflicts is documented in written form by CPW staff and range from a second hand report of a bear being seen in a town or suburb to a physical incident between a bear and a person. While these conflict reports provide a snapshot of individual incidents, lumping reports into categories or evaluating summary statistics can be misleading. There are a number of issues related to capturing the location of the incident versus the location the report was filed from, the reliability of some reports and the bias in reporting associated with increased media coverage on an event or location that can all significantly increase or decrease the number of conflict reports. The CPW continues to document reported human conflicts with bears, and will continue to improve and refine the system and methods used for collecting and synthesizing those
Page 17 of 38
reports. Bears involved in conflicts will be handled per CPW policy at the discretion of the field officer or supervisor.
A considerable proportion of human development occurs in bear habitat. Development causes the loss and fragmentation of habitat, restricting the number of bears that can live on the landscape. It also puts more people into bear territory which increases human-bear contacts. This results in more human-bear conflicts. As humans continue to encroach into the bears’ domain, it can be expected that the bear population will decrease. It is unfair to both humans and to bears to attempt to manage the bear population at the same level as pre-development. However it is also irresponsible to remove or attempt to remove all black bears from the landscape. The two must be balanced.
Figure 11. The proportion of game damage claimed in DAU B-18 by type of claim from 2002-2011
Current harvest and total mortality objectives
The current bear harvest objective identified in the 2000 B-18 Black Bear DAU plan (Wait 2000) was to harvest a maximum of 80 bears per year as a three year average. A non-harvest mortality objective was not identified in the 2000 DAU plan, however the harvest objective and the total mortality objective were used synonymously in setting annual license numbers. Beginning in 2009 the harvest objective and total mortality objective were incrementally increased to address a presumed increasing bear population as well as growing concerns of the bear population surpassing the social tolerance level. This was based partially on the number of bear complaints and human/bear conflicts. In 2011 the harvest mortality and total mortality objective for the DAU was 120 bears and 135 bears, respectively.
MANAGEMENT CONSIDERATIONS
Black bears have been classified as big game in Colorado since 1944. Yet the first black bear management plan was not developed until 1990, following seminal research in the Black Mesa area in western Colorado. Most of the fundamental aspects of black bear demographics, survival and reproductive strategies, physical characteristics, and behaviors described by Beck (1991) and by Gill and Beck (1990) hold true today.

Page 18 of 38
Black bears live at relatively low densities compared to other big game species. They are relatively late maturing and slow reproducers. At high mortality levels, especially if the mortality is driven by poor natural forage conditions, the proportion of females in total mortality increases. When combined with poor reproduction and recruitment the high mortality levels may result in a population decline if a large area is affected or if there are no source areas nearby to produce dispersing sub-adult black bears. In source areas, black bear populations are limited by the capacity of the habitat to support black bears and their social structure. Some species compensate for excessive adult mortality by producing more offspring. However, black bears do not respond in this manner. High adult mortality tends to result in a younger age population and lower productivity (average number of young per litter). Young male black bears disperse from their mother’s home range when they are 1.5 to 2.5 years old and often travel long distances to occupy vacant habitat. However, young female black bears rarely disperse far. As a result, black bear populations far from source areas are slow to recover from over-harvest.
Colorado has elected to adopt a form of source-sink management wherein DAUs will be managed with different overall management strategies. Sink areas will be geographically dispersed and should be allied with corresponding stable/increasing management areas in order to provide proximity to source areas. Other States and Provinces have followed a similar construct under varying names, including light, moderate, or heavy harvest regimes; population increase, stable, or reduction strategies; and population growth, maintenance, or suppressed strategies. Each term is relative because managers can’t know with absolute certainty how many bears there are or what the precise population trajectory may be at the moment. Thus, by necessity harvest or population management strategies must choose a relative approach.
Bears are primarily solitary and their survival strategies do not lend themselves to easy or inexpensive inventory methods. Consequently, managers must rely upon indirect information and indices to population status and trajectory. Although many States and Provinces have adopted similar gender and age class indices, in few circumstances have these indices been directly tested experimentally. Rather, they have resulted from relatively few observational studies within the then existing management frameworks. From these certain conclusions were arrived at based on the observed data and inferences made about the relative vulnerability of age classes and gender cohorts.
Certain age class and gender cohort indices have been shown to have the same values in both increasing and declining populations (Costello et al. 2001), and so caution is always advised to observe them over time rather than instantaneously. If total harvest or mortality in relation to the actual population size (absolute harvest or mortality rate) is quite small, then the relative proportions used by certain indices could have no real relationship to a population effect. Therefore, rather than relying on a few indices, it may be more appropriate to describe and use a suite of indices to inform management decisions. The following indices will be evaluated in relation to black bears in DAU B-18: Habitat models and forage condition monitoring, mortality density, population modeling, hunter success rates, age class and gender composition in harvest, human-bear conflicts, and game damage.
CPW Bear Study
In 2011 CPW began research on human-bear conflicts and the ecology of urban and wildland bears in the Durango area. There are three main objectives of this study. The first objective aims to test management strategies to reduce bear-human conflicts through the reduction of the availability of

Page 19 of 38
anthropogenic food to bears, the development of a plan for translocation of nuisance black bears, and the use of a spatially-targeted harvest program to reduce the number of nuisance bears. The second objective is to determine the influence of urban environments on regional bear population dynamics. For this portion of the project, the research team will evaluate the availability of natural and anthropogenic food resources on bear movement and habitat use, estimate vital rates of bears relative to their use of natural and anthropogenic foods, and quantify the relative effects of resource use, conflict bear management (lethal removals and translocations) and harvest on bear demography. The last objective of the study is to develop population and habitat models to support the sustainable management of black bears. Components of this objective include using multiple data sources (harvest, DNA mark-recapture, and telemetry data) to develop improved bear population models to guide annual harvest regulations and inform statewide estimates of population size and trend. Additionally, project personnel will build regional habitat models to better predict bear density, direct the location of future monitoring efforts, and identify key seasonal resource areas. These objectives address significant questions in bear management and the results will be invaluable for future black bear management.
Habitat Models
Habitat use by black bears primarily depends on the season and available forage. Most black bears in B-18 appear to use the lower elevation pinyon-juniper habitats throughout the year. There are higher concentrations of bears in this habitat in early spring and late fall as it frees of snow and have juniper berry or pinyon nut crops. Black bears in the DAU use higher elevation mountain shrub and aspen communities throughout the summer and fall as they have high abundance and quality forage. In B-18 there is a high black bear use of low elevation riparian areas when berries are plentiful.
Two different habitat models have been developed to relate bear use, occupancy and forage value to project possible populations by extrapolating bear densities. The population projections use densities derived from relevant Colorado data and from literature. Managers applied densities representative of similar habitats and vegetation types in Colorado to develop population projections and then select population ranges which best represent current conditions in the DAU.
General Vegetation/Bear Density Extrapolation
The first model was developed by Gill and Beck (1991) in an unpublished report to the Colorado Parks and Wildlife Commission and was modified by Apker (2003) in an internal CPW report. This model applies subjective probable black bear densities for different vegetation types to the amount of land area of those vegetation types in the various GMUs. The vegetation type amounts for this model were derived from landsat GAP project coarse vegetation types. This vegetation/density model provides a snapshot extrapolation of possible bear population size in Colorado based on current vegetation classes and both measured and projected bear densities in those vegetation classes from the 1990s. This model and its subsequent extrapolation yields a projected bear population in B-18 of 497 black bears (Table 2). This estimate appears to be low based on harvest projections and other analysis.

Page 20 of 38
Table 2. B-18 bear numbers based on vegetation extrapolation
Common Name
Square Miles of
Veg. Class in DAU
Acres of Veg. Class
in DAU
Percent of DAU that is Veg. Class
Bear Density as
1 bear/X
mi2
Bear Numbers
Aspen 171.76 109925 6.14% 1 172 Douglas fir 67.77 43375 2.42% 8 8 Forest dominated wetland/riparian 2.52 1613 0.09% 10 0 Gambel oak 63.71 40776 2.28% 1 64 Juniper woodland 60.38 38646 2.16% 20 3 Mixed conifer 133.99 85751 4.79% 10 13 Mixed forest 8.92 5708 0.32% 6 1 Pinyon Juniper 228.33 146133 8.17% 8 29 Ponderosa Pine 848.76 543206 30.37% 6 141 Spruce fir 622.48 398384 22.27% 10 62 Subalpine meadow 26.10 16702 0.93% 10 3
TOTAL 2234.72 1430219 79.95%
497 Square miles in DAU 2791.13
Use/occupancy Density Extrapolation
The second habitat model was developed in 2008 using the CPW Basinwide GIS Vegetation Classification project data (Figure 4) and CPW wildlife managers were asked to rank each vegetation type for its relative forage value. This results in a two tiered habitat ranking system. Use/occupancy was defined at 4 levels; primary, secondary, edge, and out. Relative forage value was rated for primary, secondary, and edge habitat based upon the perceived potential of those habitats to provide forage for black bears. Use/occupancy terms are defined as follows:
Primary – cover types that bears typically and normally are found at various times of year. Secondary – cover types that bears occasionally use but is not preferred. Edge – cover types infrequently used, but bears may be found in when adjacent to Primary cover types. Out – cover types that are not black bear habitat or those in which bears would only travel
through.
The result of this use/occupancy analysis provides tables of bear habitat in terms of its relative use and state of occupancy and their potential relative forage value. This resulted in a matrix for assigning habitat quality and subsequently for assigning bear densities to different habitat quality to extrapolate a potential population. Table 3 provides the results of the surface area analysis for B-18 and utilizes density values that will be discussed below. The population results for B-18 can be incorporated into modeling efforts or used as comparison to independent population model runs.

Page 21 of 38
Table 3. Results of habitat surface area analysis for use/occupancy population estimate in B-18
BEAR DAU GMU Out
km2
Bear Habitat Categories Bear Density Projected Bear Population Area in km2 Bear/km2
Primary Secondary Edge Total Primary Secondary Edge Primary Secondary Edge Total
B-18
75 636 690 114 233 1,674 0.36 0.23 0.036 249 26 8 283
77 228 1,107 18 89 1,442 0.36 0.23 0.036 399 4 3 406
78 342 1,456 34 145 1,977 0.36 0.23 0.036 524 8 5 537
751 347 662 27 164 1,200 0.36 0.23 0.036 238 6 6 251
771 294 479 63 111 947 0.36 0.23 0.036 173 15 4 191 B-18 Total 1,847 4,395 257 741 7,241 1582 59 27 1668
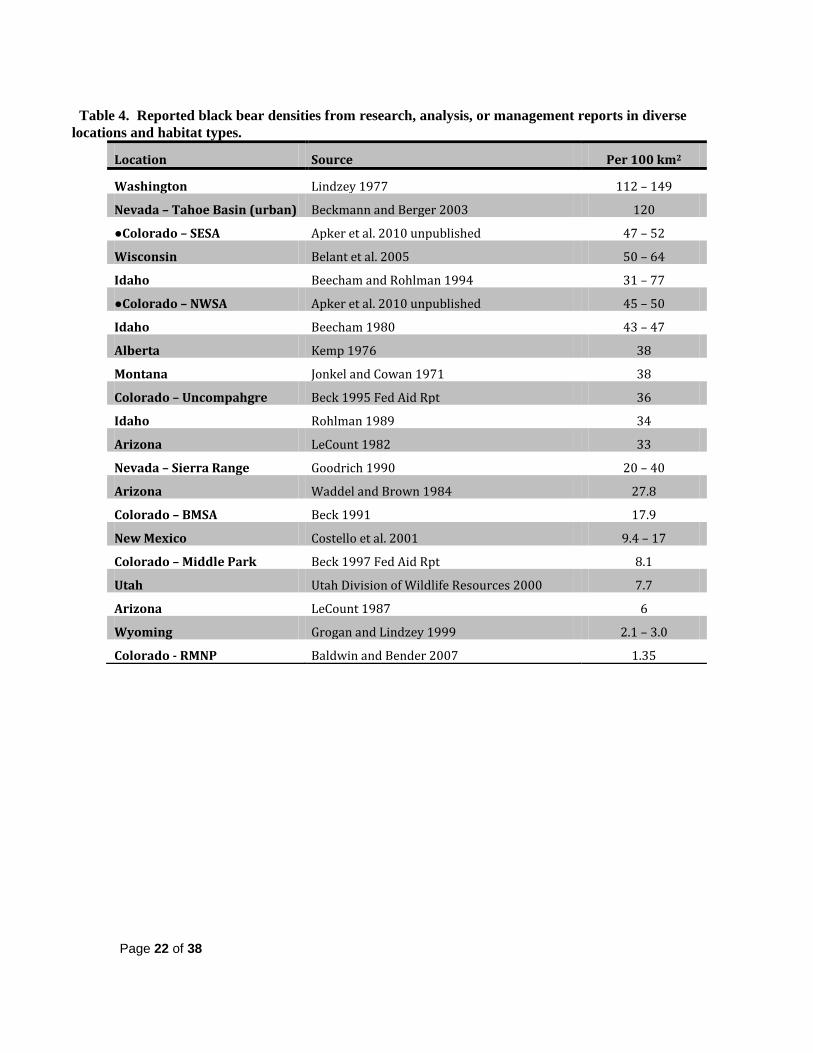
Two Colorado mark-recapture surveys conducted in 2009 indicate higher black bear densities than those found by most studies, analyses, or management reports in the western United States (Table 4). Although density estimates are influenced by the size of the study area and the methods by which density estimates were derived (see Apker et al. 2010); overall habitat quality in the two 2009 study areas in Colorado is probably better than that found in most other study areas. It should also be noted that both the Colorado 2009 survey areas were selected in large part because they were considered among the highest overall quality habitat in Colorado and the exact survey grid areas were structured to include mostly the highest quality cover and forage value habitat for the survey season.
In addition to the two recent studies in Colorado, CPW also studied the black bear population on the nearby Uncompahgre Plateau, GMUs 61 and 62 (Beck 1995). Beck (1995) determined the Uncompahgre Plateau had a density of 36/100 km2 (1 bear /mi2), which was considered to be very high. However, in recent years, based on increasing harvest success and more available anthropogenic food sources, it is plausible that densities in Primary quality bear habitat could be similar to that of Colorado’s NWSA (North West Study Area near Glenwood Springs) or SESA (South East Study Area near Trinidad) management areas.
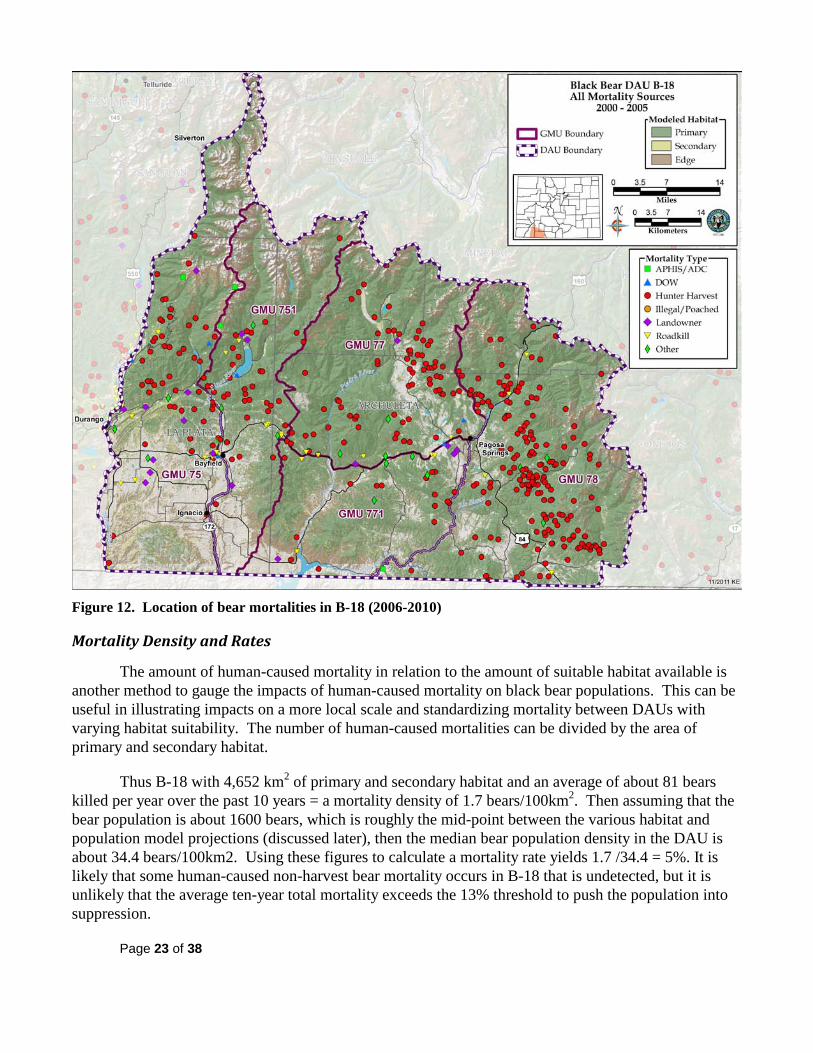
Several other correlates of bear habitat use/occupancy are also available to managers in B-18 including harvest density/locations, roadkill/highway crossings, and conflict hotspots. An evaluation of B-18 harvest locations superimposed on the basic categories of bear habitat use and occupancy indicates that most harvest, and presumably most of the bears, are being found (in the fall) in primary habitat or within edge habitat that very closely adjoins primary habitat (Figure 12). The significant exception to this would be the presence of bears, as documented through roadkill, harvest and conflicts, in high densities in some localized areas of edge habitat (those associated with human food sources).
Page 22 of 38
Table 4. Reported black bear densities from research, analysis, or management reports in diverse locations and habitat types.
Location Source Per 100 km2
Washington Lindzey 1977 112 – 149
Nevada – Tahoe Basin (urban) Beckmann and Berger 2003 120
●Colorado – SESA Apker et al. 2010 unpublished 47 – 52
Wisconsin Belant et al. 2005 50 – 64
Idaho Beecham and Rohlman 1994 31 – 77
●Colorado – NWSA Apker et al. 2010 unpublished 45 – 50
Idaho Beecham 1980 43 – 47
Alberta Kemp 1976 38
Montana Jonkel and Cowan 1971 38
Colorado – Uncompahgre Beck 1995 Fed Aid Rpt 36
Idaho Rohlman 1989 34
Arizona LeCount 1982 33
Nevada – Sierra Range Goodrich 1990 20 – 40
Arizona Waddel and Brown 1984 27.8
Colorado – BMSA Beck 1991 17.9
New Mexico Costello et al. 2001 9.4 – 17
Colorado – Middle Park Beck 1997 Fed Aid Rpt 8.1
Utah Utah Division of Wildlife Resources 2000 7.7
Arizona LeCount 1987 6
Wyoming Grogan and Lindzey 1999 2.1 – 3.0
Colorado - RMNP Baldwin and Bender 2007 1.35
Page 23 of 38
Figure 12. Location of bear mortalities in B-18 (2006-2010)
Mortality Density and Rates
The amount of human-caused mortality in relation to the amount of suitable habitat available is another method to gauge the impacts of human-caused mortality on black bear populations. This can be useful in illustrating impacts on a more local scale and standardizing mortality between DAUs with varying habitat suitability. The number of human-caused mortalities can be divided by the area of primary and secondary habitat.
Thus B-18 with 4,652 km2 of primary and secondary habitat and an average of about 81 bears killed per year over the past 10 years = a mortality density of 1.7 bears/100km2. Then assuming that the bear population is about 1600 bears, which is roughly the mid-point between the various habitat and population model projections (discussed later), then the median bear population density in the DAU is about 34.4 bears/100km2. Using these figures to calculate a mortality rate yields 1.7 /34.4 = 5%. It is likely that some human-caused non-harvest bear mortality occurs in B-18 that is undetected, but it is unlikely that the average ten-year total mortality exceeds the 13% threshold to push the population into suppression.

Page 24 of 38
While there are few reference values for human-caused mortality density in the literature, these values may be used to assess relative trends of harvest in each hunt area through time. Evaluating mortality density in relation to estimated population densities for black bears give some context with which to interpret these data. Miller (1990) demonstrated that under optimal conditions of reproduction and survival, maximum sustainable total mortality for black bears could be as high as 14.2%. Beck and White (1996 unpublished) conducted black bear population simulation analyses which, given their assumptions, produced stable bear populations with annual mortality at up to 15%.
It is unlikely that bears annually experience optimum reproduction and survival conditions due to environmental variation affecting forage conditions and black bear vulnerability to mortality factors. Therefore, we have formulated mortality rate thresholds associated with different management strategies which are somewhat lower than the foregoing:
Management Strategy Mortality Rate Threshold
Increasing < 7% Stable 7% - 13% Decreasing > 13%
Forage Condition - Mast Production Surveys
Forage conditions influence bear reproductive success and certain gender and age specific survival rates due to changes in vulnerability to mortality (Beck 1991, Costello et al. 2001). Therefore, managers consider forage conditions when formulating annual management recommendations. In the fall of 2008, CPW began inventory of mast production conditions. Following survey protocols developed by Costello et al. (2001), we made only slight modifications to provide a basic 5 point matrix of fall mast fruit productions for gamble oak, juniper spp., chokecherry, and serviceberry. Forage condition results within DAUs can then be represented numerically to reflect annual forage conditions. These results can provide managers objective information about relative forage conditions over time and use that with their professional judgment to influence management recommendations. Taking it a step further, the results can be used as one of the many population model inputs as a factor influencing birth rates and cub survival in the population models.
Population Models
Another tool to estimate black bear populations is the development of deterministic population models utilizing annual harvest data and density data, where available, along with biological data from the literature. The starting population estimate for the models was 1000 bears. We used plausible values from the literature for age-specific survival (Costello et al. 2001, Beck 1991, Beck 1997), number of cubs per litter, and estimated forage condition index values to account for changes in reproduction and mortality rates due to poor forage years. For 2008 and 2009, we used actual forage condition index values derived from CPW assessing vegetation. For years prior to 2008-2009, non-hunt mortality was used to determine an index of forage conditions based on the assumption that if non-hunt mortality is higher than average, then forage conditions must have been poor and if non-hunt mortality was lower than average, then forage conditions were probably good. The models used mortality data with harvest as a direct model input and non-hunt mortality adjusted upward since we know records do not document all non-hunt mortality.

Page 25 of 38
While the models do yield population estimates, these estimates are predicated on many plausible, yet assumed input values. The results do appear to conform to population extrapolations derived by the habitat models. Nonetheless, the value of the models is most worthwhile as an assessment of trends in population trajectories and responses to mortality and forage condition variability rather than the absolute population estimate produced.
Two models were developed for B-18, one model with liberal, but plausible model parameters, and another model with more conservative, but plausible parameter values.
Assumptions common to both the Liberal and Conservative Models
The initial population size of 1000 bears and the starting age distributions for both models was derived from extrapolations of habitat quantity and known bear densities from the literature. Sex ratio at birth was assumed to be 50:50, with an average litter size of two. Based on 2007-2009 tooth data, there were 51 adult female bear samples in B-18 that allowed for evaluation of primapatry and birth interval. This sample supports using five years as the age of female primapatry in B-18 and using a birth interval of two years between liters. Both models employ a non-harvest multiplier of 1.5 that increases the value of the reported non-harvest mortality.
Subadult and adult survival rates were largely midpoints of published ranges in New Mexico and Colorado (Costello et al. 2001, Beck 1991, Beck 1997), while cub survival fell within published ranges but was modulated by a mast index that is intended to reflect documented forage conditions on a yearly basis. Predicted population and age structure levels beyond the current year (2011) relied upon the continuation of assumptions used in the preceding years, as well as projected future mortality levels at levels necessary to stabilize the population.
Liberal Model
The differences in assumptions between the liberal and conservative models are related to survival rates. Club survival rates were variable according to forage conditions and the model utilized the following rates: 37% for poor food years, 67% for average food years, and 80% for good food years. In addition to survival rates, the liberal model utilized the following survival rates for the other age and sex classes of bears: Yearling female was 90%, sub-adult female was 93%, adult female 94%, yearling males was 91%, sub-adult males was 90%, and adult males was 89%. Modeling results from using the liberal inputs and assumptions were:
2011 Post-hunt population estimate 2,059 Total adult bears (male/female) 853 (223/630) Conservative Model
The conservative model used lower survival rates than the liberal model. Again cub survival rates were variable according to forage conditions and the model utilized the following rates: 37% for poor food years, 65% for average food years, and 80% for good food years. In addition to survival rates, the liberal model utilized the following survival rates for the other age and sex classes of bears: Yearling female was 89%, sub-adult female was 92%, adult female 93%, yearling males was 90%, sub-adult males was 89%, and adult males was 89%. Modeling results from using the liberal inputs and
Page 26 of 38
assumptions were:
2011 Post-hunt population estimate 1,546 Total adult bears (male/female) 649 (144/505)
Mortality Composition and Management Criteria
Black bear vulnerability to harvest and other mortality factors varies depending upon differences in habitat, hunter effort or pressure, access, and forage conditions. Bears are less vulnerable where cover is dense over large geographic areas. They are more vulnerable where vehicle access is good. The greatest influence in annual variation in bear vulnerability is forage conditions. When natural forage quality or availability is poor bears must become much more mobile in search of food, especially during fall hyperphagic periods. Increased mobility tends to result in bears being more visible to hunters, more likely to encounter human food sources, more frequently found along or crossing roads, and more concentrated in areas where there may be relatively more forage available. All of these tendencies can result in increased hunter harvest, increase human conflict mortality, more roadkills and other forms of mortality. Not all segments of bear populations are equally vulnerable however, regardless of other influences. Hunting pressure affects harvest rate, which affects age structure, sex ratios, and densities of black bear populations. Adult males are typically most vulnerable because they are bold (often use open areas) and have larger home ranges. Sub-adult males are slightly less vulnerable. Consequently, the adult male segment of a population is the first to be reduced under hunter pressure. As harvest rates increase, the proportion of sub-adult black bears (those less than 5 years old) in the harvest typically increases, whereas the proportion of adult males declines. A low percentage of adult males (≥5 years old) in the harvest may be an indication of over-harvest. This criterion is a more sensitive indicator of black bear population levels than median age (Idaho Dept. of Fish and Game 1998). The mean percent of adult males in the harvest in relatively stable populations in Idaho (Beecham and Rohlman 1994) and New Mexico (Costello et al. 2001) under moderate to high harvest levels was 30% and 28%, respectively. Studies of black bear populations in Alaska, Virginia, and Arizona showed similar relationships between lightly and heavily hunted populations. Therefore, 25% to 35% adult males in the harvest could indicate a stable black bear population. Levels lower than 25% may indicate a higher level of harvest, which has reduced the adult male segment of the population; whereas levels higher than 35% may indicate a much lighter harvest level. Based on the 4 years of available data in B-18 (2007-2010), it appears that current harvest levels could be slightly high, as adult males comprise 22% of the total harvest (Figure 13).
As harvest levels increase and additional adult and sub-adult males are removed from an area, the proportion of females in the harvest begins to increase (Fraser et al. 1982, Kolenosky 1986, Beecham and Rohlman 1994), because female are least vulnerable, especially if accompanied by cubs. The average percent females in the harvest of black bear populations under moderate and high hunting pressure in Idaho (Beecham and Rohlman 1994) and New Mexico (Costello et al. 2001) was 35% and 40%, respectively. Beecham and Rohlman (1994) suggest a desired proportion of female harvest of 35% to maintain a stable population, whereas Beck (1991) suggested maintaining <40% females in harvest. Therefore, a range of 30% to 40% females in the total harvest could indicate a stable black bear population. Data Analysis Unit B-18 is within the stable range using this indicator, with a 33% female harvest rate over the last four years (2007-2010) (Figure 13). Proportions higher than 40% may suggest reduction of the number of females in the population. Monitoring this criterion helps ensure a stable

Page 27 of 38
reproductive portion of the population and the ability of the population to rebound in the event of a decline.
Figure 13. Bear harvest in B-18 by proportion of age class and gender (2007-2010).
With increasing harvest of a black bear population, younger females are removed and older females become more common in the harvest. Thus, the proportion of adults in the female harvest would rise with increasing harvest rates, increasing mean age of females in the harvest (Kolenosky 1986, Beecham and Rohlman 1994). This phenomenon is especially important with late-reproducing species like bears, since removing adult females has the enhanced effect of not only reducing the number of bears in the population, but also decreasing reproductive potential of the population and, thus, its ability to respond to declines. The delayed response of slow reproducing populations to reductions was noted by Harris (1984) and was demonstrated in modeling efforts by Miller (1990), who predicted black bear populations reduced by 50% would take an average of 17 years to recover if hunting pressure was reduced by 25%.
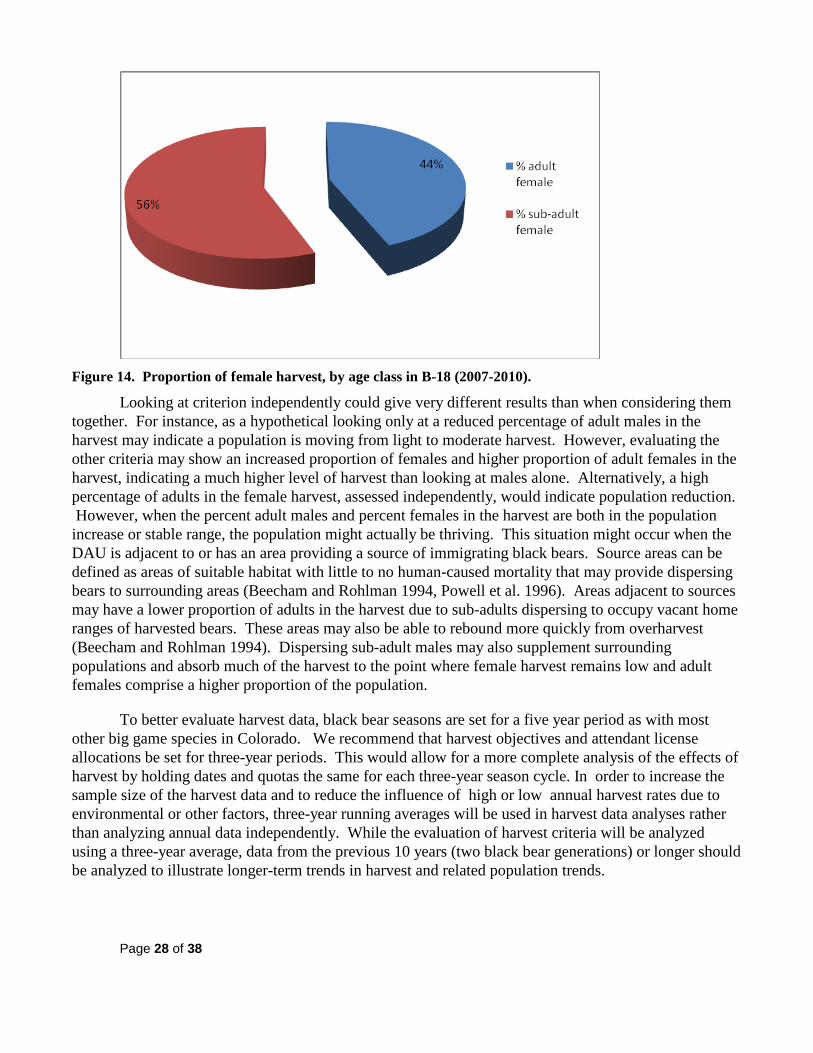
The percent of adults in the female harvest, rather than mean or median age of the females in the harvest, can also be used to gauge the presumed population trajectory. Averaged over a three-year period, this criterion provides a more meaningful measurement of female harvest age structure, especially in areas with small sample sizes. The mean percent of adult females in the harvest of two New Mexico black bear populations under moderate and high harvest pressure was 55% and 70%, respectively (Costello et al. 2001). The mean percent adult females in the Wyoming statewide female black bear harvest from 1994-2005 was 47%, with a range of 32% – 57%, suggesting that 45 – 55% adult female harvest provides a stable proportion of adult females (Wyoming Game and Fish Dept. 2007). In B-18, adult females comprised 44% of the female harvest from 2007-2010, indicative of a stable population under this criteria (Figure 14).
Page 28 of 38
Figure 14. Proportion of female harvest, by age class in B-18 (2007-2010).
Looking at criterion independently could give very different results than when considering them together. For instance, as a hypothetical looking only at a reduced percentage of adult males in the harvest may indicate a population is moving from light to moderate harvest. However, evaluating the other criteria may show an increased proportion of females and higher proportion of adult females in the harvest, indicating a much higher level of harvest than looking at males alone. Alternatively, a high percentage of adults in the female harvest, assessed independently, would indicate population reduction. However, when the percent adult males and percent females in the harvest are both in the population increase or stable range, the population might actually be thriving. This situation might occur when the DAU is adjacent to or has an area providing a source of immigrating black bears. Source areas can be defined as areas of suitable habitat with little to no human-caused mortality that may provide dispersing bears to surrounding areas (Beecham and Rohlman 1994, Powell et al. 1996). Areas adjacent to sources may have a lower proportion of adults in the harvest due to sub-adults dispersing to occupy vacant home ranges of harvested bears. These areas may also be able to rebound more quickly from overharvest (Beecham and Rohlman 1994). Dispersing sub-adult males may also supplement surrounding populations and absorb much of the harvest to the point where female harvest remains low and adult females comprise a higher proportion of the population.
To better evaluate harvest data, black bear seasons are set for a five year period as with most other big game species in Colorado. We recommend that harvest objectives and attendant license allocations be set for three-year periods. This would allow for a more complete analysis of the effects of harvest by holding dates and quotas the same for each three-year season cycle. In order to increase the sample size of the harvest data and to reduce the influence of high or low annual harvest rates due to environmental or other factors, three-year running averages will be used in harvest data analyses rather than analyzing annual data independently. While the evaluation of harvest criteria will be analyzed using a three-year average, data from the previous 10 years (two black bear generations) or longer should be analyzed to illustrate longer-term trends in harvest and related population trends.

Page 29 of 38
Social Factors
The social factors that influence management of black bears in B-18 include game damage, human conflicts, and hunting opportunity. As mentioned in the previous section on game damage, the highest number of claims was bear depredation on sheep, goats, and cattle. The average number of game damage claims over the last 10 years was 7.5 per year. During the years of natural forage failures, damage claims increase. Monitoring trends in game damage may be another index to monitor bear management. If game damage claims appear to be increasing over the 7.5/year average, outside of poor natural forage years, then that may mean the population is increasing and searching for alternative food sources. In addition to domestic livestock depredation and beehives, human conflicts occurred when bears are utilizing garbage containers, bird feeders, and potentially entering cars or houses when access is easy and attractants are present. Increasing human conflicts can be an indicator of increasing bear populations, but locally is believed to be more a factor of increasing human population and development in prime bear habitat. Increasing human conflicts usually generate more outreach to address minimizing bear attractants.
Direct, significant human conflicts with black bears in B-18 typically involve a bear entering or attempting to enter a home, cabin, trailer or car. These conflicts are dealt with by CPW field staff differently depending on severity of the incident, other site-specific qualities and whether the bear in question had been previously handled by the CPW. There is a CPW policy on handling bears that have already received a first “strike”, as well as procedures to follow if a bear makes physical contact with a person.
In addition to managing game damage and human conflicts, we are also interested in maintaining hunting opportunity. Bear hunting in B-18 is popular with competition for limited September rifle licenses taking preference points to draw, as well as archery and muzzleloader licenses selling out shortly after becoming available to purchase.
STRATEGIC GOALS AND MANAGEMENT OBJECTIVES
Process for Developing Strategic Goals and Management Objectives
Public Process
Through the DAU planning process, ample opportunity was given for the general public to provide input on bear populations and management in B-18. A survey was made available on the internet from May 18 to June 22, 2012. Information about the survey was given through a press release and on the CDOW website. Those who did not have internet access were sent a hard copy of the survey at their request. Additionally postcards were mailed to individuals who had hunted bears in B-18 within the previous two years and to 2,000 random residents with the DAU. Letters requesting comments were also sent to local counties, land management and natural resource agencies, local and statewide special interest groups, and local Native American tribes.
There were 225 people who participated in the survey (221 on-line, 4 hard copies). The demographics of respondents were: 75% were residents of Colorado, 60% lived in the DAU, and 71% were bear hunters or applied for a bear license. Human/bear conflicts were important to 82% of
Page 30 of 38
respondents. Of the three management alternatives outlined within this plan;
- 58% supported alternative 1 of maintaining a stable population, - 18% favored alternative 2 of a three year decrease using 15% off-take rate, and - 11% chose alternative 3 of a three year decrease using a 20% off-take rate.
Written comments were numerous and each was reviewed. A significant proportion of comments involved management change outside the realm of this plan such as initiating a spring season, allowing baiting and the use of dogs, and preventing human development in bear habitat. Most people who wrote comments wanted the CPW to manage for a viable bear population. How they viewed this was varied from drastically decreasing the number of bears to the other extreme of not hunting bears. A large percent commented that people need to be more responsible to avoid human/bear conflicts. There were two main thoughts on how to deal with human/bear problems; 1) was to educate people so that people learned how to live with bears, and 2) was to increase hunter harvest on bears. Interestingly was the number of comments from residents who had lived in the same area for 20, 30 or more years and had never seen a bear on or around their property until the past 5-10 years. Now several of these people are having numerous bears on their property and are experiencing multiple problems with bears. A copy of the survey and survey results are on file at the Durango CPW service center and are available upon request.
Additionally the Southern Ute Indian Tribe (SUIT) provided comment. The SUIT recommended that CPW delay the work on the DAU plan until after more information on local bear populations and ecology was gleaned from the CPW bear research which started last year in Durango. This information could be used to provide better management directive in the new DAU plan.
After the initial public outreach a draft of the B-18 plan was developed and posted on the CPW website (www.wildlife.state.co.us) from July 2 to August 2, 2012 for further public review and comment. A letter that stated the draft plan was available for review and requested comments was sent to local counties, land management and natural resource agencies, local and statewide special interest groups, and local Native American tribes.
La Plata County provided comments during this time period. The county acknowledged that human/bear conflicts were an important component of managing bears and that CPW had invested a large amount of resources to minimize these conflicts. La Plata County deferred management recommendations to CPW, but suggested a more cautious approach be used initially if decreasing the population was prescribed.
Bear Smart Durango also commented on the draft plan. Recommendations were that available anthropomorphic food sources be removed in bear habitat prior to using any bear population management strategy.
The biologist from the Pagosa Ranger District of the San Juan National Forest provided some pertinent comment as well. Depredation involving domestic livestock on active grazing allotments averaged around three reports annually and mostly involved young calves according the district’s range specialists. As for black bear incidents in public campgrounds, it is reported that there were occasional incidents but the overall trend in number of incidents has declined dramatically due to bear aware programs and installation of bear resistant dumpsters in campgrounds. Accordingly any of the bear
Page 31 of 38
management alternatives appeared to be compatible with resource management activities occurring on public lands in the area.
District Wildlife Managers (DWMs) working within B-18 as well as the local Area Wildlife Manager (AWM), Patt Dorsey, and myself reviewed the comments and survey results. On August 13, 2012 we met and discussed recommended management alternatives for this plan. There was agreement that the B-18 bear population was higher than ever recorded and human/bear conflicts reflected this. Within the past five to ten years human/bear conflicts had grown significantly and bears where becoming more aggressive searching for anthropomorphic food sources. This had been documented in the number of bear/human conflict report forms over the years. Bears entering houses and other structures in search of food had become a common occurrence where before it was rare. A tireless effort had been made by CPW personnel to teach people how to live with bears and avoid conflict. This will remain an important strategy regardless of bear population management objectives. DWMs also had observed more bears in areas away from urban development. Based on all this, there was general consensus that the bear population was thriving and that the social tolerance of bears had been exceeded. A lower bear population was desirable. It was felt that this could be done while still providing a healthy, viable population and a quality experience for bear hunters and others wishing to view bears in natural habitat away from human development.
Strategic Goals
Subsequent total mortality and harvest objectives are presented as a range of probable amounts necessary to achieve the strategic goal of the DAU. Annual monitoring of mortality amounts, gender and age structure, Colorado black bear density study, and annual forage condition survey results are all incorporated into determining annual mortality objectives. However, the models and their results have not been validated with demographic data from Colorado bear populations. Moreover, the data that has been collected and used for model inputs result from relatively new efforts. We anticipate that the models will change and be improved over time and thus should be viewed as presumptive estimates. Therefore, although the plan identifies mortality and age and gender objectives, these are initial values. Modeling will be conducted every other to every third year, while other mortality data and demographics are collected and analyzed annually. Population extrapolations based on predicted densities, range-wide or within vegetation associations, will be re-evaluated as new data is gathered via research and mark-recapture surveys. While unlikely, objectives may be periodically adjusted in order to achieve the DAU strategic goals based on changes in the information sources above. Specific objectives will be documented in annual objective sheets approved by the Parks and Wildlife Commission. These objective sheets will also govern annual license levels to achieve the DAU strategic goals.
Three Alternative Strategic Goals in B-18 were considered:
Stable population trend: To achieve a strategic goal of maintaining a stable bear population in B-18, management criteria applied to determine harvest and total mortality rates should fall in an intermediate range. Total mortality, or off-take, as a proportion of the population should fall between 7-13% of the estimated population. Based on current population projections the total mortality would be approximately 106-197 black bears annually. Proportion of adult males in the harvest should be within 25-35%, with all females making up 30-40% of harvest. Additionally, adult females should comprise approximately 45-55% of the female harvest. Within the framework of an overall stable population,

Page 32 of 38
game damage and human/bear conflicts in localized areas of concern would fall under current CPW policies. Not every management index must be in complete agreement, but most should point toward a stable population. The current three year average total bear mortality in B-18 is 102 of which 34% is female, 22% adult male, and the proportion of adult females in the female harvest is 44%.
A stable population following a moderate reduction in the population: Applied management criteria determining harvest and total mortality rates would be in the liberal range. This would achieve a strategic goal of decreasing the bear population in B-18. It would then be re-evaluated after five years and management would continue to decrease the population or change to maintain the bear population at the new, lower population size.
Total mortality, or off-take, as a proportion of the population would incrementally be increased over a three year period to 15% and then be maintained at that level for up to two years. Based on current population projections the total mortality objective would be as high as 240 black bears annually. The proportion of adult males in the harvest could be low, even below 25%, with total female harvest rates going over 40%. Additionally, adult female proportions in the female harvest can account for rates over 55%. During these five years of decreasing the population, the sex and age composition of mortality and harvest would be evaluated annually to determine if the indices were indicating a downward trend. Also, analysis of damage and nuisance complaints would be used to determine if a higher harvest was meeting management goals. Not every management index must be in complete agreement, but most should point initially toward a decreasing trend. After this period of increased harvest, management would shift to maintain a stable population but at the new, lower population size (parameters outlined in Stable Population Trend above).
A stable population following an aggressive reduction in the population: Applied management criteria determining harvest and total mortality rates would be in the liberal range. This would achieve a strategic goal of decreasing the bear population in B-18. It would then be re-evaluated after five years and management would continue to decrease the population or change to maintain the bear population at the new, lower population size.
Total mortality, or off-take, as a proportion of the population would incrementally be increased to 20% over three years and then held there for up to two years. Based on current population projections the total mortality objective would be approximately 320 black bears. Proportion of adult males in the harvest can be low, even below 25%, with total female harvest rates going over 40%. Additionally, adult female proportions in the female harvest can account for rates over 55%. After three years of decreasing the population, the sex and age composition of mortality and harvest would be re-examined to determine if the indices were indicating a downward trend. This information, combined with analysis of damage and nuisance complaints, would inform decisions on whether to continue with higher harvests for the next few years, or whether the population was within an acceptable range and overall harvest and mortality could be decreased to stabilize the population (parameters outlined in Stable Population Trend above). Not every management index must be in complete agreement, but most should point initially toward a decreasing trend, followed by a stable trend.
Monitored Data to Inform Management
All known dead black bear, from both harvest and non-harvest sources, are checked by CPW

Page 33 of 38
staff to obtain biological information. The proportion in total mortality of each gender will continue to be closely monitored on an annual basis to assure that female mortality rates are not contrary to the DAU strategic goals. Age structure in total mortality and reproductive history are derived from extraction of a premolar tooth from bears when bear harvest and non-hunt mortality is reported through the mandatory check.
In 2009 and 2010, hair snag surveys were conducted in two locations in Colorado. A third survey was added in 2011 which included a portion of this DAU. Additional hair snag survey areas may be established in the future during the term of this DAU plan. Results about bear density, gender, and possibly age structure from these surveys may be incorporated into the habitat model/density extrapolations.
Because of low reproductive rates, black bear populations cannot sustain high harvest levels over prolonged periods. Research has shown that high harvest levels can quickly reduce black bear populations to levels where severe reductions in harvest quotas and season lengths may be necessary for greater than 10 years for full recovery of a population (Miller 1990, Beecham and Rohlman 1994). Therefore, the following harvest criteria will be assessed at the DAU level, with each DAU strategic goal set to achieve the criteria for reduced, stable, or increasing black bear numbers.
Total mortality Monitoring harvest and overall mortality totals in relation to projected population size will be
important in interpreting mean age and relative proportions of age/gender classes as indices. Based upon the strategic goal of a stable population following a moderate reduction in the population, the total mortality off-take range that would allow managers to reach that goal is up to 15% for as many as five years, then 7-13% for the remainder of the life of this plan.
Proportion of mortality by age and gender The following 3 harvest criteria will be monitored annually, using a 3-year average in B-18.
Population Trend Decreasing Stable Increasing
% of Adult Males in Total Harvest < 25% 25 - 35% > 35% % of All Females in Total Harvest > 40% 30 - 40% < 30%
% of Adult Females in Total Female Harvest > 55% 45 - 55% < 45% Forage condition monitoring Collected annually this data can be used when projecting reproductive rates, cub survival,
vulnerability to harvest and other factors related to modeling and predicting population trends for the upcoming year. Annual forage condition/mast production surveys are conducted in representative GMUs in DAU B-18. Results of these surveys are incorporated into population modeling efforts, as are mortality, age and gender structure data.
Game Damage & Human Conflict Numbers and types of game damage claims associated with bears will be monitored annually. In
addition, documented human conflicts will be monitored annually. The general trend in damage claims and conflicts will be evaluated to determine if they are increasing or decreasing, but no specific trigger or
Page 34 of 38
action is being identified. In most cases, management efforts will be taken to address an individual bear causing conflict through CPW policy. Management efforts may include public outreach to trap and transplant or even harvest conflict bears, following protocols identified in CPW Administrative Directive W-2.
Management Objectives
The specific total mortality and harvest objectives are based on present information and assumptions about population status and trajectory. These represent starting points in an ongoing process. Annual changes to mortality and harvest objectives are anticipated based on new information and evaluation of monitored data. Annual quantitative objectives will be documented in DAU objective sheets approved by the Parks and Wildlife Commission during annual regulation cycles.
Using the 4 different models/techniques to project plausible bear population sizes in B-18 yields the following:
Vegetation/ Bear Density extrapolation = 497 independent bears Use/occupancy density model population extrapolation = 1668 independent bears Liberal Population Model for 2011 = 2,059 bears (1,633 independent) Conservative Population Model for 2011 = 1,546 bears (1,226 independent)
For purposes of calculating mortality objectives to correspond with the strategic goal in the DAU a 2011 presumptive post-hunt population of 1,600 independent bears will be used. This is based on the use/occupancy density model and the liberal population model. It is also supported by current black bear mortality demographics. Harvest and total mortality objectives are based on the population of independent bears since cubs are not legal for harvest in Colorado. Population estimates will be revised and utilized as new data becomes available from hair snare surveys in B-18 and the CPW bear study in Durango.
Mortality Objectives – 3 year running average
Total Mortality Objective
In order to achieve a DAU strategic goal of a stable population following a moderate reduction in the population in B-18, it is estimated that the average total mortality should be ≤ 240 up to five years at a 15% off-take then decreased to a 10% off-take which may be 98-146.
Hunter Harvest Objective
Annual hunter harvest objectives are determined by deducting the 3-year running average amount of non-hunter mortality from the total mortality objective. If the strategic goal is a stable population following a moderate reduction in the population, then hunter harvest objectives could be adjusted up or down to (presumably) increase or decrease the rate population growth or decline. Based on a total mortality objective of ≤ 240 up to five years at a 15% off-take then decreased to a 10% off-take which may be 98-146, the hunter harvest objective will be ≤ 204 up to five years, then decreased to around 83-125.
Age & Gender Structure (harvest composition) in Hunter Harvest Objective

Page 35 of 38
It is estimated that the 3-year running average proportion of age and gender structure in hunter harvest should meet the following criteria:
Harvest Criteria Strategic Goal Decreasing Stable
% of Adult Males in Total Harvest < 25% 25 - 35% % of All Females in Total Harvest > 40% 30 - 40% % of Adult Females in Total Female Harvest > 55% 45 - 55%
Game Damage and Human Conflict Objectives
Standard CPW management techniques will be employed in B-18 to reduce game damage and human conflicts with bears. While management techniques used may be similar in both management zones, the application of lethal control to remove conflict individuals in bear management zones may be used more consistently. Other methods of non-lethal intervention will be used when the conditions and individual situation warrant it.
Conclusion and preferred DAU strategic goal (with mortality objectives)
CPW Commission adopted a stable population following a moderate reduction in the population in DAU B-18. This is based on the current population size and flourishing performance, habitat availability, human and agricultural conflict potential, human development and growth rate in bear habitat, and input from the public survey and 30-day comment period. In 2012 the B-18 population reached a historic high and has pushed the social tolerance of these animals coexisting with people. This has occurred during the same time period that there has been significant urban development in bear habitat, resulting in a loss of habitat. These issues can be partially addressed by decreasing the population over five years at a 15% off-take. A stable, healthy, and viable population of bears will be managed thereafter which was the wish of a large proportion of the public that provided comments on this management plan.
The total mortality objective will be incrementally increased over three years to 240 (15% off-take), held there for up to two more years, then decreased to 10% of the population level which may be 98-146 bears annually. Hunter harvest objective will be incrementally increased to 204 over three years then held at that level for up to two more years. It would then be decreased to 83-125, depending on the new population size, per year for the remainder of the life of this plan. Age and gender proportions will be monitored to assess whether the population is increasing, stable, or decreasing. Total mortality, or off-take, as a proportion of the population should fall in the 13-18% range for the first three years, and then decrease to 7-13% for the remaining years of this plan. Proportion of adult males in the annual harvest can be less than 25% during the 15% off-take, but should be 25-35% thereafter. All females in the harvest can be greater than 40% for the three year of 15% off-take and 30-40% for the remaining years. Proportion of adult females in the total female harvest can be greater than 55% during the three year decreasing phase, but should fall between 45-55% after that time period. Not every management index must be in complete agreement, but most should point toward the management goal.
The specific total mortality and harvest objectives were based on present information and
Page 36 of 38
assumptions about population status and trajectory. These represent starting points in an ongoing process. Flexibility needs to remains within management prescription of this plan to allow for the most current and applicable data be used as it becomes available so long as the “spirit” of the adopted management objectives are respected. Specifically is the increased knowledge of black bear ecology, population dynamics, and behavior that is expected to be gleaned from the black bear study which just began in Durango (part of this DAU) in 2011 and is scheduled to conclude in 2016. Annual changes to mortality and harvest objectives are anticipated based on new information and evaluation of monitored data. Annual quantitative objectives will be documented in DAU objective sheets by the Parks and Wildlife Commission during annual regulation cycles.
Page 37 of 38
REFERENCES
Apker, J. A., P. Lukacs, J. Broderick, B. Dreher, J. Mao, A. Vitt 2010. Non-Invasive DNA-Based Black Bear Density Estimates in Colorado – 2009. Internal Colorado Division of Wildlife Memo.
Baldwin, R. A. and L. C. Bender. 2007. Population demographics, habitat utilization, critical habitats, and condition of black bears in Rocky Mountain National Park. Rocky Mountain National Park, Estes Park, Colorado. 244pp.
Beck and White (1996 unpublished)
Beck, T.D. 1991. Black bears of west-central Colorado. Colorado Division of Wildlife Report Number 39. 86pp.
Beck, T. D. 1995. Development of black bear inventory techniques. Colorado Division of Wildlife. Wildlife Research Report. Federal Aid Project W-153-R-8, Job Progress Report. 11pp.
Beck, T. D. 1997. Development of black bear inventory techniques. Colorado Division of Wildlife. Wildlife Research Report. Federal Aid Project W-153-R-10, Final Report. 11pp.
Beecham, J.J. and J. Rohlman. 1994. A shadow in the forest: Idaho’s black bear. The University of Idaho Press, Idaho, 245pp.
Costello, C.M., D.E. Jones, K.A. Green Hammond, R.M. Inman, K.H. Inman, B.C. Thompson, R.A.
Deitner, H.B. Quigley. 2001. A study of black bear ecology in New Mexico with models for population dynamics and habitat suitability. Final Report Federal Aid in Wildlife Restoration Project W-131-R. 197 pp.
Costello, C.M., K.H. Inman, D.E. Jones, R.M. Inman, B.C. Thompson, H.B. Quigley. 2004. Reliability of the cementum annuli technique for estimating age of black bears in New Mexico. Wildlife Society Bulletin 32:169 – 176.
Fraser, D.G., J.F. Gardner, G.B. Kolenosky, and S. Strathearn. 1982. Estimation of harvest rate of black bears from age and sex data. Wildlife Society Bulletin 10:53 – 57.
Gill, R. B. and T. D. Beck. 1990. Black bear management plan. Colorado Division of Wildlife Report Number 15. 44pp.
Grogan, R.G. 1997. Black bear ecology in Southeast Wyoming: The Snowy Range. M.S. Thesis, University of Wyoming, 84pp.
Harris, R.B. 1984. Harvest age structure as an indicator of grizzly bear population status. M.S. thesis, University of Montana, Missoula. 204pp.
Page 38 of 38
Harshyne, W.A., D.R. Diefenbach, G.L. Alt, G.M. Matson. 1998. Analysis of error from cementum-annuli age estimates of known-age Pennsylvania black bears. Journal of Wildlife Management 62:1281 – 1291.
Idaho Dept. of Fish and Game. 1998. Idaho black bear management plan, 1999 – 2010: Status and objectives of Idaho’s black bear resource. 77pp.
Kolenosky, G.B. 1986. The effects of hunting on an Ontario black bear population. International Conference on Bear Research and Management 6:45 – 55. Page 38 of 39
McLaughlin, C.R., G.J. Matula, Jr., R.A. Cross, W.H. Halteman, M.A. Caron, AND K.I. Morris. 1990. Precision and accuracy of estimating age of Maine black bears by cementum annuli. International Conference on Bear Research and Management 8:415–419.
Miller, S.D. 1990. Population management of bears in North America. International Conference on Bear Research and Management 8:357 – 373.
Powell, R.A., J.W. Zimmerman, and D.E. Seaman. 1996. Demographic analyses of a hunted black bear population with access to a refuge. Conservation Biology 10:224 – 234.
Wait, S. 2000. Black bear management guidelines for bear DAU B-18. Colorado Division of Wildlife. Unpublished.
Wyoming Game and Fish Department. 2007. Wyoming black bear management plan. 59pp.