Embed Size (px)
Citation preview
San Mateo County Comprehensive Bicycle and Pedestrian Plan
Final
Adopted September 8, 2011
City/County Association of Governments of San Mateo County
Prepared by: Alta Planning + Design
in association with Fehr & Peers and Eisen | Letunic

San Mateo County Comprehensive Bicycle and Pedestrian Plan
Acknowledgements
C/CAG Bicycle and Pedestrian Advisory Committee
Matt Grocott, Chair
Judi Mosqueda, Vice Chair
Naomi Patridge
Karyl Matsumoto
Cory Roay
Ken Ibarra
Marge Colapietro
Ian Bain
Paul Grantham
Steve Schmidt
Frank Markowitz
David Alfano
Cathleen Baker
Cathy Baylock
Former Members
Joel Slavit
Julie Lancelle
Lucy Wicks
We wish to thank staff from the following agencies who contributed to this plan: Town of
Atherton, City of Belmont, City of Brisbane, City of Burlingame, Town of Colma, City of Daly
City, City of East Palo Alto, City of Foster City, City of Half Moon Bay, Town of
Hillsborough, City of Menlo Park, City of Millbrae, City of Pacifica, Town of Portola Valley,
City of Redwood City, City of San Bruno, City of San Carlos, City of San Mateo, City of
South San Francisco, Town of Woodside, County of San Mateo, Metropolitan
Transportation Commission, Caltrans District 4, SamTrans, San Francisco International
Airport, San Mateo County Transportation Authority, and City/County Association of
Governments of San Mateo County.

This page intentionally left blank.
San Mateo County Comprehensive Bicycle and Pedestrian Plan
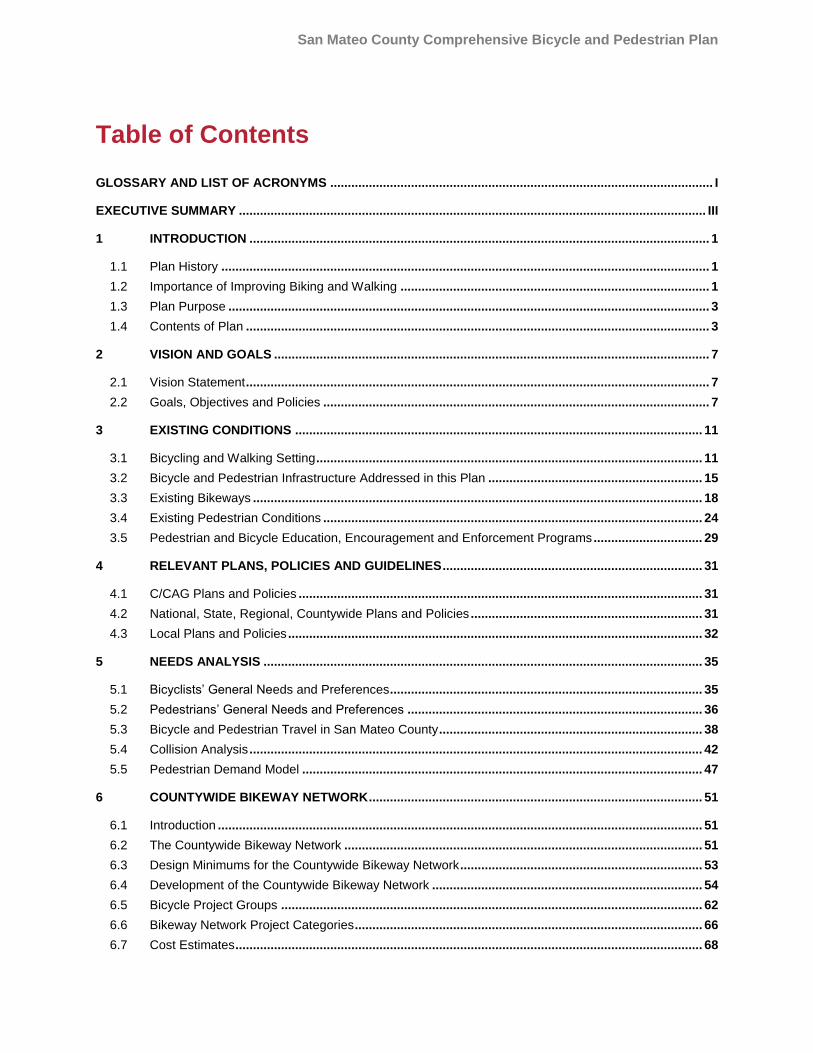
Table of Contents
GLOSSARY AND LIST OF ACRONYMS ............................................................................................................. I
EXECUTIVE SUMMARY ..................................................................................................................................... III
1 INTRODUCTION ................................................................................................................................... 1
1.1 Plan History ........................................................................................................................................... 1
1.2 Importance of Improving Biking and Walking ........................................................................................ 1
1.3 Plan Purpose ......................................................................................................................................... 3
1.4 Contents of Plan .................................................................................................................................... 3
2 VISION AND GOALS ............................................................................................................................ 7
2.1 Vision Statement .................................................................................................................................... 7
2.2 Goals, Objectives and Policies .............................................................................................................. 7
3 EXISTING CONDITIONS .................................................................................................................... 11
3.1 Bicycling and Walking Setting .............................................................................................................. 11
3.2 Bicycle and Pedestrian Infrastructure Addressed in this Plan ............................................................. 15
3.3 Existing Bikeways ................................................................................................................................ 18
3.4 Existing Pedestrian Conditions ............................................................................................................ 24
3.5 Pedestrian and Bicycle Education, Encouragement and Enforcement Programs ............................... 29
4 RELEVANT PLANS, POLICIES AND GUIDELINES .......................................................................... 31
4.1 C/CAG Plans and Policies ................................................................................................................... 31
4.2 National, State, Regional, Countywide Plans and Policies .................................................................. 31
4.3 Local Plans and Policies ...................................................................................................................... 32
5 NEEDS ANALYSIS ............................................................................................................................. 35
5.1 Bicyclists’ General Needs and Preferences ......................................................................................... 35
5.2 Pedestrians’ General Needs and Preferences .................................................................................... 36
5.3 Bicycle and Pedestrian Travel in San Mateo County ........................................................................... 38
5.4 Collision Analysis ................................................................................................................................. 42
5.5 Pedestrian Demand Model .................................................................................................................. 47
6 COUNTYWIDE BIKEWAY NETWORK ............................................................................................... 51
6.1 Introduction .......................................................................................................................................... 51
6.2 The Countywide Bikeway Network ...................................................................................................... 51
6.3 Design Minimums for the Countywide Bikeway Network ..................................................................... 53
6.4 Development of the Countywide Bikeway Network ............................................................................. 54
6.5 Bicycle Project Groups ........................................................................................................................ 62
6.6 Bikeway Network Project Categories ................................................................................................... 66
6.7 Cost Estimates ..................................................................................................................................... 68
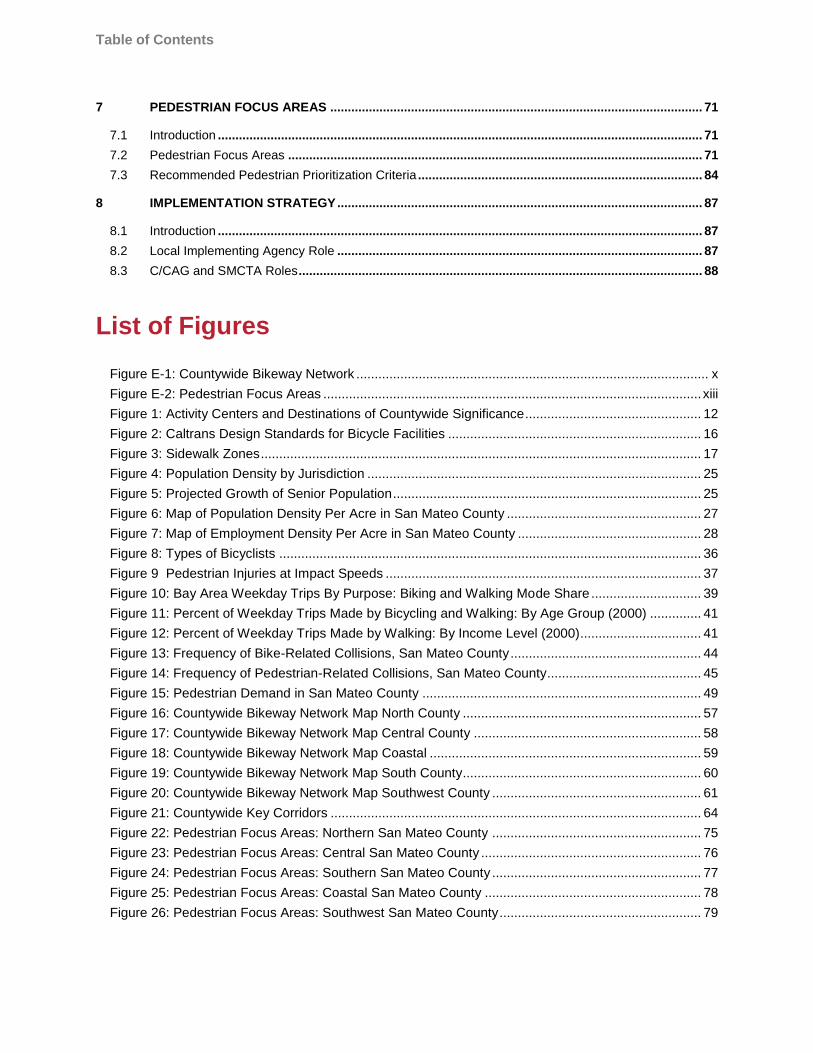
Table of Contents
City/
7 PEDESTRIAN FOCUS AREAS .......................................................................................................... 71
7.1 Introduction .......................................................................................................................................... 71
7.2 Pedestrian Focus Areas ...................................................................................................................... 71
7.3 Recommended Pedestrian Prioritization Criteria ................................................................................. 84
8 IMPLEMENTATION STRATEGY ........................................................................................................ 87
8.1 Introduction .......................................................................................................................................... 87
8.2 Local Implementing Agency Role ........................................................................................................ 87
8.3 C/CAG and SMCTA Roles ................................................................................................................... 88
List of Figures
Figure E-1: Countywide Bikeway Network ................................................................................................ x
Figure E-2: Pedestrian Focus Areas ....................................................................................................... xiii
Figure 1: Activity Centers and Destinations of Countywide Significance ................................................ 12
Figure 2: Caltrans Design Standards for Bicycle Facilities ..................................................................... 16
Figure 3: Sidewalk Zones ........................................................................................................................ 17
Figure 4: Population Density by Jurisdiction ........................................................................................... 25
Figure 5: Projected Growth of Senior Population .................................................................................... 25
Figure 6: Map of Population Density Per Acre in San Mateo County ..................................................... 27
Figure 7: Map of Employment Density Per Acre in San Mateo County .................................................. 28
Figure 8: Types of Bicyclists ................................................................................................................... 36
Figure 9 Pedestrian Injuries at Impact Speeds ...................................................................................... 37
Figure 10: Bay Area Weekday Trips By Purpose: Biking and Walking Mode Share .............................. 39
Figure 11: Percent of Weekday Trips Made by Bicycling and Walking: By Age Group (2000) .............. 41
Figure 12: Percent of Weekday Trips Made by Walking: By Income Level (2000) ................................. 41
Figure 13: Frequency of Bike-Related Collisions, San Mateo County .................................................... 44
Figure 14: Frequency of Pedestrian-Related Collisions, San Mateo County .......................................... 45
Figure 15: Pedestrian Demand in San Mateo County ............................................................................ 49
Figure 16: Countywide Bikeway Network Map North County ................................................................. 57
Figure 17: Countywide Bikeway Network Map Central County .............................................................. 58
Figure 18: Countywide Bikeway Network Map Coastal .......................................................................... 59
Figure 19: Countywide Bikeway Network Map South County................................................................. 60
Figure 20: Countywide Bikeway Network Map Southwest County ......................................................... 61
Figure 21: Countywide Key Corridors ..................................................................................................... 64
Figure 22: Pedestrian Focus Areas: Northern San Mateo County ......................................................... 75
Figure 23: Pedestrian Focus Areas: Central San Mateo County ............................................................ 76
Figure 24: Pedestrian Focus Areas: Southern San Mateo County ......................................................... 77
Figure 25: Pedestrian Focus Areas: Coastal San Mateo County ........................................................... 78
Figure 26: Pedestrian Focus Areas: Southwest San Mateo County ....................................................... 79
San Mateo County Comprehensive Bicycle and Pedestrian Plan
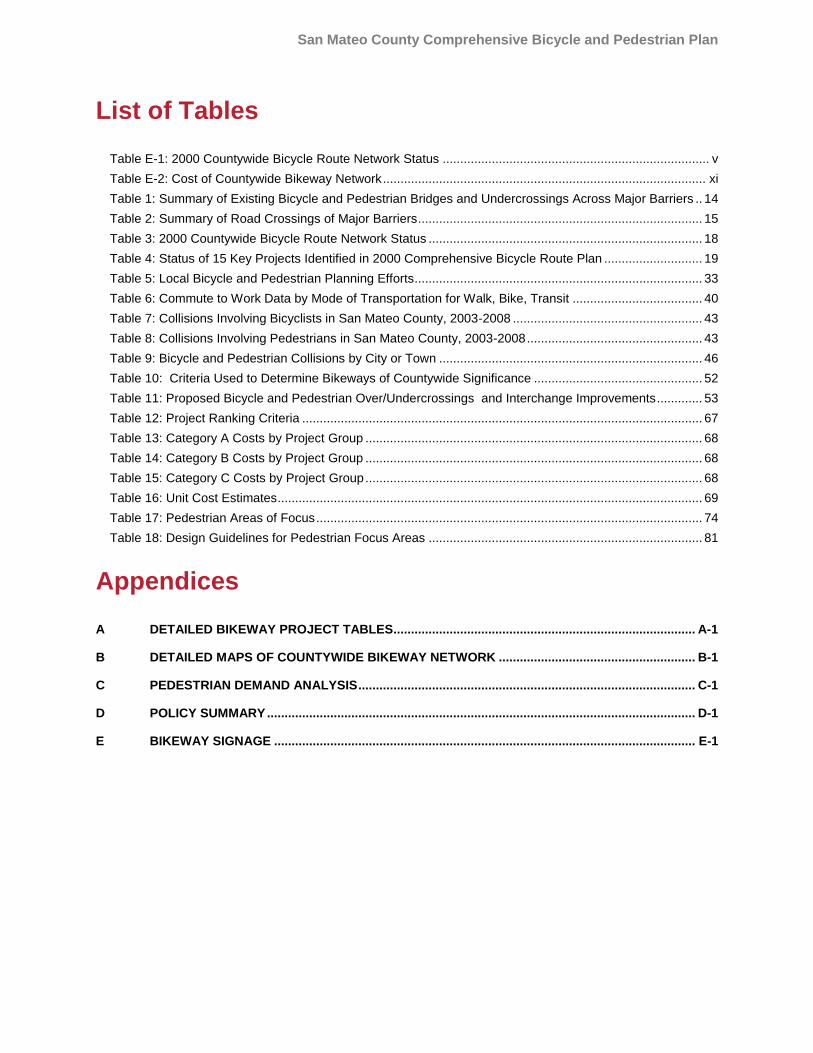
List of Tables
Table E-1: 2000 Countywide Bicycle Route Network Status ............................................................................ v
Table E-2: Cost of Countywide Bikeway Network ............................................................................................ xi
Table 1: Summary of Existing Bicycle and Pedestrian Bridges and Undercrossings Across Major Barriers .. 14
Table 2: Summary of Road Crossings of Major Barriers ................................................................................. 15
Table 3: 2000 Countywide Bicycle Route Network Status .............................................................................. 18
Table 4: Status of 15 Key Projects Identified in 2000 Comprehensive Bicycle Route Plan ............................ 19
Table 5: Local Bicycle and Pedestrian Planning Efforts .................................................................................. 33
Table 6: Commute to Work Data by Mode of Transportation for Walk, Bike, Transit ..................................... 40
Table 7: Collisions Involving Bicyclists in San Mateo County, 2003-2008 ...................................................... 43
Table 8: Collisions Involving Pedestrians in San Mateo County, 2003-2008 .................................................. 43
Table 9: Bicycle and Pedestrian Collisions by City or Town ........................................................................... 46
Table 10: Criteria Used to Determine Bikeways of Countywide Significance ................................................ 52
Table 11: Proposed Bicycle and Pedestrian Over/Undercrossings and Interchange Improvements ............. 53
Table 12: Project Ranking Criteria .................................................................................................................. 67
Table 13: Category A Costs by Project Group ................................................................................................ 68
Table 14: Category B Costs by Project Group ................................................................................................ 68
Table 15: Category C Costs by Project Group ................................................................................................ 68
Table 16: Unit Cost Estimates ......................................................................................................................... 69
Table 17: Pedestrian Areas of Focus .............................................................................................................. 74
Table 18: Design Guidelines for Pedestrian Focus Areas .............................................................................. 81
Appendices
A DETAILED BIKEWAY PROJECT TABLES...................................................................................... A-1
B DETAILED MAPS OF COUNTYWIDE BIKEWAY NETWORK ........................................................ B-1
C PEDESTRIAN DEMAND ANALYSIS ................................................................................................ C-1
D POLICY SUMMARY .......................................................................................................................... D-1
E BIKEWAY SIGNAGE ........................................................................................................................ E-1

Table of Contents
City/
This page intentionally left blank.
San Mateo County Comprehensive Bicycle and Pedestrian Plan
Page i
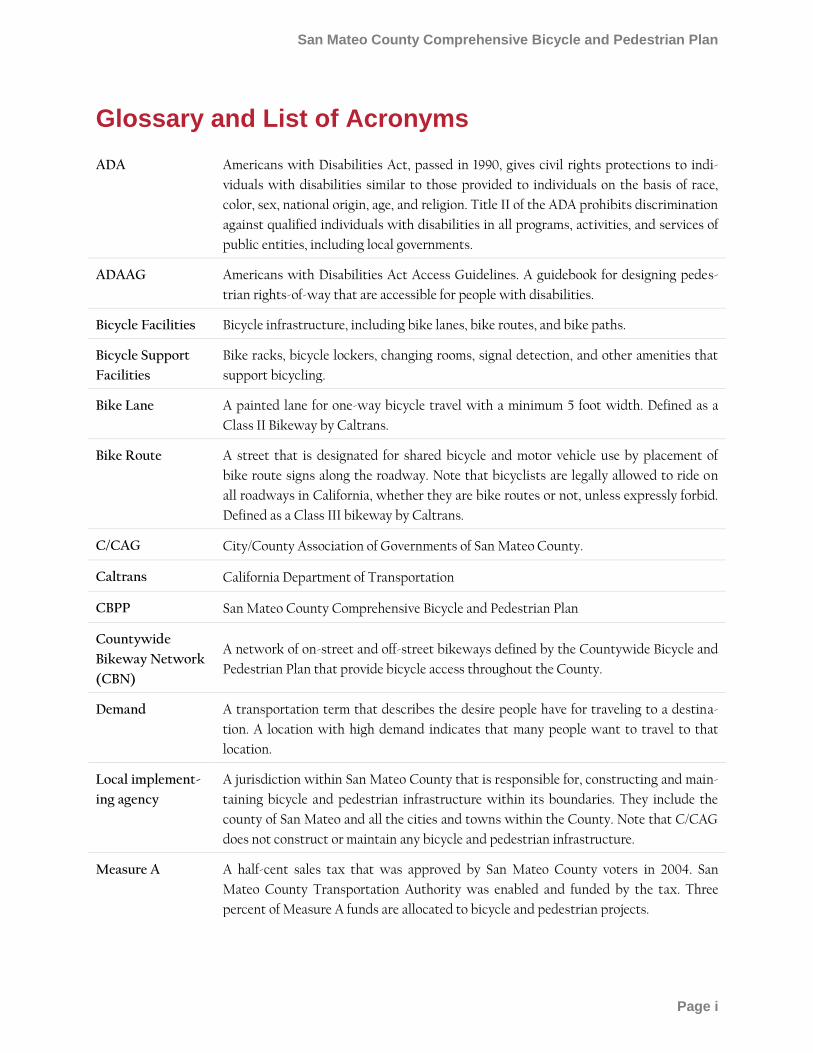
Glossary and List of Acronyms
ADA Americans with Disabilities Act, passed in 1990, gives civil rights protections to indi-
viduals with disabilities similar to those provided to individuals on the basis of race,
color, sex, national origin, age, and religion. Title II of the ADA prohibits discrimination
against qualified individuals with disabilities in all programs, activities, and services of
public entities, including local governments.
ADAAG Americans with Disabilities Act Access Guidelines. A guidebook for designing pedes-
trian rights-of-way that are accessible for people with disabilities.
Bicycle Facilities Bicycle infrastructure, including bike lanes, bike routes, and bike paths.
Bicycle Support
Facilities
Bike racks, bicycle lockers, changing rooms, signal detection, and other amenities that
support bicycling.
Bike Lane A painted lane for one-way bicycle travel with a minimum 5 foot width. Defined as a
Class II Bikeway by Caltrans.
Bike Route A street that is designated for shared bicycle and motor vehicle use by placement of
bike route signs along the roadway. Note that bicyclists are legally allowed to ride on
all roadways in California, whether they are bike routes or not, unless expressly forbid.
Defined as a Class III bikeway by Caltrans.
C/CAG City/County Association of Governments of San Mateo County.
Caltrans California Department of Transportation
CBPP San Mateo County Comprehensive Bicycle and Pedestrian Plan
Countywide
Bikeway Network
(CBN)
A network of on-street and off-street bikeways defined by the Countywide Bicycle and
Pedestrian Plan that provide bicycle access throughout the County.
Demand A transportation term that describes the desire people have for traveling to a destina-
tion. A location with high demand indicates that many people want to travel to that
location.
Local implement-
ing agency
A jurisdiction within San Mateo County that is responsible for, constructing and main-
taining bicycle and pedestrian infrastructure within its boundaries. They include the
county of San Mateo and all the cities and towns within the County. Note that C/CAG
does not construct or maintain any bicycle and pedestrian infrastructure.
Measure A A half-cent sales tax that was approved by San Mateo County voters in 2004. San
Mateo County Transportation Authority was enabled and funded by the tax. Three
percent of Measure A funds are allocated to bicycle and pedestrian projects.
Glossary and List of Acronyms
City/
Page ii
Mode Share A measurement of the number of trips or more commonly percentage of trips that are
taken by a given type of transportation. Mode shares include, but are not limited to,
bicycling, walking, transit, and driving.
MTC Metropolitan Transportation Commission
Multi-Use Path A paved path with an 8-foot minimum paved width, that is solely for bicycle and pedes-
trian travel. Defined as a Class I Bikeway by Caltrans.
MUTCD Manual of Uniform Traffic Control Devices
Pedestrian
Amenities
Street furniture, pedestrian-scale lighting, landscaping, and other infrastructure and
design elements that support pedestrians and improve the walkability of a street.
Pedestrian
Facilities Pedestrian infrastructure, including sidewalks and paths.
Pedestrian Focus
Areas
Eight general location types defined by the Countywide Bicycle and Pedestrian Plan
that are should receive pedestrian improvements.
Regional Bicycle
Program (RBP) Bicycle funding allocated to San Mateo County. C/CAG distributes the funding.
ROW Right-of-way
Shared Roadway
Bicycle Markings
(Sharrows)
A stencil of a bicycle and chevron placed in the middle of the right-hand vehicle lane,
typically adjacent to parallel parking. The shared lane marking indicates to bicyclists
where they should ride to avoid opening car doors and reminds motorists that bicycles
will be riding in the middle of the lane.
SMCTA San Mateo County Transportation Authority
SR State Route
Statewide
Integrated Traffic
Report System
(SWITRS)
A database of police-reported collisions maintained by the California Highway Patrol.
Transportation
Development Act
Article 3
Bicycle and pedestrian funding allocated to San Mateo County. Funds are distributed
to C/CAG, which is the designated agency to manage the funds.
San Mateo County Comprehensive Bicycle and Pedestrian Plan
Page iii
Executive Summary
Introduction The City/County Association of Governments of San Mateo County (C/CAG), with support from the San
Mateo County Transportation Authority (SMCTA) have developed the San Mateo County Comprehensive Bicycle
and Pedestrian Plan (CBPP) to addresses the planning, design, funding, and implementation of bicycle and pe-
destrian projects of countywide significance. The CBPP updates the prior San Mateo County Comprehensive Bicycle
Route Plan (2000) and expands the earlier plan by adding a pedestrian component. New elements in the CBPP
include:
A policy framework to guide and evaluate implementation of the projects recommended by the CBPP.
An updated Countywide Bikeway Network that incorporates projects completed to-date and new
proposed projects identified by San Mateo County‘s cities, the County and the community.
Detailed maps and tables of proposed bikeway projects to assist local implementing agencies in con-
structing bikeways.
An analysis of land use and demographics to identify areas with high pedestrian demand to assist lo-
cal implementing agencies in identifying their most important pedestrian projects.
Pedestrian Focus Areas and suggested prioritization criteria, which will guide countywide invest-
ment in pedestrian infrastructure.
A companion document to assist local implementing agencies in developing education and promotion
programs, and funding and designing bicycle and pedestrian facilities.
Vision and Goals
The CBPP‘s recommendations flow from the plan‘s vision and goals. The vision statement expresses what bi-
cycling and walking will be like in San Mateo County in the future:
San Mateo County has an interconnected system of safe, convenient and universally accessible bicycle and
pedestrian facilities, for both transportation and recreation. These facilities provide access to jobs, homes, schools,
transit, shopping, community facilities, parks and regional trails throughout the county. At the same time, the
county has strengthened its network of vibrant, higher-density, mixed-use and transit-accessible communities, that
enable people to meet their daily needs without access to a car. As a result, many more people in San Mateo County
ride bicycles and walk, making our transportation system more balanced, equitable and sustainable. More bicycling
and walking have reduced automobile dependence, traffic congestion, pollution and the county’s carbon footprint
while increasing mobility options, promoting healthy lifestyles, saving residents money and fostering social
interaction.
Goals set the overall directions for efforts to improve non-motorized transportation, and are
supported by policies that identify more specific action items to support each goal. The five goals for
the CBPP are:
Goal 1: A Comprehensive Countywide System of Facilities for Bicyclists and Pedestrians
Executive Summary
City/
Page iv
Goal 2: More People Riding and Walking for Transportation and Recreation
Goal 3: Improved Safety for Bicyclists and Pedestrians
Goal 4: Complete Streets and Routine Accommodation of Bicyclists and Pedestrians
Goal 5: Strong Local Support for Non-Motorized Transportation
Outreach The CBPP was developed in consultation with San Mateo County‘s cities and towns, the County of San
Mateo, Caltrans, San Francisco International Airport, and the Metropolitan Transportation Commission. Sev-
eral of these jurisdictions consulted with their local bicycle and pedestrian advisory groups and community
members and passed comments along for inclusion in the CBPP. Information was also presented to the
SMCTA Citizens Advisory Committee and Board. The C/CAG Bicycle and Pedestrian Committee reviewed
components of the plan as they were developed, and the committee‘s comments were incorporated into the
CBPP. The general public was invited to a workshop in November 2010 to view and comment on existing
conditions and a proposed bikeway network. The Public Review Draft of the CBPP was made available for
comment between February 2011 and May 2011. Prior to release of the Draft Final CBPP, C/CAG met with key
advocacy organizations and members of the public to discuss and clarify comments and requested revisions to
the CBPP.
Existing Conditions
Just over 700,000 people live in San Mateo County. Topography and public policy have limited urbanization
to the eastern part of the county along the Highway 101 corridor. The county‘s wide range of development
patterns, from urban to rural, precludes a one-size fits all approach to bicycle and pedestrian planning. The
CBPP categorizes improvements in both urban and rural areas of the county.
Transit Caltrain, Bay Area Rapid Transit (BART), San Mateo County Transit (SamTrans), employer shuttles, and
local shuttles provide transit services in San Mateo County. These transit operators facilitate bicycle and
pedestrian travel by extending the reach of these modes and providing an alternative mode in the case of
inclement weather or emergency. Caltrain, BART and SamTrans provide for bicyclists at stations and on
transit vehicles and many bicyclists utilize Caltrain, in particular. Bicycle and pedestrian access to stations
varies by jurisdiction, but can be improved in many locations. Alameda to San Mateo cross county services
such as the M line is provided and operated by AC Transit and Dumbarton Express. Rail line, for commuter
rail or freight, can act as barriers to bicycle and pedestrian travel. The CBPP identifies bicycle and pedestrian
projects that serve transit stations and includes existing and proposed crossings of rail lines.
Freeways and Roads Freeways such as Highway 101, Interstate 280, Interstate 380, and grade-separated portions of State Route 92
are barriers to bicyclist and pedestrian travel, and biking or walking through freeway interchanges can be
uncomfortable and difficult. Many communities have constructed or are planning to construct bridges or
tunnels across freeways and provide improvements through interchanges.
San Mateo County Comprehensive Bicycle and Pedestrian Plan
Page v
Major roadways, such as El Camino Real (State Route 82), at-grade portions of State Route 92. Highway 1 and
Woodside Road (State Route 84) facilitate bicycle and pedestrian travel but also act as barriers. These
roadways provide direct continuous access, but are often not designed to adequately accommodate bicyclists
and pedestrians. Intersections along these major roadways prioritize motor vehicle traffic flow with minimal
consideration of impacts on bicyclists and pedestrians.
The CBPP emphasizes access across freeways and major roadways, and includes an inventory of overcrossings,
undercrossings, and interchanges and arterial intersections that should be evaluated for improvement.
Existing Bikeways
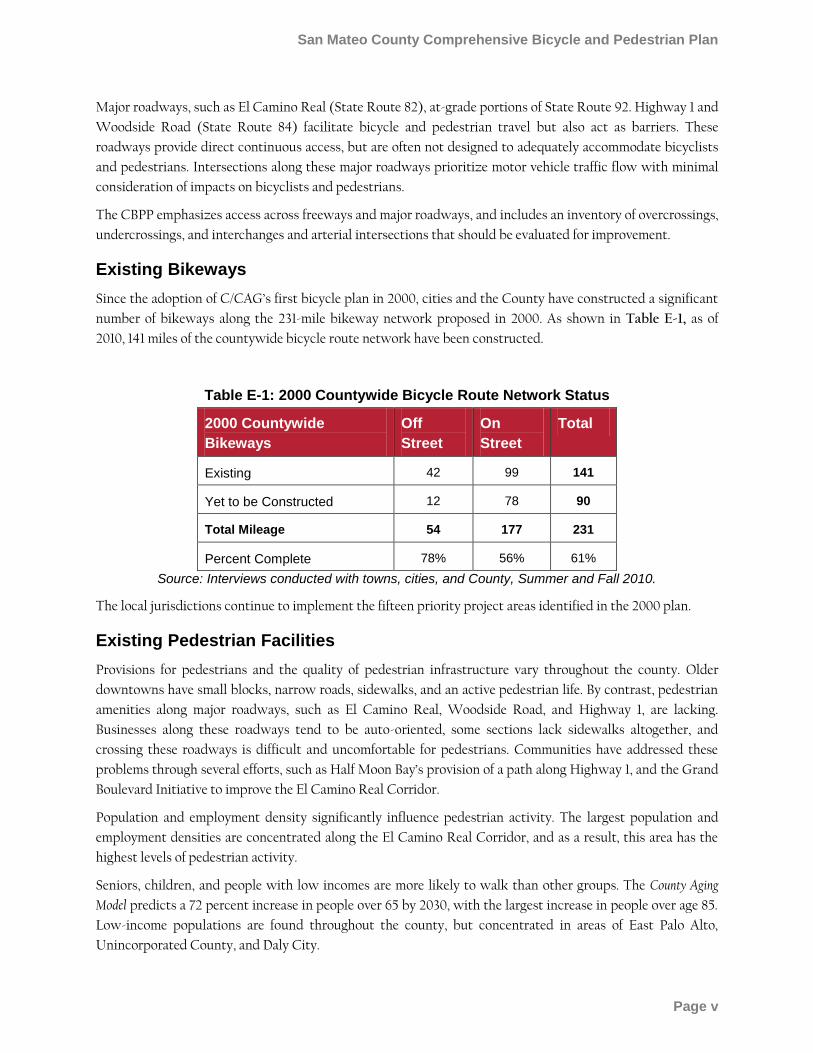
Since the adoption of C/CAG‘s first bicycle plan in 2000, cities and the County have constructed a significant
number of bikeways along the 231-mile bikeway network proposed in 2000. As shown in Table E-1, as of
2010, 141 miles of the countywide bicycle route network have been constructed.
Table E-1: 2000 Countywide Bicycle Route Network Status
2000 Countywide
Bikeways
Off
Street
On
Street
Total
Existing 42 99 141
Yet to be Constructed 12 78 90
Total Mileage 54 177 231
Percent Complete 78% 56% 61%
Source: Interviews conducted with towns, cities, and County, Summer and Fall 2010.
The local jurisdictions continue to implement the fifteen priority project areas identified in the 2000 plan.
Existing Pedestrian Facilities
Provisions for pedestrians and the quality of pedestrian infrastructure vary throughout the county. Older
downtowns have small blocks, narrow roads, sidewalks, and an active pedestrian life. By contrast, pedestrian
amenities along major roadways, such as El Camino Real, Woodside Road, and Highway 1, are lacking.
Businesses along these roadways tend to be auto-oriented, some sections lack sidewalks altogether, and
crossing these roadways is difficult and uncomfortable for pedestrians. Communities have addressed these
problems through several efforts, such as Half Moon Bay‘s provision of a path along Highway 1, and the Grand
Boulevard Initiative to improve the El Camino Real Corridor.
Population and employment density significantly influence pedestrian activity. The largest population and
employment densities are concentrated along the El Camino Real Corridor, and as a result, this area has the
highest levels of pedestrian activity.
Seniors, children, and people with low incomes are more likely to walk than other groups. The County Aging
Model predicts a 72 percent increase in people over 65 by 2030, with the largest increase in people over age 85.
Low-income populations are found throughout the county, but concentrated in areas of East Palo Alto,
Unincorporated County, and Daly City.
Executive Summary
City/
Page vi
Relevant Plans, Policies and Guidelines The CBPP builds on and supports a number of plans, policies, and projects of other agencies. As described
above, the CBPP updates C/CAG‘s 2000 Comprehensive Bicycle Route Plan. The CBPP also incorporates the
policies supporting bicycle-transit integration and pedestrian-supportive land uses contained in C/CAG‘s
2001 Countywide Transportation Plan (CTP). C/CAG is currently updating the Countywide Transportation Plan
(CTP) in parallel with the development of the CBPP. The updated CTP refers to and reflects the goals and
policies of the CBPP.
Regionally, the CBPP incorporates bikeways of countywide significance identified by the Metropolitan
Transportation Commission‘s (MTC) 2009 Regional Bicycle Plan for the Bay Area and uses MTC‘s Communities of
Concern1 as a key criterion for bicycle and pedestrian projects. The CBPP also includes the Bay Trail alignment
identified by the Association of Bay Area Governments and the California Coastal Trail and Parallel Trail
along the Pacific coast of the County. On a local level, the CBPP incorporates planned and proposed bikeways
identified in local implementing jurisdictions‘ plans, including the Bay-to-Ocean trails proposed in the Draft
San Mateo County Trails Plan.
Local Agency Bicycle and Pedestrian Planning Efforts
Local bicycle and pedestrian planning efforts are varied, and there has been a trend toward providing more
staff time and effort for bicycle and pedestrian planning. Most cities and towns in San Mateo County refer to
bicycle and pedestrian infrastructure in their General Plan‘s Circulation Element. Of the twenty cities and
towns in the county, four have stand-alone bicycle master plans and none have pedestrian master plans,
although as of February 2011, at least two cities are planning to develop pedestrian master plans. Eight cities
have bicycle or pedestrian advisory committees. Numerous specific plans address bicycle or pedestrian
planning. The County of San Mateo, in conjunction with local communities in the unincorporated areas, have
developed various levels of planning documents.
Needs Analysis
Bicyclists’ Needs
The CBPP addresses the needs of all bicyclists, from ―strong and fearless‖ riders who are comfortable riding on
any roadway regardless of conditions, to ―interested but concerned‖ riders who only ride on quiet streets or
paths during favorable weather. The CBPP focuses recommendations on this latter group of bicyclists, who
are likely to bicycle more if provided safe and comfortable bikeways.
Pedestrians’ Needs
Pedestrians require safe, connected, and accessible sidewalks and pathways that provide direct access to
shops, schools, transit, and residential neighborhoods. The CBPP pays particular attention to the needs of
children, seniors and people with disabilities, and suggests design guidelines that support these user groups:
slow vehicle speeds, short crossings, refuge islands, bulb-outs, and longer crossing times at signalized inter-
sections. The CBPP focuses pedestrian improvements in eight areas: downtown areas, El Camino Real Corri-
1 Low-income communities
San Mateo County Comprehensive Bicycle and Pedestrian Plan
Page vii
dor, Highway 1/Coastal Trail/Parallel Trail Corridor, major barriers, safe routes to school, safe routes to trans-
it, access to county/regional activity centers, and regional trails.
How Much are People Biking and Walking?
As is the case with the rest of the country, data for the Bay Area show that biking and walking trips make up a
small percentage of all total trips. Biking trips comprise between 1.2 percent and 1.5 percent of all trips taken
in the Bay Area and walking trips comprise between 8 and 10 percent of all trips.2 The exception is school
trips; nearly 17 percent of school trips are made by foot, underscoring the importance of quality pedestrian
infrastructure near schools.
More recent data from the U.S. Census show that 0.8 percent of the county population biked to work and 2.7
percent walked to work. These percentages are lower than Bay Area averages of 1.1 percent bike to work and
3.2 percent walk to work, though mode splits vary by community, with Redwood City and Menlo Park seeing
high bicycle commute rates, and San Mateo and Redwood City seeing the highest number of pedestrian
commuters. These data indicate that high bicycle and pedestrian commute rates are achievable in San Mateo
County, given investment in bicycle and pedestrian infrastructure.
Who is Biking and Walking?
In the Bay Area, people who bike and walk for transportation tend to be younger and less affluent than the
general population. School-aged youth typically walk more than other age groups, with nearly 16 percent of all
trips made by foot.3 Walking rates decrease with age, but rise again in the elderly cohort. Bicycling trips are
highest among people under 30, with the 23 to 29 age group biking for 2.4 percent of all trips.4
In the Bay Area, walking rates vary with income levels. People from households with incomes under $30,000
(in 2000 dollars) are more than twice as likely to walk—17.4 percent to 7.4 percent as people in the highest
income households.5 These data underscore the importance of providing quality pedestrian infrastructure in
low-income communities and employment areas.
Bike and Pedestrian Safety Between 2004 and 2008, an average of 217 bicyclists and 270 pedestrians were injured in traffic collisions in
San Mateo County each year. During this same period, a total of 13 bicyclists and 46 pedestrians were killed in
traffic collisions. Fatalities of bicyclists and pedestrians comprise a significant percentage of all traffic
fatalities in San Mateo County. Between 2004 and 2008, bicyclist fatalities accounted for 8 percent of all
traffic fatalities and pedestrian fatalities accounted for 27 percent. In comparison, these modes comprise only
1.5 and 10 percent of all trips for the Bay Area.
Most collisions are concentrated in urban areas of the county, particularly along the El Camino Real corridor.
Bicycle collisions also show a concentration at the intersection of Highway 1 and Highway 92 and in Montara.
Pedestrian collisions show a concentration along Mission Street in Daly City.
2 Metropolitan Transportation Commission‘s Bay Area Travel Survey (2000) 3 Ibid. 4 Ibid. 5 Ibid.
Executive Summary
City/
Page viii
Pedestrian Demand Analysis
A demand analysis based on land use, proximity to transit, employment and residential densities, intersection
density, street connectivity, demographics, and other factors predicts that pedestrian activity is most
concentrated along the Highway 101 corridor (including El Camino Real) in the eastern part of the county,
with additional activity along the coast in Half Moon Bay and Pacifica. The pedestrian demand analysis
informs the development of focused areas for pedestrian improvements.
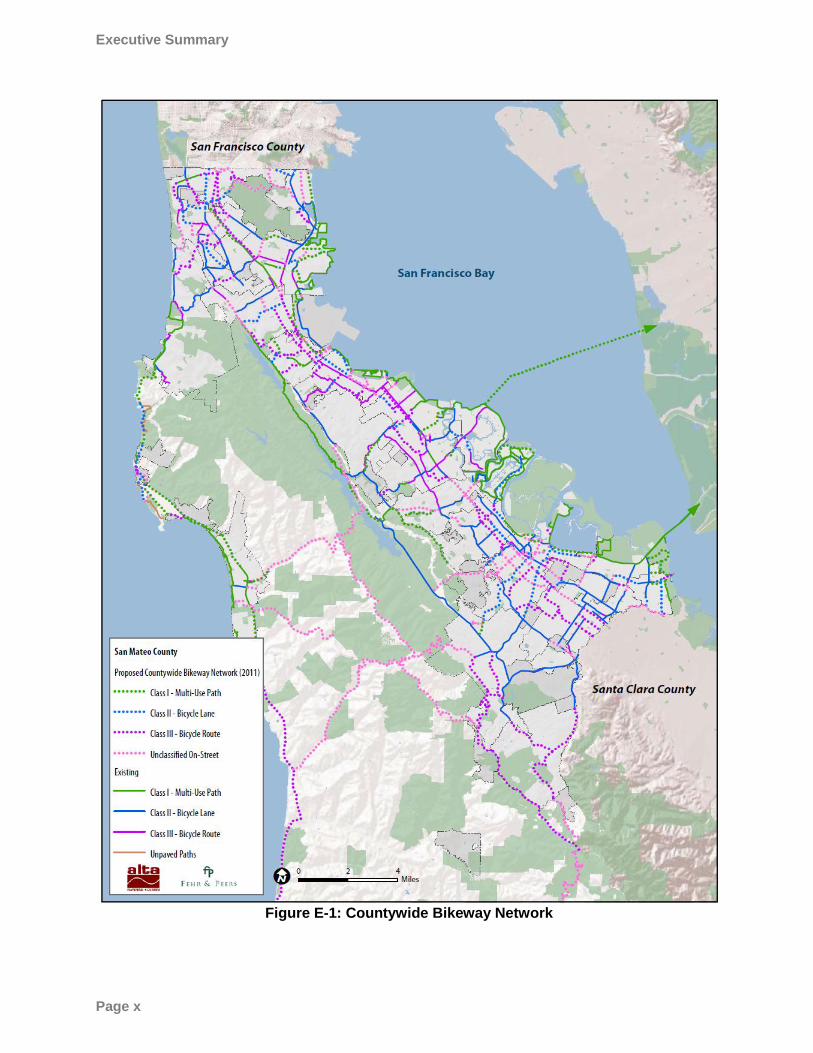
Countywide Bikeway Network The CBPP establishes the Countywide Bikeway Network (CBN)—a comprehensive countywide system of on-
street and off-street bikeways, overcrossings, and bicycle friendly intersections and freeway interchanges that
provide safe, convenient access to major destinations, transit stops, and recreational amenities. Local
implementing agencies and members of the public provided input that was used to develop the CBN. Figure
E-1 shows the CBN.
The CBN focuses on countywide transportation, therefore only includes a sub-set of bikeways identified by
local implementing agencies. Bikeways in the CBN are considered of countywide significance by meeting one
or more of the following criteria:
North-South Connectivity: Improves connectivity or safety along El Camino Real or Highway 1
East-West Connectivity: Improves connectivity or safety across Highway 101, Caltrain. El Camino
Real, Interstate 280, Highway 1, and from Bay to Ocean.
Cross-Jurisdictional Connections: Provides access to Santa Clara or San Francisco Counties, or
between jurisdictions within San Mateo County.
Access to Destinations of County Significance: Provides access to or improves safety near transit,
colleges, employment centers, parks, recreation centers, etc…
Inclusion in Other Countywide or Regional Plan: Included in a plan adopted by San Mateo County,
Metropolitan Transportation Commission, or Association of Bay Area Governments plans.
Bicycle Project Groups To provide a logical way of discussing and cataloging bicycle projects, and to support bicycling within San
Mateo County, the CBPP includes three bicycle project groups:
Key Corridors are corridors that serve key transportation and recreation needs evident in county commute
patterns, concentration of population, and geography. They include the North South Bikeway, the East of 101
North-South Corridor, the Bay Trail, Woodside Road, Highway 1/Coastal Trail/Parallel Trail, Crystal Springs
Regional Trail (San Bruno to Woodside), the Northern East-West Route (South San Francisco to Pacifica)
and Alameda de Las Pulgas.
Bicycle parking is a key element of the bicycle network; secure parking at end-trip locations is essential to
making a trip possible. The CBPP lists general bicycle parking locations considered to be of countywide
significance.
Bicycle signage, both route numbering and wayfinding signage, is an important tool to improve the legibility
of the Countywide Bikeway Network. The CBPP recommends that cities and the County use the Route
San Mateo County Comprehensive Bicycle and Pedestrian Plan
Page ix
Number System developed for the 2000 plan. In addition to installing route numbering along numbered
bikeways, the CBPP recommends that cities and the County install bicycle wayfinding signage along all CBN
bikeways.
Executive Summary
City/
Page x
Figure E-1: Countywide Bikeway Network
San Mateo County Comprehensive Bicycle and Pedestrian Plan
Page xi
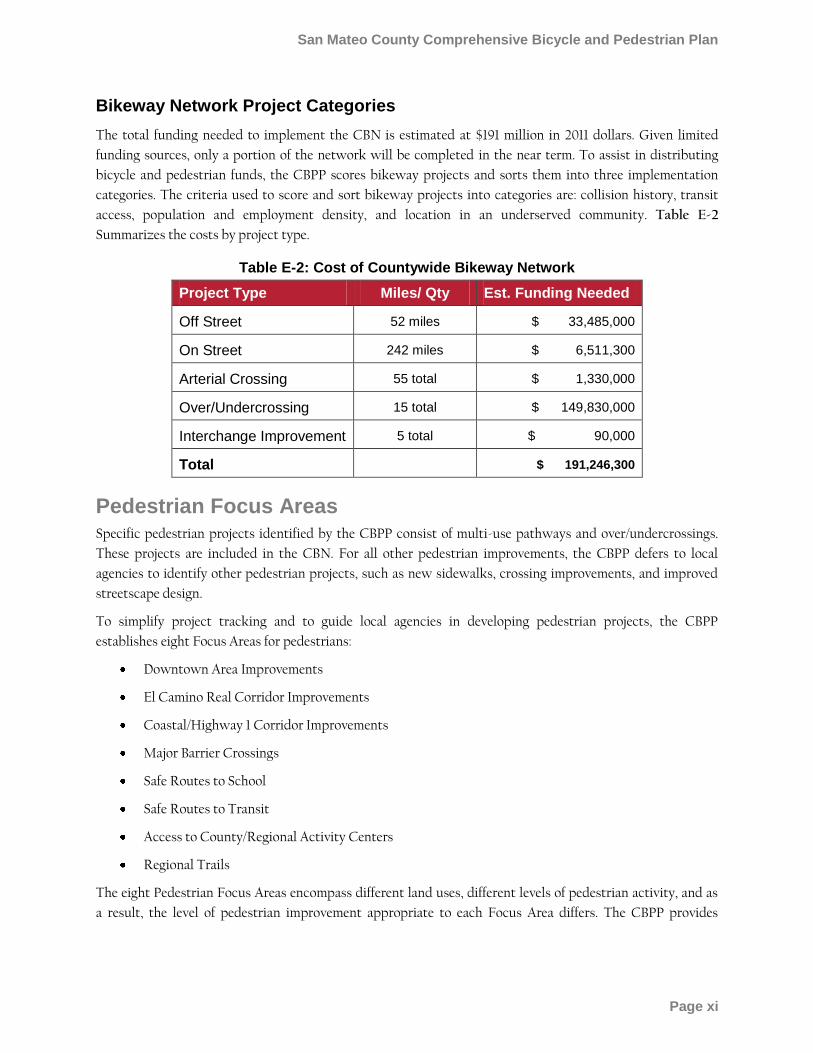
Bikeway Network Project Categories
The total funding needed to implement the CBN is estimated at $191 million in 2011 dollars. Given limited
funding sources, only a portion of the network will be completed in the near term. To assist in distributing
bicycle and pedestrian funds, the CBPP scores bikeway projects and sorts them into three implementation
categories. The criteria used to score and sort bikeway projects into categories are: collision history, transit
access, population and employment density, and location in an underserved community. Table E-2
Summarizes the costs by project type.
Table E-2: Cost of Countywide Bikeway Network
Project Type Miles/ Qty Est. Funding Needed
Off Street 52 miles $ 33,485,000
On Street 242 miles $ 6,511,300
Arterial Crossing 55 total $ 1,330,000
Over/Undercrossing 15 total $ 149,830,000
Interchange Improvement 5 total $ 90,000
Total
$ 191,246,300
Pedestrian Focus Areas Specific pedestrian projects identified by the CBPP consist of multi-use pathways and over/undercrossings.
These projects are included in the CBN. For all other pedestrian improvements, the CBPP defers to local
agencies to identify other pedestrian projects, such as new sidewalks, crossing improvements, and improved
streetscape design.
To simplify project tracking and to guide local agencies in developing pedestrian projects, the CBPP
establishes eight Focus Areas for pedestrians:
Downtown Area Improvements
El Camino Real Corridor Improvements
Coastal/Highway 1 Corridor Improvements
Major Barrier Crossings
Safe Routes to School
Safe Routes to Transit
Access to County/Regional Activity Centers
Regional Trails
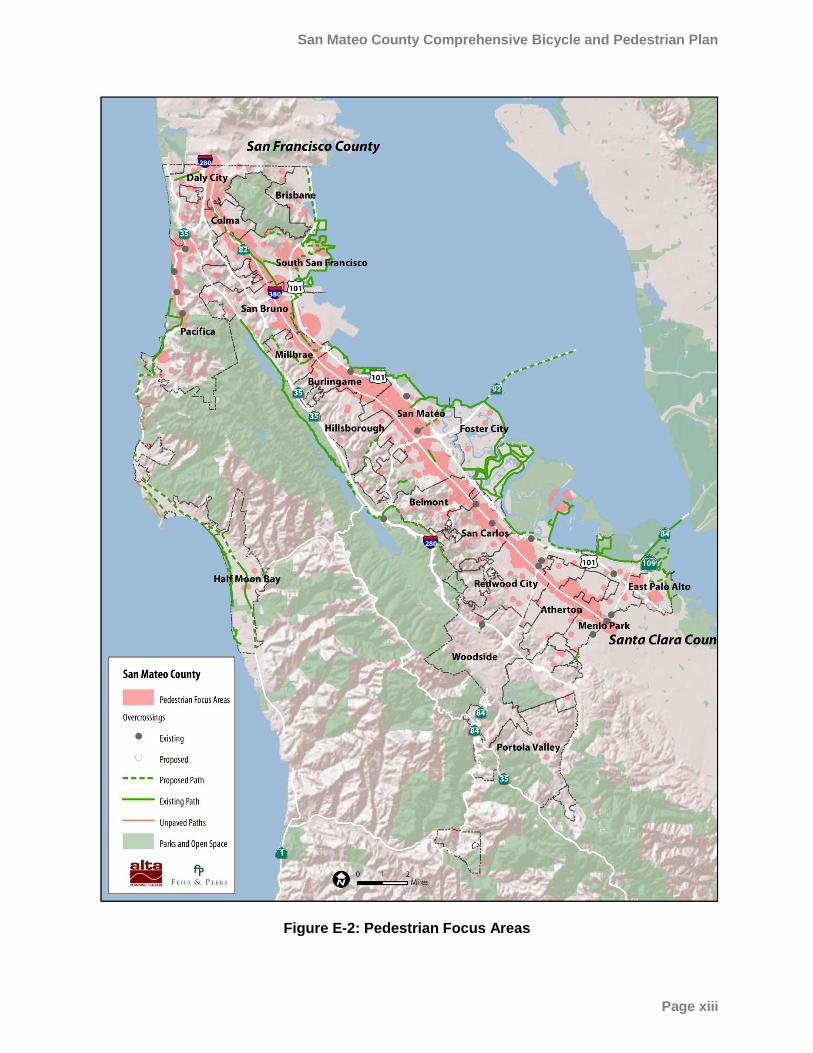
The eight Pedestrian Focus Areas encompass different land uses, different levels of pedestrian activity, and as
a result, the level of pedestrian improvement appropriate to each Focus Area differs. The CBPP provides
Executive Summary
City/
Page xii
minimum design guidelines for each focus area, covering sidewalk design, crossings, transit connections, and
streetscape design. Figure E-2 shows the Pedestrian Focus Areas.
Recommended Pedestrian Criteria
The CBPP presents the following criteria to assist in the funding of pedestrian projects of countywide
significance:
Projects located in Pedestrian Focus Areas should receive priority over projects that do not.
Projects that meet or exceed the design guidelines for the Focus Area, should receive priority over
those that do not.
Projects that improve pedestrian safety, either at a high-collision location or through best practices in
pedestrian design should be prioritized over those that do not.
Projects that target seniors, youth, people with disabilities, and low-income communities and
individuals should be prioritized over those that do not.
San Mateo County Comprehensive Bicycle and Pedestrian Plan
Page xiii
Figure E-2: Pedestrian Focus Areas
Executive Summary
City/
Page xiv
Implementation Strategy Realization of the bicycle and pedestrian projects identified by the CBPP requires continued collaboration
between the cities, the County, C/CAG, SMCTA, and Caltrans. Local implementing agencies are responsible
for designing, constructing and maintaining projects, and working with Caltrans to construct projects along
Caltrans right-of-way. A companion document to this plan provides local implementing agencies with
resources to assist in developing projects recommended by the CBPP.
C/CAG‘s and SMCTA‘s primary role with respect to implementation of the CBPP is to assist local
jurisdictions in implementing projects and programs, and most importantly, to provide funding to the twenty
cities and the County for specific bicycle and pedestrian projects that are on the CBN and within the
Pedestrian Focus Areas.
Funding C/CAG is responsible for distributing Transportation Development Act (TDA) Article 3 and Regional Bicycle
Program (RBP) funds for bicycle projects within the County. SMCTA administers the Measure A funds for
transportation projects and programs in San Mateo County, including the 3 percent of funds for planning,
design, and construction of bicyclist and pedestrian infrastructure. The two agencies are responsible for
developing processes to solicit projects from the local jurisdictions, encourage submission of project
applications, and evaluate and prioritize projects.
For individual bicycle related projects, the CBPP‘s established categories will facilitate the process of
distributing limited local funds. All bicycle projects within the three categories will be considered for funding.
For pedestrian projects, projects within the Pedestrian Focus Areas would be emphasized for funding.
San Mateo County Comprehensive Bicycle and Pedestrian Plan
Page 1
1 Introduction
The C/CAG is the designated Congestion Management Agency (CMA) for San Mateo County, and is
responsible for the coordination, planning, and programming of transportation, land-use, and air quality
related programs and projects. With regard to bicycle and pedestrian programs, C/CAG is responsible for
distributing Transportation Development Act (TDA) Article 3 and Regional Bicycle Program (RBP) funds for
projects within San Mateo County.
SMCTA administers the Measure A Program, funded by the half-cent sales tax, for transportation-related
projects and programs. The Pedestrian and Bicycle Program, one of six programs, receives three percent of the
total sales tax revenue. The Measure A time horizon is 25 years, through the year 2033.
C/CAG, in partnership with the SMCTA and in coordination with the 20 cities and the County, has
developed the CBPP to identify bike routes of countywide significance and to identify focused areas for
pedestrian improvements and related design guidance. The CBPP will provide guidance on countywide
priorities for future funding.
1.1 Plan History
The 2000 San Mateo County Comprehensive Bicycle Route Plan included a set of goals, objectives, policies and actions
to guide development and implementation of bicycling projects and programs in San Mateo County. The plan
positioned local cities and the County for state and federal funding and was adopted as an element of the
following year‘s Countywide Transportation Plan 2010. Numerous jurisdictions have since developed bicycle,
pedestrian, and other multi-modal plans that have further refined and expanded concepts from the 2000 plan,
including the Metropolitan Transportation Commission‘s (MTC) 2001 Regional Bicycle Plan and 2009 Regional
Bicycle Plan Update. The updated CBPP incorporates, but does not supersede, elements from these other efforts.
The CBPP reinforces the priorities of the region and cities and will aid C/CAG and partner agency SMCTA in
prioritizing expenditure of limited and increasingly valuable transportation funding for pedestrian and bicycle
projects.
As the name suggests, C/CAG‘s Comprehensive Bicycle and Pedestrian Plan also provides analysis and review of
regionally significant pedestrian issues and related priorities.
1.2 Importance of Improving Biking and Walking
Research from a variety of disciplines confirms the overwhelming benefits of walking and bicycling to
community health and stresses the importance of retrofitting a built environment that has largely catered to
the automobile for the better half of a century. As a growing and diverse county that takes pride in its
commitment to livability, San Mateo has at least six different – and significant – reasons for making it easier to
travel without a car:
Introduction
City/
Page 2
Congestion Reduction: According to the 2009 National Household Travel Survey, approximately
40% of all trips taken are under two miles –nearly two-thirds of which are taken by car.6 Other local
studies have shown that up to 27% of morning congestion can be attributed to parents dropping their
kids off at school.7 These figures strongly suggest untapped opportunity to relieve congestion through
targeted efforts that convert some or all of these trips to walking and biking. This is bolstered by the
knowledge that increasing roadway capacity is often neither feasible nor cost-effective for built-out
urban areas and can actually lead to inducing new vehicle trips.
Economic Competitiveness: Businesses want to attract talent, and increasingly talent is attracted to
walkable, livable neighborhoods. One survey estimates that 30% of all working Americans changed or
left their job at one point due to the length of their commute.8 Walkable and bikeable communities
are also more stable and affordable. Walk San Diego, a community-based California non-profit,
reports that during the housing crash homes in communities deemed ―walkable‖ maintained almost
5% more of their value than non-walkable communities with similar neighborhood demographics.9
And by eliminating the need to travel by car residents can save an average of more $4,000/year10 —
effectively increasing their purchasing power (and the availability of ―affordable‖ housing) without
increasing average income.
Environmental Protection: The environmental impacts of driving and its related infrastructure are
by now well documented and well understood. Whether it is reducing air pollution and emissions of
harmful greenhouse gases, saving wildlife habitat and available agricultural resources, or addressing
stormwater flooding and degraded water quality—efforts to reduce vehicle miles travelled (VMT)
and demand for new roadways by investing in non-motorized travel is and should be a top priority.
Under Senate Bill 375, the California Air Resources Board identified targets in greenhouse gas reduc-
tions in the Bay Area of 7 percent under 2005 levels by 2020 and 15 percent by 2035. Encouraging pe-
destrian and bicycle transportation will help to achieve these targets.
Public Safety: The Surface Transportation Policy Partnership (STPP) ―pedestrian danger index‖
considers pedestrian crashes, population, and overall pedestrian activity. Its 2000 report ranked San
Mateo County as the fifth most dangerous county for pedestrians in California.11 The existence of a
safety problem is corroborated by analysis from this plan that shows a high concentration of crashes
along streets such as El Camino Real and a disproportionately high number of pedestrian crashes
among all traffic collisions. Success at making walking safer and more attractive has the added
benefits of building social cohesiveness among residents and adding ‗eyes on the street‘ – factors that
also often lead to reductions in crime.12
6 For additional statistics see: http://www.bikeleague.org/resources/reports/pdfs/nhts09.pdf 7 Transportation Authority of Marin (TAM): http://www.tam.ca.gov/index.aspx?page=94 8 According to Commute Seattle: http://www.commuteseattle.com/?page_id=223 9 ―Walkable‘ Communities Lose Less Value, “The Wall Street Journal, November 8, 2010. 10 ―Evaluating Non-Motorized Transportation Benefits and Costs,‖ Victoria Transportation Policy Institute, November, 2010. 11Dangerous By Design: Solving the Epidemic of Preventable Pedestrian Deaths (And Making Great Neighborhoods Too), Surface Transportation Policy Partnership, 2010. http://www.transact.org/Ca/dangerousbydesign.htm 12 For various sources that discuss the relationship of walkability and crime, see: http://streetswiki.wikispaces.com/Eyes+On+The+Street
San Mateo County Comprehensive Bicycle and Pedestrian Plan
Page 3
Social Equity: For the nearly three percent of San Mateo County households that do not own a car,13
walking and/or bicycling is an essential, daily activity (even if commuting by transit). Targeting a fair
share of resources toward these taxpayers is not only the right thing to do; it will be an especially
important strategy to ensure an aging population is not left isolated from important county services.
Public Health: As the percentage of children walking to school has dropped precipitously in a
generation, rates of obesity and chronic disease (namely diabetes) have skyrocketed.14 Following a
similar trend, less than half of all U.S. adults now achieve healthy levels of physical activity according
to the Centers for Disease Control and Prevention. While the causes and issues involved are complex,
there is a growing consensus that poor access to walkable neighborhoods is a prime contributor to
this public health epidemic.15
1.3 Plan Purpose
The CBPP addresses the planning, design, funding, and implementation for a variety of bicycle and pedestrian
infrastructure projects and programs in three important ways:
First, the CBPP provides a new policy framework to guide the implementation and evaluation of this plan.
This framework includes a long-term vision statement and a set of goals and policies that incorporate bicycle
and pedestrian issues.
Second, the CBPP updates and refines the Countywide Bicycle Network (CBN). To maximize funding
available for bikeway projects, and to assist cities without a bicycle plan, the CBPP emphasizes projects that
improve safety, that promote access to jobs; that are located within areas of high population density; and that
are in areas with the greatest need.
Third, the plan establishes geographic focus areas for countywide investment in pedestrian infrastructure,
based on an analysis of pedestrian activity and need throughout the county. To assist jurisdictions with
identifying specific pedestrian projects, the CBPP describes minimum design guidelines for these focus areas.
The CBPP also serve as a bicycle and pedestrian plan for cities in the County that currently do not have their
own.
1.4 Contents of Plan
The remainder of this plan is organized in a logical sequence to provide information on the state of pedestrian
and bicycle needs in San Mateo County and a set of actions for making walking and bicycling safer, easier and
more comfortable:
Chapter 2, Vision and Goals, includes a set of goals, objectives, policies, actions, and a long-term
vision statement to guide development and implementation of the CBPP.
13 According to the 2000 Bay Area Travel Survey (BATS) 14 The Institute of Medicine of the National Academies (2004) estimates obesity rates among children are three times what they were in the 1980‘s. 15 See Frank, et al (2005). ―Linking Objectively Measured Physical Activity with Objectively Measured Urban Form,‖ American Journal of Preventative Medicine28 (2, Sup. 2.), pp. 117–125.
Introduction
City/
Page 4
Chapter 3, Existing Conditions, reviews existing walking and bicycling conditions in San Mateo
County, and includes an inventory of major assets and maps of important land use and demographic
characteristics.
Chapter 4, Relevant Plans, Policies and Guidelines, summarizes state, regional, county and local
planning efforts related to walking and biking.
Chapter 5, Needs Analysis, provides a detailed analysis of walking and bicycling trends in San
Mateo County and identifies the most critical needs for encouraging more walking and bicycling
activity. As part of this chapter, pedestrian demand factors are thoroughly explored.
Chapter 6, Countywide Bikeway Network, presents the bikeway projects needed to complete the
Countywide Bikeway Network (CBN), and a companion framework that sorts projects into three
implementation categories. This Chapter also includes cost estimates by categories.
Chapter 7, Pedestrian Focus Areas, establishes pedestrian ―Focus Areas‖: areas of high pedestrian
demand where pedestrian improvements of countywide significance can be located. The Chapter also
suggests a methodology to use when prioritizing projects in these Focus Areas.
Chapter 8, Implementation Strategy, describes the roles of the local implementing agencies, C/CAG
and the SMCTA, and how the CBPP will be used to guide implementation of bicycle and pedestrian
funding programs.
The document is supported by several appendices:
Appendix A, Detailed Bikeway Project Tables, lists roadway segments, overcrossings, and
intersection improvements on the CBN by category and by jurisdiction. It also includes maps of CBN
projects color-coded by project category.
Appendix B, Detailed Maps of Countywide Bikeway Network, presents city-level maps of the
Countywide Bikeway Network, allowing cities and the County to identify specific bikeway segments
in their jurisdiction.
Appendix C, Pedestrian Demand Analysis, describes the process to identify high pedestrian
demand areas that can be used to prioritize pedestrian projects.
Appendix D, Federal, State, Regional, and County Policy Matrix, summarizes policies and plans
relevant to the CBPP and identifies how the CBPP complies with or supports these policies and plans.
Appendix E, Bikeway Signage, presents design details for the Route Number system and bicycle
wayfinding for bikeways along the CBN.
A companion document to the CBPP, A Resource Guide for the Education, Promotion, Funding, and Design of Pedestrian
and Bicycle Facilities provides guidance to cities and the County in implementing bicycle and pedestrian
projects. It includes the following information:
Education, Encouragement, and Promotion Guidebook, describes programs and activities local
jurisdictions may use to support and promote walking and biking.
Funding Sources, provides implementing agencies with a list of potential sources to fund bicycle and
pedestrian projects and programs.
San Mateo County Comprehensive Bicycle and Pedestrian Plan
Page 5
Pedestrian Design Guidelines, and Bicycle Design Guidelines provide design guidelines drawn
from federal and state sources, as well as innovative and experimental treatments, that communities
can consider when designing bikeways and pedestrian infrastructure.

Introduction
City/
Page 6
This page intentionally left blank.
San Mateo County Comprehensive Bicycle and Pedestrian Plan
Page 7
2 Vision and Goals
This chapter presents a vision, goals, and policies to support bicycling and walking within San Mateo County.
The goals and policies reflect C/CAG‘s role and responsibilities as the countywide transportation planning,
funding and coordinating agency, and were developed in collaboration with C/CAG‘s Bicycle and Pedestrian
Advisory Committee. The CBPP‘s recommended bikeways and pedestrian focus areas are designed to support
these goals and policies.
2.1 Vision Statement
The following vision statement expresses what bicycling and walking will be like in San Mateo County in the
future upon implementation of projects contained in the CBPP:
San Mateo County has an interconnected system of safe, convenient and universally accessible bicycle and pedestrian
facilities, for both transportation and recreation. These facilities provide access to jobs, homes, schools, transit, shopping,
community facilities, parks and regional trails throughout the county. At the same time, the county has strengthened its
network of vibrant, higher-density, mixed-use and transit-accessible communities, that enable people to meet their daily
needs without access to a car. As a result, many more people in San Mateo County ride bicycles and walk, making our
transportation system more balanced, equitable and sustainable. More bicycling and walking have reduced automobile
dependence, traffic congestion, pollution and the county’s carbon footprint while increasing mobility options, promoting
healthy lifestyles, saving residents money and fostering social interaction.
2.2 Goals, Objectives and Policies
The five goals presented here are broad statements of purpose, each dealing with a separate topic designed to
support implementation of the long-term vision for bicycling and walking in the county. The goals set the
overall directions for efforts to improve non-motorized transportation.
Just as the goals buttress the vision statement, several policies support each goal. These policies identify more
specific action areas to attain each goal. Together, the goals and policies define the implementation strategy
for the CBPP. In most cases, C/CAG and the SMCTA will need to rely on the cooperation of other agencies,
especially local jurisdictions, to pursue and achieve the policies and goals outlined here.
Goal : A Comprehensive Countywide System of Facil it ies for Bicyclists
and Pedestrians
● Policy 1.1: Program funds for bicycle, pedestrian and accessibility improvements to local jurisdictions for
the planning, design, construction and maintenance of facilities of countywide priority.
● Policy 1.2: In developing a countywide system of facilities, place special attention on implementing or im-
proving north–south routes (particularly for bicyclists) and reducing barriers to east–west access.
● Policy 1.3: Encourage and collaborate with Caltrans and local agencies to implement countywide priority
facilities within their jurisdiction. In particular, encourage Caltrans to provide safe bicycle and pedestrian
Vision and Goals
City/
Page 8
crossings of state highways in San Mateo County and local agencies to include bicycle and pedestrian pro-
jects in their capital improvement programs.
● Policy 1.4: Promote cooperation among local agencies and with San Francisco and Santa Clara counties to
pursue funding for multi-jurisdictional projects and implement bicycle and pedestrian facilities across ju-
risdictional lines.
● Policy 1.5: Provide funding for support facilities, including short- and long-term bicycle parking; a count-
ywide bikeway signage scheme; locker rooms, showers and other amenities in public facilities for changing
and for storing clothes and equipment; and devices for improving accessibility for people with disabilities.
● Policy 1.6: Update this plan every five years, particularly to incorporate needed changes to the list of pro-
posed countywide projects.
Goal : More People Riding and Walking for Transportation and
Recreation
● Policy 2.1: Work with local, county and regional agencies and organizations—including those with a focus
on public health—to develop effective encouragement programs that promote bicycling and walking as
safe, convenient and healthy modes of transportation.
● Policy 2.2: Provide funding for effective support programs and events that encourage bicycling and walk-
ing among a broad range of potential users, including people with disabilities.
● Policy 2.3: Encourage local school districts to implement projects and activities that promote bicycling and
walking to school among students and staff.
● Policy 2.4: Encourage local agencies and transit operators, such as SamTrans, Caltrain and BART, to work
cooperatively to promote bicycling and walking to transit by improving access to and through stations and
stops, installing bicycle parking and maximizing opportunities for on-board bicycle access.
● Policy 2.5: Promote integration of bicycle-related and walking-related services and activities into broader
countywide transportation demand management and commute alternatives programs.
● Policy 2.6: Serve as a resource to county employers on promotional information and resources related to
bicycling and walking.
● Policy2.7: Encourage local agencies to provide safe and convenient bicycle and pedestrian infrastructure
for underserved communities.
Goal : Improved Safety for Bicyclists and Pedestrians
● Policy 3.1: When allocating funds, place an emphasis on projects that address safety deficiencies, especially
conflicts with motor vehicles, for bicyclists, pedestrians and people with disabilities.
● Policy 3.2: Promote collaboration among the Sheriff‘s Office, local police departments and other county
and local agencies to develop and administer effective safety, education and enforcement strategies related
to non-motorized transportation.
San Mateo County Comprehensive Bicycle and Pedestrian Plan
Page 9
● Policy 3.3: Provide support for programs that educate drivers, bicyclists and pedestrians about their rights
and responsibilities, as well as traffic education and safety programs for adults and youth.
Goal : Complete Streets and Routine Accommodation of Bicyclists and
Pedestrians
● Policy 4.1: Comply with the complete streets policy requirements of Caltrans and the Metropolitan Trans-
portation Commission concerning safe and convenient access for bicyclists and pedestrians, and assist lo-
cal implementing agencies in meeting their responsibilities under the policy.
● Policy 4.2: For local transportation projects funded by county or regional agencies, encourage that local
implementing agencies incorporate ―complete streets‖ principles as appropriate; that they provide at least
equally safe and convenient alternatives if they result in the degradation of bicycle or pedestrian access; and
that they provide temporary accommodations for pedestrians and bicyclists during construction.
● Policy 4.3: Monitor countywide transportation projects to ensure that the needs of bicyclists and pedestri-
ans are considered in programming, planning, design, construction, operation and maintenance, and en-
courage local agencies to do the same for their projects.
● Policy 4.4: Provide support to local agencies in adopting policies, guidelines and standards for complete
streets and for routine accommodation of bicyclists and pedestrians in all new transportation projects.
● Policy 4.5: Encourage local agencies to adopt policies, guidelines, standards and regulations that result in
truly bicycle-friendly and pedestrian-friendly land use developments, and provide them technical assis-
tance and support in this area.
● Policy 4.6: Discourage local agencies from removing, degrading or blocking access to bicycle and pedestri-
an facilities without providing a safe and convenient alternative.
Goal : Strong Local Support for Non-Motorized Transportation
● Policy 5.1: Encourage all local jurisdictions to develop comprehensive bicycle and pedestrian plans, and
provide assistance and support in this area as appropriate.
● Policy 5.2: Encourage all local jurisdictions to designate bicycle and pedestrian coordinators and to estab-
lish local bicycle and pedestrian advisory committees or provide other meaningful opportunities for public
input on issues related to non-motorized transportation.
● Policy 5.3: Involve the public and local agencies meaningfully in making decisions about the planning, de-
sign and funding of bicycle and pedestrian projects, and maintain an open and accessible process for
providing input and influencing decisions.
● Policy 5.4: Provide timely information to local jurisdictions on funding programs and sources not adminis-
tered by C/CAG that may be used to implement bicycle and pedestrian facilities, and encourage them to
submit applications for project funding.
Vision and Goals
City/
Page 10
This page intentionally left blank.
San Mateo County Comprehensive Bicycle and Pedestrian Plan
Page 11
3 Existing Conditions
This section describes the status of bicycle and pedestrian facilities in San Mateo County as of 2010. By
examining existing facilities, connectivity, gaps in the bicycle and pedestrian network, accessibility for all
users, safety, and barriers to multi-modal travel, key opportunities and constraints are identified.
3.1 Bicycling and Walking Setting
Bicycling and walking in San Mateo County are affected by the county‘s geographic features, geographic
distribution of population and employment, and transportation system. The county includes flat coastal areas
that support everyday walking and bicycling, as well as mountainous areas that provide recreational bicycling
opportunities. Residents, jobs, employment, and major transit and freeway corridors are concentrated in the
eastern part of the County, and as a result, this area sees more walking and bicycling than other areas of the
County. At the same time, the high concentration of through-movement corridors also creates barriers for
bicyclists and pedestrians.
The following sections describe these three topics in more detail.
3.1.1 Geographic Features
San Mateo County is framed by the Pacific coast on the west and by the San Francisco Bay to the east. The
Santa Cruz Mountains form a ridge along the San Francisco Peninsula from San Francisco to Salinas,
separating the Pacific Ocean from San Francisco Bay. More than half a dozen watercourses flow through the
county to drain into the ocean or the Bay. Geographic features, such as mountains, hills and streams, create
barriers for bicyclists and pedestrians thereby limiting circulation. The mountain ranges and abundance of
open space parks and reserves throughout the western portion of the county offer challenging and exciting
bike rides to recreational bicyclists.
3.1.2 Development Pattern and Activity Centers
The county is home to 718,451 residents.16 Topographic limitations and public policy in San Mateo County
have limited urbanization to the eastern part of the county along the Highway 101 corridor. Downtowns,
employment centers, and transit hubs are distributed throughout the county. Smaller activity centers also
exist along Highway 1 in the more rural western part of the county.
The county‘s wide range of development patterns, from urban to rural, precludes a one-size fits all approach to
bicycle and pedestrian planning. This Plan prioritizes improvements in the urbanized areas of the county,
while also providing for rural areas. As an example, the design guidelines included in the CBPP‘s companion
document, A Resource Guide for the Education, Promotion, Funding, and Design of Pedestrian and Bicycle Facilities, have
been tailored to support recommended projects that are located throughout the county, in both urban and
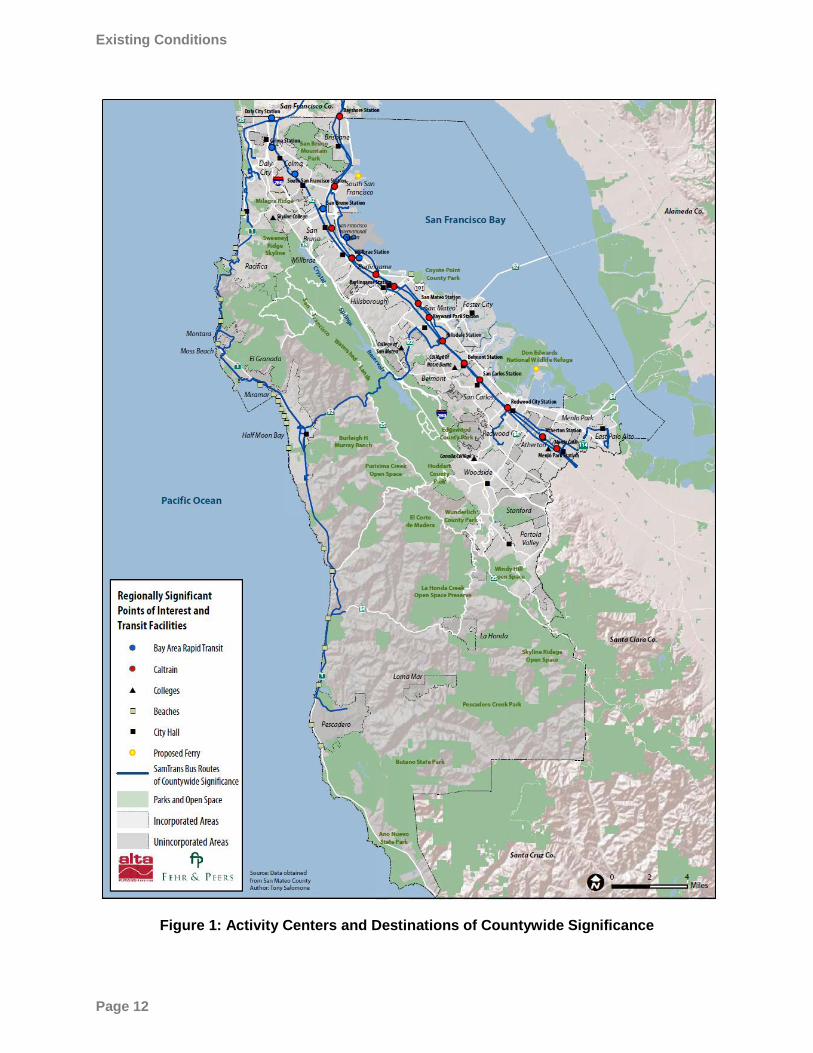
rural areas. Figure 1 maps activity centers and destinations of countywide significance.
16 2008 American Community Survey
Existing Conditions
City/
Page 12
Figure 1: Activity Centers and Destinations of Countywide Significance
San Mateo County Comprehensive Bicycle and Pedestrian Plan
Page 13
3.1.3 Transportation System The geographic features and land use relationships in San Mateo County have resulted in a transportation
system generally oriented in a north-south direction along the San Francisco Bay. Historically, each city
developed with a focus on the downtown and around local railroad stations, resulting in a discontinuous
street grid system from community to community. The County also has many populated unincorporated
areas, such as North Fair Oaks and Montara, whose streets fall under the jurisdiction of County planning and
public works agencies. The freeways, major arterials and rail lines that provide transportation between San
Mateo County‘s communities are described below.
Freeways and Roadways
Major north-south arterials and freeways in San Mateo County include Highway 101, El Camino Real (State
Route 82), Interstate 280, and Highway l. Major east-west freeways and roadways include Interstate 380,
Woodside Road (State Route 84) and Highway 92.
Transit
San Mateo County is served by Caltrain, which provides commuter rail service along the San Francisco
Peninsula; Bay Area Rapid Transit (BART), which provides train service throughout the San Francisco Bay
Area; and the San Mateo County Transit District (SamTrans), which offers bus and paratransit services for the
county. SamTrans has identified the following bus routes of countywide significance: El Camino trunkline
service: Routes 390 and 391; Middlefield Rd. corridor: Route 296; Pacifica (Linda Mar) to Daly City BART
connection: Route 110; Bayshore Highway (bayside east): Route 292, and Highway 92: Route 294. These are
shown in Figure 1. C/CAG and SMCTA also fund numerous shuttles that provide access between transit
stops and workplaces.
This Plan uses BART and Caltrain station access as a criterion for categorizing bikeway projects and uses bus
and rail access to help identify pedestrian projects of countywide significance.
Airports
The San Mateo community is served by the San Francisco International Airport (SFIA). SFIA is one of the
world‘s 30 busiest airports. The San Carlos Airport and Half Moon Bay Airport provide additional aviation
access.
3.1.4 Barriers to Bicycle and Pedestrian Travel The transportation features described above facilitate bicycle and pedestrian access throughout the county,
but also act as barriers to bicyclists and pedestrians. These barriers are described below. Chapter 6 of the
CBPP provides recommendations for bicycle and pedestrian bridges and arterial-bikeway intersection
improvements that address the barriers presented in this section.
Freeway and Roadway Barriers
Many roadway crossings of the interstates and highways are challenging and uncomfortable for bicyclists and
pedestrians, particularly roadway crossings associated with interchanges. On- and off-ramps, high traffic
volumes, and steep grades are particularly problematic for bicyclists. Intersections along Woodside Road, El
Camino Real and other major arterials are typically configured to accommodate motorists, but do not always
comfortably accommodate bicyclists and pedestrians. Shoulders along portions of Highway 92, particularly
west of I-280, are often narrow or non-existent. The CBPP includes an inventory of freeway overcrossings and
Existing Conditions
City/
Page 14
undercrossings, interchanges, and intersections along major arterials that are relevant to bicycle and
pedestrian travel in San Mateo County.
Transit Barriers
Transit services facilitate active transportation by enabling bicyclists and pedestrians to extend their travel
distances. At the same time, limited crossings of rail lines within the county serve as barriers to east-west
bicycle and pedestrian travel. Grade separated crossings can provide safe access across rail lines if designed to
accommodate bicyclists and pedestrians. Retrofitting grade separated crossings with bike lanes, paths or
sidewalks can be prohibitive, so often these crossings do not accommodate bicyclists and pedestrians and are
gaps in an otherwise continuous bikeway or walkway network. At-grade crossings of rail lines are
problematic for bicyclists when the rail tracks intersect the bicyclist line of travel at less than a 45 degree
angle. Most at-grade rail crossings in San Mateo County are close to perpendicular, but there are some
crossings, particularly of spur lines, that meet at an undesirable angle.
Airport Barriers
Airports are primary destinations not just for travelers, but also for employees of the airline and airport
concessions. There is limited direct bicycle and pedestrian access to San Mateo County‘s airports, and in the
eastern part of the county the Bay Trail alignment has been affected by the SFIA and the San Carlos Airport.
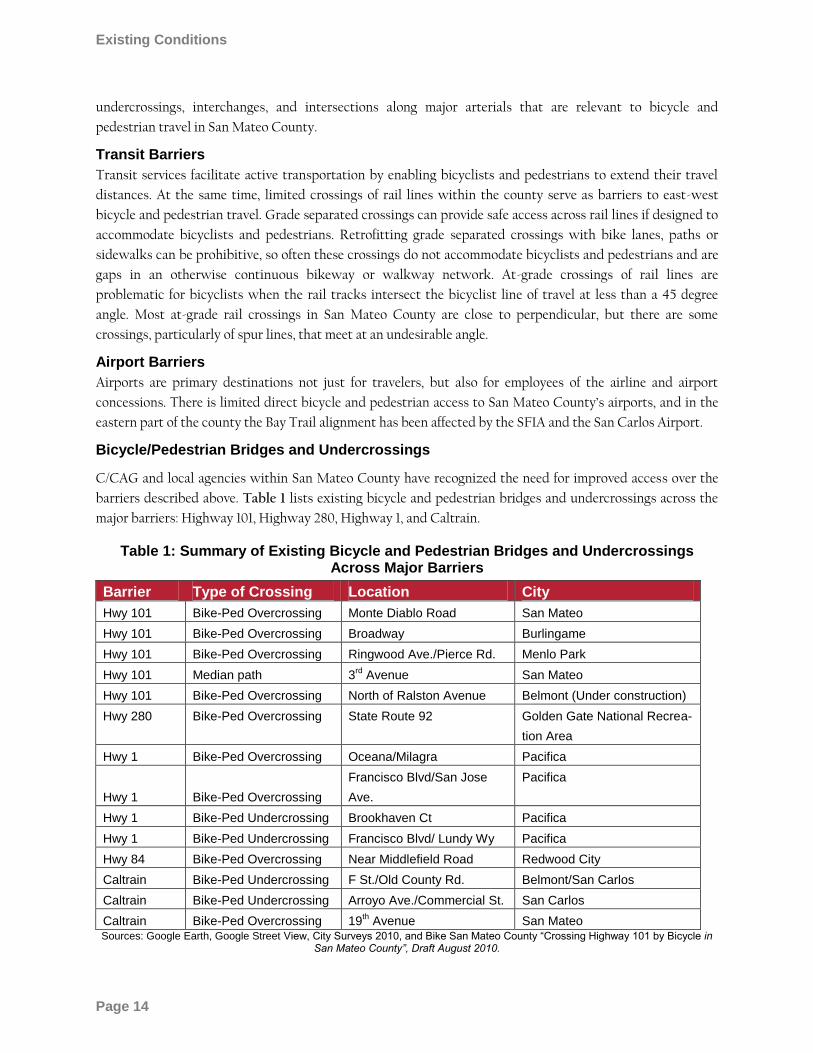
Bicycle/Pedestrian Bridges and Undercrossings
C/CAG and local agencies within San Mateo County have recognized the need for improved access over the
barriers described above. Table 1 lists existing bicycle and pedestrian bridges and undercrossings across the
major barriers: Highway 101, Highway 280, Highway 1, and Caltrain.
Table 1: Summary of Existing Bicycle and Pedestrian Bridges and Undercrossings Across Major Barriers
Barrier Type of Crossing Location City
Hwy 101 Bike-Ped Overcrossing Monte Diablo Road San Mateo
Hwy 101 Bike-Ped Overcrossing Broadway Burlingame
Hwy 101 Bike-Ped Overcrossing Ringwood Ave./Pierce Rd. Menlo Park
Hwy 101 Median path 3rd
Avenue San Mateo
Hwy 101 Bike-Ped Overcrossing North of Ralston Avenue Belmont (Under construction)
Hwy 280 Bike-Ped Overcrossing State Route 92 Golden Gate National Recrea-
tion Area
Hwy 1 Bike-Ped Overcrossing Oceana/Milagra Pacifica
Hwy 1 Bike-Ped Overcrossing
Francisco Blvd/San Jose
Ave.
Pacifica
Hwy 1 Bike-Ped Undercrossing Brookhaven Ct Pacifica
Hwy 1 Bike-Ped Undercrossing Francisco Blvd/ Lundy Wy Pacifica
Hwy 84 Bike-Ped Overcrossing Near Middlefield Road Redwood City
Caltrain Bike-Ped Undercrossing F St./Old County Rd. Belmont/San Carlos
Caltrain Bike-Ped Undercrossing Arroyo Ave./Commercial St. San Carlos
Caltrain Bike-Ped Overcrossing 19th Avenue San Mateo
Sources: Google Earth, Google Street View, City Surveys 2010, and Bike San Mateo County “Crossing Highway 101 by Bicycle in San Mateo County”, Draft August 2010.
San Mateo County Comprehensive Bicycle and Pedestrian Plan
Page 15
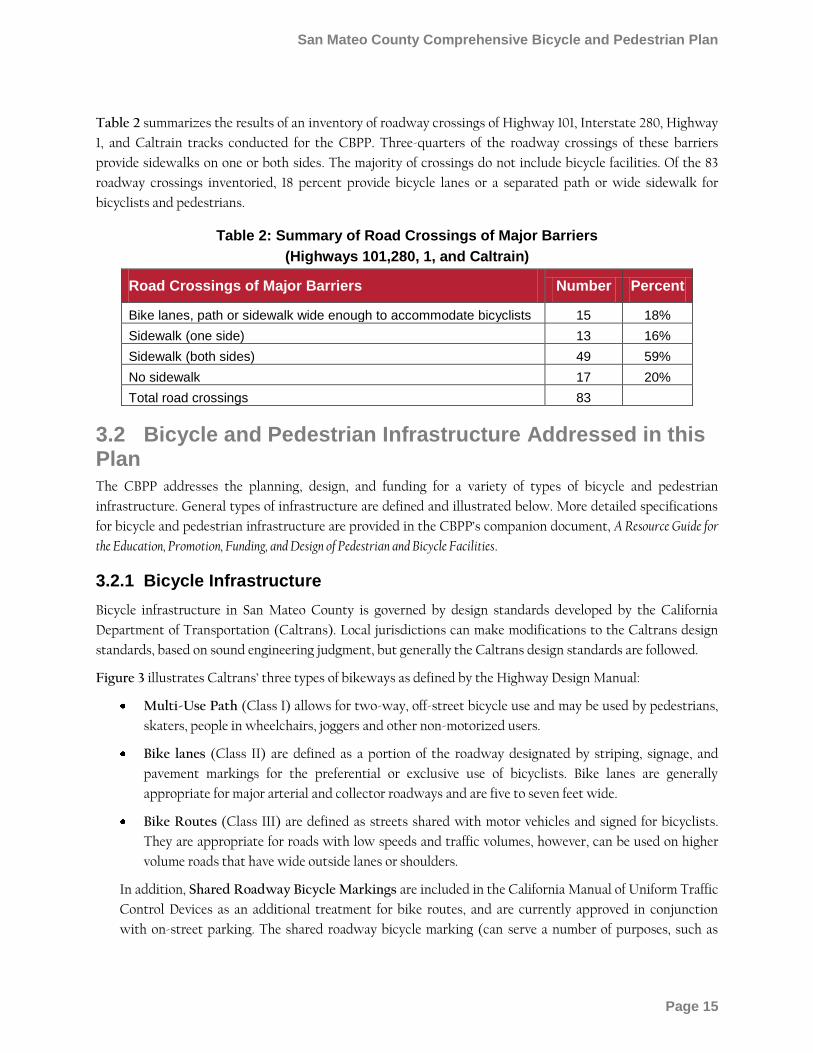
Table 2 summarizes the results of an inventory of roadway crossings of Highway 101, Interstate 280, Highway
1, and Caltrain tracks conducted for the CBPP. Three-quarters of the roadway crossings of these barriers
provide sidewalks on one or both sides. The majority of crossings do not include bicycle facilities. Of the 83
roadway crossings inventoried, 18 percent provide bicycle lanes or a separated path or wide sidewalk for
bicyclists and pedestrians.
Table 2: Summary of Road Crossings of Major Barriers
(Highways 101,280, 1, and Caltrain)
Road Crossings of Major Barriers Number Percent
Bike lanes, path or sidewalk wide enough to accommodate bicyclists 15 18%
Sidewalk (one side) 13 16%
Sidewalk (both sides) 49 59%
No sidewalk 17 20%
Total road crossings 83
3.2 Bicycle and Pedestrian Infrastructure Addressed in this Plan The CBPP addresses the planning, design, and funding for a variety of types of bicycle and pedestrian
infrastructure. General types of infrastructure are defined and illustrated below. More detailed specifications
for bicycle and pedestrian infrastructure are provided in the CBPP‘s companion document, A Resource Guide for
the Education, Promotion, Funding, and Design of Pedestrian and Bicycle Facilities.
3.2.1 Bicycle Infrastructure
Bicycle infrastructure in San Mateo County is governed by design standards developed by the California
Department of Transportation (Caltrans). Local jurisdictions can make modifications to the Caltrans design
standards, based on sound engineering judgment, but generally the Caltrans design standards are followed.
Figure 3 illustrates Caltrans‘ three types of bikeways as defined by the Highway Design Manual:
Multi-Use Path (Class I) allows for two-way, off-street bicycle use and may be used by pedestrians,
skaters, people in wheelchairs, joggers and other non-motorized users.
Bike lanes (Class II) are defined as a portion of the roadway designated by striping, signage, and
pavement markings for the preferential or exclusive use of bicyclists. Bike lanes are generally
appropriate for major arterial and collector roadways and are five to seven feet wide.
Bike Routes (Class III) are defined as streets shared with motor vehicles and signed for bicyclists.
They are appropriate for roads with low speeds and traffic volumes, however, can be used on higher
volume roads that have wide outside lanes or shoulders.
In addition, Shared Roadway Bicycle Markings are included in the California Manual of Uniform Traffic
Control Devices as an additional treatment for bike routes, and are currently approved in conjunction
with on-street parking. The shared roadway bicycle marking (can serve a number of purposes, such as
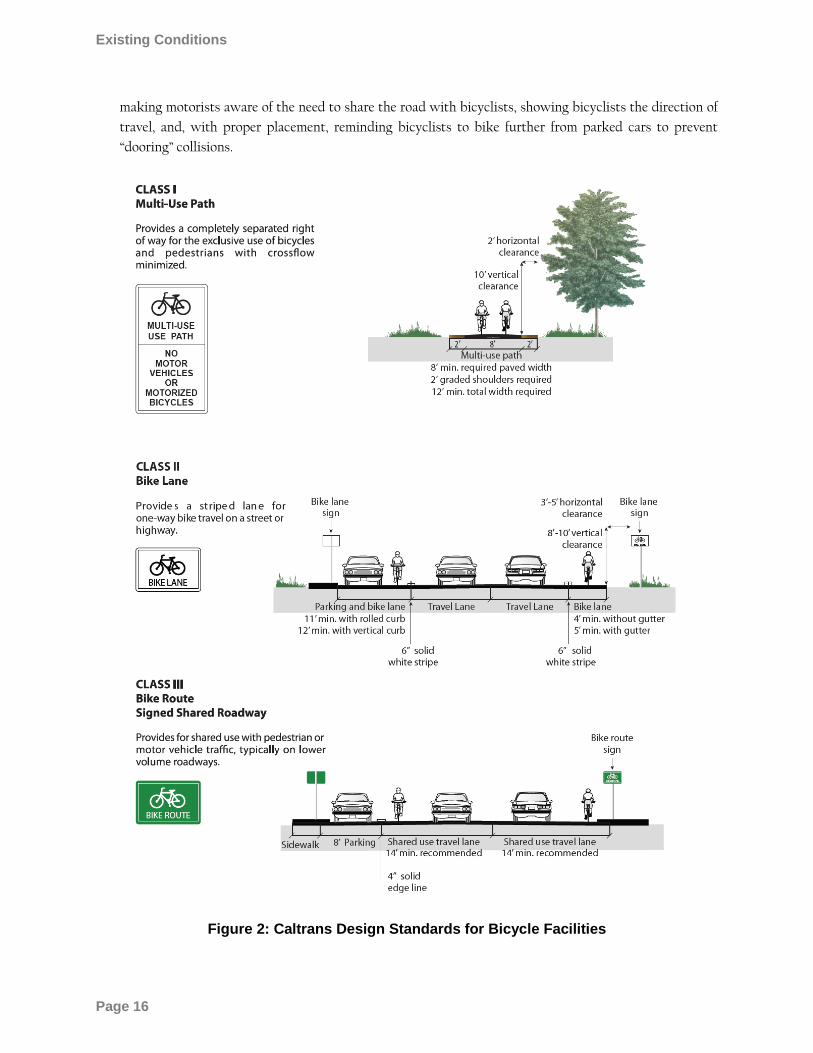
Existing Conditions
City/
Page 16
making motorists aware of the need to share the road with bicyclists, showing bicyclists the direction of
travel, and, with proper placement, reminding bicyclists to bike further from parked cars to prevent
―dooring‖ collisions.
Figure 2: Caltrans Design Standards for Bicycle Facilities
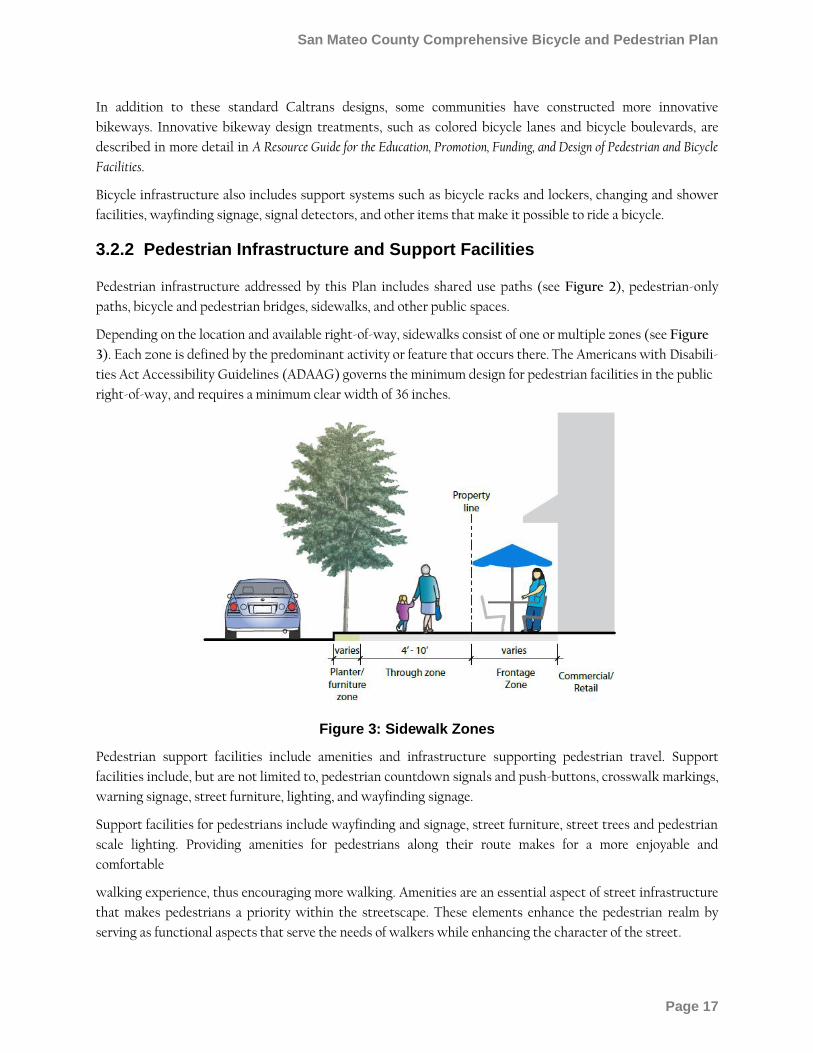
San Mateo County Comprehensive Bicycle and Pedestrian Plan
Page 17
In addition to these standard Caltrans designs, some communities have constructed more innovative
bikeways. Innovative bikeway design treatments, such as colored bicycle lanes and bicycle boulevards, are
described in more detail in A Resource Guide for the Education, Promotion, Funding, and Design of Pedestrian and Bicycle
Facilities.
Bicycle infrastructure also includes support systems such as bicycle racks and lockers, changing and shower
facilities, wayfinding signage, signal detectors, and other items that make it possible to ride a bicycle.
3.2.2 Pedestrian Infrastructure and Support Facilities
Pedestrian infrastructure addressed by this Plan includes shared use paths (see Figure 2), pedestrian-only
paths, bicycle and pedestrian bridges, sidewalks, and other public spaces.
Depending on the location and available right-of-way, sidewalks consist of one or multiple zones (see Figure
3). Each zone is defined by the predominant activity or feature that occurs there. The Americans with Disabili-
ties Act Accessibility Guidelines (ADAAG) governs the minimum design for pedestrian facilities in the public
right-of-way, and requires a minimum clear width of 36 inches.
Figure 3: Sidewalk Zones
Pedestrian support facilities include amenities and infrastructure supporting pedestrian travel. Support
facilities include, but are not limited to, pedestrian countdown signals and push-buttons, crosswalk markings,
warning signage, street furniture, lighting, and wayfinding signage.
Support facilities for pedestrians include wayfinding and signage, street furniture, street trees and pedestrian
scale lighting. Providing amenities for pedestrians along their route makes for a more enjoyable and
comfortable
walking experience, thus encouraging more walking. Amenities are an essential aspect of street infrastructure
that makes pedestrians a priority within the streetscape. These elements enhance the pedestrian realm by
serving as functional aspects that serve the needs of walkers while enhancing the character of the street.
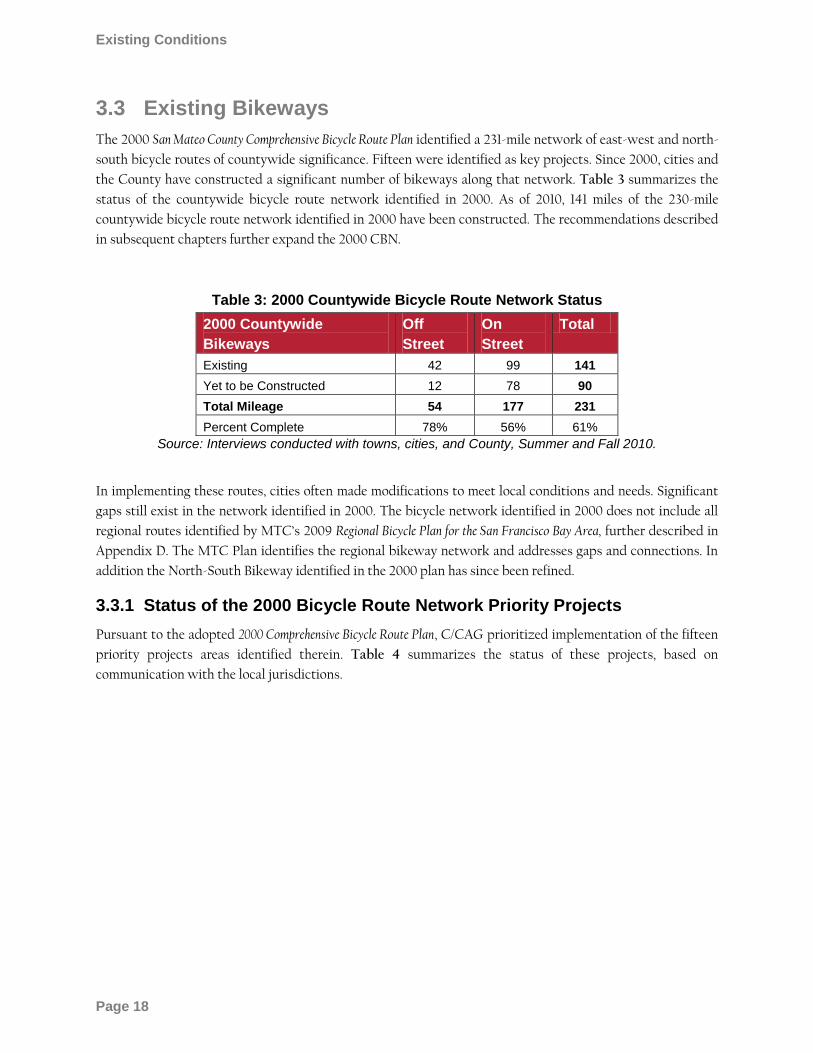
Existing Conditions
City/
Page 18
3.3 Existing Bikeways
The 2000 San Mateo County Comprehensive Bicycle Route Plan identified a 231-mile network of east-west and north-
south bicycle routes of countywide significance. Fifteen were identified as key projects. Since 2000, cities and
the County have constructed a significant number of bikeways along that network. Table 3 summarizes the
status of the countywide bicycle route network identified in 2000. As of 2010, 141 miles of the 230-mile
countywide bicycle route network identified in 2000 have been constructed. The recommendations described
in subsequent chapters further expand the 2000 CBN.
Table 3: 2000 Countywide Bicycle Route Network Status
2000 Countywide
Bikeways
Off
Street
On
Street
Total
Existing 42 99 141
Yet to be Constructed 12 78 90
Total Mileage 54 177 231
Percent Complete 78% 56% 61%
Source: Interviews conducted with towns, cities, and County, Summer and Fall 2010.
In implementing these routes, cities often made modifications to meet local conditions and needs. Significant
gaps still exist in the network identified in 2000. The bicycle network identified in 2000 does not include all
regional routes identified by MTC‘s 2009 Regional Bicycle Plan for the San Francisco Bay Area, further described in
Appendix D. The MTC Plan identifies the regional bikeway network and addresses gaps and connections. In
addition the North-South Bikeway identified in the 2000 plan has since been refined.
3.3.1 Status of the 2000 Bicycle Route Network Priority Projects
Pursuant to the adopted 2000 Comprehensive Bicycle Route Plan, C/CAG prioritized implementation of the fifteen
priority projects areas identified therein. Table 4 summarizes the status of these projects, based on
communication with the local jurisdictions.
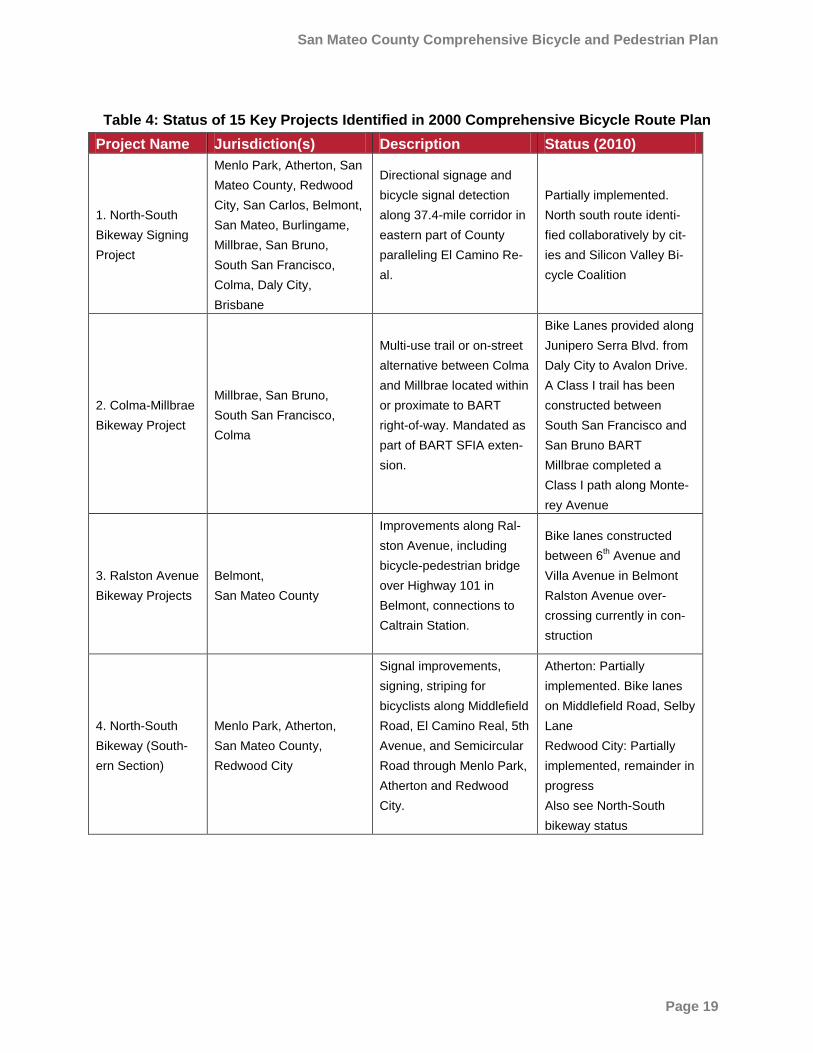
San Mateo County Comprehensive Bicycle and Pedestrian Plan
Page 19
Table 4: Status of 15 Key Projects Identified in 2000 Comprehensive Bicycle Route Plan
Project Name Jurisdiction(s) Description Status (2010)
1. North-South
Bikeway Signing
Project
Menlo Park, Atherton, San
Mateo County, Redwood
City, San Carlos, Belmont,
San Mateo, Burlingame,
Millbrae, San Bruno,
South San Francisco,
Colma, Daly City,
Brisbane
Directional signage and
bicycle signal detection
along 37.4-mile corridor in
eastern part of County
paralleling El Camino Re-
al.
Partially implemented.
North south route identi-
fied collaboratively by cit-
ies and Silicon Valley Bi-
cycle Coalition
2. Colma-Millbrae
Bikeway Project
Millbrae, San Bruno,
South San Francisco,
Colma
Multi-use trail or on-street
alternative between Colma
and Millbrae located within
or proximate to BART
right-of-way. Mandated as
part of BART SFIA exten-
sion.
Bike Lanes provided along
Junipero Serra Blvd. from
Daly City to Avalon Drive.
A Class I trail has been
constructed between
South San Francisco and
San Bruno BART
Millbrae completed a
Class I path along Monte-
rey Avenue
3. Ralston Avenue
Bikeway Projects
Belmont,
San Mateo County
Improvements along Ral-
ston Avenue, including
bicycle-pedestrian bridge
over Highway 101 in
Belmont, connections to
Caltrain Station.
Bike lanes constructed
between 6th Avenue and
Villa Avenue in Belmont
Ralston Avenue over-
crossing currently in con-
struction
4. North-South
Bikeway (South-
ern Section)
Menlo Park, Atherton,
San Mateo County,
Redwood City
Signal improvements,
signing, striping for
bicyclists along Middlefield
Road, El Camino Real, 5th
Avenue, and Semicircular
Road through Menlo Park,
Atherton and Redwood
City.
Atherton: Partially
implemented. Bike lanes
on Middlefield Road, Selby
Lane
Redwood City: Partially
implemented, remainder in
progress
Also see North-South
bikeway status
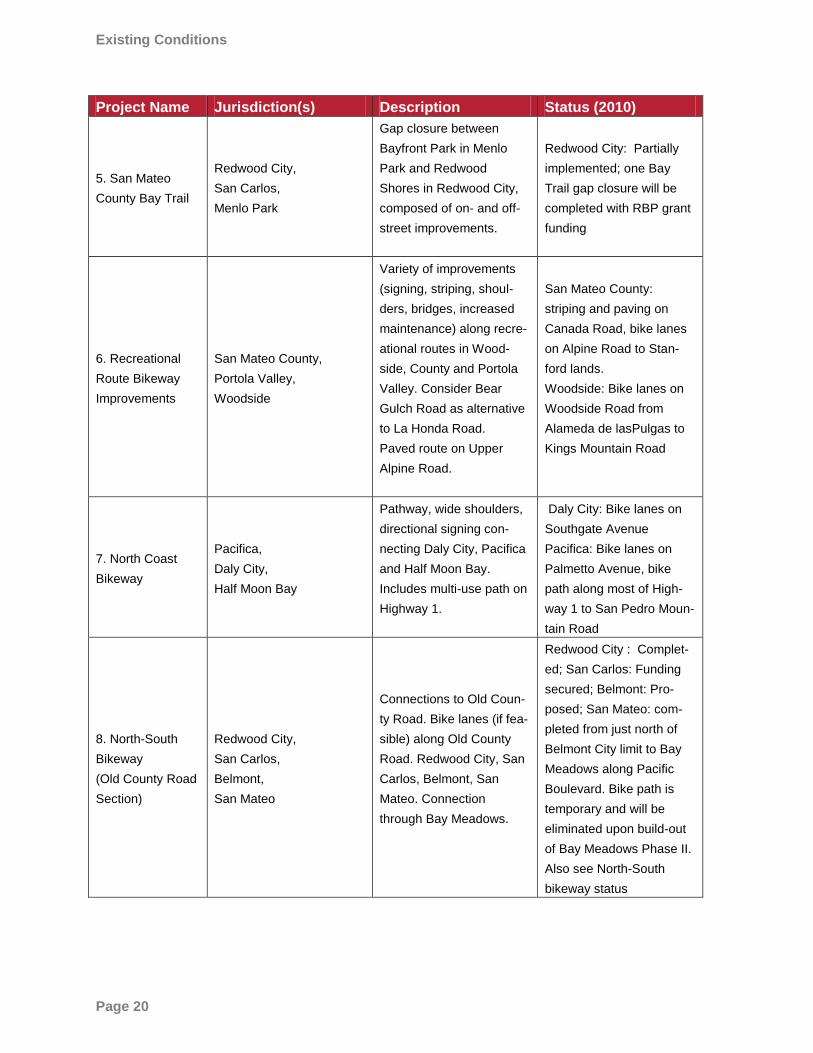
Existing Conditions
City/
Page 20
Project Name Jurisdiction(s) Description Status (2010)
5. San Mateo
County Bay Trail
Redwood City,
San Carlos,
Menlo Park
Gap closure between
Bayfront Park in Menlo
Park and Redwood
Shores in Redwood City,
composed of on- and off-
street improvements.
Redwood City: Partially
implemented; one Bay
Trail gap closure will be
completed with RBP grant
funding
6. Recreational
Route Bikeway
Improvements
San Mateo County,
Portola Valley,
Woodside
Variety of improvements
(signing, striping, shoul-
ders, bridges, increased
maintenance) along recre-
ational routes in Wood-
side, County and Portola
Valley. Consider Bear
Gulch Road as alternative
to La Honda Road.
Paved route on Upper
Alpine Road.
San Mateo County:
striping and paving on
Canada Road, bike lanes
on Alpine Road to Stan-
ford lands.
Woodside: Bike lanes on
Woodside Road from
Alameda de lasPulgas to
Kings Mountain Road
7. North Coast
Bikeway
Pacifica,
Daly City,
Half Moon Bay
Pathway, wide shoulders,
directional signing con-
necting Daly City, Pacifica
and Half Moon Bay.
Includes multi-use path on
Highway 1.
Daly City: Bike lanes on
Southgate Avenue
Pacifica: Bike lanes on
Palmetto Avenue, bike
path along most of High-
way 1 to San Pedro Moun-
tain Road
8. North-South
Bikeway
(Old County Road
Section)
Redwood City,
San Carlos,
Belmont,
San Mateo
Connections to Old Coun-
ty Road. Bike lanes (if fea-
sible) along Old County
Road. Redwood City, San
Carlos, Belmont, San
Mateo. Connection
through Bay Meadows.
Redwood City : Complet-
ed; San Carlos: Funding
secured; Belmont: Pro-
posed; San Mateo: com-
pleted from just north of
Belmont City limit to Bay
Meadows along Pacific
Boulevard. Bike path is
temporary and will be
eliminated upon build-out
of Bay Meadows Phase II.
Also see North-South
bikeway status
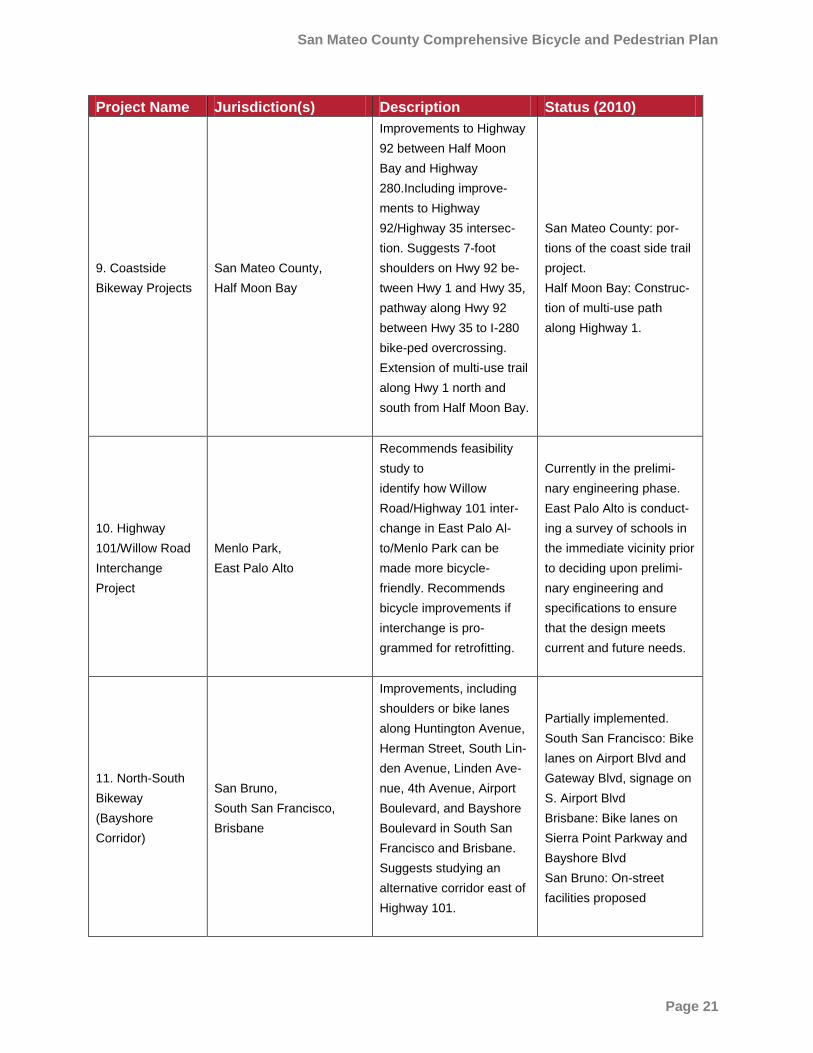
San Mateo County Comprehensive Bicycle and Pedestrian Plan
Page 21
Project Name Jurisdiction(s) Description Status (2010)
9. Coastside
Bikeway Projects
San Mateo County,
Half Moon Bay
Improvements to Highway
92 between Half Moon
Bay and Highway
280.Including improve-
ments to Highway
92/Highway 35 intersec-
tion. Suggests 7-foot
shoulders on Hwy 92 be-
tween Hwy 1 and Hwy 35,
pathway along Hwy 92
between Hwy 35 to I-280
bike-ped overcrossing.
Extension of multi-use trail
along Hwy 1 north and
south from Half Moon Bay.
San Mateo County: por-
tions of the coast side trail
project.
Half Moon Bay: Construc-
tion of multi-use path
along Highway 1.
10. Highway
101/Willow Road
Interchange
Project
Menlo Park,
East Palo Alto
Recommends feasibility
study to
identify how Willow
Road/Highway 101 inter-
change in East Palo Al-
to/Menlo Park can be
made more bicycle-
friendly. Recommends
bicycle improvements if
interchange is pro-
grammed for retrofitting.
Currently in the prelimi-
nary engineering phase.
East Palo Alto is conduct-
ing a survey of schools in
the immediate vicinity prior
to deciding upon prelimi-
nary engineering and
specifications to ensure
that the design meets
current and future needs.
11. North-South
Bikeway
(Bayshore
Corridor)
San Bruno,
South San Francisco,
Brisbane
Improvements, including
shoulders or bike lanes
along Huntington Avenue,
Herman Street, South Lin-
den Avenue, Linden Ave-
nue, 4th Avenue, Airport
Boulevard, and Bayshore
Boulevard in South San
Francisco and Brisbane.
Suggests studying an
alternative corridor east of
Highway 101.
Partially implemented.
South San Francisco: Bike
lanes on Airport Blvd and
Gateway Blvd, signage on
S. Airport Blvd
Brisbane: Bike lanes on
Sierra Point Parkway and
Bayshore Blvd
San Bruno: On-street
facilities proposed
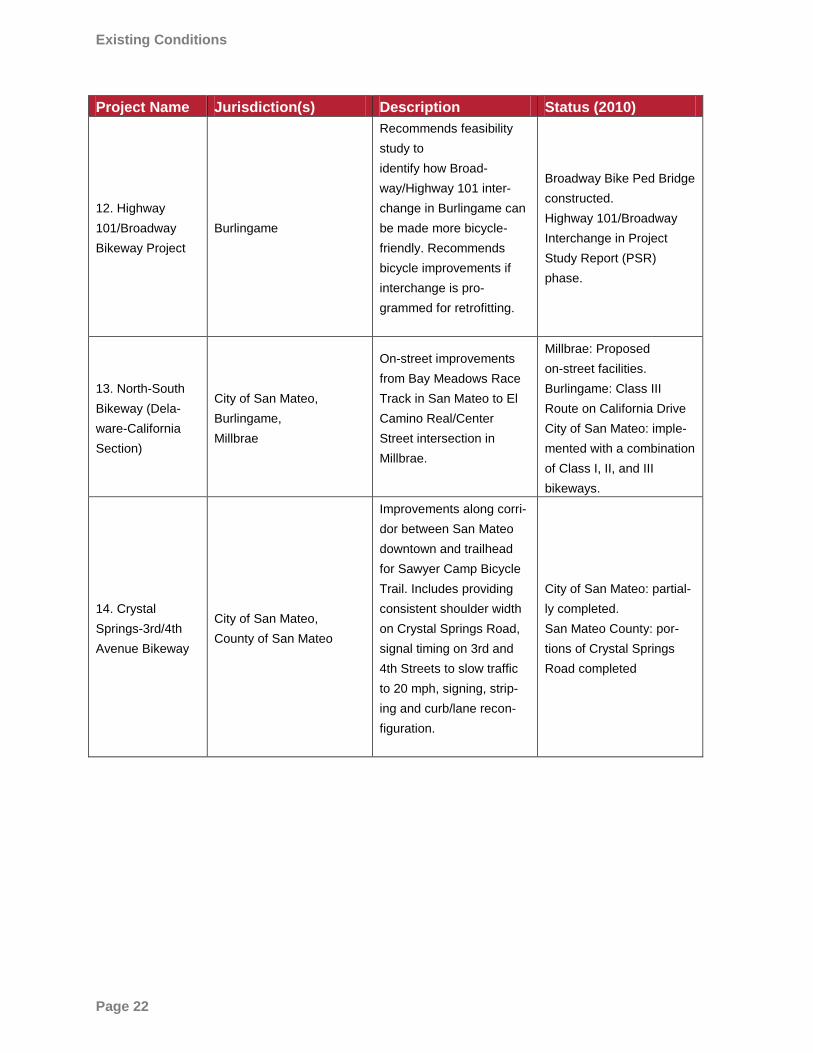
Existing Conditions
City/
Page 22
Project Name Jurisdiction(s) Description Status (2010)
12. Highway
101/Broadway
Bikeway Project
Burlingame
Recommends feasibility
study to
identify how Broad-
way/Highway 101 inter-
change in Burlingame can
be made more bicycle-
friendly. Recommends
bicycle improvements if
interchange is pro-
grammed for retrofitting.
Broadway Bike Ped Bridge
constructed.
Highway 101/Broadway
Interchange in Project
Study Report (PSR)
phase.
13. North-South
Bikeway (Dela-
ware-California
Section)
City of San Mateo,
Burlingame,
Millbrae
On-street improvements
from Bay Meadows Race
Track in San Mateo to El
Camino Real/Center
Street intersection in
Millbrae.
Millbrae: Proposed
on-street facilities.
Burlingame: Class III
Route on California Drive
City of San Mateo: imple-
mented with a combination
of Class I, II, and III
bikeways.
14. Crystal
Springs-3rd/4th
Avenue Bikeway
City of San Mateo,
County of San Mateo
Improvements along corri-
dor between San Mateo
downtown and trailhead
for Sawyer Camp Bicycle
Trail. Includes providing
consistent shoulder width
on Crystal Springs Road,
signal timing on 3rd and
4th Streets to slow traffic
to 20 mph, signing, strip-
ing and curb/lane recon-
figuration.
City of San Mateo: partial-
ly completed.
San Mateo County: por-
tions of Crystal Springs
Road completed
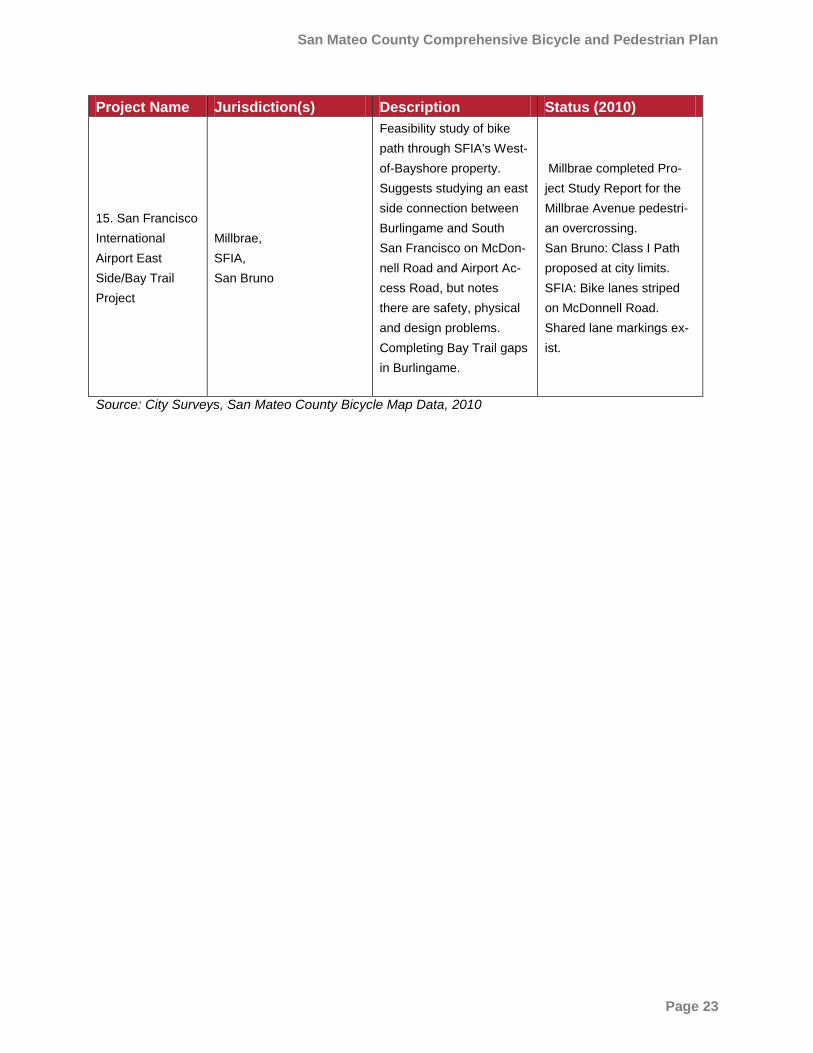
San Mateo County Comprehensive Bicycle and Pedestrian Plan
Page 23
Project Name Jurisdiction(s) Description Status (2010)
15. San Francisco
International
Airport East
Side/Bay Trail
Project
Millbrae,
SFIA,
San Bruno
Feasibility study of bike
path through SFIA's West-
of-Bayshore property.
Suggests studying an east
side connection between
Burlingame and South
San Francisco on McDon-
nell Road and Airport Ac-
cess Road, but notes
there are safety, physical
and design problems.
Completing Bay Trail gaps
in Burlingame.
Millbrae completed Pro-
ject Study Report for the
Millbrae Avenue pedestri-
an overcrossing.
San Bruno: Class I Path
proposed at city limits.
SFIA: Bike lanes striped
on McDonnell Road.
Shared lane markings ex-
ist.
Source: City Surveys, San Mateo County Bicycle Map Data, 2010
Existing Conditions
City/
Page 24
3.4 Existing Pedestrian Conditions
This section begins with a general description of pedestrian infrastructure in the county, discusses population
densities and land uses that are conducive to pedestrian activity, and includes a discussion of the projected
dramatic increase in the aging population in San Mateo County.
3.4.1 Pedestrian Infrastructure
Provisions for pedestrians and the quality of pedestrian infrastructure vary throughout the county. Older
downtowns, particularly those along the 101 corridor, are walkable, with small blocks, narrow roads,
sidewalks on both sides, and vibrant storefronts. Several communities have invested significantly to enhance
the walkability in their downtowns.
Major roadways (such as El Camino Real, Woodside Road, and Highway 1) are wide, have high traffic
volumes and infrequent crossings, and act as pedestrian barriers. Pedestrian amenities along these roadways
are often lacking, and fronting property tends to be auto-oriented. Highway 1 lacks sidewalks or pathways
along most of its length, although pathway segments have been constructed in some coastal communities;
pathways along Highway 1 in Half Moon Bay are well used and highly appreciated by the community. El
Camino Real remains a barrier to pedestrians and, in many cities, separates residential and downtown areas
from the Caltrain stations. Efforts are underway in the county to enhance pedestrian access along and across
El Camino Real as part of the Grand Boulevard Multimodal Transportation Corridor Plan.
The county‘s freeways and rail lines create significant barriers to pedestrian access. Several communities have
constructed roadway overcrossings of these barriers and basic pedestrian access has typically been provided.
Of the 83 roadway crossings of Highways 101, 280, 1, and Caltrain, 80 percent have sidewalks and 59 percent
of all roadway crossings have sidewalks on both sides. See Table 2 for a summary of pedestrian amenities
provided on roadways that cross the county‘s major barriers. Despite these efforts at accommodation, much
more can be done to improve the pedestrian experience, particularly at freeway on- and off-ramps.
The county‘s transit systems are an important part of the pedestrian network. However, the quality and
connectivity of pedestrian access to BART and Caltrain stations varies. Major roadways or the tracks
themselves often act as pedestrian barriers. A handful of communities have constructed pedestrian under- or
overcrossings of the Caltrain tracks or major roadways. These are listed in Table 1. In some cases, these
crossings are well designed and provide direct access to the stations. In other cases, pedestrians sometimes
must travel a distance to the next safe rail crossing.
3.4.2 Employment and Population Densities
Population and employment density significantly influence pedestrian activity. Densities range from 450
persons per square mile to 13,700 persons per square mile (see Figure 4). Population density within the
county is concentrated along El Camino Real, as shown in Figure 6. Some cities are dense, with five cities
(Daly City, East Palo Alto, Foster City, San Mateo and San Bruno) having higher average densities than
Oakland, California. These higher densities provide a significant opportunity for walking within the county.
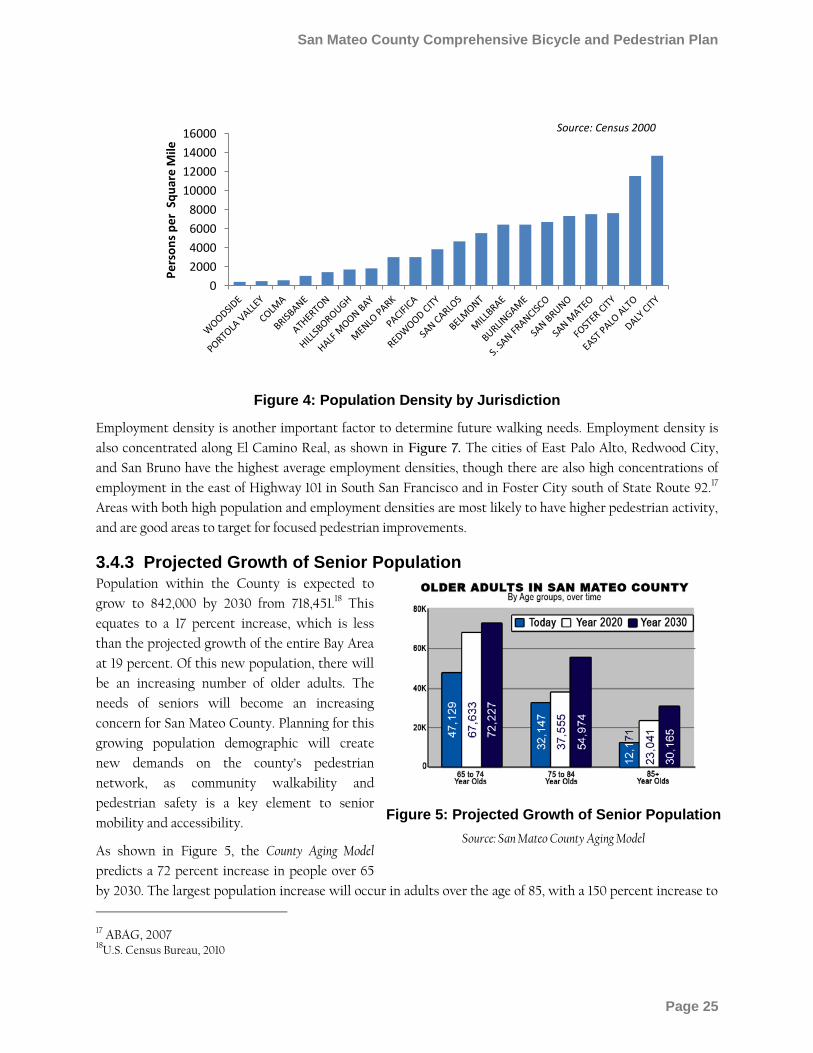
San Mateo County Comprehensive Bicycle and Pedestrian Plan
Page 25
Figure 4: Population Density by Jurisdiction
Employment density is another important factor to determine future walking needs. Employment density is
also concentrated along El Camino Real, as shown in Figure 7. The cities of East Palo Alto, Redwood City,
and San Bruno have the highest average employment densities, though there are also high concentrations of
employment in the east of Highway 101 in South San Francisco and in Foster City south of State Route 92.17
Areas with both high population and employment densities are most likely to have higher pedestrian activity,
and are good areas to target for focused pedestrian improvements.
3.4.3 Projected Growth of Senior Population Population within the County is expected to
grow to 842,000 by 2030 from 718,451.18 This
equates to a 17 percent increase, which is less
than the projected growth of the entire Bay Area
at 19 percent. Of this new population, there will
be an increasing number of older adults. The
needs of seniors will become an increasing
concern for San Mateo County. Planning for this
growing population demographic will create
new demands on the county‘s pedestrian
network, as community walkability and
pedestrian safety is a key element to senior
mobility and accessibility.
As shown in Figure 5, the County Aging Model
predicts a 72 percent increase in people over 65
by 2030. The largest population increase will occur in adults over the age of 85, with a 150 percent increase to
17 ABAG, 2007 18
U.S. Census Bureau, 2010
0
2000
4000
6000
8000
10000
12000
14000
16000
Pe
rso
ns
pe
r S
qu
are
Mile
Source: Census 2000
Figure 5: Projected Growth of Senior Population
Source: San Mateo County Aging Model
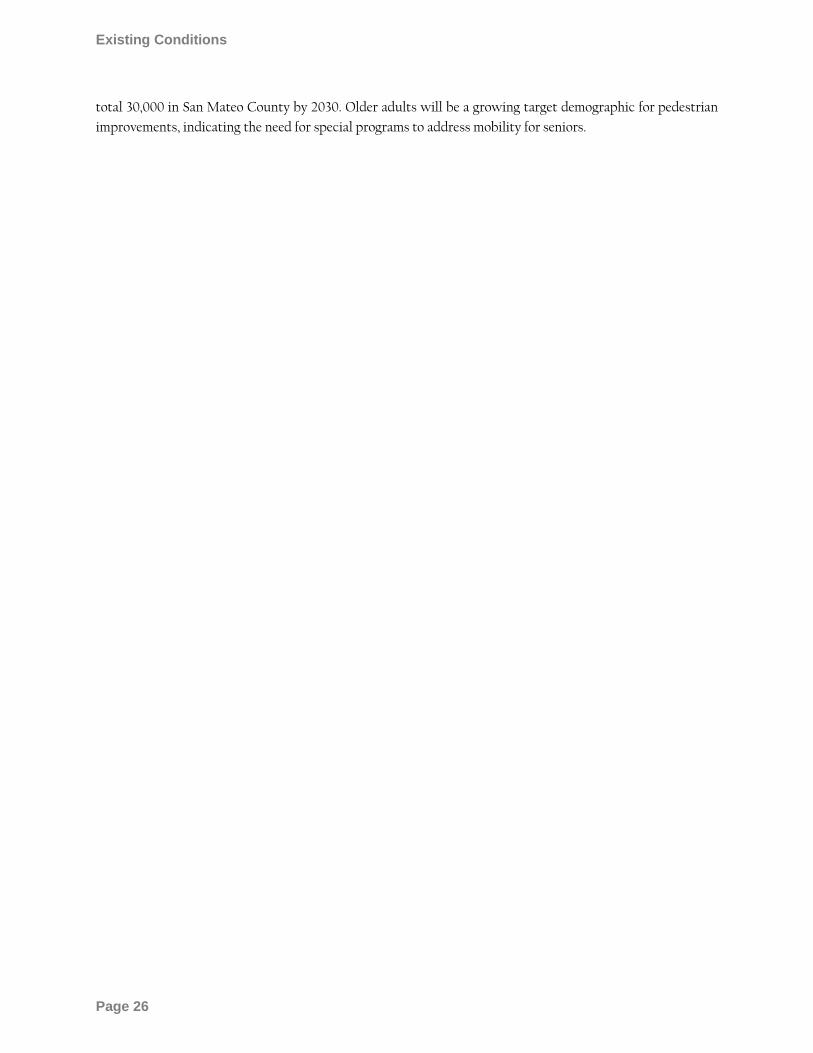
Existing Conditions
City/
Page 26
total 30,000 in San Mateo County by 2030. Older adults will be a growing target demographic for pedestrian
improvements, indicating the need for special programs to address mobility for seniors.
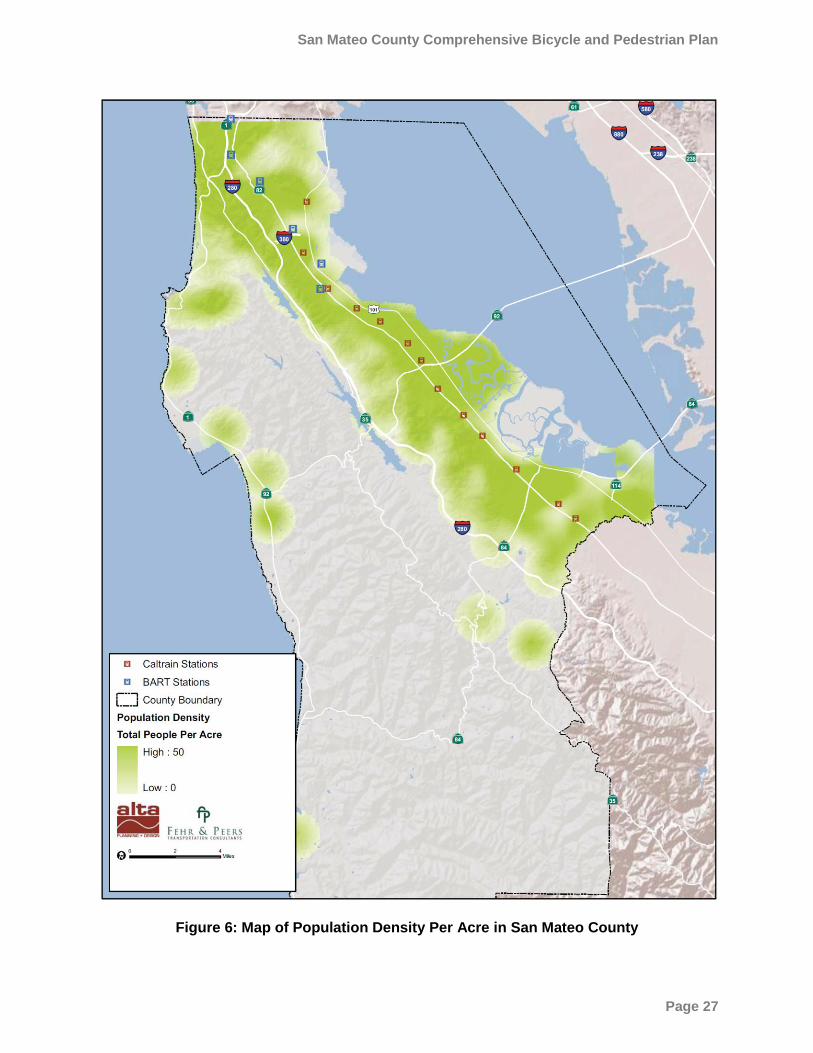
San Mateo County Comprehensive Bicycle and Pedestrian Plan
Page 27
Figure 6: Map of Population Density Per Acre in San Mateo County
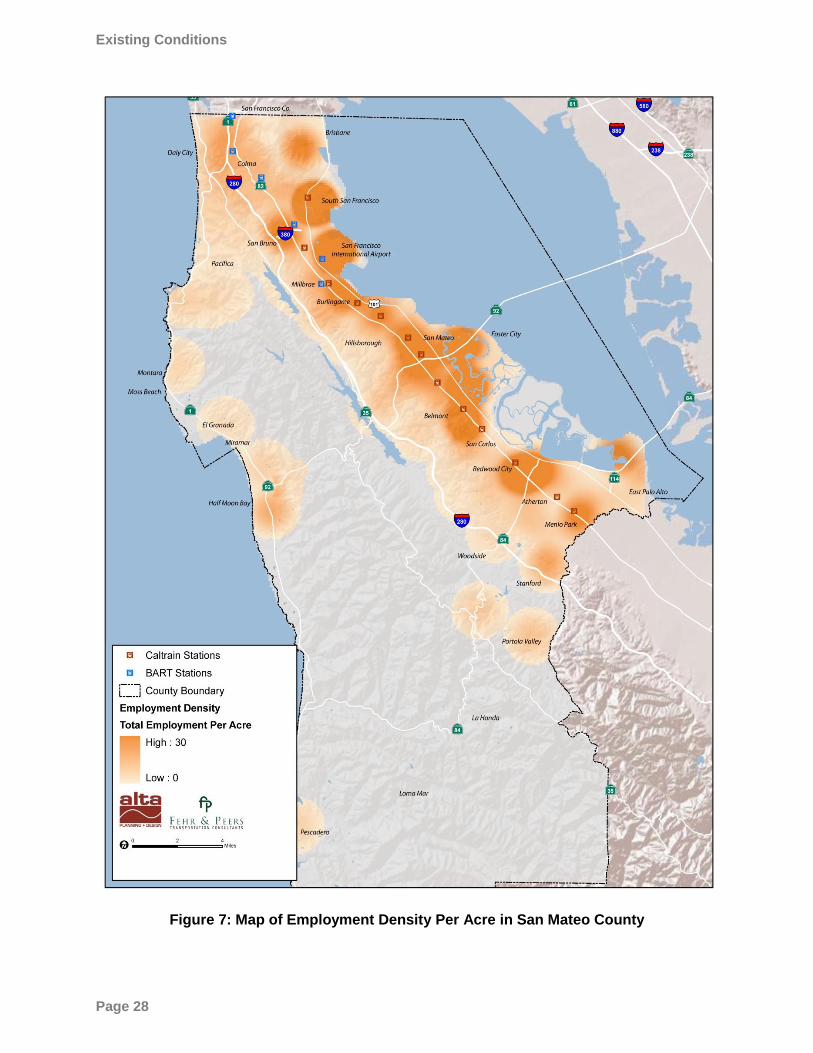
Existing Conditions
City/
Page 28
Figure 7: Map of Employment Density Per Acre in San Mateo County
San Mateo County Comprehensive Bicycle and Pedestrian Plan
Page 29
3.5 Pedestrian and Bicycle Education, Encouragement and Enforcement Programs
Increasingly, public agencies are realizing the importance of providing programs and activities to support and
promote walking and biking. These programs go beyond the typical public agency role of planning, designing,
funding, and constructing bicycle and pedestrian infrastructure. Several local, regional, state and federal fund-
ing sources can be used for program implementation. The CBPP‘s companion document, A Resource Guide for the
Education, Promotion, Funding, and Design of Pedestrian and Bicycle Facilities, describes programs local jurisdictions
may wish to implement.
Several existing programs within San Mateo County complement and support walking and bicycling. These
include, but are not limited to:
Bike to Work Day
Bike to Work Day is an annual Bay Area event in which people are encouraged to leave their car at home for a
day and bicycle to work. Volunteers at Energizer Stations hand out snacks and beverages to commuting bicy-
clists, and companies are encouraged to participate in mileage contests such as the Team Bike Challenge. In
2004, the Metropolitan Transportation Commission (MTC) awarded the Bay Area Bicycle Coalition (BABC)
with a contract to coordinate the regional Bike to Work Day event for the nine counties in the San Francisco
Bay Area. Within San Mateo County, Energizer Stations are coordinated by the Peninsula Traffic Congestion
Relief Alliance in partnership with the Silicon Valley Bicycle Coalition.
Streets Alive San Mateo County
Streets Alive organizes open streets throughout San Mateo County. Open streets are temporary events where
a street is closed to motor vehicle traffic and opened to bicyclists, walkers, joggers, and all other forms of ac-
tive transportation. Often, free entertainment, food, and other activities are provided along the street. Streets
Alive promotes creative use of public spaces to promote social connection and physical activity.
Great Race for Clean Air
The Spare the Air Program was established by the Bay Area Air Quality Management District (BAAQMD) to
educate people about air pollution and to encourage them to change their behavior to improve air quality. As a
Spare the Air program, The Great Race for Clean Air is a competition between employers to encourage em-
ployees to use commute alternatives to driving alone such as ridesharing, carpooling, vanpooling, biking,
walking, or riding transit. The BAAQMD and local Air Quality Resource Team provide participants with in-
formation on commute alternatives and one-on-one support, if requested.
County Employees Commute Alternatives
San Mateo County Commute Alternatives Program (CAP) is dedicated to reducing traffic congestion and as-
sociated air pollution emissions, conserving energy, and improving the quality of life for employees and the
community by offering commute incentives to its employees that promote the use of alternate transportation
modes. CAP features a transit pass; vanpool, carpool, bike, and walk subsidies; a rideshare match service; a
Guaranteed Ride Home Program; carpool-only parking facilities; and a bike locker program.
Regional Rideshare 511 Program
The 511 Regional Rideshare Program is operated by MTC and is funded by grants from the FHWA, U.S. DOT,
MTC, the BAAQMD and county congestion management agencies. The 511 Rideshare program seeks to reduce
traffic congestion and auto emissions by encouraging the use of carpools and vanpools and employer transpor-
Existing Conditions
City/
Page 30
tation demand management programs. Participants may receive tax benefits, free transit passes, discounted
bridge tolls, and cash by carpooling. The San Mateo County CAP is linked with the 511 Ridematch Service and
can assist commuters traveling into or out of San Mateo County.
San Mateo County Safe Routes to School Program
In 2011, C/CAG received funding from MTC to establish a countywide Safe Routes to School Program focus-
ing on education, encouragement, and enforcement strategies to promote walking and bicycling to school. As
of August 2011, the San Mateo County Office of Education was developing the program.
San Mateo County Comprehensive Bicycle and Pedestrian Plan
Page 31
4 Relevant Plans, Policies and Guidelines
The CBPP will build on and support a number of plans, policies and projects of other agencies. These other
planning efforts are being conducted by a variety of public agencies and are occurring not only at the local lev-
el but also at the county, regional, state and federal levels. This section provides an overview of the planning
framework for bicycling and walking in San Mateo County. It summarizes the key planning efforts that will
affect, and in some cases be affected by, implementation of the CBPP.
Appendix D describes the key related state, regional and county plans.
4.1 C/CAG Plans and Policies
Among other functions, C/CAG is the Congestion Management Agency for San Mateo County, and is tasked
with alleviating and managing traffic congestion in the county. Planning for bicyclists and pedestrians is a key
element of this task. Four primary C/CAG plans and policies are relevant to the CPBB.
San Mateo County Comprehensive Bicycle Route Plan (2000)-The CBPP updates this plan and adds a new
pedestrian component.
Countywide Transportation Plan (CTP) (2001)-The overall goal of the CTP is to reduce traffic congestion
in San Mateo County. It contains policies supporting bicycle-transit integration and pedestrian-
supportive land uses.
Congestion Management Plan (CMP) (Being updated currently, 2011)-This plan identifies the CMP
roadway system and sets performance measures (including Level of Service) for the system. Bicycle
and pedestrian projects recommended in the CBPP should consider these performance measures.
Countywide Transportation Plan 2035 (in development) -This update to the 2001 CTP includes draft
vision, goals, objectives and policies for bicycling and walking.
4.2 National, State, Regional, Countywide Plans and Poli-cies
Numerous plans and policies at the national, state, Bay Area and county level guide bicycle and pedestrian
planning.
At the national and state levels, policy statements such as the U.S. Department of Transportation‘s ―Policy
Statement on Bicycle and Pedestrian Accommodation Regulations and Recommendations‖ in March 2010, and
Caltrans 2008 Deputy Directive 64-R1 ―Complete Streets—Integrating the Transportation System,‖ state the
agencies‘ intentions to provide for bicyclists and pedestrians in all transportation facilities. The California
legislature has passed two bills that require government agencies to develop plans for reducing greenhouse gas
emissions, California Global Warming Solutions Act (AB 32) (2006), and California Senate Bill 375 (2008).
Walking and bicycling efforts will be a key component of these plans. The California Legislature also passed
AB 1358 (2007), the ―Complete Streets Act,‖ which requires cities and counties, upon revision of their general
plan, to identify how the jurisdiction will provide for the routine accommodation of all roadway users,
including bicyclists and pedestrians. The Act first took effect in January 2009.
Relevant Plans, Policies and Guidelines
City/
Page 32
At the regional level, the Metropolitan Transportation Commission (MTC) has adopted policies supporting
walking and bicycling, and developed plans and studies that focus on walking, bicycling, and equitable
provision of mobility. Of key importance to the CBPP are MTC‘s Regional Bicycle Plan for the Bay Area (2009),
which identifies regional bikeway connections in the Bay Area, and the agency‘s Regional Policy for the
Accommodation of Non-Motorized Travelers (2006), which requires agencies requesting funding to fill out a
checklist describing how transportation projects accommodate bicyclists and pedestrians. The CBPP‘s
Countywide Bikeway Network includes regionally significant bikeways in San Mateo County identified in the
Regional Bicycle Plan.
Also at the regional level, the Association of Bay Area Governments (ABAG) has planned for and supported
the construction of the Bay Trail within San Mateo County. ABAG‘s plan, The Bay Trail: Planning for a Recreational
Ring around San Francisco Bay (1989), and subsequent San Francisco Bay Trail Gap Analysis (2005) outline plans for a
400-mile loop around the San Francisco Bay. The CBPP includes the San Mateo segments of the Bay Trail as
bikeways of countywide significance.
At the county level, SMCTA‗s Strategic Plan guides the allocation of Measure A funding for numerous
transportation projects through, including bicycle and pedestrian projects. Three percent of Measure A
revenues through 2033 are allocated toward bicycle and pedestrian projects. Caltrain has developed bicycle
access plans and conducted rider surveys that provide information about access modes. San Mateo County’s
Trails Plan, which is being developed by San Mateo County, contains proposed alignments for trails that
inform east-west connections identified in the CBPP. Other San Mateo County planning efforts such as the
Highway 1 Safety and Mobility Improvement Study, and planning documents for the Coastal Trail and the Parallel
Trail inform the CBPP‘s recommendations for portions of Unincorporated County along the Highway 1
corridor.
4.3 Local Plans and Policies
The CBPP seeks to build upon and support local bicycle and planning efforts. In San Mateo County, the
Circulation Element of General Plans most often addresses local bicycle and pedestrian planning. Outside of
General Plans, bicycle and pedestrian planning is also addressed as part of area plans. Of note:
Four cities have bicycle master plans.
There are no cities with pedestrian master plans, but at least two cities are planning to develop
them.19
No cities have a dedicated bicycle and pedestrian coordinator.
Eight of twenty cities have a bicycle or pedestrian advisory committee.
Table 5 lists the bicycle and pedestrian-related planning efforts by the local jurisdictions.
19
Menlo Park has a Sidewalk Master Plan, but this plan primarily provides design guideline, and does not deal with pedestrian mobility and access to destinations.
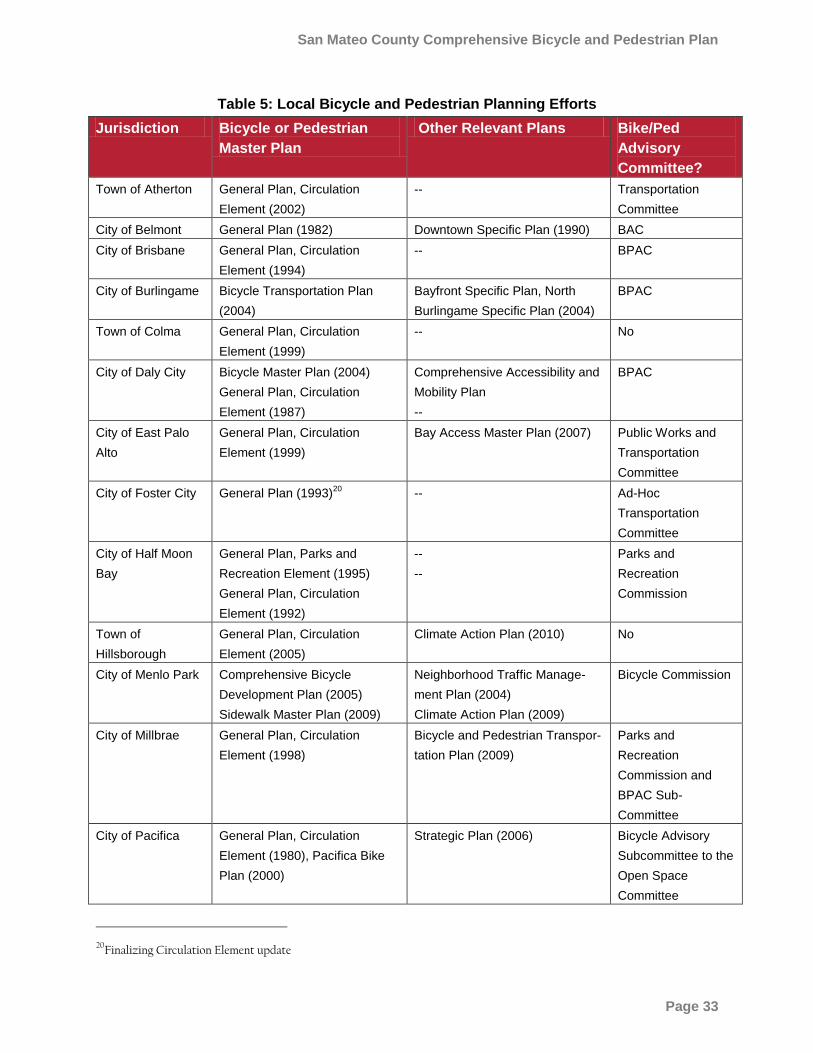
San Mateo County Comprehensive Bicycle and Pedestrian Plan
Page 33
Table 5: Local Bicycle and Pedestrian Planning Efforts
Jurisdiction Bicycle or Pedestrian
Master Plan
Other Relevant Plans Bike/Ped
Advisory
Committee?
Town of Atherton General Plan, Circulation
Element (2002)
-- Transportation
Committee
City of Belmont General Plan (1982) Downtown Specific Plan (1990) BAC
City of Brisbane General Plan, Circulation
Element (1994)
-- BPAC
City of Burlingame Bicycle Transportation Plan
(2004)
Bayfront Specific Plan, North
Burlingame Specific Plan (2004)
BPAC
Town of Colma General Plan, Circulation
Element (1999)
-- No
City of Daly City Bicycle Master Plan (2004)
General Plan, Circulation
Element (1987)
Comprehensive Accessibility and
Mobility Plan
--
BPAC
City of East Palo
Alto
General Plan, Circulation
Element (1999)
Bay Access Master Plan (2007) Public Works and
Transportation
Committee
City of Foster City General Plan (1993)20
-- Ad-Hoc
Transportation
Committee
City of Half Moon
Bay
General Plan, Parks and
Recreation Element (1995)
General Plan, Circulation
Element (1992)
--
--
Parks and
Recreation
Commission
Town of
Hillsborough
General Plan, Circulation
Element (2005)
Climate Action Plan (2010) No
City of Menlo Park Comprehensive Bicycle
Development Plan (2005)
Sidewalk Master Plan (2009)
Neighborhood Traffic Manage-
ment Plan (2004)
Climate Action Plan (2009)
Bicycle Commission
City of Millbrae General Plan, Circulation
Element (1998)
Bicycle and Pedestrian Transpor-
tation Plan (2009)
Parks and
Recreation
Commission and
BPAC Sub-
Committee
City of Pacifica General Plan, Circulation
Element (1980), Pacifica Bike
Plan (2000)
Strategic Plan (2006) Bicycle Advisory
Subcommittee to the
Open Space
Committee
20Finalizing Circulation Element update
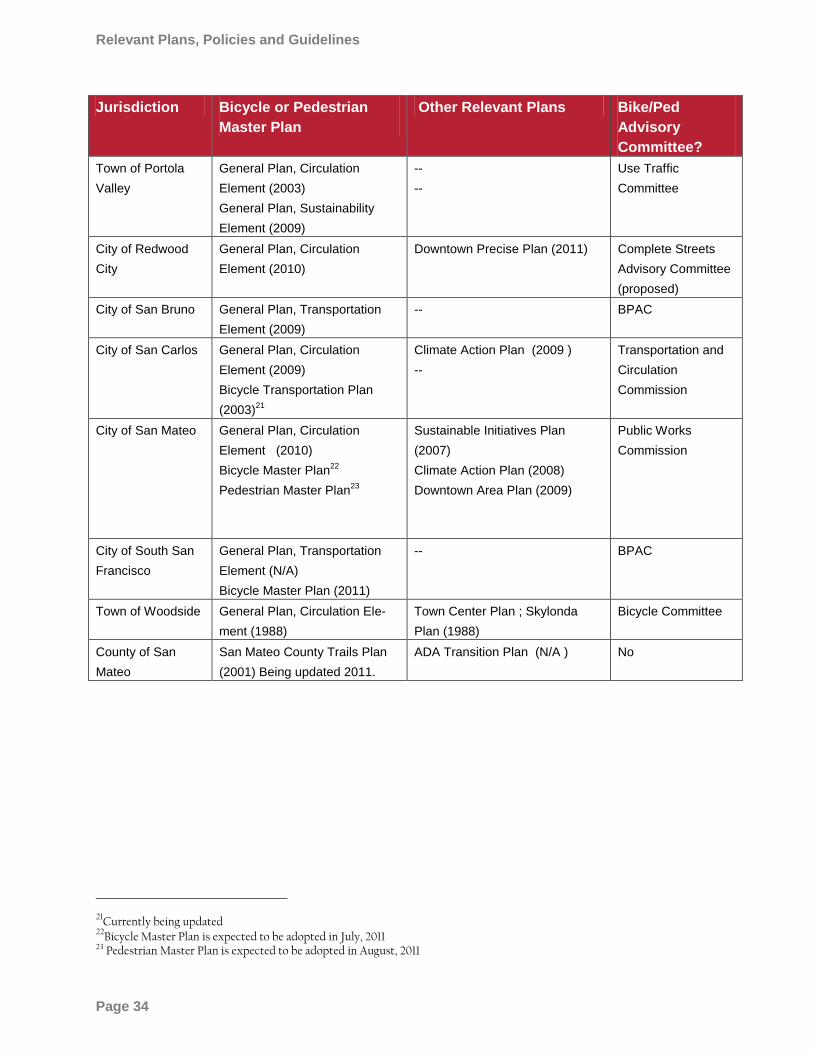
Relevant Plans, Policies and Guidelines
City/
Page 34
Jurisdiction Bicycle or Pedestrian
Master Plan
Other Relevant Plans Bike/Ped
Advisory
Committee?
Town of Portola
Valley
General Plan, Circulation
Element (2003)
General Plan, Sustainability
Element (2009)
--
--
Use Traffic
Committee
City of Redwood
City
General Plan, Circulation
Element (2010)
Downtown Precise Plan (2011) Complete Streets
Advisory Committee
(proposed)
City of San Bruno General Plan, Transportation
Element (2009)
-- BPAC
City of San Carlos General Plan, Circulation
Element (2009)
Bicycle Transportation Plan
(2003)21
Climate Action Plan (2009 )
--
Transportation and
Circulation
Commission
City of San Mateo General Plan, Circulation
Element (2010)
Bicycle Master Plan22
Pedestrian Master Plan23
Sustainable Initiatives Plan
(2007)
Climate Action Plan (2008)
Downtown Area Plan (2009)
Public Works
Commission
City of South San
Francisco
General Plan, Transportation
Element (N/A)
Bicycle Master Plan (2011)
-- BPAC
Town of Woodside General Plan, Circulation Ele-
ment (1988)
Town Center Plan ; Skylonda
Plan (1988)
Bicycle Committee
County of San
Mateo
San Mateo County Trails Plan
(2001) Being updated 2011.
ADA Transition Plan (N/A )
No
21Currently being updated
22Bicycle Master Plan is expected to be adopted in July, 2011
23 Pedestrian Master Plan is expected to be adopted in August, 2011
San Mateo County Comprehensive Bicycle and Pedestrian Plan
Page 35
5 Needs Analysis
This chapter discusses the general needs and preferences of bicyclists and pedestrians, analyzes bicyclist and
pedestrian collision patterns in San Mateo County, and identifies land use and population trends within and
surrounding the county. The purpose of this analysis is to understand and assess the needs of bicyclists and
pedestrians and identify how the CBPP will meet those needs.
5.1 Bicyclists’ General Needs and Preferences The CBPP addresses the needs of all bicyclists. It is important to understand the range in bicyclists‘ skill levels
in order to develop a successful plan. The skill level of the bicyclist greatly influences travel speeds and
behavior. Understanding the behavioral characteristics and transportation infrastructure preferences of
different bicyclists is an important part of the planning process. Bicycle infrastructure should accommodate as
many user types as possible, and provide a comfortable experience for the greatest number of bicyclists.
Survey data and anecdotal evidence support four categories to address the population‘s varying attitudes
towards biycling:
Strong and Fearless (Less than 2 percent). These bicyclists typically ride anywhere on any roadway
regardless of roadway conditions or weather. They can ride faster than other user types, prefer direct
routes and will typically choose on-street facilities – even if shared with vehicles – over separate
bicycle facilities such as bicycle paths. Less than two percent of the population can be categorized as
‗Strong and Fearless‘ bicyclists.
Enthused & Confident (13 percent). These bicyclists are confident and comfortable riding on all
types of bicycle facilities but will usually prefer low traffic streets or multi-use pathways when
available. They may deviate from a more direct route in favor of a preferred facility type. This group
includes all kinds of bicyclists including commuters, recreationalists, racers, and utilitarian bicyclists.
Approximately 13 percent of the population fall under the category of ‗Enthused & Confident‘
bicyclists.
Interested but Concerned (60 percent). These bicyclists do not ride a bicycle regularly. They
typically only ride a bicycle on low traffic streets or bicycle paths under favorable conditions and
weather. They perceive traffic and safety as significant barriers to increased use of bicycling. These
bicyclists may ride more regularly with encouragement, education and experience. Approximately 60
percent of the population can be categorized as ‗interested in cycling but concerned about safety.‘
No Way No How (25 percent). Approximately 25 percent of the population are not bicyclists, and
perceive severe safety issues with riding in traffic. A significant portion of these people will never ride a
bicycle under any circumstance.
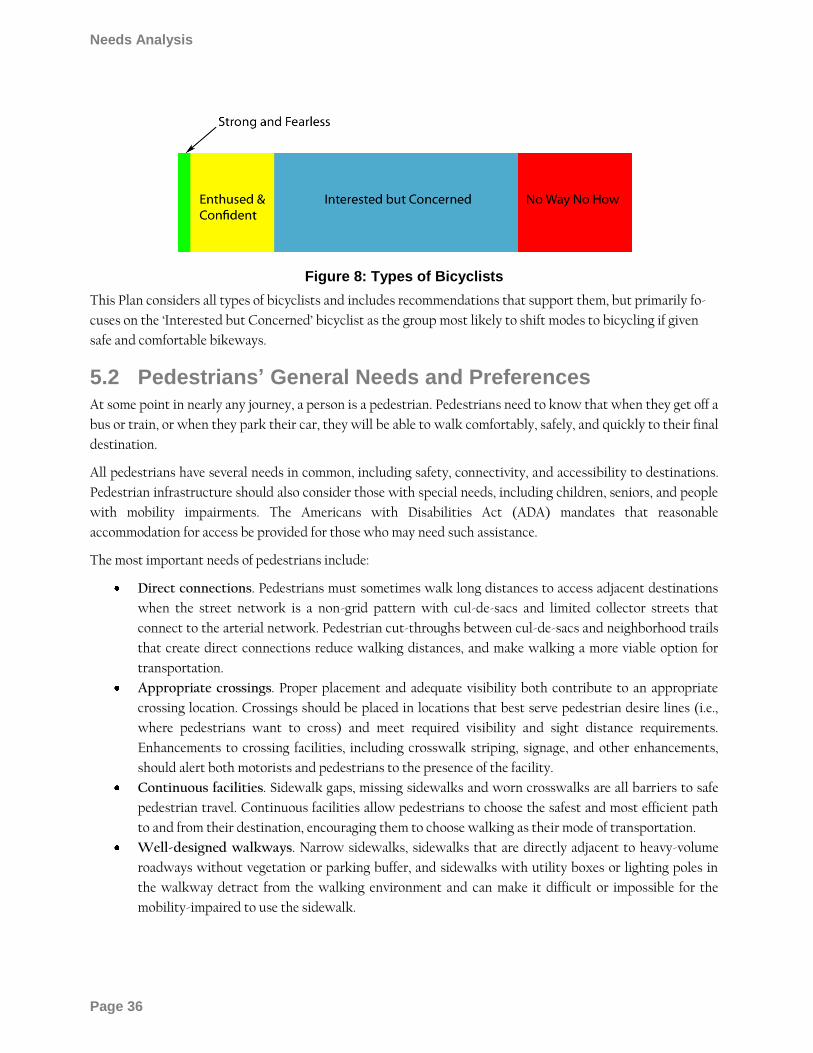
Needs Analysis
City/
Page 36
Figure 8: Types of Bicyclists
This Plan considers all types of bicyclists and includes recommendations that support them, but primarily fo-
cuses on the ‗Interested but Concerned‘ bicyclist as the group most likely to shift modes to bicycling if given
safe and comfortable bikeways.
5.2 Pedestrians’ General Needs and Preferences At some point in nearly any journey, a person is a pedestrian. Pedestrians need to know that when they get off a
bus or train, or when they park their car, they will be able to walk comfortably, safely, and quickly to their final
destination.
All pedestrians have several needs in common, including safety, connectivity, and accessibility to destinations.
Pedestrian infrastructure should also consider those with special needs, including children, seniors, and people
with mobility impairments. The Americans with Disabilities Act (ADA) mandates that reasonable
accommodation for access be provided for those who may need such assistance.
The most important needs of pedestrians include:
Direct connections. Pedestrians must sometimes walk long distances to access adjacent destinations
when the street network is a non-grid pattern with cul-de-sacs and limited collector streets that
connect to the arterial network. Pedestrian cut-throughs between cul-de-sacs and neighborhood trails
that create direct connections reduce walking distances, and make walking a more viable option for
transportation.
Appropriate crossings. Proper placement and adequate visibility both contribute to an appropriate
crossing location. Crossings should be placed in locations that best serve pedestrian desire lines (i.e.,
where pedestrians want to cross) and meet required visibility and sight distance requirements.
Enhancements to crossing facilities, including crosswalk striping, signage, and other enhancements,
should alert both motorists and pedestrians to the presence of the facility.
Continuous facilities. Sidewalk gaps, missing sidewalks and worn crosswalks are all barriers to safe
pedestrian travel. Continuous facilities allow pedestrians to choose the safest and most efficient path
to and from their destination, encouraging them to choose walking as their mode of transportation.
Well-designed walkways. Narrow sidewalks, sidewalks that are directly adjacent to heavy-volume
roadways without vegetation or parking buffer, and sidewalks with utility boxes or lighting poles in
the walkway detract from the walking environment and can make it difficult or impossible for the
mobility-impaired to use the sidewalk.
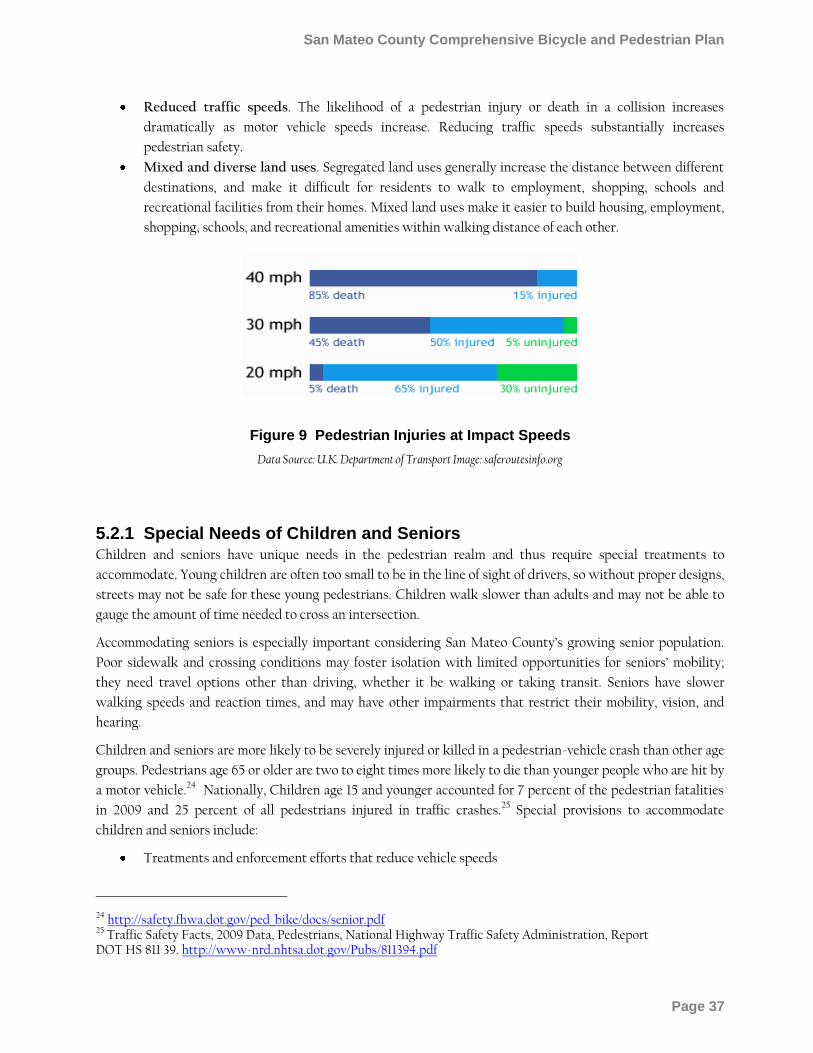
San Mateo County Comprehensive Bicycle and Pedestrian Plan
Page 37
Reduced traffic speeds. The likelihood of a pedestrian injury or death in a collision increases
dramatically as motor vehicle speeds increase. Reducing traffic speeds substantially increases
pedestrian safety.
Mixed and diverse land uses. Segregated land uses generally increase the distance between different
destinations, and make it difficult for residents to walk to employment, shopping, schools and
recreational facilities from their homes. Mixed land uses make it easier to build housing, employment,
shopping, schools, and recreational amenities within walking distance of each other.
Figure 9 Pedestrian Injuries at Impact Speeds
Data Source: U.K. Department of Transport Image: saferoutesinfo.org
5.2.1 Special Needs of Children and Seniors Children and seniors have unique needs in the pedestrian realm and thus require special treatments to
accommodate. Young children are often too small to be in the line of sight of drivers, so without proper designs,
streets may not be safe for these young pedestrians. Children walk slower than adults and may not be able to
gauge the amount of time needed to cross an intersection.
Accommodating seniors is especially important considering San Mateo County‘s growing senior population.
Poor sidewalk and crossing conditions may foster isolation with limited opportunities for seniors‘ mobility;
they need travel options other than driving, whether it be walking or taking transit. Seniors have slower
walking speeds and reaction times, and may have other impairments that restrict their mobility, vision, and
hearing.
Children and seniors are more likely to be severely injured or killed in a pedestrian-vehicle crash than other age
groups. Pedestrians age 65 or older are two to eight times more likely to die than younger people who are hit by
a motor vehicle.24 Nationally, Children age 15 and younger accounted for 7 percent of the pedestrian fatalities
in 2009 and 25 percent of all pedestrians injured in traffic crashes.25 Special provisions to accommodate
children and seniors include:
Treatments and enforcement efforts that reduce vehicle speeds
24 http://safety.fhwa.dot.gov/ped_bike/docs/senior.pdf 25 Traffic Safety Facts, 2009 Data, Pedestrians, National Highway Traffic Safety Administration, Report DOT HS 811 39. http://www-nrd.nhtsa.dot.gov/Pubs/811394.pdf
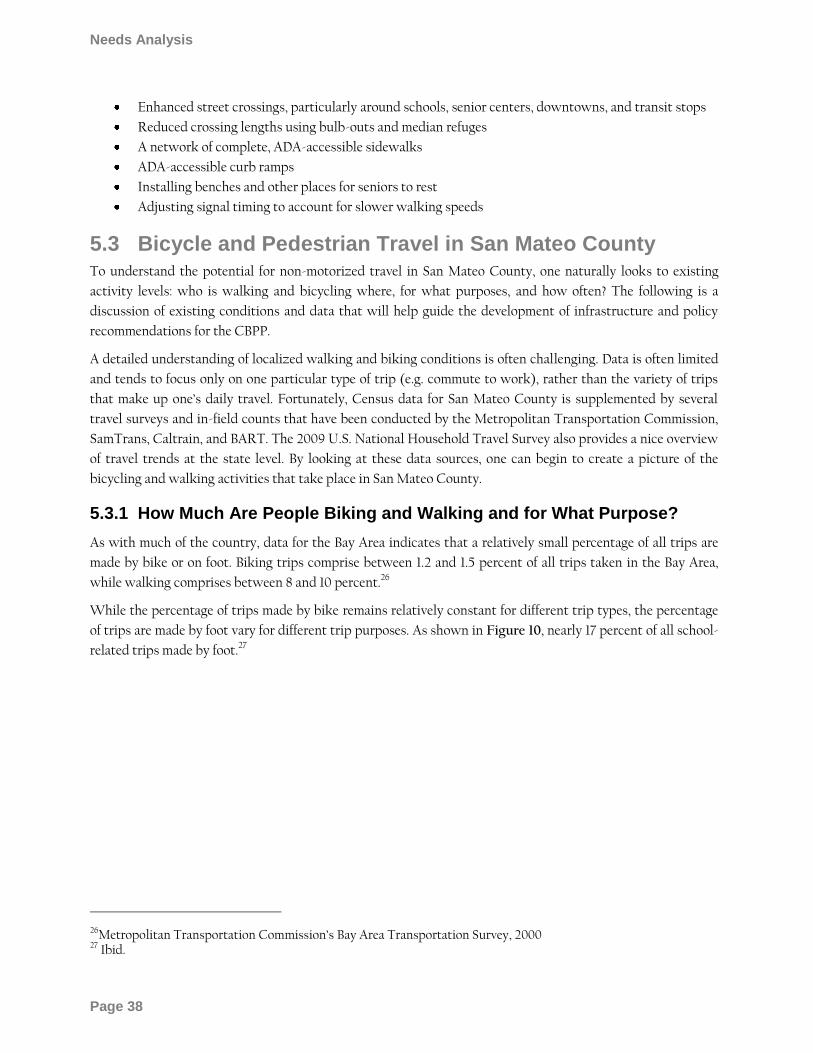
Needs Analysis
City/
Page 38
Enhanced street crossings, particularly around schools, senior centers, downtowns, and transit stops
Reduced crossing lengths using bulb-outs and median refuges
A network of complete, ADA-accessible sidewalks
ADA-accessible curb ramps
Installing benches and other places for seniors to rest
Adjusting signal timing to account for slower walking speeds
5.3 Bicycle and Pedestrian Travel in San Mateo County To understand the potential for non-motorized travel in San Mateo County, one naturally looks to existing
activity levels: who is walking and bicycling where, for what purposes, and how often? The following is a
discussion of existing conditions and data that will help guide the development of infrastructure and policy
recommendations for the CBPP.
A detailed understanding of localized walking and biking conditions is often challenging. Data is often limited
and tends to focus only on one particular type of trip (e.g. commute to work), rather than the variety of trips
that make up one‘s daily travel. Fortunately, Census data for San Mateo County is supplemented by several
travel surveys and in-field counts that have been conducted by the Metropolitan Transportation Commission,
SamTrans, Caltrain, and BART. The 2009 U.S. National Household Travel Survey also provides a nice overview
of travel trends at the state level. By looking at these data sources, one can begin to create a picture of the
bicycling and walking activities that take place in San Mateo County.
5.3.1 How Much Are People Biking and Walking and for What Purpose?
As with much of the country, data for the Bay Area indicates that a relatively small percentage of all trips are
made by bike or on foot. Biking trips comprise between 1.2 and 1.5 percent of all trips taken in the Bay Area,
while walking comprises between 8 and 10 percent.26
While the percentage of trips made by bike remains relatively constant for different trip types, the percentage
of trips are made by foot vary for different trip purposes. As shown in Figure 10, nearly 17 percent of all school-
related trips made by foot.27
26Metropolitan Transportation Commission‘s Bay Area Transportation Survey, 2000 27 Ibid.
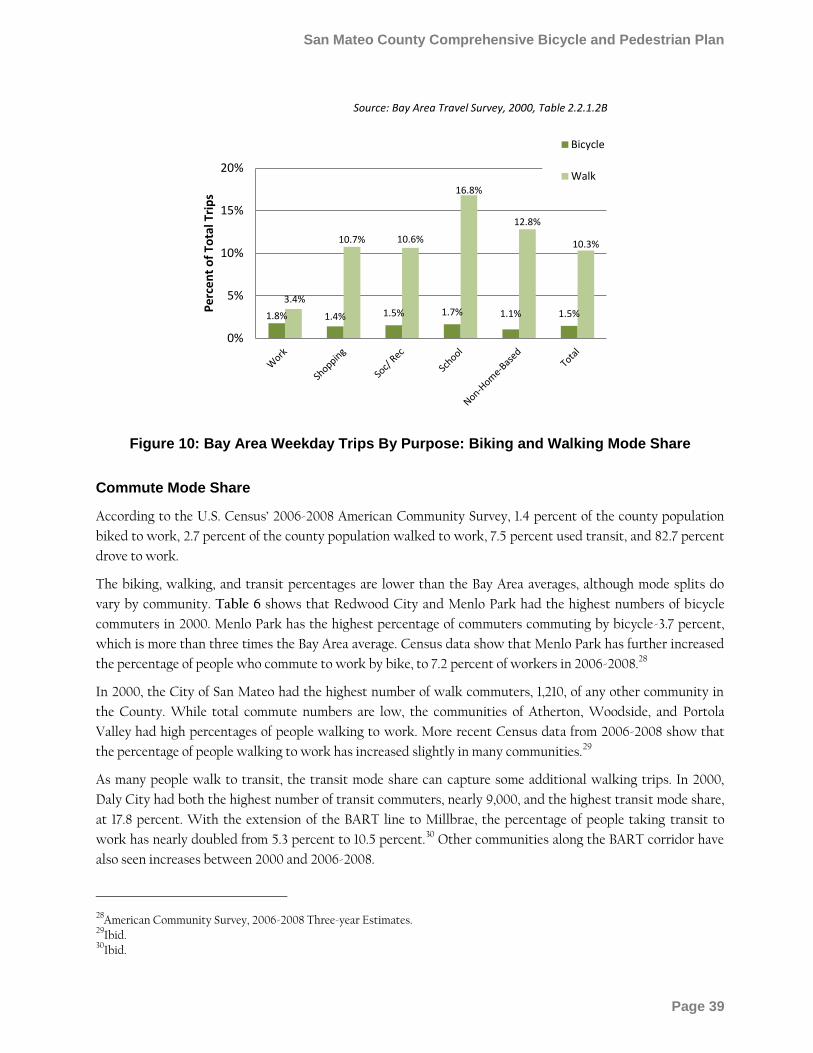
San Mateo County Comprehensive Bicycle and Pedestrian Plan
Page 39
Figure 10: Bay Area Weekday Trips By Purpose: Biking and Walking Mode Share
Commute Mode Share
According to the U.S. Census‘ 2006-2008 American Community Survey, 1.4 percent of the county population
biked to work, 2.7 percent of the county population walked to work, 7.5 percent used transit, and 82.7 percent
drove to work.
The biking, walking, and transit percentages are lower than the Bay Area averages, although mode splits do
vary by community. Table 6 shows that Redwood City and Menlo Park had the highest numbers of bicycle
commuters in 2000. Menlo Park has the highest percentage of commuters commuting by bicycle-3.7 percent,
which is more than three times the Bay Area average. Census data show that Menlo Park has further increased
the percentage of people who commute to work by bike, to 7.2 percent of workers in 2006-2008.28
In 2000, the City of San Mateo had the highest number of walk commuters, 1,210, of any other community in
the County. While total commute numbers are low, the communities of Atherton, Woodside, and Portola
Valley had high percentages of people walking to work. More recent Census data from 2006-2008 show that
the percentage of people walking to work has increased slightly in many communities.29
As many people walk to transit, the transit mode share can capture some additional walking trips. In 2000,
Daly City had both the highest number of transit commuters, nearly 9,000, and the highest transit mode share,
at 17.8 percent. With the extension of the BART line to Millbrae, the percentage of people taking transit to
work has nearly doubled from 5.3 percent to 10.5 percent.30 Other communities along the BART corridor have
also seen increases between 2000 and 2006-2008.
28
American Community Survey, 2006-2008 Three-year Estimates. 29
Ibid. 30
Ibid.
1.8% 1.4% 1.5% 1.7% 1.1% 1.5%
3.4%
10.7% 10.6%
16.8%
12.8%
10.3%
0%
5%
10%
15%
20%
Pe
rce
nt
of
Tota
l Tri
ps
Bicycle
Walk
Source: Bay Area Travel Survey, 2000, Table 2.2.1.2B
Needs Analysis
City/
Page 40
Table 6: Commute to Work Data by Mode of Transportation for Walk, Bike, Transit
(2000 Census)
Jurisdiction Bike Walk Transit
Percent Number Percent Number Percent Number
Atherton 0.0% 0 5.4% 167 3.2% 100
Belmont 0.4% 49 1.4% 190 3.8% 527
Brisbane 0.5% 10 2.1% 44 5.6% 117
Burlingame 0.7% 108 2.4% 360 7.6% 1,157
Colma 0.0% 0 4.4% 22 10.8% 54
Daly City 0.1% 39 1.3% 664 17.8% 8,858
East Palo Alto 1.8% 193 1.6% 171 6.2% 688
Foster City 0.7% 106 1.3% 201 3.6% 568
Half Moon Bay 1.5% 89 3.1% 184 1.6% 96
Hillsborough 0.0% 0 1.1% 52 2.4% 112
Menlo Park 3.7% 562 2.2% 338 4.0% 614
Millbrae 0.5% 45 2.0% 188 5.3% 502
Pacifica 0.2% 50 1.0% 206 8.1% 1,684
Portola Valley 0.0% 0 3.5% 69 0.0% -
Redwood City 1.8% 697 2.8% 1,097 4.8% 1,899
San Bruno 0.5% 112 2.2% 457 7.9% 1,656
San Carlos 0.6% 86 1.4% 215 3.7% 557
San Mateo (City) 0.6% 275 2.6% 1,210 6.2% 2,931
South San Francisco 0.4% 118 2.6% 752 9.2% 2,680
Woodside 0.0% 0 4.8% 116 0.3% 7
Unincorporated County 1.2% 259 3.1% 653 4.8% 1,000
County 0.8% 2,896 2.1% 7,609 7.4% 26,029
Bay Area 1.1% 3.2% 9.7%
5.3.2 Who is Biking and Walking in San Mateo County?
Data show that people who bike and walk for transportation tend to be younger and less affluent than the
general population.
Age
In the Bay Area, school-age youth and people in their twenties are more likely to bike, than other age groups
although bicycle trips still make up a very small percentage of total trips for these age groups (see Figure 11).
Similarly, school-aged youth typically walk more than other age groups, with nearly 16 percent of trips made on
foot.31Although people in their forties tend to walk the least, the percentage of walking trips increases as one
gets older.
31Metropolitan Transportation Commission‘s Bay Area Transportation Survey, 2000
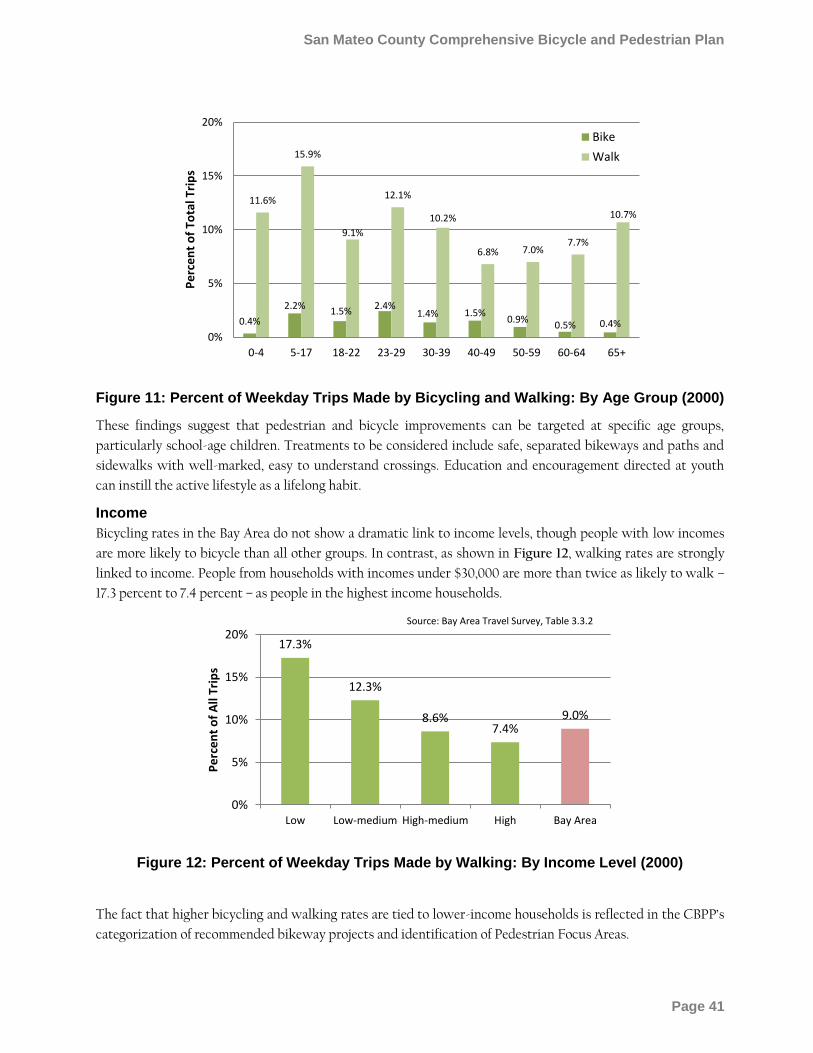
San Mateo County Comprehensive Bicycle and Pedestrian Plan
Page 41
Figure 11: Percent of Weekday Trips Made by Bicycling and Walking: By Age Group (2000)
These findings suggest that pedestrian and bicycle improvements can be targeted at specific age groups,
particularly school-age children. Treatments to be considered include safe, separated bikeways and paths and
sidewalks with well-marked, easy to understand crossings. Education and encouragement directed at youth
can instill the active lifestyle as a lifelong habit.
Income
Bicycling rates in the Bay Area do not show a dramatic link to income levels, though people with low incomes
are more likely to bicycle than all other groups. In contrast, as shown in Figure 12, walking rates are strongly
linked to income. People from households with incomes under $30,000 are more than twice as likely to walk –
17.3 percent to 7.4 percent – as people in the highest income households.
Figure 12: Percent of Weekday Trips Made by Walking: By Income Level (2000)
The fact that higher bicycling and walking rates are tied to lower-income households is reflected in the CBPP‘s
categorization of recommended bikeway projects and identification of Pedestrian Focus Areas.
0.4%
2.2% 1.5%
2.4% 1.4% 1.5%
0.9% 0.5% 0.4%
11.6%
15.9%
9.1%
12.1%
10.2%
6.8% 7.0% 7.7%
10.7%
0%
5%
10%
15%
20%
0-4 5-17 18-22 23-29 30-39 40-49 50-59 60-64 65+
Pe
rce
nt
of
Tota
l Tri
ps
Bike
Walk
17.3%
12.3%
8.6% 7.4%
9.0%
0%
5%
10%
15%
20%
Low Low-medium High-medium High Bay Area
Pe
rce
nt
of
All
Trip
s
Source: Bay Area Travel Survey, Table 3.3.2
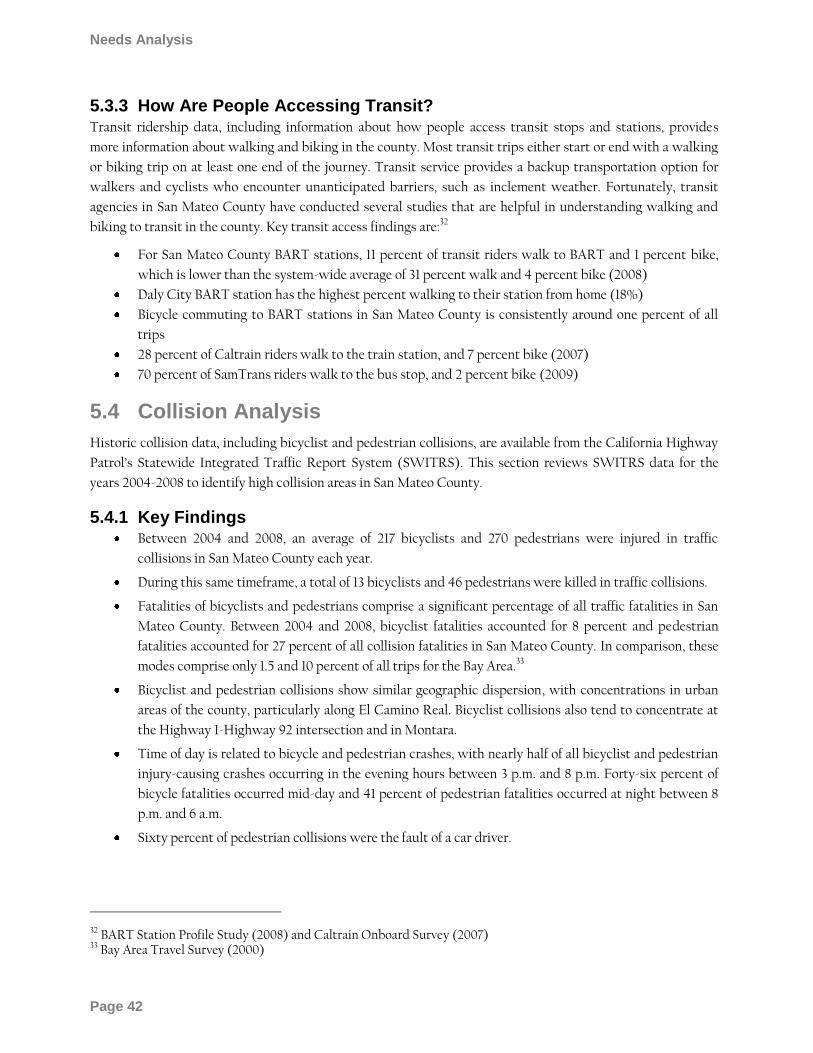
Needs Analysis
City/
Page 42
5.3.3 How Are People Accessing Transit? Transit ridership data, including information about how people access transit stops and stations, provides
more information about walking and biking in the county. Most transit trips either start or end with a walking
or biking trip on at least one end of the journey. Transit service provides a backup transportation option for
walkers and cyclists who encounter unanticipated barriers, such as inclement weather. Fortunately, transit
agencies in San Mateo County have conducted several studies that are helpful in understanding walking and
biking to transit in the county. Key transit access findings are:32
For San Mateo County BART stations, 11 percent of transit riders walk to BART and 1 percent bike,
which is lower than the system-wide average of 31 percent walk and 4 percent bike (2008)
Daly City BART station has the highest percent walking to their station from home (18%)
Bicycle commuting to BART stations in San Mateo County is consistently around one percent of all
trips
28 percent of Caltrain riders walk to the train station, and 7 percent bike (2007)
70 percent of SamTrans riders walk to the bus stop, and 2 percent bike (2009)
5.4 Collision Analysis
Historic collision data, including bicyclist and pedestrian collisions, are available from the California Highway
Patrol‘s Statewide Integrated Traffic Report System (SWITRS). This section reviews SWITRS data for the
years 2004-2008 to identify high collision areas in San Mateo County.
5.4.1 Key Findings Between 2004 and 2008, an average of 217 bicyclists and 270 pedestrians were injured in traffic
collisions in San Mateo County each year.
During this same timeframe, a total of 13 bicyclists and 46 pedestrians were killed in traffic collisions.
Fatalities of bicyclists and pedestrians comprise a significant percentage of all traffic fatalities in San
Mateo County. Between 2004 and 2008, bicyclist fatalities accounted for 8 percent and pedestrian
fatalities accounted for 27 percent of all collision fatalities in San Mateo County. In comparison, these
modes comprise only 1.5 and 10 percent of all trips for the Bay Area.33
Bicyclist and pedestrian collisions show similar geographic dispersion, with concentrations in urban
areas of the county, particularly along El Camino Real. Bicyclist collisions also tend to concentrate at
the Highway 1-Highway 92 intersection and in Montara.
Time of day is related to bicycle and pedestrian crashes, with nearly half of all bicyclist and pedestrian
injury-causing crashes occurring in the evening hours between 3 p.m. and 8 p.m. Forty-six percent of
bicycle fatalities occurred mid-day and 41 percent of pedestrian fatalities occurred at night between 8
p.m. and 6 a.m.
Sixty percent of pedestrian collisions were the fault of a car driver.
32 BART Station Profile Study (2008) and Caltrain Onboard Survey (2007) 33 Bay Area Travel Survey (2000)
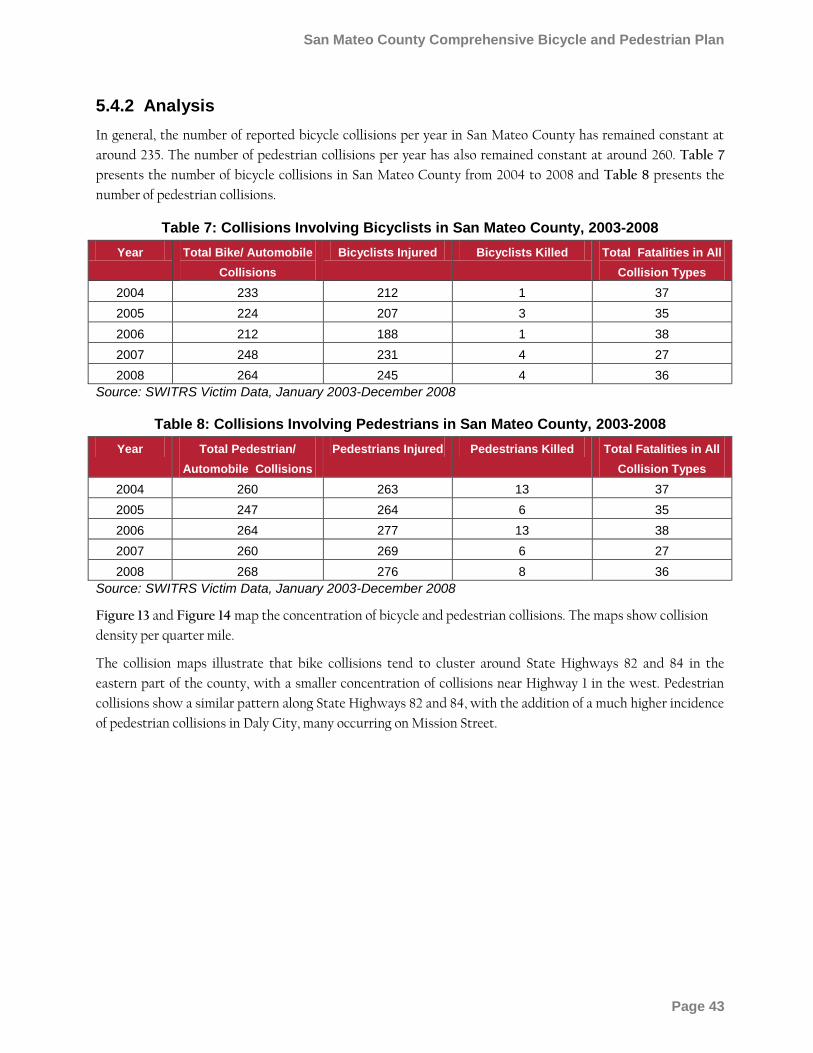
San Mateo County Comprehensive Bicycle and Pedestrian Plan
Page 43
5.4.2 Analysis
In general, the number of reported bicycle collisions per year in San Mateo County has remained constant at
around 235. The number of pedestrian collisions per year has also remained constant at around 260. Table 7
presents the number of bicycle collisions in San Mateo County from 2004 to 2008 and Table 8 presents the
number of pedestrian collisions.
Table 7: Collisions Involving Bicyclists in San Mateo County, 2003-2008
Year Total Bike/ Automobile
Collisions
Bicyclists Injured Bicyclists Killed Total Fatalities in All
Collision Types
2004 233 212 1 37
2005 224 207 3 35
2006 212 188 1 38
2007 248 231 4 27
2008 264 245 4 36
Source: SWITRS Victim Data, January 2003-December 2008
Table 8: Collisions Involving Pedestrians in San Mateo County, 2003-2008
Year Total Pedestrian/
Automobile Collisions
Pedestrians Injured Pedestrians Killed Total Fatalities in All
Collision Types
2004 260 263 13 37
2005 247 264 6 35
2006 264 277 13 38
2007 260 269 6 27
2008 268 276 8 36
Source: SWITRS Victim Data, January 2003-December 2008
Figure 13 and Figure 14 map the concentration of bicycle and pedestrian collisions. The maps show collision
density per quarter mile.
The collision maps illustrate that bike collisions tend to cluster around State Highways 82 and 84 in the
eastern part of the county, with a smaller concentration of collisions near Highway 1 in the west. Pedestrian
collisions show a similar pattern along State Highways 82 and 84, with the addition of a much higher incidence
of pedestrian collisions in Daly City, many occurring on Mission Street.
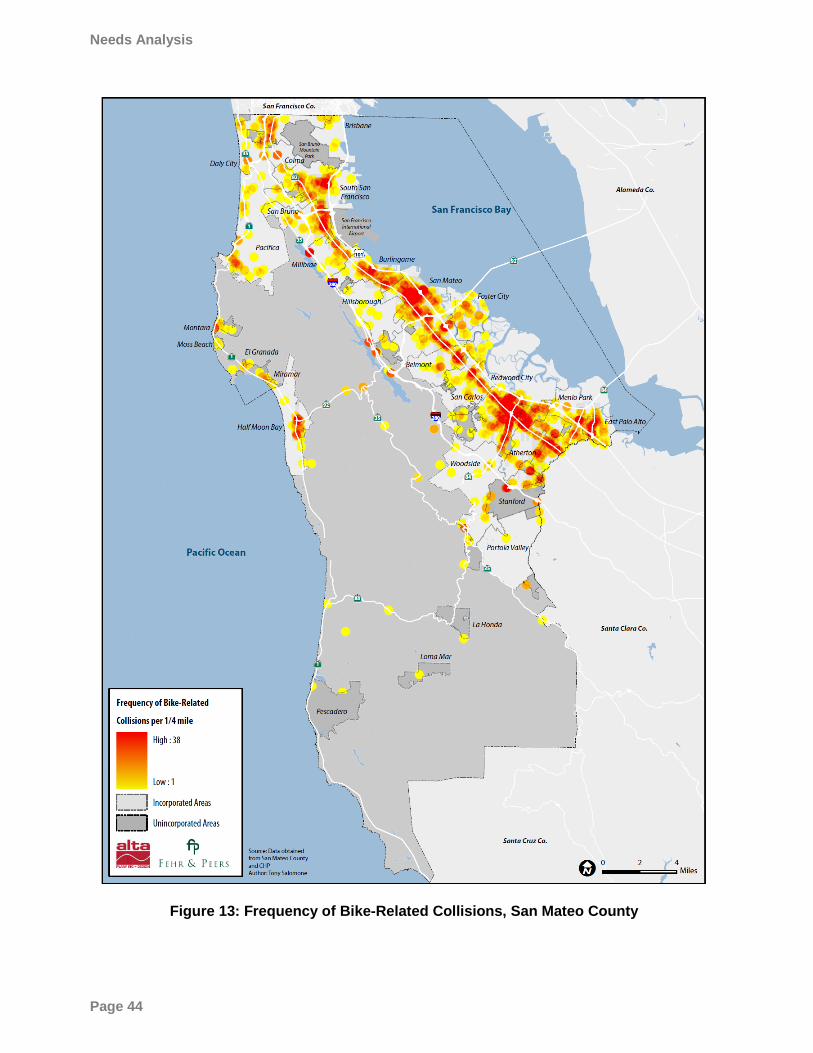
Needs Analysis
City/
Page 44
Figure 13: Frequency of Bike-Related Collisions, San Mateo County
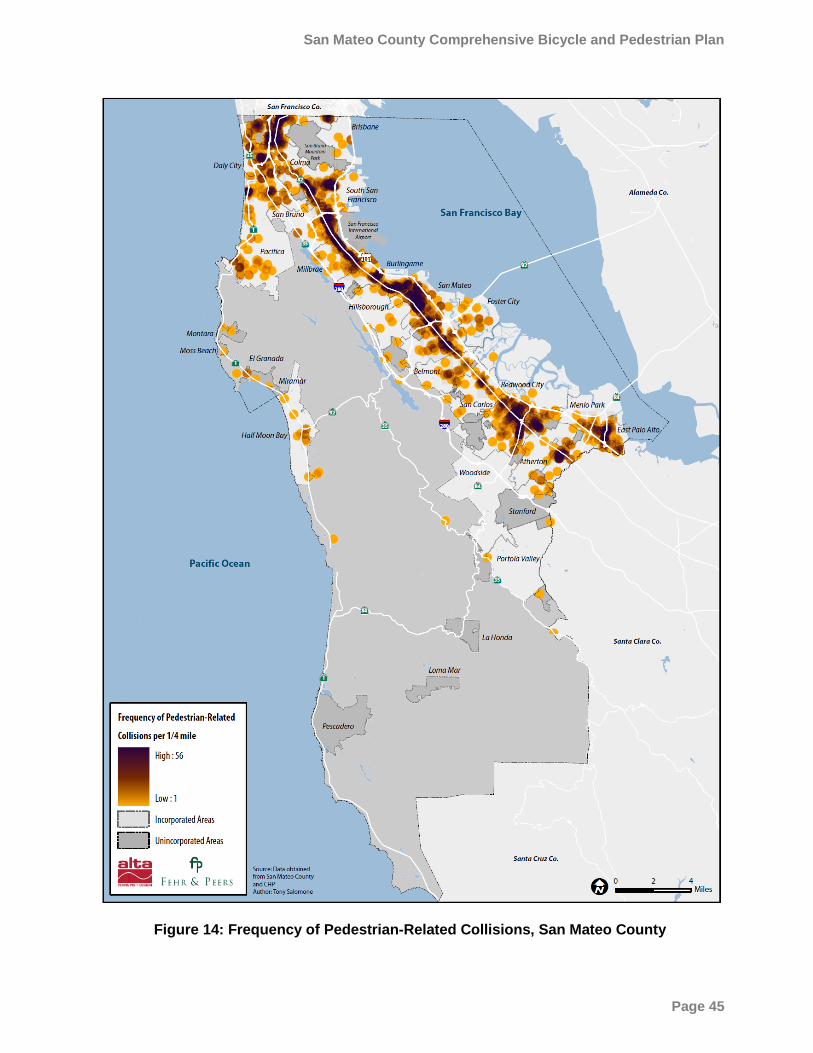
San Mateo County Comprehensive Bicycle and Pedestrian Plan
Page 45
Figure 14: Frequency of Pedestrian-Related Collisions, San Mateo County
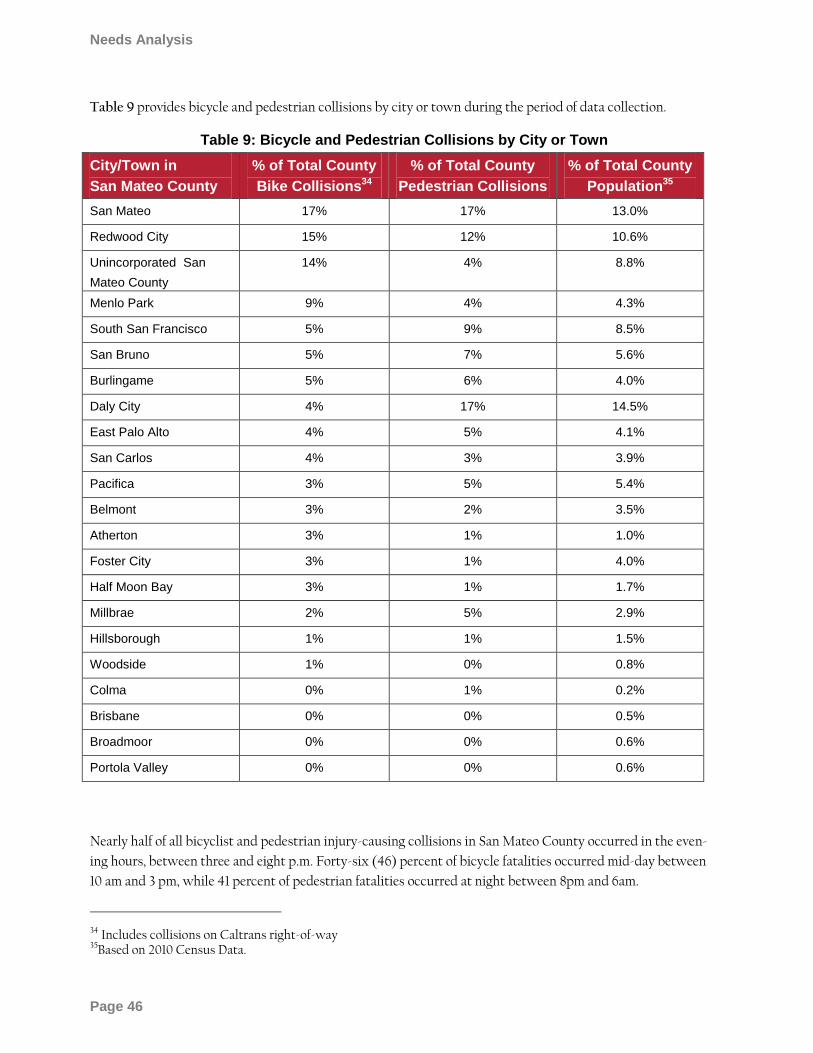
Needs Analysis
City/
Page 46
Table 9 provides bicycle and pedestrian collisions by city or town during the period of data collection.
Table 9: Bicycle and Pedestrian Collisions by City or Town
City/Town in
San Mateo County
% of Total County
Bike Collisions34
% of Total County
Pedestrian Collisions
% of Total County
Population35
San Mateo 17% 17% 13.0%
Redwood City 15% 12% 10.6%
Unincorporated San
Mateo County
14% 4% 8.8%
Menlo Park 9% 4% 4.3%
South San Francisco 5% 9% 8.5%
San Bruno 5% 7% 5.6%
Burlingame 5% 6% 4.0%
Daly City 4% 17% 14.5%
East Palo Alto 4% 5% 4.1%
San Carlos 4% 3% 3.9%
Pacifica 3% 5% 5.4%
Belmont 3% 2% 3.5%
Atherton 3% 1% 1.0%
Foster City 3% 1% 4.0%
Half Moon Bay 3% 1% 1.7%
Millbrae 2% 5% 2.9%
Hillsborough 1% 1% 1.5%
Woodside 1% 0% 0.8%
Colma 0% 1% 0.2%
Brisbane 0% 0% 0.5%
Broadmoor 0% 0% 0.6%
Portola Valley 0% 0% 0.6%
Nearly half of all bicyclist and pedestrian injury-causing collisions in San Mateo County occurred in the even-
ing hours, between three and eight p.m. Forty-six (46) percent of bicycle fatalities occurred mid-day between
10 am and 3 pm, while 41 percent of pedestrian fatalities occurred at night between 8pm and 6am.
34 Includes collisions on Caltrans right-of-way 35Based on 2010 Census Data.
San Mateo County Comprehensive Bicycle and Pedestrian Plan
Page 47
The most common bicyclist traffic violations were infringing on automobile right-of-way and riding on the
wrong side of the road. Other frequent traffic violations included improper turning, traffic signals and signs,
and unsafe speed.
Sixty (60) percent of pedestrian collisions were the fault of a vehicle, while only 29 percent were caused by
pedestrian violations. The most common cause of collisions was violating the pedestrian right-of-way.
5.5 Pedestrian Demand Model
Land use development type and proximity to certain destinations strongly influence the demand for walking in
the County. By categorizing levels of pedestrian demand based on land use and other factors, this Plan
identifies places that have the most desirable walking conditions. The methodology is based on research
conducted for the US Environmental Protection Agency (EPA) on the relationship between the built
environment and travel patterns. Through this and subsequent studies, several factors have been shown to have
significant effects on the number of people walking in a given area.36 This analysis produces generalized
estimates of pedestrian activity along all streets in San Mateo County.
Indicators of pedestrian demand are organized into four categories: built environment; proximity to walking
destinations; demographics; and street network and pedestrian permeability. Within these four groups, the
following seventeen indicators were used to estimate pedestrian demand:
Population Density
Employment Density
Land Use Mix
Schools
Parks/Beaches
Transit Proximity – Bus lines
Transit Proximity – Rail stops
Neighborhood Shopping Districts
Social and Recreational Destinations
Employment Centers
Age
Income
Vehicle Ownership
Priority Development Areas
Street Segment Length
Intersection Density
Street Connectivity
36The literature on travel behavior substantiates that several ―D-factors‖ independently affect travel behavior, including: land use
Density, Diversity (land use mix); pedestrian Design, and access to regional Destinations. Because these ―Ds‖ work at a very local level, most travel demand models are too aggregate in scale to capture the effects of the Ds. Additional ―D‖ factors such as Dis-tance to Transit and population Demographics are also included based on their demonstrated relationship to walking/biking.
Needs Analysis
City/
Page 48
Figure 15 illustrates the results of this analysis for San Mateo County. The Pedestrian Index is a score that
ranges from zero to 100 that estimates the pedestrian demand along all streets in San Mateo County. Areas
with red shades have higher relative walking rates than areas with orange and yellow shades. In general, the
areas with the highest pedestrian demand are concentrated along the El Camino Real Corridor. This includes
El Camino Real itself and many streets on either side of it, which combined rank as some of the streets with the
highest walking demand in the County.
The weighting of each individual variable is based on the results of the EPA research described above. A more
detailed description of the methodology and maps at a higher scale are provided in Appendix C.
Based on the model results, the areas with the highest walking demand are located in Daly City, South San
Francisco, San Bruno, San Mateo and Redwood City. Moderate walking demand can be found in other
downtown districts, including Burlingame, Belmont, San Carlos, Menlo Park and East Palo Alto. Several areas
in the western part of the County, including Half Moon Bay and Pacifica have neighborhoods with moderate to
high pedestrian demand.
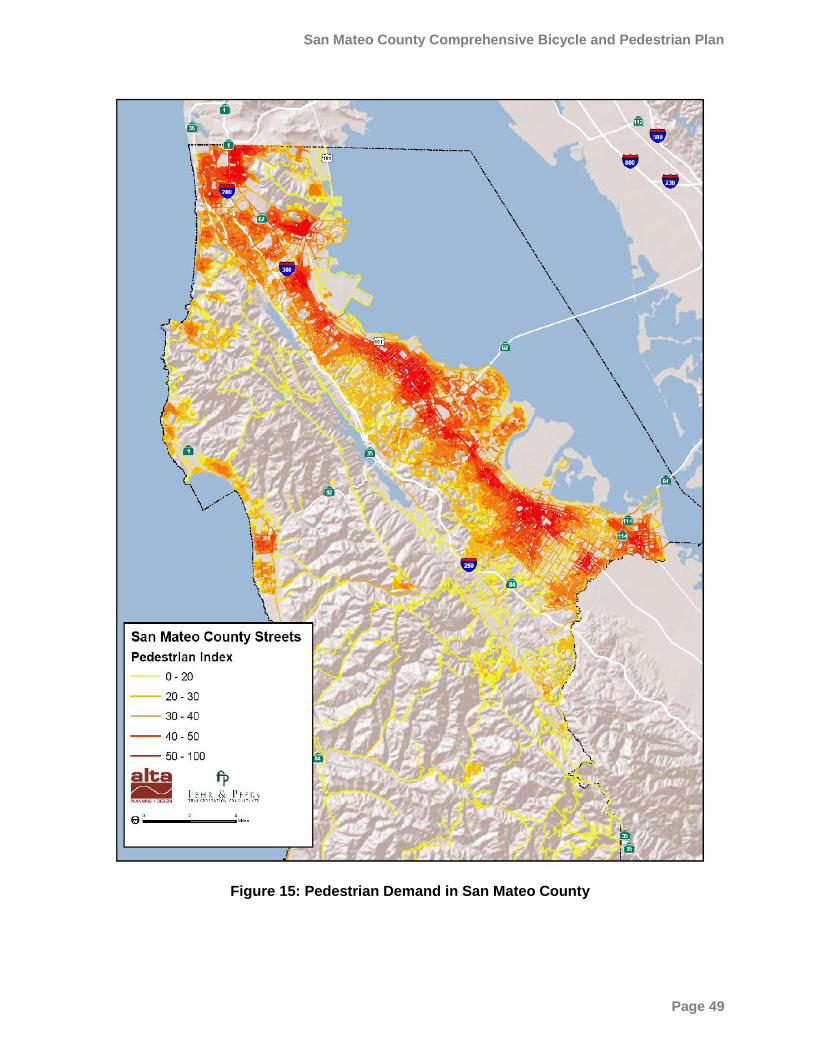
San Mateo County Comprehensive Bicycle and Pedestrian Plan
Page 49
Figure 15: Pedestrian Demand in San Mateo County
Needs Analysis
City/
Page 50
This page left blank intentionally.
San Mateo County Comprehensive Bicycle and Pedestrian Plan
Page 51
6 Countywide Bikeway Network
6.1 Introduction
This chapter presents the bikeway projects needed to complete the Countywide Bikeway Network (CBN).
The recommendations are based on a review of local and regional bicycle planning efforts, existing conditions
within the county, discussions with local agency staff (including the Public Works and Planning
Departments), and input from members of the public. They have been developed to meet the vision, goals and
policies of the CBPP.
To support C/CAG‘s role as San Mateo County‘s Congestion Management Agency, and to maximize funding
available for bikeway and pedestrian projects, this plan prioritizes utility trips by promoting access to jobs,
places where most county residents live, and communities with the greatest need.
This chapter consists of the following sections:
The Countywide Bikeway Network– Describes the CBN and criteria used to determine countywide
significance. The CBN consists of linear bikeways, streets, roadways and paths that will provide a
continuous bikeway network throughout the county, and major barrier crossings, over and
undercrossings and intersection and interchange improvements that facilitate bicycling across
freeways, major arterials, and other transportation and geographic features
Design Minimums for the Countywide Bikeway Network–Provides recommended design
standards to be applied to bikeways on the CBN, and includes a discussion of low volume parallel
routes that can be designed to accommodate bicyclists of all abilities.
Development of the Countywide Bikeway Network – Describes the outreach process used to
create the 2011 CBN.
Bicycle Focus Areas– Describes countywide projects and programs that support the CBN, and
include: Key Corridors, which consist of nine corridors that serve key countywide transportation
needs; bikeway signage; and bicycle parking.
Bikeway Network Project Categories – Describes the criteria used to sort the CBN projects into
implementation categories. Criteria support the goals and policies of this Plan and include access to
activity centers, access to transit, safety, and social equity. Also provides a summary of recommended
CBN projects, sorted into three implementation categories.
Cost Estimates – Presents the unit costs used to develop per-mile cost estimates for bicycle routes,
bicycle lanes, pathways, and other proposed improvements.
6.2 The Countywide Bikeway Network
The Countywide Bikeway Network is a comprehensive countywide system of on-street and off-street
bikeways, overcrossings, and bicycle-friendly intersections that provide safe, convenient access to major
destinations, transit stops, and recreational amenities. The CBN encompasses the two main needs for
bicyclists in San Mateo County—a continuous network of bicycle facilities and connections across major
barriers.
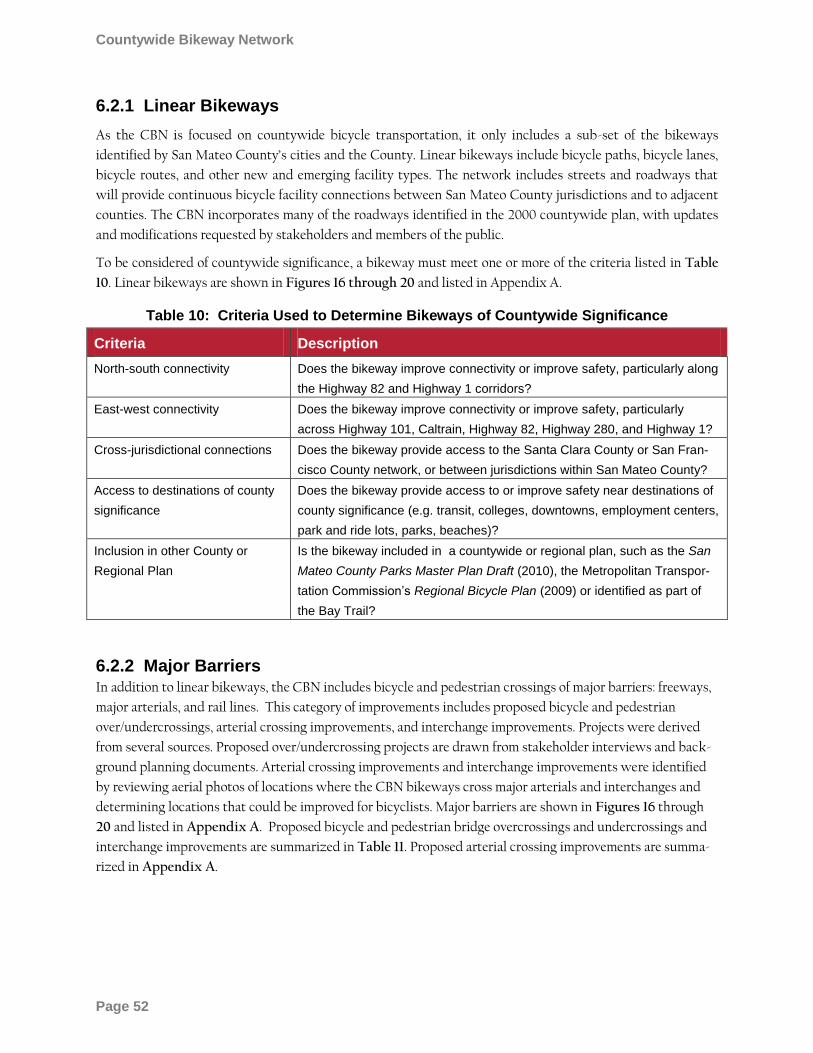
Countywide Bikeway Network
City/
Page 52
6.2.1 Linear Bikeways
As the CBN is focused on countywide bicycle transportation, it only includes a sub-set of the bikeways
identified by San Mateo County‘s cities and the County. Linear bikeways include bicycle paths, bicycle lanes,
bicycle routes, and other new and emerging facility types. The network includes streets and roadways that
will provide continuous bicycle facility connections between San Mateo County jurisdictions and to adjacent
counties. The CBN incorporates many of the roadways identified in the 2000 countywide plan, with updates
and modifications requested by stakeholders and members of the public.
To be considered of countywide significance, a bikeway must meet one or more of the criteria listed in Table
10. Linear bikeways are shown in Figures 16 through 20 and listed in Appendix A.
Table 10: Criteria Used to Determine Bikeways of Countywide Significance
Criteria Description
North-south connectivity Does the bikeway improve connectivity or improve safety, particularly along
the Highway 82 and Highway 1 corridors?
East-west connectivity Does the bikeway improve connectivity or improve safety, particularly
across Highway 101, Caltrain, Highway 82, Highway 280, and Highway 1?
Cross-jurisdictional connections Does the bikeway provide access to the Santa Clara County or San Fran-
cisco County network, or between jurisdictions within San Mateo County?
Access to destinations of county
significance
Does the bikeway provide access to or improve safety near destinations of
county significance (e.g. transit, colleges, downtowns, employment centers,
park and ride lots, parks, beaches)?
Inclusion in other County or
Regional Plan
Is the bikeway included in a countywide or regional plan, such as the San
Mateo County Parks Master Plan Draft (2010), the Metropolitan Transpor-
tation Commission’s Regional Bicycle Plan (2009) or identified as part of
the Bay Trail?
6.2.2 Major Barriers In addition to linear bikeways, the CBN includes bicycle and pedestrian crossings of major barriers: freeways,
major arterials, and rail lines. This category of improvements includes proposed bicycle and pedestrian
over/undercrossings, arterial crossing improvements, and interchange improvements. Projects were derived
from several sources. Proposed over/undercrossing projects are drawn from stakeholder interviews and back-
ground planning documents. Arterial crossing improvements and interchange improvements were identified
by reviewing aerial photos of locations where the CBN bikeways cross major arterials and interchanges and
determining locations that could be improved for bicyclists. Major barriers are shown in Figures 16 through
20 and listed in Appendix A. Proposed bicycle and pedestrian bridge overcrossings and undercrossings and
interchange improvements are summarized in Table 11. Proposed arterial crossing improvements are summa-
rized in Appendix A.
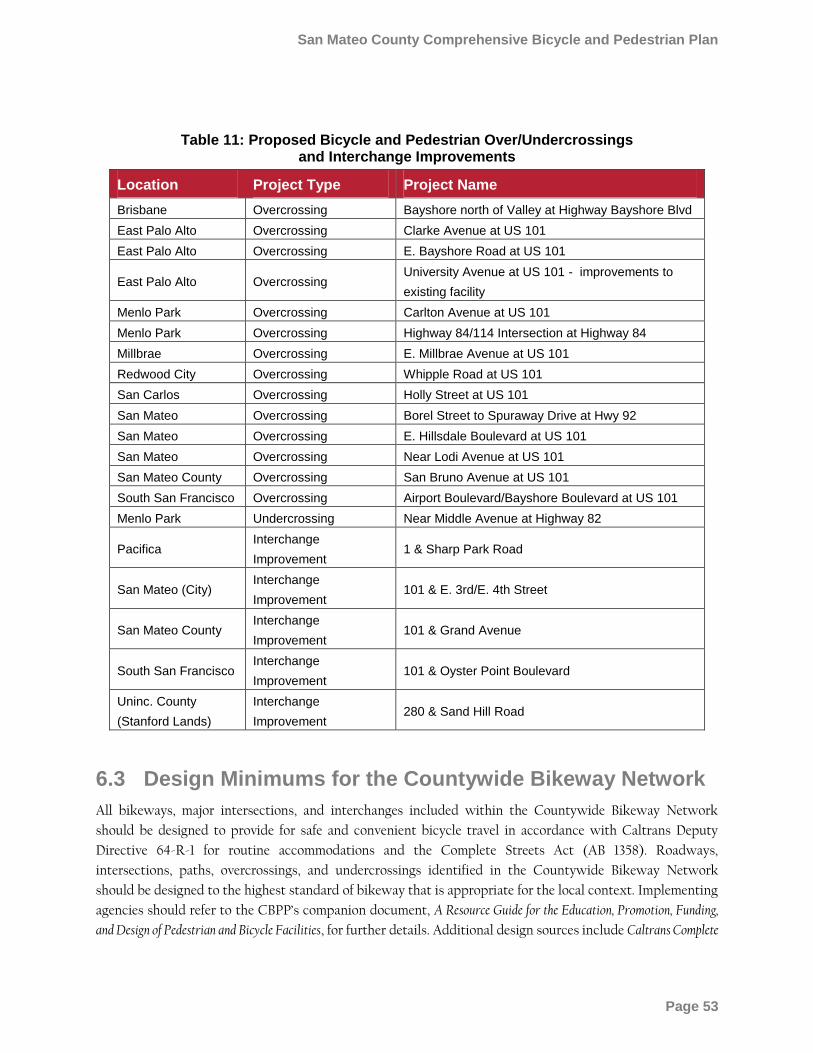
San Mateo County Comprehensive Bicycle and Pedestrian Plan
Page 53
Table 11: Proposed Bicycle and Pedestrian Over/Undercrossings and Interchange Improvements
Location Project Type Project Name
Brisbane Overcrossing Bayshore north of Valley at Highway Bayshore Blvd
East Palo Alto Overcrossing Clarke Avenue at US 101
East Palo Alto Overcrossing E. Bayshore Road at US 101
East Palo Alto Overcrossing University Avenue at US 101 - improvements to
existing facility
Menlo Park Overcrossing Carlton Avenue at US 101
Menlo Park Overcrossing Highway 84/114 Intersection at Highway 84
Millbrae Overcrossing E. Millbrae Avenue at US 101
Redwood City Overcrossing Whipple Road at US 101
San Carlos Overcrossing Holly Street at US 101
San Mateo Overcrossing Borel Street to Spuraway Drive at Hwy 92
San Mateo Overcrossing E. Hillsdale Boulevard at US 101
San Mateo Overcrossing Near Lodi Avenue at US 101
San Mateo County Overcrossing San Bruno Avenue at US 101
South San Francisco Overcrossing Airport Boulevard/Bayshore Boulevard at US 101
Menlo Park Undercrossing Near Middle Avenue at Highway 82
Pacifica Interchange
Improvement 1 & Sharp Park Road
San Mateo (City) Interchange
Improvement 101 & E. 3rd/E. 4th Street
San Mateo County Interchange
Improvement 101 & Grand Avenue
South San Francisco Interchange
Improvement 101 & Oyster Point Boulevard
Uninc. County
(Stanford Lands)
Interchange
Improvement 280 & Sand Hill Road
6.3 Design Minimums for the Countywide Bikeway Network
All bikeways, major intersections, and interchanges included within the Countywide Bikeway Network
should be designed to provide for safe and convenient bicycle travel in accordance with Caltrans Deputy
Directive 64-R-1 for routine accommodations and the Complete Streets Act (AB 1358). Roadways,
intersections, paths, overcrossings, and undercrossings identified in the Countywide Bikeway Network
should be designed to the highest standard of bikeway that is appropriate for the local context. Implementing
agencies should refer to the CBPP‘s companion document, A Resource Guide for the Education, Promotion, Funding,
and Design of Pedestrian and Bicycle Facilities, for further details. Additional design sources include Caltrans Complete
Countywide Bikeway Network
City/
Page 54
Intersections: A Guide to Reconstructing Intersections and Interchanges for Bicyclists and Pedestrians, the updated Caltrans
Highway Design Manual (forthcoming), and the National Association of City Transportation Officials Urban
Bikeway Design Guide.37
Designing for Bicyclists of All Abilities
Due to the street layout and geography of the County, many of the CBN bikeways follow high-volume, major
arterials and highways. Lower-volume local roads that provide a more pleasant bicycling experience generally
do not provide county-level connections. Implementing agencies should consider the wide range of bicyclists‘
abilities, and strive to design a CBN that accommodates all types of bicyclists, including ―interested but
concerned‖ bicyclists, as described in Section 5.1. In some cases, agencies may need to look to innovative or
experimental treatments such as traffic calming, bicycle boulevards, cycletracks, colored bicycle lanes, and
high-intensity actuated crosswalk beacons.
In other cases, agencies may wish to designate a parallel bikeway along a lower-volume street as a bicycle
boulevard or other high-quality bicycle facility. Parallel routes should be a minimum of a mile long, provide a
similar level of connectivity as the CBN route, be located within a quarter mile or less of the CBN route, and
provide for bicyclists of all abilities. Ideally, a parallel route provides continuous access through multiple
jurisdictions. A parallel route is not intended to replace the CBN route or serve as a detour around a short,
challenging segment of the CBN, but rather provide a longer-distance alternative route for less-experienced
bicyclists. The CBN contains a handful of low-volume routes that parallel El Camino Real and the North
South Bikeway. These were identified by the public. While an extensive analysis and identification of low-
volume parallel routes was not undertaken for this update of the CBPP, future updates may include such an
effort.
6.4 Development of the Countywide Bikeway Network
The CBN is derived from the countywide bicycle route network identified in the 2000 San Mateo County
Comprehensive Bicycle Route Plan. The 2011 CBN reflects input received during meetings with stakeholders at the
cities and the County, communications with local bicycle advocacy organizations, and public comments
received at a public workshop and through the project website. The 2009 Countywide Bikeway Map was
used to identify existing bikeways and confirm alignments. Subsequent meetings with city and County staff
refined the network. A description of the city/County and public outreach processes follows.
6.4.1 Input from Local Jurisdictions
As a countywide plan, this CBPP serves to coordinate bicycle and pedestrian planning among San Mateo
County‘s jurisdictions and the countywide agencies. Local implementing agencies – the cities and County –
were consulted throughout plan development, and recommendations within this plan are built on and reflect
their recommendations. The following outreach efforts sought input from the local implementing agencies:
The cities and County completed surveys indicating progress toward the 2000 Countywide Bicycle Plan
and suggested bicycle and pedestrian projects of countywide significance.
37 http://www.dot.ca.gov/hq/traffops/survey/pedestrian/Complete-Intersections-A-Guide-to-Reconstructing-Intersections-and-Interchanges-for-Bicyclists-and-Pedestirans.pdf http://nacto.org/cities-for-cycling/design-guide/
San Mateo County Comprehensive Bicycle and Pedestrian Plan
Page 55
Additional interviews were conducted with staff at cities, the County of San Mateo, the SMCTA, the
Metropolitan Transportation Commission, and Caltrans District 4.
The C/CAG Bicycle and Pedestrian Advisory Committee (BPAC) provided guidance towards
development of the CBPP.
6.4.2 Public Outreach A Public Open House was held on October 28, 2010 to present the vision, goals, and policies of the CBPP; the
existing and proposed Countywide Bikeway Network (CBN); and analysis of pedestrian demands and
identifying improvement needs. The Open house allowed members of the public (including bicycle advocacy
group members) and local agency staff the opportunity to review, discuss, and provide comments and inputs
on the various components of the Plan. Over 40 individuals attended. Additional inputs were received from
individuals and advocacy groups, including Bike San Mateo County and Silicon Valley Bicycle Coalition,
through written correspondence (letters and e-mails) after the Open House.
The Public Review Draft Plan was released in February 2011 and a two-month comment period followed. In
June 2011, C/CAG invited key stakeholders from the community to participate in an in-person discussion of
comments received during the public comment period.
All comments were taken into consideration and as applicable, were incorporated into the CBPP. Comments
that were considered to be outside the scope of the CBPP were noted and will be referred to the appropriate
agencies.
6.4.3 Summary of Revisions and Additions to the Countywide Bikeway Network
While conditions in San Mateo County have changed since 2000, many of the alignments identified in the
2000 bicycle route network remain key to the bikeway network. Most alignments from the 2000 plan have
been brought over to the 2011 Countywide Bikeway Network. If alignments were modified or added, it was for
the following typical reasons:
The city or County has implemented an alternative alignment, or identified an alternative alignment
within an adopted plan.
Multiple parallel alignments in close proximity were refined to only one or two options.
An alignment identified in the 2000 plan is infeasible or no longer relevant.
A destination of countywide significance is not adequately served by the 2000 network.
Members of the public requested a new or modified alignment.
Key additions and modifications to the network include:
The north-south route has been updated to reflect a combination of recommended alignments
identified by the Silicon Valley Bicycle Coalition and final preferred routes approved by the respective
cities.
Bikeways identified in the Metropolitan Transportation Commission‘s 2009 Regional Bicycle Plan have
been added.
Countywide Bikeway Network
City/
Page 56
On-street portions of the Bay to Ocean trails identified as part of the update of the San Mateo County
Trails Master Plan have been added.
The Bay Trail has been updated to reflect ABAG‘s most recent maps.
Bikeways recommended in Caltrain‘s Bicycle Access and Parking Plan and BART station area plans have
been added.
An inventory of existing and proposed overcrossings of major barriers has been added.
An inventory of major arterial crossings has been added.
Two north-south bikeways on low-volume residential streets west of El Camino Real have been add-
ed. One travels through the cities of San Bruno, Millbrae, and Burlingame on Elm, Magnolia, and
Quesada. The other travels through the cities of San Carlos, Redwood City, Atherton, and Menlo Park
along Elm, Hudson, Austin, Elena, and San Mateo.
Woodside Road between Alameda De Las Pulgas and the Bay Trail has been added as a proposed on-
street bikeway.
Removal of Forest View Avenue and Bella Vista Drive as proposed bikeways in Hillsborough.
Removal of Preston Road and Espinosa Road as proposed bikeways in Thornewood Open Space.
The Coastal Trail and Parallel Trail were enhanced to reflect planning efforts at the County level.
Numerous minor revisions to the network based on comments received from jurisdictions and the
public.
Figures 16 through 20 show the existing and proposed Countywide Bikeway Network. The class of the
proposed bikeway is shown when that information is available. If it is not available, the bikeway is shown as
―unclassified on-street.‖ When applicable, a bikeway‘s route number is included on the maps. Detailed maps
of the CBN, organized by jurisdiction, are provided in Appendix B. Figures 16 through 20 also show key
corridors highlighted. These are explained further in Section 6.5.
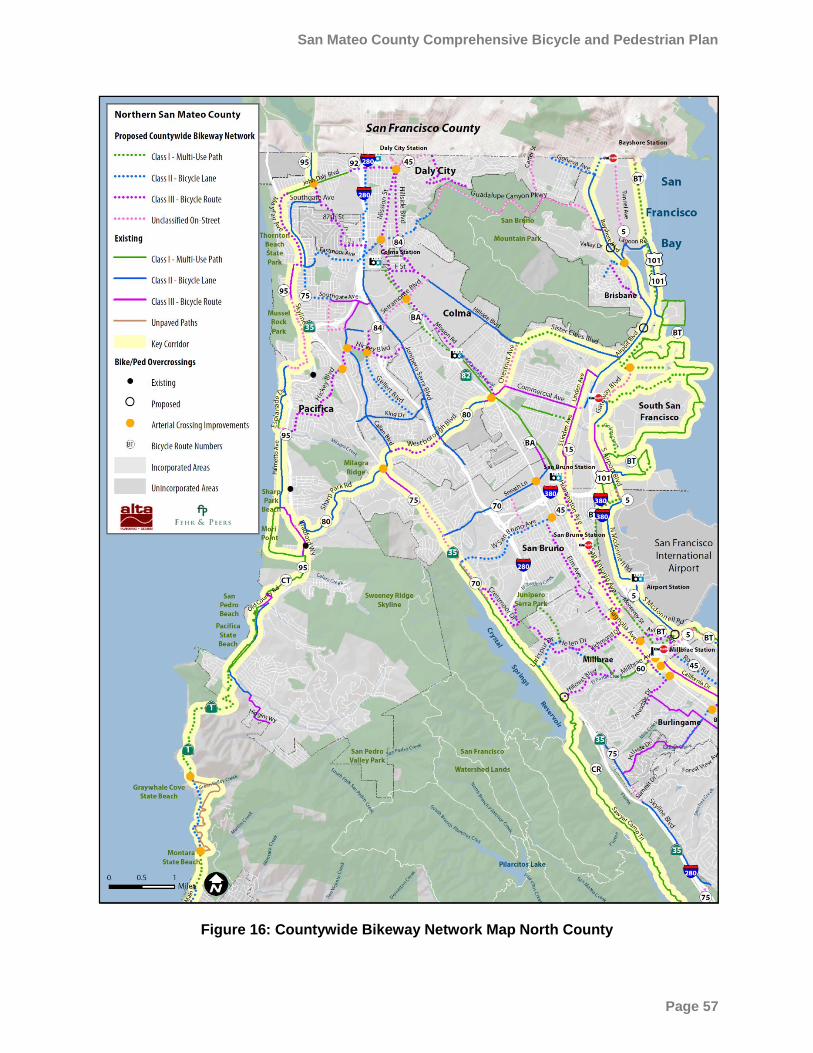
San Mateo County Comprehensive Bicycle and Pedestrian Plan
Page 57
Figure 16: Countywide Bikeway Network Map North County
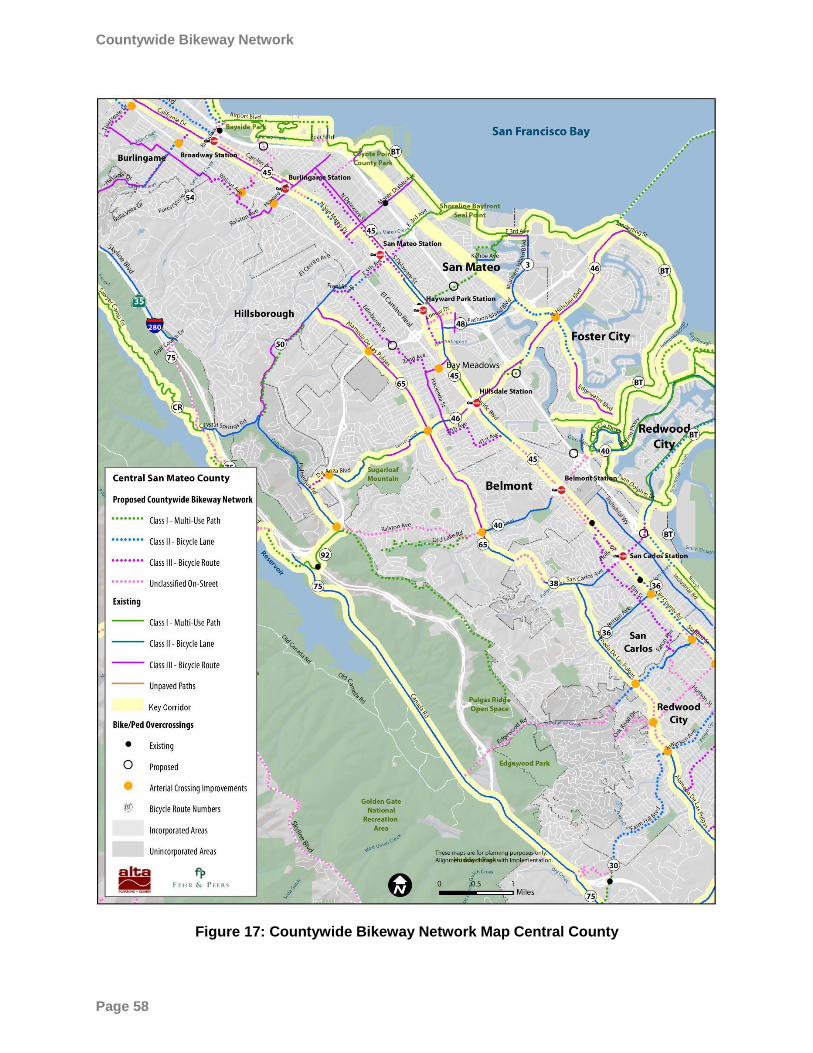
Countywide Bikeway Network
City/
Page 58
Figure 17: Countywide Bikeway Network Map Central County
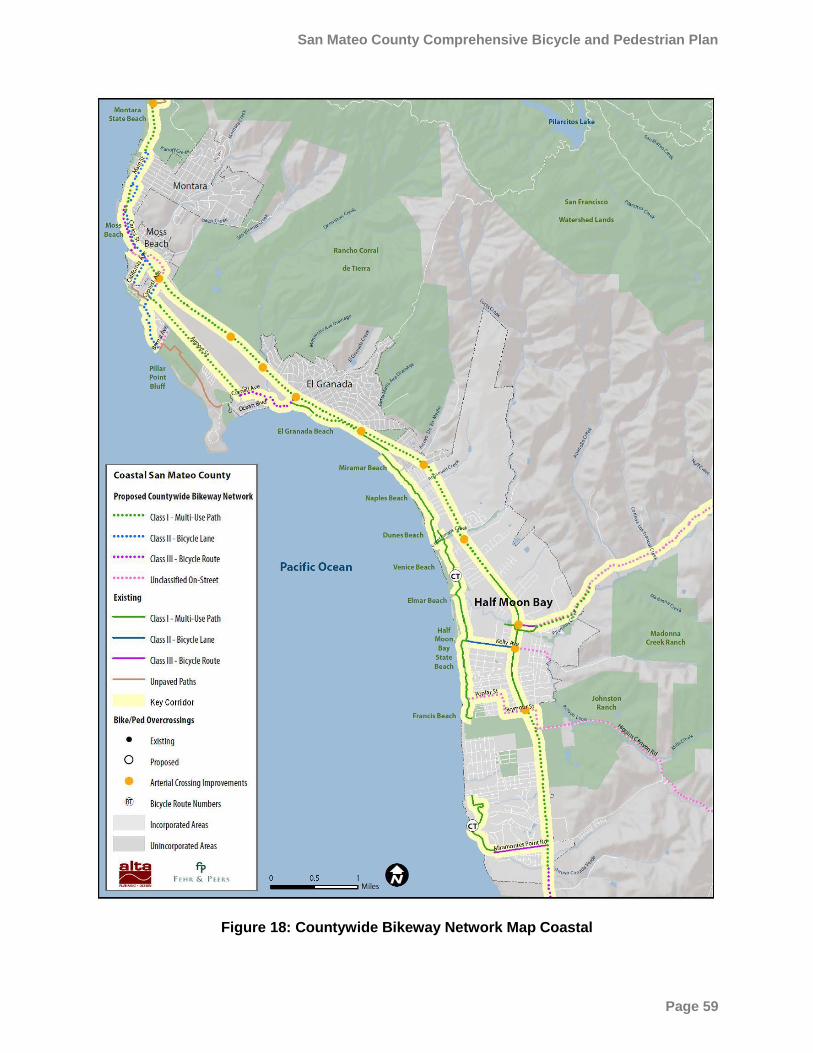
San Mateo County Comprehensive Bicycle and Pedestrian Plan
Page 59
Figure 18: Countywide Bikeway Network Map Coastal
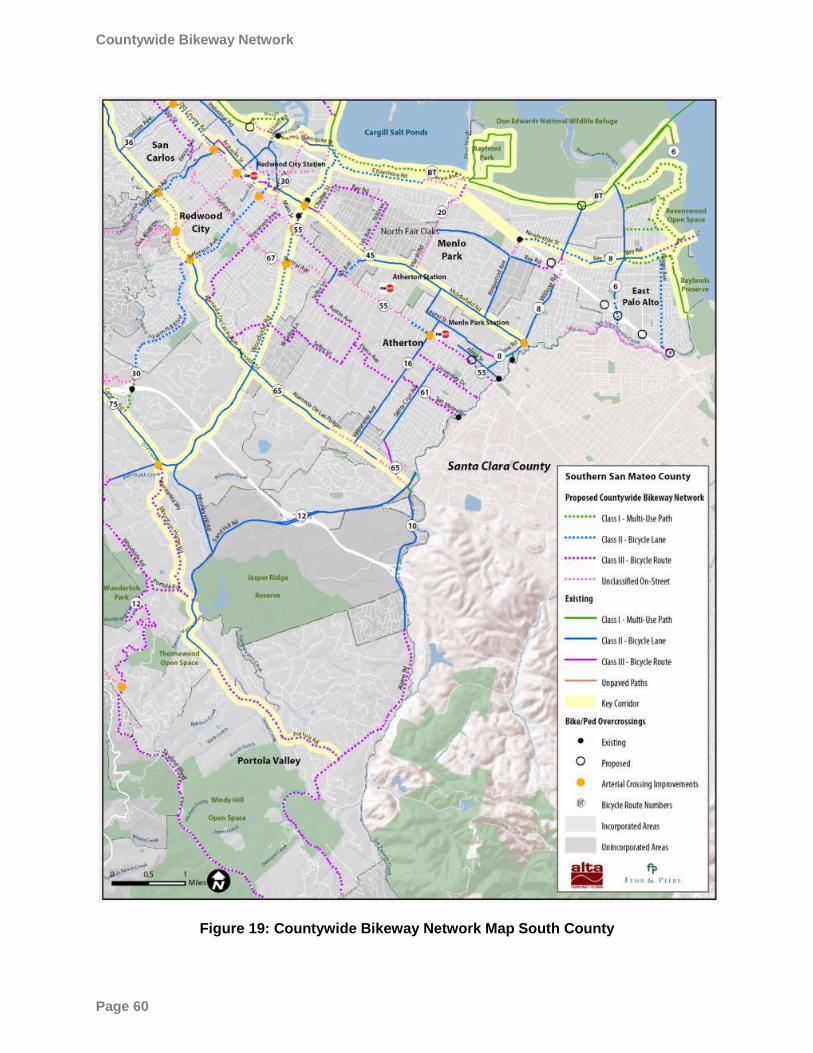
Countywide Bikeway Network
City/
Page 60
Figure 19: Countywide Bikeway Network Map South County
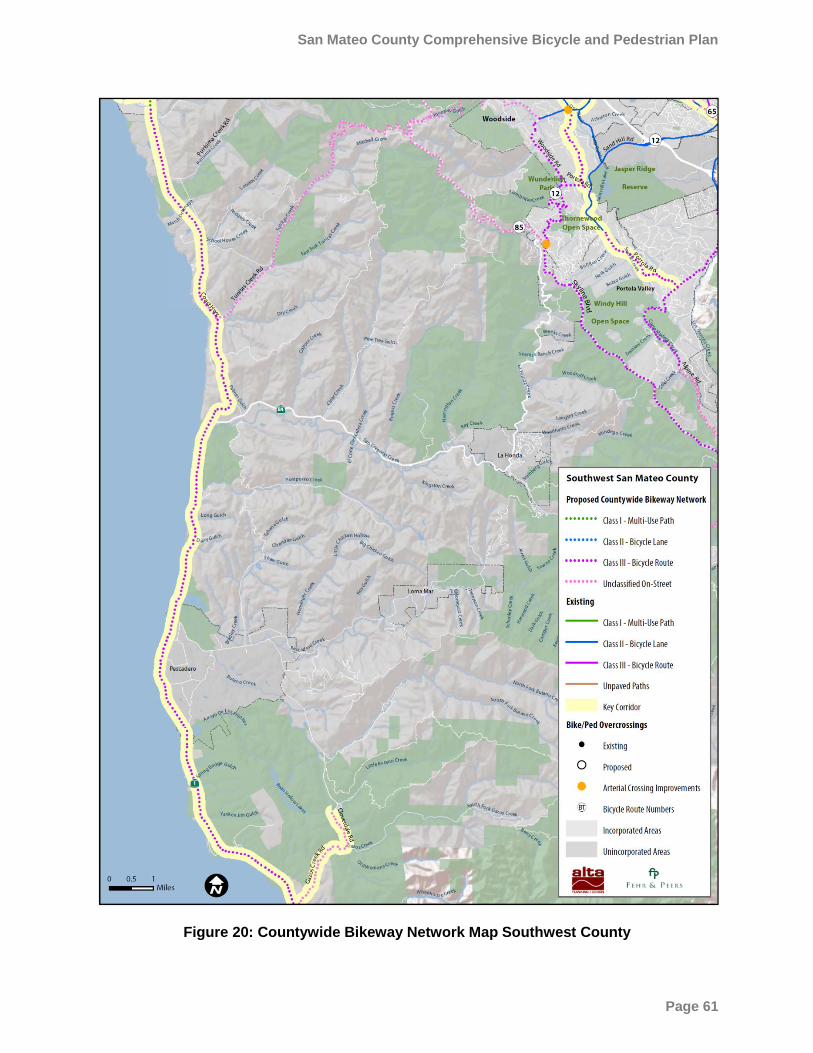
San Mateo County Comprehensive Bicycle and Pedestrian Plan
Page 61
Figure 20: Countywide Bikeway Network Map Southwest County
Countywide Bikeway Network
City/
Page 62
6.5 Bicycle Project Groups To support the CBN, the CBPP identifies three project groups that emerged from the 2000 Plan, other
background planning documents, stakeholder discussions, and review of potential projects. The project
groups are countywide programs that support bicycling and consist of key corridors, bicycle signage and
bicycle parking. By defining project groups, the CBPP enables C/CAG to monitor funding and progress for
these important support programs. More detailed definitions for each of the categories are provided below.
Countywide Key Corridors
Key Corridors are defined as long-distance corridors that serve key transportation and recreation needs
evident in county commute patterns, concentration of population and county geography. Four of these—the
North-South Bikeway, the San Francisco Bay Trail, the Highway 1/Coastal Trail/Parallel Trail, and the East of
101 North-South Corridor were identified in whole or in part as key projects in the 2000 plan. With the
exception of the East of 101 North-South Corridor, all Key Corridors are identified in MTC‘s Regional Bicycle
Plan. Key Corridors are illustrated in Figure 21 and highlighted in Figures 16 through 20.
San Francisco Bay Trail—The San Francisco Bay Trail is a 500-mile partially-constructed bicycle
and pedestrian loop around the San Francisco Bay. The Bay Trail is a priority for Regional, County
and local jurisdictions. It provides key recreation opportunities, and in San Mateo County, serves in
part as a commute corridor. The Bay Trail consists primarily of Class I Bike Paths, but in some
locations, Class II Bike Lanes and adjacent sidewalks are provided. The entire Bay Trail and access
spurs to the Bay Trail are included in this key corridor.
East of 101 North-South Corridor—This corridor runs from Santa Clara County to San Francisco
County between Highway 101 and the Bay Trail. A specific alignment has not been identified, though
there are some existing and proposed bikeways that could become segments of this corridor. The
need for a continuous on-street bikeway alignment east of 101 was identified by members of the
public during the development of the CBPP. It is intended to serve bicycle commuters.
North South Bikeway—El Camino Real provides the most direct north-south connection on the
eastern part of the county, and connects downtowns, Caltrain, BART, and residences. The multi-
jurisdictional Grand Boulevard Initiative envisions El Camino Real as a multi-modal corridor that
provides for all modes, including bicyclists. However, at this time very few jurisdictions provide on-
street bikeways along El Camino Real and bicycling conditions on the roadway are challenging and
uncomfortable. High traffic volumes and transit use makes it difficult to replace vehicle lanes with
bicycle lanes. The North South Bikeway, identified through a collaborative effort of local jurisdictions
and bicyclists, provides an alternative parallel route to El Camino Real. Many segments of the North
South Bikeway have bike lanes, and bicycling conditions along this route are a significant
improvement over those on El Camino Real. Improvements along El Camino Real and the North
South Bikeway, as well as nearby lower volume parallel routes are included in this key corridor.
Alameda de Las Pulgas—This corridor has been identified by the public and local jurisdictions as a
key bicycling corridor connecting the County of Santa Clara to San Mateo. It provides an inland
alternative to the North South Bikeway. Bike lanes are striped on approximately half the length of
the corridor (South of Belmont) while the remainder is a signed bicycle route. Several key sections do
San Mateo County Comprehensive Bicycle and Pedestrian Plan
Page 63
not have designated bicycle facilities. Improvements can be made along the entire corridor to improve
bicycling conditions, particularly at intersections. It serves both commute and recreational needs.
Crystal Springs Regional Trail (San Bruno to Woodside) – This Class I Bike Path is a highly-used
recreational corridor in the central part of the county. It has been identified as a key corridor in the
Draft County Trails Master Plan.
Highway 1/Coastal Trail/Parallel Trail—The Highway 1 corridor, including the Parallel Trail, which
runs adjacent to Highway 1, and the Coastal Trail, which is located adjacent to the Coast, provide key
recreational and commute opportunities for the coastal communities in the western part of San
Mateo County. Improvements along this corridor will provide bicycle (and pedestrian) facilities
where few currently exist, and serve the low-income population, agricultural workers, and transit
riders who are already biking and walking along this corridor. The Parallel Trail parallels Highway 1
from Montara to Half Moon Bay and consists of Class I Bike Paths and Class II Bike Lanes. The
Coastal Trail is part of a larger statewide effort to provide a network of public trails along the entire
California coastline. In San Mateo County, the final alignment of the Coastal Trail and type of
facilities proposed are still under discussion, and may change from the alignments identified in the
CBPP. The trail consists of Class I Bike Paths, Class II Bike Lanes, Class III Bike Routes, and unpaved
gravel trails. Recognizing the importance of the Coastal Trail, the CBPP includes the entire alignment
through San Mateo County, including the dirt trails. It should be noted, however, that unpaved trails
do not meet Class I Bike Path standards—Class I paths are required to be paved—and therefore are
technically not under the purview of this CBPP.
Northern East-West Route (South San Francisco to Pacifica)— This commute corridor has been
identified as a potential Bay to Ocean route in the Draft County Trails Master Plan. It consists of on-
street bikeways.
Highway 92 Corridor (San Mateo to Half Moon Bay)—This east-west corridor provides commute
opportunities at its western end in Half Moon Bay, and provides recreational opportunities along the
more rural section in the central part of the County. Improvements along this corridor will provide
bicycle (and pedestrian) facilities where few currently exist, and serve the low-income population,
agricultural workers, and transit riders who are already biking and walking along this corridor. In the
urbanized eastern portion of the County, in the City of San Mateo and Foster City, highway 92 is
grade-separated and acts as a barrier to north-south movement. Improvements paralleling and
crossing Highway 92 are important to facilitate bicycle access.
Woodside Road – This roadway is a key east-west connection in the southern part of the county,
and connects the following north-south corridors: the Bay Trail, the East of 101 Corridor, the North-
South Bikeway and El Camino Real, Alameda de Las Pulgas and the Crystal Springs Regional Trail.
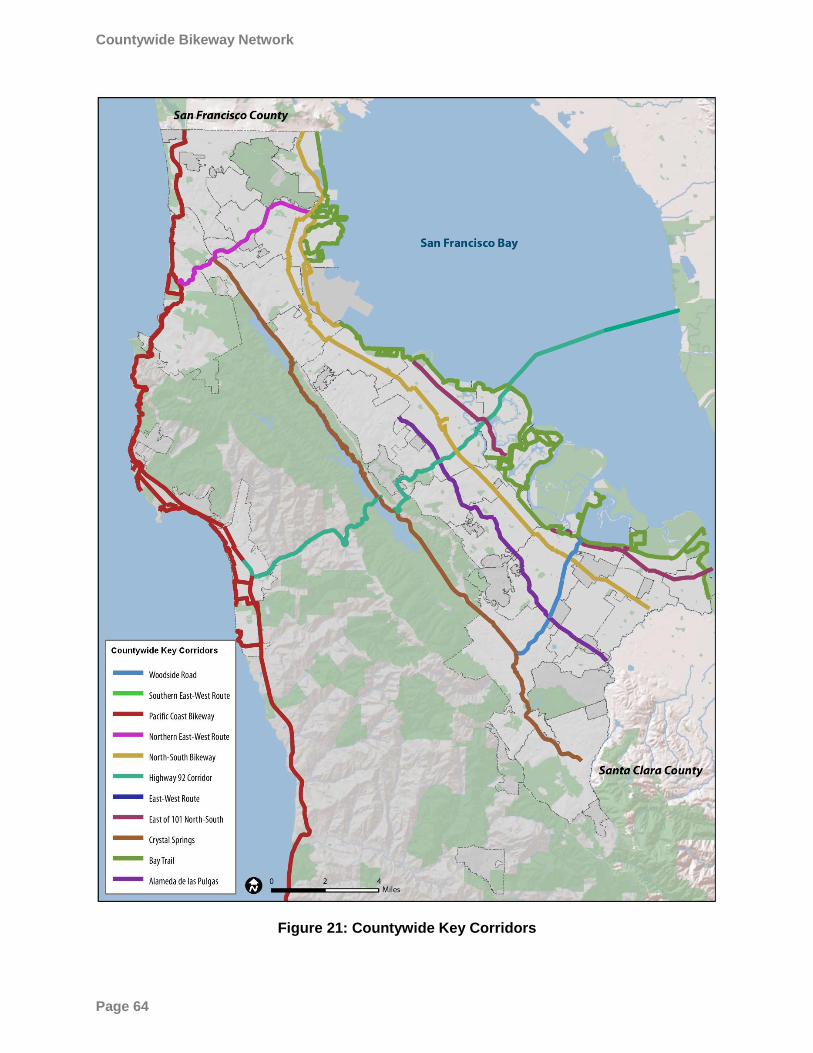
Countywide Bikeway Network
City/
Page 64
Figure 21: Countywide Key Corridors
San Mateo County Comprehensive Bicycle and Pedestrian Plan
Page 65
Signage
The CBPP recommends that cities and the County use the Route Number System shown in Figures 16
through 20. The numbering system was developed for the San Mateo County Comprehensive Bicycle Route Plan
(2000), and has been carried over without changes. Route numbers should be used with the California
MUTCD‘s bicycle route number marker (SG45 CA). The sign can be modified to include a city logo. Appen-
dix E provides design guidelines for the Route Number System.
In addition to recommending route numbering along numbered bikeways, the CBPP recommends that cities
and the County install bicycle wayfinding signage along all CBN bikeways. Wayfinding signage provides in-
formation necessary for bicyclists to navigate along a bicycle route, including the distance to key destinations,
advance notice for turns in the bicycle route, and identification of intersecting bicycle routes. Wayfinding
signs are typically placed at key locations leading to and along bicycle facilities, including where multiple
routes intersect and at key bicyclist ―decision points.‖ Wayfinding signs displaying destinations, distances
and ―riding time‖ can dispel common misperceptions about time and distance while increasing users‘ comfort
and accessibility to the priority street network. Wayfinding signs also visually cue motorists that they are
driving along a bicycle route and should correspondingly use caution. Note that too many road signs tend to
clutter the right-of-way, and it is recommended that these signs be posted at a level most visible to bicyclists
and pedestrians, rather than per vehicle signage standards.
Cities and the County should install wayfinding signage based on the California MUTCD‘s bike route sign (D11-
1) bicycle guide sign (D1-1b), and street name sign (D1-1c).38
Bicycle Parking
End of trip bicycle facilities including bicycle parking, lockers and showers are a key element of a bicycle net-
work. Every bicycle trip not only includes travel between destinations, it includes parking at the origin and
destination. Shower and locker facilities at large commercial developments encourage bicycling by providing
storage space for clothing and an opportunity to freshen up before work. Employees who exercise on their
lunch break can also benefit from shower and locker facilities.
Bicycle parking is important to San Mateo County because it is a key element of the bicycle network. While
the CBPP outlines recommendations for investment in a transportation network for travel, it also recognizes
the importance of bicycle parking at end-trip locations. Secure parking at end-trip locations is essential to
making a trip possible. Locations without bicycle parking are not attractive or inviting to bicyclists. As a re-
sult, bicyclists may not journey to these destinations. Studies show that though many factors influence bicy-
cling, secure parking has a significantly positive effect.39
The following types and locations of bicycle parking are considered to be of countywide significance, and will
be eligible for funding through the CFP process:
Bicycle racks at regional destinations including:
o Transit stations
o Transit hubs
38
In the Bay Area, the City of Oakland has developed a logical and easy to use wayfinding signage system based on CA MUTCD signs. See http://www.oaklandpw.com/Page122.aspx#wayfinding for Oakland‘s Bicycle Wayfinding Design Guidelines. 39 John E. Abraham and John Douglas Hunt, ―Influences on Bicycle Use,‖ Transport 34, no. 4 (2007): 466.
Countywide Bikeway Network
City/
Page 66
o Community downtowns
o Public hospitals
o Regional parks
Bicycle lockers or similar long-term secure parking facility at the following regional destinations:
o Transit stations
o Transit hubs
o Community downtowns
6.6 Bikeway Network Project Categories
The total funding needed to implement the CBN is estimated at $191 million in 2011 dollars. The CBN is based
on data from project description received by the jurisdictions for the purpose of this planning document.
Given projected funding sources, only a portion of the network will be completed within the near-term. In
order to assist C/CAG, the SMCTA, and other funding agencies in distributing the limited available funds,
this Plan sorts CBN projects into three categories based on the project ranking criteria described in Table 11.
These criteria are based on the goals and policies for the CBPP.
Note that this ranking only scores linear bikeways and barrier crossings on the CBN. The designation of a
bikeway as a key corridor, described in Section 6.5, does not influence the project ranking of that bikeway.
While most key corridors score high on the project categorization described below, some key corridors,
particularly those in rural areas, may not score high.
6.6.1 Project Categorization Process The criteria used to score and sort projects into categories are: collision history, transit access, population and
employment density, and location in an underserved community. Values for each criterion were assigned to
the recommended bikeway projects using a Geographic Information System (GIS)-based tool. The
assumptions used to assign values are identified in the ―Notes‖ column of Table 12. Once values had been
assigned in GIS, the population density, employment density, and crashes per mile were normalized. Finally,
the normalized scores were weighted to reflect the relative importance of each criterion: collision history 20
points, transit access 15 points, population density 8 points, employment density 12 points, underserved
community 8 points.
The weighting process emphasizes utility trips—commute, shopping, and personal business trips. Focusing
on these types of trips maximizes the benefit and funding available for bikeway projects. Shifting people from
driving to bicycling for utility trips—particularly for commute trips— can help reduce congestion. Most
bikeway funding from county, regional, state, and federal agencies require eligible bikeway projects to support
utility trips. Funding for purely recreational bikeways is more limited.
Each category includes a mix of on-street and off-street bikeways, arterial crossing improvements, interchange
improvements, and proposed bicycle/pedestrian overcrossings.
These categories are meant to be guidelines. The distribution of funds should consider these categories but
ultimately be made on a project-by-project basis, considering an individual project‘s merits compared to the
other competing projects for a funding cycle. Tables 13, 14 and 15 summarize costs for each project group for
the three categories. Appendix A contains detailed tables listing individual projects by jurisdiction, and maps
showing projects by category.
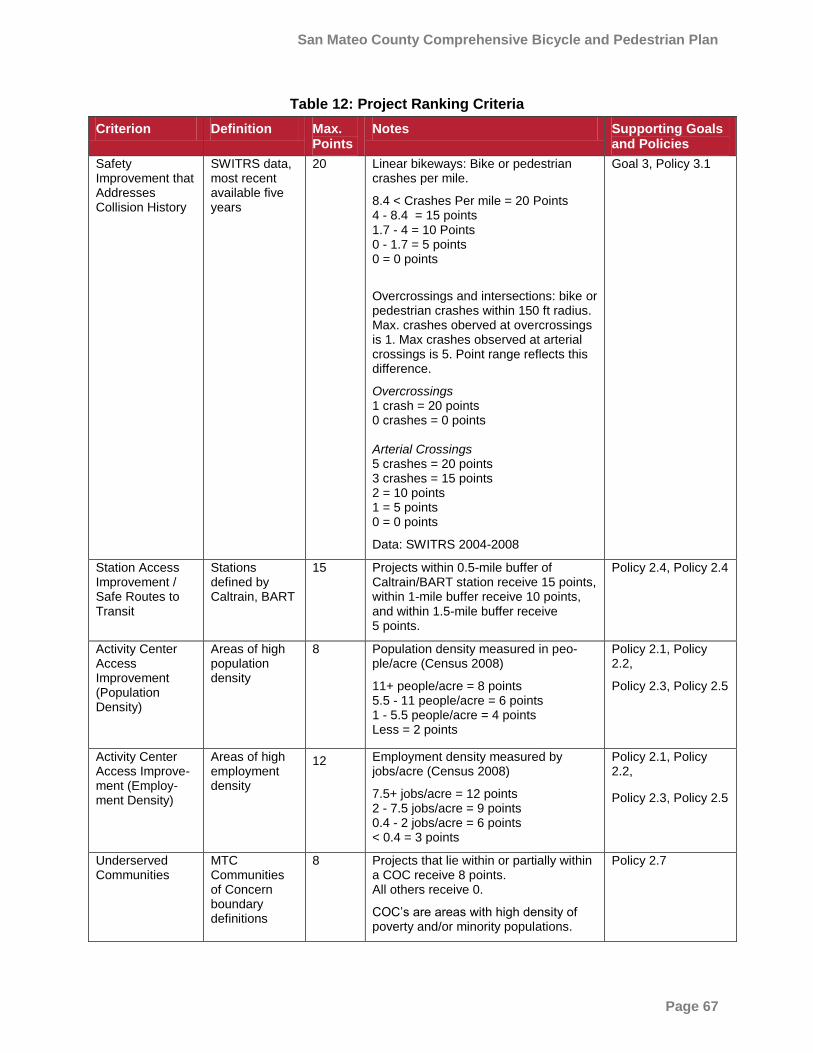
San Mateo County Comprehensive Bicycle and Pedestrian Plan
Page 67
Table 12: Project Ranking Criteria
Criterion Definition Max. Points
Notes Supporting Goals and Policies
Safety Improvement that Addresses Collision History
SWITRS data, most recent available five years
20 Linear bikeways: Bike or pedestrian crashes per mile.
8.4 < Crashes Per mile = 20 Points 4 - 8.4 = 15 points 1.7 - 4 = 10 Points 0 - 1.7 = 5 points 0 = 0 points
Overcrossings and intersections: bike or pedestrian crashes within 150 ft radius. Max. crashes oberved at overcrossings is 1. Max crashes observed at arterial crossings is 5. Point range reflects this difference.
Overcrossings 1 crash = 20 points 0 crashes = 0 points Arterial Crossings 5 crashes = 20 points 3 crashes = 15 points 2 = 10 points 1 = 5 points 0 = 0 points
Data: SWITRS 2004-2008
Goal 3, Policy 3.1
Station Access Improvement / Safe Routes to Transit
Stations defined by Caltrain, BART
15 Projects within 0.5-mile buffer of Caltrain/BART station receive 15 points, within 1-mile buffer receive 10 points, and within 1.5-mile buffer receive 5 points.
Policy 2.4, Policy 2.4
Activity Center Access Improvement (Population Density)
Areas of high population density
8
Population density measured in peo-ple/acre (Census 2008)
11+ people/acre = 8 points 5.5 - 11 people/acre = 6 points 1 - 5.5 people/acre = 4 points Less = 2 points
Policy 2.1, Policy 2.2,
Policy 2.3, Policy 2.5
Activity Center Access Improve-ment (Employ-ment Density)
Areas of high employment density
12 Employment density measured by jobs/acre (Census 2008)
7.5+ jobs/acre = 12 points 2 - 7.5 jobs/acre = 9 points 0.4 - 2 jobs/acre = 6 points < 0.4 = 3 points
Policy 2.1, Policy 2.2,
Policy 2.3, Policy 2.5
Underserved Communities
MTC Communities of Concern boundary definitions
8 Projects that lie within or partially within a COC receive 8 points. All others receive 0.
COC’s are areas with high density of poverty and/or minority populations.
Policy 2.7
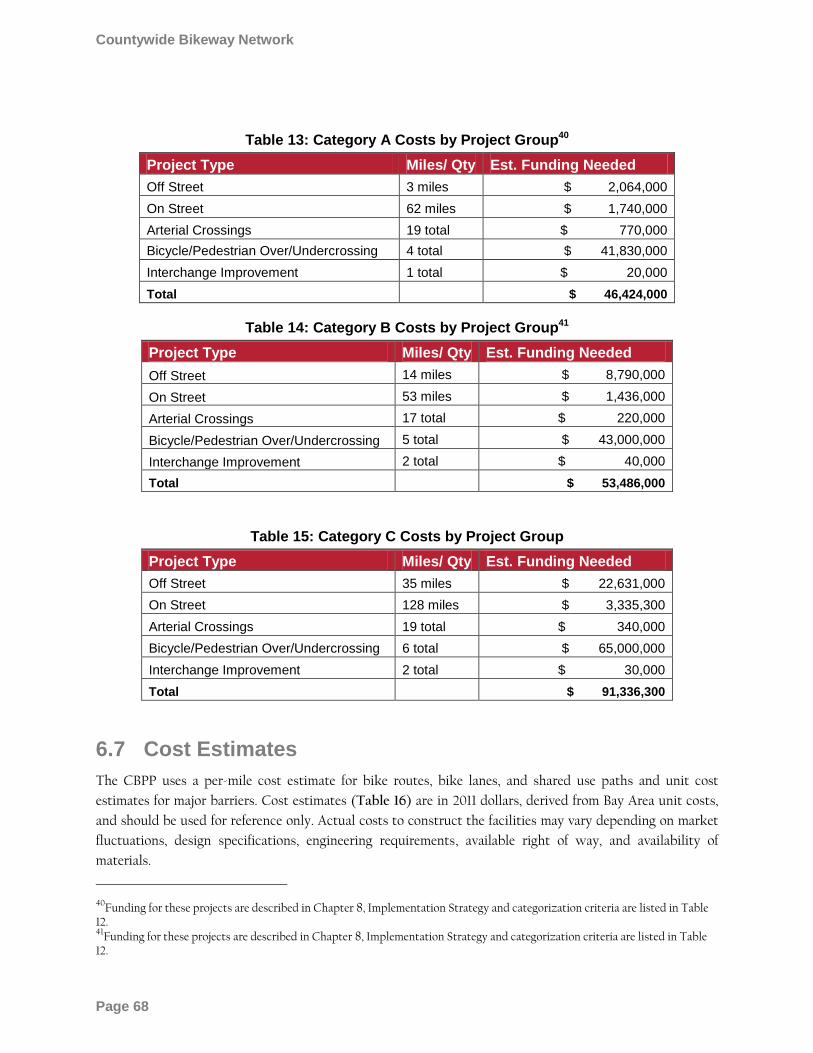
Countywide Bikeway Network
City/
Page 68
Table 13: Category A Costs by Project Group40
Project Type Miles/ Qty Est. Funding Needed
Off Street 3 miles $ 2,064,000
On Street 62 miles $ 1,740,000
Arterial Crossings 19 total $ 770,000
Bicycle/Pedestrian Over/Undercrossing 4 total $ 41,830,000
Interchange Improvement 1 total $ 20,000
Total
$ 46,424,000
Table 14: Category B Costs by Project Group41
Project Type Miles/ Qty Est. Funding Needed
Off Street 14 miles $ 8,790,000
On Street 53 miles $ 1,436,000
Arterial Crossings 17 total $ 220,000
Bicycle/Pedestrian Over/Undercrossing 5 total $ 43,000,000
Interchange Improvement 2 total $ 40,000
Total
$ 53,486,000
Table 15: Category C Costs by Project Group
Project Type Miles/ Qty Est. Funding Needed
Off Street 35 miles $ 22,631,000
On Street 128 miles $ 3,335,300
Arterial Crossings 19 total $ 340,000
Bicycle/Pedestrian Over/Undercrossing 6 total $ 65,000,000
Interchange Improvement 2 total $ 30,000
Total
$ 91,336,300
6.7 Cost Estimates
The CBPP uses a per-mile cost estimate for bike routes, bike lanes, and shared use paths and unit cost
estimates for major barriers. Cost estimates (Table 16) are in 2011 dollars, derived from Bay Area unit costs,
and should be used for reference only. Actual costs to construct the facilities may vary depending on market
fluctuations, design specifications, engineering requirements, available right of way, and availability of
materials.
40
Funding for these projects are described in Chapter 8, Implementation Strategy and categorization criteria are listed in Table 12. 41
Funding for these projects are described in Chapter 8, Implementation Strategy and categorization criteria are listed in Table 12.
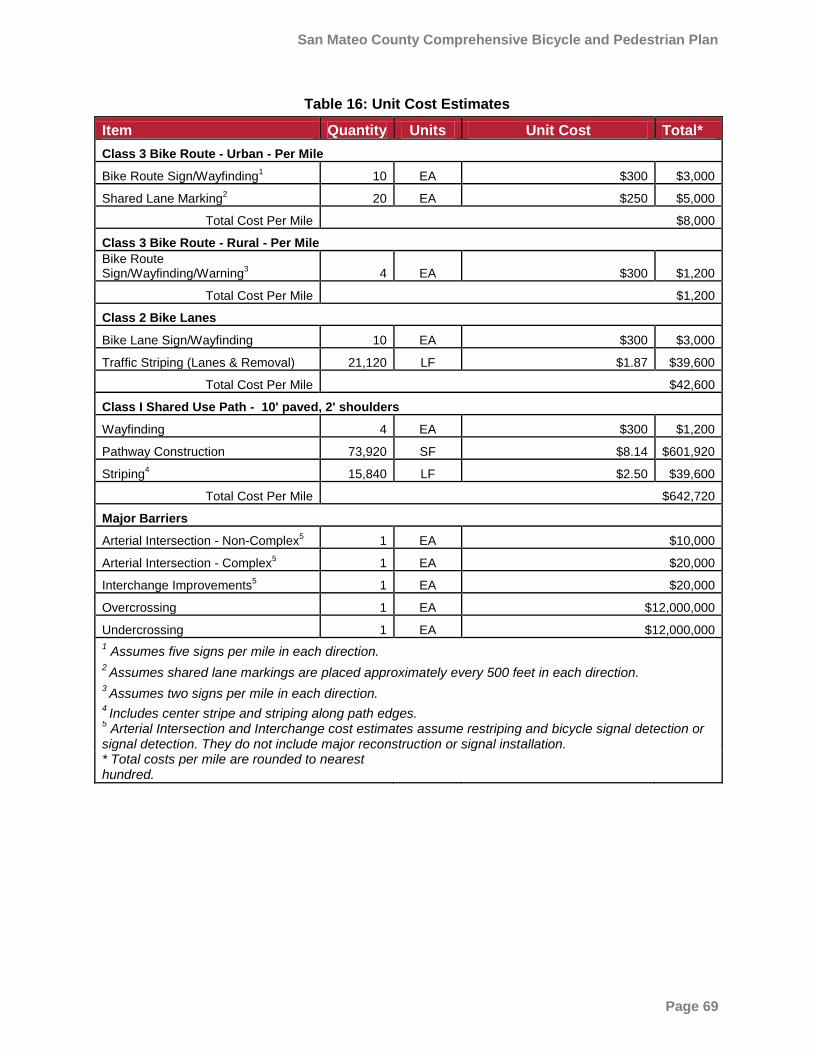
San Mateo County Comprehensive Bicycle and Pedestrian Plan
Page 69
Table 16: Unit Cost Estimates
Item Quantity Units Unit Cost Total*
Class 3 Bike Route - Urban - Per Mile
Bike Route Sign/Wayfinding1 10 EA $300 $3,000
Shared Lane Marking2 20 EA $250 $5,000
Total Cost Per Mile $8,000
Class 3 Bike Route - Rural - Per Mile
Bike Route Sign/Wayfinding/Warning
3 4 EA $300 $1,200
Total Cost Per Mile $1,200
Class 2 Bike Lanes
Bike Lane Sign/Wayfinding 10 EA $300 $3,000
Traffic Striping (Lanes & Removal) 21,120 LF $1.87 $39,600
Total Cost Per Mile $42,600
Class I Shared Use Path - 10' paved, 2' shoulders
Wayfinding 4 EA $300 $1,200
Pathway Construction 73,920 SF $8.14 $601,920
Striping4 15,840 LF $2.50 $39,600
Total Cost Per Mile $642,720
Major Barriers
Arterial Intersection - Non-Complex5 1 EA $10,000
Arterial Intersection - Complex5 1 EA $20,000
Interchange Improvements5 1 EA $20,000
Overcrossing 1 EA $12,000,000
Undercrossing 1 EA $12,000,000
1 Assumes five signs per mile in each direction.
2 Assumes shared lane markings are placed approximately every 500 feet in each direction.
3 Assumes two signs per mile in each direction.
4 Includes center stripe and striping along path edges.
5 Arterial Intersection and Interchange cost estimates assume restriping and bicycle signal detection or
signal detection. They do not include major reconstruction or signal installation. * Total costs per mile are rounded to nearest hundred.

Countywide Bikeway Network
City/
Page 70
This page left intentionally blank.
San Mateo County Comprehensive Bicycle and Pedestrian Plan
Page 71
7 Pedestrian Focus Areas
7.1 Introduction Pedestrians have a more limited mobility range than other transportation users. Unlike bicyclists and drivers,
pedestrians do not typically travel long distances and instead are concentrated in local, accessible areas with
short, direct routes. Consequently, rather than describing a countywide network of facilities this chapter
identifies pedestrian areas with high pedestrian demand and includes a methodology to use when evaluating
projects in these high demand areas.
7.2 Pedestrian Focus Areas
The pedestrian demand analysis42 described in Chapter 5 identifies areas of high pedestrian demand. To
simplify project tracking and to guide local agencies in developing pedestrian projects, the CBPP establishes
eight Focus Areas for pedestrians, described below.
Jurisdictions may wish to consider land use and development policies within these Focus Areas that support
pedestrian activity. Such policies may include requiring new and redeveloped areas to include walking access,
connecting existing cul-de-sacs, dead ends or long blocks with paseos, limiting block size, and encouraging a
dense accessible mix of land uses and services.
Downtown Area Improvements
Downtown areas within San Mateo County generally have high levels of walking activity. As a result, many
downtown areas also have excellent pedestrian facilities- wide sidewalks, attractive landscaping and frequent,
high-visibility crosswalks. However, there are many locations with moderate to high levels of walking demand
that do not have high quality walking environments. These areas would benefit from additional improvements
that encourage walking, since a greater number of people would benefit, and such improvements can have a
significant economic impact on the community.
Projects in this Focus Area should consist of improvements to pedestrian environments and connections on
streets and corridors where there would be a substantial benefit from enhanced facilities. Sidewalks should
ideally include a planted/furniture zone, a wide pedestrian through zone, and a frontage zone. Communities
may consider pedestrian plazas, peripheral parking, congestion-priced parking and other emerging designs
and programs to enhance the environment and encourage pedestrian activity.
El Camino Real Corridor Improvements
Improvements to the El Camino Real corridor are critical for increasing and encouraging walking in the
county. In addition to running through many downtown areas and commercial districts, many Caltrain
stations are located near El Camino Real. Population and employment densities on the corridor are also very
high relative to most other areas in the county.
While El Camino Real currently has signalized crossings in some locations, controlled crossing opportunities
are not well spaced for pedestrians, which results in the corridor being a substantial barrier to walking,
despite high demand.
42
The results of this model are also described in Appendix C, which also includes detailed maps of expected walking demand ―PedIndex‖ score on each street.
Pedestrian Focus Areas
City/
Page 72
Projects in this Focus Area should make crossings more frequent, safer and more convenient and enhance the
experience of walking along the corridor, particularly where ground floor retail is located. Sidewalks should
ideally include a planting or furniture zone, a wide pedestrian through zone, and a frontage zone.
The Grand Boulevard Initiative is an ongoing multi-jurisdictional effort to improve transportation conditions
for all modes on El Camino Real, including walking. Key goals of the Grand Boulevard Initiative are to create a
pedestrian-oriented environment and improve the corridor‘s streetscape design. The CBPP complements the
goals of the Grand Boulevard Initiative for the El Camino Real corridor. The CBPP‘s companion document, A
Resource Guide for the Education, Promotion, Funding, and Design of Pedestrian and Bicycle Facilities, provides design
guidance for introducing additional pedestrian crossings and promoting a convenient and comfortable
sidewalk network along the corridor – in particular around Caltrain and BART stations.
Highway 1/Coastal Trail/Parallel Trail Improvements
The Highway 1 corridor runs north to south along the western part of San Mateo County. The corridor
includes several town centers and provides access to many state parks and beaches. In many places,
pedestrian access along the Highway 1 corridor is limited by infrequent crossing opportunities, heavy traffic
volumes, high vehicle speeds and unimproved pedestrian facilities. As a result, there is substantial need for
improvements along certain sections of the corridor.
The Parallel Trail and the Coastal Trail improvements will provide pedestrian facilities where few currently
exist. The Parallel Trail runs along Highway 1 from Montara to Half Moon Bay and consists of Class I Bike
Paths and Class II Bike Lanes. The Coastal Trail consists of Class I Bike Paths, Class II Bike Lanes, Class III
Bike Routes, and unpaved dirt trails.
Improvements in this Focus Area will generally consist of new walking pathways along Highway 1 and new or
enhanced crossing opportunities. Design treatments in the mid-coast section between Pacifica and Half Moon
Bay will follow the guidelines set forth in the Highway 1 Safety and Mobility Improvement Study, which identifies
barriers to multimodal travel on the corridor and proposes context-sensitive design standards.
Major Barrier Crossings
Barrier crossings are defined as improved connections across physical barriers to walking, and may include
traditional grade-separated crossings of freeways, railroads and waterways, in addition to large arterials such
as Woodside Road. Providing connections across major barriers is beneficial for both bicyclists and
pedestrians. New or improved crossings for pedestrians are especially beneficial where they would connect
separated areas with high levels of walking demand such as major employment centers. Additionally, new or
reconstructed freeway interchanges can benefit from additional design improvements to encourage safe
convenient pedestrian and bicycle access or dedicated bicycle and pedestrian overcrossings.
As a first step, existing roadway crossings of major barriers should be upgraded to provide improved
pedestrian access via wide sidewalks and other improvements. Grade-separated pedestrian and bicycle
crossings may be considered where anticipated use will be high and no alternative at-grade option exists. Use
of a grade-separation is highly sensitive to the time it takes compared to an alternative at-grade crossing, with
less than 20 percent of pedestrians using a crossing if it takes 50 percent longer than the at-grade crossing.43
43 AASHTO Guide for the Planning, Design, and Operation of Pedestrian Facilities. (2004) page 96, cited from ITE study, ―Pedestrian Use of Bridges/Tunnels Based on Convenience.‖ (1998).
San Mateo County Comprehensive Bicycle and Pedestrian Plan
Page 73
Projects in this Focus Area will generally consist of pedestrian over- and undercrossings, improvements to at-
grade arterial intersections, and pedestrian-related improvements to interchanges associated with the
following: Highway 1, Highway 101, Highway 280, Highway 92, Highway 84/Woodside Road, Highway 380,
Caltrain, future high-speed rail, major creeks or waterways.
Safe Routes to School
Safe Route to School improvements facilitate walking and bicycling access to schools in San Mateo County.
The area within a one-mile radius of a school is considered the highest priority for Safe Routes to School
infrastructure improvements. Projects in this Focus Area may include the addition of bulb-outs at
intersections along recommended school access routes, development of improved pedestrian crossings, and
traffic calming measures to help reduce motor vehicle speeds.
Other types of Safe Routes to School improvements, including educational programs, are described in detail in
the CBPP‘s companion document, A Resource Guide for the Education, Promotion, Funding, and Design of Pedestrian and
Bicycle Facilities. State and federal Safe Routes to School funding is available, and C/CAG is developing a
program for distribution of county-level Safe Routes to School funding.
Safe Routes to Transit
Pedestrian access to transit hubs is critical for encouraging transit ridership. Stations that are isolated by
freeways or busy arterials or have no safe or convenient walkways between residential areas and transit stops
should be prioritized. Intersections and crossings near station areas can also be challenging and unpleasant to
navigate due to their location on busy arterials, and are priority locations for improvement. Projects within
this Focus Area will generally consist of sidewalks, wayfinding signage, intersection improvements within a
half-mile radius of Caltrain and BART stations and a quarter-mile of major bus lines, and bus stop and transit
station amenities that improve the pedestrian experience.
MTC‘s Safe Routes to Transit (SR2T) funding program, funded by Regional Measure 2 and administered by
TransForm and the East Bay Bicycle Coalition, provides additional funding sources for transit-related
projects. A Resource Guide for the Education, Promotion, Funding, and Design of Pedestrian and Bicycle Facilities describes
the SR2T program.
Access to County/Regional Activity Centers
Many county and regional activity centers would benefit from improved walking connections. These include
major hospitals, civic uses, employment districts, and parks, as well as rural town centers and neighborhood
shopping / commercial districts. Projects within this Focus Area will generally consist of new sidewalks,
intersection improvements, and crossing improvements.
Regional Trails
Regional trails provide key recreational and commute opportunities for pedestrians. All Class I paths
identified in the CBN are also considered Pedestrian Focus Areas. Trails of countywide significance include:
Bay Trail, Parallel Trail, Coastal Trail, Crystal Springs Regional Trail, and multi-use pathway portions of the
Bay to Ocean Trails as identified in the San Mateo County Trails Master Plan. Projects within this Focus Area
will consist of construction of new trails, upgrading existing trails, constructing trailheads, and roadway
crossing improvements along trails.
Table 17 summarizes Pedestrian Focus Areas and Figures 22 through 26 map the Focus Areas.
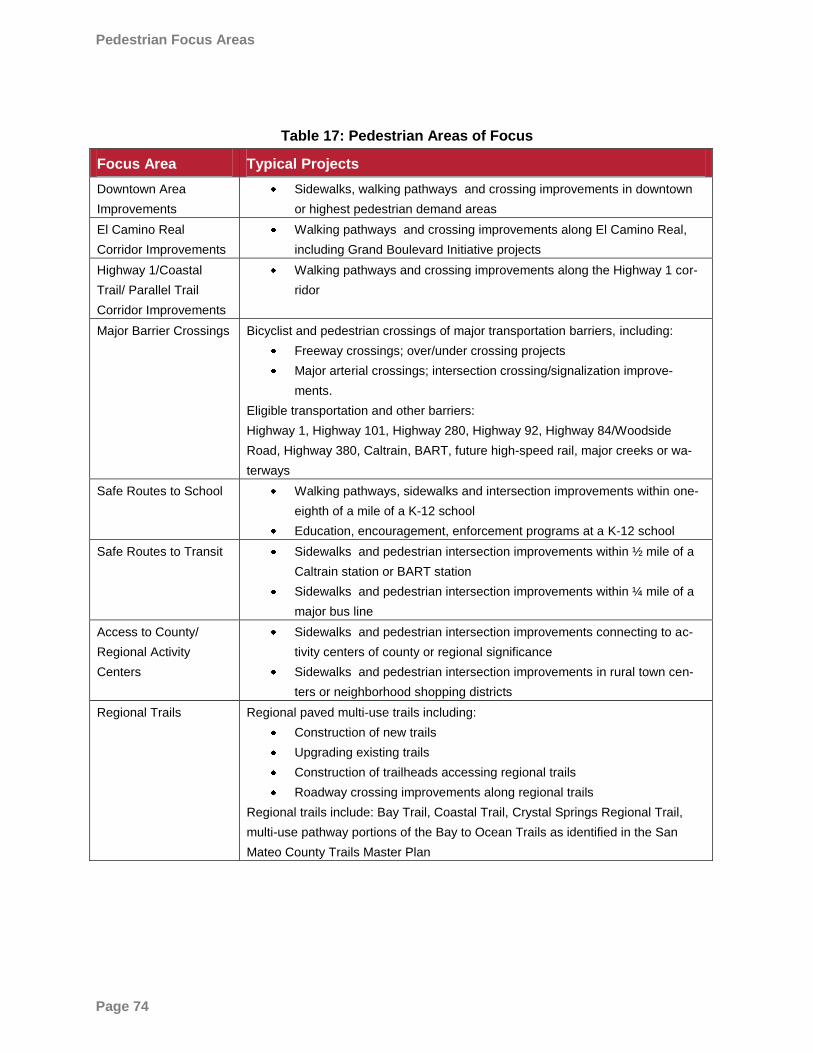
Pedestrian Focus Areas
City/
Page 74
Table 17: Pedestrian Areas of Focus
Focus Area Typical Projects
Downtown Area
Improvements
Sidewalks, walking pathways and crossing improvements in downtown
or highest pedestrian demand areas
El Camino Real
Corridor Improvements
Walking pathways and crossing improvements along El Camino Real,
including Grand Boulevard Initiative projects
Highway 1/Coastal
Trail/ Parallel Trail
Corridor Improvements
Walking pathways and crossing improvements along the Highway 1 cor-
ridor
Major Barrier Crossings Bicyclist and pedestrian crossings of major transportation barriers, including:
Freeway crossings; over/under crossing projects
Major arterial crossings; intersection crossing/signalization improve-
ments.
Eligible transportation and other barriers:
Highway 1, Highway 101, Highway 280, Highway 92, Highway 84/Woodside
Road, Highway 380, Caltrain, BART, future high-speed rail, major creeks or wa-
terways
Safe Routes to School Walking pathways, sidewalks and intersection improvements within one-
eighth of a mile of a K-12 school
Education, encouragement, enforcement programs at a K-12 school
Safe Routes to Transit Sidewalks and pedestrian intersection improvements within ½ mile of a
Caltrain station or BART station
Sidewalks and pedestrian intersection improvements within ¼ mile of a
major bus line
Access to County/
Regional Activity
Centers
Sidewalks and pedestrian intersection improvements connecting to ac-
tivity centers of county or regional significance
Sidewalks and pedestrian intersection improvements in rural town cen-
ters or neighborhood shopping districts
Regional Trails Regional paved multi-use trails including:
Construction of new trails
Upgrading existing trails
Construction of trailheads accessing regional trails
Roadway crossing improvements along regional trails
Regional trails include: Bay Trail, Coastal Trail, Crystal Springs Regional Trail,
multi-use pathway portions of the Bay to Ocean Trails as identified in the San
Mateo County Trails Master Plan
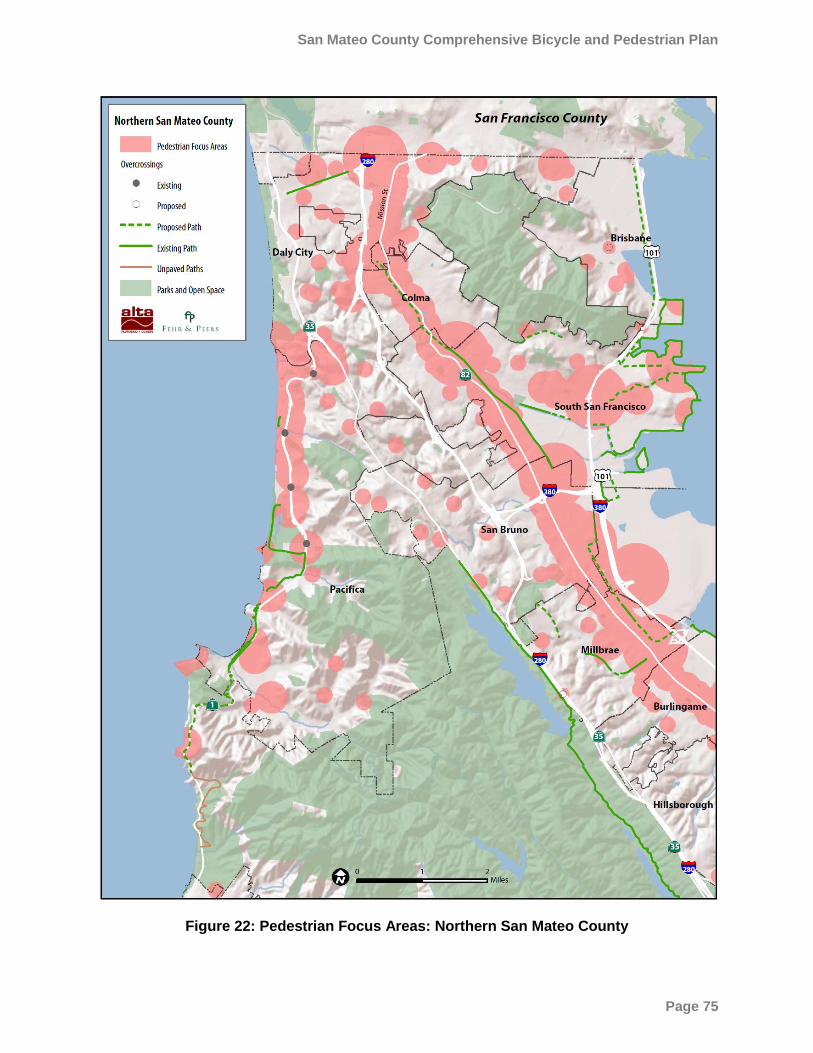
San Mateo County Comprehensive Bicycle and Pedestrian Plan
Page 75
Figure 22: Pedestrian Focus Areas: Northern San Mateo County
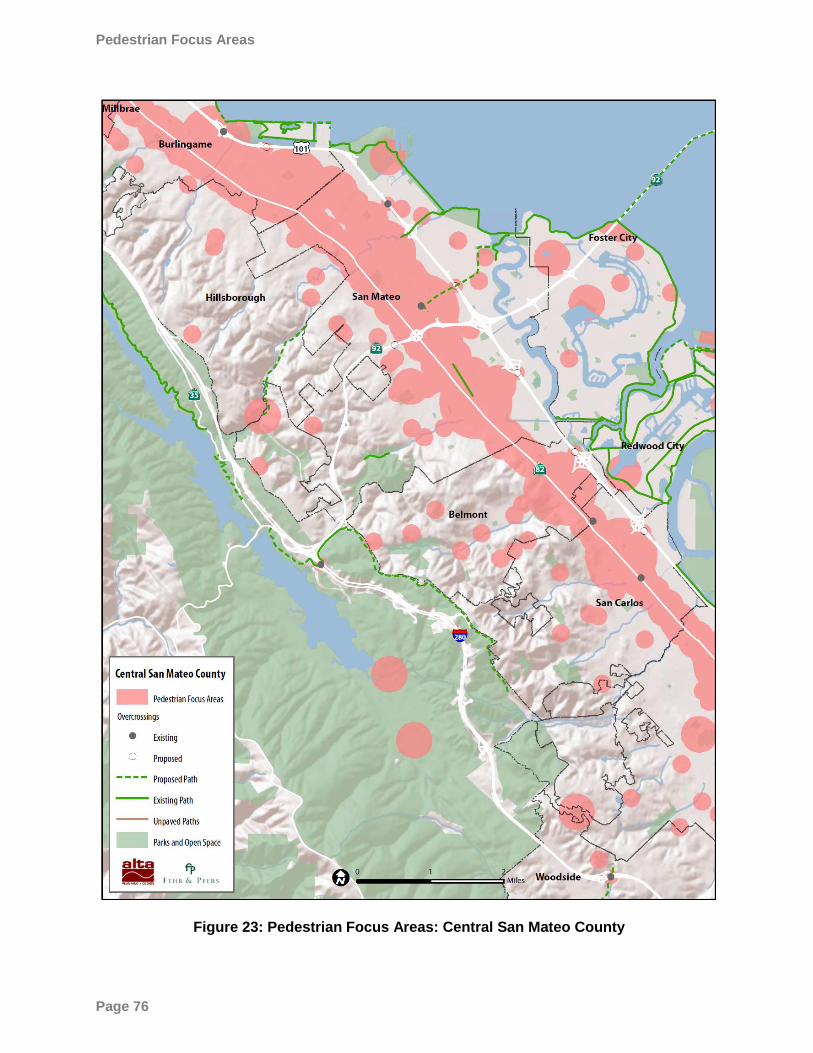
Pedestrian Focus Areas
City/
Page 76
Figure 23: Pedestrian Focus Areas: Central San Mateo County
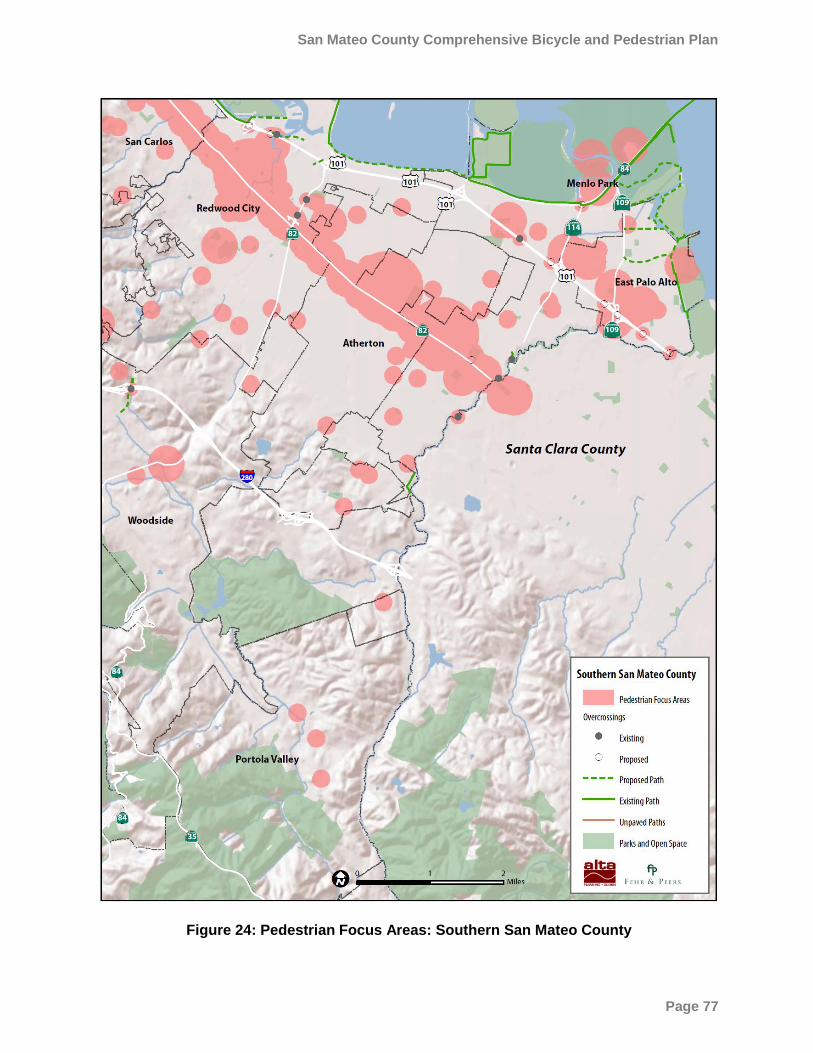
San Mateo County Comprehensive Bicycle and Pedestrian Plan
Page 77
Figure 24: Pedestrian Focus Areas: Southern San Mateo County
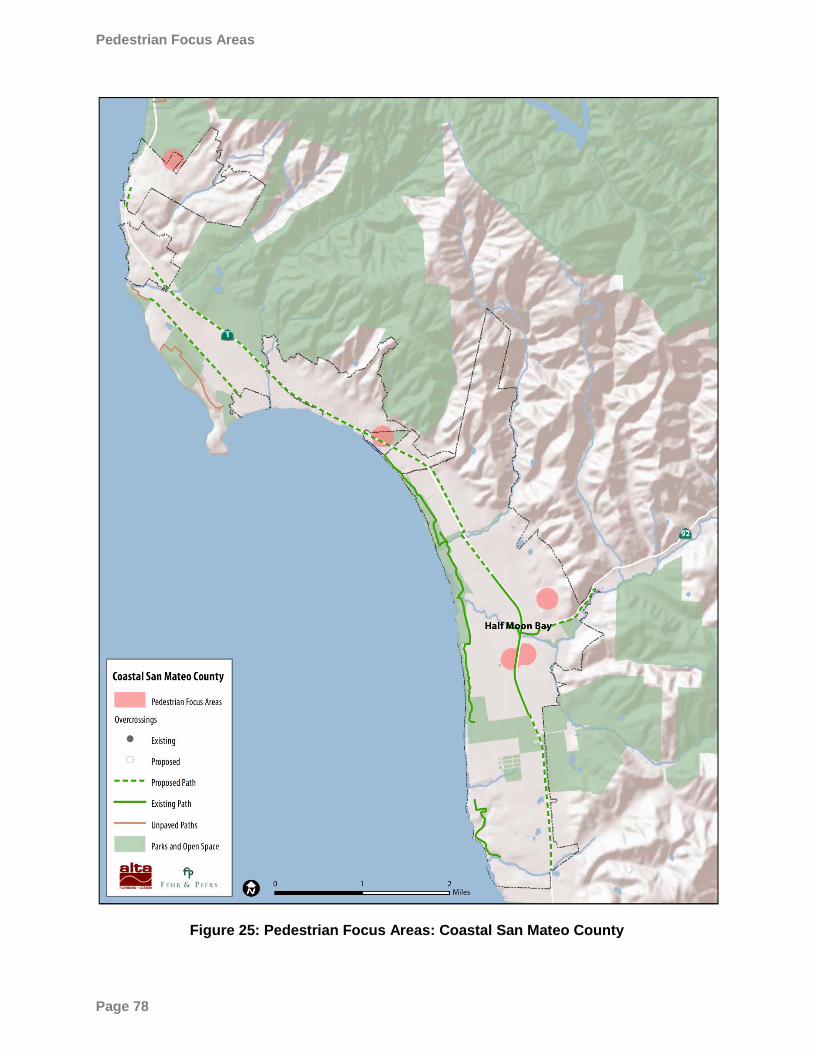
Pedestrian Focus Areas
City/
Page 78
Figure 25: Pedestrian Focus Areas: Coastal San Mateo County
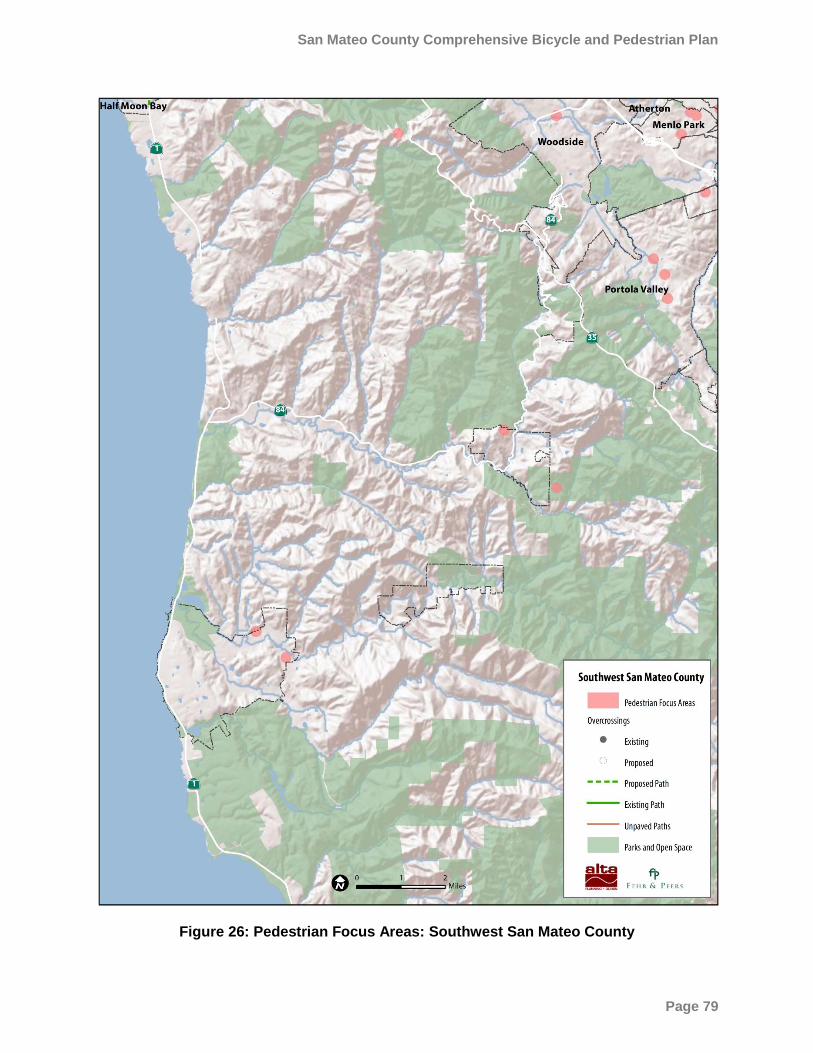
San Mateo County Comprehensive Bicycle and Pedestrian Plan
Page 79
Figure 26: Pedestrian Focus Areas: Southwest San Mateo County
Pedestrian Focus Areas
City/
Page 80
7.2.1 Designing for Pedestrian Improvements in Focus Areas
The eight Pedestrian Focus Areas encompass different land uses, different levels of pedestrian activity, and
different types of projects. As a result, the level of pedestrian improvement appropriate to each Focus Area
differs. Table 18, on the following pages, describes the minimum design guidelines for each Focus Area. In
some cases right-of-way, intersection capacity, or other constraints may preclude meeting these design
guidelines. However, towns, cities and the County should strive to provide pedestrian environments that meet
or exceed these guidelines whenever possible.
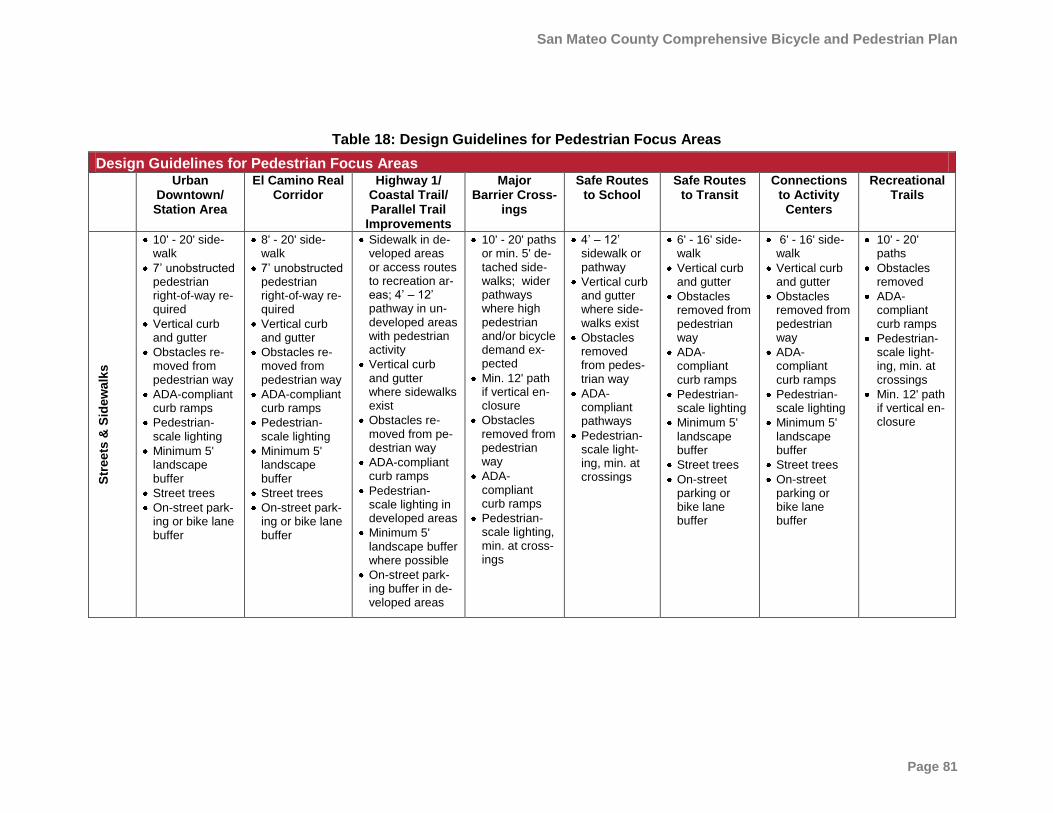
San Mateo County Comprehensive Bicycle and Pedestrian Plan
Page 81
Table 18: Design Guidelines for Pedestrian Focus Areas
Design Guidelines for Pedestrian Focus Areas Urban
Downtown/ Station Area
El Camino Real Corridor
Highway 1/ Coastal Trail/ Parallel Trail
Improvements
Major Barrier Cross-
ings
Safe Routes to School
Safe Routes to Transit
Connections to Activity
Centers
Recreational Trails
Str
eets
& S
idew
alk
s
10' - 20' side-walk
7’ unobstructed pedestrian right-of-way re-quired
Vertical curb and gutter
Obstacles re-moved from pedestrian way
ADA-compliant curb ramps
Pedestrian-scale lighting
Minimum 5' landscape buffer
Street trees
On-street park-ing or bike lane buffer
8' - 20' side-walk
7’ unobstructed pedestrian right-of-way re-quired
Vertical curb and gutter
Obstacles re-moved from pedestrian way
ADA-compliant curb ramps
Pedestrian-scale lighting
Minimum 5' landscape buffer
Street trees
On-street park-ing or bike lane buffer
Sidewalk in de-veloped areas or access routes to recreation ar-eas; 4’ – 12’ pathway in un-developed areas with pedestrian activity
Vertical curb and gutter where sidewalks exist
Obstacles re-moved from pe-destrian way
ADA-compliant curb ramps
Pedestrian-scale lighting in developed areas
Minimum 5' landscape buffer where possible
On-street park-ing buffer in de-veloped areas
10' - 20' paths or min. 5' de-tached side-walks; wider pathways where high pedestrian and/or bicycle demand ex-pected
Min. 12' path if vertical en-closure
Obstacles removed from pedestrian way
ADA-compliant curb ramps
Pedestrian-scale lighting, min. at cross-ings
4’ – 12’ sidewalk or pathway
Vertical curb and gutter where side-walks exist
Obstacles removed from pedes-trian way
ADA-compliant pathways
Pedestrian-scale light-ing, min. at crossings
6' - 16' side-walk
Vertical curb and gutter
Obstacles removed from pedestrian way
ADA-compliant curb ramps
Pedestrian-scale lighting
Minimum 5' landscape buffer
Street trees
On-street parking or bike lane buffer
6' - 16' side-walk
Vertical curb and gutter
Obstacles removed from pedestrian way
ADA-compliant curb ramps
Pedestrian-scale lighting
Minimum 5' landscape buffer
Street trees
On-street parking or bike lane buffer
10' - 20' paths
Obstacles removed
ADA-compliant curb ramps
Pedestrian-scale light-ing, min. at crossings
Min. 12' path if vertical en-closure
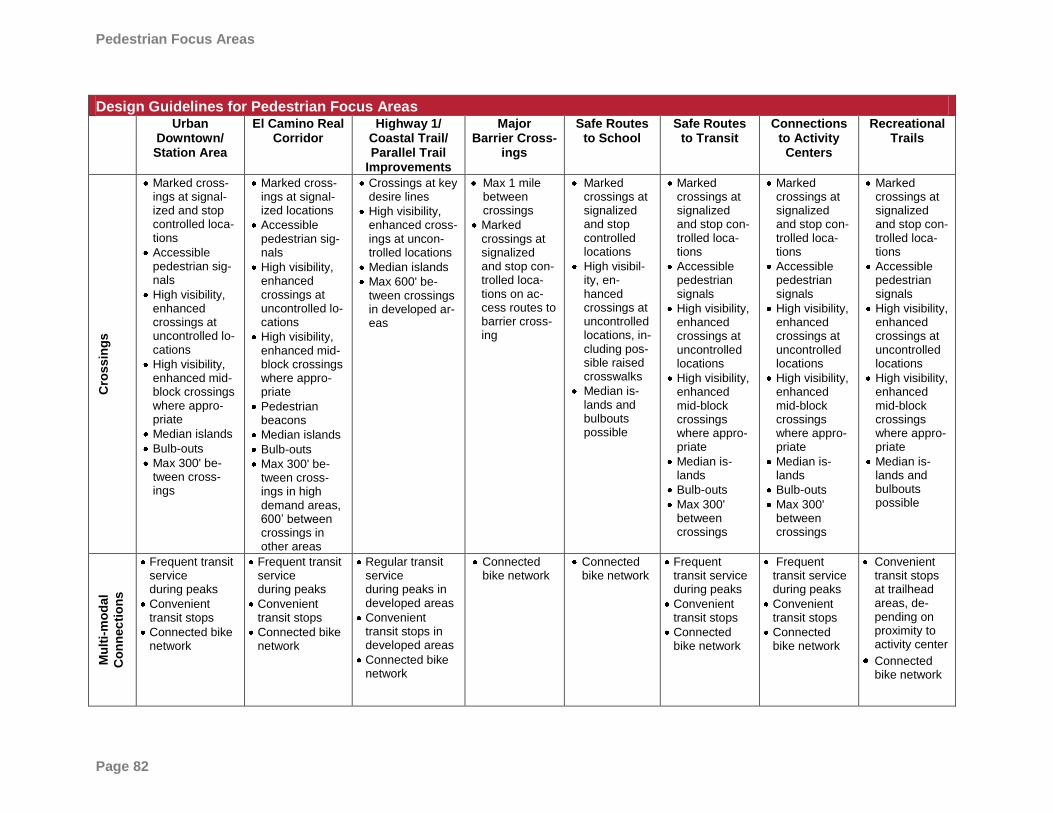
Pedestrian Focus Areas
City/
Page 82
Design Guidelines for Pedestrian Focus Areas Urban
Downtown/ Station Area
El Camino Real Corridor
Highway 1/ Coastal Trail/ Parallel Trail
Improvements
Major Barrier Cross-
ings
Safe Routes to School
Safe Routes to Transit
Connections to Activity
Centers
Recreational Trails
Cro
ssin
gs
Marked cross-ings at signal-ized and stop controlled loca-tions
Accessible pedestrian sig-nals
High visibility, enhanced crossings at uncontrolled lo-cations
High visibility, enhanced mid-block crossings where appro-priate
Median islands
Bulb-outs
Max 300' be-tween cross-ings
Marked cross-ings at signal-ized locations
Accessible pedestrian sig-nals
High visibility, enhanced crossings at uncontrolled lo-cations
High visibility, enhanced mid-block crossings where appro-priate
Pedestrian beacons
Median islands
Bulb-outs
Max 300' be-tween cross-ings in high demand areas, 600’ between crossings in other areas
Crossings at key desire lines
High visibility, enhanced cross-ings at uncon-trolled locations
Median islands
Max 600' be-tween crossings in developed ar-eas
Max 1 mile between crossings
Marked crossings at signalized and stop con-trolled loca-tions on ac-cess routes to barrier cross-ing
Marked crossings at signalized and stop controlled locations
High visibil-ity, en-hanced crossings at uncontrolled locations, in-cluding pos-sible raised crosswalks
Median is-lands and bulbouts possible
Marked crossings at signalized and stop con-trolled loca-tions
Accessible pedestrian signals
High visibility, enhanced crossings at uncontrolled locations
High visibility, enhanced mid-block crossings where appro-priate
Median is-lands
Bulb-outs
Max 300' between crossings
Marked crossings at signalized and stop con-trolled loca-tions
Accessible pedestrian signals
High visibility, enhanced crossings at uncontrolled locations
High visibility, enhanced mid-block crossings where appro-priate
Median is-lands
Bulb-outs
Max 300' between crossings
Marked crossings at signalized and stop con-trolled loca-tions
Accessible pedestrian signals
High visibility, enhanced crossings at uncontrolled locations
High visibility, enhanced mid-block crossings where appro-priate
Median is-lands and bulbouts possible
Mu
lti-
mo
dal
Co
nn
ec
tio
ns
Frequent transit service during peaks
Convenient transit stops
Connected bike network
Frequent transit service during peaks
Convenient transit stops
Connected bike network
Regular transit service during peaks in developed areas
Convenient transit stops in developed areas
Connected bike network
Connected bike network
Connected bike network
Frequent transit service during peaks
Convenient transit stops
Connected bike network
Frequent transit service during peaks
Convenient transit stops
Connected bike network
Convenient transit stops at trailhead areas, de-pending on proximity to activity center
Connected bike network
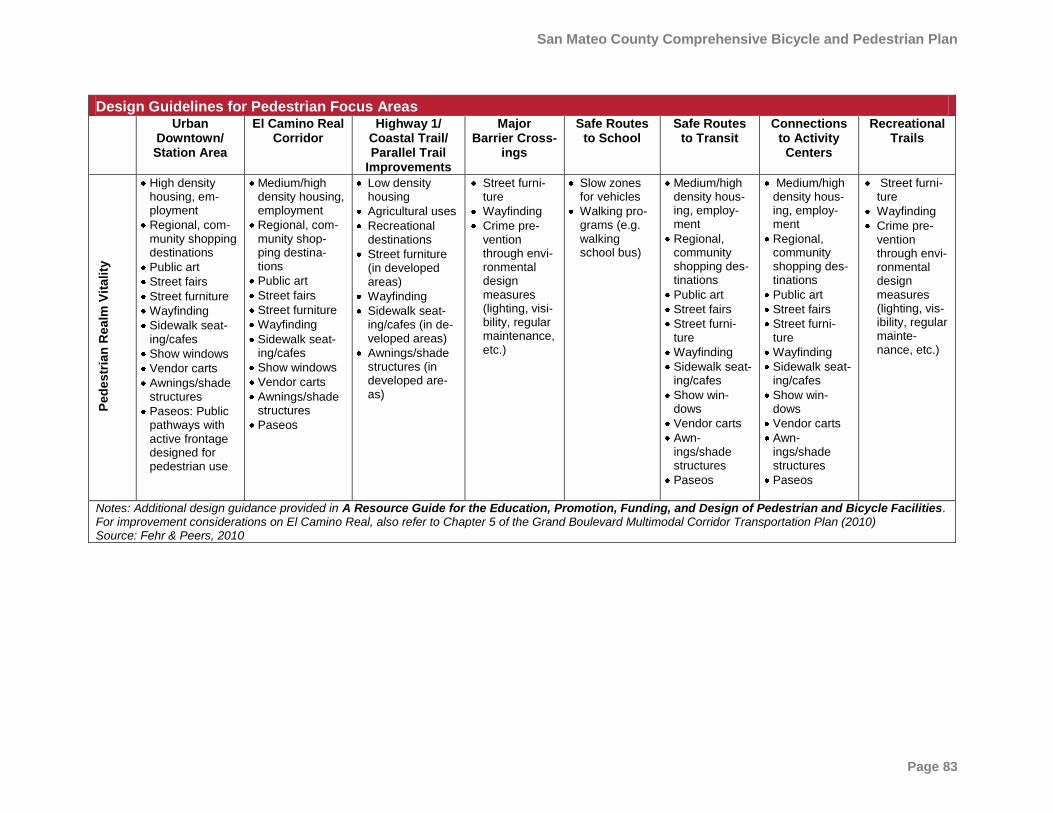
San Mateo County Comprehensive Bicycle and Pedestrian Plan
Page 83
Design Guidelines for Pedestrian Focus Areas Urban
Downtown/ Station Area
El Camino Real Corridor
Highway 1/ Coastal Trail/ Parallel Trail
Improvements
Major Barrier Cross-
ings
Safe Routes to School
Safe Routes to Transit
Connections to Activity
Centers
Recreational Trails
Ped
estr
ian
Realm
Vit
ality
High density housing, em-ployment
Regional, com-munity shopping destinations
Public art
Street fairs
Street furniture
Wayfinding
Sidewalk seat-ing/cafes
Show windows
Vendor carts
Awnings/shade structures
Paseos: Public pathways with active frontage designed for pedestrian use
Medium/high density housing, employment
Regional, com-munity shop-ping destina-tions
Public art
Street fairs
Street furniture
Wayfinding
Sidewalk seat-ing/cafes
Show windows
Vendor carts
Awnings/shade structures
Paseos
Low density housing
Agricultural uses
Recreational destinations
Street furniture (in developed areas)
Wayfinding
Sidewalk seat-ing/cafes (in de-veloped areas)
Awnings/shade structures (in developed are-as)
Street furni-ture
Wayfinding
Crime pre-vention through envi-ronmental design measures (lighting, visi-bility, regular maintenance, etc.)
Slow zones for vehicles
Walking pro-grams (e.g. walking school bus)
Medium/high density hous-ing, employ-ment
Regional, community shopping des-tinations
Public art
Street fairs
Street furni-ture
Wayfinding
Sidewalk seat-ing/cafes
Show win-dows
Vendor carts
Awn-ings/shade structures
Paseos
Medium/high density hous-ing, employ-ment
Regional, community shopping des-tinations
Public art
Street fairs
Street furni-ture
Wayfinding
Sidewalk seat-ing/cafes
Show win-dows
Vendor carts
Awn-ings/shade structures
Paseos
Street furni-ture
Wayfinding
Crime pre-vention through envi-ronmental design measures (lighting, vis-ibility, regular mainte-nance, etc.)
Notes: Additional design guidance provided in A Resource Guide for the Education, Promotion, Funding, and Design of Pedestrian and Bicycle Facilities. For improvement considerations on El Camino Real, also refer to Chapter 5 of the Grand Boulevard Multimodal Corridor Transportation Plan (2010) Source: Fehr & Peers, 2010
Pedestrian Focus Areas
City/
Page 84
7.3 Recommended Pedestrian Prioritization Criteria Specific pedestrian projects identified by this plan – pedestrian and bicycle overcrossings and undercrossings,
and multi-use pathways – are identified in Chapter 6, Countywide Bikeway Network. The CBPP defers to
local agencies to identify other pedestrian projects, such as new sidewalks, crossing improvements, and
improved streetscape design. This section describes criteria that can be used to prioritize these other
pedestrian projects during the funding process. These criteria reflect the goals and policies of the CBPP, and
ask the following questions:
Does the project fall within a pedestrian focus area?
Is the project consistent with relevant pedestrian design guidelines and pedestrian focus area charac-
teristics?
Does the project improve pedestrian safety?
Does the project target people with disabilities, children, seniors, or an underserved population?
7.3.1 Improvement Located in a Pedestrian Focus Area
Projects located in Pedestrian Focus Areas described in Section 7.2 should be encouraged.
Pedestrian Focus Areas encompass key pedestrian activity areas within the County, and the CBPP has
identified these locations for pedestrian improvements. Projects in Focus Areas will affect a large number of
pedestrians where the need for improvements may be greatest. They include downtowns, El Camino Real,
Highway 1, major barrier crossings, school areas, transit stops, and access to destinations of countywide
significance.
This criterion supports CBPP Policies 2.3 and 2.4.
7.3.2 Consistency with Design Guidelines and Complete Streets Policies Projects that meet or exceed the design guidelines listed in Table 18, should be emphasized.
For additional reference, the Pedestrian Design Guidelines included in the CBPP companion document A
Resource Guide for the Education, Promotion, Funding, and Design of Pedestrian and Bicycle Facilities are intended to
provide a toolbox of potential strategies to improve walking conditions. These Guidelines were developed to
be consistent with Complete Streets and Routine Accommodations policies. They also provide references to
other useful design guidance for pedestrian facilities, such as the San Mateo County Sustainable Green Streets and
Parking Lots Design Guidebook (2009).
This criterion supports CBPP Policies 4.1, 4.2, and 4.5.
7.3.3 Pedestrian Safety Projects that improve pedestrian safety, either at a high-collision location or through best practices in
pedestrian design should be prioritized over those that do not.
A high rate of pedestrian injuries and fatalities suggest the pedestrian realm is an undesirable place to travel
and may benefit from enhanced pedestrian facilities focusing on safety. While the total number of police-
reported pedestrian collisions in a given area is readily available, it is often difficult to establish a rate –
pedestrian collisions per pedestrian exposed to motor vehicles. Local agencies can collect counts of pedestrian
San Mateo County Comprehensive Bicycle and Pedestrian Plan
Page 85
exposure to establish the rate, or can refer to the estimated pedestrian demand maps included as an appendix
to the CBPP.
This criterion supports CBPP Policy 3.1 and 3.4.
7.3.4 Target Demographics Projects that target seniors, youth, people with disabilities, and low-income communities and individuals
should be prioritized over those that do not.
Several key demographic groups would benefit significantly from improved pedestrian infrastructure. They
include people with disabilities, children, seniors, and people living in underserved communities. People with
disabilities often require a connected transportation network that meets or exceeds ADA guidelines. Children
and seniors are more at risk of being injured or killed in a car crash than other age groups. In San Mateo
County, people with low incomes are also much more likely to walk than other income groups.
This criterion supports CBPP Policies 2.2, 2.3, 2.7 and 3.1.
Pedestrian Focus Areas
City/
Page 86
This page intentionally left blank.
San Mateo County Comprehensive Bicycle and Pedestrian Plan
Page 87
8 Implementation Strategy
8.1 Introduction The CBPP identifies bicycle and pedestrian projects of countywide significance through the Countywide
Bikeway Network (CBN) and Pedestrian Focus Areas. Realization of the bicycle and pedestrian projects
described in this plan requires continued collaboration between the cities, County, C/CAG, San Mateo
County Transportation Authority, and Caltrans.
8.2 Local Implementing Agency Role
Local cities and San Mateo County will need to design, construct and maintain the bicycle and pedestrian
infrastructure. The CBN is drawn from the bike plans and proposed projects of local agencies. Local agencies
should refer to the detailed project tables and detailed maps provided in Appendices A and B, respectively.
The Pedestrian Focus Areas are described in Chapter 7 of this plan. Local agencies should refer to those Focus
Areas when identifying pedestrian projects that are eligible for countywide funding.
8.2.1 Construction Funding
Cities and the County have limited funds available to construct and maintain all infrastructure, including
bicycle and pedestrian projects. Many local implementing agencies will rely on grant funding to construct
projects recommended in the CBPP. Maximum grant awards for bicycle and pedestrian projects tend to be
low—ranging up to a million dollars. More costly projects recommended in the CBPP will need to be phased
over time or integrated into larger transportation projects. For example, proposed pedestrian
over/undercrossings identified in the CBPP should be constructed as part of any freeway widening project and
proposed bicycle lanes should be striped when a roadway is scheduled for routine repaving.
Cities and the County may also consider funding bicycle and pedestrian infrastructure identified in the CBPP
as part of conditions of development, based on the impact the development has on bicycle and pedestrian
circulation. Pedestrian streetscape improvements can be codified in city design guidelines and constructed
with new development or redevelopment.
Other local sources of construction funding include creating an assessment district or business improvement
district to fund construction and maintenance costs.
8.2.2 Maintenance Funding
New bicycle and pedestrian projects will increase costs of operations and maintenance for local implementing
agencies. Maintenance and operations for on-street bikeways can typically be rolled into existing street
sweeping and repaving programs, but maintenance of sidewalks, pathways, bridges and undercrossings will
require significant additional resources.
Ideally, funding for maintenance and operations should be secured before local implementing agencies decide
to construct new bicycle or pedestrian infrastructure. As grant funding is generally not available for on-going
costs of maintenance and operations, local implementing agencies will need to identify local revenues to fund
these activities. Local funding mechanisms for maintenance include development of a local assessment
district, business improvement district, community facilities district, and requiring property owners to
Implementation Strategy
City/
Page 88
maintain adjacent sidewalks and pathways. Any funding source should include an automatic increase linked
to inflation and bring in enough to support a reserve fund for larger maintenance needs, such as emergency
repair, path resurfacing, or bridge replacement.
Local implementing agencies may also consider volunteer community-based maintenance and patrols for
pathways, and adopt-a-trail programs. The costs of administering these programs should be weighed against
the benefits of reduced maintenance and operations costs.
8.2.3 Projects on Caltrans Roadways
The CBPP recommends bicycle and pedestrian projects on Caltrans-owned roadways, including Woodside
Road (SR 84), El Camino Real (SR 82), Highway 1, Highway 92, Skyline Boulevard (SR35), as well as bicycle
and pedestrian under and over crossings across Highway 101 and Interstate 280. Local implementing agencies
will need to work with Caltrans to encourage the agency to design and construct bicycle and pedestrian
improvements along these roadways, in accordance with Caltrans‘ routine accommodation policy.
8.2.4 Other Resources for Local Implementing Agencies
The CBPP includes a companion document intended to assist San Mateo County‘s cities and County in
designing and funding bicycle and pedestrian infrastructure, and developing programs to support walking and
bicycling. This document, A Resource Guide for the Education, Promotion, Funding, and Design of Pedestrian and Bicycle
Facilities contains the following information:
Education, Safety, and Promotion Guidebook – provides description and cost estimates of proven
programs to support walking and biking
Funding Sources – summarizes local, county, regional, state and Federal funding sources that can be
used for development of bicycle and pedestrian infrastructure and programs
Pedestrian Design Guidelines – illustrates best practices for pedestrian design, including innovative
designs
Bicycle Design Guidelines – illustrates best practices for bicycle design, including innovative designs
8.3 C/CAG and SMCTA Roles
C/CAG provides countywide-level guidance in assisting local jurisdictions to implement bicycle and
pedestrian projects and programs, and most importantly, provides funding for bicycle and pedestrian
improvements within the County. The cities, County and other transportation agencies are responsible for
bringing projects forward. C/CAG and SMCTA provide funding to the projects that best meet the guidelines
established by the CBPP and the specific call for project criteria.
It is recognized that there are benefits in increasing bicycle and pedestrian coordination between jurisdictions
in the County such as providing an expanded website with bicycle and pedestrian information to serve San
Mateo County stakeholders, collaborating with local agencies to implement demonstration projects to show-
case bicycling and walking, and strengthening the oversight of routine accommodation requirements by en-
couraging project sponsors to consider the bicyclists and pedestrian needs early on during the project devel-
opment and planning process, as appropriate.
San Mateo County Comprehensive Bicycle and Pedestrian Plan
Page 89
8.3.1 Funding the CBPP
C/CAG‘s and SMCTA‘s primary role with respect to implementation of the CBPP is to provide funding to the
twenty cities and the County for bicycle and pedestrian specific projects that are on the CBN and within the
Pedestrian Focus Areas. The CBPP and resulting project list provides local jurisdictions information for
determining projects to sponsor for funding through the Transportation Development Act (TDA) Article 3,
Measure A, and other state and federal funding opportunities.
C/CAG is responsible for distributing TDA Article 3 and Regional Bicycle Program (RBP) funds for bicycle
projects within the County. C/CAG, as part of the funding process, is also responsible for developing a process
to solicit projects from the local jurisdictions, encouraging submission of project applications, and evaluating
and prioritizing projects.
The SMCTA administers the Measure A funds for transportation projects and programs in San Mateo County.
The new Measure A includes a Pedestrian and Bicycle Program category that provides funding for
construction of facilities for bicyclists and pedestrians. The goal of the category is to fund infrastructure
projects that encourage and improve bicycling and walking conditions in San Mateo County. Annually, three
percent (3%) of the new Measure A sales tax revenues are set aside for Pedestrian and Bicycle Program. The
Pedestrian and Bicycle Program call for projects is conducted biennially.
8.3.2 CBPP Recommended Projects
For individual bicycle related projects, the CBPP‘s established categories will be utilized to help facilitate the
process of distributing limited local funds. All bicycle projects within the three catgegories will be considered
for funding. Since there is a wide array of pedestrian related projects, projects within the Pedestrian Focus
Areas would receive higher consideration for funding over projects in areas not defined in the CBPP.
8.3.3 Implementation Approach
Ultimately, the 20 cities and the County will plan, design, construct, and maintain the bicycle and pedestrian
projects identified in this Plan. These recommended projects, located throughout San Mateo County, address
different needs and requirements, vary in type, size and cost, and would be implemented by the jurisdictions
in phases and over multiple years. Most of the individual projects are already identified in the CBPP in some
level of detail, by either a specific location or located within a focus area. To facilitate the implementation of
these projects, C/CAG and the SMCTA will work collaboratively with the cities and County. It is important
to keep in mind that both pedestrian and bicycle projects are eligible for funding. The call for projects and
selection system should be sensitive to this such that a reasonable balance between pedestrian and bicycle
projects is achieved each funding cycle.
The SMCTA and C/CAG will commit to using a focused implementation strategy to complete projects in a
more structured manner. By utilizing a focus it also provides direction to prospective applicants on the
projects desired for funding. This may help advance key projects since neither C/CAG or SMCTA are
typically project sponsors.
The proposed strategy is to further group the projects by types, focus areas, and key corridors. The general
project groups would be associated and linked with current regional and countywide transportation planning
efforts including the Grand Boulevard Initiative, US 101 Corridor System Management Plan, Sustainable
Implementation Strategy
City/
Page 90
Communities Strategies, and other plans as applicable. Project groupings are included in the following
Implementation Categories and specific Project Types:
Address Broad Objectives
o Link Bicycle and Pedestrian crossings with major freeway improvement projects on US-101,
I-280, Hwy 84 and Hwy 92. Due to the cost of bicycle and pedestrian crossings, it is best to
fund them in conjunction with the major improvement project.
o Meet the needs of a broad variety of groups (i.e., seniors, people with disabilities, school chil-
dren, etc…)
o Projects co-sponsored by two or more jurisdictions
o Projects that serve multiple purposes
Address Specific Issues of Concern
o Safety deficiencies, particularly with motor vehicles
o Mitigate access barriers
o Improve key crossings across major highway and freeways
o Improve existing facilities (as opposed to constructing new facilities that expand the system)
o Add new facilities as needed to close gaps
Implement Specific Project Category
o Installation of signage along designated routes
o Smaller-sized projects that are ready for construction and relatively easy to implement
o Pedestrian crossings across El Camino Real
Corridor Connectivity and Gap Closures
o Completion of the Bay Trail
o Completion of signs for the N-S Bikeway
o Serve the primary connectivity needs between jurisdictions
SMCTA and C/CAG should take into consideration the above Implementation Categories when developing
the biennial bicycle and pedestrian funding program for the Measure A and TDA Article 3. One or more Im-
plementation Categories may be emphasized in any one program cycle. This emphasis essentially assigns an
additional preference layer and increases the opportunity for a particular project category to receive funding.
For each funding cycle that SMCTA and C/CAG administer, different Implementation Categories or Project
Types may be encouraged based on the number of eligible projects and availability of funds. A predetermined
amount of funds could be set aside towards specific Project Types.