Embed Size (px)
Citation preview
San Simon River Watershed – Arizona Rapid Watershed Assessment
June 2007
Prepared by: USDA Natural Resource Conservation Service – Arizona University of Arizona, Water Resources Research Center
In cooperation with:
Arizona Association of Conservation Districts Arizona Department of Agriculture
Arizona Department of Environmental Quality Arizona Department of Water Resources
Arizona Game & Fish Department Arizona State Land Department
USDA Forest Service USDI Bureau of Land Management

Released by:
Sharon Megdal Director
University of Arizona Water Resources Research Center
David McKay State Conservationist
U.S. Department of Agriculture Natural Resources Conservation Service
Additional Principal Investigators: Dino DeSimone – Natural Resources Conservation Service, Phoenix, Arizona Keith Larson – Natural Resources Conservation Service, Phoenix, Arizona Kristine Uhlman – Water Resources Research Center, University of Arizona D. Phil Guertin – School of Natural Resources, University of Arizona Deborah Young – Associate Director, Cooperative Extension, University of Arizona The United States Department of Agriculture (USDA) prohibits discrimination in all its programs and activities on the basis of race, color, national origin, gender, religion, age, disability, political beliefs, sexual orientation, and marital or family status. (Not all prohibited bases apply to all programs.) Persons with disabilities who require alternative means for communication of program information (Braille, large print, audiotape, etc.) should contact USDA’s TARGET Center at 202-720-2600 (voice and TDD). To file a complaint of discrimination, write USDA, Director, Office of Civil Rights, Room 326W, Whitten Building, 14th and Independence Avenue, SW, Washington, D.C., 20250-9410 or call (202) 720-5964 (voice or TDD). USDA is an equal employment opportunity provider and employer.

San Simon River – 15040006 8-Digit Hydrologic Unit
Rapid Watershed Assessment
Section 1: Introduction Overview of Rapid Watershed Assessments
A Rapid Watershed Assessment (RWA) is a concise report containing information on natural resource conditions and concerns within a designated watershed. The "rapid" part refers to a relatively short time period to develop the report as compared to a more comprehensive watershed planning effort. The “assessment” part refers to a report containing maps, tables and other information sufficient to give an overview of the watershed and for use as a building block for future planning. RWAs look at physical and socioeconomic characteristics and trends, as well as current and future conservation work.
The assessments involve the collection of readily available quantitative and qualitative information to develop a watershed profile, and sufficient analysis of that information to generate an appraisal of the conservation needs of the watershed. These assessments are conducted by conservation planners, using Geographic Information System (GIS) technology, assessing current levels of resource management, identifying priority resource concerns, and making estimates of future conservation work. Conservation Districts and other local leaders, along with public land management agencies, are involved in the assessment process.
An RWA can be used as a communication tool between the Natural Resources Conservation Service (NRCS) and partners for describing and prioritizing conservation work in selected watersheds. RWAs provide initial estimates of conservation investments needed to address the identified resource concerns in the watershed. RWAs serve as a platform for conservation program delivery, provide useful information for development of NRCS and Conservation District business plans, and lay a foundation for future watershed planning.
General Description of the San Simon River Watershed
The San Simon Watershed is located along the San Simon River in Cochise and Graham Counties in southeastern Arizona, and in Hidalgo County in southwestern New Mexico (Figure 1-1). The Watershed comprises 1,440,265 acres (2250 square miles) and is located about 90% in Arizona (Cochise and Graham Counties) and 10% in New Mexico (Hidalgo County). Forty-one percent of the land is managed by the Bureau of Land Management (BLM), 26% is State Trust Land, 19% is private land and 13% is managed by the U.S. Forest Service.
The watershed includes the Cities of San Simon, Portal, Bowie and Apache. Conservation assistance is provided through four Natural Resource Conservation Districts: Wilcox-San Simon, Gila Valley, and Whitewater Draw NRCDs in Arizona and Hidalgo SWCD in New Mexico. There are four U.S. Department of Agriculture (USDA) Service Centers in the area, located in
San Simon River Watershed Rapid Watershed Assessment Section 1 - Introduction page 1- 1
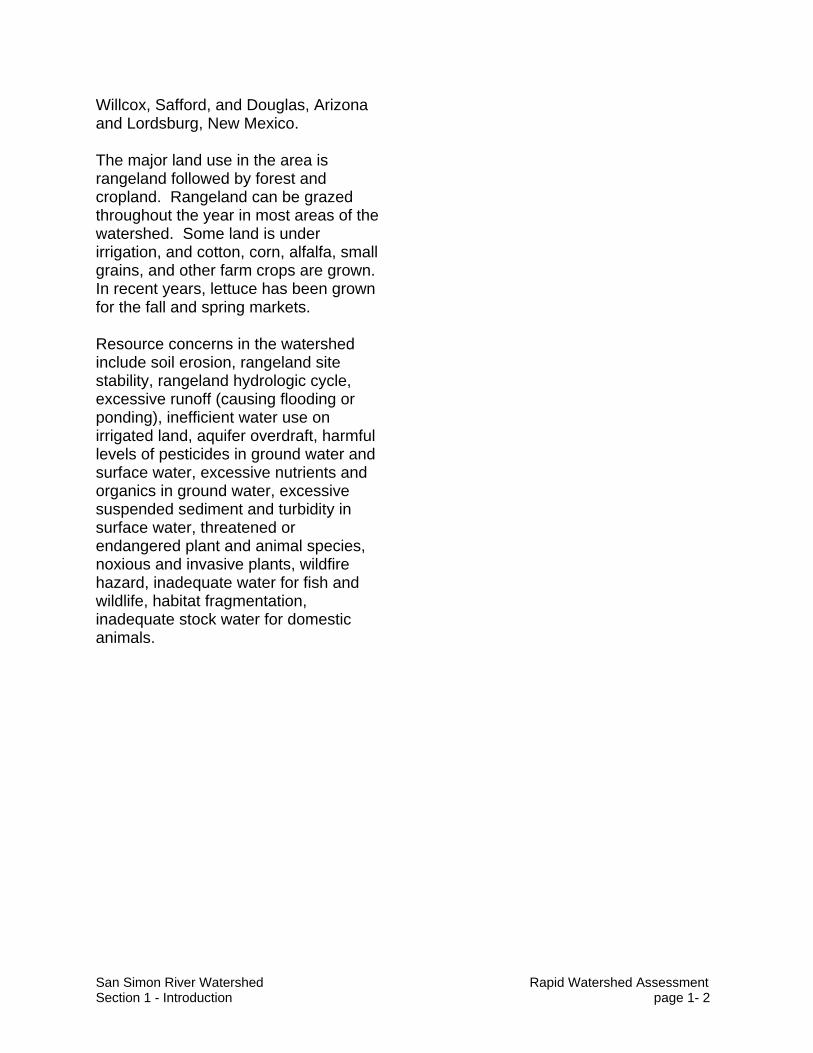
Willcox, Safford, and Douglas, Arizona and Lordsburg, New Mexico.
The major land use in the area is rangeland followed by forest and cropland. Rangeland can be grazed throughout the year in most areas of the watershed. Some land is under irrigation, and cotton, corn, alfalfa, small grains, and other farm crops are grown. In recent years, lettuce has been grown for the fall and spring markets.
Resource concerns in the watershed include soil erosion, rangeland site stability, rangeland hydrologic cycle, excessive runoff (causing flooding or ponding), inefficient water use on irrigated land, aquifer overdraft, harmful levels of pesticides in ground water and surface water, excessive nutrients and organics in ground water, excessive suspended sediment and turbidity in surface water, threatened or endangered plant and animal species, noxious and invasive plants, wildfire hazard, inadequate water for fish and wildlife, habitat fragmentation, inadequate stock water for domestic animals.
San Simon River Watershed Rapid Watershed Assessment Section 1 - Introduction page 1- 2

Section 2: Physical Description Watershed Size The San Simon River Watershed covers approximately 2250 square miles, representing about 1.8% of the state of Arizona and less than .2% of New Mexico. The watershed (including both Arizona and New Mexico) has a maximum width of about 40 miles east-west, and a length of about 93 miles north-south. The San Simon River Watershed was delineated by the U.S. Geological Survey and has been subdivided by the NRCS into smaller watersheds or drainage areas. Each drainage area has a unique hydrologic unit code (HUC) number and a name based on the primary surface water feature within the HUC. These drainage areas can be further subdivided into even smaller watersheds as needed. The San Simon River Watershed has an 8-digit HUC of 15040006 and contains the following 10-digit HUCs:
• 1504000601 (San Simon Headwaters);
• 1504000602 (Cave Creek-San
Simon River);
• 1504000603 (Happy Camp Wash);
• 1504000604 (East Whitetail
Creek-San Simon River);
• 1504000605 (Whitlock Wash-Hospital Flat);
• 1504000606 (Tule Wells Draw-
San Simon River);
• 1504000607 (Gold Gulch-San
Simon River); and,
• 1504000608 (Slick Rock Wash-San Simon River) (Figure 1-2).
Geology The San Simon River watershed lies within the Basin and Range Geologic Province. Within the Basin and Range Province, thousands of feet of alluvial fill have eroded from nearly vertical, block-faulted mountains with metamorphic cores. As the deep basins filled with debris and volcanic eruptions dammed streams and isolated drainage basins, thick layers of salt accumulated in the layered sediments. As the basins filled and drainages connected, most southern Arizona streams joined together as tributaries of the Gila River. Less than five million years ago when the Colorado River became the master drainage of the region, the Gila River drainage network began downcutting to balance with the Colorado system. Within the last two million years, and in response to alternating wet and dry climate cycles, complicated arrays of terraces were eroded along the upper Gila River and its tributaries. These land forms are evident throughout the San Simon River Watershed. The geology of the San Simon River Watershed consists of four major rock types: igneous, sedimentary, metamorphic, and alluvial surficial deposits (Figure 2-1). These geologic types make up approximately 45%, 24%, 2%, and 28% of the surficial geology (Chronic, 1983).
San Simon River Watershed Rapid Watershed Assessment Section 2 - Physical Description page 2- 1
The surficial deposits are differentiated between younger, Holocene to middle Pleistocene, and older, middle Pleistocene to latest Pliocene, surficial deposits, with the older alluvium forming the broad valleys along the Gila River main drainage. The younger surficial deposits are found in isolated terraces along the mountain flanks, residuals of the downcutting that occurred when the regional drainage transferred from the Gila to the Colorado River system. The igneous rocks are subdivided between extrusive lava flows and light-colored granitic intrusive magma. The igneous intrusions and volcanism permitted mineral-rich solutions to rise toward the land surface and solidify, resulting in most of Arizona’s mineral deposits and rich mining history, and contributing to high concentrations of heavy metals in the water and sediments in these areas. Soils Soils within the San Simon River Watershed are diverse and formed as the result of differences in climate, vegetation, geology, and physiography. Detailed soils information for the watershed is available from the Natural Resources Conservation Service (NRCS) and the U.S. Forest Service (USFS). The USFS maintains Terrestrial Ecosystem Surveys on National Forest Lands within the watershed. Lands outside of National Forests are included within the following NRCS Soil Surveys: “Soil Survey of San Simon Area, AZ, Parts of Cochise, Graham, and Greenlee Counties” and “Soil Survey of Cochise County, AZ, Douglas-Tombstone Part.” Soils data
and maps from these Soil Surveys can be accessed through the NRCS Web Soil Survey website: http://websoilsurvey.nrcs.usda.gov. Common Resource Areas The USDA, Natural Resources Conservation Service (NRCS) defines a Common Resource Area (CRA) as a geographical area where resource concerns, problems, or treatment needs are similar (NRCS 2006). It is considered a subdivision of an existing Major Land Resource Area (MLRA). Landscape conditions, soil, climate, human considerations, and other natural resource information are used to determine the geographic boundaries of a Common Resource Area. The San Simon River Watershed is comprised of three Common Resource Areas (Figure 2-2 and Table 2-1). The lower portion of the watershed is comprised of CRA 41.2 “Chihuahuan – Sonoran Desert Shrubs” with elevations ranging from 2600 to 4000 feet and precipitation averaging 8 to 12 inches per year. Vegetation includes mesquite, palo verde, catclaw acacia, soaptree yucca, creosotebush, staghorn cholla, desert saltbush, Mormon tea, burroweed, snakeweed, tobosa, black grama, threeawns, bush muhly, and burrograss. The soils in the area have a thermic soil temperature regime and a typic aridic soil moisture regime. The dominant soil orders are Aridisols, Vertisols and Entisols. Deep, coarse to moderately fine-textured, soils occur on floodplains and alluvial fans. Deep, well and moderately well-drained, medium and moderately fine-textured, soils occur on lower valley slopes and playas.
San Simon River Watershed Rapid Watershed Assessment Section 2 - Physical Description page 2- 2

Deep, gravelly, medium to fine-textured, soils occur on fan terraces. Shallow, gravelly and cobbly, medium to fine-textured, soils occur on hills and mountains. The middle portion of the watershed is comprised of CRA 41.3 “Chihuahuan – Sonoran Semidesert Grasslands” with elevations ranging from 3,200 to 5,000 feet and precipitation averaging 12 to 16 inches per year. Vegetation includes mesquite, catclaw acacia, netleaf hackberry, palo verde, fourwing saltbush, littleleaf sumac, sideoats grama, black grama, plains lovegrass, tobosa, threeawns, and Arizona cottontop and bush muhly. The soils in the area have a thermic soil temperature regime and an ustic aridic soil moisture regime. The dominant soil orders are Aridisols and Mollisols. Shallow, gravelly and cobbly, moderately coarse to moderately fine-textured, soils and rock outcrop occur on hills and mountains. Deep, moderately coarse to fine-textured, soils occur on uplands and in drainage ways. The upper portion of the watershed is comprised of CRA 41.1 “Mexican Oak-Pine Forest and Oak Savannah” with elevations ranging from 4500 to 10,700 feet and precipitation averaging 16 to 30 inches. Vegetation includes Emory oak, Arizona white oak, one-seed juniper, alligator juniper, California bricklebush, skunkbush sumac, Arizona rosewood, wait-a-bit mimosa, sideoats grama, blue grama, wooly bunchgrass, plains lovegrass, squirreltail, and pinyon ricegrass. The soils in the area have a thermic to mesic temperature regime and an aridic ustic to typic ustic soil moisture regime. The dominant soil orders are Entisols and Mollisols.
Shallow, gravelly and cobbly, moderately coarse to moderately fine-textured, soils and rock outcrop occur on hills and mountains. These three Common Resource Areas (CRA 41.3, 41.2, 41.1) occur within the Basin and Range Physiographic Province which is characterized by numerous mountain ranges rising abruptly from broad, plain-like valleys and basins. Igneous and metamorphic rock classes dominate the mountain ranges and sediments filling the basins represent combinations of fluvial, lacustrine, colluvial and alluvial deposits. Table 2-1: San Simon Watershed – Common Resource Areas
Common Resource Area
Type Area
(sq. mi.) Percent of Watershed
41.2 Chihuahuan -Sonoran Desert Shrubs 1,258 55.89 41.3 Chihuahuan -Sonoran Semidesert Grasslands 483 21.48 41.1 Mexican Oak-Pine Forest and Oak Savannah 509 22.63 Data Sources: GIS map layer “cra”. Arizona Land Information System (ALRIS 2004), Natural Resource Conservation Service (NRCS 2006). New Mexico Resource Geographic Information (RGIS 2007) Slope Classifications Slope, as well as soil characteristics and topography, are important when assessing the vulnerability of a watershed to erosion. Approximately 26% of the San Simon Watershed has a slope greater than 15%, while 62% of the watershed has a slope less than 5%.
San Simon River Watershed Rapid Watershed Assessment Section 2 - Physical Description page 2- 3
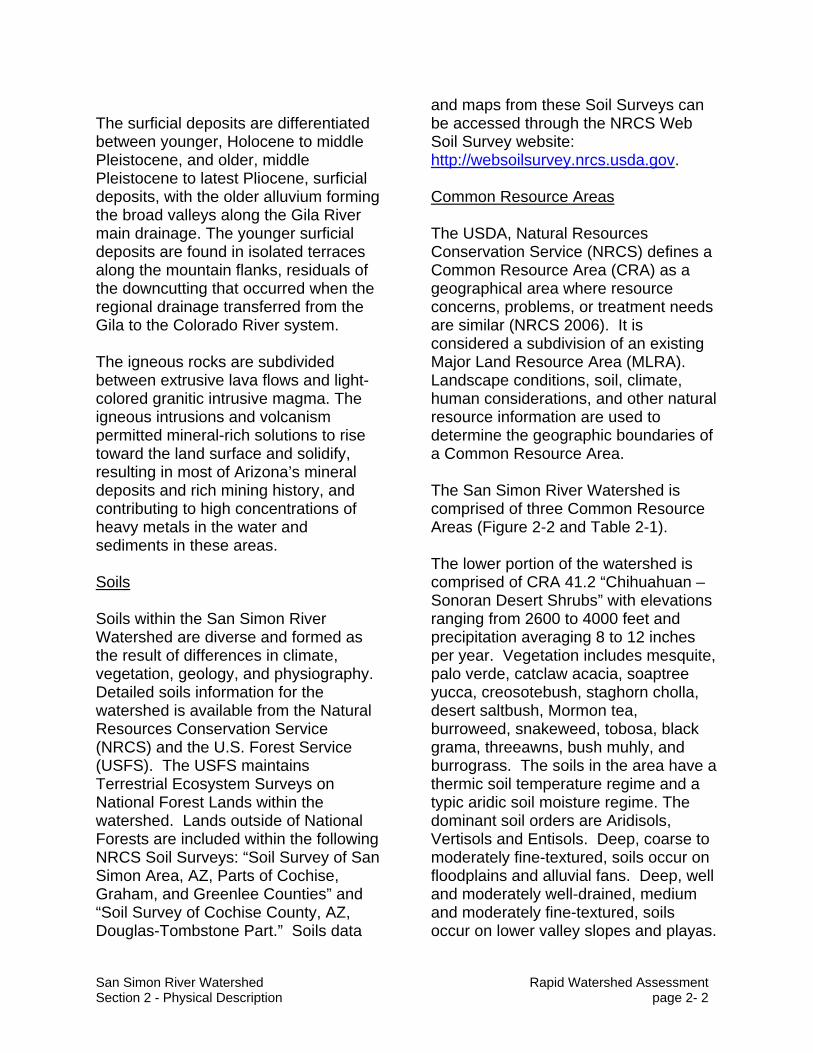
The Tule Wells Draw-San Simon River Watershed is relatively flat, with only 15% of its area over 15% slope, and 80% less than 5% slope. The San Simon River Headwater Slick Rock
Watershed is relatively steeper, with 44% of the area greater than 15% slope, and 43% of the area with less than 5% slope (Table 2-2 and Figure 2-3).
Table 2-2: San Simon River Watershed Slope Classifications
Percent Watershed Name Area (sq. miles) 0-5% 5-15% >15%
San Simon River Headwaters Slick Rock 1504000601 342 43 13 44
Cave Creek-San Simon River 1504000602 353 57 12 31
Happy Camp Wash 1504000603 175 68 5 27
East Whitetail Creek-San Simon River 1504000604 393 66 9 25
Whitlock Wash-Hospital Flat 1504000605 189 53 18 29
Tule Wells Draw-San Simon River 1504000606 209 80 5 15
Gold Gulch-San Simon River 1504000607 286 66 17 17
Slick Rock Wash-San Simon River 1504000608 303 64 18 18
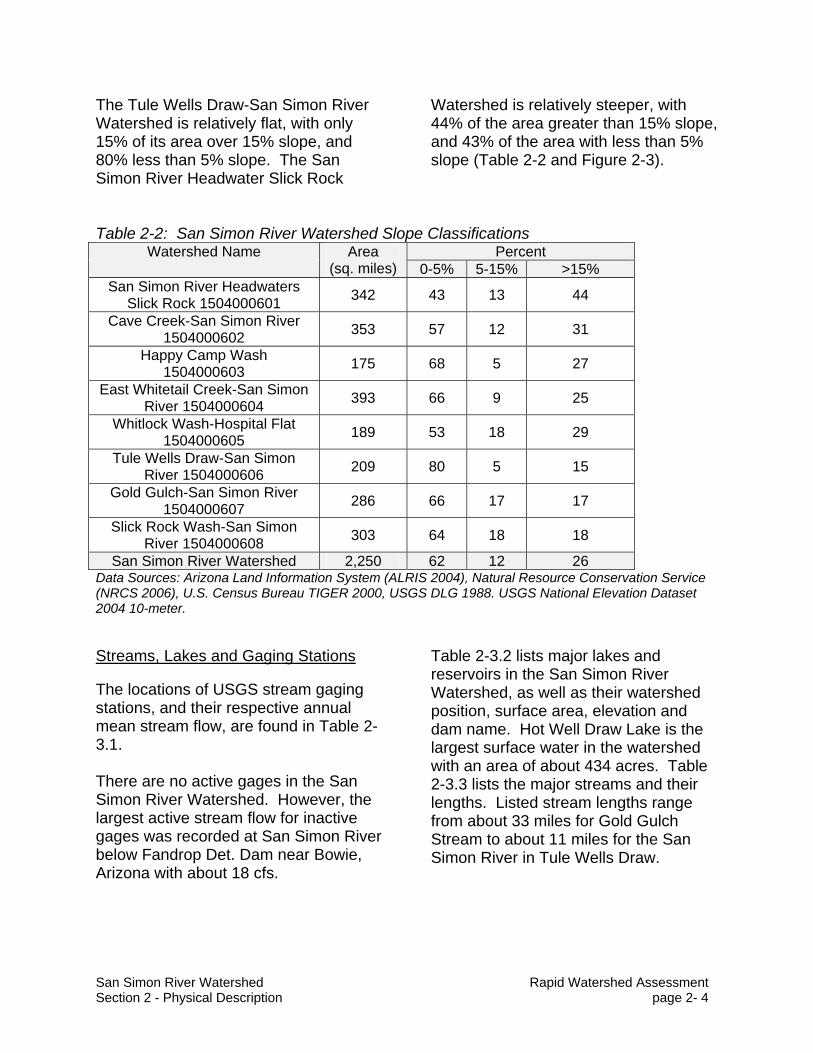
San Simon River Watershed 2,250 62 12 26 Data Sources: Arizona Land Information System (ALRIS 2004), Natural Resource Conservation Service (NRCS 2006), U.S. Census Bureau TIGER 2000, USGS DLG 1988. USGS National Elevation Dataset 2004 10-meter. Streams, Lakes and Gaging Stations The locations of USGS stream gaging stations, and their respective annual mean stream flow, are found in Table 2-3.1. There are no active gages in the San Simon River Watershed. However, the largest active stream flow for inactive gages was recorded at San Simon River below Fandrop Det. Dam near Bowie, Arizona with about 18 cfs.
Table 2-3.2 lists major lakes and reservoirs in the San Simon River Watershed, as well as their watershed position, surface area, elevation and dam name. Hot Well Draw Lake is the largest surface water in the watershed with an area of about 434 acres. Table 2-3.3 lists the major streams and their lengths. Listed stream lengths range from about 33 miles for Gold Gulch Stream to about 11 miles for the San Simon River in Tule Wells Draw.
San Simon River Watershed Rapid Watershed Assessment Section 2 - Physical Description page 2- 4
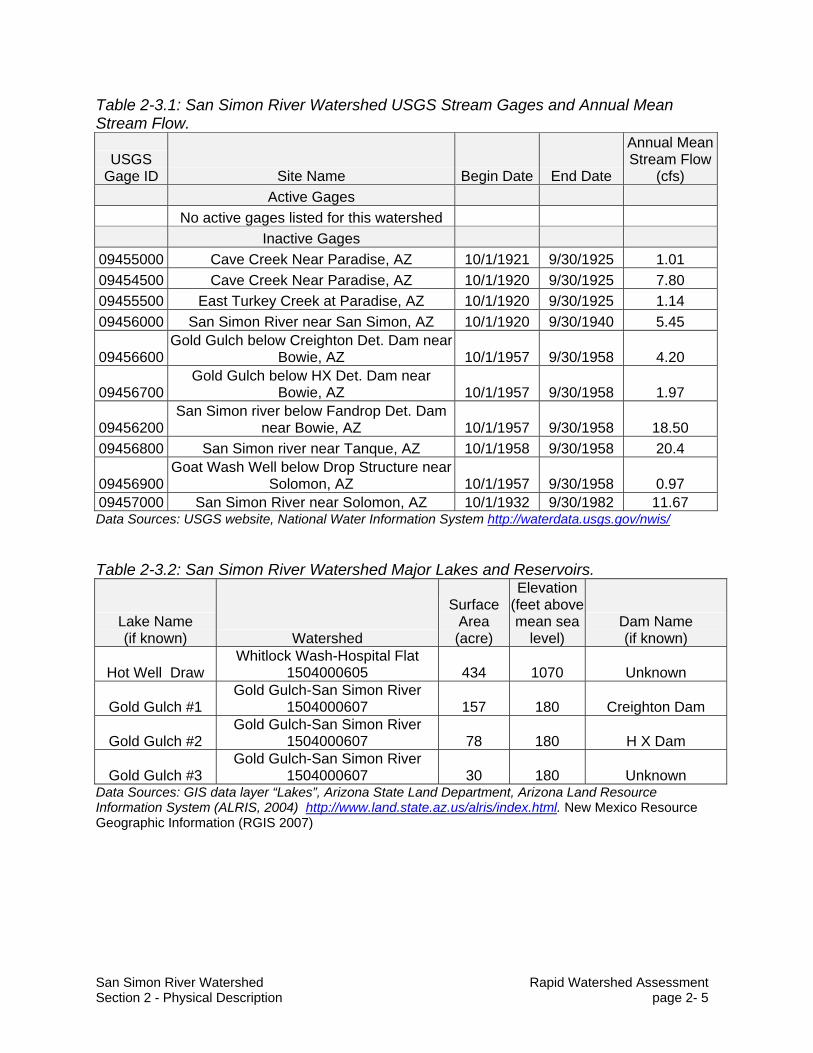
Table 2-3.1: San Simon River Watershed USGS Stream Gages and Annual Mean Stream Flow.
USGS Gage ID Site Name Begin Date End Date
Annual Mean Stream Flow
(cfs) Active Gages No active gages listed for this watershed Inactive Gages
09455000 Cave Creek Near Paradise, AZ 10/1/1921 9/30/1925 1.01 09454500 Cave Creek Near Paradise, AZ 10/1/1920 9/30/1925 7.80 09455500 East Turkey Creek at Paradise, AZ 10/1/1920 9/30/1925 1.14 09456000 San Simon River near San Simon, AZ 10/1/1920 9/30/1940 5.45
09456600 Gold Gulch below Creighton Det. Dam near
Bowie, AZ 10/1/1957 9/30/1958 4.20
09456700 Gold Gulch below HX Det. Dam near
Bowie, AZ 10/1/1957 9/30/1958 1.97
09456200 San Simon river below Fandrop Det. Dam
near Bowie, AZ 10/1/1957 9/30/1958 18.50 09456800 San Simon river near Tanque, AZ 10/1/1958 9/30/1958 20.4
09456900 Goat Wash Well below Drop Structure near
Solomon, AZ 10/1/1957 9/30/1958 0.97 09457000 San Simon River near Solomon, AZ 10/1/1932 9/30/1982 11.67 Data Sources: USGS website, National Water Information System http://waterdata.usgs.gov/nwis/ Table 2-3.2: San Simon River Watershed Major Lakes and Reservoirs.
Lake Name (if known) Watershed
Surface Area (acre)
Elevation (feet above mean sea
level) Dam Name (if known)
Hot Well Draw Whitlock Wash-Hospital Flat
1504000605 434 1070 Unknown
Gold Gulch #1 Gold Gulch-San Simon River
1504000607 157 180 Creighton Dam
Gold Gulch #2 Gold Gulch-San Simon River
1504000607 78 180 H X Dam
Gold Gulch #3 Gold Gulch-San Simon River
1504000607 30 180 Unknown Data Sources: GIS data layer “Lakes”, Arizona State Land Department, Arizona Land Resource Information System (ALRIS, 2004) http://www.land.state.az.us/alris/index.html. New Mexico Resource Geographic Information (RGIS 2007)
San Simon River Watershed Rapid Watershed Assessment Section 2 - Physical Description page 2- 5

Table 2-3.3: San Simon River Watershed Major Streams and Lengths Stream Name Watershed Stream Length
(miles) Gold Gulch Gold Gulch-San Simon River 32.6
Hot Well Draw Whitlock Wash-Hospital Flat 27.9 Slick Rock Wash-San Simon River 25.7
San Simon River East Whitetail Creek-San Simon River 22.3
Oak Draw Slick Rock Wash-San Simon River 18.0 Cave Creek-San Simon River 17.2 Gold Gulch-San Simon River 13.3 San Simon River
Tule Wells Draw-San Simon River (1504000606) 10.5
Total 150.3 Data Sources: GIS data layer “Streams”, Arizona State Land Department, Arizona Land Resource Information System (ALRIS 2004). http://www.land.state.az.us/alris/index.html New Mexico Resource Geographic Information (RGIS 2007). Riparian Vegetation The Arizona Game & Fish Department has identified and mapped riparian vegetation associated with perennial waters in response to the requirements of the state Riparian Protection Program (July 1994). This map was used to identify riparian areas in the San Simon River Watershed (Figure 2-5). Five of the ten types of riparian areas classified by Game & Fish occur within the San Simon River Watershed. Riparian areas encompass approximately 1,965 acres (3.1 sq. mi.) or less than 0.1% of the entire watershed. Conifer Oak comprises about 1,626 acres, or 83% of the riparian areas. Mixed Broadleaf and Agriculture comprise about 9% and 4% of the watershed, respectively (Table 2-4). Cave Creek-San Simon River Watershed has the greatest amount of riparian vegetation with about 1,894 acres (3.0 square miles). The San Simon River Headwaters at Slick Rock
is the only other watershed with riparian vegetation, and it has about 70 acres (0.1 sq. mi.). Land Cover The Riparian Vegetation map (Figure 2-5) and Land Cover map (Figure 2-6) were created from the Southwest Regional Gap Analysis Project land cover map (Lowry et. al, 2005). Within the San Simon Watershed, Table 2-5 identifies the Apacherian-Chihuahuan Grassland and Mesquite Scrub as the most common land cover type over the entire watershed, encompassing about 43% of the watershed. The next most common types are Chihuahuan Desert, Thorn, and Sand Flat Scrub (32%) and Madrean Pine Oak Woodland (8%). Note: There are a total of 26 GAP vegetation categories present within the San Simon Watershed boundary. Some of these categories occur only in small concentrations, and are not visible at the small scale in which the maps are displayed. Some of the vegetation categories were re-grouped in order to
San Simon River Watershed Rapid Watershed Assessment Section 2 - Physical Description page 2- 6
increase the legibility of the map. In collaboration with NRCS, staff were able to create a total of 14 grouped GAP
vegetation categories, as shown on Table 2-5.
Table 2-4: San Simon River Watershed Riparian Vegetation (acres) by 10-digit Watershed (Part 1 of 2)
Riparian Vegetation Community
San Simon River Headwaters Slick
Rock 1504000601
Cave Creek-San Simon River 1504000602
Happy Camp Wash
1504000603
East Whitetail Creek-San
Simon River 1504000604
Agriculture - 77 - - Conifer Oak - 1,626 - -
Mixed Broadleaf - 186 - - North American
Warm Desert Lower Montane Riparian
Woodland and Shrub
39 - - -
North American Warm Desert
Riparian Mesquite Bosque
32 6 - -
San Simon Watershed total area
(acres) 70 1,894 - -
Table 2-4: San Simon River Watershed Riparian Vegetation (acres) by 10-digit Watershed (Part 2 of 2)
Riparian Vegetation Community
Whitlock Wash-Hospital Flat 1504000605
Tule Wells Draw-San Simon River
1504000606
Gold Gulch-San Simon
River 1504000607
Slick Rock Wash-San
Simon River 1504000608
Total acres
Agriculture - - - - 77 Conifer Oak - - - - 1,626
Mixed Broadleaf - - - - 186 North American Warm Desert
Lower Montane Riparian
Woodland and Shrub
- - - - 38
North American Warm Desert
Riparian Mesquite Bosque
- - - - 38
San Simon Watershed total
area (acres) - - - - 1,965
Data Sources: GIS data layer “pan_riparian_att”, Arizona State Land Department, Arizona Land Resource Information System (ALRIS, 2004) http://www.land.state.az.us/alris/index.html. Southwest ReGAP (GAP 2007).
San Simon River Watershed Rapid Watershed Assessment Section 2 - Physical Description page 2- 7

Table 2-5: San Simon River Watershed Southwest Regional GAP Analysis Project Land Cover, Percent of 10-digit Watershed (Part 1 of 2)
Landcover
Slick Rock Wash-San
Simon River 1504000505
Whitlock Wash-Hospital Flat 1504000607
Tule Wells Draw-San
Simon River 1504000607
East Whitetail Creek-San
Simon River 1504000606
Agriculture 0.98% - 2.14% 4.10% Apacherian-Chihuahuan
Grassland and Mesquite Scrub 26.27% 43.12% 59.48% 43.61%
Chihuahuan Desert, Thorn, and Sand Flat
Scrub 64.20% 45.09% 26.85% 33.22% Developed, Medium -
High Intensity 0.04% - 0.44% 0.36% Developed, Open
Space - Low Intensity 0.02% - 0.14% - Madrean Pine Oak
Woodland 2.44% 3.12% 6.71% 8.34% Madrean Pinyon-Juniper Woodland 2.13% 4.53% 2.09% 4.96%
Mogollon Chaparral 0.26% 1.34% 0.58% 1.29% No Value, this occurs
along state lines - - - 1.68%
North American Warm Desert Barren
Lands 1.00% 0.90% 0.45% 1.80% North American
Warm Desert Woody and Emergent
Wetlands 0.26% 0.34% 1.11% 0.54% Open Water - <0.01% - -
Rocky Mountain Ponderosa Pine and
Aspen Forest Woodland - 0.01% <0.01% 0.41%
Sonoran Desert Scrub 2.38% 1.03% 0.01% - Area
(sq. mile) 303 189 209 393 Data Sources: GIS data layer “Arizona Gap Analysis Project Vegetation Map”, University of Arizona, Southern Arizona Data Services Program, 2004 http://sdrsnet.srnr.arizona.edu/index.php Originated by Arizona Game & Fish Department, Habitat Branch, 1993, this dataset was digitized from the August 1980 David E. Brown & Charles H. Lowe 1:1,000,000 scale, 'Biotic Communities of the Southwest'. New Mexico Resource Geographic Information (RGIS 2007)
San Simon River Watershed Rapid Watershed Assessment Section 2 - Physical Description page 2- 8

Table 2-5: San Simon River Watershed Southwest Regional GAP Analysis Project Land Cover, Percent of 10-digit Watershed (Part 2 of 2)
Landcover
Cave Creek-San
Simon River 1504000604
San Simon River
Headwaters 1504000602
Gold Gulch-San Simon
River 1504000608
Happy Camp Wash 1504000604
San Simon River
WatershedAgriculture 0.84% 1.64% 1.25%
Apacherian-Chihuahuan
Grassland and Mesquite Scrub 35.60% 46.62% 44.73% 54.89% 42.66%
Chihuahuan Desert, Thorn, and Sand Flat
Scrub 25.18% 10.59% 43.40% 19.48% 32.10% Developed, Medium -
High Intensity - - 0.19% 0.32% 0.14% Developed, Open
Space - Low Intensity - - - - 0.01% Madrean Pine Oak
Woodland 6.69% 14.18% 7.34% 13.48% 8.02% Madrean Pinyon-Juniper Woodland 7.35% 10.09% 2.12% 5.77% 5.42%
Mogollon Chaparral 1.43% 2.94% 0.74% 1.88% 1.40% No Value, this occurs
along state lines 20.72% 13.03% - - 6.57% North American
Warm Desert Barren Lands 1.72% 2.44% 0.45% 1.32% 1.43%
North American Warm Desert Woody
and Emergent Wetlands 0.05% 0.54% 0.57% 1.22% 0.42%
Open Water - <0.01% - - <0.01% Rocky Mountain
Ponderosa Pine and Aspen Forest
Woodland 0.41% 0.02% 0.10% - 0.10% Sonoran Desert
Scrub - - 0.34% - 0.42% Area (sq. mile) 354 342 286 175 2,250
Data Sources: GIS data layer “Arizona Gap Analysis Project Vegetation Map”, University of Arizona, Southern Arizona Data Services Program, 2004 http://sdrsnet.srnr.arizona.edu/index.php Originated by Arizona Game & Fish Department, Habitat Branch, 1993, this dataset was digitized from the August 1980 David E. Brown & Charles H. Lowe 1:1,000,000 scale, 'Biotic Communities of the Southwest'. New Mexico Resource Geographic Information (RGIS 2007)
San Simon River Watershed Rapid Watershed Assessment Section 2 - Physical Description page 2- 9
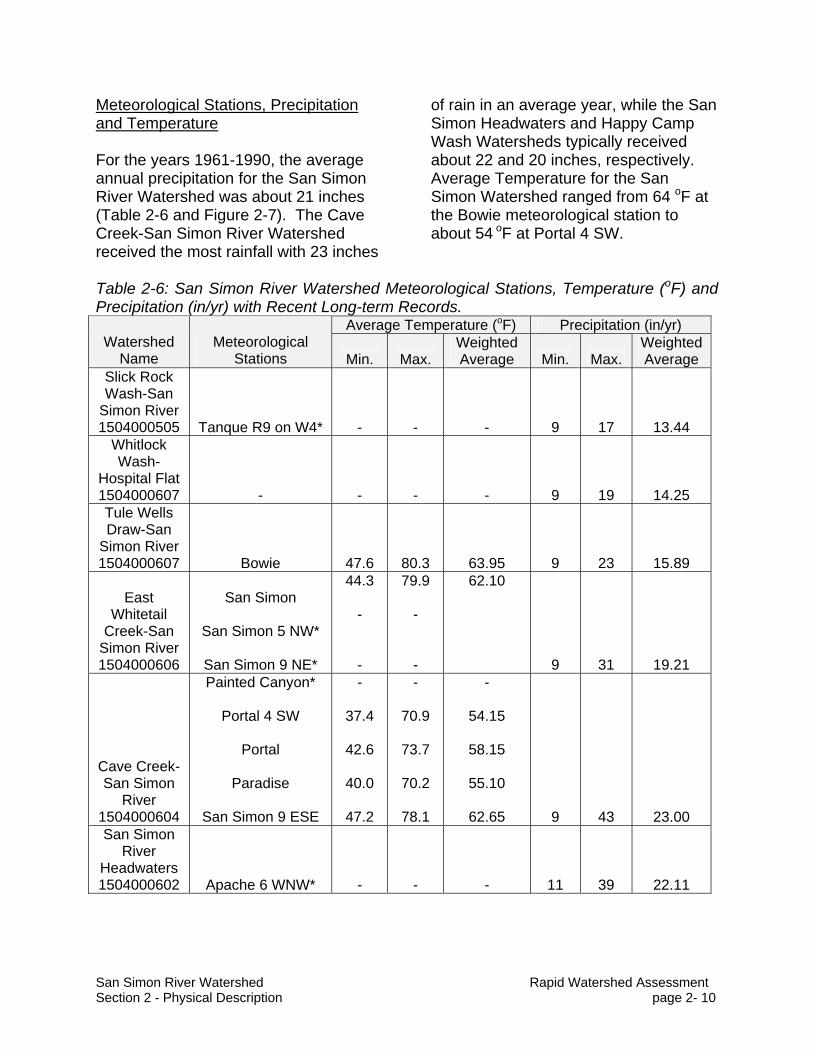
Meteorological Stations, Precipitation and Temperature For the years 1961-1990, the average annual precipitation for the San Simon River Watershed was about 21 inches (Table 2-6 and Figure 2-7). The Cave Creek-San Simon River Watershed received the most rainfall with 23 inches
of rain in an average year, while the San Simon Headwaters and Happy Camp Wash Watersheds typically received about 22 and 20 inches, respectively. Average Temperature for the San Simon Watershed ranged from 64 oF at the Bowie meteorological station to about 54 oF at Portal 4 SW.
Table 2-6: San Simon River Watershed Meteorological Stations, Temperature (oF) and Precipitation (in/yr) with Recent Long-term Records.
Average Temperature (oF) Precipitation (in/yr) Watershed
Name Meteorological
Stations Min. Max. Weighted Average Min. Max.
Weighted Average
Slick Rock Wash-San
Simon River 1504000505 Tanque R9 on W4* - - - 9 17 13.44
Whitlock Wash-
Hospital Flat 1504000607 - - - - 9 19 14.25 Tule Wells Draw-San
Simon River 1504000607 Bowie 47.6 80.3 63.95 9 23 15.89
East Whitetail
Creek-San Simon River 1504000606
San Simon
San Simon 5 NW*
San Simon 9 NE*
44.3 - -
79.9 - -
62.10 9 31 19.21
Cave Creek-San Simon
River 1504000604
Painted Canyon*
Portal 4 SW
Portal
Paradise
San Simon 9 ESE
-
37.4
42.6
40.0
47.2
-
70.9
73.7
70.2
78.1
-
54.15
58.15
55.10
62.65 9 43 23.00 San Simon
River Headwaters 1504000602 Apache 6 WNW* - - - 11 39 22.11
San Simon River Watershed Rapid Watershed Assessment Section 2 - Physical Description page 2- 10
Average Temperature (oF) Precipitation (in/yr) Watershed
Name Meteorological
Stations Min. Max. Weighted Average Min. Max.
Weighted Average
Gold Gulch-San Simon
River 1504000608
Bowie Junction R15 ON W* - - - 9 21 15.40
Happy Camp Wash
1504000604 Bowie 3 ESE* - - - 9 25 19.53 San Simon
River Watershed - - - - 9 43 20.85
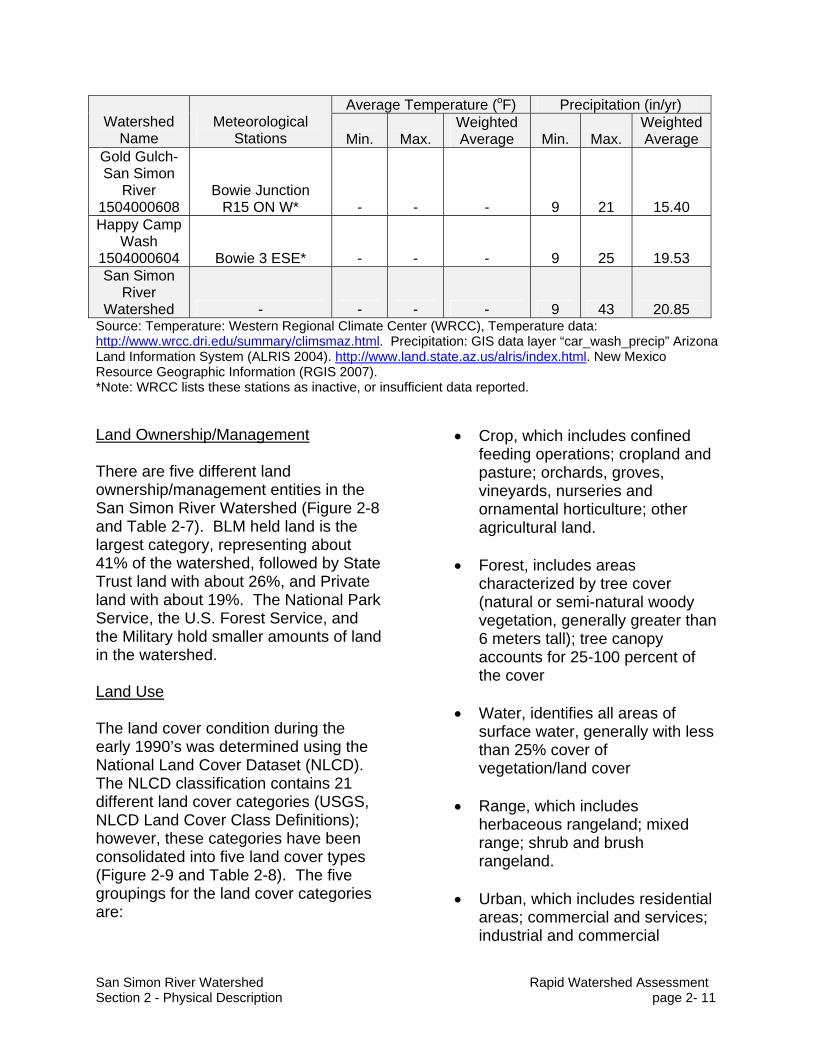
Source: Temperature: Western Regional Climate Center (WRCC), Temperature data: http://www.wrcc.dri.edu/summary/climsmaz.html. Precipitation: GIS data layer “car_wash_precip” Arizona Land Information System (ALRIS 2004). http://www.land.state.az.us/alris/index.html. New Mexico Resource Geographic Information (RGIS 2007). *Note: WRCC lists these stations as inactive, or insufficient data reported. Land Ownership/Management There are five different land ownership/management entities in the San Simon River Watershed (Figure 2-8 and Table 2-7). BLM held land is the largest category, representing about 41% of the watershed, followed by State Trust land with about 26%, and Private land with about 19%. The National Park Service, the U.S. Forest Service, and the Military hold smaller amounts of land in the watershed. Land Use The land cover condition during the early 1990’s was determined using the National Land Cover Dataset (NLCD). The NLCD classification contains 21 different land cover categories (USGS, NLCD Land Cover Class Definitions); however, these categories have been consolidated into five land cover types (Figure 2-9 and Table 2-8). The five groupings for the land cover categories are:
• Crop, which includes confined feeding operations; cropland and pasture; orchards, groves, vineyards, nurseries and ornamental horticulture; other agricultural land.
• Forest, includes areas
characterized by tree cover (natural or semi-natural woody vegetation, generally greater than 6 meters tall); tree canopy accounts for 25-100 percent of the cover
• Water, identifies all areas of
surface water, generally with less than 25% cover of vegetation/land cover
• Range, which includes
herbaceous rangeland; mixed range; shrub and brush rangeland.
• Urban, which includes residential
areas; commercial and services; industrial and commercial
San Simon River Watershed Rapid Watershed Assessment Section 2 - Physical Description page 2- 11

The most common land cover type in the San Simon River Watershed is Range which makes up about 98% of the watershed. Crop is the next most common type with about 1% of the total area.
complexes; mixed urban or built-up land; other urban or built-up land; strip mines quarries and gravel pits; transportation, communication and utilities.
Table 2-7: San Simon River Watershed Land Ownership/Management. (Percent of each 10-digit Watershed) (Part 1 of 2)
Land Owner
Slick Rock Wash-San
Simon River 1504000505
Whitlock Wash-Hospital
Flat 1504000607
Tule Wells Draw-San
Simon River 1504000607
East Whitetail Creek-San
Simon River 1504000606*
Cave Creek-San Simon
River 1504000604*
BLM 88.04% 30.69% 55.59% 46.97% 31.74%
Military - - - - - National
Parks - - - 0.37% -
Private 2.87% 2.18% 21.94% 18.64% 26.94%
State Trust 5.94% 67.13% 22.47% 22.14% 21.18%
USFS 3.15% - - 11.67% 19.89% Area (square
miles) 303 189 209 393 354 Data Sources: GIS data layer “ownership”, (Arizona Land Information System (ALRIS 2004), Natural Resource Conservation Service (NRCS 2006). New Mexico Resource Geographic Information (RGIS 2007) http://www.land.state.az.us/alris/index.html Table 2-7: San Simon River Watershed Land Ownership/Management. (Percent of each 10-digit Watershed) (Part 2 of 2)
Land Owner
San Simon River Headwaters
1504000602*
Gold Gulch-San Simon River 1504000608
Happy Camp Wash
1504000604 San Simon River
Watershed BLM 5.52% 41.07% 33.72% 41.32%
Military - - - -
National Parks - - 1.39% 0.25% Private 38.14% 8.67% 29.87% 19.15%
State Trust 16.92% 46.33% 29.82% 25.80% USFS 39.42% 3.94% 5.19% 13.42%
Total Area (square miles) 342 286 175 2,251
Data Sources: GIS data layer “ownership (Arizona Land Information System (ALRIS 2004), Natural Resource Conservation Service (NRCS 2006). New Mexico Resource Geographic Information (RGIS 2007), http://www.land.state.az.us/alris/index.html.
San Simon River Watershed Rapid Watershed Assessment Section 2 - Physical Description page 2- 12

Table 2-8: San Simon River Watershed Land Use, Percent of 10-digit Watershed
Land Cover/Location Crop Forest Urban Range Water Area
(sq. mi.) Slick Rock Wash-San
Simon River 1504000505 0.98% 0.04% 0.06% 98.92% - 303
Whitlock Wash-Hospital Flat 1504000607 - 0.30% - 99.70% <0.01% 188
Tule Wells Draw-San Simon River 1504000607 2.14% 0.21% 0.59% 97.06% - 209
East Whitetail Creek-San Simon River
1504000606 4.18% 1.35% 0.36% 94.32% - 393 Cave Creek-San
Simon River 1504000604 1.07% 1.88% - 97.06% - 353
San Simon River Headwaters 1504000602 - 0.81% - 99.16% <0.01% 342
Gold Gulch-San Simon River 1504000608 - 0.15% 0.19% 99.66% - 286
Happy Camp Wash 1504000604 1.64% 1.37% 0.32% 96.67% - 175
San Simon River Watershed 1.34% 0.85% 0.17% 97.64% <0.01% 2,250
Data Sources: GIS data layer “san_gapveg”, Arizona State Land Department, Arizona Land Resource Information System (ALRIS 2004) http://www.land.state.az.us/alris/index.html. New Mexico Geographic Information (RGIS 2007).
Mines – Primary Ores Table 2-9 and Figure 2-10 show the types of ores being mined in the San Simon River Watershed. The most common mine type found in the watershed are geothermal, with 64 geothermal wells, followed by copper with 20 mines, lead with 19 mines, and gold and manganese, each with 13 mines.
San Simon River Watershed Rapid Watershed Assessment Section 2 - Physical Description page 2- 13

Table 2-9: San Simon River Watershed Mines – Primary Ores. Ore Type Total Number of Mines Ore Type Total Number of Mines Geothermal* 64 Gypsum 4 Copper 20 Uranium 4 Lead 19 Silver 2 Gold 13 Stone 2 Manganese 13 Tin 2 Sand & Gravel 6 Silicon 1 Zeolites 6 Clay 1 Tungsten 5 Beryllium 1 Diatomite 4 Zinc 1 Fluorine 4 GIS data layer “mines”, Arizona State Land Department, Arizona Land Resource Information System (ALRIS, 2004). http://www.land.state.az.us/alris/index.html. New Mexico Resource Geographic Information (RGIS 2007). *All Geothermal mine names are listed as “name unknown.” All other listings have mine names associated with them.
San Simon River Watershed Rapid Watershed Assessment Section 2 - Physical Description page 2- 14

Section 3: Resource Concerns Introduction Conservation Districts and other local leaders, along with NRCS and other resource management agencies, have identified priority natural resource concerns for this watershed. These concerns can be grouped under the broad resource categories of Soil, Water, Air, Plants, or Animals (SWAPA). Refer to Table 3-1 for a listing of priority resource concerns by land use within the San Simon River Watershed. Soil Erosion Soil erosion is defined as the movement of soil from water (sheet and rill or gully) or wind forces requiring treatment when soil loss tolerance levels are exceeded. Sheet and rill erosion is a concern particularly on rangeland and forest land in areas of shallow soils and poor vegetative cover. Soil loss results in reduced water holding capacity and plant productivity. Gully erosion can be a significant problem in areas of steep slopes and deep soils. Loss of vegetative cover and down-cutting of streams contribute to gully formation. Wind erosion is locally significant where adequate vegetative cover is not maintained. Conservation practices applied to address this resource concern are generally those that help improve vegetative cover, stabilize sites, and control water flows. Practices may include critical area planting, deferred grazing, grade stabilization structures, herbaceous wind barriers, prescribed grazing, range planting, stream channel stabilization, tree and shrub
establishment, water and sediment control basins, water spreading, windbreak establishment, and wildlife upland habitat management. Soil Condition
Soil condition is a resource concern on cropland whenever soil tilth is poor or soil compaction is excessive. Poor soil tilth results whenever unsuitable combinations of minerals, air, water, and organic matter occur, resulting in low microbial activity and chemical reactions. Soil compaction results from excessive compressing of soil particles and aggregates by machines or livestock, thus affecting plant-soil-moisture-air relationships. Soil condition can become a problem whenever a field is excessively tilled or tilled when the soil is wet, lack of crop rotation, and lack of addition of organic matter. Poor soil condition reduces root growth and plant productivity.
Conservation practices applied to address this resource concern are generally those that improve plant cover, improve soil organic matter, improve soil microbial activity, reduce tillage operations, or mechanically break up compacted soils. Practices may include deep tillage, conservation cover, conservation crop rotation, cover & green manure crop, irrigation water management, mulching, nutrient management, pest management, residue management, tree and shrub establishment, and waste utilization. Reduced tillage passes and addition of organic matter from cover crops or residue will improve soil condition.
San Simon River Watershed Rapid Watershed Assessment Section 3 - Resource Concerns page 3- 1

Table 3-1: San Simon River Watershed Priority Resource Concerns by Land Use
Resource Category Cropland ConcernsRangeland Concerns Forest Concerns Urban Concerns
Soil Erosion
Sheet & Rill Erosion
Sheet & Rill Erosion
Roads & Construction Sites
Soil Condition
Soil Compaction & Organic Matter Depletion
Water Quality
Excessive Nutrients & Organics & Pesticides in Ground Water
Excessive Suspended Sediment in Surface Water
Excessive Suspended Sediment in Surface Water
Excessive Nutrients & Organics & Pesticides in Ground Water
Water Quantity
Inefficient Use on Irrigated Land & Aquifer Overdraft
Inefficient Use on Irrigated Land & Aquifer Overdraft
Air Quality Plant Condition
Plant Productivity, Health & Vigor
Plant Productivity, Health & Vigor
Noxious & Invasive Plants
Noxious & Invasive Plants
Noxious & Invasive Plants
Domestic Animals
Inadequate Quantities & Quality of Feed & Forage & Water
Inadequate Quantities & Quality of Feed & Forage & Water
Species of Concern
T&E Species & Declining Species & Species of Concern
T&E Species & Declining Species & Species of Concern
(NRCS, 2007) Water Quality The Arizona Department of Environmental Quality (ADEQ) assesses surface water quality to identify which surface waters are impaired or attaining designed uses and to prioritize future monitoring. Impaired waters, as defined by Section 303(d) of the federal Clean Water Act, are those waters that are not meeting the state's water quality standards for designated uses. Attaining waters meet state water quality standards for designated uses. Strategies are implemented on impaired waters to reduce pollutant loadings so that surface water quality standards will
be met, unless impairment is solely due to natural conditions. Once a surface water has been identified as impaired, activities in the watershed that might contribute further loadings of the pollutant are not allowed. Agencies and individuals planning future projects in the watershed must be sure that activities will not further degrade these impaired waters and are encouraged through grants to implement strategies to reduce loading. One of the first steps is the development of a Total Maximum Daily Load (TMDL) analysis to empirically determine the
San Simon River Watershed Rapid Watershed Assessment Section 3 - Resource Concerns page 3- 2

load reduction needed to meet standards. The Draft 2006 Status of Ambient Surface Water Quality in Arizona (ADEQ 2007) indicates that generally surface water quality is excellent where monitored and assessed (Figure 3.1). The status of water bodies in the San Simon River Watershed is:
• Cave Creek, from headwaters to South Fork of Cave Creek. 15040006-852A. 7.5 miles. This reach is given “unique water” protection. Impaired due to selenium. (Note that preliminary TMDL monitoring does not show further exceedances.) (02 Cave Creek-San Simon River Sub-Basin)
• Cave Creek, from South Fork
Cave Creek to Coronado National Forest boundary. 15040006-852B. 1.5 miles. This reach is given “unique water” protection. Attaining all uses. No exceedances.
• Dankworth Ponds. 15040006-
0440. 8 acres. Attaining some uses. Selenium exceedance in 1 (out of 1) sample. However, this lake system is also considered naturally impaired by low dissolved oxygen due to ground water upwelling. (06 Stockton Wash Sub-Basin)
• Roper Lake. 15040006-1250. 25
acres. Attaining some uses. Missing core parameters needed to assess designated uses. No exceedances. However, this lake system is also considered
naturally impaired by low dissolved oxygen due to ground water upwelling. (06 Stockton Wash Sub-Basin)
• South Fork Cave Creek, from
headwaters to Cave Creek. 15040006-849. 8.1 miles. Attaining all uses.
(Data collected on other stream reaches or lakes in this watershed was insufficient to determine if impaired or attaining any designated use.)
Water Quantity According to the Arizona Department of Water Resources (ADWR), ground water, in general, is found under water-table conditions in the upper aquifer and under artesian conditions in the lower aquifer. Prior to development, ground water movement generally followed surface-water patterns. Since the early 1950's, when pumpage increased dramatically, ground water movement has been toward areas of intense pumpage near farming centers. Declines in water levels are greatest in these areas. Maximum declines are found in the lower aquifer of up to 211 feet near Bowie from 1962-1987, and declines of up to 100 feet common around much of the watershed. In the southern part of the sub-basin, ground water level changes ranged from a rise of 15 feet to a decline of 15 feet over the same period. Water levels in the upper aquifer for 1987 ranged from 30 to 150 feet below land surface, and discharge from wells varied from 75 to 300 gallons per minute. In the lower aquifer, water levels
San Simon River Watershed Rapid Watershed Assessment Section 3 - Resource Concerns page 3- 3

range from less than 100 to 500 feet below land surface and large irrigation wells yield 500 to 2,000 gallons per minute. Air Quality Air quality is not a significant concern for this watershed (Figure 3-2). According to the ADEQ Air Quality Division (ADEQ, Air Quality Division), the San Simon River Watershed contains no areas that are listed as “non-attainment” areas, or “attainment areas with air quality maintenance plans.” Plant Condition Plant condition is a resource concern whenever plants do not manufacture sufficient food to continue the growth cycle or to reproduce. Plant condition is frequently a concern on rangeland where proper grazing management is not being applied. Conservation practices applied to address this resource concern are generally those that maintain or improve the health, photosynthetic capability, rooting and reproductive capability of vegetation. Practices may include brush management, critical area planting, deferred grazing, fencing, forest stand improvement, herbaceous wind barriers, nutrient management, pest management, prescribed grazing, prescribed burning, range planting, recreation area improvement, riparian forest buffers, tree and shrub establishment, wetland development or restoration, wildlife upland habitat management, wildlife watering facility, wildlife wetland habitat management, and windbreak establishment.
Noxious and Invasive Plants Noxious and invasive plants are a resource concern whenever these species cause unsuitable grazing conditions for livestock or wildlife and due to their potential to out-compete native species which are generally preferred for wildlife habitat value. Increases in noxious and invasive plants can result from poor grazing management, drought, control of wildfires in the higher elevations, and other causes. Conservation practices applied to address this resource concern are generally those that control the establishment or reduce the population of noxious and invasive plant species. Practices may include brush management, deferred grazing, fencing, forest stand improvement, pest management, prescribed burning, prescribed grazing, and wildlife upland habitat management. Bark Beetle, Drought, and Wildfire Bark beetles are rarely found in the San Simon River Watershed and are not a significant concern (USFS 2007). The Climate Assessment for the Southwest (CLIMAS) website (www.ispe.arizona.edu/climas) provides information on Arizona and New Mexico's drought status. Recent precipitation events have placed the areas of Arizona and New Mexico that encompass the San Simon Watershed in the mild and moderate drought status. However, the watershed remains abnormally dry, and continued drought development is likely.
San Simon River Watershed Rapid Watershed Assessment Section 3 - Resource Concerns page 3- 4

The Southwest Coordination Center (www.gacc.nifc.gov/swcc/predictive/outlooks/outlooks.htm) places the San Simon Watershed in the “Above Normal” category for significant wildland fire activity potential due to the abnormally dry and warm conditions. Domestic Animal Concerns Domestic animal concerns occur whenever the quantity and quality of food are not adequate to meet the nutritional requirements of animals, or adequate quantity and quality of water is not provided. This is frequently a concern on rangeland when changes in species composition resulting from poor grazing management and drought can reduce the availability of suitable forage. Conservation practices applied to address this resource concern are generally those that maintain or improve the quantity, quality, and diversity of forage available for animals, reduce the concentration of animals at existing water sources, and insure adequate quantity and reliability of water for the management of domestic animals. Practices may include brush
management, deferred grazing, fencing, pest management, prescribed burning, prescribed grazing, pipelines, ponds, range planting, water spreading, wells, spring development, watering facility, and wildlife upland habitat management. Species of Concern There are 55 threatened and endangered species listed for Arizona (U. S. Fish and Wildlife Service website). In 1990 Arizona voters created the Heritage Fund, designating up to $10 million per year from lottery ticket sales for the conservation and protection of the state’s wildlife and natural areas. The Heritage Fund allowed for the creation of the Heritage Data Management System (HDMS) which identifies elements of concern in Arizona and consolidates information about their status and distribution throughout the state. (Arizona Game & Fish website, 2006) The San Simon River Watershed contains 18 species that are either listed, species of concern, or candidate species, under the U.S. Endangered Species Act (Table 3-2).
Table 3-2: San Simon River Watershed Species of Concern and Endangered Species Classifications and Observations(1)
Common Name Species Name USESA
(2) USFS
(3) BLM (4)
STATE (5)
Last Recorded Observation
Accipiter gentilis Northern Goshawk SC S WSC 1994 Allium bigelovii Bigelow Onion SR 1968 Allium plummerae Plummer Onion SR 1963 Allium rhizomatum Redflower Onion S SR 1980-PRE
Amazilia violiceps Violet-crowned Hummingbird WSC 1995
Ammodramus bairdii Baird's Sparrow SC WSC 1996-WI Anthocharis cethura Felder's Orange Tip S 1964 Apacheria chiricahuensis Chiricahua Rock Flower SR 1977
San Simon River Watershed Rapid Watershed Assessment Section 3 - Resource Concerns page 3- 5

Common Name Species Name USESA
(2) USFS
(3) BLM (4)
STATE (5)
Last Recorded Observation
Aquila chrysaetos Golden Eagle 1979 Arabis tricornuta Chiricahua Rock Cress S 2001 Asclepias lemmonii Lemmon Milkweed S 1989 Astragalus cobrensis var. maguirei Coppermine Milk-vetch SC S SR 1991 Astragalus cobrensis var. maguirei Coppermine Milk-vetch SC S SR 1993 Athene cunicularia hypugaea Western Burrowing Owl SC S 1979 Bat Colony 2001 Carex chihuahuensis A Sedge S 1994
CH for Empidonax traillii extimus
Designated Critical Habitat for southwestern willow flycatcher
CH for Strix occidentalis lucida
Designated Critical Habitat for Mexican spotted owl
CH for Xyrauchen texanus
Designated Critical Habitat for razorback sucker
Choeronycteris mexicana
Mexican Long-tongued Bat SC WSC 2005
Coccyzus americanus occidentalis
Western Yellow-billed Cuckoo C S WSC 1984
Corynorhinus townsendii pallescens
Pale Townsend's Big-eared Bat SC 2005
Crotalus willardi obscurus
New Mexico Ridge-nosed Rattlesnake LT S 1998
Cyprinodon macularius Desert Pupfish LE WSC 1991 Draba standleyi Standley Whitlow-grass SC 1996
Echinocereus ledingii Pinaleno Hedgehog Cactus SR 1979
Empidonax fulvifrons pygmaeus
Northern Buff-breasted Flycatcher SC WSC 2000
Empidonax traillii extimus
Southwestern Willow Flycatcher LE S WSC 1998
Erigeron kuschei Chiricahua Fleabane SC S SR 1982 Escobaria tuberculosa Incense Corycactus SR 1995 Eumops perotis californicus
Greater Western Bonneted Bat SC 1969
Euptilotis neoxenus Eared Quetzal S 1979 Falco peregrinus anatum
American Peregrine Falcon SC S WSC 2005
San Simon River Watershed Rapid Watershed Assessment Section 3 - Resource Concerns page 3- 6
Common Name Species Name USESA
(2) USFS
(3) BLM (4)
STATE (5)
Last Recorded Observation
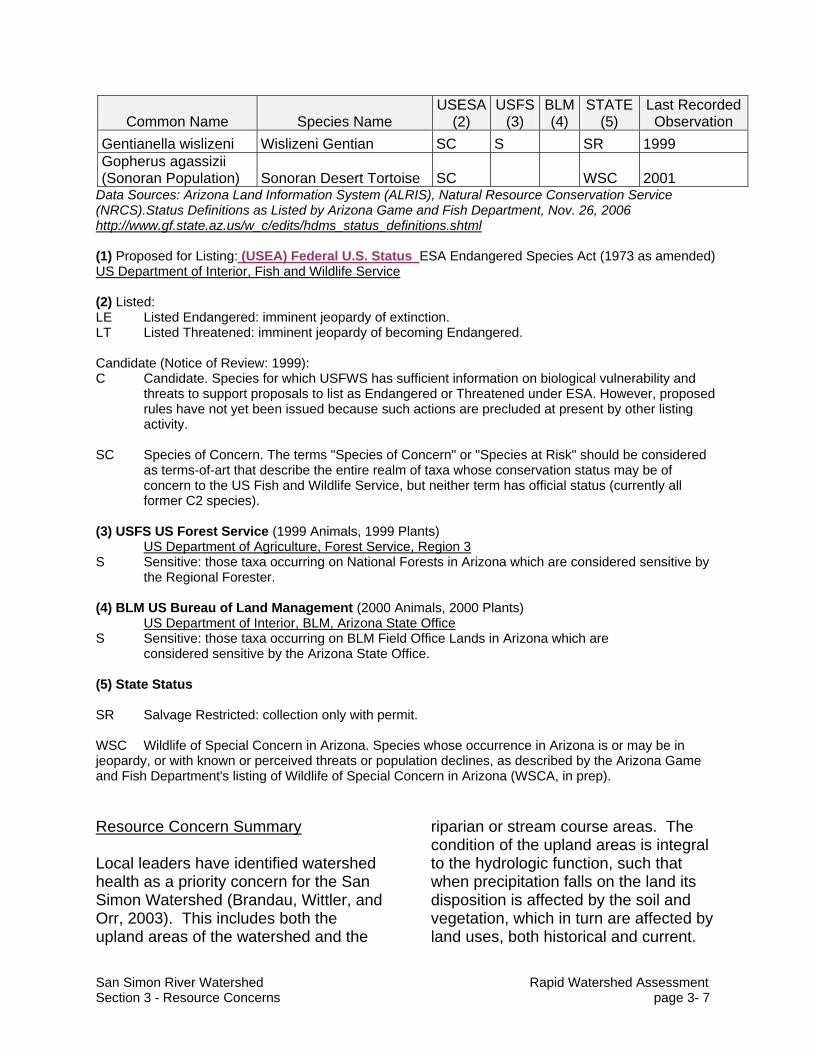
Gentianella wislizeni Wislizeni Gentian SC S SR 1999 Gopherus agassizii (Sonoran Population) Sonoran Desert Tortoise SC WSC 2001
Data Sources: Arizona Land Information System (ALRIS), Natural Resource Conservation Service (NRCS).Status Definitions as Listed by Arizona Game and Fish Department, Nov. 26, 2006 http://www.gf.state.az.us/w_c/edits/hdms_status_definitions.shtml (1) Proposed for Listing: (USEA) Federal U.S. Status ESA Endangered Species Act (1973 as amended) US Department of Interior, Fish and Wildlife Service (2) Listed:LE Listed Endangered: imminent jeopardy of extinction. LT Listed Threatened: imminent jeopardy of becoming Endangered. Candidate (Notice of Review: 1999): C Candidate. Species for which USFWS has sufficient information on biological vulnerability and
threats to support proposals to list as Endangered or Threatened under ESA. However, proposed rules have not yet been issued because such actions are precluded at present by other listing activity.
SC Species of Concern. The terms "Species of Concern" or "Species at Risk" should be considered
as terms-of-art that describe the entire realm of taxa whose conservation status may be of concern to the US Fish and Wildlife Service, but neither term has official status (currently all former C2 species).
(3) USFS US Forest Service (1999 Animals, 1999 Plants)
US Department of Agriculture, Forest Service, Region 3 S Sensitive: those taxa occurring on National Forests in Arizona which are considered sensitive by
the Regional Forester. (4) BLM US Bureau of Land Management (2000 Animals, 2000 Plants)
US Department of Interior, BLM, Arizona State Office S Sensitive: those taxa occurring on BLM Field Office Lands in Arizona which are considered sensitive by the Arizona State Office. (5) State Status SR Salvage Restricted: collection only with permit. WSC Wildlife of Special Concern in Arizona. Species whose occurrence in Arizona is or may be in jeopardy, or with known or perceived threats or population declines, as described by the Arizona Game and Fish Department's listing of Wildlife of Special Concern in Arizona (WSCA, in prep). Resource Concern Summary Local leaders have identified watershed health as a priority concern for the San Simon Watershed (Brandau, Wittler, and Orr, 2003). This includes both the upland areas of the watershed and the
riparian or stream course areas. The condition of the upland areas is integral to the hydrologic function, such that when precipitation falls on the land its disposition is affected by the soil and vegetation, which in turn are affected by land uses, both historical and current.
San Simon River Watershed Rapid Watershed Assessment Section 3 - Resource Concerns page 3- 7

Conservation progress for the previous five years in the San Simon River Watershed has focused on addressing the following primary resource concerns:
The amount of the precipitation which immediately runs off the land surface, and that which infiltrates into the soil to either be used for plant growth or to recharge ground water, is dependent on this critical interface.
Soil Erosion – Sheet and Rill
Erosion Water Quality – Excessive
Suspended Sediment and Turbidity in Surface Water
The San Simon watershed is a mosaic of federal, state and private lands where livestock grazing, agriculture and recreation are the primary land uses. Recreational use includes a designated OHV use area. The San Simon River started to incise early in the 20th century. Starting in the 1930’s the Bureau of Land Management has installed erosion control structures to halt the channel incision. There are currently 19 major detention dams, dikes and earth structures installed in the San Simon Watershed. Erosion and erosion control remain important concerns in the San Simon Watershed.
Water Quantity – Inefficient Water Use on Irrigated Land
Plant Condition – Productivity, Health and Vigor
Domestic Animals – Inadequate Quantities and Quality of Feed and Forage
The following table presents conservation accomplishments in this watershed during fiscal years (FY) 2002 through 2006, according to the NRCS Progress Reporting System (Table 3-3). With access to U.S. Interstate 10 the
private and state lands near the communities of Bowie and San Simon have the potential to experience rapid growth in the future. The southern portion of the San Simon Watershed, with high elevations and moderate temperatures, also has the potential to experience growth in the form of small acreage ranches.
Conservation Progress/Status
San Simon River Watershed Rapid Watershed Assessment Section 3 - Resource Concerns page 3- 8

Table 3-3: San Simon River Watershed Conservation Treatment Applied San Simon River Watershed (15040006) FY02-06
Conservation Treatment Applied TOTAL Brush Management (acres) 480 Conservation Crop Rotation (acres) 1,495 Fence (feet) 8,394 Irrigation System, Sprinkler (acres) 1,203 Irrigation Water Conveyance, Pipeline, Underground, Plastic (feet) 26,872 Irrigation Water Management (acres) 5,177 Nutrient Management (acres) 3,414 Pest Management (acres) 3,414 Pipeline (feet) 37,132 Prescribed Grazing (acres) 141,535 Residue Management, Seasonal (acres) 949 Structure for Water Control (number) 16 Upland Wildlife Habitat Management (acres) 39,430 Watering facility (number) 13
(NRCS, 2007)
San Simon River Watershed Rapid Watershed Assessment Section 3 - Resource Concerns page 3- 9
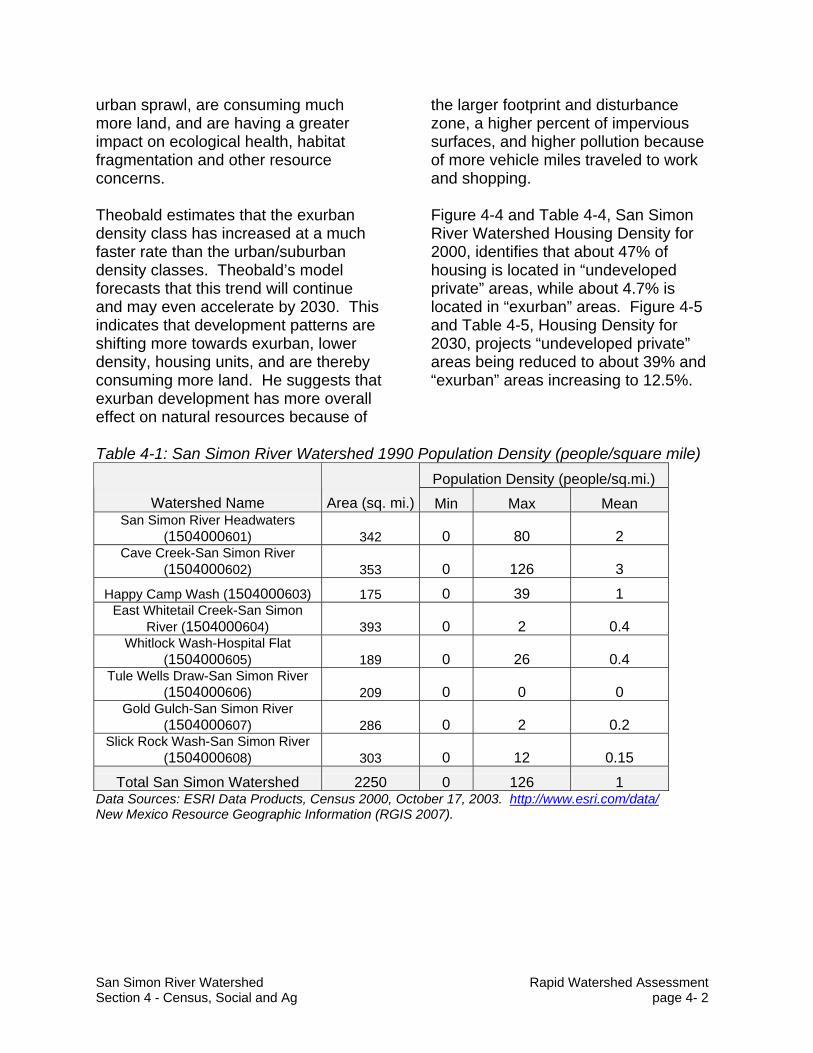
Section 4: Census, Social and Agricultural Data This section discusses the human component of the watershed and the pressure on natural resources caused by humans and by population change. Population Density, 1990 Census block statistics for 1990 were compiled from information prepared by Geo-Lytics (Geo-Lytics, 1998). These data were linked with census block data and used to create a density map (Figure 4-1) through a normalization process using a grid of 7 km squares. This process involves calculating density per census block and intersecting it with the grid, which is then used to calculate the number of people and thus density per grid square. Table 4-1 shows the tabulated minimum, maximum and mean number of people per square mile in 1990 for each watershed. In 1990, the mean population density for the entire watershed was about 1 person per square mile. Cave Creek-San Simon River had the highest population mean with about 3 people per square mile, and a maximum of 126 people per square mile. Population Density, 2000 The Census Block 2000 statistics data were downloaded from the Environmental Systems Research Institute (ESRI) website (ESRI Data Products, 2003) and are shown in Table 4-2. A population density map (Figure 4-2) was created from these data. The mean
population density in 2000 was about 1.4 people per square mile. Slick Rock Wash-San Simon River had the highest mean population density with 7 people per square mile, respectively. East Whitetail Creek-San Simon River had the highest maximum density of 54 people per square mile. Population Density Change, 1990-2000 The 1990 and 2000 population density maps were used to create a population density change map. The resulting map and table (Figure 4-3 and Table 4-3) show population increase or decrease over the ten year time frame. Overall, mean population density showed a zero increase in people per square mile during this ten-year time period. Happy Canyon Wash and Tule Wells Draw at San Simon River both had the highest mean increase in population density at 0.2 people per square mile. Sam Simon Headwater and cave Creek at San Simon River both had the greatest decrease in population at -0.2 people per square mile. Housing Density, 2000 and 2030 The Watershed Housing Density Map for the years 2000 and 2030 were created with data developed by David M. Theobald (Theobald, 2005). Theobald developed a nationwide housing density model that incorporates a thorough way to account for land-use change beyond the “urban fringe.” Exurban regions are the “urban fringe”, or areas outside suburban areas, having population densities greater than 0.68 – 16.18 ha (1.68 – 40 acres) per unit. Theobald stresses that exurban areas are increasing at a much faster rate than
San Simon River Watershed Rapid Watershed Assessment Section 4 - Census, Social and Ag page 4- 1
urban sprawl, are consuming much more land, and are having a greater impact on ecological health, habitat fragmentation and other resource concerns. Theobald estimates that the exurban density class has increased at a much faster rate than the urban/suburban density classes. Theobald’s model forecasts that this trend will continue and may even accelerate by 2030. This indicates that development patterns are shifting more towards exurban, lower density, housing units, and are thereby consuming more land. He suggests that exurban development has more overall effect on natural resources because of
the larger footprint and disturbance zone, a higher percent of impervious surfaces, and higher pollution because of more vehicle miles traveled to work and shopping. Figure 4-4 and Table 4-4, San Simon River Watershed Housing Density for 2000, identifies that about 47% of housing is located in “undeveloped private” areas, while about 4.7% is located in “exurban” areas. Figure 4-5 and Table 4-5, Housing Density for 2030, projects “undeveloped private” areas being reduced to about 39% and “exurban” areas increasing to 12.5%.
Table 4-1: San Simon River Watershed 1990 Population Density (people/square mile)
Population Density (people/sq.mi.) Watershed Name Area (sq. mi.) Min Max Mean
San Simon River Headwaters (1504000601) 342 0 80 2
Cave Creek-San Simon River (1504000602) 353 0 126 3
Happy Camp Wash (1504000603) 175 0 39 1 East Whitetail Creek-San Simon
River (1504000604) 393 0 2 0.4 Whitlock Wash-Hospital Flat
(1504000605) 189 0 26 0.4 Tule Wells Draw-San Simon River
(1504000606) 209 0 0 0 Gold Gulch-San Simon River
(1504000607) 286 0 2 0.2 Slick Rock Wash-San Simon River
(1504000608) 303 0 12 0.15
Total San Simon Watershed 2250 0 126 1 Data Sources: ESRI Data Products, Census 2000, October 17, 2003. http://www.esri.com/data/ New Mexico Resource Geographic Information (RGIS 2007).
San Simon River Watershed Rapid Watershed Assessment Section 4 - Census, Social and Ag page 4- 2

Table 4-2: San Simon River Watershed 2000 Population Density (people/square mile) Population Density (people/sq.mi.)
Watershed Name Area (sq. mi.) Min Max Mean San Simon River Headwaters
(1504000601) 342 0 24 1
Cave Creek-San Simon River (1504000602) 353 0 16 1
East Whitetail Creek-San Simon River (1504000604) 393 0 54 1
Happy Camp Wash (1504000603) 175 0 5 1 Tule Wells Draw-San Simon River
(1504000606) 209 0 3 0.4
Gold Gulch-San Simon River (1504000607) 286 0 5 0.1
Whitlock Wash-Hospital Flat (1504000605) 189 0 0 0
Slick Rock Wash-San Simon River (1504000608) 303 0 252 7
Total San Simon Watershed 2250 0 252 1.4 Data Sources: ESRI Data Products, Census 2000, October 17, 2003. http://www.esri.com/data/ New Mexico Resource Geographic Information (RGIS 2007). Table 4-3: San Simon River Watershed 1990 to 2000 Population Density Change (people/square mile)
Population Density (people/sq. mile) Watershed Name Area (sq. mile)
Min Max Mean San Simon River Headwaters
(1504000601) 342 -80 23 -2 Cave Creek-San Simon River
(1504000602) 353 -110 6 -2 East Whitetail Creek-San Simon
River (1504000604) 393 -21 15 0
Happy Camp Wash (1504000603) 175 -2 3 0.2 Tule Wells Draw-San Simon River
(1504000606) 209 -1 2 0.2 Gold Gulch-San Simon River
(1504000607) 286 -2 9 0 Whitlock Wash-Hospital Flat
(1504000605) 189 0 0 0 Slick Rock Wash-San Simon River
(1504000608) 303 -53 107 3
Total San Simon Watershed 2250 -110 107 0 Data Sources: ESRI Data Products, Census 2000, October 17, 2003. http://www.esri.com/data/ New Mexico Resource Geographic Information (RGIS 2007).
San Simon River Watershed Rapid Watershed Assessment Section 4 - Census, Social and Ag page 4- 3

Table 4-4: San Simon River Watershed Housing Density 2000 (Percent of Watershed) (Part 1of 2)*
Housing Density
San Simon River
Headwaters Slick Rock
1504000601
Cave Creek-San Simon
River 1504000602
Happy Camp Wash
1504000603
East Whitetail Creek-San
Simon River 1504000604
Undeveloped Private 57.8% 50.9% 86.1% 30.3%
Rural 42.0% 48.5% 13.8% 67.3% Exurban 0.2% 0.6% 0.1% 2.2%
Suburban 0.0 0.0 0.0 0.1% Urban 0.0 0.0 0.0 0.0
San Simon Watershed (sq. miles)
342 353 175 393
Table 4-4: San Simon River Watershed Housing Density 2000 (Percent of Watershed) (Part 2 of 2)*
Housing Density
Whitlock Wash-Hospital
Flat (1504000605)
Tule Wells Draw-San
Simon River (1504000606)
Gold Gulch-San Simon
River (1504000607)
Slick Rock Wash-San
Simon River (1504000608)
Undeveloped Private
92.2% 57.7% 95.4% 47.3%
Rural 7.7% 40.5% 3.9% 46.1% Exurban 0.1% 1.6% 0.6% 4.7%
Suburban 0.2% 1.1% Urban 0.1% 0.9%
San Simon Watershed (sq. miles)
189 209 286 303
Source: Arizona Land Information System (ALRIS 2004), Natural Resource Conservation Service (NRCS 2006) and Theobald (2005). *All calculations are based on GIS data layer “housing density (Theobald, 2005).”
San Simon River Watershed Rapid Watershed Assessment Section 4 - Census, Social and Ag page 4- 4

Table 4-5: San Simon River Watershed Housing Density 2030 (Percent of Watershed) (Part 1 of 2)*
Housing Density
San Simon River
Headwaters Slick Rock
(1504000601)
Cave Creek-San Simon
River (1504000602)
Happy Camp Wash
(1504000603)
East Whitetail Creek-San
Simon River (1504000604)
Undeveloped Private 17.5% 32.0% 9.6% 6.4%
Rural 69.5% 46.8% 84.9% 59.9% Exurban 13.0% 20.9% 5.5% 32.6%
Suburban 0.3% 1.0% Urban 0.1
San Simon Watershed (sq. miles)
342 353 175 393
Table 4-5: San Simon River Watershed Housing Density 2030 (Percent of Watershed) (Part 2 of 2)*
Housing Density
Whitlock Wash-Hospital
Flat (1504000605)
Tule Wells Draw-San
Simon River (1504000606)
Gold Gulch-San Simon
River (1504000607)
Slick Rock Wash-San
Simon River (1504000608)
Undeveloped Private 88.4% 8.2% 23.9% 39.0%
Rural 11.3% 64.6% 74.3% 42.5% Exurban 0.2% 24.8% 1.8% 12.5%
Suburban 0.1% 1.7% 4.5% Urban 0.7% 1.5%
San Simon Watershed (sq. miles)
189 209 286 303
Source: Arizona Land Information System (ALRIS 2004), Natural Resource Conservation Service (NRCS 2006) and Theobald (2005). *All calculations are based on GIS data layer “housing density (Theobald, 2005).” San Simon River Watershed Agricultural Statistics Arizona is known as one of the most productive and efficient agricultural regions in the world, with beauty that also provides the food and fiber to sustain life in the desert. Arizona is also one of the most diverse agricultural producing states in the nation, producing more than 160 varieties of vegetables, livestock, field crops and
nursery stock. The climate, natural resources, agribusiness infrastructure and farm heritage help make agriculture a $9.2 billion dollar industry employing more than 72,000 individuals. According to the United States Department of Agriculture’s, 2002 Census, there are more than 7,000 farms and ranches, seventy-eight percent of which are owned by individuals or families. The total
San Simon River Watershed Rapid Watershed Assessment Section 4 - Census, Social and Ag page 4- 5

farmland in Arizona is comprised of more than 26,000,000 acres with irrigated crops on 1,280,000 acres and pasture for animals on 23,680,000. Agriculture in general on the San Simon Watershed is comprised of:
• Considerable grazing land for many livestock operations
• Multiple recreational equestrian facilities
• A number of apiary (honey bee) operations
• Large plantings of pecans and a few pistachios and walnuts
• A significant amount of chili production
• A few mixed crops including: Alfalfa Small grains
• Vineyards and grapes • Miscellaneous plantings of fruit
trees, including apples, peaches, nectarines and plums
Of the 323 farms that have pasture and rangeland, 75% have 100 or more acres. Seventy-three percent of all farms in the watershed are less than 1,000 acres in size. Of the 211 farms that harvest crops, 47% are 49 acres or less in size. To derive the data, the NASS (National Agricultural Statistics Service, United States Department of Agriculture) has farm data by zip code. We used the U.S. Census Bureau ZIP Census Tabulation Areas (ZCTA) to generate maps. A typical 5-digit ZCTA (there are 3-digit ZCTAs as well) is typically nearly identical to a 5-digit U.S. Postal Service ZIP code, but there are some distinctions. Unlike ZIP codes, ZCTA areas are spatially complete and they
are easier to map. The Bureau created special `XX ZCTAs (ZCTAs with a valid 3-digit ZIP but with “XX” as last two characters of the code) which represent large unpopulated areas where it made no sense to assign a census block to an actual ZIP code. Similarly, HH ZCTAs represent large bodies of water within a 3-digit zip area. There is typically no population in either an XX or HH ZCTA. Data is withheld by NASS for categories with one to four farms. This is to protect the identity of individual farmers. Farm counts for these zip codes are included in the "State Total" category. Some categories only contained stars instead of numbers. Each star was counted as one farm. But because each star could represent as many as 4 farms, each number on the tables are actually greater than or equal to the number listed. In some cases this results in percentages that add up to more or less that 100 percent. Tables for the San Simon Watershed include data from zip codes both contained within the watershed and zip codes crossing watershed boundaries.
San Simon River Watershed Rapid Watershed Assessment Section 4 - Census, Social and Ag page 4- 6

Figure 4-6: San Simon River Watershed Farms by Size (2002)
0%5%
10%15%20%25%30%35%40%45%50%
1 to 49 acres 50 to 999 acres >1000 acres
Perc
ent f
arm
s
Table 4-6: San Simon River Wash Watershed Farms by Size All farms 1 to 49 acres 50 to 999 acres >1000 acres 610 26% 47% 26% Percents rounded. Data source: NASS (National Agricultural Statistics Service, United States Department of Agriculture)
Figure 4-7: San Simon Watershed Pasture and Rangeland (2002)
050
100150200250300350
Total Farms Farms with 100acres or more
num
ber o
f far
ms
Permanent Pasture and Rangeland All Other Land
f
Table 4-7: San Simon River Watershed Pasture and Rangeland Category Total farms Farms 100 acres or more Permanent pasture and rangeland 323 75
All other land 295 11 Percents rounded. Data source: NASS (National Agricultural Statistics Service, United States Department of Agriculture)
San Simon River Watershed Rapid Watershed Assessment Section 4 - Census, Social and Ag page 4- 7
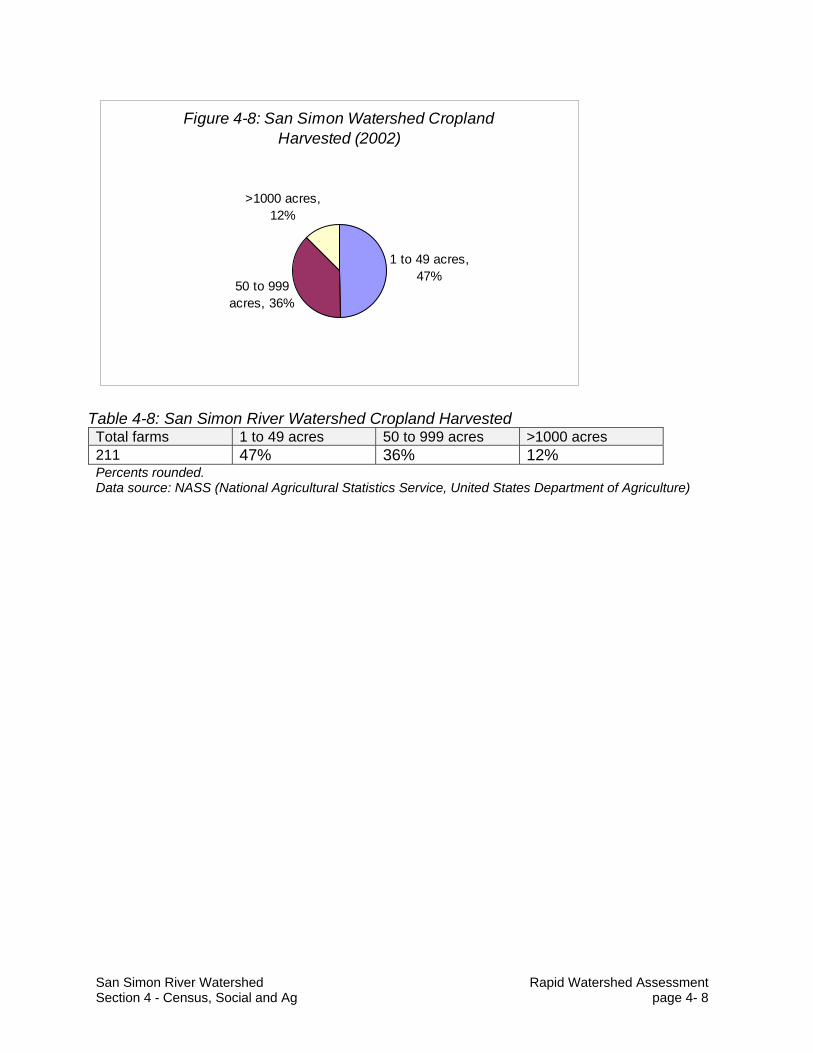
Figure 4-8: San Simon Watershed Cropland Harvested (2002)
1 to 49 acres, 47%
50 to 999 acres, 36%
>1000 acres, 12%
Table 4-8: San Simon River Watershed Cropland Harvested Total farms 1 to 49 acres 50 to 999 acres >1000 acres 211 47% 36% 12% Percents rounded. Data source: NASS (National Agricultural Statistics Service, United States Department of Agriculture)
San Simon River Watershed Rapid Watershed Assessment Section 4 - Census, Social and Ag page 4- 8

Section 5: Resource Assessment Tables The following Resource Assessment Tables summarize current and desired future natural resource conditions for the San Simon River Watershed. The tables present information on benchmark and future conservation systems and practices, qualitative effects on primary resource concerns, and estimated costs for conservation implementation. Conservation District board members, NRCS conservationists, and other people familiar with conservation work in the watershed were consulted for estimating current and future natural resource conditions. The tables show three levels of conservation treatment (Baseline, Progressive, Resource Management System) for each of the major land uses (crop, range, forest) within the watershed. Baseline is defined as a low level of conservation adoption with landowners who are typically not participating in conservation programs. There are, however, a few practices that have been commonly adopted by all landowners in this watershed. Progressive is defined as an intermediate level of conservation adoption with landowners who are actively participating in conservation programs and have adopted several practices but not satisfied all of the Quality Criteria in the NRCS Field Office Technical Guide. Resource Management System (RMS) is defined as a complete system of conservation practices that addresses all of the Soil, Water, Air, Plant, and Animal (SWAPA) resource concerns typically seen for this land use in this watershed.
For each land use, the results of the assessment are presented in two parts. Part 1 (Assessment Information) summarizes the conservation practices at each treatment level and the quantities of practices for current benchmark conditions and projected future conditions. Part 1 also displays the four primary resource concerns, along with individual practice effects and an overall Systems Rating (ranging from a low of 1 to a high of 5) indicating the effectiveness of the conservation system used at each treatment level. Part 2 (Conservation Cost Table) summarizes the installation, management, and related costs by conservation practice and treatment level for the projected future conditions by federal and private share of the costs. Part 2 also displays the benchmark and future conservation conditions status bars. Credit goes to NRCS in Oregon for development of the template for these Resource Assessment Tables. NOTE: the numbers in the first column of each table represent NRCS conservation practice codes.
San Simon River Watershed Rapid Watershed Assessment Section 5 - Resource Assessment page 5- 1

WA
TER
SH
ED
NA
ME
& C
OD
E
SA
N S
IMO
N R
IVE
R -
1504
0006
LA
ND
US
E A
CR
ES
19
,255
LAN
DU
SE
TY
PE
C
RO
P
TYP
ICA
L U
NIT
SIZ
E A
CR
ES
1,
000
AS
SE
SS
ME
NT
INFO
RM
ATI
ON
C
ALC
UL
ATE
D P
AR
TIC
IPA
TIO
N
81%
B
ench
mar
k C
ondi
tions
Fu
ture
Con
ditio
ns
RE
SO
UR
CE
CO
NC
ER
NS
Con
serv
atio
n S
yste
ms
by T
reat
men
t Lev
el
Tota
l U
nits
E
xist
ing
Unc
hang
ed
Uni
ts
New
Tr
eatm
ent
Uni
ts
Tota
l U
nits
Soi
l Con
ditio
n –
Org
anic
M
atte
r D
eple
tion
Wat
er
Qua
ntity
–
Inef
ficie
nt
Wat
er U
se o
n Ir
riga
ted
Land
Wat
er Q
ualit
y –
Exc
essi
ve
Nut
rien
ts a
nd
Org
anic
s in
G
roun
dwat
er
Air
Qua
lity
– P
artic
ulat
e m
atte
r le
ss
than
10
mic
rom
eter
s in
dia
met
er
(PM
10)
Bas
elin
e S
yste
m R
atin
g ->
1
5 2
0
Irrig
atio
n La
nd L
evel
ing
(ac
.) 4
64
722
108
0 10
8 0
4 0
0 Ir
rigat
ion
Sys
tem
, Sur
face
and
Sub
surf
ace
(ac.
) 4
43
2,88
8 43
3 0
433
0 4
0 0
Irrig
atio
n W
ater
Con
veya
nce,
Ditc
h an
d C
anal
Lin
ing
(ft.)
428
2,
888
433
0 43
3 2
4 2
0 Ir
rigat
ion
Wat
er C
onve
yanc
e, P
ipel
ine
(ft.)
430
1,
444
217
0 21
7 2
5 3
0 S
truc
ture
for W
ater
Con
trol
(n
o.)
587
3 0
0 0
0 3
0 0
Tota
l Acr
eage
at B
asel
ine
2,88
8 43
3 0
433
P
rogr
essi
ve
Sys
tem
Rat
ing
->
4 5
4 3
Con
serv
atio
n C
rop
Rot
atio
n (
ac.)
328
1,
926
481
289
770
4 3
1 3
Irrig
atio
n La
nd L
evel
ing
(ac
.) 4
64
963
313
72
385
0 4
0 0
Irrig
atio
n S
yste
m, S
urfa
ce a
nd S
ubsu
rfac
e (a
c.)
443
96
3 38
5 0
385
0 4
0 0
Irrig
atio
n W
ater
Con
veya
nce,
Ditc
h an
d C
anal
Lin
ing
(ft.)
428
9,
628
2,69
6 1,
155
3,85
1 2
4 2
0 Ir
rigat
ion
Wat
er C
onve
yanc
e, P
ipel
ine
(ft.)
430
1,
926
626
144
770
2 5
3 0
Irrig
atio
n W
ater
Man
agem
ent
(ac.
) 44
9 1,
926
481
289
770
4 5
5 3
Res
idue
Man
agem
ent,
Sea
sona
l (a
c.)
344
963
241
144
385
3 1
-1
3 S
truc
ture
for W
ater
Con
trol
(n
o.)
587
10
3 1
4 0
3 0
0 To
tal A
crea
ge a
t Pro
gres
sive
Lev
el
1,92
6 48
1 28
9 77
0
RM
S
Sys
tem
Rat
ing
->
4 5
4 3
Con
serv
atio
n C
rop
Rot
atio
n (
ac.)
328
14
,441
15
,885
2,
166
18,0
52
4 3
1 3
Irrig
atio
n La
nd L
evel
ing
(ac
.) 4
64
14,4
41
15,7
05
2,34
7 18
,052
0
4 0
0 Ir
rigat
ion
Sys
tem
, Mic
roirr
igat
ion
(ac.
) 44
1 1,
444
1,44
4 36
1 1,
805
0 4
0 0
Irrig
atio
n S
yste
m, S
prin
kler
(ac.
) 44
2 1,
444
1,44
4 36
1 1,
805
0 4
0 0
Irrig
atio
n S
yste
m, S
urfa
ce a
nd S
ubsu
rfac
e (a
c.)
443
14
,441
17
,330
72
2 18
,052
0
4 0
0 Ir
rigat
ion
Wat
er C
onve
yanc
e, D
itch
and
Can
al L
inin
g (ft
.) 4
28
144,
413
153,
799
26,7
16
180,
516
2 4
2 0
Irrig
atio
n W
ater
Con
veya
nce,
Pip
elin
e (f
t.) 4
30
28,8
83
31,4
10
4,69
3 36
,103
2
5 3
0 Ir
rigat
ion
Wat
er M
anag
emen
t (a
c.)
449
14,4
41
15,8
85
2,16
6 18
,052
4
5 5
3 N
utrie
nt M
anag
emen
t (a
c.)
590
14,4
41
14,4
41
3,61
0 18
,052
3
1 5
1 P
est M
anag
emen
t (a
c.)
595
14,4
41
14,4
41
3,61
0 18
,052
0
1 0
0 R
esid
ue a
nd T
illag
e M
anag
emen
t, M
ulch
Till
(ac
.) 34
5 7,
221
7,22
1 1,
805
9,02
6 3
1 -1
3
Res
idue
Man
agem
ent,
Sea
sona
l (a
c.)
344
7,22
1 7,
943
1,08
3 9,
026
3 1
-1
3 S
truc
ture
for W
ater
Con
trol
(n
o.)
587
144
154
27
181
0 3
0 0
Tota
l Acr
eage
at R
MS
Lev
el
14,4
41
14,4
41
3,61
0 18
,052
San Simon River Watershed Rapid Watershed Assessment Section 5 - Resource Assessment page 5- 2

WA
TER
SH
ED
NA
ME
& C
OD
E
SA
N S
IMO
N R
IVE
R -
1504
0006
LA
ND
US
E A
CR
ES
19
,255
LAN
DU
SE
TY
PE
C
RO
P
TYP
ICA
L U
NIT
SIZ
E A
CR
ES
1,
000
CO
NS
ER
VA
TIO
N C
OS
T TA
BLE
C
ALC
ULA
TED
PA
RTI
CIP
ATI
ON
81
%
FU
TUR
E
FED
ER
AL
PR
IVA
TE
Inst
alla
tion
Cos
t M
anag
emen
tC
ost -
3 y
rs
Tech
nica
l A
ssis
tanc
e In
stal
latio
n C
ost
Ann
ual O
& M
+ M
gt C
osts
C
onse
rvat
ion
Sys
tem
s by
Tre
atm
ent L
evel
N
ew
Trea
tmen
t U
nits
50
%
100%
20
%
Tota
l Pre
sent
V
alue
Cos
t 50
%
100%
Tota
l Pre
sent
V
alue
Cos
t
Pro
gres
sive
Con
serv
atio
n C
rop
Rot
atio
n (
ac.)
328
28
9 $0
$8
,665
$1
,733
$9
,453
$0
$2
,888
$4
,446
Irrig
atio
n La
nd L
evel
ing
(ac
.) 4
64
72
$36,
103
$0
$7,2
21
$43,
324
$36,
103
$2,1
66
$45,
228
Irrig
atio
n S
yste
m, S
urfa
ce a
nd S
ubsu
rface
(ac.
) 44
3 0
$0
$0
$0
$0
$0
$0
$0Irr
igat
ion
Wat
er C
onve
yanc
e, D
itch
and
Can
al L
inin
g (ft
.) 4
28
1,15
5 $4
,621
$0
$9
24
$5,5
45
$4,6
21
$185
$5
,400
Irrig
atio
n W
ater
Con
veya
nce,
Pip
elin
e (ft
.) 4
30
144
$722
$0
$1
44
$866
$7
22
$29
$844
Irrig
atio
n W
ater
Man
agem
ent
(ac.
) 44
9 28
9 $0
$8
,665
$1
,733
$9
,453
$0
$2
,888
$4
,446
Res
idue
Man
agem
ent,
Sea
sona
l (a
c.)
344
144
$0
$2,5
99
$520
$2
,836
$0
$8
66
$1,3
34S
truct
ure
for W
ater
Con
trol
(no.
) 58
7 1
$173
$0
$3
5 $2
08
$173
$7
$2
02
Sub
tota
l 28
9 $4
1,62
0 $1
9,92
9 $1
2,31
0 $7
1,68
6 $4
1,62
0 $9
,030
$6
1,90
0R
MS
Con
serv
atio
n C
rop
Rot
atio
n (
ac.)
328
2,
166
$0
$64,
986
$12,
997
$70,
900
$0
$21,
662
$33,
345
Irrig
atio
n La
nd L
evel
ing
(ac
.) 4
64
2,34
7 $1
,173
,352
$0
$2
34,6
70
$1,4
08,0
22
$1,1
73,3
52
$70,
401
$1,4
69,9
07Irr
igat
ion
Sys
tem
, Mic
roirr
igat
ion
(ac.
) 44
1 36
1 $2
70,7
73
$0
$54,
155
$324
,928
$2
70,7
73
$27,
077
$384
,833
Irrig
atio
n S
yste
m, S
prin
kler
(ac.
) 44
2 36
1 $3
06,8
77
$0
$61,
375
$368
,252
$3
06,8
77
$12,
275
$358
,584
Irrig
atio
n S
yste
m, S
urfa
ce a
nd S
ubsu
rface
(ac.
) 44
3 72
2 $0
$0
$0
$0
$0
$0
$0
Irrig
atio
n W
ater
Con
veya
nce,
Ditc
h an
d C
anal
Lin
ing
(ft.)
428
26
,716
$1
06,8
65
$0
$21,
373
$128
,238
$1
06,8
65
$4,2
75
$124
,871
Irrig
atio
n W
ater
Con
veya
nce,
Pip
elin
e (ft
.) 4
30
4,69
3 $2
3,46
7 $0
$4
,693
$2
8,16
0 $2
3,46
7 $9
39
$27,
421
Irrig
atio
n W
ater
Man
agem
ent
(ac.
) 44
9 2,
166
$0
$64,
986
$12,
997
$70,
900
$0
$21,
662
$33,
345
Nut
rient
Man
agem
ent
(ac.
) 59
0 3,
610
$0
$108
,309
$2
1,66
2 $1
18,1
66
$0
$36,
103
$55,
575
Pes
t Man
agem
ent
(ac.
) 59
5 3,
610
$0
$108
,309
$2
1,66
2 $1
18,1
66
$0
$36,
103
$55,
575
Res
idue
and
Till
age
Man
agem
ent,
Mul
ch T
ill (a
c.) 3
45
1,80
5 $0
$4
6,03
1 $9
,206
$5
0,22
1 $0
$1
5,34
4 $2
3,62
0R
esid
ue M
anag
emen
t, S
easo
nal
(ac.
) 34
4 1,
083
$0
$19,
496
$3,8
99
$21,
270
$0
$6,4
99
$10,
004
Stru
ctur
e fo
r Wat
er C
ontro
l (n
o.)
587
27
$4,0
07
$0
$801
$4
,809
$4
,007
$1
60
$4,6
83
Sub
tota
l 3,
610
$1,8
85,3
41
$412
,117
$4
59,4
92
$2,7
12,0
31
$1,8
85,3
41
$252
,499
$2
,581
,763
Gra
nd T
otal
3,
899
$1,9
26,9
61
$432
,046
$4
71,8
01
$2,7
83,7
17
$1,9
26,9
61
$261
,529
$2
,643
,663
Cha
rt R
efer
s To
La
ndus
e Ty
pe
CR
OP
C
alcu
late
d P
artic
ipat
ion
Rat
e 81
%
A
vera
ge P
V C
osts
per
Ac
Sys
tem
Fe
dera
l P
riva
te
Pro
g $2
48.2
0 $2
14.3
2
R
MS
$7
51.1
9 $7
15.1
1
San Simon River Watershed Rapid Watershed Assessment Section 5 - Resource Assessment page 5- 3

WAT
ERSH
ED N
AME
& CO
DE
SAN
SIM
ON R
IVER
- 15
0400
06
LAND
USE
ACRE
S 1,
393,7
64
LAND
USE
TYPE
RA
NGE
TYPI
CAL
UNIT
SIZ
E AC
RES
50,0
00
ASSE
SSM
ENT
INFO
RMAT
ION
CALC
ULAT
ED P
ARTI
CIPA
TION
50
%
Be
nchm
ark
Cond
ition
s Fu
ture
Con
ditio
ns
RESO
URCE
CON
CERN
S
Cons
erva
tion
Syst
ems b
y Tre
atm
ent L
evel
Tota
l Un
its
Exist
ing
Unch
ange
dUn
its
New
Trea
tmen
tUn
its
Tota
l Un
its
Soil E
rosio
n –
Shee
t and
Rill
Wat
er Q
ualit
y –
Exce
ssiv
e Su
spen
ded
Sedi
men
t and
Tu
rbid
ity in
Su
rface
Wat
er
Plan
t Co
nditi
on –
Prod
uctiv
ity,
Healt
h an
d Vi
gor
Dom
estic
An
imal
s –
Inad
equa
te
Quan
titie
s and
Qu
ality
of
Feed
and
Fora
ge
Base
line
Syst
em R
atin
g ->
1
3 0
0
Fenc
e (
ft.)
382
104,
532
52,2
66
0 52
,266
0
1 1
1 Pi
pelin
e (
ft.)
516
104,
532
52,2
66
0 52
,266
3
3 0
0 W
ater
ing F
acilit
y (no
.) 6
14
209
105
0 10
5 0
4 1
0 To
tal A
crea
ge a
t Bas
eline
1,
045,
323
522,6
62
0 52
2,662
Prog
ress
ive
Syst
em R
atin
g ->
4
3 4
4
Fenc
e (
ft.)
382
69,6
88
60,9
77
104,
532
165,
509
0 1
1 1
Pipe
line
(ft.
) 51
6 69
,688
60
,977
10
4,53
2 16
5,50
9 3
3 0
0 Pr
escr
ibed
Burn
ing
(ac.)
338
13
,938
6,
969
26,1
33
33,1
02
1 1
4 4
Pres
cribe
d Gr
azing
(a
c.) 5
28
139,
376
69,6
88
261,
331
331,
019
5 3
5 5
Wat
ering
Fac
ility (
no.)
614
56
80
52
13
2 0
4 1
0 To
tal A
crea
ge a
t Pro
gres
sive L
evel
13
9,376
69
,688
26
1,33
1 33
1,019
RMS
Syst
em R
atin
g ->
4
4 5
5
Brus
h M
anag
emen
t (a
c.) 3
14
20,9
06
20,9
06
33,1
02
54,0
08
4 4
5 3
Fenc
e (
ft.)
382
209,
065
270,
042
270,
042
540,
084
0 1
1 1
Pipe
line
(ft.
) 51
6 20
9,06
5 27
0,04
2 27
0,04
2 54
0,08
4 3
3 0
0 Pr
escr
ibed
Burn
ing
(ac.)
338
20
,906
27
,875
26
,133
54
,008
1
1 4
4 Pr
escr
ibed
Graz
ing
(ac.)
528
20
9,06
5 27
8,75
3 26
1,33
1 54
0,08
4 5
3 5
5 Ra
nge
Plan
ting
(ac
.) 5
50
20,9
06
20,9
06
33,1
02
54,0
08
4 2
5 5
Uplan
d W
ildlife
Hab
itat M
anag
emen
t (a
c.) 6
45
209,
065
209,
065
331,
019
540,
084
0 0
4 1
Wat
ering
Fac
ility (
no.)
614
20
9 28
9 25
1 54
0 0
4 1
0 W
ildlife
Wat
ering
Fac
ility
(no.
) 64
8 42
42
66
10
8 0
4 1
0 To
tal A
crea
ge at
RM
S Le
vel
209,0
65
209,0
65
331,
019
540,0
84
San Simon River Watershed Rapid Watershed Assessment Section 5 - Resource Assessment page 5- 4

WAT
ERSH
ED N
AME
& CO
DE
SAN
SIM
ON
RIVE
R - 1
5040
006
LAND
USE
ACRE
S 1,
393,
764
LAND
USE
TYPE
RA
NGE
TYPI
CAL
UNIT
SIZ
E AC
RES
50,0
00
CONS
ERVA
TIO
N CO
ST T
ABLE
CA
LCUL
ATED
PAR
TICI
PATI
ON
50%
FU
TURE
FE
DERA
L PR
IVAT
E
Inst
alla
tion
Cost
M
anag
emen
tCo
st -
3 yr
s Te
chni
cal
Assis
tanc
e In
stal
latio
n Co
st
Annu
al O
& M
+ M
gt C
osts
C
onse
rvat
ion
Syst
ems
by T
reat
men
t Lev
el
New
Trea
tmen
t Un
its
50%
10
0%
20%
Tota
l Pre
sent
Va
lue
Cost
50
%
100%
Tota
l Pre
sent
Va
lue
Cost
Prog
ress
ive
Fenc
e (
ft.)
382
104,
532
$156
,798
$0
$3
1,36
0 $1
88,1
58
$156
,798
$6
,272
$1
83,2
18Pi
pelin
e (
ft.)
516
104,
532
$418
,129
$0
$8
3,62
6 $5
01,7
55
$418
,129
$1
6,72
5 $4
88,5
82Pr
escr
ibed
Bur
ning
(a
c.)
338
26,1
33
$653
,327
$0
$1
30,6
65
$783
,992
$6
53,3
27
$13,
067
$708
,368
Pres
crib
ed G
razin
g (
ac.)
528
26
1,33
1 $1
95,9
98
$0
$39,
200
$235
,198
$1
95,9
98
$0
$195
,998
Wat
erin
g Fa
cility
(no.
) 61
4 52
$2
6,13
3 $0
$5
,227
$3
1,36
0 $2
6,13
3 $1
,568
$3
2,73
8
Subt
otal
26
1,33
1 $1
,450
,386
$0
$2
90,0
77
$1,7
40,4
63
$1,4
50,3
86
$37,
632
$1,6
08,9
04RM
S
Brus
h M
anag
emen
t (a
c.)
314
33,1
02
$1,9
86,1
14
$0
$397
,223
$2
,383
,336
$1
,986
,114
$3
9,72
2 $2
,153
,438
Fenc
e (
ft.)
382
270,
042
$405
,063
$0
$8
1,01
3 $4
86,0
75
$405
,063
$1
6,20
3 $4
73,3
14Pi
pelin
e (
ft.)
516
270,
042
$1,0
80,1
67
$0
$216
,033
$1
,296
,201
$1
,080
,167
$4
3,20
7 $1
,262
,169
Pres
crib
ed B
urni
ng
(ac.
) 33
8 26
,133
$6
53,3
27
$0
$130
,665
$7
83,9
92
$653
,327
$1
3,06
7 $7
08,3
68Pr
escr
ibed
Gra
zing
(ac
.) 5
28
261,
331
$195
,998
$0
$3
9,20
0 $2
35,1
98
$195
,998
$0
$1
95,9
98Ra
nge
Plan
ting
(ac
.) 5
50
33,1
02
$993
,057
$0
$1
98,6
11
$1,1
91,6
68
$993
,057
$1
9,86
1 $1
,076
,719
Upla
nd W
ildlif
e Ha
bita
t Man
agem
ent
(ac.
) 64
5 33
1,01
9 $0
$1
,290
,974
$2
58,1
95
$1,4
08,4
58
$0
$430
,325
$6
62,4
21W
ater
ing
Faci
lity (n
o.)
614
251
$125
,439
$0
$2
5,08
8 $1
50,5
27
$125
,439
$7
,526
$1
57,1
42W
ildlif
e W
ater
ing
Facil
ity
(no.
) 64
8 66
$3
3,10
2 $0
$6
,620
$3
9,72
2 $3
3,10
2 $6
62
$35,
891
Subt
otal
33
1,01
9 $5
,472
,266
$1
,290
,974
$1
,352
,648
$7
,975
,177
$5
,472
,266
$5
70,5
72
$6,7
25,4
60
Gra
nd T
otal
59
2,35
0 $6
,922
,652
$1
,290
,974
$1
,642
,725
$9
,715
,640
$6
,922
,652
$6
08,2
04
$8,3
34,3
64
Char
t Ref
ers
To
Land
use
Type
RA
NGE
Calc
ulat
ed P
artic
ipat
ion
Rate
50
%
Av
erag
e PV
Cos
ts p
er A
c
Sy
stem
Fe
dera
l Pr
ivat
e
Pr
og
$6.6
6 $6
.16
RMS
$24.
09
$20.
32
San Simon River Watershed Rapid Watershed Assessment Section 5 - Resource Assessment page 5- 5

WAT
ERSH
ED N
AME
& CO
DE
SAN
SIM
ON R
IVER
- 15
0400
06
LAND
USE
ACRE
S 24
,728
LAND
USE
TYPE
FO
REST
TY
PICA
L UN
IT S
IZE
ACRE
S 50
,000
ASSE
SSM
ENT
INFO
RMAT
ION
CALC
ULAT
ED P
ARTI
CIPA
TION
10
%
Be
nchm
ark
Cond
ition
s Fu
ture
Con
ditio
ns
RESO
URCE
CON
CERN
S
Cons
erva
tion
Syst
ems
by T
reat
men
t Lev
el
Tota
l Un
its
Exis
ting
Unch
ange
d Un
its
New
Trea
tmen
tUn
its
Tota
l Un
its
Soil
Eros
ion
– Sh
eet a
nd R
ill
Wat
er Q
ualit
y –
Exce
ssiv
e Su
spen
ded
Sedi
men
t and
Tu
rbid
ity in
Su
rface
Wat
er
Plan
t Co
nditi
on –
Pr
oduc
tivity
, He
alth
and
Vi
gor
Dom
estic
An
imal
s –
Inad
equa
te
Quan
titie
s an
d Qu
ality
of
Feed
and
Fo
rage
Base
line
Syst
em R
atin
g ->
1
3 0
0
Fenc
e (
ft.)
382
2,47
3 2,
226
0 2,
226
0 1
1 1
Pipe
line
(ft.
) 51
6 2,
473
2,22
6 0
2,22
6 3
3 0
0 W
ater
ing
Facil
ity (n
o.)
614
5 4
0 4
0 4
1 0
Tota
l Acr
eage
at B
asel
ine
24,7
28
22,2
55
0 22
,255
Prog
ress
ive
Syst
em R
atin
g ->
4
3 4
4
Fenc
e (
ft.)
382
0 12
4 49
5 61
8 0
1 1
1 Pi
pelin
e (
ft.)
516
0 12
4 49
5 61
8 3
3 0
0 Pr
escr
ibed
Bur
ning
(a
c.)
338
0 0
124
124
1 1
4 4
Pres
crib
ed G
razin
g (
ac.)
528
0
0 1,
236
1,23
6 5
3 5
5 W
ater
ing
Facil
ity (n
o.)
614
0 0
0 0
0 4
1 0
Tota
l Acr
eage
at P
rogr
essi
ve L
evel
0
0 1,
236
1,23
6
RMS
Syst
em R
atin
g ->
5
4 5
3
Brus
h M
anag
emen
t (a
c.)
314
0 0
124
124
4 4
5 3
Fenc
e (
ft.)
382
0 12
4 1,
113
1,23
6 0
1 1
1 Pi
pelin
e (
ft.)
516
0 12
4 1,
113
1,23
6 3
3 0
0 Pr
escr
ibed
Bur
ning
(a
c.)
338
0 0
124
124
1 1
4 4
Pres
crib
ed G
razin
g (
ac.)
528
0
0 1,
236
1,23
6 5
3 5
5 Tr
ee/S
hrub
Est
ablis
hmen
t (a
c.)
612
0 0
124
124
5 1
4 -3
Up
land
Wild
life H
abita
t Man
agem
ent
(ac.
) 64
5 0
0 1,
236
1,23
6 0
0 4
1 W
ater
ing
Facil
ity (n
o.)
614
0 0
1 1
0 4
1 0
Wild
life W
ater
ing
Facil
ity
(no.
) 64
8 0
0 0
0 0
0 0
0 To
tal A
crea
ge a
t RM
S Le
vel
0 0
1,23
6 1,
236
San Simon River Watershed Rapid Watershed Assessment Section 5 - Resource Assessment page 5- 6

WAT
ERSH
ED N
AME
& CO
DE
SAN
SIM
ON
RIVE
R - 1
5040
006
LAND
USE
ACRE
S 24
,728
LAND
USE
TYPE
FO
REST
TY
PICA
L UN
IT S
IZE
ACRE
S 50
,000
CONS
ERVA
TIO
N CO
ST T
ABLE
CA
LCUL
ATED
PAR
TICI
PATI
ON
10%
FU
TURE
FE
DERA
L PR
IVAT
E
Inst
alla
tion
Cost
M
anag
emen
tC
ost -
3 y
rs
Tech
nica
l As
sist
ance
In
stal
latio
n Co
st
Annu
al O
& M
+
Mgt
Cos
ts
Con
serv
atio
n Sy
stem
s by
Tre
atm
ent L
evel
N
ew
Trea
tmen
t U
nits
50
%
100%
20
%
Tota
l Pre
sent
Va
lue
Cost
50
%
100%
Tota
l Pre
sent
Va
lue
Cost
Prog
ress
ive
Fenc
e (
ft.)
382
495
$742
$0
$1
48
$890
$7
42
$30
$867
Pipe
line
(ft.
) 51
6 49
5 $1
,978
$0
$3
96
$2,3
74
$1,9
78
$79
$2,3
12Pr
escr
ibed
Bur
ning
(a
c.)
338
124
$3,0
91
$0
$618
$3
,709
$3
,091
$6
2 $3
,351
Pres
crib
ed G
razi
ng
(ac.
) 52
8 1,
236
$927
$0
$1
85
$1,1
13
$927
$0
$9
27W
ater
ing
Faci
lity
(no.
) 61
4 0
$124
$0
$2
5 $1
48
$124
$7
$1
55
Subt
otal
1,
236
$6,8
62
$0
$1,3
72
$8,2
34
$6,8
62
$178
$7
,612
RMS
Brus
h M
anag
emen
t (a
c.)
314
124
$7,4
18
$0
$1,4
84
$8,9
02
$7,4
18
$148
$8
,043
Fenc
e (
ft.)
382
1,11
3 $1
,669
$0
$3
34
$2,0
03
$1,6
69
$67
$1,9
50Pi
pelin
e (
ft.)
516
1,11
3 $4
,451
$0
$8
90
$5,3
41
$4,4
51
$178
$5
,201
Pres
crib
ed B
urni
ng
(ac.
) 33
8 12
4 $3
,091
$0
$6
18
$3,7
09
$3,0
91
$62
$3,3
51Pr
escr
ibed
Gra
zing
(a
c.)
528
1,23
6 $9
27
$0
$185
$1
,113
$9
27
$0
$927
Tree
/Shr
ub E
stab
lishm
ent
(ac.
) 61
2 12
4 $5
87
$0
$117
$7
05
$587
$1
2 $6
37U
plan
d W
ildlif
e Ha
bita
t Man
agem
ent
(ac.
) 64
5 1,
236
$0
$4,8
22
$964
$5
,261
$0
$1
,607
$2
,474
Wat
erin
g Fa
cilit
y (n
o.)
614
1 $4
95
$0
$99
$593
$4
95
$30
$620
Wild
life
Wat
erin
g Fa
cility
(n
o.)
648
0 $1
24
$0
$25
$148
$1
24
$2
$134
Subt
otal
1,
236
$18,
762
$4,8
22
$4,7
17
$27,
776
$18,
762
$2,1
06
$23,
338
Gra
nd T
otal
2,
473
$25,
624
$4,8
22
$6,0
89
$36,
010
$25,
624
$2,2
84
$30,
950
Char
t Ref
ers
To
Land
use
Type
FO
RES
T
C
alcu
late
d Pa
rtici
patio
n Ra
te
10%
Aver
age
PV C
osts
per
Ac
Syst
em
Fede
ral
Priv
ate
Prog
$6
.66
$6.1
6
R
MS
$22.
46
$18.
88
San Simon River Watershed Rapid Watershed Assessment Section 5 - Resource Assessment page 5- 7
Section 6: References Arizona Association of Conservation Districts (http://www.aaocd.org/) Arizona Dept. of Agriculture (http://www.azda.gov/) Arizona Dept. of Environmental Quality Water Quality Monitoring & Assessment (http://azdeq.gov/environ/water/assessment/assess.html) Arizona Department of Environmental Quality (ADEA). Draft 2006 Status of Ambient
Surface Water Quality in Arizona – Arizona’s Integrated 305(b) Assessment and 303(d) Listing Report. Arizona Department of Environmental Quality, Phoenix, Arizona.
Arizona Department of Environmental Quality, Air Quality Division, http://www.azdeq.gov/environ/air/plan/notmeet.html#phoenix Arizona Department of Water Resources, Southeastern Arizona Planning Area, San
Simon Sub-basin, http://www.water.az.gov/dwr/Content/Find_by_Program/Rural_Programs/OutsideAMAs_PDFs_for_web/Southeastern_Arizona_Planning_Area/Safford_Basin.pdf
Arizona Department of Water Resources, Arizona Drought Preparedness Plan,
Background & Impact Assessment Section, Governor’s Drought Task Force, Governor Janet Napolitano, October 8, 2004. http://www.azwater.gov/dwr/content/find_by_program/GDTF/conclusion/Background_Section_100804FINAL.pdf
Arizona Department of Water Resources (ADWR), 2007. Arizona Water Atlas,
Vol. 2, web published at http://www.azwater.gov/dwr/ Arizona Game & Fish Dept. Heritage Database http://www.azgfd.gov/w_c/edits/species_concern.shtml) Arizona Game & Fish website, 2006, http://www.azgfd.gov/w_c/heritage_program.shtml. Arizona State Land Department, Arizona Land Resource Information System (ALRIS), GIS data layer “Geology,” February 7, 2003. http://www.land.state.az.us/alris/index.html. Arizona State Land Department, Arizona Land Resource Information System (ALRIS), GIS data layer “Lakes,” February 7, 2003, http://www.land.state.az.us/alris/index.html.
San Simon River Watershed Rapid Watershed Assessment Section 6 - References page 6- 1

Arizona State Land Department, Arizona Land Resource Information System (ALRIS), GIS data layer “mines”, February 7, 2002
http://www.land.state.az.us/alris/index.html Arizona State Land Department, Arizona Land Resource Information System (ALRIS), GIS data layer “natveg”, June 12, 2003
http://www.land.state.az.us/alris/index.html Arizona State Land Department, Arizona Land Resource Information System (ALRIS), GIS data layer “ownership”, February 7, 2002
http://www.land.state.az.us/alris/index.html Arizona State Land Department, Arizona Land Resource Information System (ALRIS), GIS data layer “Streams”, Arizona, October, 10, 2002 http://www.land.state.az.us/alris/index.html. Brandau, B., R. Wittler, and Barron Orr. 2003. San Simon Watershed Assessment and
Restoration Plan. In: Renard, Kenneth G., McElroy, Stephen A., Gburek, William J., Canfield, H. Evan and Scott, Russell L. (eds.). 2003. First Interagency Conference on Research in the Watersheds, October 27-30, 2003. U.S. Department of Agriculture, Agricultural Research Service. (CD-ROM)
Brown, David E., and Charles H. Lowe, Biotic Communities of the Southwest
1:1,000,000 scale, August 1980. Bureau of Land Management Arizona Website (http://www.blm.gov/az/st/en.html) Chronic, Halka. 1983. Roadside Geology of Arizona. Mountain Press Publishing
Company, Montana. Environmental Protection Agency (EPA) website http://epa.gov/air/airtrends/aqtrnd95/pm10.html ESRI Data Products, http://arcdata.esri.com/data/tiger2000/tiger_download.cfm
Census 2000. October 17, 2003. GeoLytics, Inc. 1998. Census 1990. Census CD + Maps. Release 3.0. Gordon, N.D., T.A. McMahon, and B.L. Finlayson. 1992. Stream Hydrology; Chapter 4- Getting to know your stream. John Wiley & Sons, New York, New York.
San Simon River Watershed Rapid Watershed Assessment Section 6 - References page 6- 2

Lowry, J. H, Jr., R. D. Ramsey, K. Boykin, D. Bradford, P. Comer, S. Falzarano, W. Kepner, J. Kirby, L. Langs, J. Prior-Magee, G. Manis, L. O’Brien, T. Sajwaj, K. A. Thomas, W. Rieth, S. Schrader, D. Schrupp, K. Schulz, B. Thompson, C. Velasquez, C. Wallace, E. Waller and B. Wolk. 2005. /Southwest Regional Gap Analysis Project: Final Report on Land Cover Mapping Methods/, RS/GIS Laboratory, Utah State University, Logan, Utah.
National Agricultural Statistics Service (http://www.nass.usda.gov/) Natural Resources Conservation Service (NRCS), 2007, Tables generated by NRCS
Phoenix Office. Natural Resources Conservation Service (NRCS) Fact Sheet, San Simon River
Watershed. Natural Resources Conservation Service (NRCS) Website 2006, Technical Guide –
New Mexico http://www.nm.nrcs.usda.gov/technical/fotg/transmittals/fotg-1.doc Natural Resources Conservation Service Arizona Website (http://www.az.nrcs.usda.gov/) Natural Resources Conservation Service Arizona GIS Webpage (http://www.az.nrcs.usda.gov/technical/gis/index.html) Natural Resources Conservation Service Web Soil Survey (http://websoilsurvey.nrcs.usda.gov/app/) Natural Resources Conservation Service Water & Climate Center (http://www.wcc.nrcs.usda.gov/) New Mexico Resource Geographic Information (RGIS). 2007 Southern Arizona Data Services Program, GIS data layer “Arizona Gap Analysis
Project Vegetation Map”, University of Arizona, 2004, http://sdrsnet.srnr.arizona.edu/index.php, originated by Arizona Game & Fish Department, Habitat Branch, 1993, this dataset was digitized from the August 1980 David E. Brown & Charles H. Lowe 1:1,000,000 scale, 'Biotic Communities of the Southwest'.
Southwest Regional GAP Project (http://fws-nmcfwru.nmsu.edu/swregap/ Theobald, D. 2005. Landscape patterns of exurban growth in the USA from 1980 to
2020. Ecology and Society 10(1): 32. [online] URL: http://www.ecology and society.org/vol10/iss1/art32/.
United States Department of Agriculture, GIS Data Analysis, obtained from U.S. Forest
Service, Southwestern Region, Forest Health office, Feb. 26, 2007
San Simon River Watershed Rapid Watershed Assessment Section 6 - References page 6- 3

United States Environmental Protection Agency, Surf Your Watershed (http://www.epa.gov/surf/) United States Environmental Protection Agency, Air Quality Trends,
http://epa.gov/air/aritrends/aqtrnd95/pm10.html. United States Fish & Wildlife Service, Threatened and Endangered Species Listed for
Arizona, http://ecos.fws.gov. United States Fish & Wildlife Service Arizona Ecological Services (http://www.fws.gov/southwest/es/arizona/) United States Forest Service (USFS), Southwestern Region, Forest Health Office. Bark
Beetle section based on analysis of GIS data of bark beetle impacts, obtained from the U.S. Forest Service Feb. 26, 2007
United States Forest Service, Forest Service, Fact Sheet “Arizona Bark Beetle
Epidemics,” produced by Forest Health Staff, Southwestern Region, USDA Forest Service, January 2004, http://www.fs.fed.us/r3/prescott/forest-health/index.shtml
United States Forest Service (USFS), Terrestrial Ecosystem Surveys. Surveys are
available for National Forest Lands within the watershed. United States Forest Service Southwestern Region (http://www.fs.fed.us/r3/) United States Geological Survey, NLCD Land Cover Class Definitions, http://landcover.usgs.gov/classes.php United States Geological Survey, April 8, 2003, derived from DEM,
http://edc.usgs.gov/geodata/ United States Geological Survey website, National Water Information System
http://waterdata.usgs.gov/nwis/ Western Regional Climate Center (WRCC), Temperature data. July 15, 2004.
http://www.wrcc.dri.edu/summary/climsmaz.html.
San Simon River Watershed Rapid Watershed Assessment Section 6 - References page 6- 4

GLOSSARY Drainage Basin A region or area bounded by a topographic divide and occupied by a
drainage system, also known as a watershed. Drought There is no universally accepted quantitative definition of drought.
Generally, the term is applied to periods of less than average precipitation over a certain period of time; nature's failure to fulfill the water wants and needs of man.
Flood A flood is an overflow or inundation that comes from a river or other body of water and causes or threatens damage. It can be any relatively high streamflow overtopping the natural or artificial banks in any reach of a stream. It is also a relatively high flow as measured by either gage height or discharge quantity.
Ground Water The supply of fresh and saline water found beneath the Earth's surface which is often used for supplying wells and springs. Because ground water is a major source of drinking water, there is a growing concern over areas where leaching agricultural or industrial pollutants are contaminating ground water.
Soil Moisture Regimes
Aridic is a soil moisture regime that has no water available for plants for more than half the cumulative time that the soil temperature at 50 cm (20 in.) below the surface is >5°C (41° F.), and has no period as long as 90 consecutive days when there is water for plants while the soil temperature at 50 cm (20 in.) is continuously >8°C (46°F.). Udic is a soil moisture regime that is neither dry for as long as 90 cumulative days nor for as long as 60 consecutive days in the 90 days following the summer solstice at periods when the soil temperature at 50 cm (20 in.) below the surface is above 5°C (41° F.). Ustic is a soil moisture regime that is intermediate between the aridic and udic regimes and common in temperate subhumid or semiarid regions, or in tropical and subtropical regions with a monsoon climate. A limited amount of water is available for plants but occurs at times when the soil temperature is optimum for plant growth.
Soil Orders
A soil order is a group of soils in the broadest category. In the current USDA classification scheme there are 12 orders, differentiated by the presence or absence of diagnostic horizons.
Soil Temperature
Regimes
Hyperthermic is a soil temperature regime that has mean annual soil temperatures of 22°C (72°F.) or more and >5°C (41° F.) difference between mean summer and mean winter soil temperatures at 50 cm (20 in.) below the surface. Thermic is a soil temperature regime that has mean annual soil temperatures of 15°C (59°F.) or more but <22°C (72°F.), and >5°C (41° F.) difference between mean summer and mean winter soil temperatures at 50 cm (20 in.) below the surface.
San Simon River Watershed Rapid Watershed Assessment Section 7 - Glossary page 7- 1

Mesic A soil temperature regime that has mean annual soil temperatures of 8°C (46°F.) or more but <15°C (59°F.), and >5°C (41° F.) difference between mean summer and mean winter soil temperatures at 50 cm (20 in.) below the surface.
Surface Water Water on the earth's surface. Lakes, bays, ponds, impounding reservoirs, springs, rivers, streams, creeks, estuaries, wetlands, marshes, inlets, canals, and all other bodies of surface water, natural or artificial, inland or coastal, fresh or salt, navigable or non-navigable, and including the beds and banks of all watercourses and bodies of surface water, that are wholly or partially inside or bordering the state or subject to the jurisdiction of the state; except that waters in treatment systems which are authorized by state or federal law, regulation, or permit, and which are created for the purpose of waste treatment.
Watershed The area of land that contributes surface run-off to a given point in a drainage system and delineated by topographic divides.
San Simon River Watershed Rapid Watershed Assessment Section 7 - Glossary page 7- 2

Acknowledgements The following University of Arizona staff and students contributed to the production of this report. Terry Sprouse Erin Westfall Lainie Levick Melisa Kennedy Ivan Parra Myrtho Joseph Dilruba Yeasmin Ari Posner Mickey Reed NRCS Field Office, Area Office and State Office staff contributed to the development of this assessment.
San Simon River Watershed Rapid Watershed Assessment Section 7 - Glossary page 7- 3