Embed Size (px)
Citation preview

SANDSAND20UnlimitePrinted M
Petrof thComMou A Stud Jason EMark A. Prepared bySandia NatAlbuquerqu
Sandia Nata wholly owNational Nu Approved fo
DIA RE013-0027 ed Release March 2013
rologihe Dampresunt Sidy for the
E. Heath, StRodriguez
y ional Laborator
ue, New Mexico
ional Laboratorwned subsidiary uclear Security A
or public releas
PORT
3
ic andallas Cssed Amon DOE Ene
tephen J. B
ies 87185 and Liv
ies is a multi-prof Lockheed M
Administration u
e; further dissem
d PetrCenteAir EnSand
ergy Stora
auer, Scott
vermore, Califor
rogram laboratoartin Corporatiounder contract D
mination unlimit
rophyer Strunergydstone
age Syste
t T. Broome
nia 94550
ry managed anon, for the U.S. DE-AC04-94AL8
ted.
ysicalucturey Store ems Prog
e, Thomas
d operated by SDepartment of 85000.
l Evale, Iowrage in
gram
A. Dewers,
Sandia CorporaEnergy's
uatiowa, fon the
, and
tion,
on r

Issued bby Sand NOTICUnited nor anymake anaccuracydiscloseto any manufacrecommtheir conecessaof their Printed availabl Availab U.S Of P.O Oa Te Fac E-M On Availab U.S Na 52 Spr Te Fac E-M On
by Sandia Nationdia Corporation.
CE: This reportStates Governm
y of their employny warranty, expy, completeness
ed, or represent tspecific comm
cturer, or othemendation, or favontractors or surily state or reflcontractors.
in the United Stle copy.
ble to DOE and DS. Department o
ffice of ScientificO. Box 62 ak Ridge, TN 37
lephone: csimile: Mail: nline ordering:
ble to the public fS. Department o
ational Technical85 Port Royal Rringfield, VA 2
lephone: csimile: Mail: nline order:
nal Laboratories
t was prepared ament. Neither th
yees, nor any ofpress or implieds, or usefulnessthat its use woulmercial productrwise, does no
voring by the Unubcontractors. ect those of the
tates of America
DOE contractorsof Energy c and Technical
7831
(865) 576-8401(865) 576-5728reports@adonishttp://www.osti
from of Commerce l Information Se
Rd. 2161
(800) 553-6847(703) [email protected]://www.ntis
2
s, operated for th
as an account ohe United Statesf their contracto
d, or assume anys of any informld not infringe prt, process, or ot necessarily cnited States Gov
The views anUnited States G
. This report has
s from
Information
.osti.gov
.gov/bridge
ervice
dworld.gov .gov/help/orderm
he United States
of work sponsores Government, nors, subcontractoy legal liability omation, apparaturivately owned rservice by tr
constitute or imvernment, any agnd opinions expGovernment, any
s been reproduce
methods.asp?loc
s Department of
ed by an agencynor any agency ors, or their empor responsibilityus, product, or rights. Referenc
rade name, tradmply its endorgency thereof, opressed herein
y agency thereof
ed directly from
c=7-4-0#online
f Energy
y of the thereof, ployees, y for the
process e herein demark, rsement, r any of do not
f, or any
the best
3
SAND2013-0027 Unlimited Release
Printed March 2013
Petrologic and Petrophysical Evaluation of the Dallas Center Structure, Iowa, for Compressed
Air Energy Storage in the Mount Simon Sandstone
Jason E. Heath1, Stephen J. Bauer1, Scott T. Broome1, Thomas A. Dewers1, and Mark A. Rodriguez2
Departments of 1Geomechanics and 2Materials Characterization Sandia National Laboratories
P.O. Box 5800 Albuquerque, New Mexico 87185-0750
Abstract
The Iowa Stored Energy Plant Agency selected a geologic structure at Dallas Center, Iowa, for evaluation of subsurface compressed air energy storage. The site was rejected due to lower-than-expected and heterogeneous permeability of the target reservoir, lower-than-desired porosity, and small reservoir volume. In an initial feasibility study, permeability and porosity distributions of flow units for the nearby Redfield gas storage field were applied as analogue values for numerical modeling of the Dallas Center Structure. These reservoir data, coupled with an optimistic reservoir volume, produced favorable results. However, it was determined that the Dallas Center Structure cannot be simplified to four zones of high, uniform permeabilities. Updated modeling using field and core data for the site provided unfavorable results for air fill-up. This report presents Sandia National Laboratories’ petrologic and petrophysical analysis of the Dallas Center Structure that aids in understanding why the site was not suitable for gas storage.

4
ACKNOWLEDGMENTS The authors thank Dr. Imre Gyuk and the U.S. Department of Energy for funding this work, and Georgianne Huff for her relentless interest and support of compressed air energy storage. The authors also thank Raymond Anderson and Robert McKay of the Iowa Geological and Water Survey for discussions on regional lithofacies variation of the Mount Simon Sandstone and the Eau Claire Formation, and for a review of this report. Weatherford Laboratories performed air-displacing-water centrifuge capillary pressure and relative permeability measurements. Poro-Technology performed mercury capillary pressure measurements. TerraTek, a Schlumberger Company, performed “Tight Rock Analysis” on low permeability rock samples. Thin sections were prepared by Wagner Petrographic. Sandia National Laboratories is a multi-program laboratory managed and operated by Sandia Corporation, a wholly owned subsidiary of Lockheed Martin Corporation, for the U.S. Department of Energy’s National Nuclear Security Administration under contract DE-AC04-94AL85000.

5
CONTENTS
1. Introduction ................................................................................................................................. 9
2. Regional geologic and site-specific background ...................................................................... 13
3. Methods and materials .............................................................................................................. 17 3.1 General approach and data consistency ............................................................................ 17 3.2 Porosity, bulk density, permeability, and TOC ................................................................. 17 3.3 Air-displacing-water capillary pressure and relative permeability measurements ........... 18 3.4 Mercury intrusion capillary pressure measurements ........................................................ 19 3.5 X-ray diffraction ............................................................................................................... 21 3.6 Thin-section examination.................................................................................................. 22
4. Results ....................................................................................................................................... 25 4.1. Overview of Keith No. 1 well logs, permeability, and XRD data ................................... 25 4.2. Porosity, bulk density, absolute permeability, and TOC ................................................. 25 4.3. Air-displacing-water capillary pressure and relative permeability measurements .......... 25 4.4. Mercury capillary pressure measurements ....................................................................... 32 4.5. X-ray diffraction .............................................................................................................. 32 4.6. Thin-section examination................................................................................................. 36
5. Discussion and implications ..................................................................................................... 39
6. References ................................................................................................................................. 41
Appendix A: Permeability and effective confining pressure ........................................................ 43
Appendix B: Original data from Weatherford Laboratories on capillary pressure and relative permeability .................................................................................................................................. 51
Appendix C: Thin section inventory ............................................................................................. 57
Appendix D: Tables of Mount Simon Sandstone petrographic observations ............................... 61
Appendix E: Mount Simon Sandstone petrography photomicrograph atlas ................................ 73
Appendix F: Distribution .............................................................................................................. 87
FIGURES Figure 1. a) Structural elevation map of the top of the Mount Simon Sandstone at the crest of the Dallas Center Structure (from The Hydrodynamics Group, 2011). b) Map showing the location of the well Keith No. 1 in Iowa. .................................................................................................... 10 Figure 2. Plot of the change in sample volume, normalized by the original sample volume, versus pressure. The point of departure of the curve from the linear fit represents the “closure pressure.”....................................................................................................................................................... 20 Figure 3. Schematic of rock sample used for thin sections, billets, and XRD samples. The horizontal dimension left of the cut-line for the XRD is approximately 24 mm, the vertical

6
dimension is approximately 40 mm, and the depth is approximately 1 cm. The material removed for XRD is such that it provided at least 1 gram of ground-up material. ..................................... 22 Figure 4. Well logs, permeability, XRD data, and log-based geologic units for Keith No. 1 well. The legend for permeability data indicates the direction (e.g., vertical or horizontal) or type of measurement. ................................................................................................................................ 26 Figure 5. Permeability versus depth for Keith No. 1 well. ........................................................... 27 Figure 6. Porosity versus depth for Keith No. 1 well. .................................................................. 28 Figure 7. Porosity versus permeability results for Keith No. 1 well. ............................................ 29 Figure 8. Sample bulk density versus depth for Keith No. 1 well. ............................................... 30 Figure 9. Primary drainage capillary pressure curves by centrifuge methods on two Mount Simon Sandstone core samples from Keith No. 1 well. ........................................................................... 31 Figure 10. Relative permeability data (drainage cycle only) for air-water system at net confining stress of 800 psi and temperature of 72°F, for a sample depth of 2,933.63 ft from Keith No. 1 well. ............................................................................................................................................... 32 Figure 11. Plot of incremental mercury saturation versus pore throat diameter for the 30 samples from Keith No. 1 well. Blue represents Mt. Simon Sandstone samples, whereas red indicates the Eau Claire Formation. “V” and “H” stand for vertical or horizontal directional porosimetry. .... 33 Figure 12. X-ray diffraction composition versus depth for samples from Keith No. 1 well. ....... 34
TABLES Table 1. X-ray diffraction results .................................................................................................. 35
7
NOMENCLATURE CAES compressed air energy storage ISEPA Iowa Stored Energy Plant Agency md millidarcy MICP mercury intrusion capillary pressure psi pounds per square inch SNL Sandia National Laboratories TOC total organic carbon TRA Tight Rock Analysis TRSZ Thurman-Redfield structural zone XRD X-ray diffraction


9
1. INTRODUCTION The Iowa Stored Energy Plant Agency (ISEPA) selected a domal geologic structure at Dallas Center, Iowa (Figure 1), for evaluation of subsurface compressed air energy storage (CAES). The site was ultimately rejected due to lower-than-expected and heterogeneous permeability of the target reservoir and smaller-than-expected reservoir size. CAES envisions storing electrical energy in the form of high-pressure compressed air in a suitable vessel (Succar and Williams, 2008). The stored energy is retrieved by releasing the air for flow in a turbine. The geologic storage vessel must meet specific pressure and air flow rates to sustain operation of the turbo-generator equipment. The Hydrodynamics Group, LLC, with technical contributions from Sandia National Laboratories (SNL), completed a performance analysis of the feasibility of the Dallas Center Structure for CAES (see the project final report by The Hydrodynamics Group, 2011). The target for air storage was the Mount Simon Sandstone, a regional aquifer overlain by Eau Claire Formation, a low permeability caprock formation. Two essential elements of developing and operating a CAES site include: 1) the initial filling of a structure with air and concomitant displacement of formation water to irreducible water saturations; and 2) the deliverability or air mass flow rate of the storage vessel needed to sustain turbo-generator equipment (The Hydrodynamics Group, 2011). Air fill-up to irreducible water saturations maximizes air withdrawal rates by achieving the highest effective permeability to air and reduces the amount of produced water (The Hydrodynamics Group, 2011). Further, a large air “bubble” results in injection and production cycles without large changes in reservoir pressure (The Hydrodynamics Group, 2011).The major finding for the Dallas Center Structure, based on a variety of field data and numerical modeling, is that initial air fill-up is problematic. The lower-than-expected and heterogeneous permeability and shale interbeds, according to the modeling results, would limit creation of a continuous large air bubble and instead cause fingering of injected air and establish air flow in pathways that do not fill the entire structure. The Dallas Center Structure was chosen based on an initial feasibility study using reservoir properties of the nearby Redfield natural gas storage field (Hershey, 1962). The permeability distributions for Redfield, for four flow units in the Mount Simon Sandstone, were applied as analogue values for numerical modeling of the Dallas Center Structure. These permeability values, and the thicknesses of the four storage zones, resulted in favorable modeling results (Moridis et al., 2007). However, the Dallas Center Structure cannot be simplified to four zones of relatively high, uniform permeabilities. Updated modeling based on Dallas Center Structure field and core data provided unfavorable results for air fill-up (The Hydrodynamics Group, 2011).The geologic properties change spatially from Redfield to Dallas Center Structure, which highlights the need for understanding regional and local variation in petrophysical properties. This report presents SNL’s petrologic and petrophysical analysis of the Dallas Center Structure, within the context of The Hydrodynamics Group’s performance analysis. Data provided herein include absolute and relative permeability, capillary pressure, composition via X-ray diffraction (XRD), and thin-section examination of pore types and rock textures (i.e., petrography). Geomechanical results are presented separately by Dewers et al. (submitted 31 October 2012). SNL’s contribution provides insight into geologic controls on the flow properties

10
Figure 1. a) Structural elevation map of the top of the Mount Simon Sandstone at the crest of the Dallas Center Structure (from The Hydrodynamics Group, 2011). b) Map showing the location of the well Keith No. 1 in Iowa. of both the target reservoir and the sealing integrity of the caprock. A focus is on pore-scale control of permeability and porosity. The major finding is that the Mount Simon Sandstone at the Keith No. 1, near the top of the geologic structure, is very heterogeneous, with only the upper quartzarenite portion being the most easily characterized as a uniform flow unit. The lower portion contains heterolithic rock types with a variety of pore types, diagenetic cements including evaporites and iron- and titanium-oxides, and hence heterogeneous petrophysical

11
properties. Quantification of pyrite was obtained to assess whether enough pyrite exists to pose a concern for acidification by interaction with oxidized pore fluids due to air injection. Pyrite is a minor constituent, occurring in less than one areal percent via point counting or less than one wt% by XRD. These data are presented in a framework of regional geology and lithologies for possible application to other localities, as the Mount Simon Sandstone is target throughout the Midwest United States for geologic CO2 sequestration, natural gas storage, and underground injection of waste (e.g., brine).


13
2. REGIONAL GEOLOGIC AND SITE-SPECIFIC BACKGROUND Regional geologic information is presented to allow comparison between properties of the Mount Simon Sandstone and the overlying Eau Claire Formation at the Dallas Center Structure with other locations in the Midwest United States. These formations are receiving much scrutiny because they are targets for geologic CO2 sequestration (Medina and Rupp, 2012), other waste disposal, and natural gas storage. The Cambrian Mount Simon Sandstone, a major sandstone aquifer, extends broadly throughout the Midwestern United States, overlying Precambrian crystalline basement or sedimentary rocks in Iowa, Illinois, Indiana, Ohio, Michigan, Minnesota, Wisconsin, and Nebraska, reaching thicknesses of > 305 m (1,000 ft) in eastern Iowa, Illinois, Indiana, and Michigan (Anderson, 1998). In Ohio, several lithofacies (i.e., up to eight) have been identified and interpreted as indicating deposition as a tidally-influenced transgressive barrier sequence, with environments including: swash and surf zones; mud, sand, and mixed flats; sand flats to tidal channel; tidal inlet channels, and bioturbated sand flats (Saeed and Evans, 2012). Lithologies encompass conglomerate to pebbly to fine sandstone, siltstone, mudstone, and heterolithic sandstone-mudstone (Saeed and Evans, 2012). Bowen et al. (2011), focusing on the Illinois Basin, state that depositional environments may include shallow-marine, deltaic, fluvial, eolian, and possibly sabkha settings, with lithofacies including: cobble conglomerate; stratified conglomerate; poorly to well-sorted sandstone; and interstratifed sandstone and shale; and shale. The abundant Mount Simon Sandstone lithofacies have been modified by diagenesis including mechanical compaction, pressure solution, and dissolution and precipitation of a variety of cements (Hoholick et al., 1984; Bowen et al., 2011). Bowen et al. (2011) summarize pore types as including “intergranular porosity, elongate pores, oversize pores, fracture porosity, and dissolution porosity.” Major cements for the Illinois Basin include quartz and feldspar overgrowths, clays, iron oxides, carbonate, chlorite, and chert, which display regular spatial distribution patterns over large areas of the Illinois Basin (Hoholick et al., 1984; Bowen et al., 2011). Porosity types (i.e., intergranular, elongate pores, etc.) can be mapped to trends in percent porosity (e.g., see Fig. 6 on page 79 in Bowen et al., 2011). To our knowledge, permeability values have not been similarly related to porosity types, although permeability is a key metric for fluid injection-related activities. Permeability trends have been related to sandstone texture (i.e., grain size), depth, and percent porosity for the Illinois Basin (Frailey et al., 2011). Thus, the Mount Simon Sandstone is heterolithic, with a range in porosity and permeability values due to a variety of depositional environments and diagenetic modifications, which have been assessed, mainly for the Illinois Basin, to attempt to obtain trends in values for siting and planning operations of CO2 sequestration locations. Geophysical well logs help to constrain porosity trends (e.g., net pay) and define flow units for reservoir modeling. Well-log-based flow units or informal lithostratigraphic subdivisions of the Mount Simon Sandstone for the Illinois Basin were defined to determine what portion of the formation is suitable for geologic CO2 storage (Medina and Rupp, 2012). These units include upper, middle, and lower portions of the formation, where the upper has high gamma-ray values and is shaly. The shaly portion of the upper unit includes the so-called “B-Cap” of Becker et al. (1978). The quartzose-rich, middle unit has relatively lower and constant gamma-ray values (i.e., the values are relatively uniform with depth), and represents a potential main flow unit (Medina and Rupp, 2012). The lower unit

14
has relatively higher and more variable gamma-ray values, with a feldspar content that increases with depth (Medina and Rupp, 2012). In the Mount Simon in western Ohio, informal three-unit subdivisions include an upper unit of relatively low and uniform gamma-ray values (Saeed and Evans, 2012), which is a clean (i.e., predominately quartzarenite) sandstone and probably corresponds with the middle unit of Medina and Rupp’s (2012) work in the Illinois Basin. The top of the upper unit grades into the overlying Eau Claire Formation over a 0.5 m zone with an increase in shale, glauconite, and K-feldspar, and thus Saeed and Evans (Saeed and Evans, 2012) do not mention or identify the “B-Cap.” The clean sandstone is then underlain by a strongly heterolithic middle unit with sandstone, siltstone, and mudstone, corresponding to a variety of tidally-influenced lagoon to tidal inlet channel depositional environments (Saeed and Evans, 2012). The lower unit is conglomerate-rich, with interbedded mudstones, siltstone, and fine-grained sandstone couplets.
Overlying the Mount Simon Sandstone over much of its regional extent is the Cambrian Eau Claire Formation. The formation varies, from north-to-south, from being siliciclastic-dominated in its type area near Eau Claire in western Wisconsin to mixed siliclastic-carbonate to carbonate-dominated in northeastern Missouri (McKay, 1988). The following summarizes McKay’s (1988) descriptions of three informal units, the upper, middle, and lower portions, of the Eau Claire Formation in eastern Iowa. The upper portion of northeastern Iowa contains finely and coarsely interlayered feldspathic and glauconitic sandstone and shale, which contain inarticulate brachiopod shells, trilobite and hyolithid molds. In southeastern Iowa, the sandstone-shale facies grades into a variably glauconitic, dolomitic, feldspathic siltstone-shale facies, with sparse inarticulate brachiopod shells and fragments of trilobite molds. The middle Eau Claire Formation, from northeastern to southeastern Iowa, grades from siltstone-shale facies to a shale and dolomite facies. The siltstones display bioturbation and glauconite. The dolomite facies includes skeletal dolomite packstones to grainstones, bioturbated dolomites, dense crystalline dolomite, and dolomite algal thrombolites and stromatolites. The lower Eau Claire is a fine sandstone and shale facies in eastern Iowa. Lithologies range from laminated to ripple laminated to bioturbated shaly sandstone and interlayered sandstone and shale, shale, flat pebble conglomerate, and dolomite echinoderm packstones. In summary, the Eau Claire Formation has significant large-scale facies changes from being siliciclastic to carbonate, and includes a large variety of lithologies. The Dallas Center Structure lies near the southeastern edge of the Iowa Horst of the Mid-Continent Rift System, next to the Thurman-Redfield structural zone (TRSZ), where domal structures occur due to deformation near the horst and the TRSZ (Anderson and McKay, 1989; Moridis et al., 2007). The Dallas Center Structure lies six miles to the west of the Redfield gas storage field. The Hydrodynamics Group (2011) oversaw seismic mapping and coring of the Keith No. 1, Mortimer No. 1, and Mortimer No. 3 wells (see Figure 1 for well locations) to confirm and update previous structural interpretation of seismic reflection data collected by Bay Geophysical, Inc. (2006). The updated structural interpretation, using both core and revised geophysics, has ~ 65-70 ft of structural closure over an ~1.5 mi2 area (Figure 1; The Hydrodynamics Group, 2011), which was less than the more favorable initial interpretation by Bay Geophysical. The total structure, based on the contour map of Figure 1, has two structural domes. The Hydrodynamics Group (2011) identified four flow units for the Dallas Center

15
Structure wells based on geophysical well log signatures that were similar to those of the Redfield gas storage field. The four units, labeled A through D from shallower to deeper, for the feasibility modeling of the Dallas Center Structure (see Section 1) were assigned uniform permeabilities of 97, 309, 1,016, and 411 md, respectively, based on permeability values from Redfield. Based on the actual heterogeneous and generally lower permeability results obtained from the Dallas Center Structure core (see Section 4.2), it was determined that these Redfield permeabilities are not realistic as analogue values.


17
3. METHODS AND MATERIALS 3.1 General approach and data consistency To support evaluation of Dallas Center Structure for CAES, SNL performed petrologic and petrophysical analyses on conventional core from the Keith No. 1 and Mortimer No. 1 wells (see Figure 1a). Several complimentary data types were obtained for Keith No. 1 (which lies near the top of the Dallas Center Structure; see Figure 1), which were collected at or close to the same core depth location to remain within the same lithofacies. The data for Mortimer No. 1 include only permeability, porosity, and bulk density (and well logs). In the following sections, the focus is on the Keith No. 1 well: if the well is not specifically named, the reader should assume it is Keith No. 1. The Mortimer No. 1 data are given in Appendix A. 3.2 Porosity, bulk density, permeability, and TOC Samples were selected at specific core depths from Keith No. 1 and Mortimer No. 1 wells for their representativeness of lithofacies present in the core. Samples labeled A and B are vertical core plugs (i.e., plugs cut parallel with the long axis of the core) from the same depth, which were used for permeability, porosity, bulk density measurements, and for triaxial testing (after permeability testing; Dewers et al., submitted 31 October 2012) . Additional core plug samples labeled V or H are from the same depth, but are cut parallel (V) or perpendicular (H) to the core axis. It follows that A, B, V samples represent vertical permeability, and H represents horizontal permeability. It should be noted that cross bedding in some of the lithofacies obfuscates the “value” of horizontal versus vertical sampling. All samples were dried by pulling a vacuum on cored- and end-prepped samples for 24 to 48 hours, until the sample mass remained constant. Porosity was determined with a Coberly-Stevens gas porosimeter (developed by Frank Jones and Associates), which is based on Boyle’s Law. Density was determined through calculations using the measured mass and dimensions of prepared dry samples. Permeability was determined using a modified gas permeameter system. Each specimen was subjected to a drying phase prior to the permeability measurement, which consisted of being subjected to a vacuum and then stored in in a dry environment. Permeability was measured using a constant head (or pressure) technique and nitrogen as the permeant. In this technique, the test specimen is placed between two metal platens having central ports that permit the permeant (nitrogen) to enter and exit the specimen. Highly-permeable porous felt metal disks are placed in the interface between the platens and specimen to distribute the permeant and permeant pressure across the full cross-section of the specimen (the permeability of the system without a rock sample was evaluated and was found to be 1-2 orders of magnitude greater than the greatest permeability measured). The specimen is jacketed with a paint-on ultraviolet-cured polyurethane material that is sealed to the platens and serves to protect the specimen from hydraulic confining fluid and also to prevent permeant from short-circuiting around the sides of the specimen during testing. The jacketed specimen-platen assembly is placed inside a pressure vessel (permeameter) and the upstream and downstream ports of the platens are connected to a permeant source and to a flow meter, respectively. The annulus between the specimen and pressure vessel is filled with

18
isopar fluid and pressurized during the test (applying a pressure to the external surface of the specimen) to simulate in situ stresses and also to further enhance the jacket-specimen interface seal. In this test series, the confining pressures investigated were generally 500 psi, 1,000 psi, 1,500 psi, 2,000 psi, 2,500 psi, and 3,000 psi. Once the confining pressures had stabilized to a constant value, permeant was allowed to enter the upstream side of the specimen at a constant pressure (usually 25 or 50 psig depending on sample porosity). The downstream side of the specimen was vented to the atmosphere using a flow meter. The flow meter was connected to the data acquisition system and gave flow in cm3/min. Intrinsic permeability k was calculated from the following equation:
22
2
eaia
eae
PPA
PLQk
(1)
where is dynamic viscosity of the permeant; L is specimen length; A is specimen cross-sectional area; Qe is steady-state permeant flow rate; and Pia and Pea are the inlet and exit absolute pressures. A subset of core samples were sent to TerraTek, a Schlumberger company, for “Tight Rock Analysis” (TRA), which is suited for mudstone or low permeability lithologies. The TRA method is meant to measure rock permeability and not permeability due to pressure-release fractures or damage caused by drilling, coring, or core handling. Four Eau Claire Formation samples were sent, and one from the Mount Simon Sandstone. TerraTek also performed analysis of total organic carbon of these five samples. 3.3 Air-displacing-water capillary pressure and relative permeability measurements Samples were chosen from two distinct lithofacies of the Mount Simon Sandstone to facilitate evaluation of the impact of geologic heterogeneity on multiphase flow properties. Sections of whole core were examined by helical computed tomography (CT) scanning to aid in choosing the location of the horizontal (i.e., perpendicular to the long axis of the core) plugs. The plugs were also scanned. Two sets of plugs at approximately the same depths were obtained for the capillary pressure measurements and corresponding relative permeability tests. Plug dimensions were approximately 1.5 inch diameter by 2 inch long. Weatherford Laboratories in Houston, Texas, performed the following:
examination of the core and plugs by helical CT scanning; drilling of plugs; cleaning of plugs by azeotrope/methanol multi-phase cleaning methods; formation water/brine preparation for use in the capillary pressure measurements, based
on formation water chemistry from the field site (see The Hydrodynamics Group, 2010, for water chemistry data);

19
high speed centrifuge capillary pressure measurements; and relative permeability measurement using a steady-state method at a net confining
pressure of 800 psi and temperature of 72°F. Centrifuge techniques do not directly measure capillary pressures and water saturations at a specific location in the core plug. Calculation is necessary to convert angular velocity, average water saturation for the entire plug, and other parameters of the centrifuge measurements into capillary pressure and water saturation at the endface inlet of the sample. These calculations were made following methods by Forbes (1991; 1994; 1997). 3.4 Mercury intrusion capillary pressure measurements For the CAES project, mercury intrusion capillary pressure (MICP) measurements were obtained on Keith No. 1 core for these purposes:
evaluation of the ability of the Eau Claire Formation to act as a seal against the loss of pressurized air from the underlying target reservoir;
investigation of capillary pressure as a function of fluid saturations for both the Eau Claire Formation and the Mount Simon Sandstone;
pore throat size distributions; and defining flow units for to support future modeling of the multiphase flow of air and
groundwater.
The MICP measurements involve injection of the “non-wetting” mercury into a rock sample from low to high (i.e., 60,0000 psia) pressure. Rock samples are placed under vacuum prior to the measurements. Data produced include incremental (and cumulative) volumes of mercury injected into the penetrometer bulb containing the rock sample and the corresponding pressures. A total of thirty samples were used in the MICP tests. Twenty-eight cylindrical plugs from the core with dimensions of approximately 0.75-in long × 0.75-in diameter were jacketed with epoxy for directional mercury intrusion through the open top and bottom. Two samples of smaller dimensions were too thin for jacketing and thus underwent omni-directional intrusion. Photos of all samples were taken prior to the tests. Poro-Technology in Sugar Land, TX, performed the MICP tests on a Micromeritics AutoPore IV 9500 V1.07 instrument. Many methods for determining closure pressure exist (Katz and Thompson, 1987; Dullien, 1992; Sigal, 2009). For repeatability and to reduce subjectivity, and since non-intrudable blanks for corrections were not used, estimation of the closure pressure was based on a compressibility method. The compressibility coefficient gives the relationship of a solid under uniform compression, which can be rearranged and integrated with boundary conditions V = V0 at P = 0 to give an equation relating deformation to pressure (Colombo and Carli, 1981; Almon et al., 2008):
TP
V
V
1 (2)

20
PV
V
0
ln
(3)
where β is the compressibility coefficient; V is the bulk volume of the rock sample at some pressure; V0 is the original sample volume (at the beginning of the test); and P is pressure. For porous media, it is assumed that a plot of the natural log of V/V0 versus pressure will be linear until mercury begins entering the pore space (Colombo and Carli, 1981; Almon et al., 2008). To obtain the value of V before closure, we subtracted the intruded mercury volume from V0. The assumption is that the volumes of intruded mercury equal the decrease in bulk volume of the sample due to compression. After closure, this method of determining V no longer represents sample bulk volume because of the entry of mercury into the pore space. The pressure at which the measured curve begins to deviate from the linear fit is termed “closure” or closure pressure during this study (e.g., see Figure 2). The cumulative mercury volume at the closure pressure is used for the corrections. The sample bulk volume at closure is used in calculations of MICP-based bulk density, grain density, and porosity.
Figure 2. Plot of the change in sample volume, normalized by the original sample volume, versus pressure. The point of departure of the curve from the linear fit represents the “closure pressure.”

21
Conversion of intrusion pressure to pore throat diameter used a “bundle of capillary tubes” model via the Washburn equation (version of the Young-Laplace equation; Washburn, 1921; Dullien, 1992):
cPd
cos4 (4)
where d is the pore throat diameter of the modeled cylindrical pores; γ is the surface tension of mercury (or in general the interfacial tension between the non-wetting and wetting fluids); θ is the mercury-air/vacuum-rock contact angle; and Pc is the capillary pressure or in this case the mercury intrusion pressure (pressure difference between non-wetting and wetting fluids). Values used for contact angle and the mercury surface tension were 140° and 0.480 N m-1 (Pittman, 1992), respectively. Change from the mercury-air/vacuum system to the air-groundwater system is made using this equation:
mercuryairmercuryair
airrgroundwateairrgroundwatemercuryairairrgroundwate PP
//
//// cos
cos
(5)
where P represents the capillary pressure for the system in question labeled by the subscripts; and γ and θ represent interfacial tensions and contact angles. “Breakthrough pressure” is the pressure in a nonwetting phase at which that nonwetting phase penetrates a rock through a connected pore network of arbitrarily large size, which was previously saturated with the wetting phase (Dullien, 1992). This applies to sealing behavior of the Eau Claire Formation in terms of the pressures needed to result in significant multiphase fluid flow through the formation. 3.5 X-ray diffraction To ensure correspondence between thin section evaluation and X-ray diffraction (XRD), a section of each thin section rock sample was removed and prepared for XRD (Figure 3). X-ray diffraction was completed using a Siemens model D500 –2 powder diffractometer (Bruker AXS, Inc.; Madison, WI) using Cu K radiation (0.15406 nm). Measurements employed a diffracted-beam, curved-graphite monochromator for data collection with samples maintained at room temperature. The instrument power settings were 40 kV and 30 mA, and fixed slits were used. The diffraction patterns were collected over a range of 2 at a step size of 0.04o and a count time of 20 seconds per step.

22
Figure 3. Schematic of rock sample used for thin sections, billets, and XRD samples. The horizontal dimension left of the cut-line for the XRD is approximately 24 mm, the vertical dimension is approximately 40 mm, and the depth is approximately 1 cm. The material removed for XRD is such that it provided at least 1 gram of ground-up material. 3.6 Thin-section examination Locations of 28 rock samples for thin sections, billets, and XRD were selected after hand-sample evaluation of the core (see Appendix C for photo-inventory of thin sections). The locations were intended to support identification of distinct and reoccurring lithofacies within the Eau Claire Formation and Mount Simon Sandstone. Blocks of rock, at least 24 mm × 40 mm ×1.5 cm in size, were cut from the core. The up-hole or younging direction was marked with a notch (see Figure 3). Rock samples were impregnated with red fluorescent, low viscosity epoxy resin under vacuum. The samples were mounted to standard thin section slides (24 × 46 mm). The samples were then cut and ground to ~ 30 μm thickness. The remaining blocks of rock, with a “mirror” surface corresponding to the thin sections, were polished to produce a billet for laser scanning confocal microscopy, the results of which are not presented in this report. Thin sections were prepared by Wagner Petrographic, Lindon, Utah. Optical petrography by transmitted and reflected light was performed with a Leitz Wetzlar Orthoplan-Pol polarizing microscope. Reflected light was especially relevant to assess pyrite, which is opaque in transmitted light. Photomicrographs were taken using a Lecia DFC425 digital camera. Backscattered electron imaging and energy dispersive X-ray spectroscopy were performed on a Zeiss SUPRA 55VP instrument equipped with a Bruker quad silicon drift detector. Variable pressure mode was used with the Zeiss SUPRA 55VP, which obviated coating of the samples to mitigate charging. Grain size was estimated visually using a textural comparator (American/Canadian Stratigraphic, Denver and Colorado) and measurements on digital images. The degree of sorting was

23
determined using comparators by Longiaru (1987). Modal composition of two thin sections was determined by point counting (300 points) using both transmitted and reflected light (i.e, opaques were examined with reflected light). Separate 100 point counts were performed solely on porosity to evaluate relative percentages of pore types.

25
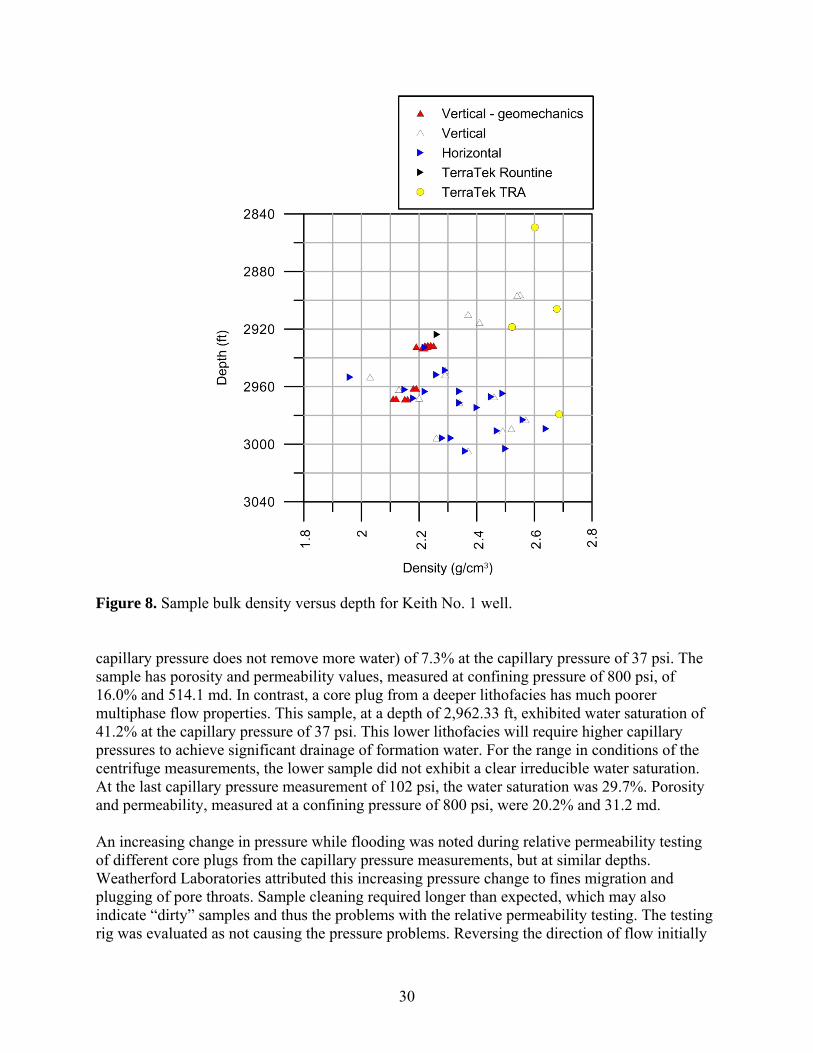
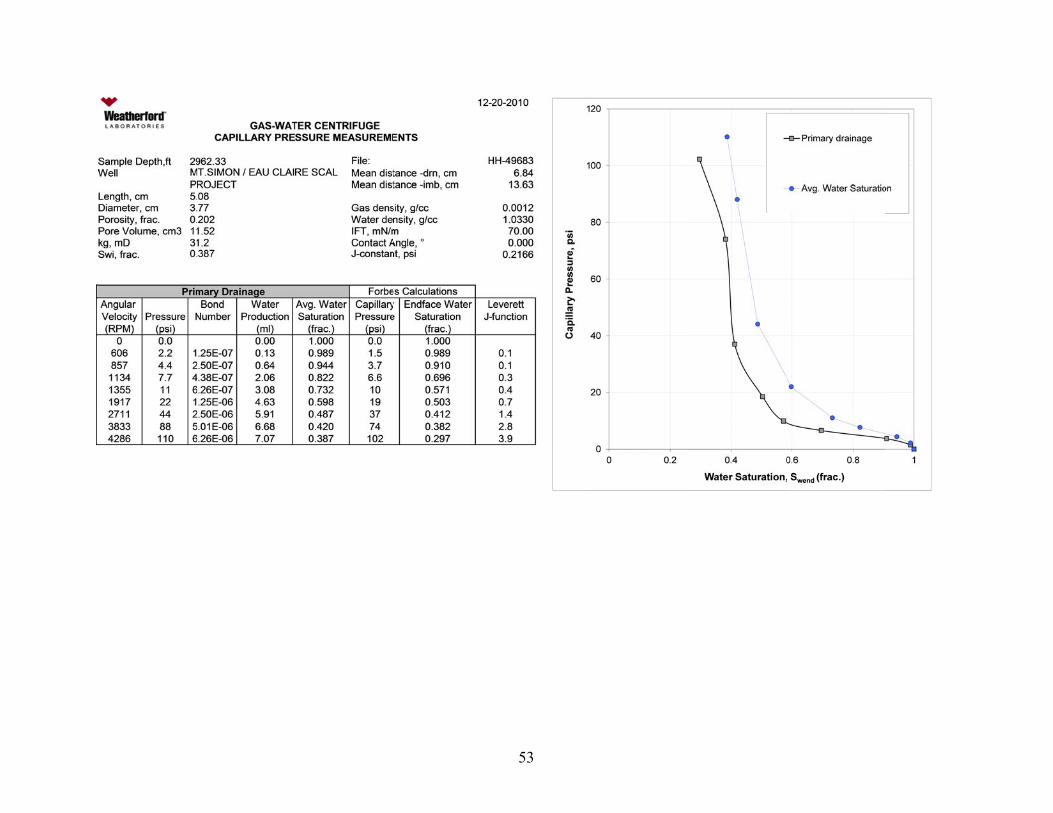
4. RESULTS 4.1. Overview of Keith No. 1 well logs, permeability, and XRD data Figure 4 displays Keith No. 1 well logs with the depth locations from the picks by The Hydrodynamics Group (2011) for the Eau Claire Formation and Mount Simon Sandstone, including informal A-D subdivisions, with the permeability and XRD data of this study. The Eau Claire Formation contains substantial dolomite. The Mount Simon Sandstone displays a quartz-rich upper portion and a very compositional heterogeneous portion at depths greater than approximately 2,950 ft. An important observation is that this permeability variation does not reach the high values (~1 D) of that initial Dallas Center Structure feasibility study (Moridis et al., 2007). Permeability measurements include those done on plugs for geomechanical tests or solely for permeability, which can be oriented vertically or horizontally to the direction of the wellbore. “TRA” indicates Tight Rock Analysis by TerraTek, Inc., a Schlumberger company, which is a pressure-decay measurement on crushed rock sample and thus an omni-directional measurement. “TerraTek routine” indicates measurement on a plug. Permeability varies greatly for the lower units (B, C, and D). Some measurements include clay-rich samples, which resulted in very low permeability (Figure 4). Low values may also be due to gypsum and hematite pore-filling cements, which are more dominant below the A unit (see Section 4.6). 4.2. Porosity, bulk density, absolute permeability, and TOC The Keith No . 1 porosity, bulk density, and permeability measurements are displayed in Figures 4-8. Appendix A contains tables of these data, including values for Mortimer No. 1 well and results of increasing the effective confining pressure during permeability measurements. The gas permeabilities reported are at 1500 psi confining pressure; data was collected at pressures from 500 psi to 3000 psi confining pressure (see Appendix A). A 10% to 20% change of permeability with increasing confining pressure was observed. The depths represented are predominantly for the Mount Simon Sandstone. Permeability varies over five orders of magnitude within the Mount Simon, showing a pronounced change to more variable values at depths greater than approximately 2,950 ft. This change corresponds with a lithofacies change from a quartzarenite to arkose and subarkose sandstones with depth. Porosity and permeability display no clear trends with depth (Figures 5 and 6), nor does bulk density (Figure 8). Porosity is poorly correlated with permeability for these Mount Simon Sandstone samples (Figure 7). Total organic carbon for samples depths 2,849.41, 2,906.11, 2,918.54, 2,923.81, and 2,979.20 ft are the following, respectively: 0.08, 0.06, 0.13, 0.08, 0.09 wt%. 4.3. Air-displacing-water capillary pressure and relative permeability measurements During primary drainage air-displacing-water capillary pressure measurements, the shallower sample at 2,933.63 ft drained to low water saturations at correspondingly low capillary pressure (Figure 9; see Appendix B for original data from Weatherford Laboratories). The sample reached irreducible water saturation (i.e., the volume of water per volume of voids when increasing

26
Figure 4. Well logs, permeability, XRD data, and log-based geologic units for Keith No. 1 well. The legend for permeability data indicates the direction (e.g., vertical or horizontal) or type of measurement.

27
Figure 5. Permeability versus depth for Keith No. 1 well.

28
Figure 6. Porosity versus depth for Keith No. 1 well.

29
Figure 7. Porosity versus permeability results for Keith No. 1 well.
30
Figure 8. Sample bulk density versus depth for Keith No. 1 well. capillary pressure does not remove more water) of 7.3% at the capillary pressure of 37 psi. The sample has porosity and permeability values, measured at confining pressure of 800 psi, of 16.0% and 514.1 md. In contrast, a core plug from a deeper lithofacies has much poorer multiphase flow properties. This sample, at a depth of 2,962.33 ft, exhibited water saturation of 41.2% at the capillary pressure of 37 psi. This lower lithofacies will require higher capillary pressures to achieve significant drainage of formation water. For the range in conditions of the centrifuge measurements, the lower sample did not exhibit a clear irreducible water saturation. At the last capillary pressure measurement of 102 psi, the water saturation was 29.7%. Porosity and permeability, measured at a confining pressure of 800 psi, were 20.2% and 31.2 md. An increasing change in pressure while flooding was noted during relative permeability testing of different core plugs from the capillary pressure measurements, but at similar depths. Weatherford Laboratories attributed this increasing pressure change to fines migration and plugging of pore throats. Sample cleaning required longer than expected, which may also indicate “dirty” samples and thus the problems with the relative permeability testing. The testing rig was evaluated as not causing the pressure problems. Reversing the direction of flow initially

31
improved the flow, which then subsequently became plugged again. This is also indicative of fines plugging pores. These plugs were rejected as the relative permeability data would have been faulty. The capillary pressure plug from the depth of 2,933.63 ft was then used for one relative permeability test (Figure 10), which did not exhibit the same increasing pressure change. The specific permeability to water (based on measured groundwater chemistry) is 309 md, whereas the specific permeability to air and the Klinkenberg permeability (the Klinkenberg correction was applied by Weatherford, see Appendix B) are 514 and 482 md, respectively. Porosity is 0.16. Gas relative permeability at a gas saturation of 0.54 is 0.20. The residual water saturation of 0.46 differs from that of the capillary pressure test, which was 0.07.
Figure 9. Primary drainage capillary pressure curves by centrifuge methods on two Mount Simon Sandstone core samples from Keith No. 1 well.

32
Figure 10. Relative permeability data (drainage cycle only) for air-water system at net confining stress of 800 psi and temperature of 72°F, for a sample depth of 2,933.63 ft from Keith No. 1 well. 4.4. Mercury capillary pressure measurements Mercury intrusion capillary pressure (MICP) measurements collected for both the overlying Eau Claire Formation and the Mount Simon Sandstone are converted to Washburn pore diameters (see Section 3.4, Eq. 4) in Figure 11. The Eau Claire Formation has pore throat diameters and capillary pressure characteristics consistent with a seal (i.e., high breakthrough pressures). The underlying Mount Simon Sandstone has capillary pore throat characteristics (i.e., low breakthrough pressures) generally consistent with reservoir rock. Figure 11displays clear separation of the majority of the Mount Simon Sandstone samples as being distinct from the Eau Claire Formation caprock samples, indicating the differences in pore throat sizes and capillary sealing behavior. 4.5. X-ray diffraction Figure 12 and Table 1 present XRD results as a function of depth. Samples from depths from 2,836.50 to 2,919.27 ft fall within the Eau Claire Formation. Mount Simon Sandstone samples are from depths 2,925.92 to 3,004.55 ft. The Eau Claire Formation samples are carbonate-dominated, with variable amounts of siliciclastics, clays, and minor occasional iron and titanium oxides and hydroxyapatite. Only the deepest sample at depth 2,919.27 ft, still included at the base of the Eau Claire Formation (see Figure 4 for depths of formation tops and bottoms), contains gypsum. Hydroxyapatite (associated with fossils, see Section 4.6) occurs at the base of the Eau Claire in samples of depths 2,913.34 and 2,918.27 ft. Dolomite is substantial at many depths, reaching 89.3 wt%. Clays include illite and kaolinite, which are 11.3 wt% or less.

33
Figure 11. Plot of incremental mercury saturation versus pore throat diameter for the 30 samples from Keith No. 1 well. Blue represents Mt. Simon Sandstone samples, whereas red indicates the Eau Claire Formation. “V” and “H” stand for vertical or horizontal directional porosimetry.

0%
10%
20%
30%
40%
50%
60%
70%
80%
90%
100%P
ha
se
(w
t%)
Figure 1
quartz micr
2. X-ray diffrac
rocline orthoclase
ction compositio
hematite gypsum
34
on versus depth
Sample Depth (ft)
m dolomite calc
for samples from
cite illite kaolinite
m Keith No. 1 w
e hydroxylapatite
well.
anatase

35
Table 1. X-ray diffraction results
Depth (ft) Quartz Microcline Orthoclase Hematite Gypsum Dolomite Calcite Illite Kaolinite Hydroxyapatite Anatase
2836.50 22.6(5) 20.3(5) 16.3(5) 0.1 - 12.4(5) 21.5(5) 5.7(5) 0.5 - 0.6
2837.96 22.5(5) 0.6 22.8(5) - - 12.7(5) 34.2(5) 6.0(5) 0.8 - 0.4
2850.89 19.6(5) 0.2 17.6(5) - - 18.8(5) 36.1(5) 6.2(5) 1.2(5) - 0.3
2860.76 2.2(5) 0.8 1.3(5) - - 25.9(5) 65.1(5) 4.7(5) - - -
2863.17 7.1(5) 0.7 1.8(5) - - 86.3(5) 1 3.1(5) - - -
2868.27 5.3(5) 0.1 1.8(5) - - 89.3(5) 3.5(5) - - - -
2879.09 13.6(5) 9.2(5) 20.7(5) - - 45.2(5) - 8.7(5) 2.6(5) - -
2891.68 12.7(5) 0.3 8.8(5) - - 73.8(5) 3.8(5) 0.6 - - -
2896.00 27.2(5) 0.2 19.2(5) 0.6 - 52.8(5) - - - - -
2909.10 24.3(5) 0.4 19.6(5) - - 47.3(5) - 7.3(5) 1.1(5) - -
2913.34 18.4(5) 0.2 1.8(5) - - 76.3(5) - - - 3.0(5) 0.3
2918.27 84.6(5) 0.1 4.2(5) - 2.8(5) - - - - 8.3(5) -
2919.27 85.3(5) - 1.3(5) - 11.5(5) - - - - - 1.9(5)
2925.92 96.0(5) 0.3 1.2(5) - - - - - - 2.0(5) 0.5
2931.10 97.7(5) - - - 1.2(5) - - - - 1.1(5) -
2948.91 96.3(5) - - - - - - - - 3.7(5) -
2951.58 47.3(5) 19.9(5) 25.9(6) - - - - 5.5(5) 0.8 0.6 -
2953.73 23.6(5) 35.4(5) 30.6(7) - - 0.8 - 7.5(5) 0.8 - 1.3(5)
2963.56 86.1(5) 0.6 7.6(5) 1.7(5) 2.3(3) - - 1.5(5) - 0.2
2964.81 62.2(5) 1.4(5) 25.2(5) - - - - 9.3(5) 0.9 - 1.0(5)
2967.20 82.6(5) 0.6 4.7(5) 0.8 7.9(5) - - 2.4(5) 0.4 - 0.6
2968.24 72.3(5) 0.6 26.2(5) 0.9 - - - - - -
2970.30 59.4(5) 0.5 29.4(5) 3.3(5) - - - 6.5(5) 0.9 - -
2983.42 67.8(5) 0.7 8.6(5) - 17.5(5) - - 4.9(5) 0.5 - -
2989.15 27.2(5) 20.1(5) 27.8(5) 16.5(5) - - - 7.9(5) 0.5 - -
2990.53 51.4(5) 1.2(5) 26.6(5) - 4.7(5) - - 13.9(5) 1.0(5) - 1.2(5)
2994.92 85.4(5) 1.6(5) 6.7(5) - 5.5(5) - - 0.8 - - -
3003.71 96.0(5) 0.2 1.8(5) 0.4 1.6(5) - - - - - -
3004.55 90.2(5) 0.1 4.4(5) 2.3(5) 0.9 - - 1.6(5) 0.5 - -

36
The upper Mount Simon Sandstone, based on samples 2,925.92 to 2,948.91 ft, is quartz-dominated with values of 96.0 to 97.7 wt%. The upper portion contains hydroxyapatite (associated with fossils, see Section 4.6) and gypsum. Deeper samples contain typically lesser quartz with substantial amounts of microcline and orthoclase feldspar, iron and titanium oxides, gypsum, and clays. 4.6. Thin-section examination Tables D1 through D4 in Appendix D summarize petrographic observations of 16 Mount Simon Sandstone thin sections with emphasis on framework and non-framework components, and on diagenesis. Table D1 focuses on grain size, sorting, and mineralogy of framework grains. Table D2 addresses non-framework components, especially authigenic minerals and porosity types. Table D3 presents diagenetic observations, such as authigenic mineral textures, the nature of contacts between framework grains, and dissolution textures. Table D4 provides modal composition based on pointing counting of two thin sections. Framework refers to grains that comprise the rigid framework of the rock. Non-framework refers to the interstitial components that reside in the spaces between or around the framework grains. Appendix E presents several photomicrographs, the observations of which were summarized in Tables D1–D4. The pink color of the scanned thin sections or the transmitted light images indicates connected porosity and hence permeability. The lithologies of the Mount Simon Sandstone samples vary from quartzarenite, arkose, and subarkose to sand- and silt-bearing mudstones (Table D1). Grain size ranges from clay (< 4 µm) to pebble-sized (~ 10 mm). Sorting similarly varies from very poorly sorted to very well sorted. The samples exhibit great variability in geologic properties from the depths of 2,925.92 to 3,004.55 ft. Samples from depths 2,925.92, 2,931.10, and 2,948.91 ft are almost pure quartz sandstone (i.e., quartzarenite) with minor fossil rock fragments (i.e., hydroxyapatite; inarticulate brachiopods) and authigenic minerals. Dissolution textures indicate that pore-filling cement (i.e., in situ precipitation) may have at some time filled interstitial spaces between the quartz grains, as indicated by ragged, caries (i.e., bite-like) texture, automorphic penetration, and embayed margins. Residual pore-filling, poikilotopic (i.e., cement that surrounds grains, typically as a single continuous crystal) cement is rare, however. Subarkose and arkose sandstones, samples deeper than 2,953.73 (except for sample N26 at depth 3,004.55 ft), also show ragged, corroded margins of framework and contain poikilotopic cements, such as gypsum and hematite. These cements are typically near zones of “floating” or almost “floating” grains (i.e., framework grains that have minimal to no contact with surrounding grains). Cements probably filled the pores around the floating grains, inhibiting compaction. The cements were later partially or fully dissolved (see Appendix E for photomicrographic examples). Contacts between framework grains vary from floating to tangential to long, with lesser occurrence of concavo-convex contacts (Table D3). These contacts occur at many depths, showing that compaction and some pressure dissolution has affected porosity at all depths. However, floating grains with corroded margins also occur, mainly at depths of 2,951.58 ft or

37
deeper, which indicate that compaction may have been inhibited by a once pore-filling cements that was later dissolved. Fe-Ti oxides (i.e., hematite and anatase) occur at most depths and display replacement textures of possible pre-existing ilmenite or titaniferous magnetite (see Morad and Aldahan, 1986, for a discussion of Fe-Ti oxides in sandstones); however, these grains occur in small (<1%) amounts. Ilmenite replacement can occur in mildly reducing conditions, with concomitant pyrite precipitation. Pyrite occurs in several thin sections in small amounts. Bulk XRD does not indicate any pyrite. Point counting of samples with pyrite-after-ilmenite grains did not measure areal percentages greater than 1%.


39
5. DISCUSSION AND IMPLICATIONS The major finding is that the intrinsic permeability distribution within the Dallas Center is relatively low and more heterogeneous than that of Redfield gas storage field. The feasibility study for Dallas Center Structure (Moridis et al., 2007) used favorable permeability values (up to 1,016 md for the Unit C, based on Redfield as an analogue, which do not correspond with the actual site permeability presented herein (see Section 4.2). Thus, re-evaluation of flow modeling found unfavorable conditions for air bubble formation at the site, which is one reason why the site was rejected (The Hydrodynamics Group, 2011). Petrographic observations indicate strong heterogeneity with depth of the Mount Simon Sandstone. Grain size, sorting, composition, and diagenetic characteristics all vary over large ranges. Such heterogeneity will impact compressed air energy storage in terms of fingering of air and efficiency during air cycling. Combination of these observations with permeability, capillary pressure, and well log data indicate that the upper portion (A unit; Fig. 4) of the formation is a potential flow unit, whereas the lower portion is difficult to separate into distinct flow units, which is in contrast to Redfield. The lower portion includes lithofacies of non-reservoir quality (i.e., low permeability and high mercury intrusion or breakthrough pressures). Major factors affecting pore size distributions and connectivity of pore space is the occurrence and dissolution of gypsum and hematite cements. These cements have affected the compaction of framework grains, in some cases inhibiting compaction and resulted in floating or almost-floating grains after dissolution of cements. In places without cements, compaction has reduced porosity through long and sutured contacts between framework grains and filling of pore space by overgrowths on framework grains. Some samples exhibit more precipitation of hematite and gypsum cement within zones of relatively coarse sand grains, as opposed to nearby zones of finer sandstone. Permeability and porosity probably vary substantially with depth due to the patchy nature of the gypsum and hematite cements. The cement probably enhanced permeability by inhibiting compaction and then later being dissolved to provide connected pore space; however, if it still fills pore space, then it reduces porosity and permeability. We speculate that Redfield gas storage field may have undergone dissolution of evaporite (i.e., gypsum) cement due to soluble nature of gypsum, which in turn may have improved its permeability. Pyrite occurs in association with Ti oxide due to replacement of pre-existing ilmenite grains (see Morad and Aldahan, 1986, for presentation of chemical reactions facilitating this reaction). Quantification of pyrite, via bulk XRD and two point counts, indicates pyrite is not a major authigenic mineral (i.e., less than one areal percent or wt%). Furthermore, pyrite can exhibit an Fe-rich coating on its outer margins that may further inhibit interaction with pore fluids (see Appendix E for photomicrographs of pyrite). Thus, we conclude pyrite is of no concern to this project in terms of potential acidification by oxidizing fluids or to consumption of oxygen in the air. Viewing the data and findings altogether, we recommend for siting CAES that heterogeneity in flow properties be carefully considered for the Mount Simon Sandstone in the Thurman-Redfield structural zone, Iowa, and other locales that display similar well log characteristics. Future work

40
should address regional variation in permeability as a function of primary textural and diagenetic alterations, which can greatly affect site-specific performance assessment.

41
6. REFERENCES Almon, W.R., Dawson, W.C., Botero-Duque, F., Goggin, L.R., Yun, J.W., 2008. Seal analysis
workshop, printed materials, Chevron Energy Technology Company: held at the Joint Annual Meeting of the Geological Society of America, Soil Science Society of America, American Society of Agronomy, Crop Science Society of America, and the Gulf Coast Association of Geological Studies with the Gulf Coast Section of SEPM, October 5-9, Houston, Texas.
Anderson, R.R., McKay, R.M., 1989. Clastic Rocks Associated with the Midcontinent Rift System in Iowa, Chapter I, in: Day, W.C., Lane, D.E. (Eds.), Strategic and Critical Minerals in the Midcontinent Region, United States. U.S. Geological Survey Bulletin 1989-I, Denver, Colorado, pp. I1-I44.
Bay Geophysical Inc., 2006. Final Report - High Resolution Compressional Seismic Survey, Dallas County, Iowa. Consultants Report to Iowa Stored Energy Plant Agency, September 22.
Becker, L.E., Hreha, A.J., Dawson, T.A., 1978. Pre-Knox (Cambrian) Stratigraphy in Indiana, Bulletin 57. State of Indiana Department of Natural Resources Geological Survey, p. 72.
Bowen, B.B., Ochoa, R.I., Willkens, N.D., Brophy, J., Lovell, T.R., Fischietto, N., Medina, R., Rupp, J.A., 2011. Depositional and diagenetic variability within the Cambrian Mount Simon Sandstone: implications for carbon dioxide sequestration. Environmental Geosciences 18, 69-89.
Colombo, I., Carli, F., 1981. Measurement of compressibility coefficient of nonporous polymer powders by mercury porosimetry. Powder Technology 29, 285-287.
Dewers, T., Newell, P., Broome, S., Heath, J., Bauer, S., submitted 31 October 2012. Geomechanical behavior of Cambrian Mount Simon Sandstone lithofacies, Iowa Shelf, USA. Journal of Geophysical Research-Solid Earth.
Dullien, F.A.L., 1992. Porous media - fluid transport and pore structure, Second Edition. Academic Press, Inc., London, UK.
Folk, R.L., 1974. Petrology of sedimentary rocks. Hemphill Publishing, Austin, Texas. Forbes, P.L., 1991. Simple and accurate methods for converting centrifuge data into drainage and
imbibition capillary pressure curves, Society of core analysts annual technical conference, August 20-22, San Antonio, Texas, paper SCA-9107.
Forbes, P.L., 1994. Simple and accurate methods for converting centrifuge data into drainage and imbibition capillary pressure curves. The Log Analyst 35, 31-53.
Forbes, P.L., 1997. Centrifuge data analysis techniques: an SCA survey on the drainage capillary pressure curves from centrifuge measurements, Proceedings of the International Symposium of the Society of Core Analysts, September 8-10, Calgary, paper SCA-9714.
Frailey, S.M., Damico, J., Leetaru, H.E., 2011. Reservoir characterization of the Mt. Simon Sandstone, Illinois Basin, USA. Energy Procedia 4, 5487-5494.
Hershey, H.G., 1962. Iowa, in: Research Committee of the Interstate Oil Compact Commission (Ed.), Underground Storage of Natural Gas in the United States. Interstate Oil Compact Commission, Oklahoma City, Oklahoma.
Hoholick, J.D., Metarko, T., Potter, P.E., 1984. Regional variations of porosity and cement: St. Peter and Mount Simon Sandstones in Illinois Basin Aapg Bulletin 68, 753-764.

42
Katz, A.J., Thompson, A.H., 1987. Prediction of rock electrical conductivity from mercury injection measurements. Journal of Geophysical Research-Solid Earth and Planets 92, 599-607.
MacQuaker, J.H.S., Adams, A.E., 2003. Maximizing information from fine-grained sedimentary rocks: an inclusive nomenclature for mudstones. Journal of Sedimentary Research 73, 735-744.
McKay, R.M., 1988. Stratigraphy and lithofacies of the Dresbachian (Upper Cambrian) Eau Claire Formation in the subsurface of eastern Iowa, in: Ludvigson, G.A., Bunker, B.A. (Eds.), New perspectives on the Paleozoic history of the Upper Mississippi Valley. Society of Economic Paleontologists and MIneralogists, Guidebook for the 18th Field Conference of the Great Lakes section, pp. 33-53.
Medina, C.R., Rupp, J.A., 2012. Reservoir characterization and lithostratigraphic division of the Mount Simon Sandstone (Cambrian): implications for estimations of geologic sequestration storage capacity. Environmental Geosciences 19, 1-15.
Morad, S., Aldahan, A.A., 1986. Alteration of detrital Fe-Ti oxides in sedimentary rocks. Geological Society of America Bulletin 97, 567-578.
Moridis, G., King, M., Jansen, J., 2007. Iowa Stored Energy Park Compressed-Air Energy Storage Project: Compressed-Air Energy Storage Candidate Site Selection Evaluation in Iowa: Dallas Center Feasibility Analysis. Prepared for the Iowa Stored Energy Plant Agency by the Hydrodynamics Group, LLC, p. 46.
Saeed, A., Evans, J.E., 2012. Subsurface facies analysis of the Late Cambrian Mt. Simon Sandstone in western Ohio (Midcontinent North America). Open Journal of Geology 2, 35-47.
Sigal, R.F., 2009. A methodology for blank and conformance corrections for high pressure mercury porosimetry. Measurement Science & Technology 20, 1-11.
Succar, S., Williams, R.H., 2008. Compressed Air Energy Storage: Theory, Resources, and Applications for Wind Power. Energy Systems Analysis Group, Princeton Environmental Institute, Princeton University, p. 81.
The Hydrodynamics Group, 2010. Keith Well Report: ISEP Compressed Air Energy Storage (CAES) Project, Phase II CAES Confirmatory Drilling and Testing Program. Prepared for the Iowa Stored Energy Park, p. 44.
The Hydrodynamics Group, 2011. Iowa Stored Energy Plant Agency Compressed-Air Energy Storage Project: Final Project Report - Dallas Center Mt. Simon Structure CAES System Performance Analysis. Prepared for the Iowa Stored Energy Plant Agency, Des Moines, Iowa, p. 52.

43
APPENDIX A: PERMEABILITY AND EFFECTIVE CONFINING PRESSURE
Tables A1 and A2 present permeability, porosity, and bulk density data for the Keith No.1 and Mortimer No. 1 wells, following methods given in Section 3.2.

44
Table A1. Permeability, porosity, and bulk density for Keith No. 1 well.
Depth (ft) Depth ID Porosity Density (g/cm3) Perm. (md)
2849.41 2849.41 0.04 2.602 4.76E-04
2896.2 2896.2V 0.17 2.55 -
2896.7 2896.7V 0.04 2.54 -
2906.11 2906.11 0.05 2.678 9.70E-01
2909.95 2909.95V 0.22 2.37 -
2915.52 2915.52V 0.07 2.41 7.20E-04
2918.54 2918.54 0.07 2.523 1.01E-04
2923.81 2923.81 0.17 2.262 5.50E+01
2931.25 2931.25 A 0.16 2.23 2.91E+02
2931.25 2931.25 B 0.15 2.24 2.66E+02
2931.53 2931.53 A 0.16 2.22 3.16E+02
2931.53 2931.53 B 0.15 2.25 2.66E+02
2931.9 2931.9 A 0.16 2.22 1.12E+02
2931.9 2931.9 B 0.16 2.22 1.34E+02
2932.29 2932.29 A 0.17 2.19 1.72E+02
2932.29 2932.29 B 0.16 2.23 2.20E+02
2932.72 2932.72H 0.16 2.22 2.88E+02
2933.25 2933.25A 0.16 2.21 2.80E+02
2933.25 2933.25B 0.16 2.22 2.41E+02
2948.61 2948.61 V 0.14 2.29 1.36E+02
2948.61 2948.61H 0.14 2.29 1.36E+02
2951.79 2951.79 V 0.14 2.29 4.67E+00
2951.79 2951.79 H 0.15 2.26 1.35E+02
2953.46 2953.46 V 0.21 2.03 1.78E-01
2953.46 2953.46 H 0.25 1.96 8.85E+01
2961.31 2961.31 A 0.17 2.18 7.83E+01
2961.31 2961.31 B 0.17 2.19 9.86E+01
2962.03 2962.03 V 0.19 2.13 3.17E-01
2962.03 2962.03 H 0.19 2.15 8.97E+01
2963.23 2963.23 H 0.12 2.34 3.92E+01
2963.43 2963.43 H 0.18 2.22 9.97E+00
2964.69 2964.69 H 0.04 2.49 1.49E+01
2967.05 2967.05 V 0.06 2.46 1.94E-02
2967.05 2967.05 H 0.06 2.45 1.34E+00
2968.12 2968.12 V 0.17 2.2 6.00E-04
2968.12 2968.12 H 0.17 2.18 9.04E+00
2968.42 2968.42 A 0.21 2.11 4.00E-04
2968.42 2968.42 B 0.2 2.12 2.50E-03
2968.69 2968.69 A 0.18 2.16 5.10E-03
2968.69 2968.69B 0.18 2.15 3.16E+02

45
Table A1 continued.
Depth (ft) Depth ID Porosity Density (g/cc) Permeability
(md)
2971.24 2971.24 V 0.18 2.34 1.92E+00
2971.24 2971.24 H 0.11 2.34 6.72E+01
2974.58 2974.58 H 0.09 2.4 1.06E+02
2979.2 2979.2 0.17 2.686 4.91E-04
2983.12 2983.12 V 0.01 2.57 2.00E-03
2983.12 2983.12 H 0.01 2.56 8.90E-03
2989.25 2989.25 V 0.06 2.52 -
2989.25 2989.25 H 0.04 2.64 6.00E-04
2990.71 2990.71 V 0.04 2.49 4.04E-02
2990.71 2990.71 H 0.22 2.47 5.17E-01
2995.76 2995.76V 0.17 2.26 3.40E+00
2995.76 2995.76 H 0.13 2.31 -
2995.76 2995.76 H 0.12 2.28 1.11E+02
3003.11 3003.11 H 0.04 2.5 5.36E-01
3004.76 3004.76V 0.09 2.37 1.18E-02
3004.76 3004.76 H 0.09 2.36 -
Table A2. Permeability, porosity, and bulk density for Mortimer No. 1 well.
Depth (ft) Depth ID Porosity Density (g/cm3) Perm. (md)
2947.35 2947.35 H 0.17 2.21 3.20E+00
2947.05 2947.05 V 0.07 2.48 6.74E-03
2981.20 2981.2 H 0.1 2.47 4.80E-04
2980.87 2980.87 V 0.09 2.6 0.00000*
2966.58 2966.58 H 0.03 2.53 4.07E+00
2966.75 2966.75 V 0.03 2.51 1.44E-03
2986.40 2986.4 H 0.18 2.18 3.24E+02
2986.58 2986.58 V 0.16 2.23 1.18E+02
2975.80 2975.8 H 0.08 2.41 9.81E+01
2975.54 2975.54 V 0.16 2.21 2.73E+02
2956.35 2956.35 H 0.11 2.36 9.58E+01
2956.00 2956.0 V 0.12 2.35 1.13E-03
2940.40 2940.4 H 0.18 2.17 1.48E+02
2940.75 2940.75 V 0.17 2.2 7.25E+01
2923.25 2923.25 H 0.11 2.35 7.83E+01
2924.25 2924.25 V 0.16 2.19 4.96E-01
2936.10 2936.1 H 0.15 2.25 1.55E+02
2936.25 2936.25 V 0.14 2.25 1.13E+02
2917.12 2917.12 H 0.14 2.28 1.55E+02
2917.40 2917.4 V 0.15 2.26 -

FigureNo.1 w
e A1. Permeawell.
ability versuus effective c
46
confining preessure (resullts from all teests) for Kei
ith

FigureKeith N
e A2. PermeaNo. 1 well.
ability versuus effective c
47
confining preessure (resullts from low flow tests) f
for

Figure Awell.
A3. Permeability versus eeffective con
48
nfining presssure (all testt results) for Mortimer N
No. 1

Figure AMortimer
A4. Permeabr No. 1 well
ility versus e.
effective con
49
nfining presssure (low peermeability test results) f
for


51
APPENDIX B: ORIGINAL DATA FROM WEATHERFORD LABORATORIES ON CAPILLARY PRESSURE AND RELATIVE
PERMEABILITY The tables in this appendix are from the original reported data provided by Weatherford Laboratories.

52
53

54

55


57
APPENDIX C: THIN SECTION INVENTORY This appendix presents an inventory of the thin sections and an atlas of photomicrographs from electron and optical petrography of the Mount Simon Sandstone. The thin sections were made from core from the Iowa Stored Energy Plant Agency Keith No. 1 well (see Section 3.5-3.6).

58

59

60

61
APPENDIX D: TABLES OF MOUNT SIMON SANDSTONE PETROGRAPHIC OBSERVATIONS
This appendix presents tables of petrographic observations of Mount Simon Sandstone thin sections, supplemented by X-ray data. This information includes the following: formal rock name classification; textural and diagenetic descriptions of framework grains and non-framework components (e.g., matrix or authigenic minerals) and porosity types; and point counting results.

62
Table D1. Rock name and textural information based on petrographic and XRD observations of framework components
ID Depth (ft) Rock Name1 Predominant grain size2 Sorting3 Framework Grains Comments
N11 2925.92 quartzarenite vfU, fL, fU well/moderately well sorted (0.50)
quartz, minor feldspar, and fossil (brachiopod) rock fragments
Fossils can be much larger than other framework grains and were ignored for determining texture.
N12 2931.10 quartzarenite fl, fU very well/well sorted (0.35) quartz; minor fossil rock fragments
No comment.
N13 2948.91 quartzarenite fL, fU, mL well/moderately well sorted (0.50)
quartz; minor rock fragments including fossil fragments and chert
No comment.
N14 2951.58 arkose fL, fU, mL well/moderately well sorted (0.50)
quartz, feldspar, and minor fossil rock fragments; minor glauconitic grains
Texture applies to sandstone, although part of the thin section contains mudstone interbeds; rock name based on XRD.
N15 2953.73 coarser grained portion: arkose; finer grained portion: very fine sand- and silt-bearing to -rich mudstone
sandstone portion: vfL, vfU; mudstone portion: vfL, coarse silt and smaller
sandstone portion: very well/well sorted (0.35); mudstone portion: poorly/very poorly sorted (2.0)
sandstone: quartz, feldspar, muscovite mudstone: quartz, feldspar, muscovite
No comment.
N16 2963.56 subarkose vfL, vfU, fL, fU, mL, mU cL, cU
moderately/poorly sorted (1.00)
quartz, feldspar No comment.
1Folk (1974) classification for sandstone; MacQuaker and Adams (2003) classification for mudstone; classification based on visual estimates of framework grain composition using comparators. If sandstone, the rock name neglects non-framework components.
2Textural abbreviations include: very fine, vfL (62–88 µm), vfU (88–125 µm); fine, fL (125–177 µm), fU (177–250 µm); medium sand, mL (250–350 µm), mU (350–500 µm); coarse sand, cL (500–710 µm), cU (710–1000 µm); very coarse sand, vcL (1000–1410 µm), vcU (1410–2000 µm); granule, gL (2–2.83 mm), gU (2.83–4 mm); and pebble, pL (4–16 mm). The predominant grain size is given here; larger or smaller grains can occur.
3Sorting estimates are less accurate for mudstone-dominated thin sections.

63
Table D1 continued
ID Depth (ft) Rock Name1 Predominant grain size2 Sorting3 Framework Grains Comments
N17 2964.81 arkose relatively finer grained layers; fL, fU, mL; coarser grained layers: fL, fU, mL, mU, cL, cU, vcL
coarser grained layers: well/moderately well sorted (0.50); finer grained layers: very well/well sorted (0.35)
quartz, feldspar No comment.
N18 2967.20 subarkose vfU to pL moderately/poorly sorted (1.00)
quartz, feldspar Texture is for the lower 2/3 of the thin section and neglects the fine-grained layer.
N19 2968.24 arkose vfL, vfU very well sorted (0.0) quartz, feldspar No comment.N20 2970.30 fine sand- and silt-bearing
mudstonerelatively finer grained layer: vfU, vfL, coarse silt, and smaller
relatively finer grained layer: poorly/very poorly sorted (2.00)
clays - silt and sand (quartz, feldspar, muscovite) generally "float" in clay
Focus is on clay-rich portion of thin section.
N21 2983.42 subarkose vfU to gL moderately well/moderately sorted (0.71)
quartz, feldspar Texture focuses on sandstone section.
N22 2989.15 arkose cL to sand, silt, and smaller
poorly/very poorly sorted (2.00)
feldspar, quartz, minor muscovite
Texture includes fine grained material.
N23 2990.53 in general: arkose vcU to sand, silt, and smaller
poorly/very poorly sorted (2.00)
quartz, feldspar, muscovite Heterogeneous thin section.
3Sorting estimates are less accurate for mudstone-dominated thin sections.
1Folk (1974) classification for sandstone; MacQuaker and Adams (2003) classification for mudstone; classification based on visual estimates of framework grain composition using comparators. If sandstone, the rock name neglects non-framework components.2Textural abbreviations include: very fine, vfL (62–88 µm), vfU (88–125 µm); fine, fL (125–177 µm), fU (177–250 µm); medium sand, mL (250–350 µm), mU (350–500 µm); coarse sand, cL (500–710 µm), cU (710–1000 µm); very coarse sand, vcL (1000–1410 µm), vcU (1410–2000 µm); granule, gL (2–2.83 mm), gU (2.83–4 mm); and pebble, pL (4–16 mm). The predominant grain size is given here; larger or smaller grains can occur.

64
Table D1 continued
ID Depth (ft) Rock Name1 Predominant grain size2 Sorting3 Framework Grains Comments
N24 2994.92 subarkose relatively finer grained portion: vfU, fL, fU; coaser grained portion: cU, cL, mU, mL, fU, fL
relatively finer grained layers: very well sorted (0.0) to very well/well sorted (0.35); coaser grained layers: well/moderately well sorted (0.5)
quartz, feldspar Thin section is of tilted layers of relatively finer and coaser material, which are described separately in terms of texture; minor vcL grains occur.
N25 3003.71 quartzarenite vfU to pL poorly/very poorly sorted (2.00)
quartz, feldspar No comment.
N26 3004.55 quartzarenite fL to gU well/moderately well sorted (0.50)to moderately well/moderately sorted (0.71)
quartz, feldspar, minor chert rock fragments
Texture combines very coarse and finer portions, but neglects the mdustone interbeds.
1Folk (1974) classification for sandstone; MacQuaker and Adams (2003) classification for mudstone; classification based on visual estimates of framework grain composition using comparators. If sandstone, the rock name neglects non-framework components.
2Textural abbreviations include: very fine, vfL (62–88 µm), vfU (88–125 µm); fine, fL (125–177 µm), fU (177–250 µm); medium sand, mL (250–350 µm), mU (350–500 µm); coarse sand, cL (500–710 µm), cU (710–1000 µm); very coarse sand, vcL (1000–1410 µm), vcU (1410–2000 µm); granule, gL (2–2.83 mm), gU (2.83–4 mm); and pebble, pL (4–16 mm). The predominant grain size is given here; larger or smaller grains can occur.3Sorting estimates are less accurate for mudstone-dominated thin sections.
65
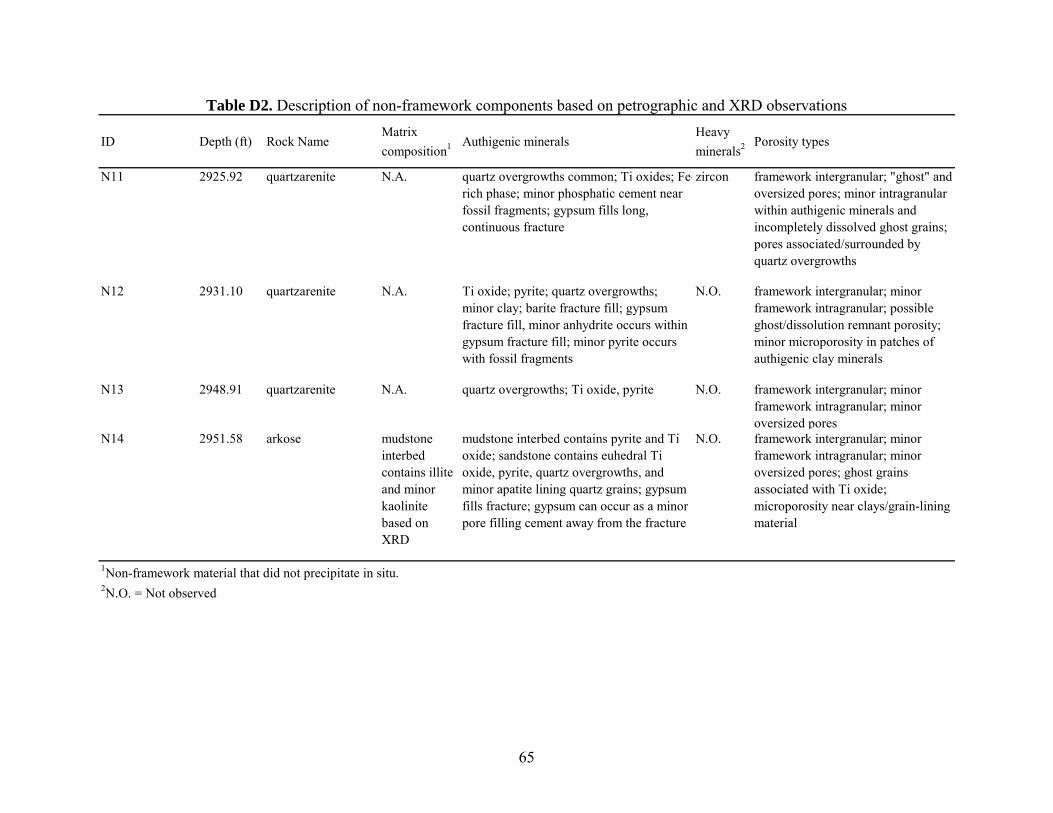
Table D2. Description of non-framework components based on petrographic and XRD observations
ID Depth (ft) Rock NameMatrix
composition1 Authigenic mineralsHeavy
minerals2 Porosity types
N11 2925.92 quartzarenite N.A. quartz overgrowths common; Ti oxides; Fe-rich phase; minor phosphatic cement near fossil fragments; gypsum fills long, continuous fracture
zircon framework intergranular; "ghost" and oversized pores; minor intragranular within authigenic minerals and incompletely dissolved ghost grains; pores associated/surrounded by quartz overgrowths
N12 2931.10 quartzarenite N.A. Ti oxide; pyrite; quartz overgrowths; minor clay; barite fracture fill; gypsum fracture fill, minor anhydrite occurs within gypsum fracture fill; minor pyrite occurs with fossil fragments
N.O. framework intergranular; minor framework intragranular; possible ghost/dissolution remnant porosity; minor microporosity in patches of authigenic clay minerals
N13 2948.91 quartzarenite N.A. quartz overgrowths; Ti oxide, pyrite N.O. framework intergranular; minor framework intragranular; minor oversized pores
N14 2951.58 arkose mudstone interbed contains illite and minor kaolinite based on XRD
mudstone interbed contains pyrite and Ti oxide; sandstone contains euhedral Ti oxide, pyrite, quartz overgrowths, and minor apatite lining quartz grains; gypsum fills fracture; gypsum can occur as a minor pore filling cement away from the fracture
N.O. framework intergranular; minor framework intragranular; minor oversized pores; ghost grains associated with Ti oxide; microporosity near clays/grain-lining material
1Non-framework material that did not precipitate in situ.2N.O. = Not observed

66
Table D2 continued
ID Depth (ft) Rock NameMatrix
composition1 Authigenic mineralsHeavy
minerals2 Porosity types
N15 2953.73 coarser grained portion: arkose; finer grained portion: very fine sand-and silt-bearing to -rich mudstone
mudstone: clays; illite common
mudstone: Ti oxide; less abundant pyrite; minor clay
N.O. sandstone: intergranular macro porosity, microporosity in clays associated with degraded feldspars; mudstone: minor microporosity in clay; minor intragranular porosity in non-clay components; minor intergranular porosity between silt/sand-rich portions of the sample
N16 2963.56 subarkose N.A. Ti oxide, hematite, gypsum, pyrite not confirmed after preliminary examination; clay associated with degraded feldspar
N.O. intergranular macro porosity; ghost grains; porosity associated with corroded grains; intragranular porosity, probably twin controlled in feldspar
N17 2964.81 arkose N.A. Ti oxide, hematite, gypsum, barite, pyrite not confirmed after preliminary examination; clay associated with degraded feldspar
N.O. ghost grains, intergranular macro porosity, porosity associated with corroded framework grains
N18 2967.20 subarkose mainly illite in finer grained interbed
poikilotopic gypsum, anhydrite with gypsum, minor hematite, Ti oxide, clay associated with degraded feldspars, quartz and feldspar overgrowths
N.O. ghost grains porosity, intergranular macroporosity, intragranular macroporosity, intergranular porosity associated with corroded framework grains
N19 2968.24 arkose clays hematite, gypsum, Ti oxide, pyrite not confirmed after examination by reflected light, clays associated with degraded feldspars, overgrowths on framework grains
N.O. intergranular macroporosity associated with corroded grains, microporosity associated with clays, ghost grains within hematite cement
1Non-framework material that did not precipitate in situ.2N.O. = Not observed

67
Table D2 continued
ID Depth (ft) Rock NameMatrix
composition1 Authigenic mineralsHeavy
minerals2 Porosity types
N20 2970.30 fine sand- and silt-bearing mudstone
clays Ti oxide (euhedral and replacement textures), pyrite not confirmed by examined with reflect light, clays associated with degraded feldspars
N.O. porosity difficult to identify within clay-rich portions of thin section
N21 2983.42 subarkose N.A. gypsum, anhydrite, clays, hematite, overgrowths on framework grains
N.O. intergranular macroporosity, oversized pores, pores associated with corroded framework grains, intragranular porosity, microporosity associated with clays
N22 2989.15 arkose possible clays clays, hematite, gypsum N.O. intergranular microporosity in clays, porosity associated with dissolution of cement
N23 2990.53 in general: arkose clays quartz and feldspar overgrowths (in portions without abundant matrix); Ti oxide; minor pyrite, gypsum, hematite
zircon microporosity in clays; macroporosity associated with corroded framework grains;
N24 2994.92 subarkose N.A. framework grain overgrowths, poikilotopic gypsum,
zircon intergranular macroporosity associated with corroded framework grains; intragranular macroporosity; porosity associated with clays; oversized pores
N25 3003.71 quartzarenite N.A. poikilotopic hematite, framework grain overgrowths, clays associated with degraded feldspar
zircon intergranular macroporosity associated with corroded framework grains; porosity associated with ghost grains; intergranular microporosity
N26 3004.55 quartzarenite N.A. clays associated with degraded feldspar, poikilotopic hematite and gypsum, overgrowths on framework grains, Ti oxide, pyrite not confirmed with examination by reflected light
N.O. intergranular macroporosity associated with corroded grains; microporosity in clays; macro and micro intragranular porosity associated with framework and clays
1Non-framework material that did not precipitate in situ.2N.O. = Not observed

68
Table D3. Summary of diagenetic observations based on petrographic and XRD data
ID Depth (ft) Rock Name Authigenic mineral texturesContacts between
framework grain grainsDissolution textures
N11 2925.92 quartzarenite euhedral quartz overgrowths; automorphic penetration of quartz by Ti-rich phase; quartz overgrowths can be missing in locations due to pressure solution; pyrite and Ti oxide replacement of framework-sized grains that were probably ilmenite or titaniferous magnetite; quartz-lining phosphatic phase occurs rarely
tangential and long contacts common between quartz grains: lesser occurrence of concavo-convex contacts
minor automorphic penetration; ghost grains; some sutured contacts between quartz grains
N12 2931.10 quartzarenite pyrite, typically in the shape of framework-sized grains - probably replacement of ilmenite; barite fills sub-vertical fractures, encompassing quartz and minor pyrite-replaced grains; gypsum also fills sub-vertical fractures and encompasses framework grains near/within the fracture
tangential and long contacts common between quartz grains: lesser occurrence of concavo-convex contacts
ragged, caries texture of quartz in barite fracture fill; quartz commonly appears corroded or has embayment-like margins
N13 2948.91 quartzarenite minor pyrite in fossil fragments; Ti oxide can occur in patches or as single crystals; quartz grains show ragged, caries texture indicated dissolution of the quartz or a once pore-filling cement; quartz overgrowths are less common than samples N11 and N12; an opaque grain-lining phase occurs, which may be Fe oxide or clays or apatite
tangential and long contacts
framework quartz commonly exhibit caries or ragged contacts and embayment-shaped margins
N14 2951.58 arkose pyrite and euhedral Ti oxide collocated in framework-grain sized patches indicates replacement of ilmenite; opaque material lines some framework grains, possible clay or Fe oxide; quartz overgrowths generally missing in area of floating grains; quartz overgrowths present; feldspar overgrowths probable
floating, tangential, and long contacts between framework grains
corroded quartz grains; margins of framework grains with embayments
N15 2953.73 coarser grained portion: arkose; finer grained portion: very fine sand-and silt-bearing to -rich mudstone
sandstone: poikilotopic gypsum, clay associated with degraded feldspar; feldspar overgrowths, Ti oxide; mudstone: Ti oxide replacement of portions of framework grains; pyrite can have euhedral shapes; oversized patches of gypsum cement
sandstone: tangential and long contacts common, floating contacts in areas of corroded grains
sandstone: quartz and feldspar grains corroded, ghost grains and dissolution remnants

69
Table D3 continuedID Depth (ft) Rock Name Authigenic mineral textures Contacts between
framework grain grainsDissolution textures
N16 2963.56 subarkose hematite can occlude porosity in portions of the sample; quartz and feldspar display ragged, caries texture and embayments by hematite; hematite is not continuous throughout the sample; poikilotopic gypsum cement fills centers of pores that are lined by hematite; framework overgrowths more difficult to recognize
framework grains display long and tangential contacts, cements can surrounded grains
zones of corroded framework grains lack hematite cement suggesting dissolution of the cement
N17 2964.81 arkose quartz overgrowths, pore filling, poikilotopic hematite, poikilotopic barite (not filling fracture as before), barite surrounds hematite, poikilotopic gypsum surrounded hematite, Ti oxide associated with ghost grains; anhydrite occurs within gypsum cements
floating in cement, tangential, long
corroded quartz and feldspar grains
N18 2967.20 subarkose poikilotopic gypsum surrounding framework grains and Ti oxide and quartz and feldspar overgrowths,
floating framework grains in gypsum, floating grains that are corroded, tangential and long contacts
corroded framework grains, ghost grains
N19 2968.24 arkose poikilotopic hematite in patches (not as continuous as in shallower samples), poikilotopic gypsum surrounding framework grains and hematite that lines grains
tangential and long contacts, almost floating contacts associated with corroded grains
porosity associated with corroded grains
N20 2970.30 fine sand- and silt-bearing mudstone
clays within degraded feldspar grains, minor caries texture on framework grains
sand and silt grains typically float in clay but can exhibit long contacts when touching
caries texture on framework grains
N21 2983.42 subarkose poikilotopic gypsum surrounding framework grains and authigenic hematite and authigenic euhedral Ti oxide and framework grain overgrowths, clays associated with degraded feldspar
long and sutured contacts between framework grains, tangential and floating contacts associated with gypsum cemented areas
corroded, embayed framework grains, porosity associated with corroded grains

70
Table D3 continued ID Depth (ft) Rock Name Authigenic mineral textures Contacts between
framework grain grainsDissolution textures
N22 2989.15 arkose poikilotopic hematite and gypsum, clay associated with degraded feldspar, hematite can be patchy or fairly continuous laterally and vertically
framework grains can "float" in hematite cement, some tangential and long contacts in areas of no or less hematite cement
framework grains exhibit corroded margins and embayments
N23 2990.53 in general: arkose poikilotopic gypsum surrounding framework grains and hematite cement
long contacts between framework grains, more tangential contacts in areas of corroded grains with more abundant porosity
porosity associated with corroded grains
N24 2994.92 subarkose poikilotopic gypsum surrounds framework grains with overgrowths; gypsum is more abundant in relatively coarser grain portions of the sample
long contacts; almost floating contacts in areas of corroded framework grains
porosity associated with corroded grains
N25 3003.71 quartzarenite poikilotopic gypsum and hematite; fracture lining hematite in quartz framework grains
long contacts between framework grains; more open, almost floating contacts in areas of corroded grains
ghost grains, porosity associated with corroded grains, pressure solution at long contacts
N26 3004.55 quartzarenite poikilotopic gypsum that surrounds framework grains and grain-lining hematite; quartz overgrowths can occur over hematite dust rings
long and sutured contacts occur
porosity associated with grain boundaries that can also be filled with gypsum, indicating dissolution of cements at grain boundaries; oversized pores; intergranular porosity associated with corroded grains

71
Table D4. Results of point counts for modal composition and porosity types
ID Depth (ft)Quartz grain
(core)Quartz
overgrowthFeldspar
Rock fragments
Euhedral Ti oxide PyriteGypsum
fracture fillClay and opaques
Heavy minerals
Barite fracture
fillPorosity
N11 2925.92 73 6 0 1 1 0 1 5 0 0 12N12 2931.10 71 8 3 1 0 0 1 4 0 2 10
ID Depth (ft)Intergranular, not oversized
Oversized Ghost grain
Associated with
corroded grains
Microporosity in clays/opaques
Intragranular qtz
N11 2925.92 74 13 3 5 5 0N12 2931.10 81 0 0 12 5 2
300 point count for modal composition in percent
100 point count for porosity types in percent

73
APPENDIX E: MOUNT SIMON SANDSTONE PETROGRAPHY PHOTOMICROGRAPH ATLAS
Scanned images of the thin sections follow first, arranged by depth and sample ID. Thin sections image from the Eau Claire are not included. The Mount Simon Sandstone thin sections start at depth 2,925.92 ft (sample N11). The photomicrographs are arranged from shallower to deeper. The first line of each caption gives the depth, the thin section ID, and the type of image. The follow lines highlight aspects of the rock samples that are mentioned in the summary of rock properties (see Tables D1-D4). This appendix uses the following code for image type: XPL – cross-polarized light RL – reflected light BSE – backscattered electron microscopy EDS – energy dispersive X-ray microscopy elemental map The lack of a code indicates plane polarized transmitted light microscopy. The length of the horizontal field of view for the original samples, for all but BSE and EDS, is given by a number at the bottom of the caption.

74

75

76

77

78

79

80

81

82

83

84

85

86
87
APPENDIX F: DISTRIBUTION External (Electronic Copy) Raymond Anderson Iowa Department of Natural Resources Iowa Geological and Water Survey 109 Trowbridge Hall Iowa City IA 52242 [email protected] Imre Gyuk U.S. Department of Energy Office of Electricity Delivery and Energy Reliability OE-10/Forrestal Building 1000 Independence Ave., S.W. Washington, DC 20585 [email protected] Robert McKay Iowa Department of Natural Resources Iowa Geological and Water Survey 109 Trowbridge Hall Iowa City IA 52242 [email protected] Peter Mozley New Mexico Tech Earth and Environmental Science Department 801 Leroy Place Socorro, NM 87801 [email protected]
Nick Critelli Iowa Stored Energy Park 317 Sixth Avenue Suite 950 Des Moines, Iowa 50309-4128 [email protected] Internal (Electronic Copy) MS0706 Borns, David J. Org. 06912 MS0734 Martino, Anthony Org. 06124 MS0735 Lee, Moo Y. Org. 06914 MS0735 Merson, John A. Org. 06910

88
MS0747 Gardner, William P. Org. 06224 MS0750 Heath, Jason E. Org. 06914 MS0751 Dewers, Thomas Org. 06914 MS0836 Martinez, Mario J. Org. 01514 MS0885 Aselage, Terrence L. Org. 01810 MS1033 Bauer, Stephen J. Org. 06914 MS1033 Broome, Scott T. Org. 06914 MS1104 Hwang, Robert Q. Org. 06110 MS1140 Guttromson, Ross Org. 06113 MS1140 Huff, Georgianne Org. 06113 MS1411 Rodriguez, Mark A. Org. 01819 MS0899 Technical Library Org. 09536