Embed Size (px)
Citation preview
SANDSFeverOil
T H E E N V I R O N M E N TA L I M P L I C AT I O N S
OF CANADA’ S O I L SANDS RUSH
BY DAN WOYNILLOWICZCHRIS SEVERSON-BAKER • MARLO RAYNOLDS
November 2005
Oil Sands FeverThe Environmental Implications of Canada’s Oil Sands Rush
T H E P E M B I N A I N S T I T U T E O I L S A N D S F E V E R i
Dan Woynillowicz
Chris Severson-Baker • Marlo Raynolds
November 2005
ii O I L S A N D S F E V E R T H E P E M B I N A I N S T I T U T E
ii About The Pembina InstituteThe Pembina Institute createssustainable energy solutions throughresearch, education, advocacy andconsulting. It promotes environmental,social and economic sustainability in thepublic interest by developing practicalsolutions for communities, individuals,governments and businesses. ThePembina Institute provides policyresearch leadership and education onclimate change, energy issues, greeneconomics, energy efficiency andconservation, renewable energy andenvironmental governance. Moreinformation about the Pembina Instituteis available at www.pembina.org or bycontacting [email protected].
Oil Sands Fever: The environmentalimplications of Canada’s oil sands rush
1st Edition, published Nov. 2005Printed in Canada
Editor: Margaret ChandlerProduction Manager: David DodgeDesign and Layout:
J&W Communications
Illustrations: Chris Severson-Baker, Dan Woynillowicz, J&W Communications and as credited
Photography: David Dodge, Chris Evans, Melinda Mara and Dan Woynillowicz
Cover Photo: Syncrude extraction plantPhoto by Melinda Mara © 2005The Washington Post and Suncortruck photo by Suncor Energy Inc.
Back Cover: Both satellite photos usedwith permission of TerraServer.com
©2005 The Pembina InstituteISBN 0-921719-83-31st Edition v1.4-06-01-31
The Pembina InstituteBox 7558Drayton Valley, Alberta T7A 1S7
Phone: 780.542.6272E-mail: [email protected]
Additional copies of this publication may be downloaded from our websitewww.pembina.org.
Oil Sands Fever
T H E P E M B I N A I N S T I T U T E O I L S A N D S F E V E R iii
Oil Sands Fever
Dan WoynillowiczDan Woynillowiczis a Senior PolicyAnalyst with thePembina Institute.Dan joined thePembina Institutein 2001 as anenvironmentalpolicy analyst in the Energy Watch Program.
Since 2003, he has led the Institute’sengagement in the review of proposedoil sands projects and in the numerousmulti-stakeholder initiatives involved inregional environmental managementand monitoring in the Athabasca oilsands. Dan acts as a spokesperson forthe Institute and has presented experttestimony regarding the environmentalimpacts of oil sands development beforeboth provincial and federal regulatoryreview panels. He holds a BSc inEnvironmental Science (University of Calgary) and is pursuing an MA in Environment and Management(Royal Roads University).
Chris Severson-BakerChris Severson-Baker is Directorof the PembinaInstitute’s EnergyWatch program.Chris joined thePembina Institutein 1996. His focushas been onreducing the
health and environmental impacts ofconventional oil and gas and the oilsands. Chris is a Pembina Institutespokesperson and has represented theInstitute in numerous regulatory reviewsof large-scale energy developmentprojects and in several multi-stakeholderinitiatives focused on energy and the environment. Chris is on the boardof the Cumulative EnvironmentalManagement Association (CEMA) for the Athabasca Oil Sands region andis an Officer at Large on the CEMAManagement Committee. He holds aBSc in Environmental and ConservationSciences (University of Alberta).
Marlo RaynoldsDr. Marlo Raynolds is the ExecutiveDirector of the Pembina Institute.Marlo has worked with the PembinaInstitute since 1995 in the developmentand practical application of triple-bottom-line decision-making tools,energy systems and strategies forsustainability. Marlo has worked with a wide range of clients includingmany large Canadian energy companies.Marlo Raynolds holds a a BSc inSystems Design Engineering (Universityof Waterloo), a Masters in Managementand Leadership for the Voluntary Sector(University of McGill) and a PhD inMechanical Engineering (University of Alberta). He is also an AdjunctAssistant Professor of SustainableDevelopment at the Haskayne School of Business, University of Calgary.
iii About the Authors
PHOTOS: DAVID DODGE, THE PEMBINA INSTITUTE
iv O I L S A N D S F E V E R T H E P E M B I N A I N S T I T U T E
iv AcknowledgementsInformation about various companiesand projects is provided in this report.This use of specific examples does notsuggest that these companies, projectsor processes are unique in terms of theproblem arising or the solution beingemployed. The authors would like toacknowledge a number of organizationsand individuals who have assisted inthe production of this report:
• The Oak Foundation
• The Hewlett Foundation
• Staff of the Pembina Institute whohelped in the research, writing and review of this document
• Mark Anielski, Karin Buss, Peter Dickey and Rob Macintosh for their contribution of ideas and
perspectives during the planningstages of this report
• Karin Buss, Karen Campbell, Matt Price, Rick Schneider and Blair Whenham and others for theirinsightful feedback and comments
The contents of this report are entirelythe responsibility of the PembinaInstitute and do not necessarily reflectthe views of those acknowledged above. We have made every effort toensure the accuracy of the informationcontained in this report at the time ofwriting. However, the authors advisethat they cannot guarantee that theinformation provided is complete oraccurate, and any person relying onthis publication does so at his or herown risk.
Oil Sands Fever
T H E P E M B I N A I N S T I T U T E O I L S A N D S F E V E R v
Foreword . . . . . . . . . . . . . . . . . . . . . . . . . . . . . . . . . . . . . . . . . . .vii
1 Canada’s Oil Sands Rush . . . . . . . . . . . . . . . . . . . . . . . . . . . . . . . . . .1
1.1 Location and Scale . . . . . . . . . . . . . . . . . . . . . . . . . . . . . . . . . . . .1
1.2 A Brief History . . . . . . . . . . . . . . . . . . . . . . . . . . . . . . . . . . . . . . .2
1.3 Tar Sands Makeover . . . . . . . . . . . . . . . . . . . . . . . . . . . . . . . . . . .3
1.4 Global Attention . . . . . . . . . . . . . . . . . . . . . . . . . . . . . . . . . . . . . .4
1.5 New Goals and Speculation . . . . . . . . . . . . . . . . . . . . . . . . . . . . .5
1.5.1 Oil Sands Domination . . . . . . . . . . . . . . . . . . . . . . . . . . . .5
1.5.2 Rising Oil Prices . . . . . . . . . . . . . . . . . . . . . . . . . . . . . . . . .6
1.6 The Impacts of Irresponsible Demand . . . . . . . . . . . . . . . . . . . . .8
1.7 The Untold Story . . . . . . . . . . . . . . . . . . . . . . . . . . . . . . . . . . . . .9
2 From Tar to Tank . . . . . . . . . . . . . . . . . . . . . . . . . . . . . . . . . . . . . . .11
2.1 Making Oil from Tar . . . . . . . . . . . . . . . . . . . . . . . . . . . . . . . . .11
2.2 Fuel for the Oil Sands . . . . . . . . . . . . . . . . . . . . . . . . . . . . . . . . .15
2.3 Transportation to Refineries . . . . . . . . . . . . . . . . . . . . . . . . . . . .17
3 Climate Change Consequences . . . . . . . . . . . . . . . . . . . . . . . . . . . . .19
3.1 Escalating Greenhouse Gas Emissions . . . . . . . . . . . . . . . . . . . . .19
3.2 A Matter of Emissions Intensity . . . . . . . . . . . . . . . . . . . . . . . . .21
3.3 Canada’s Climate Contradiction . . . . . . . . . . . . . . . . . . . . . . . . .22
3.4 Taking Meaningful Action . . . . . . . . . . . . . . . . . . . . . . . . . . . . .25
4 Environmental Impacts . . . . . . . . . . . . . . . . . . . . . . . . . . . . . . . . . . .27
4.1 Cumulative Environmental Impacts . . . . . . . . . . . . . . . . . . . . . .27
4.2 Troubled Waters . . . . . . . . . . . . . . . . . . . . . . . . . . . . . . . . . . . . .28
4.2.1 The Athabasca River . . . . . . . . . . . . . . . . . . . . . . . . . . . . .29
4.2.2 A Tailings Legacy . . . . . . . . . . . . . . . . . . . . . . . . . . . . . . .30
4.2.3 Freshwater Aquifers . . . . . . . . . . . . . . . . . . . . . . . . . . . . .32
4.2.4 Waste from Water Treatment . . . . . . . . . . . . . . . . . . . . . . .33
4.2.5 Troubling Trends in Water Use . . . . . . . . . . . . . . . . . . . . .33
v Table of Contents
Oil Sands Fever
vi O I L S A N D S F E V E R T H E P E M B I N A I N S T I T U T E
vi Table of Contents4.3 Transformed Lands . . . . . . . . . . . . . . . . . . . . . . . . . . . . . . . . . . .36
4.3.1 The Boreal Forest . . . . . . . . . . . . . . . . . . . . . . . . . . . . . . .36
4.3.2 Surface Mining and Reclamation . . . . . . . . . . . . . . . . . . .37
4.3.3 Fragmented Forests . . . . . . . . . . . . . . . . . . . . . . . . . . . . . .40
4.3.4 A Growing “Footprint” . . . . . . . . . . . . . . . . . . . . . . . . . . .41
4.4 Polluted Air . . . . . . . . . . . . . . . . . . . . . . . . . . . . . . . . . . . . . . . . .44
4.4.1 A Pollution Capital . . . . . . . . . . . . . . . . . . . . . . . . . . . . .44
4.4.2 The Impacts of Increasing Air Pollution . . . . . . . . . . . . . . .47
4.4.3 Future Trends in Air Pollution . . . . . . . . . . . . . . . . . . . . .49
4.4.4 Acid Rain . . . . . . . . . . . . . . . . . . . . . . . . . . . . . . . . . . . . .51
4.5 Managing Cumulative Environmental Impacts . . . . . . . . . . . . . .53
4.5.1 Regulating and Managing the Oil Sands . . . . . . . . . . . . . .53
4.5.2 Creating a Plan . . . . . . . . . . . . . . . . . . . . . . . . . . . . . . . .53
4.5.3 Implementing the Plan . . . . . . . . . . . . . . . . . . . . . . . . . . .54
4.5.4 Slipping Timelines . . . . . . . . . . . . . . . . . . . . . . . . . . . . . .54
4.6 Protecting the Environment . . . . . . . . . . . . . . . . . . . . . . . . . . . .57
5 Governments’ Helping Hand . . . . . . . . . . . . . . . . . . . . . . . . . . . . . .59
5.1 Rent Collection . . . . . . . . . . . . . . . . . . . . . . . . . . . . . . . . . . . . . .60
5.1.1 Government as Steward . . . . . . . . . . . . . . . . . . . . . . . . . .60
5.1.2 Fair Compensation? . . . . . . . . . . . . . . . . . . . . . . . . . . . . .60
5.1.3 Alberta’s Favourable Royalty Regime . . . . . . . . . . . . . . . . . .61
5.1.4 Federal Tax Breaks . . . . . . . . . . . . . . . . . . . . . . . . . . . . . .62
5.2 A New Fiscal Regime . . . . . . . . . . . . . . . . . . . . . . . . . . . . . . . . .63
6 A Time for Stewardship and Leadership . . . . . . . . . . . . . . . . . . . . .65
6.1 Responsible Use . . . . . . . . . . . . . . . . . . . . . . . . . . . . . . . . . . . . .65
6.2 Protecting the Climate . . . . . . . . . . . . . . . . . . . . . . . . . . . . . . . .66
6.3 Protecting the Regional Environment . . . . . . . . . . . . . . . . . . . . .66
6.4 Establishing an Equitable Fiscal Regime . . . . . . . . . . . . . . . . . . .67
Oil Sands Fever
T H E P E M B I N A I N S T I T U T E O I L S A N D S F E V E R vii
Oil Sands Fever
Until recently the oil sands were a vast but largely inaccessible resource. In the last15 years this has changed dramatically. Afteradvancements in technology significantlyimproved the economics of oil sandsproduction, government and industryimplemented an ambitious strategy in 1995to increase production. Central to thisstrategy were commitments by both federaland provincial governments to significantlyreduce royalties and taxes to spur investment.
Ambitions of producing one million barrelsper day of oil from the oil sands by 2020have been greatly exceeded: this goal wassurpassed in 2004. This intense rate ofdevelopment is being driven by a steadilyrising market price for crude oil, growinguncertainty about the global supply of oiland rapidly growing demand from theUnited States and Asia. Canada’s so-called“black gold,” now regarded as an abundant,secure and affordable source of crude oil, is the focus of international attention. Withinternational attention, comes internationalresponsibility. A feverish rush of oil sandsinvestment and development, not unlike thegold rush that swept through North Americain the 19th century, is underway. This newwealth comes at a cost.
Managing the environmental impacts arisingfrom this pace and scale of development is aconsiderable challenge that must be urgentlyaddressed, particularly in light of the newgoal of producing five million barrels per day by 2030. As Alberta’s northern borealforest is torn up for oil sands development,the environmental impacts to air, land andwater in Alberta are increasing rapidly. Not surprisingly, Alberta is now Canada’spollution capital for industrial air pollutants.And the oil sands are the single largestcontributor to greenhouse gas emissionsgrowth in Canada.
A more positive future is possible.
Until now the story of Canada’s oil sands hasonly been partially told. Tales about the vasteconomic potential of development havebeen told and re-told by the oil industry,government, energy analysts and the media,but there has been a dearth of informationabout the environmental consequences. Oil Sands Fever: The environmentalimplications of Canada’s oil sands rush fills acritical gap by providing a comprehensiveoverview of the impacts and making recom-mendations regarding their management.
The natural resources of our country are oursto decide how best to manage. This reportshould compel Canadians to demand that the governments of Alberta and Canadaensure that sound environmental manage-ment and protection accompany theeconomic opportunities arising from oil sandsdevelopment. Furthermore, the intensity ofenergy requirements and environmentalimpacts of development are clear indicationsthat we need to fundamentally re-evaluatehow we produce and consume transportationfuels. Now is the time to focus our resourceson implementing energy systems that allow usto restore our environment and build healthyand resilient communities.
The rapid and unconstrained oil sandsexpansion now before us risks squandering a publicly owned resource and creating a legacy of environmental degradation and long-term environmental liabilities. To combat these challenges and further the positive legacy desired by the public,politicians and industry, we have putforward recommendations to improve theenvironmental management of the oil sandswhile calling for an accelerated transitiontowards sustainable energy in Canada.
Dr. Marlo Raynolds, Executive DirectorCalgary, November 2005
vii Foreword
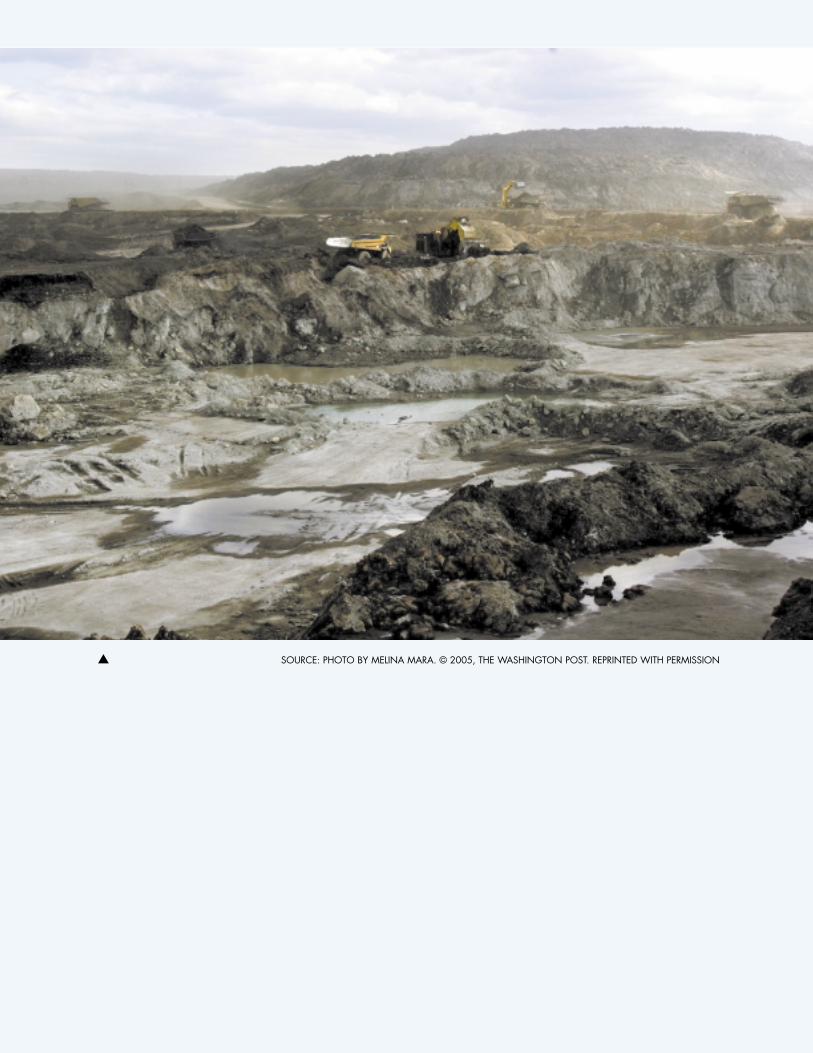
▲ SOURCE: PHOTO BY MELINA MARA. © 2005, THE WASHINGTON POST. REPRINTED WITH PERMISSION
1 Canada’s Oil Sands Rush
T H E P E M B I N A I N S T I T U T E O I L S A N D S F E V E R 1
1.1 Location and Scale
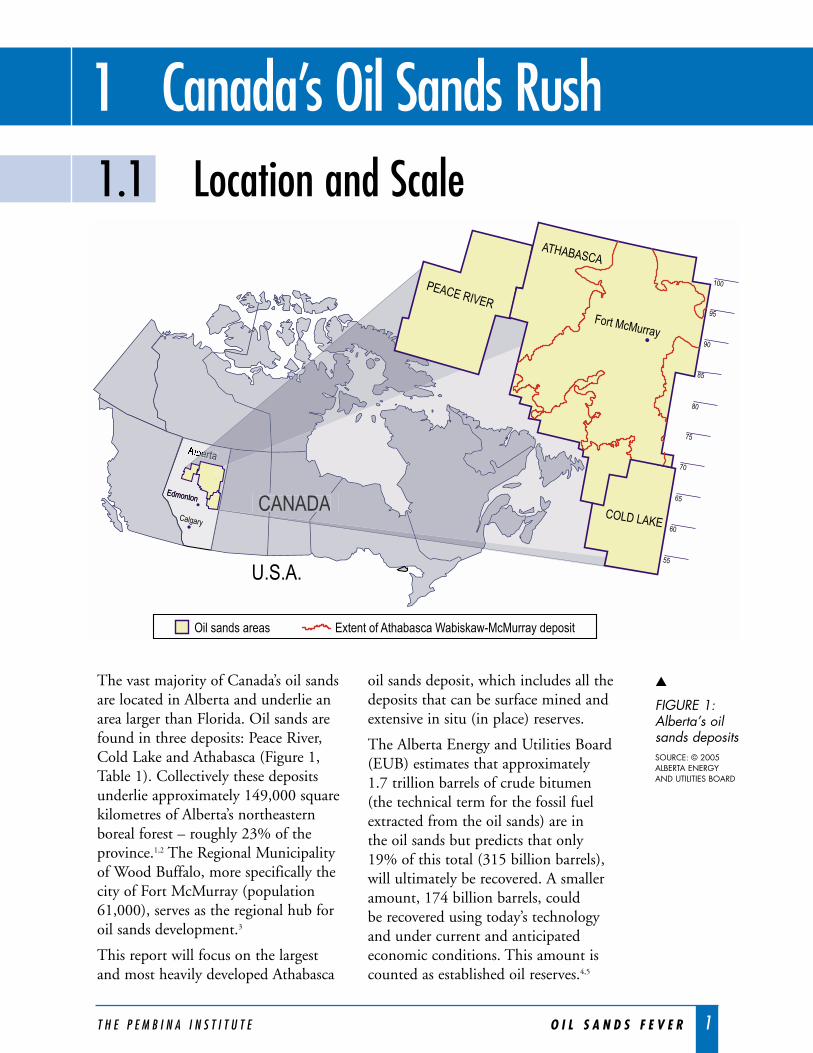
The vast majority of Canada’s oil sandsare located in Alberta and underlie anarea larger than Florida. Oil sands arefound in three deposits: Peace River,Cold Lake and Athabasca (Figure 1,Table 1). Collectively these depositsunderlie approximately 149,000 squarekilometres of Alberta’s northeasternboreal forest – roughly 23% of theprovince.1,2 The Regional Municipalityof Wood Buffalo, more specifically thecity of Fort McMurray (population61,000), serves as the regional hub foroil sands development.3
This report will focus on the largestand most heavily developed Athabasca
oil sands deposit, which includes all thedeposits that can be surface mined andextensive in situ (in place) reserves.
The Alberta Energy and Utilities Board(EUB) estimates that approximately 1.7 trillion barrels of crude bitumen(the technical term for the fossil fuelextracted from the oil sands) are in the oil sands but predicts that only19% of this total (315 billion barrels),will ultimately be recovered. A smalleramount, 174 billion barrels, could be recovered using today’s technologyand under current and anticipatedeconomic conditions. This amount iscounted as established oil reserves.4,5
Alberta
CANADA
berta
100
95
85
90
80
75
70
65
60
55
Fort McMurray
COLD LAKE
PEACE RIVER
ATHABASCA
Oil sands areas Extent of Athabasca Wabiskaw-McMurray deposit
U.S.A.
EdmontonEdmonton
Calgary
▲
FIGURE 1: Alberta’s oilsands depositsSOURCE: © 2005ALBERTA ENERGY AND UTILITIES BOARD
2 O I L S A N D S F E V E R T H E P E M B I N A I N S T I T U T E
In 1944, the Alberta governmentpartnered with a company called Oil Sands Limited to build a pilot oilsands extraction plant at Bitumount, a site north of Fort McMurray wheremuch early experimentation hadoccurred. When the costs for theconstruction of the plant doubled to$500,000 in 1948, Oil Sands Limitedpulled out, and the government ofAlberta took over sole control of theplant. After successfully demonstratingextraction of bitumen from the oilsands in 1949, the government thensold the Bitumount complex at a lossfor $180,000.8
Commercial development did notbegin until 1967 when the GreatCanadian Oil Sands Company (now Suncor) started the first open pit surface mines in the Athabascadeposit.9 In 1973, the Alberta
government invested in the oil sandsagain by forming the Alberta EnergyCompany (AEC), a 50/50 partnershipbetween the government of Alberta andits citizens. The AEC became a directequity investor in Syncrude’s originaloperations through an 80% ownershipof the pipeline carrying oil fromSyncrude to Edmonton, a 50%ownership in Syncrude’s power facilityand a 50% ownership in the Syncrudeplant.10 By 1978 Syncrude was alsoproducing oil from the oil sands.11
For several decades, Suncor andSyncrude faced numerous challengessuch as breakdowns, freeze ups, fires and high costs. But by 1986advancements in technology hadreduced the operating costs ofproducing synthetic crude oil fromCdn$35 to Cdn$13 per barrel.12
1 Canada’s Oil Sands Rush
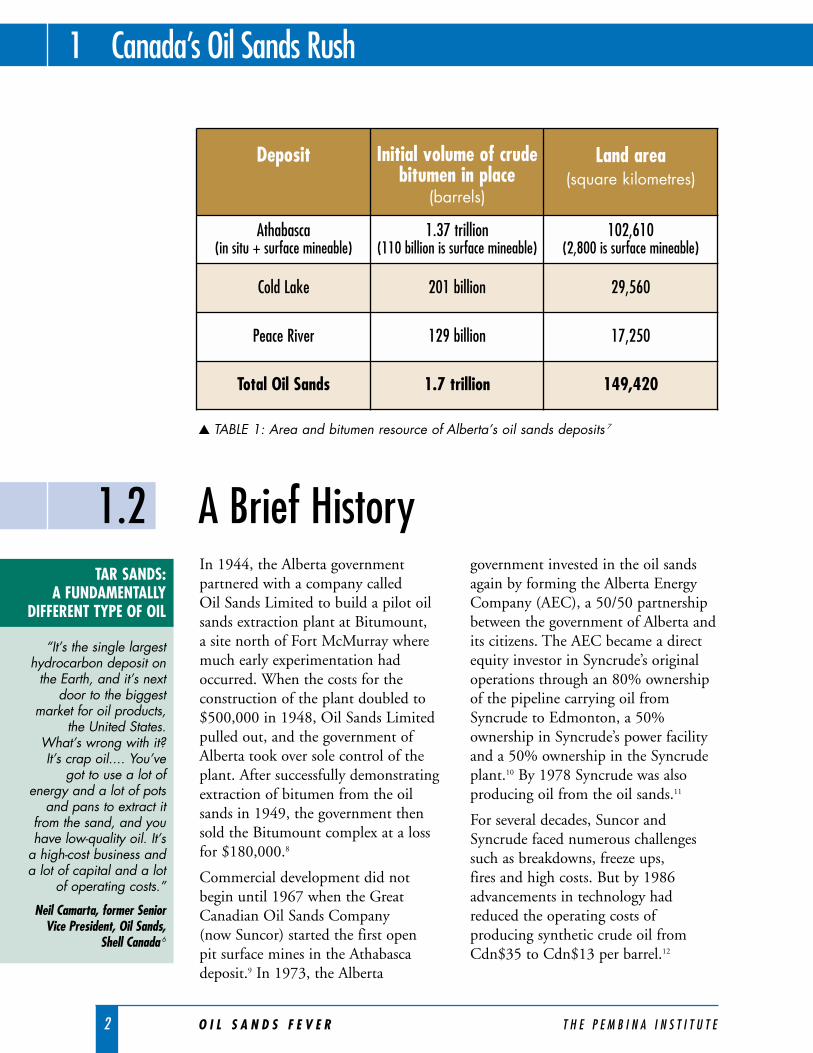
Deposit Initial volume of crudebitumen in place
(barrels)
Land area (square kilometres)
Athabasca(in situ + surface mineable)
1.37 trillion(110 billion is surface mineable)
102,610 (2,800 is surface mineable)
Cold Lake 201 billion 29,560
Peace River 129 billion 17,250
Total Oil Sands 1.7 trillion 149,420
▲ TABLE 1: Area and bitumen resource of Alberta’s oil sands deposits 7
1.2 A Brief HistoryTAR SANDS:
A FUNDAMENTALLYDIFFERENT TYPE OF OIL
“It’s the single largesthydrocarbon deposit on
the Earth, and it’s nextdoor to the biggest
market for oil products,the United States.
What’s wrong with it?It’s crap oil.... You’ve
got to use a lot ofenergy and a lot of pots
and pans to extract itfrom the sand, and youhave low-quality oil. It’s
a high-cost business anda lot of capital and a lot
of operating costs.”
Neil Camarta, former SeniorVice President, Oil Sands,
Shell Canada 6
T H E P E M B I N A I N S T I T U T E O I L S A N D S F E V E R 3
Canada’s Oil Sands Rush 1
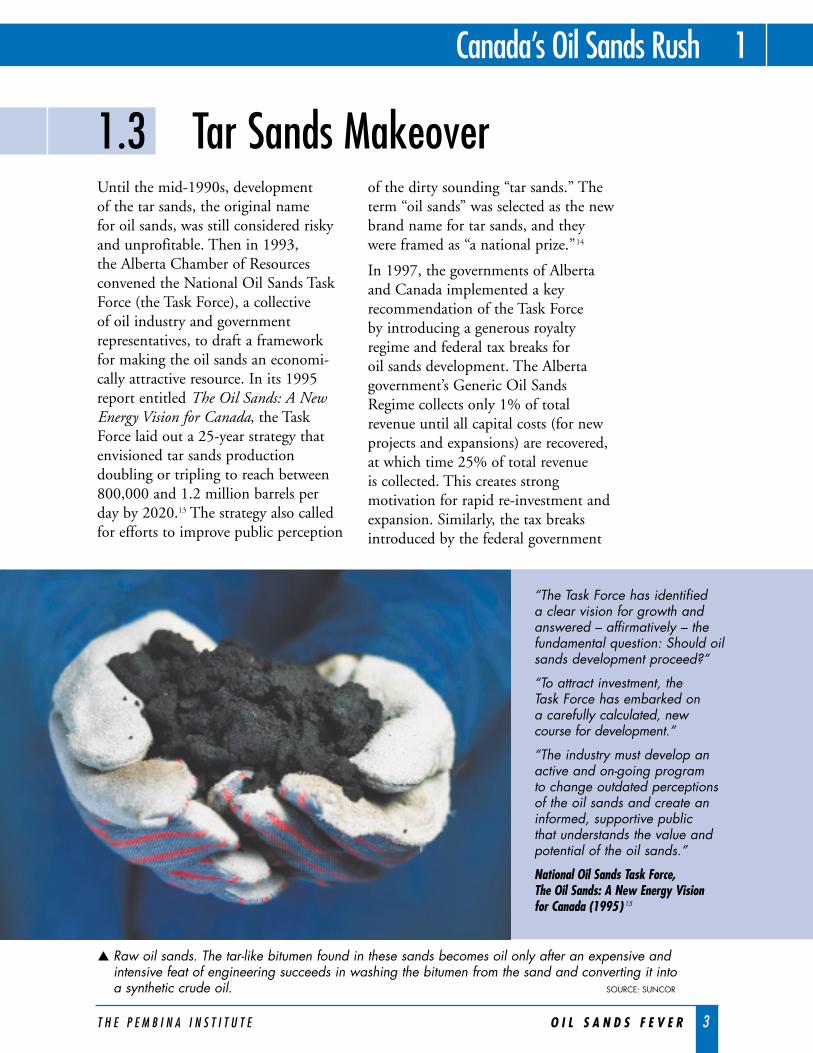
Until the mid-1990s, development of the tar sands, the original name for oil sands, was still considered riskyand unprofitable. Then in 1993, the Alberta Chamber of Resourcesconvened the National Oil Sands TaskForce (the Task Force), a collective of oil industry and governmentrepresentatives, to draft a frameworkfor making the oil sands an economi-cally attractive resource. In its 1995report entitled The Oil Sands: A NewEnergy Vision for Canada, the TaskForce laid out a 25-year strategy thatenvisioned tar sands productiondoubling or tripling to reach between800,000 and 1.2 million barrels perday by 2020.13 The strategy also calledfor efforts to improve public perception
of the dirty sounding “tar sands.” Theterm “oil sands” was selected as the newbrand name for tar sands, and theywere framed as “a national prize.”14
In 1997, the governments of Albertaand Canada implemented a keyrecommendation of the Task Force by introducing a generous royaltyregime and federal tax breaks for oil sands development. The Albertagovernment’s Generic Oil SandsRegime collects only 1% of totalrevenue until all capital costs (for newprojects and expansions) are recovered,at which time 25% of total revenue is collected. This creates strongmotivation for rapid re-investment andexpansion. Similarly, the tax breaksintroduced by the federal government
1.3 Tar Sands Makeover
“The Task Force has identified a clear vision for growth and answered – affirmatively – thefundamental question: Should oilsands development proceed?”
“To attract investment, the Task Force has embarked on a carefully calculated, new course for development.”
“The industry must develop anactive and on-going program to change outdated perceptions of the oil sands and create aninformed, supportive public that understands the value andpotential of the oil sands.”
National Oil Sands Task Force, The Oil Sands: A New Energy Vision for Canada (1995)15
▲ Raw oil sands. The tar-like bitumen found in these sands becomes oil only after an expensive andintensive feat of engineering succeeds in washing the bitumen from the sand and converting it intoa synthetic crude oil. SOURCE: SUNCOR
4 O I L S A N D S F E V E R T H E P E M B I N A I N S T I T U T E
have made the oil sands industry theenvy of Canada’s industrial sector.
Only five years after the release of theTask Force’s recommendations, thenecessary conditions for an oil sandsboom were in place. Further reductionsin operating costs and rising crude oilprices also heightened industry interest.Numerous expansion plans and newprojects were launched. A wave of
significant new expansion began to unfold. The scale of this newdevelopment greatly exceededexpectations. Fuelled by strong growthin demand for transportation fuels,particularly in the United States, and a favourable fiscal regime, oil sandsproduction more than doubled toapproximately 1.1 million barrels perday between 1995 and 2004 – 16 yearsahead of the anticipated timeline.16
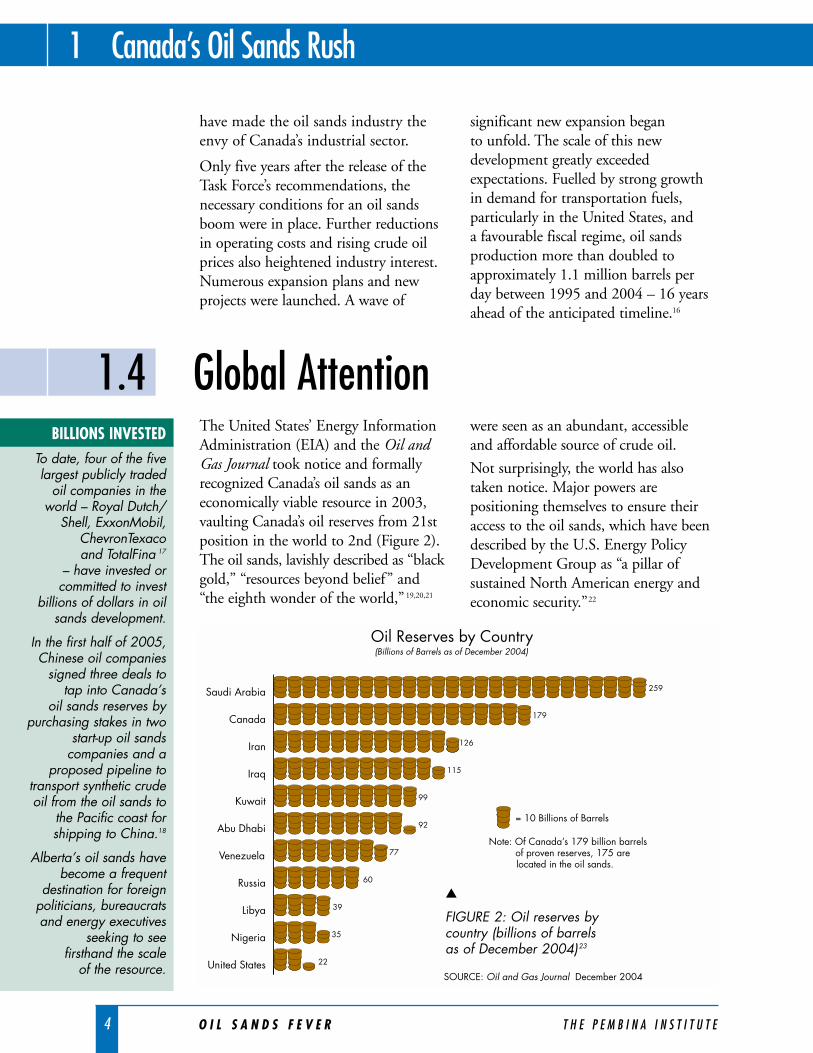
The United States’ Energy InformationAdministration (EIA) and the Oil andGas Journal took notice and formallyrecognized Canada’s oil sands as aneconomically viable resource in 2003,vaulting Canada’s oil reserves from 21stposition in the world to 2nd (Figure 2).The oil sands, lavishly described as “blackgold,” “resources beyond belief” and “the eighth wonder of the world,”19,20,21
were seen as an abundant, accessible and affordable source of crude oil.
Not surprisingly, the world has alsotaken notice. Major powers arepositioning themselves to ensure theiraccess to the oil sands, which have beendescribed by the U.S. Energy PolicyDevelopment Group as “a pillar ofsustained North American energy andeconomic security.”22
1 Canada’s Oil Sands Rush
1.4 Global Attention
Oil Reserves by Country(Billions of Barrels as of December 2004)
0 5050 100 150 200 250 300
United States
Nigeria
Libya
Russia
Venezuela
Abu Dhabi
Kuwait
Iraq
Iran
Canada
Saudi Arabia 259
179
126
115
99
92
77
60
39
35
22
SOURCE: Oil and Gas Journal December 2004
Note: Of Canada’s 179 billion barrelsof proven reserves, 175 arelocated in the oil sands.
= 10 Billions of Barrels
BILLIONS INVESTEDTo date, four of the fivelargest publicly traded
oil companies in theworld – Royal Dutch/
Shell, ExxonMobil,ChevronTexaco and TotalFina 17
– have invested orcommitted to invest
billions of dollars in oilsands development.
In the first half of 2005,Chinese oil companies
signed three deals totap into Canada’s
oil sands reserves bypurchasing stakes in two
start-up oil sandscompanies and a
proposed pipeline totransport synthetic crudeoil from the oil sands to
the Pacific coast forshipping to China.18
Alberta’s oil sands havebecome a frequent
destination for foreignpoliticians, bureaucratsand energy executives
seeking to see firsthand the scale
of the resource.
▲
FIGURE 2: Oil reserves bycountry (billions of barrelsas of December 2004)23
T H E P E M B I N A I N S T I T U T E O I L S A N D S F E V E R 5
Canada’s Oil Sands Rush 1
From 1999 through 2004, Suncor andSyncrude both expanded their surfacemining operations. Four new surfacemines and seven new in situ operationswere also approved in the Athabasca oilsands region.24 This wave of develop-ment is projected to increase productionto more than two million barrels per dayby 2010-2012.25
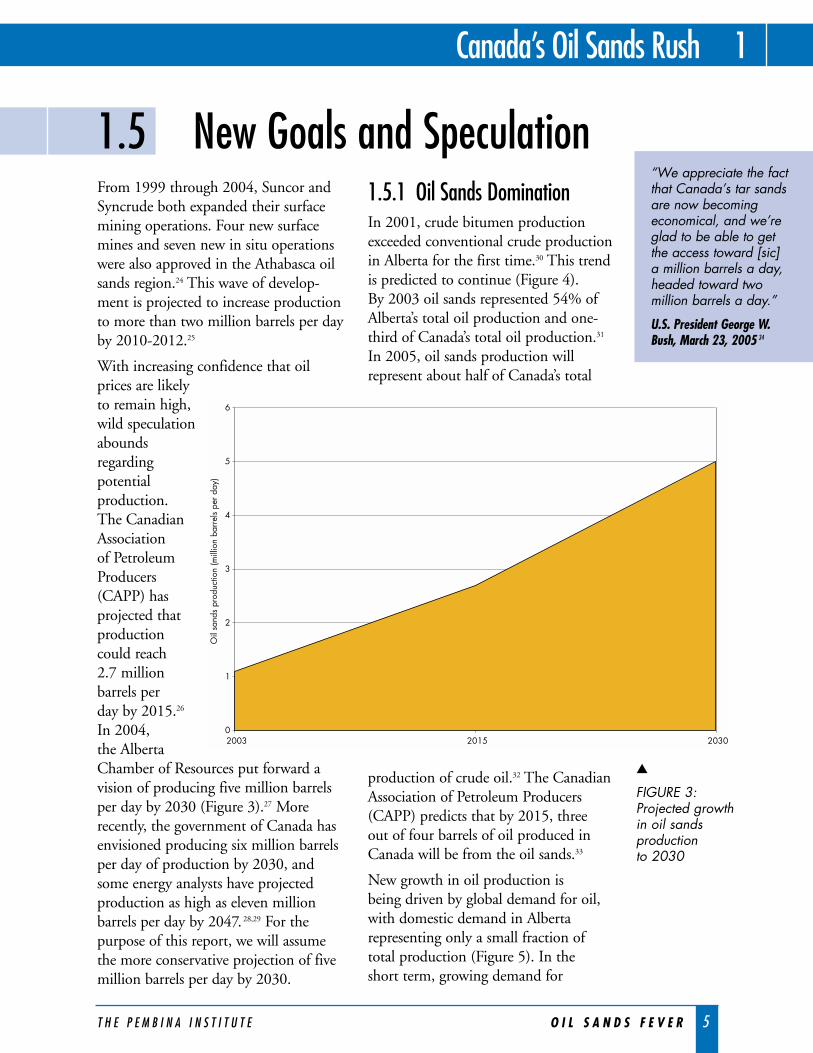
With increasing confidence that oilprices are likelyto remain high,wild speculationaboundsregardingpotentialproduction.The CanadianAssociation of PetroleumProducers(CAPP) hasprojected thatproductioncould reach 2.7 millionbarrels per day by 2015.26
In 2004, the AlbertaChamber of Resources put forward avision of producing five million barrelsper day by 2030 (Figure 3).27 Morerecently, the government of Canada hasenvisioned producing six million barrelsper day of production by 2030, andsome energy analysts have projectedproduction as high as eleven millionbarrels per day by 2047.28,29 For thepurpose of this report, we will assumethe more conservative projection of fivemillion barrels per day by 2030.
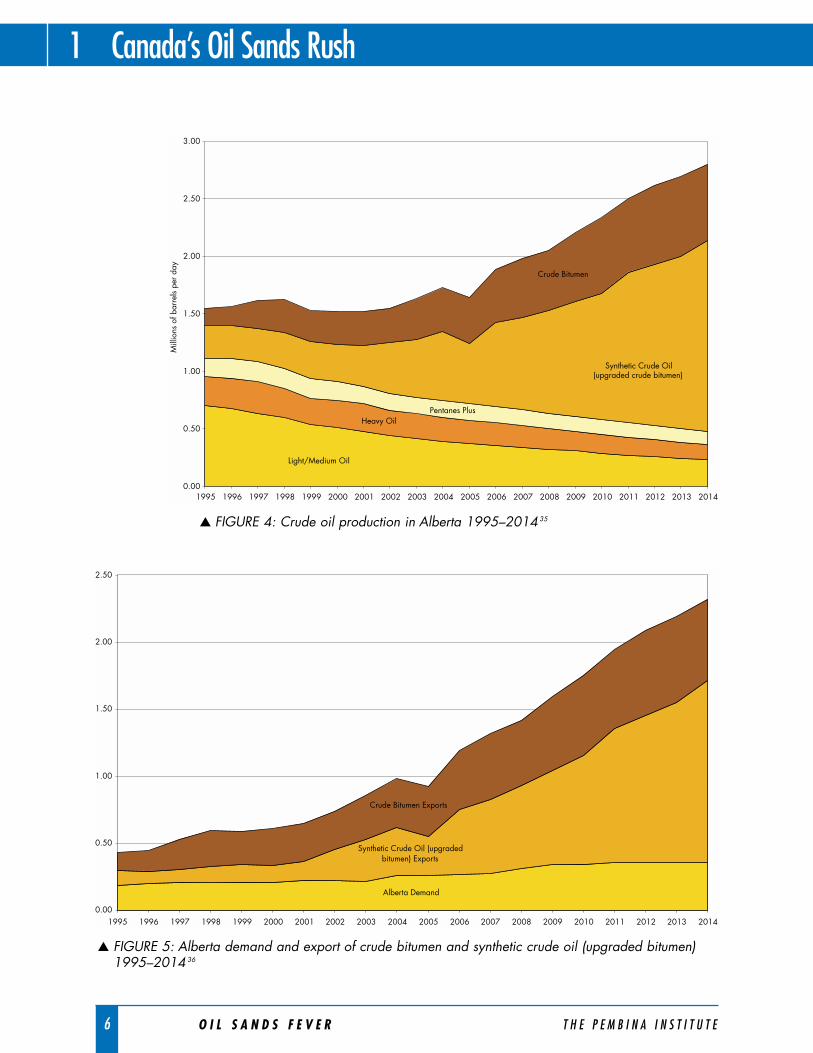
1.5.1 Oil Sands DominationIn 2001, crude bitumen productionexceeded conventional crude productionin Alberta for the first time.30 This trendis predicted to continue (Figure 4). By 2003 oil sands represented 54% ofAlberta’s total oil production and one-third of Canada’s total oil production.31
In 2005, oil sands production willrepresent about half of Canada’s total
production of crude oil.32 The CanadianAssociation of Petroleum Producers(CAPP) predicts that by 2015, three out of four barrels of oil produced inCanada will be from the oil sands.33
New growth in oil production is being driven by global demand for oil,with domestic demand in Albertarepresenting only a small fraction oftotal production (Figure 5). In the short term, growing demand for
1.5 New Goals and Speculation“We appreciate the factthat Canada’s tar sandsare now becomingeconomical, and we’reglad to be able to getthe access toward [sic]a million barrels a day,headed toward twomillion barrels a day.”
U.S. President George W.Bush, March 23, 2005 34
0
1
2
3
4
5
6
2003 2015 2030
)yad rep slerrab n oillim( noi tcudorp sdnas li
O
▲
FIGURE 3: Projected growthin oil sandsproduction to 2030
6 O I L S A N D S F E V E R T H E P E M B I N A I N S T I T U T E
1 Canada’s Oil Sands Rush
0.00
0.50
1.00
1.50
2.00
2.50
3.00
1995 1996 1997 1998 1999 2000 2001 2002 2003 2004 2005 2006 2007 2008 2009 2010 2011 2012 2013 2014
yad rep slerrab fo snoilliM
Light/Medium Oil
Heavy Oil
Crude Bitumen
Pentanes Plus
Synthetic Crude Oil (upgraded crude bitumen)
0.00
0.50
1.00
1.50
2.00
2.50
1995 1996 1997 1998 1999 2000 2001 2002 2003 2004 2005 2006 2007 2008 2009 2010 2011 2012 2013 2014
Alberta Demand
Synthetic Crude Oil (upgraded bitumen) Exports
Crude Bitumen Exports
▲ FIGURE 4: Crude oil production in Alberta 1995–2014 35
▲ FIGURE 5: Alberta demand and export of crude bitumen and synthetic crude oil (upgraded bitumen)1995–2014 36
T H E P E M B I N A I N S T I T U T E O I L S A N D S F E V E R 7
Canada’s Oil Sands Rush 1
synthetic crude oil is projected to comefrom existing markets in the AmericanMidwest and Rocky Mountain regionsbut may also expand to potentialmarkets on the U.S. East and Westcoasts and the Far East.37 The CanadianNational Energy Board predicts that by 2015 there will be a 90% increase to 2.8 million barrels per day ofCanadian crude oil exports to theUnited States, with about 70% coming from the oil sands.38
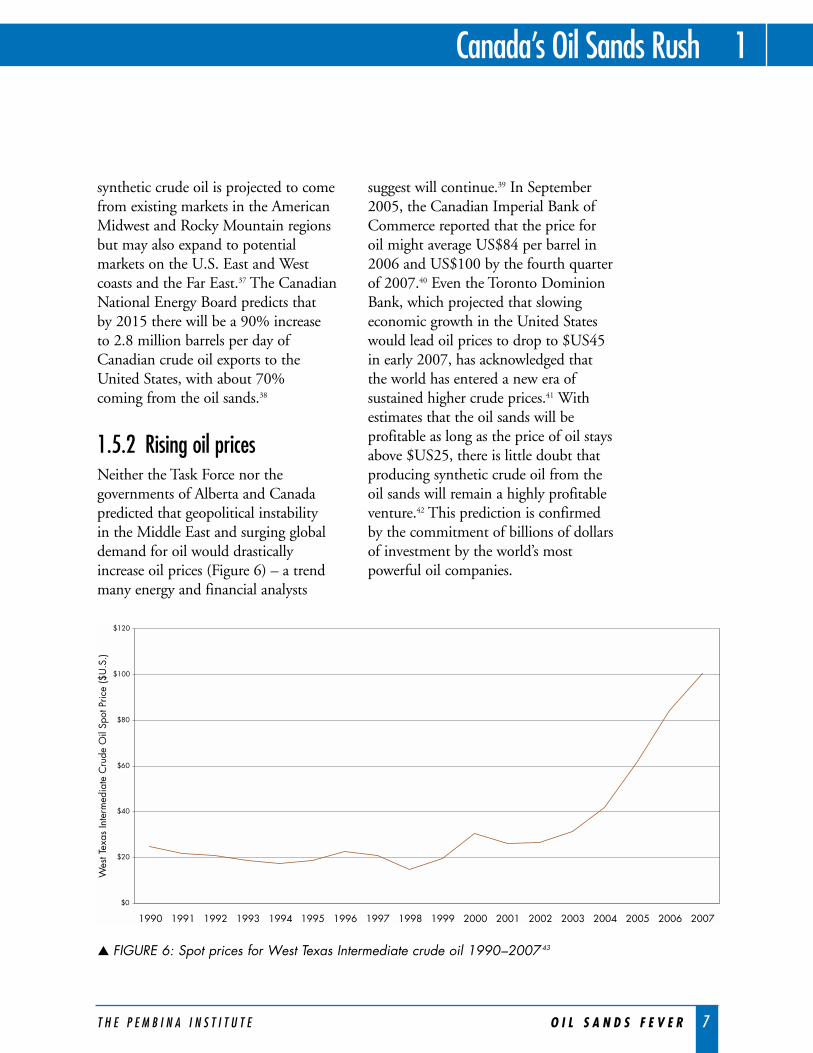
1.5.2 Rising oil pricesNeither the Task Force nor thegovernments of Alberta and Canadapredicted that geopolitical instability in the Middle East and surging globaldemand for oil would drasticallyincrease oil prices (Figure 6) – a trendmany energy and financial analysts
suggest will continue.39 In September2005, the Canadian Imperial Bank ofCommerce reported that the price foroil might average US$84 per barrel in2006 and US$100 by the fourth quarterof 2007.40 Even the Toronto DominionBank, which projected that slowingeconomic growth in the United Stateswould lead oil prices to drop to $US45in early 2007, has acknowledged thatthe world has entered a new era ofsustained higher crude prices.41 Withestimates that the oil sands will beprofitable as long as the price of oil staysabove $US25, there is little doubt thatproducing synthetic crude oil from theoil sands will remain a highly profitableventure.42 This prediction is confirmedby the commitment of billions of dollarsof investment by the world’s mostpowerful oil companies.
$0
$20
$40
$60
$80
$100
$120
1990 1991 1992 1993 1994 1995 1996 1997 1998 1999 2000 2001 2002 2003 2004 2005 2006 2007
W tseT
etnI sa xer
. S.U$( eci rP t opS li
O edurC etai de
m)
▲ FIGURE 6: Spot prices for West Texas Intermediate crude oil 1990–2007 43
8 O I L S A N D S F E V E R T H E P E M B I N A I N S T I T U T E
1.6 The Impacts of Irresponsible Demand
1 Canada’s Oil Sands Rush
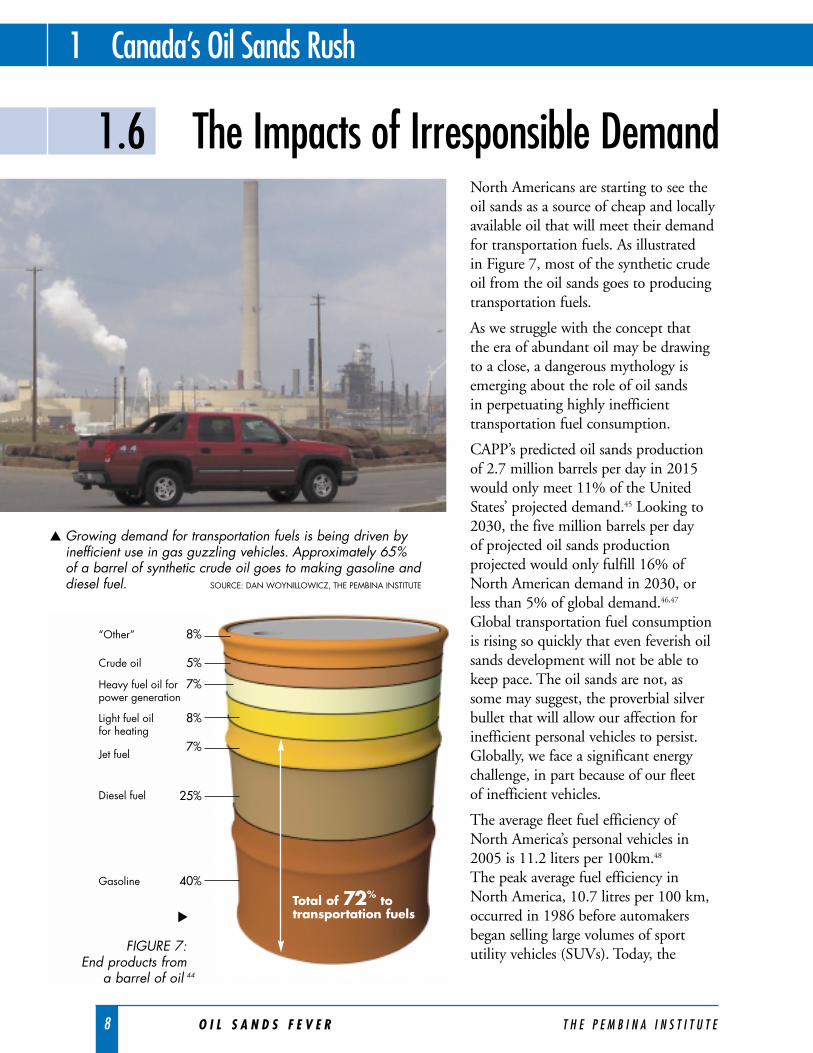
North Americans are starting to see theoil sands as a source of cheap and locallyavailable oil that will meet their demandfor transportation fuels. As illustrated in Figure 7, most of the synthetic crudeoil from the oil sands goes to producingtransportation fuels.
As we struggle with the concept that the era of abundant oil may be drawingto a close, a dangerous mythology isemerging about the role of oil sands in perpetuating highly inefficienttransportation fuel consumption.
CAPP’s predicted oil sands productionof 2.7 million barrels per day in 2015would only meet 11% of the UnitedStates’ projected demand.45 Looking to2030, the five million barrels per day of projected oil sands productionprojected would only fulfill 16% ofNorth American demand in 2030, orless than 5% of global demand.46,47
Global transportation fuel consumptionis rising so quickly that even feverish oilsands development will not be able tokeep pace. The oil sands are not, assome may suggest, the proverbial silverbullet that will allow our affection forinefficient personal vehicles to persist.Globally, we face a significant energychallenge, in part because of our fleet of inefficient vehicles.
The average fleet fuel efficiency ofNorth America’s personal vehicles in2005 is 11.2 liters per 100km.48
The peak average fuel efficiency inNorth America, 10.7 litres per 100 km,occurred in 1986 before automakersbegan selling large volumes of sportutility vehicles (SUVs). Today, the
▲ Growing demand for transportation fuels is being driven byinefficient use in gas guzzling vehicles. Approximately 65% of a barrel of synthetic crude oil goes to making gasoline anddiesel fuel. SOURCE: DAN WOYNILLOWICZ, THE PEMBINA INSTITUTE
FIGURE 7: End products from
a barrel of oil 44
▲
T H E P E M B I N A I N S T I T U T E O I L S A N D S F E V E R 9
Canada’s Oil Sands Rush 1
In 1995, the Task Force gave relativelylittle heed to the question of how tomitigate the environmental impacts of producing one million barrels per day from the oil sands. Perhaps theyassumed that they would have 25 yearsto address this question. They did not.
Production exceeded this target in lessthan a decade. With a new goal ofproducing five million barrels per day by2030, the question of how to managethe associated environmental impactsbecomes even more urgent.
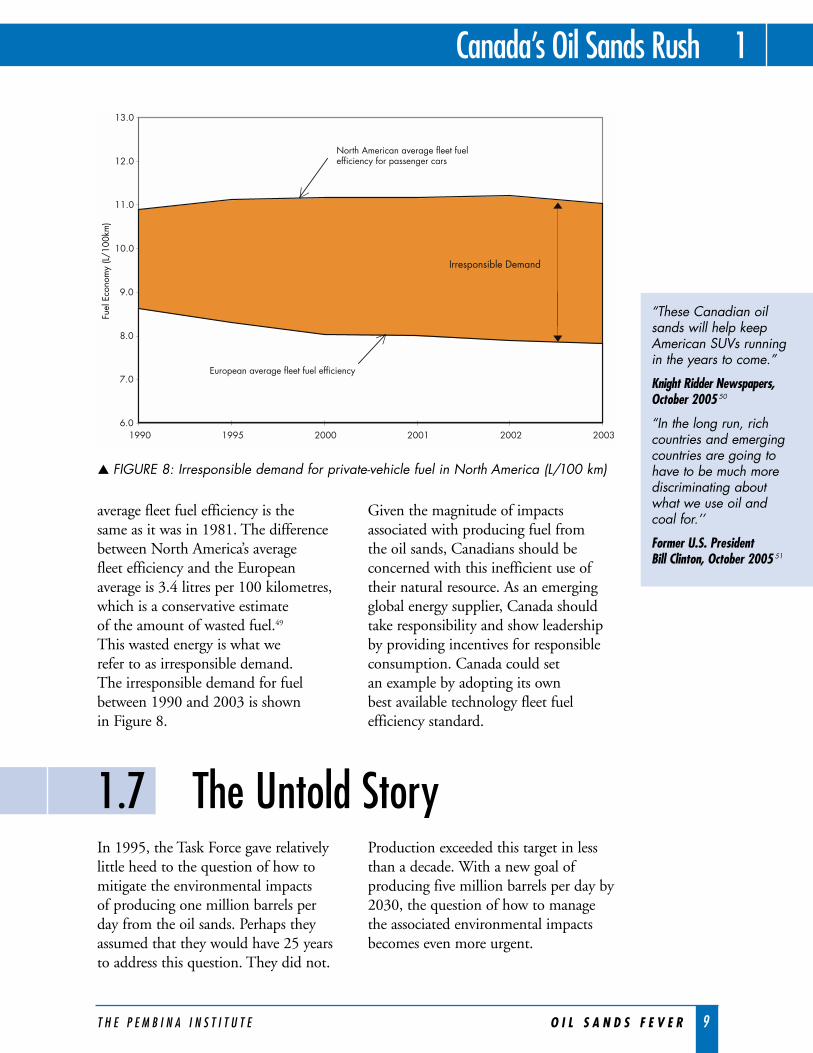
average fleet fuel efficiency is the same as it was in 1981. The differencebetween North America’s average fleet efficiency and the European average is 3.4 litres per 100 kilometres,which is a conservative estimate of the amount of wasted fuel.49
This wasted energy is what we refer to as irresponsible demand. The irresponsible demand for fuelbetween 1990 and 2003 is shown in Figure 8.
Given the magnitude of impactsassociated with producing fuel from the oil sands, Canadians should beconcerned with this inefficient use oftheir natural resource. As an emergingglobal energy supplier, Canada shouldtake responsibility and show leadershipby providing incentives for responsibleconsumption. Canada could set an example by adopting its own best available technology fleet fuelefficiency standard.
1.7 The Untold Story
▲ FIGURE 8: Irresponsible demand for private-vehicle fuel in North America (L/100 km)
6.0
7.0
8.0
9.0
10.0
11.0
12.0
13.0
1990 1995 2000 2001 2002 2003
Irresponsible Demand
North American average fleet fuel efficiency for passenger cars
European average fleet fuel efficiency
Fuel
Eco
nom
y (L
/100
km)
“These Canadian oilsands will help keepAmerican SUVs runningin the years to come.”
Knight Ridder Newspapers,October 2005 50
“In the long run, richcountries and emergingcountries are going tohave to be much morediscriminating aboutwhat we use oil andcoal for.’’
Former U.S. President Bill Clinton, October 2005 51
10 O I L S A N D S F E V E R T H E P E M B I N A I N S T I T U T E
Oil Sands Fever documents theenvironmental and climate changechallenges arising from the oil sandsdevelopment that occurred between1996 and 2004 and describes the evengreater consequences of the immensedevelopment now contemplated. Theregulatory agencies responsible forensuring development that is “fair,responsible, and in the public interest”are overwhelmed by the sheer pace ofdevelopment. These agencies must beempowered to effectively and proactivelymanage the growth. To do so thegovernment must shift its efforts and
priorities to ensuring that irreversibleenvironmental harm is preventedthrough proactive management.
In 1995, the Task Force deemed theprincipal risk for the oil sands to be“that the full economic and socialpotential of the resource will not berealized in public and private wealthcreation.”52 In our opinion, a decadelater it is clear that the greatest risk associated with the oil sands is the long-term environmental and climate implications arising from the current pace and approach toexploiting this resource.
1 Canada’s Oil Sands Rush
“Higher oil prices are merely one of along number of warning signs, natural,social and economic, all telling us thatour addiction to fossil fuels is ecologic-ally harmful, technologically backward,economically costly, and practicallyunnecessary.... The point is notwhether the price rises but, rather, how we perceive that fact. What we face is not a threat so much as an opportunity, if not an epochalchallenge. And when opportunityknocks it is time to open the door. Asthe oil system door closes we need toopen a different door, one that opensthe way to clean efficient energy.”
Vincent di Norcia, Editor, Corporate Ethics Monitor 53
“Notwithstanding our commercialinterests, Canadians stand to beharmed by a world that is polluted anddepleted of energy resources. Thus, wemust join policy makers everywhere topromote conservation and efficiencymeasures, as well as investment inalternative energy sources. Despite the fact that we in Canada have anabundance of oil, gas, uranium andhydroelectric power, our vast resourceswill not last forever.”
David Kilgour, MP Edmonton – Millwoods /Beaumont, June 15, 2005 54
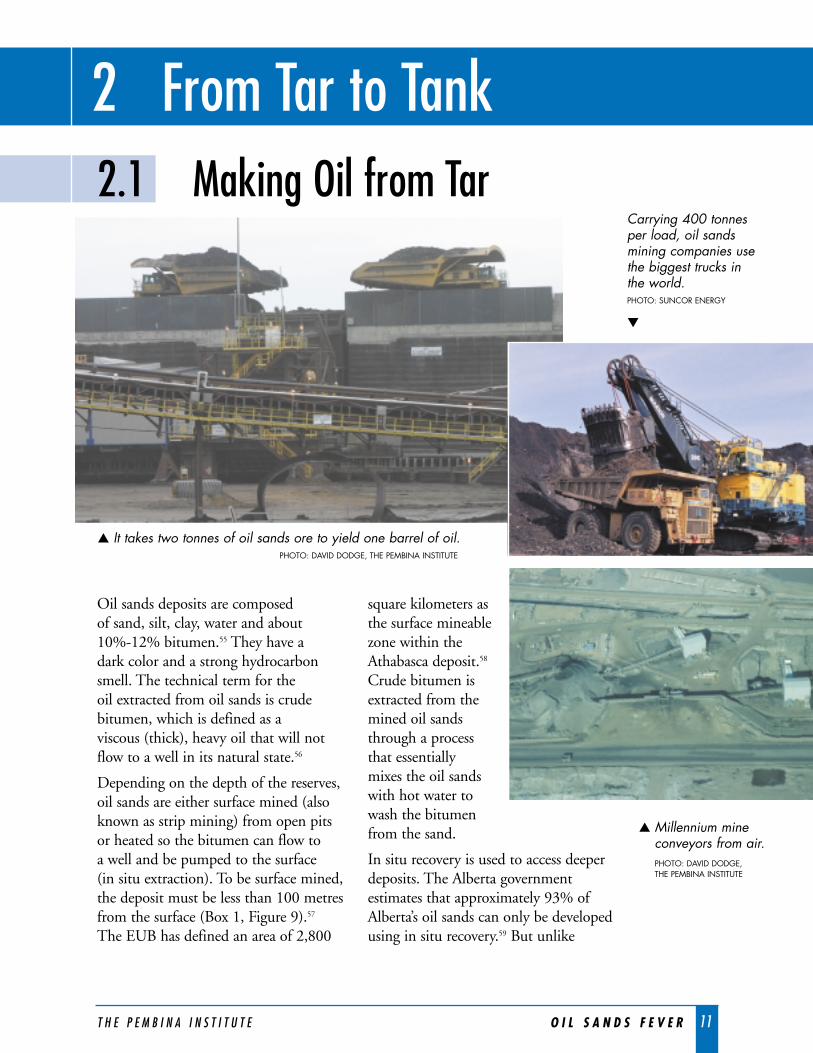
Oil sands deposits are composed of sand, silt, clay, water and about 10%-12% bitumen.55 They have a dark color and a strong hydrocarbonsmell. The technical term for the oil extracted from oil sands is crudebitumen, which is defined as a viscous (thick), heavy oil that will notflow to a well in its natural state.56
Depending on the depth of the reserves,oil sands are either surface mined (alsoknown as strip mining) from open pitsor heated so the bitumen can flow to a well and be pumped to the surface (in situ extraction). To be surface mined,the deposit must be less than 100 metresfrom the surface (Box 1, Figure 9).57
The EUB has defined an area of 2,800
square kilometers asthe surface mineablezone within theAthabasca deposit.58
Crude bitumen isextracted from themined oil sandsthrough a processthat essentiallymixes the oil sandswith hot water towash the bitumenfrom the sand.
In situ recovery is used to access deeperdeposits. The Alberta governmentestimates that approximately 93% ofAlberta’s oil sands can only be developedusing in situ recovery.59 But unlike
2 From Tar to Tank2.1 Making Oil from Tar
T H E P E M B I N A I N S T I T U T E O I L S A N D S F E V E R 11
▲ It takes two tonnes of oil sands ore to yield one barrel of oil. PHOTO: DAVID DODGE, THE PEMBINA INSTITUTE
▲ Millennium mineconveyors from air.PHOTO: DAVID DODGE, THE PEMBINA INSTITUTE
Carrying 400 tonnesper load, oil sandsmining companies usethe biggest trucks inthe world.PHOTO: SUNCOR ENERGY
▼
2 From Tar to Tank
conventional crude oil, the thick,viscous bitumen cannot be recoveredusing conventional well drillingtechniques. Special recovery methods,most commonly the injection of high-pressure steam, are needed to separatethe tar-like substance from the sand.Heating the bitumen reduces itsthickness so that it can flow to a welland be pumped to the surface. Thepredominant in situ technology is calledsteam assisted gravity drainage (SAGD)(Box 2, Figure 10).
▲
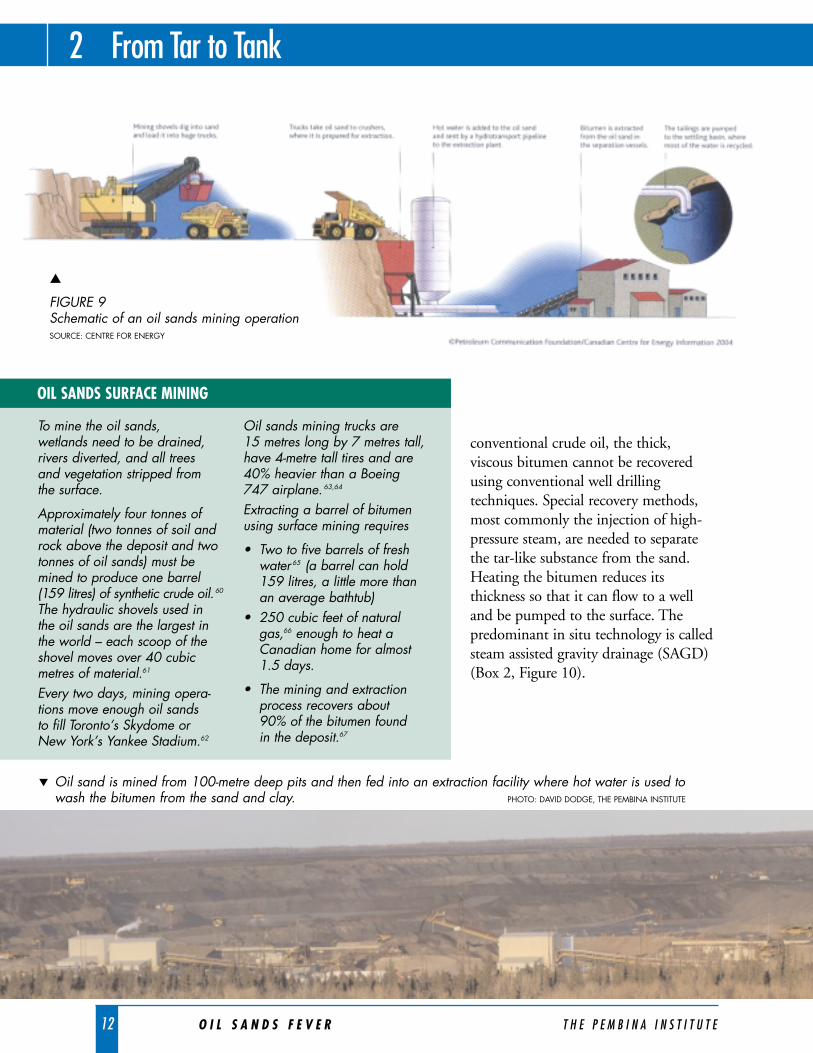
FIGURE 9Schematic of an oil sands mining operationSOURCE: CENTRE FOR ENERGY
OIL SANDS SURFACE MINING
To mine the oil sands, wetlands need to be drained,rivers diverted, and all trees and vegetation stripped from the surface.
Approximately four tonnes ofmaterial (two tonnes of soil androck above the deposit and twotonnes of oil sands) must bemined to produce one barrel(159 litres) of synthetic crude oil. 60
The hydraulic shovels used in the oil sands are the largest inthe world – each scoop of theshovel moves over 40 cubicmetres of material.61
Every two days, mining opera-tions move enough oil sands to fill Toronto’s Skydome or New York’s Yankee Stadium.62
Oil sands mining trucks are 15 metres long by 7 metres tall,have 4-metre tall tires and are40% heavier than a Boeing 747 airplane. 63,64
Extracting a barrel of bitumenusing surface mining requires
• Two to five barrels of freshwater 65 (a barrel can hold 159 litres, a little more thanan average bathtub)
• 250 cubic feet of naturalgas,66 enough to heat aCanadian home for almost1.5 days.
• The mining and extractionprocess recovers about 90% of the bitumen found in the deposit.67
▼ Oil sand is mined from 100-metre deep pits and then fed into an extraction facility where hot water is used towash the bitumen from the sand and clay. PHOTO: DAVID DODGE, THE PEMBINA INSTITUTE
12 O I L S A N D S F E V E R T H E P E M B I N A I N S T I T U T E
After being separated from the sand, the bitumen must be upgraded before it can be refined into gasoline, diesel, jet fuel and other hydrocarbon products(Box 3, Figure 11). The upgradingprocess converts the bitumen fromthick, molasses-like oil, through theaddition of hydrogen, into a lighter,higher quality synthetic crude oil thatcan be sent to refineries.
From Tar to Tank 2
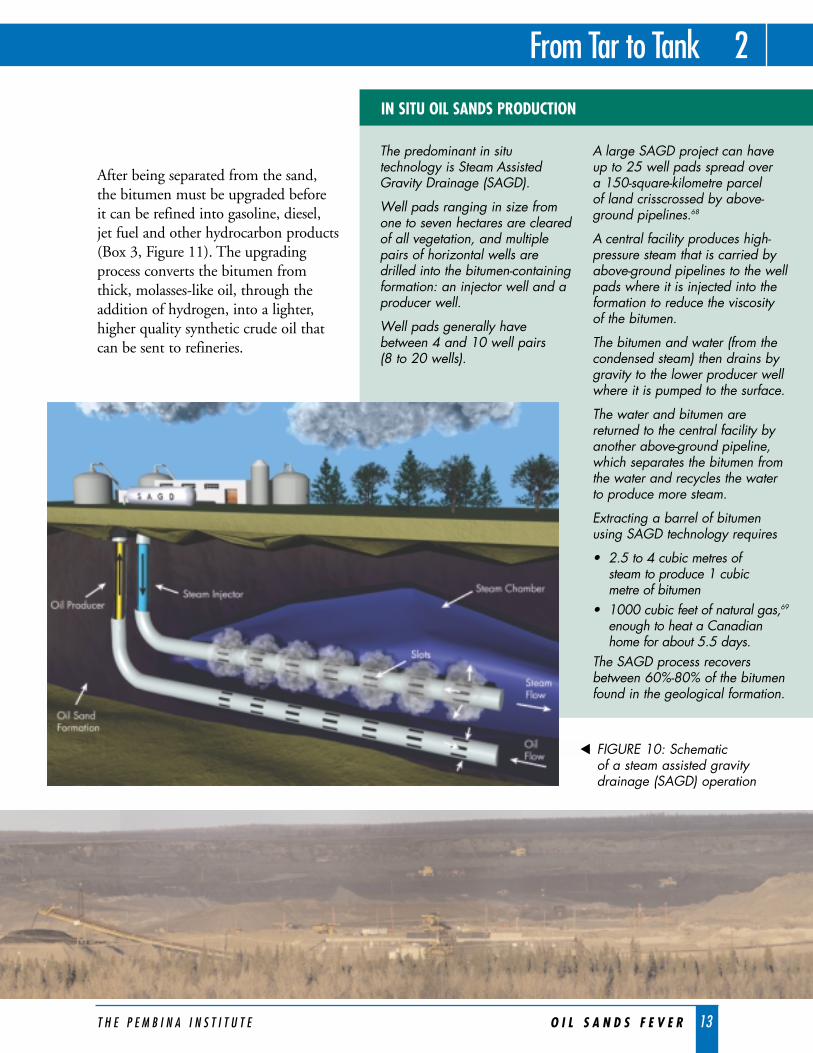
IN SITU OIL SANDS PRODUCTION
The predominant in situtechnology is Steam AssistedGravity Drainage (SAGD).
Well pads ranging in size fromone to seven hectares are clearedof all vegetation, and multiplepairs of horizontal wells aredrilled into the bitumen-containingformation: an injector well and aproducer well.
Well pads generally havebetween 4 and 10 well pairs (8 to 20 wells).
A large SAGD project can haveup to 25 well pads spread over a 150-square-kilometre parcel of land crisscrossed by above-ground pipelines.68
A central facility produces high-pressure steam that is carried byabove-ground pipelines to the wellpads where it is injected into theformation to reduce the viscosityof the bitumen.
The bitumen and water (from thecondensed steam) then drains bygravity to the lower producer wellwhere it is pumped to the surface.
The water and bitumen arereturned to the central facility byanother above-ground pipeline,which separates the bitumen fromthe water and recycles the waterto produce more steam.
Extracting a barrel of bitumenusing SAGD technology requires
• 2.5 to 4 cubic metres of steam to produce 1 cubic metre of bitumen
• 1000 cubic feet of natural gas,69
enough to heat a Canadianhome for about 5.5 days.
The SAGD process recoversbetween 60%-80% of the bitumenfound in the geological formation.
T H E P E M B I N A I N S T I T U T E O I L S A N D S F E V E R 13
FIGURE 10: Schematic of a steam assisted gravitydrainage (SAGD) operation
▼
14 O I L S A N D S F E V E R T H E P E M B I N A I N S T I T U T E
2 From Tar to Tank
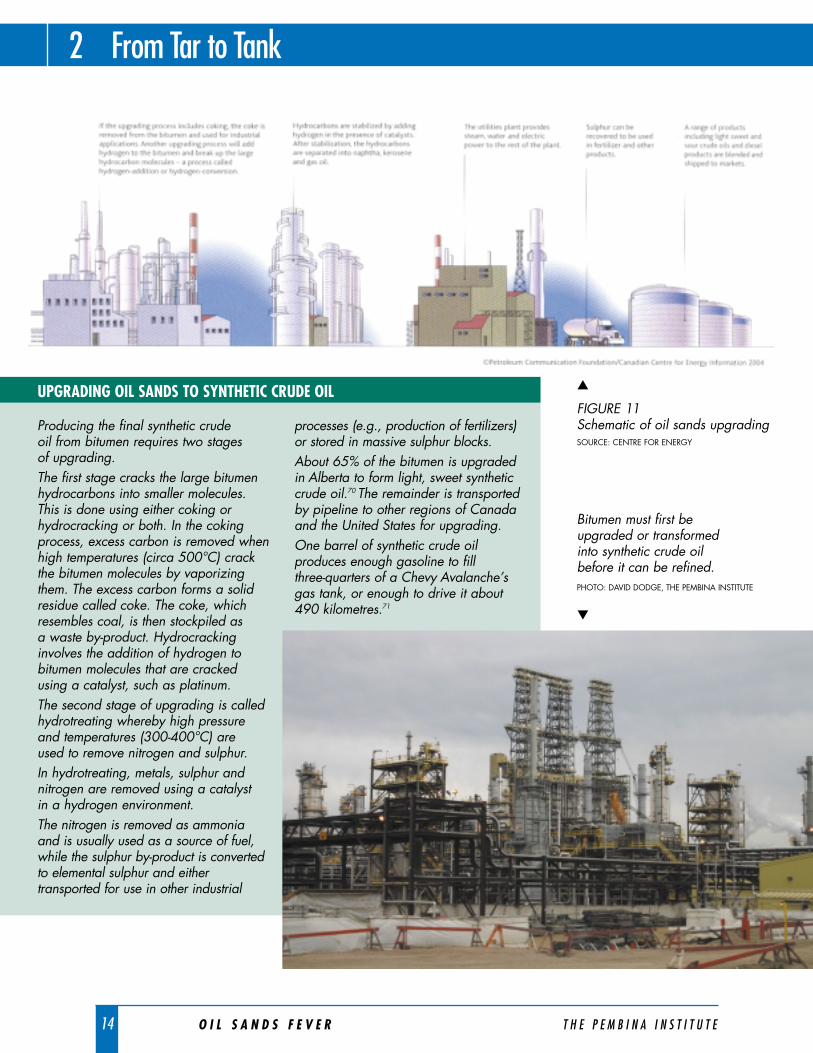
Producing the final synthetic crude oil from bitumen requires two stages of upgrading.The first stage cracks the large bitumenhydrocarbons into smaller molecules.This is done using either coking orhydrocracking or both. In the cokingprocess, excess carbon is removed whenhigh temperatures (circa 500°C) crackthe bitumen molecules by vaporizingthem. The excess carbon forms a solidresidue called coke. The coke, whichresembles coal, is then stockpiled as a waste by-product. Hydrocrackinginvolves the addition of hydrogen tobitumen molecules that are crackedusing a catalyst, such as platinum. The second stage of upgrading is calledhydrotreating whereby high pressureand temperatures (300-400°C) are used to remove nitrogen and sulphur. In hydrotreating, metals, sulphur andnitrogen are removed using a catalyst in a hydrogen environment.The nitrogen is removed as ammoniaand is usually used as a source of fuel,while the sulphur by-product is convertedto elemental sulphur and eithertransported for use in other industrial
processes (e.g., production of fertilizers)or stored in massive sulphur blocks. About 65% of the bitumen is upgradedin Alberta to form light, sweet syntheticcrude oil.70 The remainder is transportedby pipeline to other regions of Canadaand the United States for upgrading.One barrel of synthetic crude oilproduces enough gasoline to fill three-quarters of a Chevy Avalanche’sgas tank, or enough to drive it about490 kilometres.71
UPGRADING OIL SANDS TO SYNTHETIC CRUDE OIL ▲
FIGURE 11Schematic of oil sands upgradingSOURCE: CENTRE FOR ENERGY
Bitumen must first be upgraded or transformed into synthetic crude oil before it can be refined.PHOTO: DAVID DODGE, THE PEMBINA INSTITUTE
▼
T H E P E M B I N A I N S T I T U T E O I L S A N D S F E V E R 15
From Tar to Tank 2
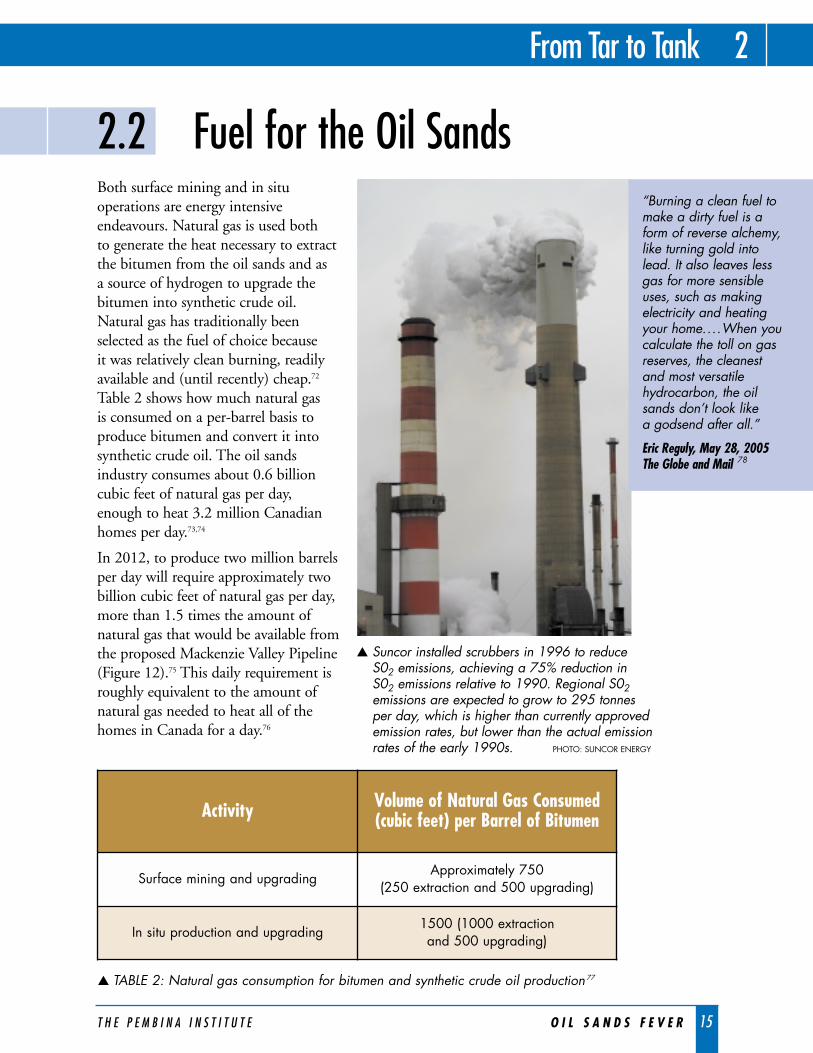
Both surface mining and in situoperations are energy intensiveendeavours. Natural gas is used both to generate the heat necessary to extractthe bitumen from the oil sands and as a source of hydrogen to upgrade thebitumen into synthetic crude oil.Natural gas has traditionally beenselected as the fuel of choice because it was relatively clean burning, readilyavailable and (until recently) cheap.72
Table 2 shows how much natural gas is consumed on a per-barrel basis toproduce bitumen and convert it intosynthetic crude oil. The oil sandsindustry consumes about 0.6 billioncubic feet of natural gas per day, enough to heat 3.2 million Canadianhomes per day.73,74
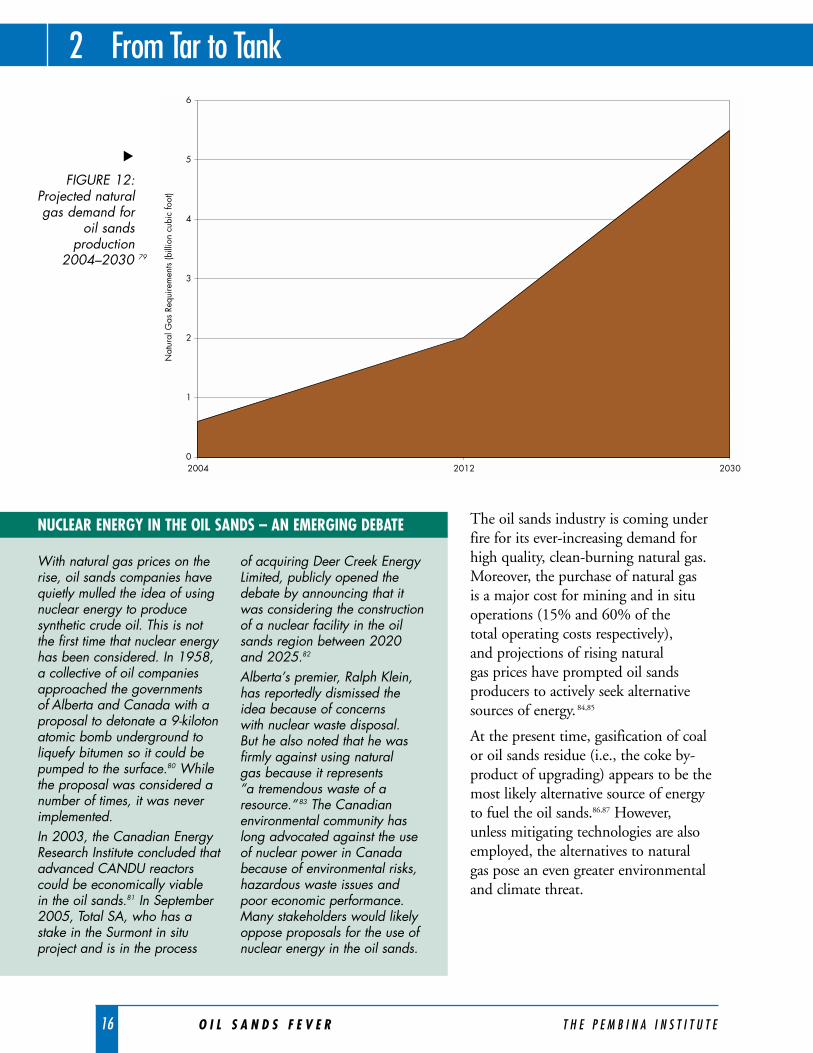
In 2012, to produce two million barrelsper day will require approximately twobillion cubic feet of natural gas per day,more than 1.5 times the amount ofnatural gas that would be available fromthe proposed Mackenzie Valley Pipeline(Figure 12).75 This daily requirement isroughly equivalent to the amount ofnatural gas needed to heat all of thehomes in Canada for a day.76
2.2 Fuel for the Oil Sands
Activity Volume of Natural Gas Consumed (cubic feet) per Barrel of Bitumen
Surface mining and upgradingApproximately 750
(250 extraction and 500 upgrading)
In situ production and upgrading1500 (1000 extraction and 500 upgrading)
▲ TABLE 2: Natural gas consumption for bitumen and synthetic crude oil production 77
▲ Suncor installed scrubbers in 1996 to reduce S02 emissions, achieving a 75% reduction in S02 emissions relative to 1990. Regional S02emissions are expected to grow to 295 tonnesper day, which is higher than currently approvedemission rates, but lower than the actual emissionrates of the early 1990s. PHOTO: SUNCOR ENERGY
“Burning a clean fuel tomake a dirty fuel is aform of reverse alchemy,like turning gold intolead. It also leaves lessgas for more sensibleuses, such as makingelectricity and heatingyour home....When youcalculate the toll on gasreserves, the cleanest and most versatilehydrocarbon, the oilsands don’t look like a godsend after all.”
Eric Reguly, May 28, 2005 The Globe and Mail 78
16 O I L S A N D S F E V E R T H E P E M B I N A I N S T I T U T E
The oil sands industry is coming underfire for its ever-increasing demand forhigh quality, clean-burning natural gas.Moreover, the purchase of natural gas is a major cost for mining and in situoperations (15% and 60% of the total operating costs respectively), and projections of rising natural gas prices have prompted oil sandsproducers to actively seek alternativesources of energy. 84,85
At the present time, gasification of coalor oil sands residue (i.e., the coke by-product of upgrading) appears to be themost likely alternative source of energyto fuel the oil sands.86,87 However, unless mitigating technologies are alsoemployed, the alternatives to natural gas pose an even greater environmentaland climate threat.
2 From Tar to Tank
0
1
2
3
4
5
6
2004 2012 2030
)toof cibuc noillib( stnem eri uqeR sa
G larutaN
NUCLEAR ENERGY IN THE OIL SANDS – AN EMERGING DEBATE
With natural gas prices on therise, oil sands companies havequietly mulled the idea of usingnuclear energy to producesynthetic crude oil. This is not the first time that nuclear energyhas been considered. In 1958,a collective of oil companiesapproached the governments of Alberta and Canada with aproposal to detonate a 9-kilotonatomic bomb underground toliquefy bitumen so it could bepumped to the surface.80 Whilethe proposal was considered anumber of times, it was neverimplemented.In 2003, the Canadian EnergyResearch Institute concluded thatadvanced CANDU reactorscould be economically viable in the oil sands.81 In September2005, Total SA, who has astake in the Surmont in situproject and is in the process
of acquiring Deer Creek EnergyLimited, publicly opened thedebate by announcing that itwas considering the constructionof a nuclear facility in the oilsands region between 2020and 2025.82
Alberta’s premier, Ralph Klein,has reportedly dismissed theidea because of concerns with nuclear waste disposal. But he also noted that he wasfirmly against using natural gas because it represents “a tremendous waste of aresource.” 83 The Canadianenvironmental community haslong advocated against the useof nuclear power in Canadabecause of environmental risks,hazardous waste issues andpoor economic performance.Many stakeholders would likelyoppose proposals for the use ofnuclear energy in the oil sands.
▲
FIGURE 12: Projected naturalgas demand for
oil sandsproduction
2004–2030 79
T H E P E M B I N A I N S T I T U T E O I L S A N D S F E V E R 17
From Tar to Tank 2
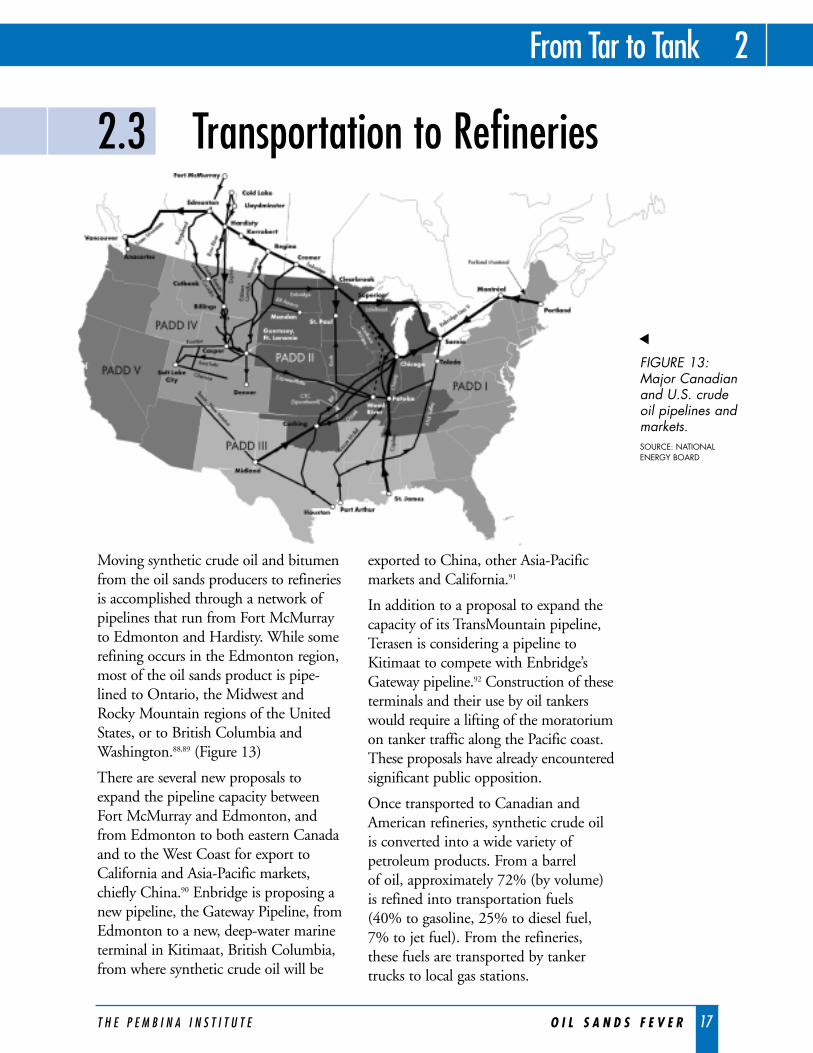
Moving synthetic crude oil and bitumenfrom the oil sands producers to refineriesis accomplished through a network ofpipelines that run from Fort McMurrayto Edmonton and Hardisty. While somerefining occurs in the Edmonton region,most of the oil sands product is pipe-lined to Ontario, the Midwest andRocky Mountain regions of the UnitedStates, or to British Columbia andWashington.88,89 (Figure 13)
There are several new proposals toexpand the pipeline capacity betweenFort McMurray and Edmonton, andfrom Edmonton to both eastern Canadaand to the West Coast for export toCalifornia and Asia-Pacific markets,chiefly China.90 Enbridge is proposing anew pipeline, the Gateway Pipeline, fromEdmonton to a new, deep-water marineterminal in Kitimaat, British Columbia,from where synthetic crude oil will be
exported to China, other Asia-Pacificmarkets and California.91
In addition to a proposal to expand thecapacity of its TransMountain pipeline,Terasen is considering a pipeline toKitimaat to compete with Enbridge’sGateway pipeline.92 Construction of theseterminals and their use by oil tankerswould require a lifting of the moratoriumon tanker traffic along the Pacific coast.These proposals have already encounteredsignificant public opposition.
Once transported to Canadian andAmerican refineries, synthetic crude oilis converted into a wide variety ofpetroleum products. From a barrel of oil, approximately 72% (by volume)is refined into transportation fuels (40% to gasoline, 25% to diesel fuel,7% to jet fuel). From the refineries,these fuels are transported by tankertrucks to local gas stations.
2.3 Transportation to Refineries
▲
FIGURE 13: Major Canadianand U.S. crudeoil pipelines andmarkets.SOURCE: NATIONALENERGY BOARD
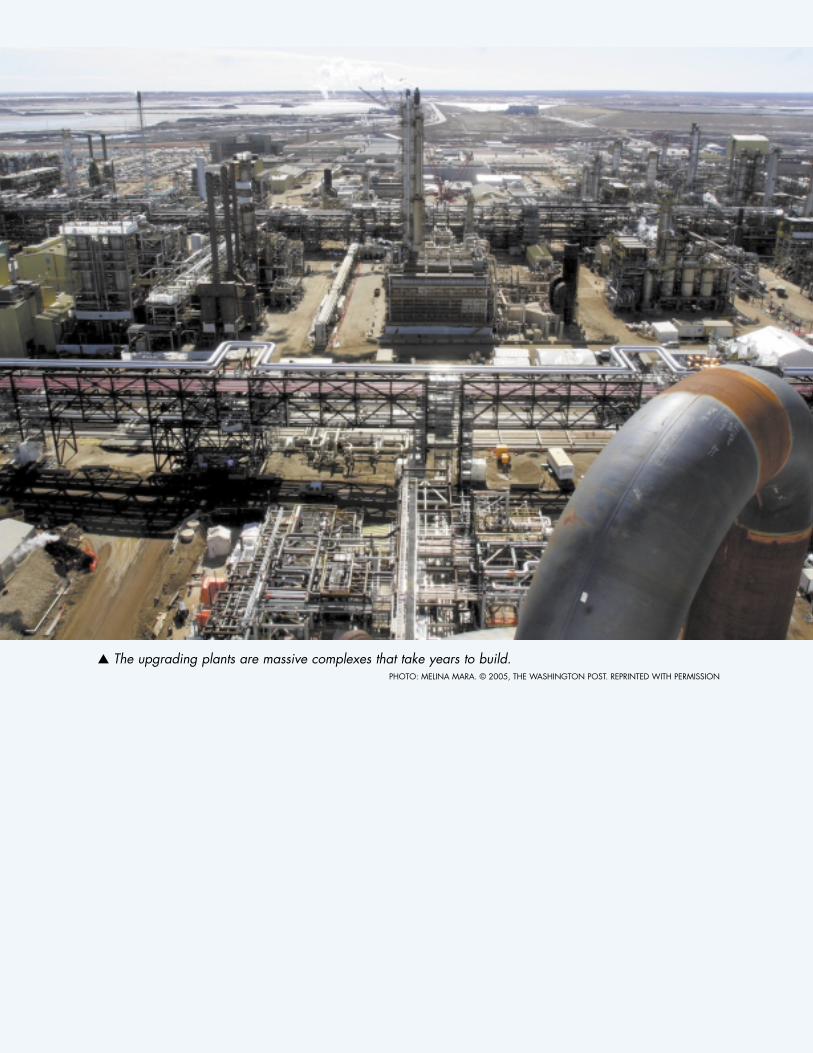
▲ The upgrading plants are massive complexes that take years to build. PHOTO: MELINA MARA. © 2005, THE WASHINGTON POST. REPRINTED WITH PERMISSION
3 Climate Change Consequences3.1 Escalating Greenhouse Gas Emissions
The science of climate change leaveslittle doubt that deep reductions inglobal greenhouse gas emissions (GHG)must be achieved if we are to preventdrastic worldwide impacts from climatechange. These reductions will need to go far beyond the requirements of theKyoto Protocol: industrialized countriessuch as Canada need to reduce theirGHG emissions to 80%-90% below the 1990 level by 2050.93
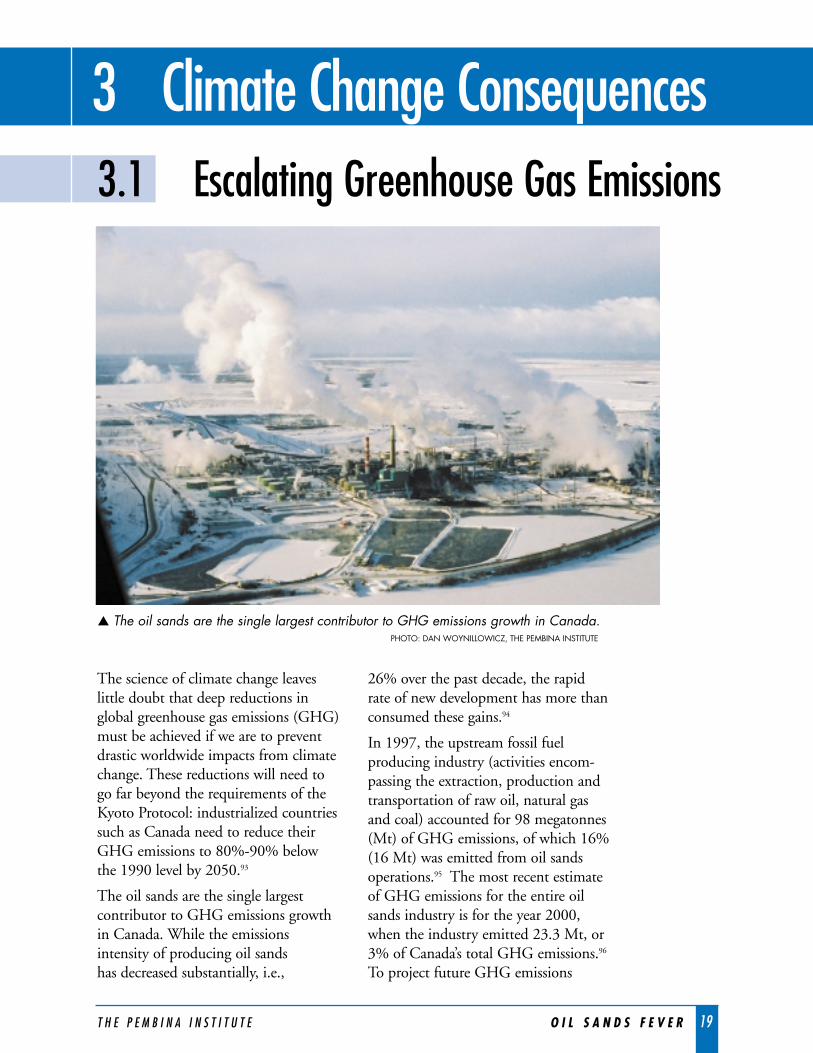
The oil sands are the single largestcontributor to GHG emissions growthin Canada. While the emissionsintensity of producing oil sands has decreased substantially, i.e.,
26% over the past decade, the rapid rate of new development has more thanconsumed these gains.94
In 1997, the upstream fossil fuelproducing industry (activities encom-passing the extraction, production andtransportation of raw oil, natural gasand coal) accounted for 98 megatonnes(Mt) of GHG emissions, of which 16%(16 Mt) was emitted from oil sandsoperations.95 The most recent estimateof GHG emissions for the entire oilsands industry is for the year 2000,when the industry emitted 23.3 Mt, or3% of Canada’s total GHG emissions.96
To project future GHG emissions
T H E P E M B I N A I N S T I T U T E O I L S A N D S F E V E R 19
▲ The oil sands are the single largest contributor to GHG emissions growth in Canada.PHOTO: DAN WOYNILLOWICZ, THE PEMBINA INSTITUTE
20 O I L S A N D S F E V E R T H E P E M B I N A I N S T I T U T E
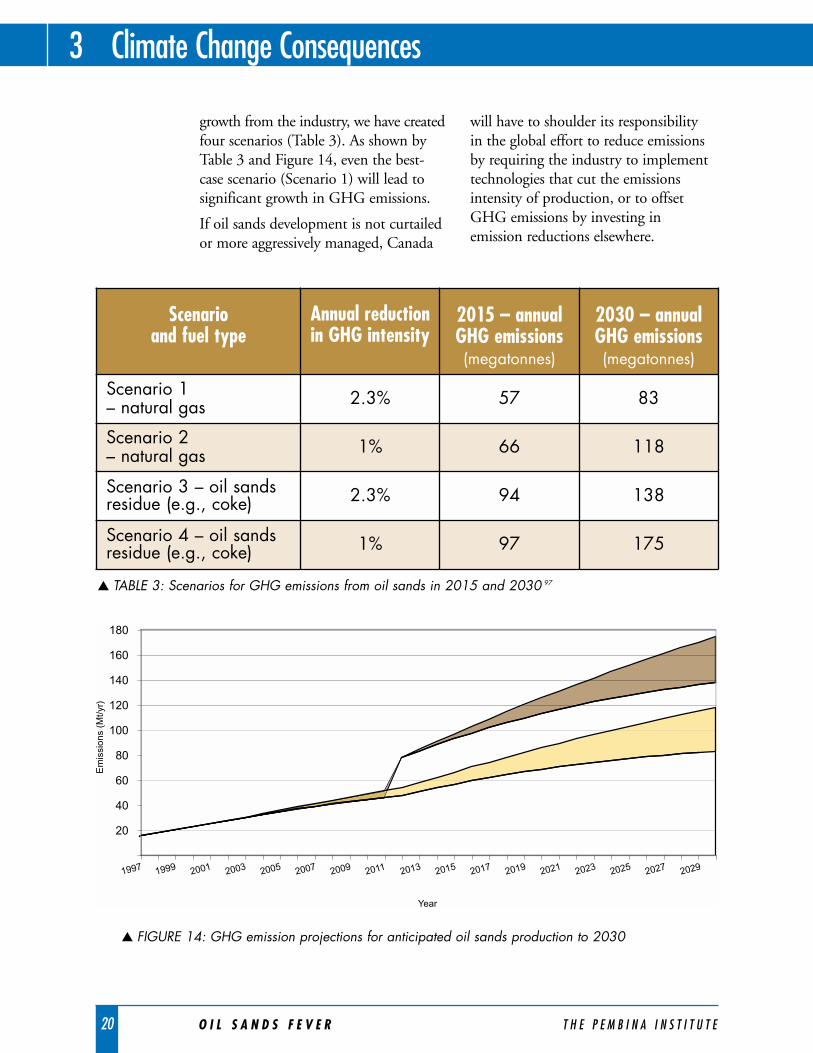
growth from the industry, we have createdfour scenarios (Table 3). As shown byTable 3 and Figure 14, even the best-case scenario (Scenario 1) will lead tosignificant growth in GHG emissions.
If oil sands development is not curtailedor more aggressively managed, Canada
will have to shoulder its responsibility in the global effort to reduce emissionsby requiring the industry to implementtechnologies that cut the emissionsintensity of production, or to offsetGHG emissions by investing inemission reductions elsewhere.
3 Climate Change Consequences
Scenario and fuel type
Annual reduction in GHG intensity
2015 – annual GHG emissions (megatonnes)
2030 – annual GHG emissions (megatonnes)
Scenario 1 – natural gas 2.3% 57 83
Scenario 2 – natural gas 1% 66 118
Scenario 3 – oil sandsresidue (e.g., coke) 2.3% 94 138
Scenario 4 – oil sandsresidue (e.g., coke) 1% 97 175
▲ TABLE 3: Scenarios for GHG emissions from oil sands in 2015 and 2030 97
20
40
60
80
100
120
140
160
180
Year
Em
issi
ons
(Mt/y
r)
1997 1999 2001 2003 2005 2007 2009 2011 2013 2015 2017 2019 2021 2023 2025 2027 2029
▲ FIGURE 14: GHG emission projections for anticipated oil sands production to 2030
T H E P E M B I N A I N S T I T U T E O I L S A N D S F E V E R 21
Climate Change Consequences 3
Canada is one of the most energy-intensive countries in the industrializedworld. Our energy intensity has declinedover the past two decades, but it stillremains high because of our energy-intensive industries. Much of Canada’senergy production and consumption is fossil fuel based; therefore, theeconomy’s GHG intensity – commonlyreferred to as carbon intensity – issimilarly high. Canada’s emissions ofGHGs relative to GDP are 25% higherthan for the industrialized world as awhole.104 According to EnvironmentCanada, this high carbon intensity
relative to other OECD countries is theresult of increased consumption of fossilfuel for electricity generation, increasedenergy consumption in the transport-ation sector and growth in fossil fuelproduction for export.105
While Canada’s obligation to reduceGHG emissions requires efforts toreduce the carbon intensity of oureconomy, significant growth in oil sandsdevelopment will produce the exactopposite. Production of synthetic crudeoil from the oil sands is a more GHGintensive endeavor than producingconventional light or medium crude oil.
3.2 A Matter of Emissions Intensity
T H E P E M B I N A I N S T I T U T E O I L S A N D S F E V E R 21
OIL SANDS AND CANADA’S EVER-INCREASING “KYOTO GAP”
The federal government regularlyproduces projections of Canada’s futureGHG emissions under a so-calledbusiness-as-usual scenario in whichgovernments implement no policies ormeasures to reduce emissions. Thedifference between projected business-as-usual emissions in 2010 (the middleyear of the five-year period to which theKyoto target applies) and the Kyototarget is commonly referred to as theKyoto gap. The Kyoto gap measures theamount by which annual emissions mustbe reduced below the business-as-usuallevel to reach the Kyoto target. Thefederal government has repeatedlyincreased its estimate of Canada’sKyoto gap, to a significant degreebecause of increased projections of oilsands production:
The emissions projection produced bythe federal government in April 1997showed a Kyoto gap of 138 Mt.98
In October 1998, the Kyoto gap wasupdated to 185 Mt, with 45% (21Mt) of the increase attributed to newprojections for oil sands production.99
In December 1999, a further updateresulted in a Kyoto gap of 199 Mt.100
In February 2002, the Kyoto gap wasfurther revised to 238 Mt, with 18 Mt of the new increase attributed to anadditional rise in projected oil sandsproduction.101
In April 2005, the government statedthat the Kyoto gap is “likely in the areaof 270 Mt.”102 It is widely understoodthat yet more increases in future oilsands production were, once again, a key factor in this latest increase to the gap.103
It should be noted that the details ofwhy the business-as-usual scenariosneeded revision in February 2002 andApril 2005 have never been published.
”Living up to Canada’scommitment to Kyotoand at the same timeensuring continuedgrowth together withtransition to a lessemission-intensiveeconomy is the biggestsingle economic andpolitical challenge forCanadian energy policyin the coming years.Curbing GHG emissions is all the more challenging asCanada’s emissions are growing along with its production andexports of energy whichconsume large quantitiesof fossil fuels.”
International Energy Agency,January 2005106
22 O I L S A N D S F E V E R T H E P E M B I N A I N S T I T U T E
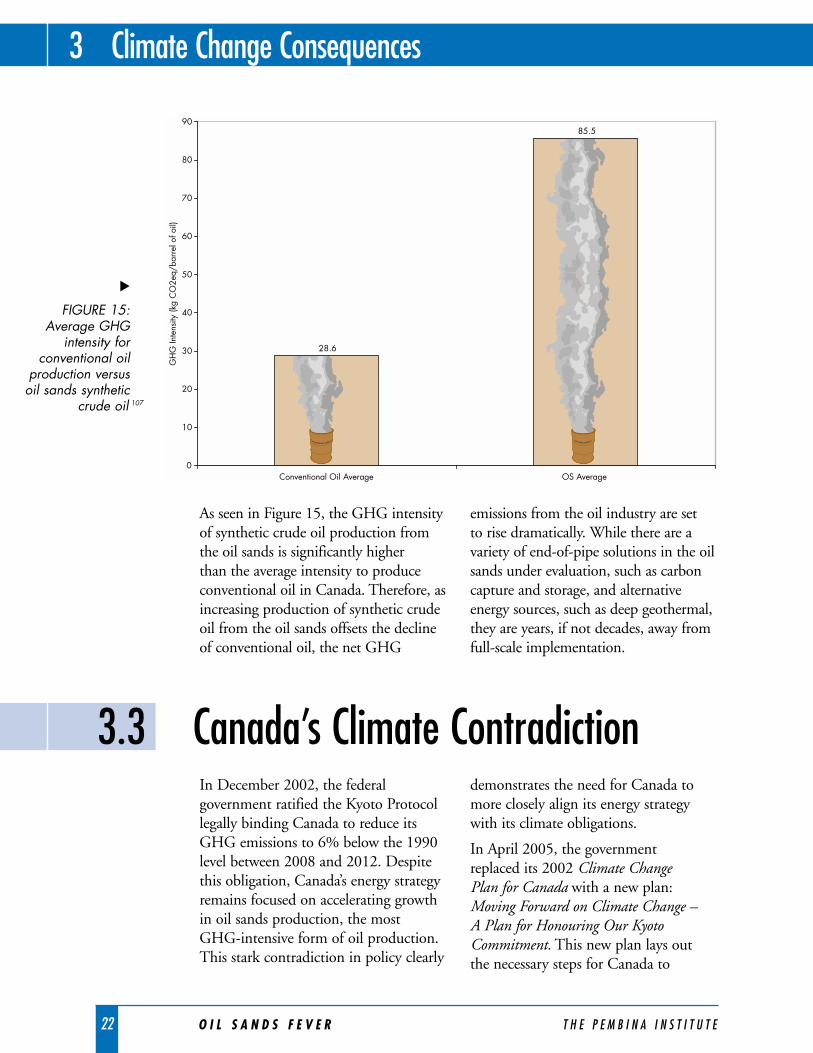
As seen in Figure 15, the GHG intensityof synthetic crude oil production fromthe oil sands is significantly higher than the average intensity to produceconventional oil in Canada. Therefore, asincreasing production of synthetic crudeoil from the oil sands offsets the declineof conventional oil, the net GHG
emissions from the oil industry are set to rise dramatically. While there are avariety of end-of-pipe solutions in the oilsands under evaluation, such as carboncapture and storage, and alternativeenergy sources, such as deep geothermal,they are years, if not decades, away fromfull-scale implementation.
In December 2002, the federalgovernment ratified the Kyoto Protocollegally binding Canada to reduce itsGHG emissions to 6% below the 1990level between 2008 and 2012. Despitethis obligation, Canada’s energy strategyremains focused on accelerating growthin oil sands production, the most GHG-intensive form of oil production.This stark contradiction in policy clearly
demonstrates the need for Canada tomore closely align its energy strategywith its climate obligations.
In April 2005, the government replaced its 2002 Climate Change Plan for Canada with a new plan:Moving Forward on Climate Change – A Plan for Honouring Our KyotoCommitment. This new plan lays out the necessary steps for Canada to
3 Climate Change Consequences
3.3 Canada’s Climate Contradiction
28.6
85.5
0
10
20
30
40
50
60
70
80
90
Conventional Oil Average OS Average
GH
G In
tens
ity (k
g C
O2e
q/ba
rrel
of o
il)
▲
FIGURE 15:Average GHG
intensity forconventional oil
production versusoil sands synthetic
crude oil 107
T H E P E M B I N A I N S T I T U T E O I L S A N D S F E V E R 23
Climate Change Consequences 3
achieve a 270 Mt reduction in annualGHG emissions by 2010. An essentialcomponent of this plan is a Large Final Emitters (LFE) system ofmandatory emissions targets and trading to secure GHG emissionreductions by heavy industry, includingthe oil sands sector. Large Final Emittersare responsible for nearly 50% ofCanada’s GHG emissions.
However, industry lobbying has led to government plans to require only 36 Mt of reductions from Large Final Emitters during 2008-2012. Soalthough responsible for nearly 50% ofCanada’s GHG emissions, they will onlybe required to achieve 13% of the 270Mt reduction target. Targets for newfacilities in the LFE system are to be setat the level of “best available technology
“We must ensure that there is nothing,as we move forward to implementKyoto, that in any way undermines or impedes the growth of projects like the oil sands and obviously their contribution to the prosperity of this country.”
Deputy Prime Minister Anne McLellan, 2002108
“Canada’s position on GHGemissions reduction is ambivalent. It can be described as someone trying to ride two horses galloping inopposite directions. One horse pullsenergy investments towards the fossilfuels sector, thus increasing GHGemissions. The opposite horse pullsprogrammes and policies aimed atreducing GHG emissions.”
Charles Caccia, former Chair, House ofCommons Standing Committee on Environmentand Sustainable Development, 2002109
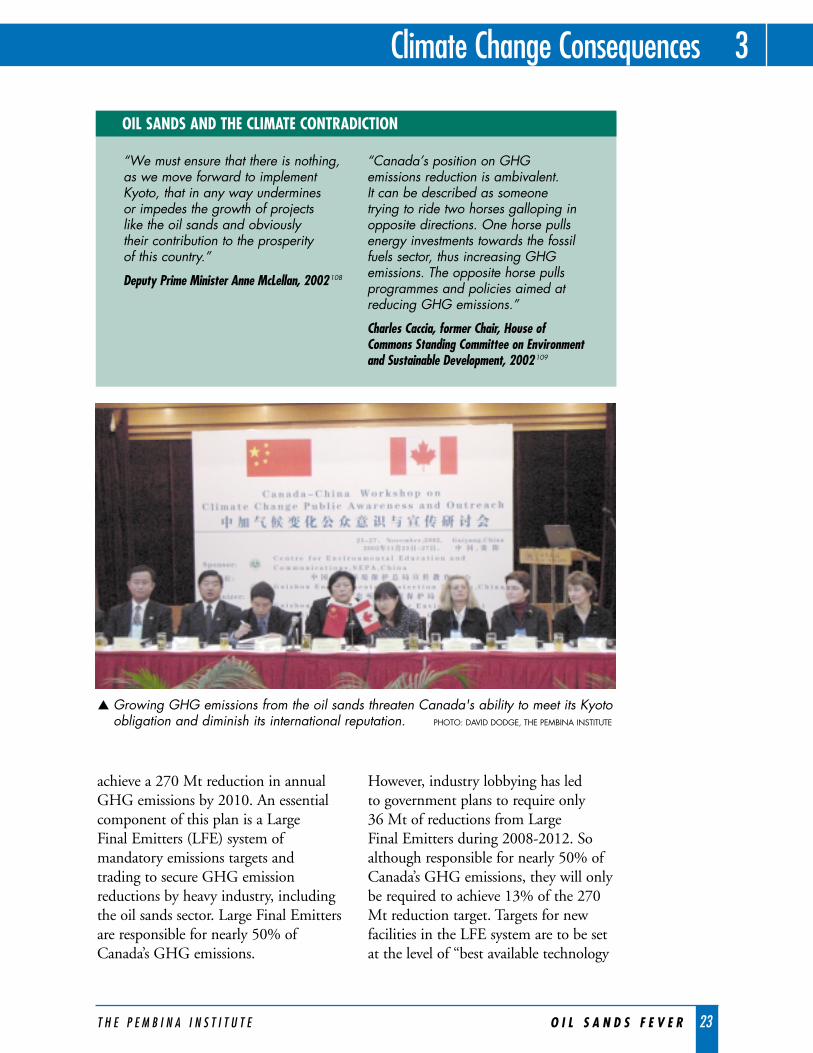
▲ Growing GHG emissions from the oil sands threaten Canada's ability to meet its Kyotoobligation and diminish its international reputation. PHOTO: DAVID DODGE, THE PEMBINA INSTITUTE
OIL SANDS AND THE CLIMATE CONTRADICTION
24 O I L S A N D S F E V E R T H E P E M B I N A I N S T I T U T E
3 Climate Change Consequences
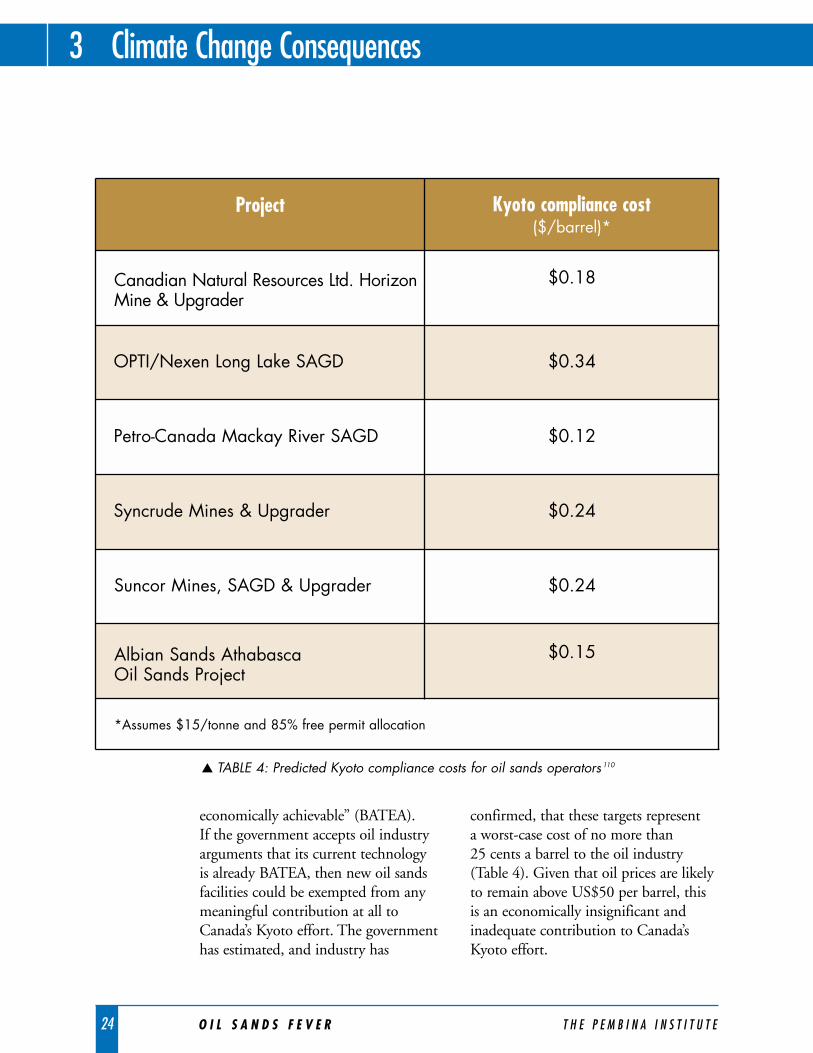
economically achievable” (BATEA). If the government accepts oil industryarguments that its current technology is already BATEA, then new oil sandsfacilities could be exempted from anymeaningful contribution at all toCanada’s Kyoto effort. The governmenthas estimated, and industry has
confirmed, that these targets represent a worst-case cost of no more than 25 cents a barrel to the oil industry (Table 4). Given that oil prices are likelyto remain above US$50 per barrel, thisis an economically insignificant andinadequate contribution to Canada’sKyoto effort.
Project Kyoto compliance cost ($/barrel)*
Canadian Natural Resources Ltd. HorizonMine & Upgrader
$0.18
OPTI/Nexen Long Lake SAGD $0.34
Petro-Canada Mackay River SAGD $0.12
Syncrude Mines & Upgrader $0.24
Suncor Mines, SAGD & Upgrader $0.24
Albian Sands Athabasca Oil Sands Project
$0.15
*Assumes $15/tonne and 85% free permit allocation
▲ TABLE 4: Predicted Kyoto compliance costs for oil sands operators 110
T H E P E M B I N A I N S T I T U T E O I L S A N D S F E V E R 25
Climate Change Consequences 3
Both government and business leaderswidely recognize climate change as one of the greatest and most pressingchallenges of the 21st century.112
To effectively tackle this challenge will require strong leadership and action in both the short and long termon the part of government and the oil sands industry.
3.4 Taking Meaningful Action
Certain companies have acknowledgedthe need to take action to reduce theirGHG emissions thereby demonstratingan ability and willingness to go furtherthan what is likely to be required ofthem by the federal government. Forexample, after receiving approval for itsAthabasca Oil Sands Project (AOSP),Shell Canada committed to achieving a 50% reduction in GHG emissionsrelative to its projected emissions
intensity of 65 kilograms of GHGs perbarrel of bitumen. The company plansto do this through a combination ofreduced energy consumption, improvedenergy efficiency, the purchase ofdomestic offsets and feasibility studiesregarding C02 capture.111 This exampleclearly demonstrates that the industrycan go well beyond what the federalgovernment expects of it.
“The scientific understanding of climatechange is now sufficiently clear to justifynations taking prompt action. It is vital that all nations identify cost-effective stepsthat they can take now, to contribute tosubstantial and long-term reduction in net global greenhouse gas emissions.”
Statement by the National Science Academies of allG8 countries, China, India and Brazil. June 2005 113
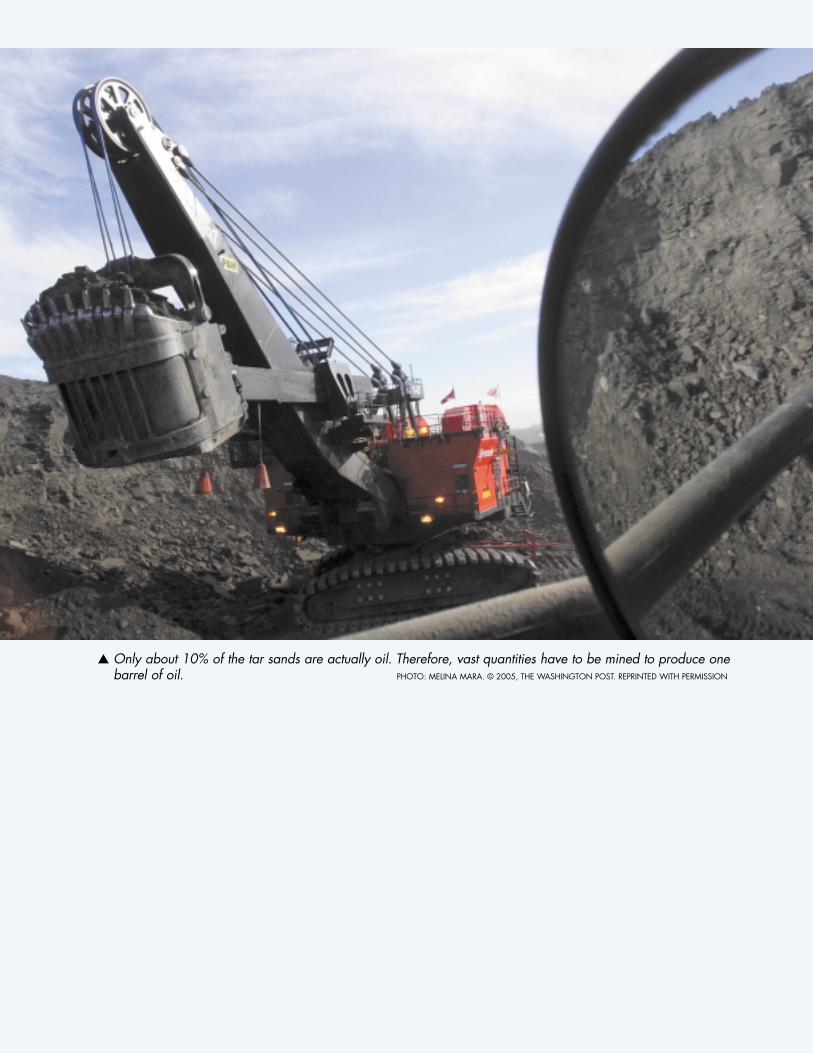
▲ Only about 10% of the tar sands are actually oil. Therefore, vast quantities have to be mined to produce onebarrel of oil. PHOTO: MELINA MARA. © 2005, THE WASHINGTON POST. REPRINTED WITH PERMISSION
The expression “death by a thousandcuts” is often used to describe theaccumulation of environmental impactsresulting from multiple industrialactivities. Technically referred to as“cumulative environmental impacts,”the accumulation of impacts mayappear insignificant on their own but can lead to significant and oftenirreversible ecological damage. In fewplaces is this concept more tangiblethan in the Athabasca oil sands region,where a proliferation of in situ andsurface mining operations are rapidlydegrading the regional environment.
The boreal forest ecosystem is resilient,but it can only withstand so muchdegradation before its ability to recoveris exceeded. This proverbial “tippingpoint,” referred to as an ecologicalthreshold or environmental limit,represents the extent of change that an ecosystem can endure before thischange is irreversible. As theindustrialization of the northeastquadrant of Alberta continuesunabated through oil sandsdevelopment, forestry, andconventional oil and gas, threats to the region’s long-term ecologicalsustainability escalate.
We need to ensure we have thescientific information to understandhow the boreal ecosystem – its air, landand water – will react to the impacts of development. It would then bepossible to determine, for example,how much water can be removed fromthe Athabasca River before fish
populations are affected, how muchhabitat can be destroyed before wildlifespecies are lost and how much airquality can change before theecosystem is irreversibly stressed.
The following sections describe how the oil sands industry impacts the region’s water, land and air and provide projections of the even greaterimpacts that will accompany planneddevelopment to approximately 3.7million barrels per day of oil sandsproduction.114 If production reachesfive million barrels per day (or higher) by 2030, the environmental impactswill be even greater than thosedescribed below.
4 Environmental Impacts4.1 Cumulative Environmental Impacts
T H E P E M B I N A I N S T I T U T E O I L S A N D S F E V E R 27
“There is noenvironmental ministeron earth who can stopthe oil from coming out of the sand, because the money istoo big. But we have to be very strict onenvironmental impact.”
Stéphane Dion, FederalMinister of Environment115
As the hub of regional oilsands development, theRegional Municipality ofWood Buffalo (RMWB) is growing rapidly andchanging. First Nationsand Métis people make upapproximately 6% of theRMWB’s population, thevast majority of whom live in small communitiesoutside Fort McMurray.116,117
The RMWB is strugglingwith the socioeconomicimpacts such as lack ofaffordable housing andinsufficient infrastructuree.g., roads and schools.The regional First Nations
and Métis face similarchallenges as they seek tobalance the benefits of jobcreation and a boomingeconomy with ensuringthat their culture, theregion’s environment andtheir traditional way of lifeare preserved. Not unlikecumulative environmentalimpacts, the rush ofdevelopment is havingcumulative socioeconomicimpacts. While beyond the scope of this report,managing thesesocioeconomic impacts is also an urgent issue.
CUMULATIVE SOCIO-ECONOMIC IMPACTS
28 O I L S A N D S F E V E R T H E P E M B I N A I N S T I T U T E
4.2 Troubled Waters
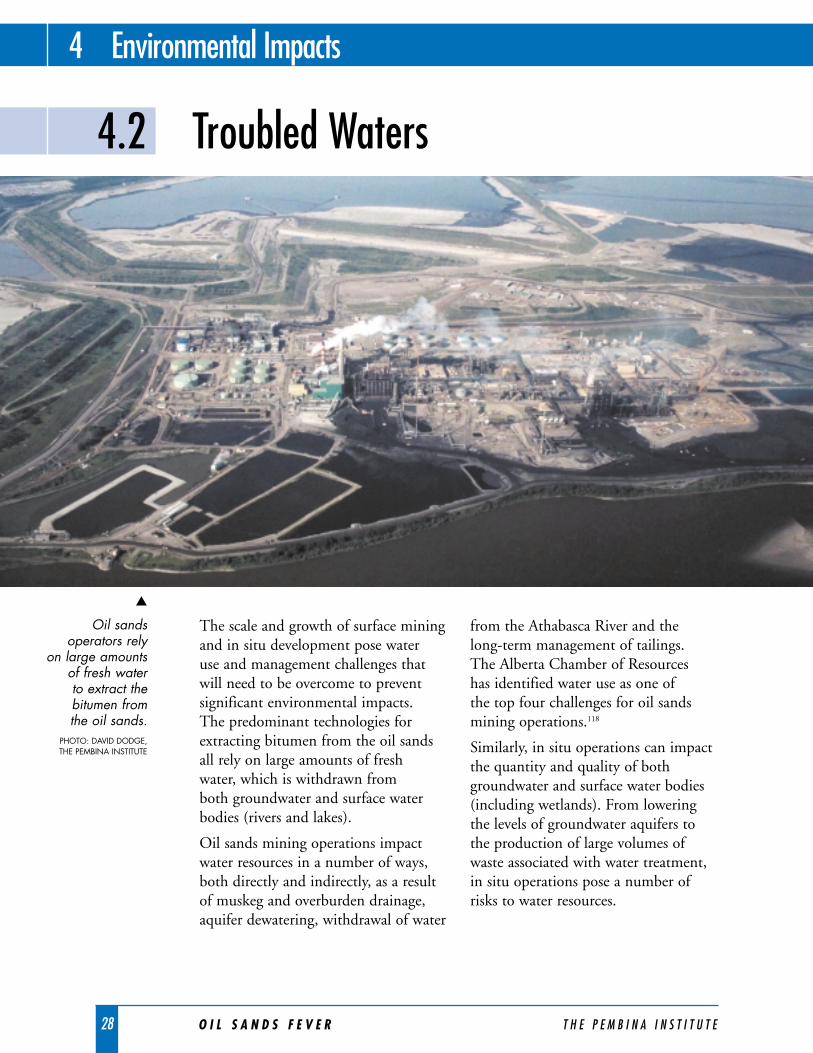
The scale and growth of surface miningand in situ development pose water use and management challenges thatwill need to be overcome to preventsignificant environmental impacts. The predominant technologies forextracting bitumen from the oil sandsall rely on large amounts of fresh water, which is withdrawn from both groundwater and surface waterbodies (rivers and lakes).
Oil sands mining operations impactwater resources in a number of ways,both directly and indirectly, as a resultof muskeg and overburden drainage,aquifer dewatering, withdrawal of water
from the Athabasca River and the long-term management of tailings. The Alberta Chamber of Resources has identified water use as one of the top four challenges for oil sandsmining operations.118
Similarly, in situ operations can impactthe quantity and quality of bothgroundwater and surface water bodies(including wetlands). From loweringthe levels of groundwater aquifers tothe production of large volumes ofwaste associated with water treatment,in situ operations pose a number ofrisks to water resources.
4 Environmental Impacts
▲
Oil sands operators rely
on large amountsof fresh water to extract the bitumen from the oil sands.
PHOTO: DAVID DODGE, THE PEMBINA INSTITUTE
T H E P E M B I N A I N S T I T U T E O I L S A N D S F E V E R 29
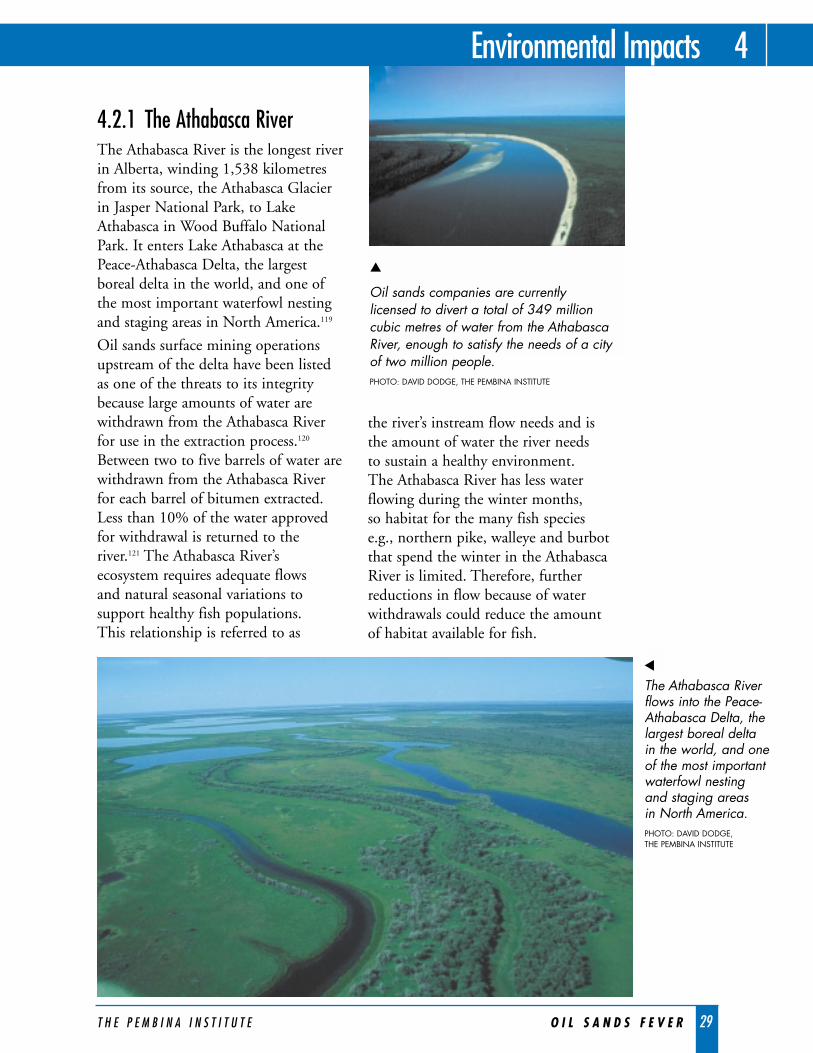
4.2.1 The Athabasca RiverThe Athabasca River is the longest riverin Alberta, winding 1,538 kilometresfrom its source, the Athabasca Glacierin Jasper National Park, to LakeAthabasca in Wood Buffalo NationalPark. It enters Lake Athabasca at thePeace-Athabasca Delta, the largestboreal delta in the world, and one ofthe most important waterfowl nestingand staging areas in North America.119
Oil sands surface mining operationsupstream of the delta have been listedas one of the threats to its integritybecause large amounts of water arewithdrawn from the Athabasca Riverfor use in the extraction process.120
Between two to five barrels of water arewithdrawn from the Athabasca Riverfor each barrel of bitumen extracted.Less than 10% of the water approvedfor withdrawal is returned to theriver.121 The Athabasca River’secosystem requires adequate flows and natural seasonal variations tosupport healthy fish populations. This relationship is referred to as
the river’s instream flow needs and is the amount of water the river needs to sustain a healthy environment. The Athabasca River has less waterflowing during the winter months, so habitat for the many fish speciese.g., northern pike, walleye and burbotthat spend the winter in the AthabascaRiver is limited. Therefore, furtherreductions in flow because of waterwithdrawals could reduce the amountof habitat available for fish.
▲
Oil sands companies are currentlylicensed to divert a total of 349 millioncubic metres of water from the AthabascaRiver, enough to satisfy the needs of a cityof two million people.PHOTO: DAVID DODGE, THE PEMBINA INSTITUTE
The Athabasca Riverflows into the Peace-Athabasca Delta, thelargest boreal delta in the world, and oneof the most importantwaterfowl nesting and staging areas in North America.PHOTO: DAVID DODGE, THE PEMBINA INSTITUTE
▲
Environmental Impacts 4
30 O I L S A N D S F E V E R T H E P E M B I N A I N S T I T U T E
After five years of gatheringinformation, Alberta Environmentplans to identify how much water must remain in the river to provideadequate habitat for the fish. Then the department can make informeddecisions about how much water canbe withdrawn during the winter whileensuring that the ecosystem is fullyprotected. However, considering theindustry’s assertion that alternatives to water-based extraction technologywill likely not emerge for 20 years,123
it is also critical for industry andgovernment to manage the timing and development of future projects(whether singly or as a region) to ensure that the Athabasca River is protected.
4.2.2 A Tailings LegacyWater used for extraction at oil sandsmines ends up in tailings – a slurry ofbitumen, water, sand, silt and fine clay
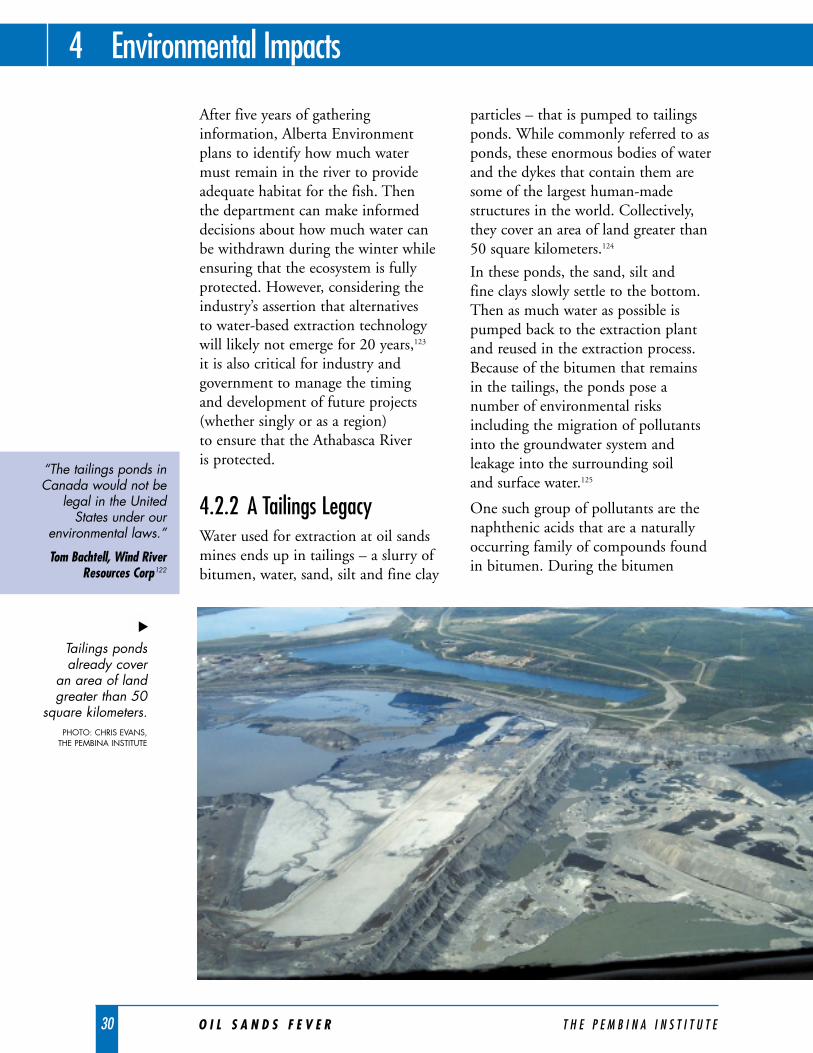
particles – that is pumped to tailingsponds. While commonly referred to asponds, these enormous bodies of waterand the dykes that contain them aresome of the largest human-madestructures in the world. Collectively,they cover an area of land greater than50 square kilometers.124
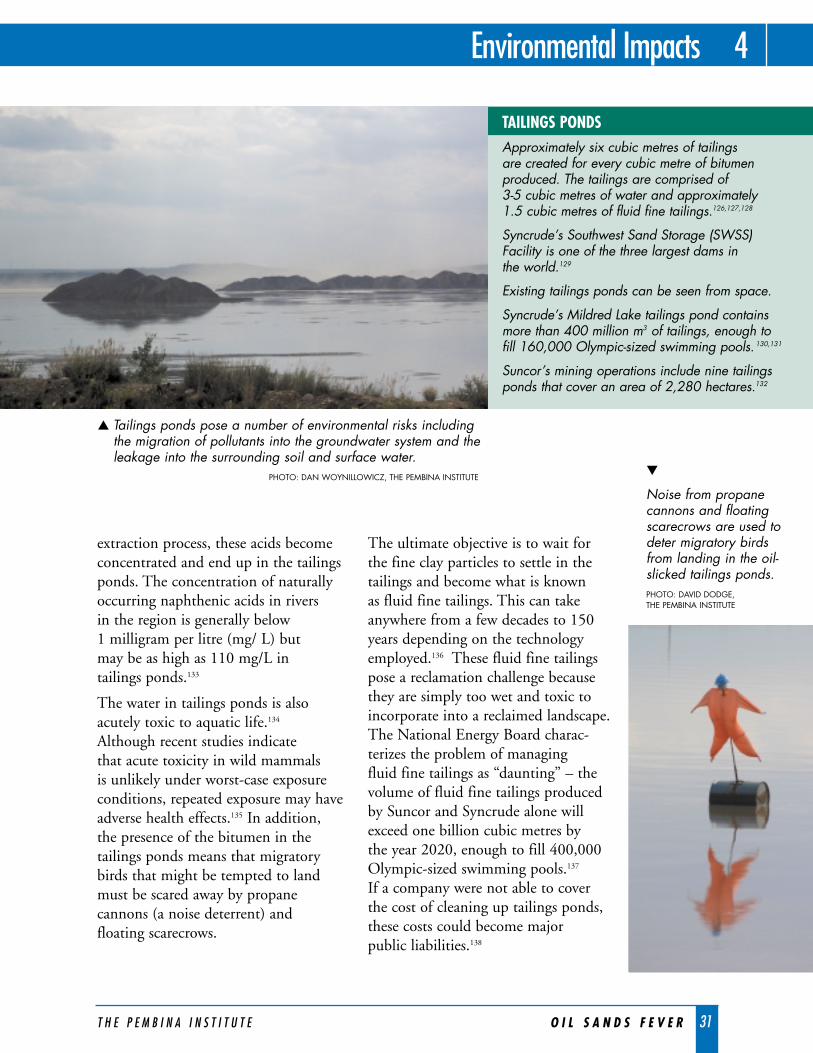
In these ponds, the sand, silt and fine clays slowly settle to the bottom.Then as much water as possible ispumped back to the extraction plantand reused in the extraction process.Because of the bitumen that remains in the tailings, the ponds pose anumber of environmental risksincluding the migration of pollutantsinto the groundwater system and leakage into the surrounding soil and surface water.125
One such group of pollutants are thenaphthenic acids that are a naturallyoccurring family of compounds foundin bitumen. During the bitumen
4 Environmental Impacts
Tailings pondsalready cover
an area of landgreater than 50
square kilometers.PHOTO: CHRIS EVANS,
THE PEMBINA INSTITUTE
▲
“The tailings ponds inCanada would not be
legal in the UnitedStates under our
environmental laws.”
Tom Bachtell, Wind RiverResources Corp122
T H E P E M B I N A I N S T I T U T E O I L S A N D S F E V E R 31
Environmental Impacts 4
extraction process, these acids becomeconcentrated and end up in the tailingsponds. The concentration of naturallyoccurring naphthenic acids in rivers in the region is generally below 1 milligram per litre (mg/ L) but may be as high as 110 mg/L in tailings ponds.133
The water in tailings ponds is alsoacutely toxic to aquatic life.134
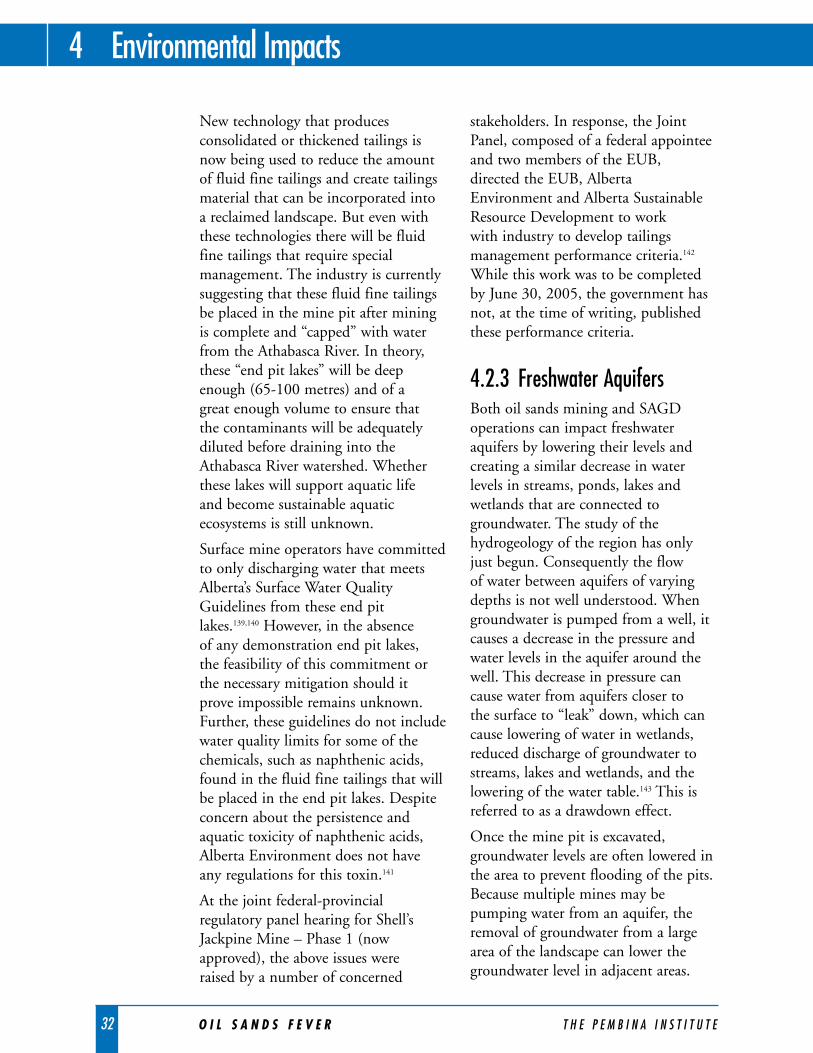
Although recent studies indicate that acute toxicity in wild mammals is unlikely under worst-case exposureconditions, repeated exposure may haveadverse health effects.135 In addition,the presence of the bitumen in thetailings ponds means that migratorybirds that might be tempted to landmust be scared away by propanecannons (a noise deterrent) andfloating scarecrows.
The ultimate objective is to wait for the fine clay particles to settle in thetailings and become what is known as fluid fine tailings. This can takeanywhere from a few decades to 150years depending on the technologyemployed.136 These fluid fine tailingspose a reclamation challenge becausethey are simply too wet and toxic toincorporate into a reclaimed landscape.The National Energy Board charac-terizes the problem of managing fluid fine tailings as “daunting” – the volume of fluid fine tailings producedby Suncor and Syncrude alone will exceed one billion cubic metres by the year 2020, enough to fill 400,000Olympic-sized swimming pools.137
If a company were not able to cover the cost of cleaning up tailings ponds,these costs could become major public liabilities.138
TAILINGS PONDSApproximately six cubic metres of tailings are created for every cubic metre of bitumenproduced. The tailings are comprised of 3-5 cubic metres of water and approximately 1.5 cubic metres of fluid fine tailings.126,127,128
Syncrude’s Southwest Sand Storage (SWSS)Facility is one of the three largest dams in the world.129
Existing tailings ponds can be seen from space.
Syncrude’s Mildred Lake tailings pond containsmore than 400 million m3 of tailings, enough tofill 160,000 Olympic-sized swimming pools. 130,131
Suncor’s mining operations include nine tailingsponds that cover an area of 2,280 hectares.132
▲ Tailings ponds pose a number of environmental risks includingthe migration of pollutants into the groundwater system and theleakage into the surrounding soil and surface water.
PHOTO: DAN WOYNILLOWICZ, THE PEMBINA INSTITUTE ▼
Noise from propanecannons and floatingscarecrows are used todeter migratory birdsfrom landing in the oil-slicked tailings ponds.PHOTO: DAVID DODGE, THE PEMBINA INSTITUTE
32 O I L S A N D S F E V E R T H E P E M B I N A I N S T I T U T E
New technology that producesconsolidated or thickened tailings isnow being used to reduce the amountof fluid fine tailings and create tailingsmaterial that can be incorporated into a reclaimed landscape. But even withthese technologies there will be fluidfine tailings that require specialmanagement. The industry is currentlysuggesting that these fluid fine tailingsbe placed in the mine pit after miningis complete and “capped” with waterfrom the Athabasca River. In theory,these “end pit lakes” will be deepenough (65-100 metres) and of a great enough volume to ensure that the contaminants will be adequatelydiluted before draining into theAthabasca River watershed. Whetherthese lakes will support aquatic life and become sustainable aquaticecosystems is still unknown.
Surface mine operators have committedto only discharging water that meetsAlberta’s Surface Water QualityGuidelines from these end pitlakes.139,140 However, in the absence of any demonstration end pit lakes, the feasibility of this commitment orthe necessary mitigation should it prove impossible remains unknown.Further, these guidelines do not includewater quality limits for some of thechemicals, such as naphthenic acids,found in the fluid fine tailings that willbe placed in the end pit lakes. Despiteconcern about the persistence andaquatic toxicity of naphthenic acids,Alberta Environment does not haveany regulations for this toxin.141
At the joint federal-provincialregulatory panel hearing for Shell’sJackpine Mine – Phase 1 (nowapproved), the above issues were raised by a number of concerned
stakeholders. In response, the JointPanel, composed of a federal appointeeand two members of the EUB, directed the EUB, AlbertaEnvironment and Alberta SustainableResource Development to work with industry to develop tailingsmanagement performance criteria.142
While this work was to be completedby June 30, 2005, the government hasnot, at the time of writing, publishedthese performance criteria.
4.2.3 Freshwater AquifersBoth oil sands mining and SAGDoperations can impact freshwateraquifers by lowering their levels andcreating a similar decrease in waterlevels in streams, ponds, lakes andwetlands that are connected togroundwater. The study of thehydrogeology of the region has onlyjust begun. Consequently the flow of water between aquifers of varyingdepths is not well understood. Whengroundwater is pumped from a well, itcauses a decrease in the pressure andwater levels in the aquifer around thewell. This decrease in pressure cancause water from aquifers closer to the surface to “leak” down, which cancause lowering of water in wetlands,reduced discharge of groundwater tostreams, lakes and wetlands, and thelowering of the water table.143 This isreferred to as a drawdown effect.
Once the mine pit is excavated,groundwater levels are often lowered inthe area to prevent flooding of the pits.Because multiple mines may bepumping water from an aquifer, theremoval of groundwater from a largearea of the landscape can lower thegroundwater level in adjacent areas.
4 Environmental Impacts
T H E P E M B I N A I N S T I T U T E O I L S A N D S F E V E R 33
Environmental Impacts 4
This can result in reduced groundwaterflows to peatlands, wetlands and othersurface water bodies.
The area impacted by the drawdowneffect of removing this water can be upto 100 square kilometres.144 Becauseprevention of pit flooding is consideredessential, even if significant impacts aredetected (e.g., wetlands drying out),there is not any possible mitigation.
In situ projects also impact freshwateraquifers through the SAGD technologyused to recover bitumen. After therecovery, 90%-95% of the water,known as produced water, is de-oiledand treated so it can be reused in thesteam generator. Because some of thewater is lost in the treatment process,additional groundwater must bewithdrawn. For every cubic metre ofbitumen produced, about 0.2 cubicmetres (200 litres) of additionalgroundwater must be added to producemore steam. To minimize the need touse freshwater aquifers, almost allSAGD projects in the region use somefresh groundwater mixed with salinegroundwater (from deeper formations).While the use of saline groundwater forSAGD operations avoids additionaldemands on freshwater aquifers,treating it for use in the steamgenerators produces large volumes ofsolid waste.
4.2.4 Waste from Water Treatment
When saline water or produced water isbeing used at SAGD facilities for steamproduction, it must either be blendedwith fresh water or treated. The wastesfrom desalinization and other
treatment processes are landfilled or injected into disposal wells that are drilled in deep, porous rockformations. Given the substantialvolumes of water used by SAGDoperations, the amount of solid wasteproduced is significant. For example,between 2005 and 2025 EnCana’sFoster Creek SAGD operation willdispose of 48 million cubic metres ofsludge into deep wells and send almost260,000 tonnes of waste to landfill.145
To minimize the cost of transportingwaste to regional landfills, manyoperators are constructing their ownlandfills and disposal wells. This has led to a proliferation of wastedisposal facilities, another long-termenvironmental concern. Thepredominant use of landfills is also aserious issue because “disposingconcentrates and effluent sludge inlandfills could have significantenvironmental and ecological impacton the nearby soil and groundwaterdue to the high concentration of acids,hydrocarbon residues, trace metals andother contaminants.”146
4.2.5 Troubling Trends in Water Use
Canadians are increasingly concernedabout the long-term sustainability ofsurface and groundwater resources andthe health of aquatic ecosystems. In themidst of a drought and public concernsabout the quantity and quality of freshwater, the government of Albertadeveloped its Water for Life strategy in2003.147 During the development ofthis strategy, the public identified theuse of water by the oil and gas sector asone of its key concerns.
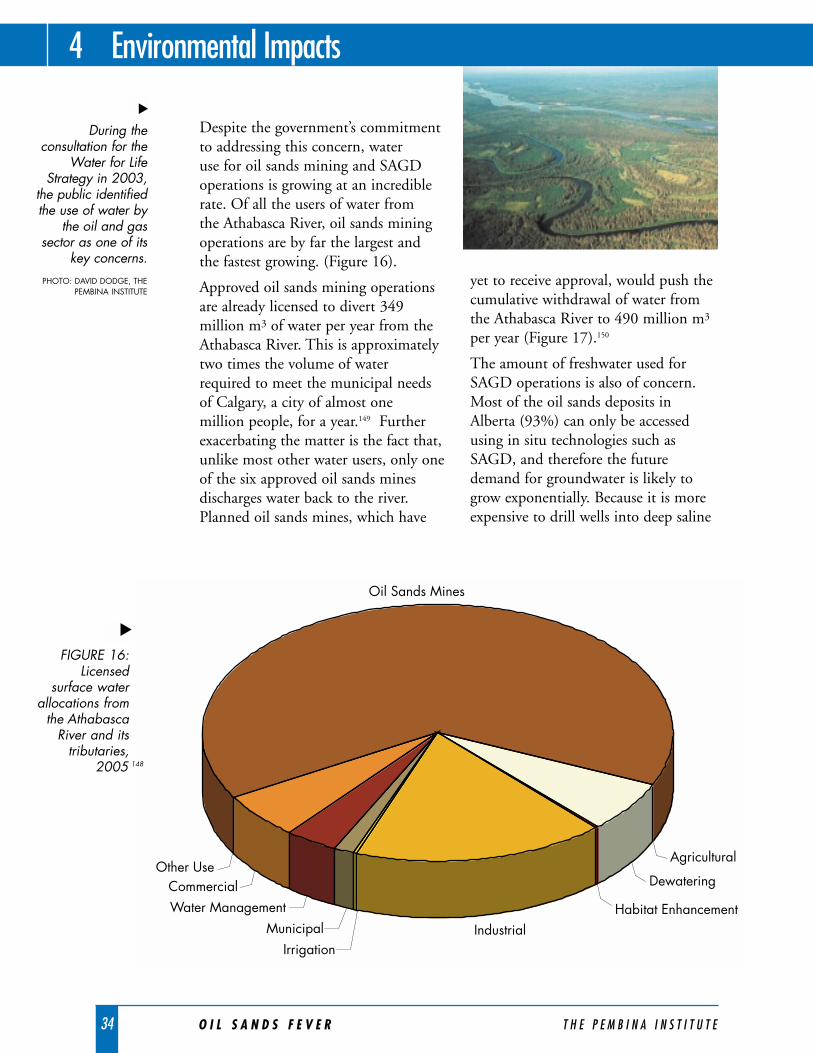
Despite the government’s commitmentto addressing this concern, water use for oil sands mining and SAGDoperations is growing at an incrediblerate. Of all the users of water from the Athabasca River, oil sands miningoperations are by far the largest and the fastest growing. (Figure 16).
Approved oil sands mining operationsare already licensed to divert 349million m3 of water per year from theAthabasca River. This is approximatelytwo times the volume of water required to meet the municipal needsof Calgary, a city of almost one million people, for a year.149 Furtherexacerbating the matter is the fact that,unlike most other water users, only oneof the six approved oil sands minesdischarges water back to the river.Planned oil sands mines, which have
yet to receive approval, would push thecumulative withdrawal of water fromthe Athabasca River to 490 million m3
per year (Figure 17).150
The amount of freshwater used forSAGD operations is also of concern.Most of the oil sands deposits inAlberta (93%) can only be accessedusing in situ technologies such asSAGD, and therefore the futuredemand for groundwater is likely togrow exponentially. Because it is moreexpensive to drill wells into deep saline
34 O I L S A N D S F E V E R T H E P E M B I N A I N S T I T U T E
4 Environmental Impacts
Oil Sands Mines
Agricultural
Dewatering
Habitat EnhancementIndustrial
IrrigationMunicipal
Water ManagementCommercial
Other Use
FIGURE 16: Licensed
surface waterallocations from
the AthabascaRiver and its
tributaries,2005 148
▲
During theconsultation for the
Water for LifeStrategy in 2003,
the public identifiedthe use of water by
the oil and gassector as one of its
key concerns.PHOTO: DAVID DODGE, THE
PEMBINA INSTITUTE
▲
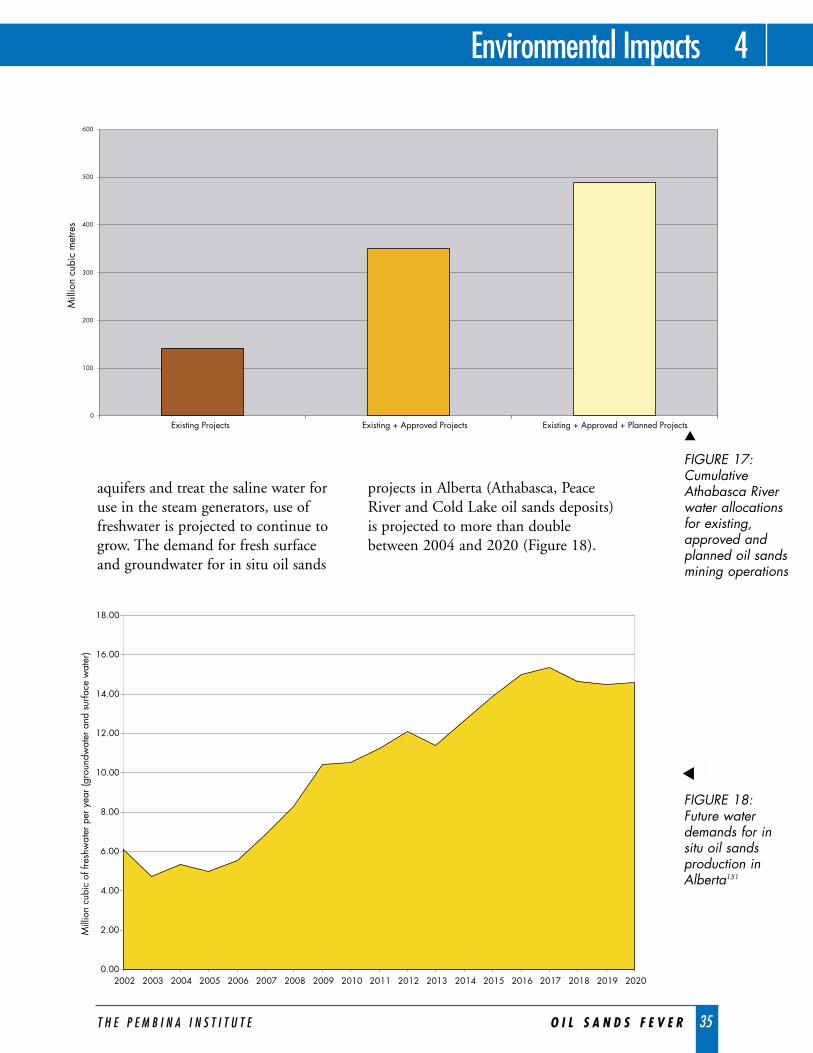
T H E P E M B I N A I N S T I T U T E O I L S A N D S F E V E R 35
Environmental Impacts 4
aquifers and treat the saline water foruse in the steam generators, use offreshwater is projected to continue togrow. The demand for fresh surface and groundwater for in situ oil sands
projects in Alberta (Athabasca, PeaceRiver and Cold Lake oil sands deposits)is projected to more than doublebetween 2004 and 2020 (Figure 18).
0
100
200
300
400
500
600
Existing Projects Existing + Approved Projects Existing + Approved + Planned Projects
Mill
ion
cubi
c m
etre
s
FIGURE 18: Future waterdemands for insitu oil sandsproduction inAlberta151
▲
FIGURE 17: CumulativeAthabasca Riverwater allocationsfor existing,approved andplanned oil sandsmining operations
0.00
2.00
4.00
6.00
8.00
10.00
12.00
14.00
16.00
18.00
2002 2003 2004 2005 2006 2007 2008 2009 2010 2011 2012 2013 2014 2015 2016 2017 2018 2019 2020
rface water)Mill
ion
cubi
c of
fres
hwat
er p
er y
ear (
grou
ndw
ater
and
sur
face
wat
er)
▲
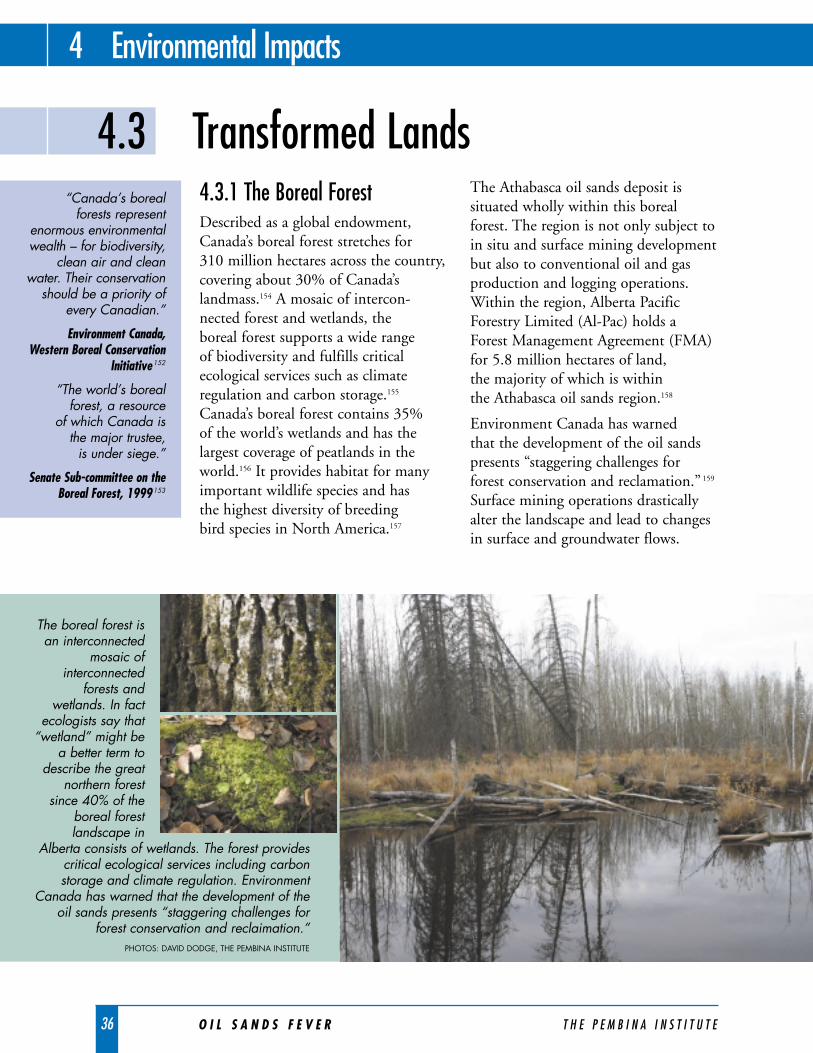
4.3.1 The Boreal ForestDescribed as a global endowment,Canada’s boreal forest stretches for 310 million hectares across the country,covering about 30% of Canada’slandmass.154 A mosaic of intercon-nected forest and wetlands, the boreal forest supports a wide range of biodiversity and fulfills criticalecological services such as climateregulation and carbon storage.155
Canada’s boreal forest contains 35% of the world’s wetlands and has thelargest coverage of peatlands in theworld.156 It provides habitat for manyimportant wildlife species and has the highest diversity of breeding bird species in North America.157
The Athabasca oil sands deposit issituated wholly within this borealforest. The region is not only subject toin situ and surface mining developmentbut also to conventional oil and gasproduction and logging operations.Within the region, Alberta PacificForestry Limited (Al-Pac) holds aForest Management Agreement (FMA)for 5.8 million hectares of land, the majority of which is within the Athabasca oil sands region.158
Environment Canada has warned that the development of the oil sandspresents “staggering challenges forforest conservation and reclamation.” 159
Surface mining operations drasticallyalter the landscape and lead to changesin surface and groundwater flows.
The boreal forest isan interconnected
mosaic ofinterconnected
forests andwetlands. In fact
ecologists say that“wetland” might be
a better term todescribe the great
northern forestsince 40% of the
boreal forestlandscape in
Alberta consists of wetlands. The forest providescritical ecological services including carbonstorage and climate regulation. Environment
Canada has warned that the development of theoil sands presents “staggering challenges for
forest conservation and reclaimation.”PHOTOS: DAVID DODGE, THE PEMBINA INSTITUTE
36 O I L S A N D S F E V E R T H E P E M B I N A I N S T I T U T E
4.3 Transformed Lands
4 Environmental Impacts
“Canada’s boreal forests represent
enormous environmentalwealth – for biodiversity,
clean air and cleanwater. Their conservation
should be a priority ofevery Canadian.”
Environment Canada,Western Boreal Conservation
Initiative152
“The world’s borealforest, a resource
of which Canada is the major trustee,
is under siege.”
Senate Sub-committee on theBoreal Forest, 1999153
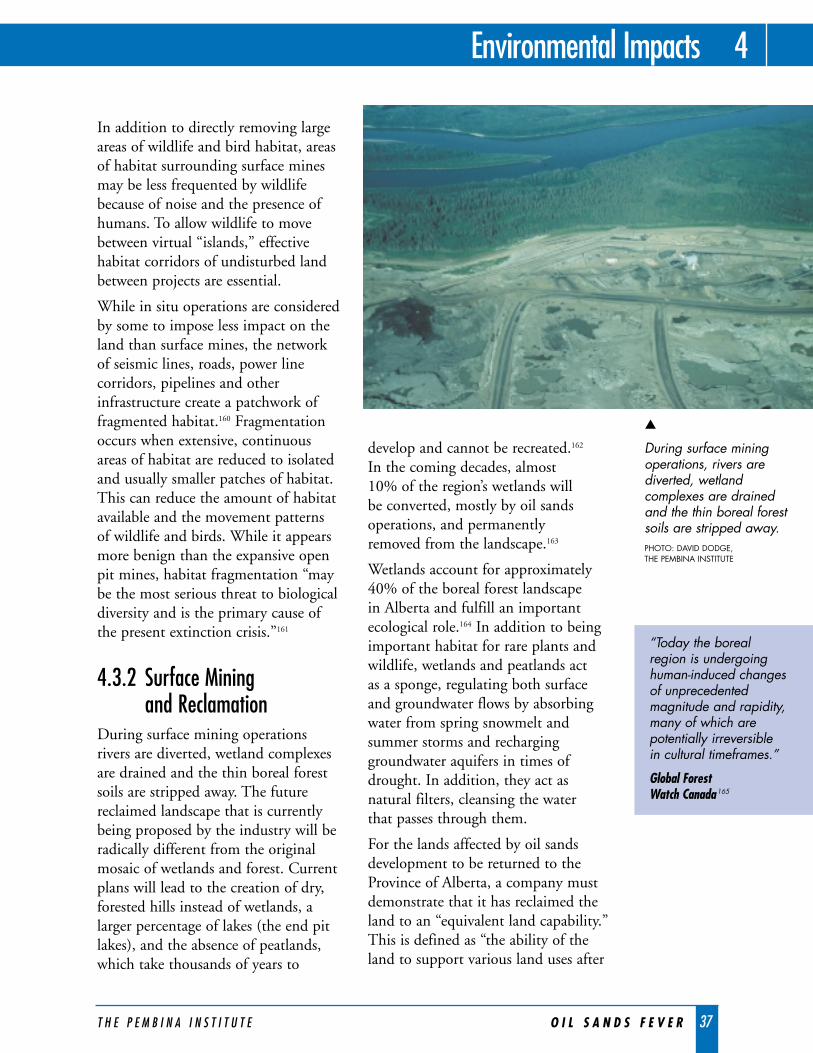
T H E P E M B I N A I N S T I T U T E O I L S A N D S F E V E R 37
Environmental Impacts 4
In addition to directly removing largeareas of wildlife and bird habitat, areasof habitat surrounding surface minesmay be less frequented by wildlifebecause of noise and the presence ofhumans. To allow wildlife to movebetween virtual “islands,” effectivehabitat corridors of undisturbed landbetween projects are essential.
While in situ operations are consideredby some to impose less impact on theland than surface mines, the networkof seismic lines, roads, power linecorridors, pipelines and otherinfrastructure create a patchwork offragmented habitat.160 Fragmentationoccurs when extensive, continuousareas of habitat are reduced to isolatedand usually smaller patches of habitat.This can reduce the amount of habitatavailable and the movement patterns of wildlife and birds. While it appearsmore benign than the expansive openpit mines, habitat fragmentation “maybe the most serious threat to biologicaldiversity and is the primary cause ofthe present extinction crisis.”161
4.3.2 Surface Mining and Reclamation
During surface mining operationsrivers are diverted, wetland complexesare drained and the thin boreal forestsoils are stripped away. The futurereclaimed landscape that is currentlybeing proposed by the industry will beradically different from the originalmosaic of wetlands and forest. Currentplans will lead to the creation of dry,forested hills instead of wetlands, alarger percentage of lakes (the end pitlakes), and the absence of peatlands,which take thousands of years to
develop and cannot be recreated.162
In the coming decades, almost 10% of the region’s wetlands will be converted, mostly by oil sandsoperations, and permanently removed from the landscape.163
Wetlands account for approximately40% of the boreal forest landscape in Alberta and fulfill an importantecological role.164 In addition to beingimportant habitat for rare plants andwildlife, wetlands and peatlands act as a sponge, regulating both surfaceand groundwater flows by absorbingwater from spring snowmelt andsummer storms and recharginggroundwater aquifers in times ofdrought. In addition, they act asnatural filters, cleansing the water that passes through them.
For the lands affected by oil sandsdevelopment to be returned to theProvince of Alberta, a company mustdemonstrate that it has reclaimed theland to an “equivalent land capability.”This is defined as “the ability of theland to support various land uses after
“Today the borealregion is undergoinghuman-induced changesof unprecedentedmagnitude and rapidity,many of which arepotentially irreversible in cultural timeframes.”
Global Forest Watch Canada165
▲
During surface miningoperations, rivers arediverted, wetlandcomplexes are drained and the thin boreal forestsoils are stripped away.PHOTO: DAVID DODGE, THE PEMBINA INSTITUTE
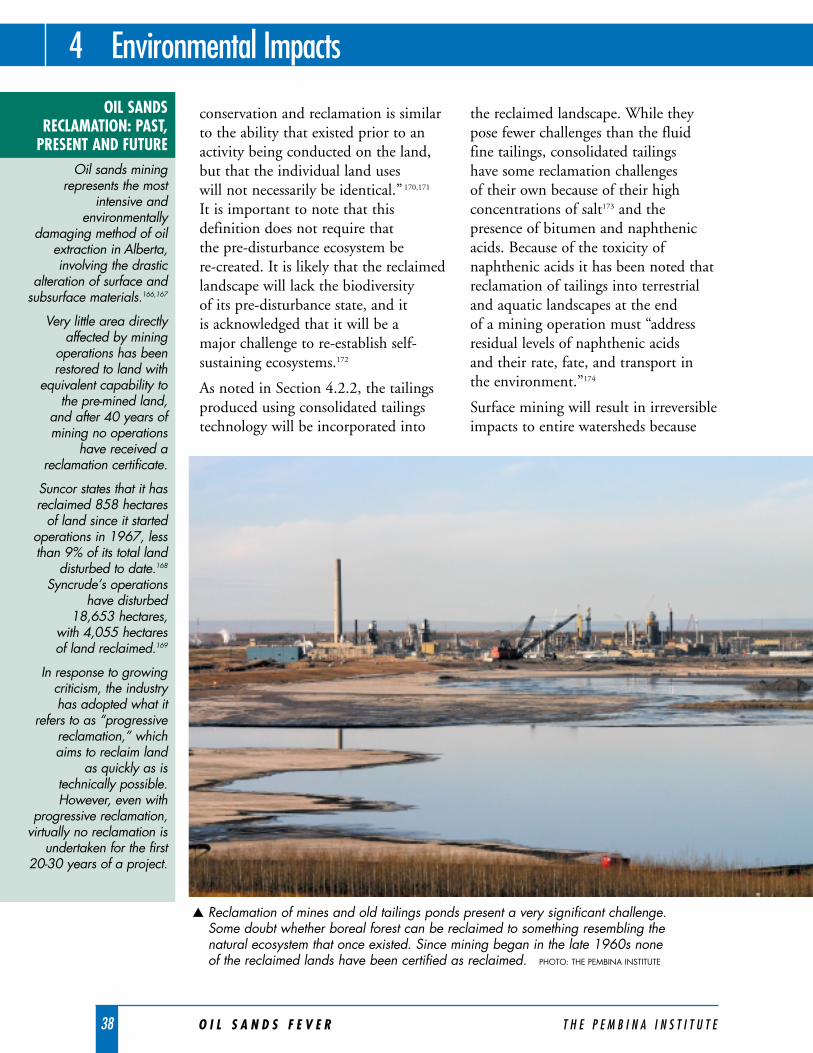
38 O I L S A N D S F E V E R T H E P E M B I N A I N S T I T U T E
conservation and reclamation is similarto the ability that existed prior to anactivity being conducted on the land,but that the individual land uses will not necessarily be identical.” 170,171
It is important to note that thisdefinition does not require that the pre-disturbance ecosystem be re-created. It is likely that the reclaimedlandscape will lack the biodiversity of its pre-disturbance state, and it is acknowledged that it will be a major challenge to re-establish self-sustaining ecosystems.172
As noted in Section 4.2.2, the tailingsproduced using consolidated tailingstechnology will be incorporated into
the reclaimed landscape. While theypose fewer challenges than the fluidfine tailings, consolidated tailings have some reclamation challenges of their own because of their highconcentrations of salt173 and thepresence of bitumen and naphthenicacids. Because of the toxicity ofnaphthenic acids it has been noted thatreclamation of tailings into terrestrialand aquatic landscapes at the end of a mining operation must “addressresidual levels of naphthenic acids and their rate, fate, and transport inthe environment.”174
Surface mining will result in irreversibleimpacts to entire watersheds because
4 Environmental Impacts
OIL SANDSRECLAMATION: PAST,
PRESENT AND FUTUREOil sands mining
represents the mostintensive and
environmentallydamaging method of oil
extraction in Alberta,involving the drastic
alteration of surface andsubsurface materials.166,167
Very little area directlyaffected by mining
operations has beenrestored to land with
equivalent capability tothe pre-mined land,
and after 40 years ofmining no operations
have received areclamation certificate.
Suncor states that it hasreclaimed 858 hectares
of land since it startedoperations in 1967, lessthan 9% of its total land
disturbed to date.168
Syncrude’s operationshave disturbed
18,653 hectares, with 4,055 hectares of land reclaimed.169
In response to growingcriticism, the industry has adopted what it
refers to as “progressivereclamation,” which aims to reclaim land
as quickly as istechnically possible.However, even with
progressive reclamation,virtually no reclamation is
undertaken for the first20-30 years of a project.
▲ Reclamation of mines and old tailings ponds present a very significant challenge. Some doubt whether boreal forest can be reclaimed to something resembling the natural ecosystem that once existed. Since mining began in the late 1960s none of the reclaimed lands have been certified as reclaimed. PHOTO: THE PEMBINA INSTITUTE
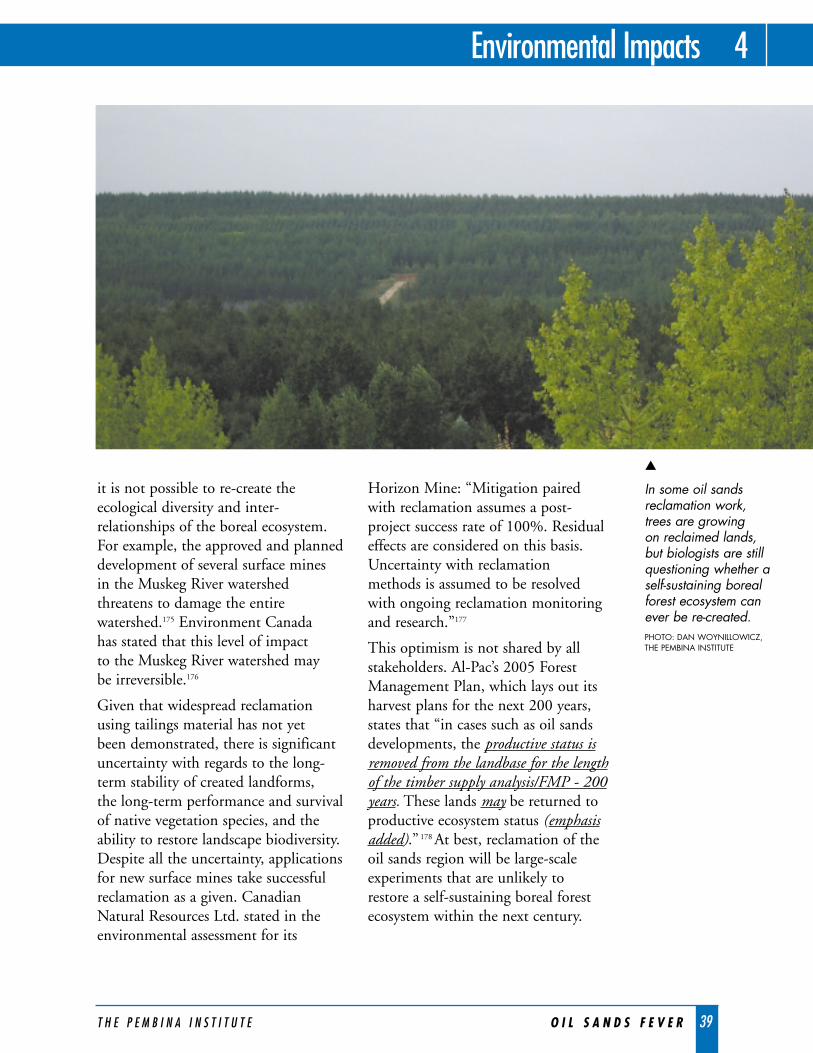
T H E P E M B I N A I N S T I T U T E O I L S A N D S F E V E R 39
Environmental Impacts 4
it is not possible to re-create theecological diversity and inter-relationships of the boreal ecosystem.For example, the approved and planneddevelopment of several surface mines in the Muskeg River watershedthreatens to damage the entirewatershed.175 Environment Canada has stated that this level of impact to the Muskeg River watershed may be irreversible.176
Given that widespread reclamationusing tailings material has not yet been demonstrated, there is significantuncertainty with regards to the long-term stability of created landforms, the long-term performance and survivalof native vegetation species, and theability to restore landscape biodiversity.Despite all the uncertainty, applicationsfor new surface mines take successfulreclamation as a given. CanadianNatural Resources Ltd. stated in theenvironmental assessment for its
Horizon Mine: “Mitigation paired with reclamation assumes a post-project success rate of 100%. Residualeffects are considered on this basis.Uncertainty with reclamation methods is assumed to be resolved with ongoing reclamation monitoringand research.”177
This optimism is not shared by allstakeholders. Al-Pac’s 2005 ForestManagement Plan, which lays out itsharvest plans for the next 200 years,states that “in cases such as oil sandsdevelopments, the productive status isremoved from the landbase for the lengthof the timber supply analysis/FMP - 200years. These lands may be returned toproductive ecosystem status (emphasisadded).” 178 At best, reclamation of theoil sands region will be large-scaleexperiments that are unlikely to restore a self-sustaining boreal forestecosystem within the next century.
▲
In some oil sandsreclamation work, trees are growing on reclaimed lands, but biologists are stillquestioning whether aself-sustaining borealforest ecosystem canever be re-created.PHOTO: DAN WOYNILLOWICZ, THE PEMBINA INSTITUTE
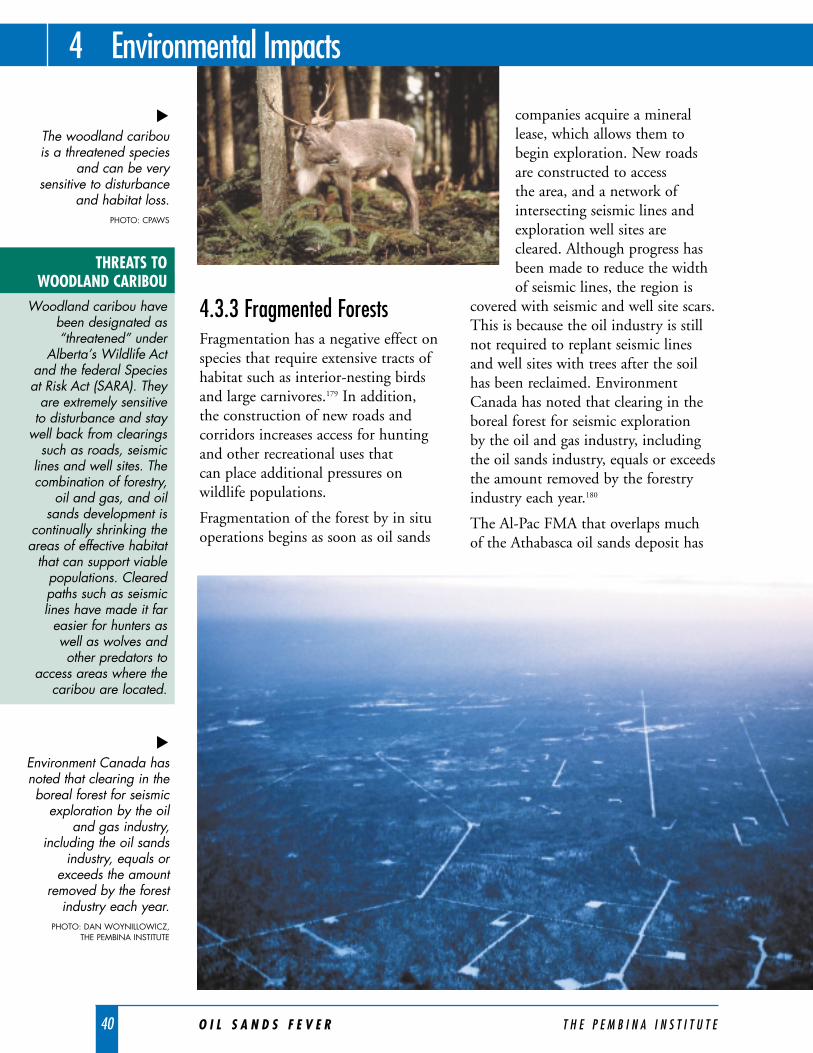
4.3.3 Fragmented ForestsFragmentation has a negative effect onspecies that require extensive tracts ofhabitat such as interior-nesting birdsand large carnivores.179 In addition, the construction of new roads andcorridors increases access for huntingand other recreational uses that can place additional pressures onwildlife populations.
Fragmentation of the forest by in situoperations begins as soon as oil sands
companies acquire a minerallease, which allows them tobegin exploration. New roadsare constructed to access the area, and a network ofintersecting seismic lines andexploration well sites arecleared. Although progress hasbeen made to reduce the widthof seismic lines, the region is
covered with seismic and well site scars.This is because the oil industry is stillnot required to replant seismic linesand well sites with trees after the soilhas been reclaimed. EnvironmentCanada has noted that clearing in theboreal forest for seismic exploration by the oil and gas industry, includingthe oil sands industry, equals or exceedsthe amount removed by the forestryindustry each year.180
The Al-Pac FMA that overlaps much of the Athabasca oil sands deposit has
40 O I L S A N D S F E V E R T H E P E M B I N A I N S T I T U T E
4 Environmental Impacts
THREATS TOWOODLAND CARIBOU
Woodland caribou havebeen designated as“threatened” under
Alberta’s Wildlife Actand the federal Speciesat Risk Act (SARA). They
are extremely sensitiveto disturbance and stay
well back from clearingssuch as roads, seismic
lines and well sites. Thecombination of forestry,
oil and gas, and oilsands development is
continually shrinking theareas of effective habitat
that can support viablepopulations. Clearedpaths such as seismiclines have made it far
easier for hunters aswell as wolves andother predators to
access areas where thecaribou are located.
Environment Canada hasnoted that clearing in theboreal forest for seismic
exploration by the oiland gas industry,
including the oil sandsindustry, equals or
exceeds the amountremoved by the forest
industry each year.PHOTO: DAN WOYNILLOWICZ,
THE PEMBINA INSTITUTE
▲
The woodland caribou is a threatened species
and can be verysensitive to disturbance
and habitat loss.PHOTO: CPAWS
▲
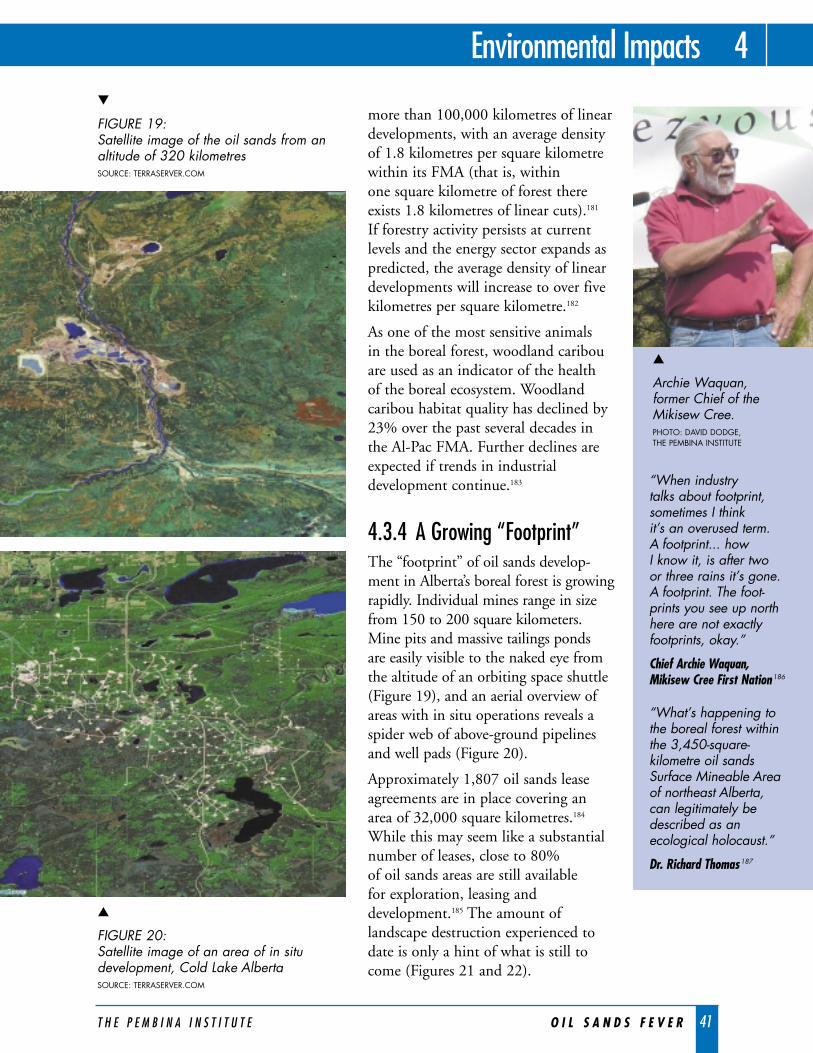
T H E P E M B I N A I N S T I T U T E O I L S A N D S F E V E R 41
Environmental Impacts 4
more than 100,000 kilometres of lineardevelopments, with an average densityof 1.8 kilometres per square kilometrewithin its FMA (that is, within one square kilometre of forest thereexists 1.8 kilometres of linear cuts).181
If forestry activity persists at currentlevels and the energy sector expands aspredicted, the average density of lineardevelopments will increase to over fivekilometres per square kilometre.182
As one of the most sensitive animals in the boreal forest, woodland caribouare used as an indicator of the health of the boreal ecosystem. Woodlandcaribou habitat quality has declined by23% over the past several decades inthe Al-Pac FMA. Further declines areexpected if trends in industrialdevelopment continue.183
4.3.4 A Growing “Footprint”The “footprint” of oil sands develop-ment in Alberta’s boreal forest is growingrapidly. Individual mines range in sizefrom 150 to 200 square kilometers.Mine pits and massive tailings ponds are easily visible to the naked eye fromthe altitude of an orbiting space shuttle(Figure 19), and an aerial overview ofareas with in situ operations reveals aspider web of above-ground pipelinesand well pads (Figure 20).
Approximately 1,807 oil sands leaseagreements are in place covering anarea of 32,000 square kilometres.184
While this may seem like a substantialnumber of leases, close to 80% of oil sands areas are still available for exploration, leasing anddevelopment.185 The amount oflandscape destruction experienced todate is only a hint of what is still tocome (Figures 21 and 22).
“When industry talks about footprint,sometimes I think it’s an overused term. A footprint... how I know it, is after two or three rains it’s gone.A footprint. The foot-prints you see up northhere are not exactlyfootprints, okay.”
Chief Archie Waquan,Mikisew Cree First Nation186
“What’s happening tothe boreal forest withinthe 3,450-square-kilometre oil sandsSurface Mineable Areaof northeast Alberta, can legitimately bedescribed as anecological holocaust.”
Dr. Richard Thomas187
▲
Archie Waquan, former Chief of theMikisew Cree.PHOTO: DAVID DODGE, THE PEMBINA INSTITUTE
▲
FIGURE 20: Satellite image of an area of in situdevelopment, Cold Lake AlbertaSOURCE: TERRASERVER.COM
▼
FIGURE 19: Satellite image of the oil sands from analtitude of 320 kilometres SOURCE: TERRASERVER.COM
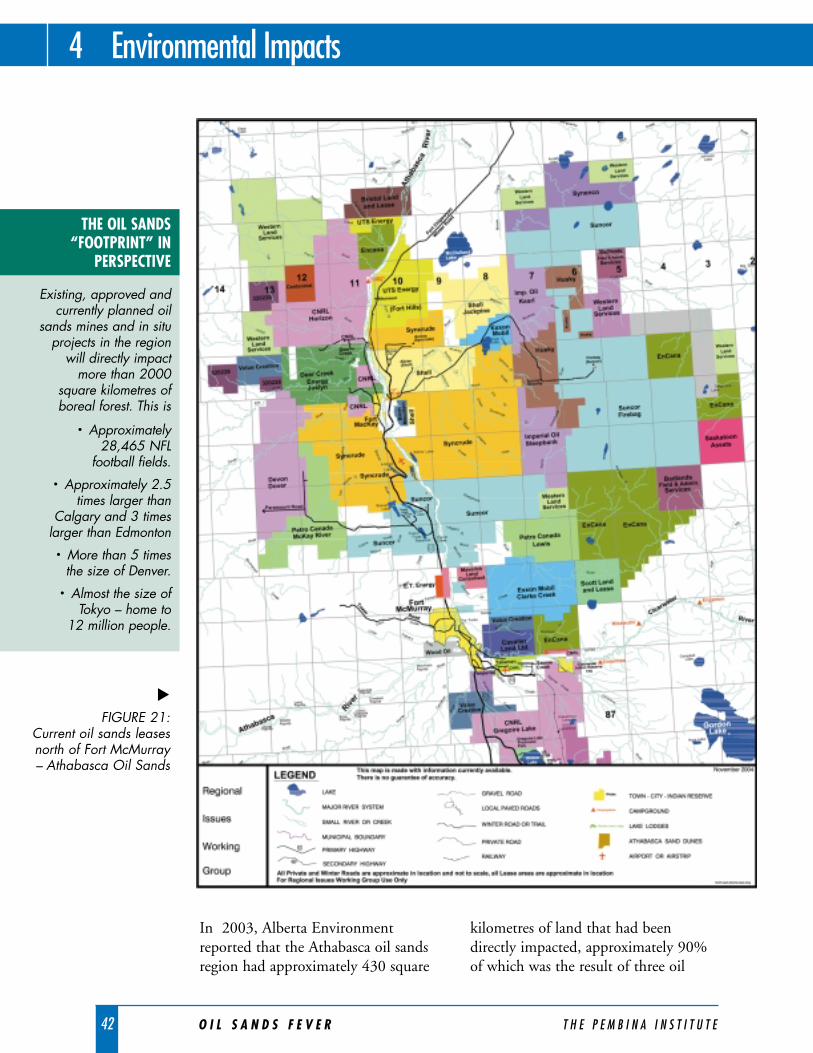
42 O I L S A N D S F E V E R T H E P E M B I N A I N S T I T U T E
In 2003, Alberta Environmentreported that the Athabasca oil sandsregion had approximately 430 square
kilometres of land that had beendirectly impacted, approximately 90%of which was the result of three oil
4 Environmental Impacts
FIGURE 21: Current oil sands leasesnorth of Fort McMurray– Athabasca Oil Sands
THE OIL SANDS“FOOTPRINT” IN
PERSPECTIVE
Existing, approved andcurrently planned oil
sands mines and in situprojects in the region
will directly impact more than 2000
square kilometres ofboreal forest. This is
• Approximately28,465 NFL
football fields.
• Approximately 2.5times larger than
Calgary and 3 timeslarger than Edmonton
• More than 5 timesthe size of Denver.
• Almost the size ofTokyo – home to
12 million people.
▲
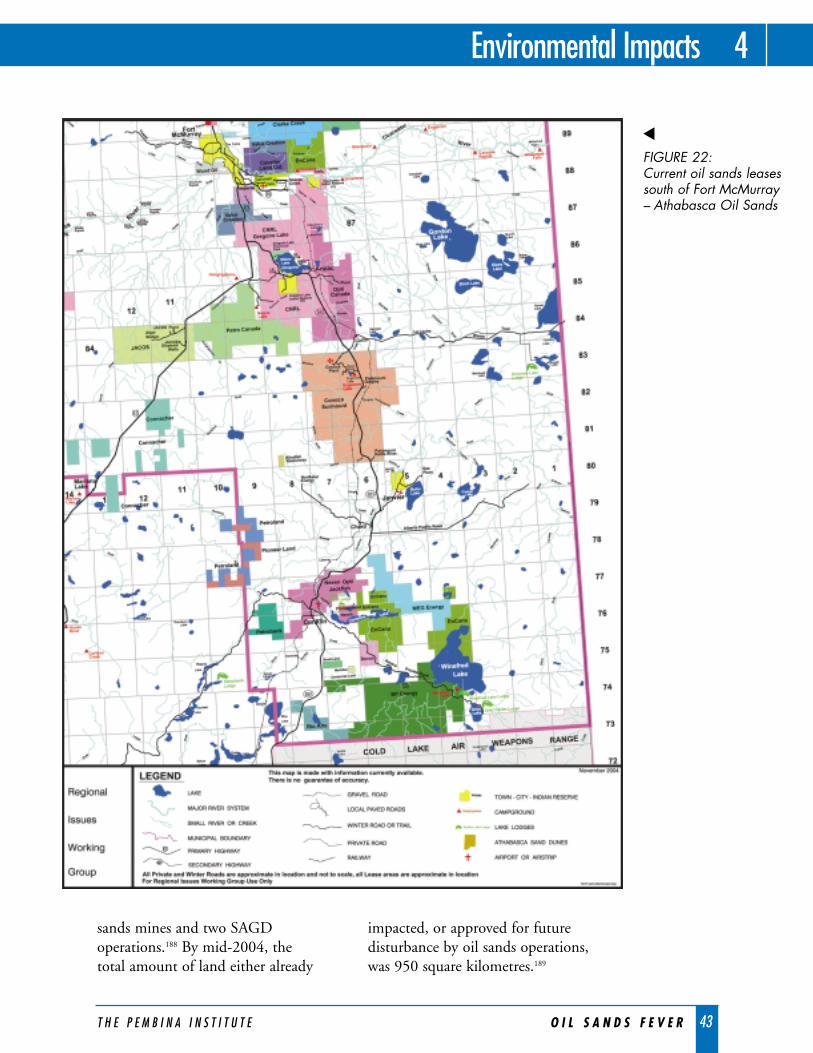
T H E P E M B I N A I N S T I T U T E O I L S A N D S F E V E R 43
Environmental Impacts 4
sands mines and two SAGDoperations.188 By mid-2004, the total amount of land either already
impacted, or approved for futuredisturbance by oil sands operations,was 950 square kilometres.189
FIGURE 22: Current oil sands leasessouth of Fort McMurray– Athabasca Oil Sands
▲
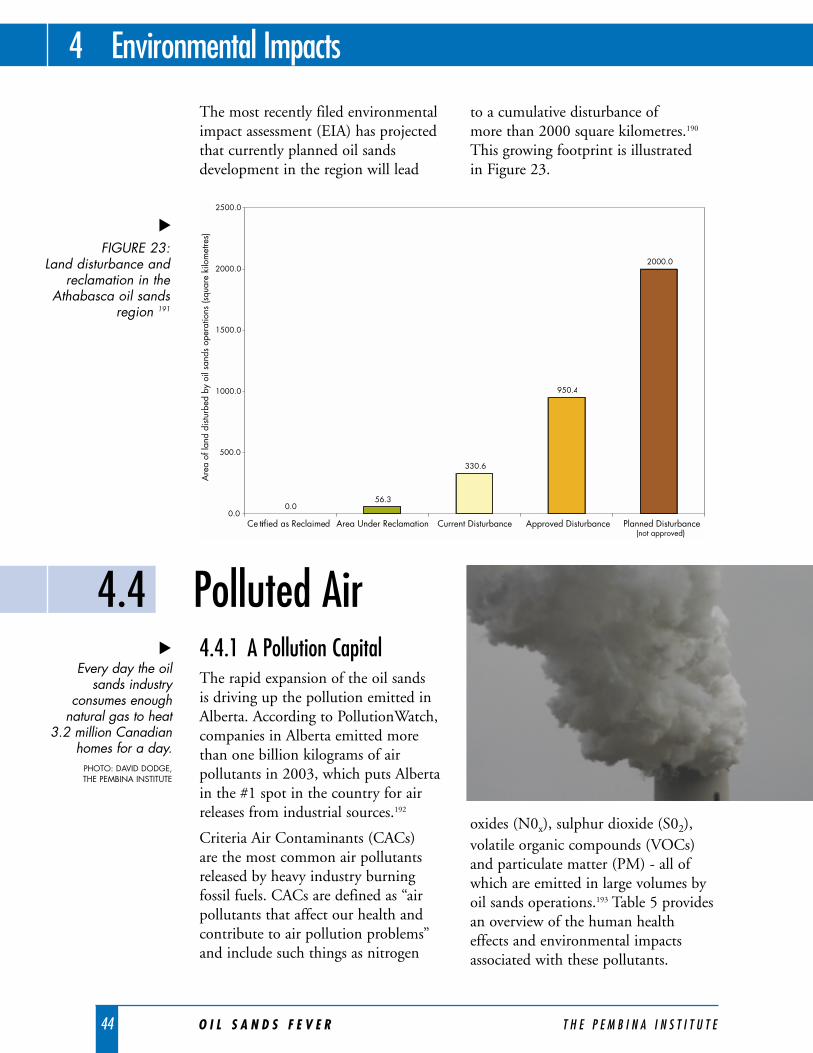
44 O I L S A N D S F E V E R T H E P E M B I N A I N S T I T U T E
4.4 Polluted Air
The most recently filed environmentalimpact assessment (EIA) has projectedthat currently planned oil sandsdevelopment in the region will lead
to a cumulative disturbance of more than 2000 square kilometres.190
This growing footprint is illustrated in Figure 23.
4 Environmental Impacts
0.056.3
330.6
950.4
2000.0
0.0
500.0
1000.0
1500.0
2000.0
2500.0
Ce rtified as Reclaimed Area Under Reclamation Current Disturbance Approved Disturbance Planned Disturbance (not approved)
Are
a of
land
dis
turb
ed b
y oi
l san
ds o
pera
tions
(squ
are
kilo
met
res)
4.4.1 A Pollution CapitalThe rapid expansion of the oil sands is driving up the pollution emitted inAlberta. According to PollutionWatch,companies in Alberta emitted morethan one billion kilograms of airpollutants in 2003, which puts Albertain the #1 spot in the country for airreleases from industrial sources.192
Criteria Air Contaminants (CACs) are the most common air pollutantsreleased by heavy industry burningfossil fuels. CACs are defined as “airpollutants that affect our health andcontribute to air pollution problems”and include such things as nitrogen
oxides (N0x), sulphur dioxide (S02),volatile organic compounds (VOCs)and particulate matter (PM) - all ofwhich are emitted in large volumes byoil sands operations.193 Table 5 providesan overview of the human healtheffects and environmental impactsassociated with these pollutants.
FIGURE 23: Land disturbance and
reclamation in theAthabasca oil sands
region 191
▲Every day the oil
sands industry consumes enough
natural gas to heat 3.2 million Canadian
homes for a day.PHOTO: DAVID DODGE, THE PEMBINA INSTITUTE
▲
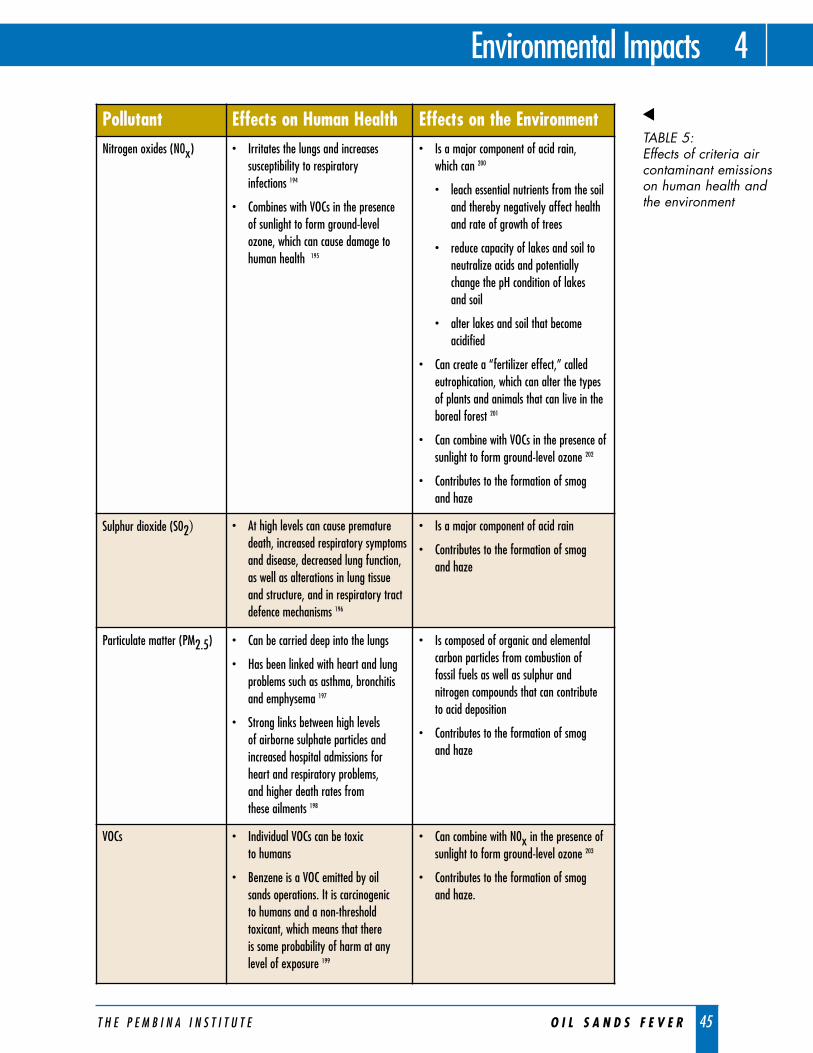
T H E P E M B I N A I N S T I T U T E O I L S A N D S F E V E R 45
Environmental Impacts 4
Pollutant Effects on Human Health Effects on the EnvironmentNitrogen oxides (N0x) • Irritates the lungs and increases
susceptibility to respiratory infections 194
• Combines with VOCs in the presence of sunlight to form ground-levelozone, which can cause damage tohuman health 195
• Is a major component of acid rain, which can 200
• leach essential nutrients from the soiland thereby negatively affect healthand rate of growth of trees
• reduce capacity of lakes and soil toneutralize acids and potentiallychange the pH condition of lakes and soil
• alter lakes and soil that becomeacidified
• Can create a “fertilizer effect,” calledeutrophication, which can alter the typesof plants and animals that can live in theboreal forest 201
• Can combine with VOCs in the presence ofsunlight to form ground-level ozone 202
• Contributes to the formation of smog and haze
Sulphur dioxide (S02) • At high levels can cause prematuredeath, increased respiratory symptomsand disease, decreased lung function,as well as alterations in lung tissueand structure, and in respiratory tractdefence mechanisms 196
• Is a major component of acid rain
• Contributes to the formation of smog and haze
Particulate matter (PM2.5) • Can be carried deep into the lungs
• Has been linked with heart and lungproblems such as asthma, bronchitisand emphysema 197
• Strong links between high levels of airborne sulphate particles andincreased hospital admissions forheart and respiratory problems, and higher death rates from these ailments 198
• Is composed of organic and elementalcarbon particles from combustion of fossil fuels as well as sulphur andnitrogen compounds that can contribute to acid deposition
• Contributes to the formation of smog and haze
VOCs • Individual VOCs can be toxic to humans
• Benzene is a VOC emitted by oil sands operations. It is carcinogenic to humans and a non-thresholdtoxicant, which means that there is some probability of harm at anylevel of exposure 199
• Can combine with N0x in the presence ofsunlight to form ground-level ozone 203
• Contributes to the formation of smog and haze.
TABLE 5: Effects of criteria aircontaminant emissionson human health andthe environment
▲
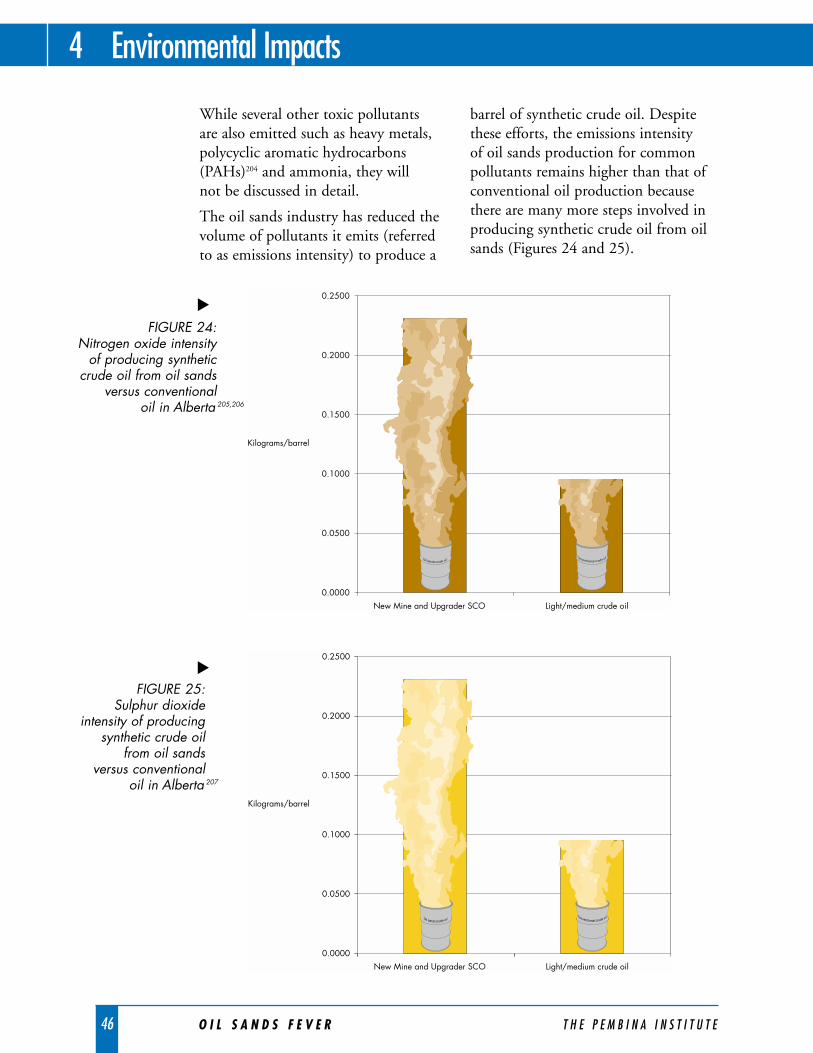
46 O I L S A N D S F E V E R T H E P E M B I N A I N S T I T U T E
While several other toxic pollutants are also emitted such as heavy metals,polycyclic aromatic hydrocarbons(PAHs)204 and ammonia, they will not be discussed in detail.
The oil sands industry has reduced thevolume of pollutants it emits (referredto as emissions intensity) to produce a
barrel of synthetic crude oil. Despitethese efforts, the emissions intensity of oil sands production for commonpollutants remains higher than that ofconventional oil production becausethere are many more steps involved inproducing synthetic crude oil from oilsands (Figures 24 and 25).
4 Environmental Impacts
0.0000
0.0500
0.1000
0.1500
0.2000
0.2500
New Mine and Upgrader SCO Light/medium crude oil
Kilograms/barrel
Conventional crude oilOil sands crude oil
0.0000
0.0500
0.1000
0.1500
0.2000
0.2500
New Mine and Upgrader SCO Light/medium crude oil
Kilograms/barrel
Conventional crude oilOil sands crude oil
FIGURE 24: Nitrogen oxide intensity
of producing syntheticcrude oil from oil sands
versus conventional oil in Alberta 205,206
FIGURE 25: Sulphur dioxide
intensity of producingsynthetic crude oil
from oil sands versus conventional
oil in Alberta 207
▲▲
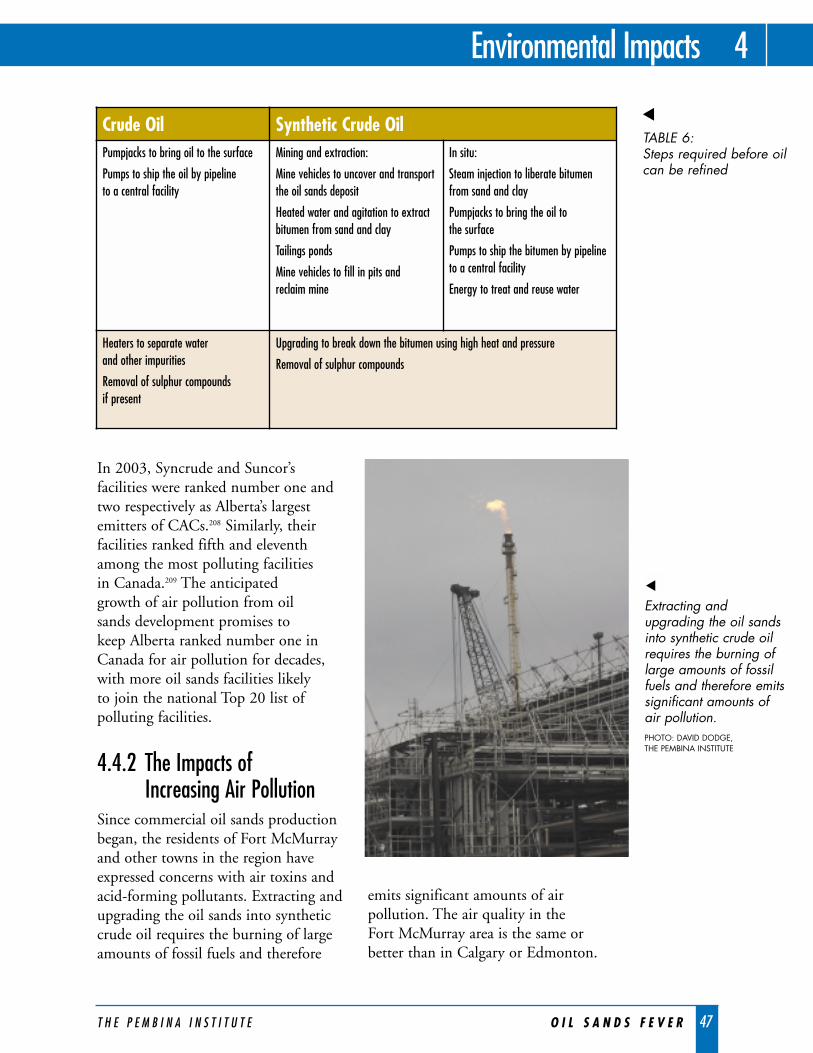
T H E P E M B I N A I N S T I T U T E O I L S A N D S F E V E R 47
Environmental Impacts 4
In 2003, Syncrude and Suncor’sfacilities were ranked number one andtwo respectively as Alberta’s largestemitters of CACs.208 Similarly, theirfacilities ranked fifth and eleventhamong the most polluting facilities in Canada.209 The anticipated growth of air pollution from oil sands development promises to keep Alberta ranked number one in Canada for air pollution for decades,with more oil sands facilities likely to join the national Top 20 list ofpolluting facilities.
4.4.2 The Impacts of Increasing Air Pollution
Since commercial oil sands productionbegan, the residents of Fort McMurrayand other towns in the region haveexpressed concerns with air toxins andacid-forming pollutants. Extracting andupgrading the oil sands into syntheticcrude oil requires the burning of largeamounts of fossil fuels and therefore
emits significant amounts of airpollution. The air quality in the Fort McMurray area is the same orbetter than in Calgary or Edmonton.
Crude Oil Synthetic Crude OilPumpjacks to bring oil to the surface
Pumps to ship the oil by pipeline to a central facility
Mining and extraction:
Mine vehicles to uncover and transportthe oil sands deposit
Heated water and agitation to extractbitumen from sand and clay
Tailings ponds
Mine vehicles to fill in pits and reclaim mine
In situ:
Steam injection to liberate bitumenfrom sand and clay
Pumpjacks to bring the oil to the surface
Pumps to ship the bitumen by pipelineto a central facility
Energy to treat and reuse water
Heaters to separate water and other impurities
Removal of sulphur compounds if present
Upgrading to break down the bitumen using high heat and pressure
Removal of sulphur compounds
TABLE 6: Steps required before oilcan be refined
▲
Extracting andupgrading the oil sandsinto synthetic crude oilrequires the burning oflarge amounts of fossilfuels and therefore emitssignificant amounts ofair pollution.PHOTO: DAVID DODGE, THE PEMBINA INSTITUTE
▲
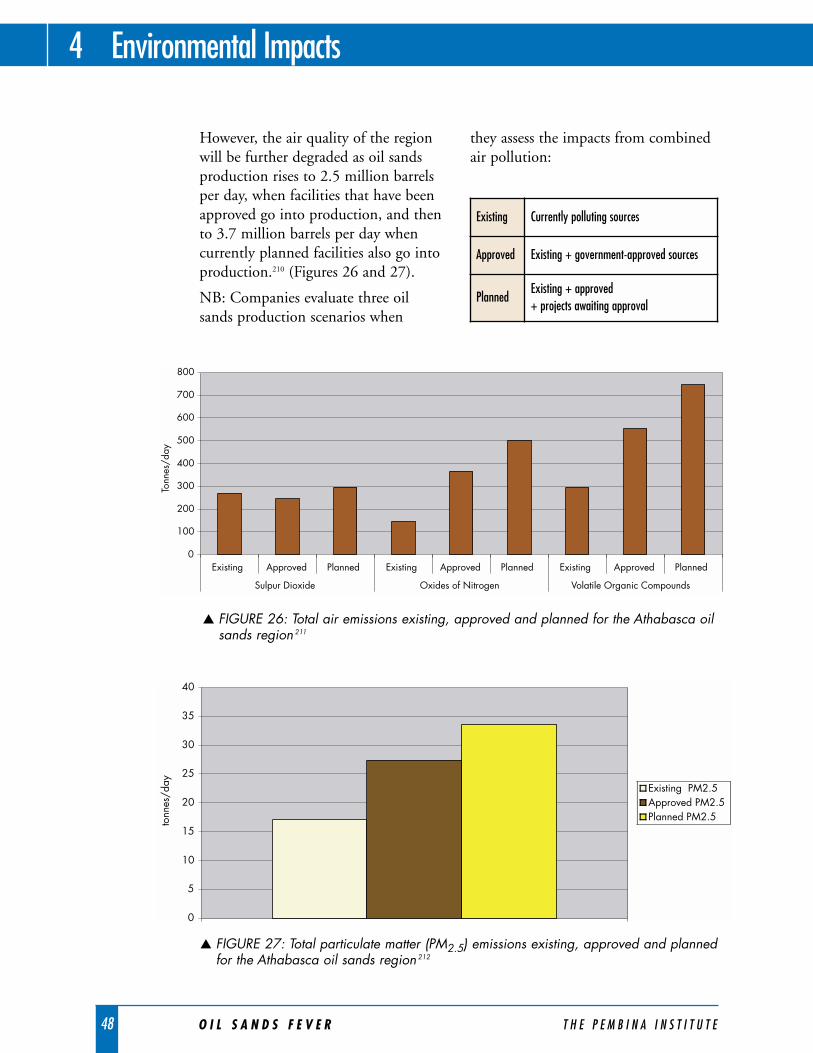
48 O I L S A N D S F E V E R T H E P E M B I N A I N S T I T U T E
However, the air quality of the regionwill be further degraded as oil sandsproduction rises to 2.5 million barrelsper day, when facilities that have beenapproved go into production, and thento 3.7 million barrels per day whencurrently planned facilities also go intoproduction.210 (Figures 26 and 27).
NB: Companies evaluate three oilsands production scenarios when
they assess the impacts from combinedair pollution:
4 Environmental Impacts
0
5
10
15
20
25
30
35
40
tonn
es/d
ay Existing PM2.5Approved PM2.5Planned PM2.5
0
100
200
300
400
500
600
700
800
Existing Approved Planned Existing Approved Planned Existing Approved Planned
Sulpur Dioxide Oxides of Nitrogen Volatile Organic Compounds
Tonn
es/d
ay
Existing Currently polluting sources
Approved Existing + government-approved sources
PlannedExisting + approved + projects awaiting approval
▲ FIGURE 26: Total air emissions existing, approved and planned for the Athabasca oilsands region 211
▲ FIGURE 27: Total particulate matter (PM2.5) emissions existing, approved and plannedfor the Athabasca oil sands region 212
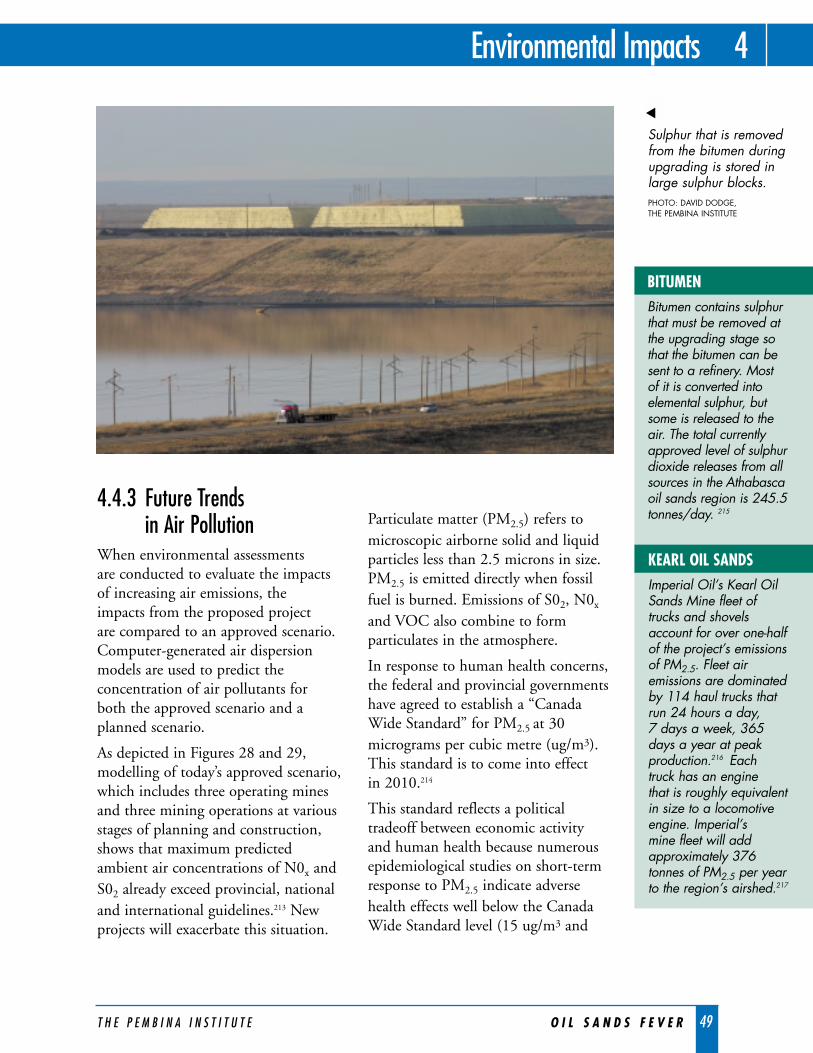
4.4.3 Future Trends in Air Pollution
When environmental assessments are conducted to evaluate the impactsof increasing air emissions, the impacts from the proposed project are compared to an approved scenario.Computer-generated air dispersionmodels are used to predict theconcentration of air pollutants for both the approved scenario and aplanned scenario.
As depicted in Figures 28 and 29,modelling of today’s approved scenario,which includes three operating minesand three mining operations at variousstages of planning and construction,shows that maximum predictedambient air concentrations of N0x andS02 already exceed provincial, nationaland international guidelines.213 Newprojects will exacerbate this situation.
Particulate matter (PM2.5) refers tomicroscopic airborne solid and liquidparticles less than 2.5 microns in size.PM2.5 is emitted directly when fossilfuel is burned. Emissions of S02, N0x
and VOC also combine to formparticulates in the atmosphere.
In response to human health concerns,the federal and provincial governmentshave agreed to establish a “CanadaWide Standard” for PM2.5 at 30micrograms per cubic metre (ug/m3).This standard is to come into effect in 2010.214
This standard reflects a politicaltradeoff between economic activity and human health because numerousepidemiological studies on short-termresponse to PM2.5 indicate adversehealth effects well below the CanadaWide Standard level (15 ug/m3 and
T H E P E M B I N A I N S T I T U T E O I L S A N D S F E V E R 49
Environmental Impacts 4
Sulphur that is removedfrom the bitumen duringupgrading is stored inlarge sulphur blocks.PHOTO: DAVID DODGE, THE PEMBINA INSTITUTE
BITUMENBitumen contains sulphurthat must be removed atthe upgrading stage sothat the bitumen can besent to a refinery. Most of it is converted intoelemental sulphur, butsome is released to theair. The total currentlyapproved level of sulphurdioxide releases from allsources in the Athabascaoil sands region is 245.5tonnes/day. 215
KEARL OIL SANDSImperial Oil’s Kearl OilSands Mine fleet oftrucks and shovelsaccount for over one-halfof the project’s emissionsof PM2.5. Fleet airemissions are dominatedby 114 haul trucks thatrun 24 hours a day, 7 days a week, 365days a year at peakproduction.216 Each truck has an engine that is roughly equivalentin size to a locomotiveengine. Imperial’s mine fleet will addapproximately 376tonnes of PM2.5 per yearto the region’s airshed.217
▲
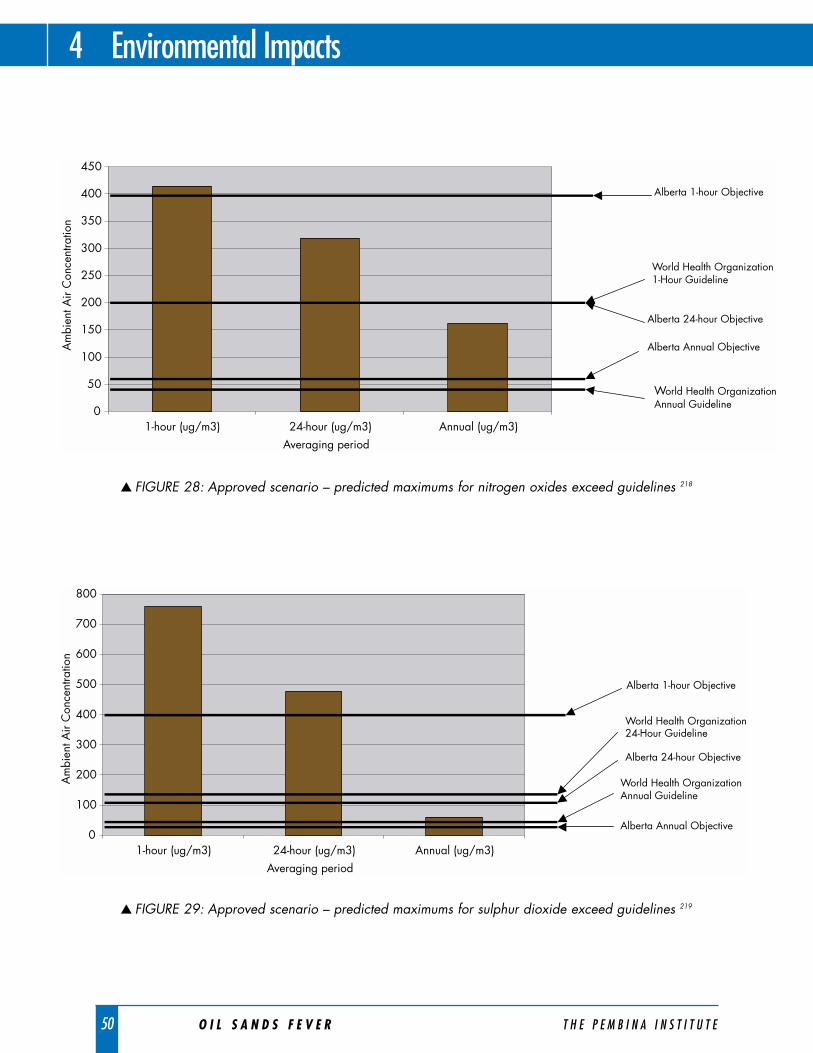
50 O I L S A N D S F E V E R T H E P E M B I N A I N S T I T U T E
4 Environmental Impacts
0
100
200
300
400
500
600
700
800
1-hour (ug/m3) 24-hour (ug/m3) Annual (ug/m3)Averaging period
World Health OrganizationAnnual Guideline
Alberta Annual Objective
Alberta 24-hour Objective
World Health Organization24-Hour Guideline
Alberta 1-hour Objective
Am
bien
t Air
Con
cent
ratio
n
0
50
100
150
200
250
300
350
400
450
1-hour (ug/m3) 24-hour (ug/m3) Annual (ug/m3)Averaging period
World Health OrganizationAnnual Guideline
Alberta Annual Objective
Alberta 24-hour Objective
World Health Organization1-Hour Guideline
Alberta 1-hour Objective
Am
bien
t Air
Con
cent
ratio
n
▲FIGURE 28: Approved scenario – predicted maximums for nitrogen oxides exceed guidelines 218
▲FIGURE 29: Approved scenario – predicted maximums for sulphur dioxide exceed guidelines 219
T H E P E M B I N A I N S T I T U T E O I L S A N D S F E V E R 51
Environmental Impacts 4
potentially lower).220 Recognizing thatthe 30 ug/m3 standard was inadequate,the Province has developed the Alberta Particulate Matter and Ozone Management Framework.221
This framework was designed toprevent degradation of air quality in areas that are below the CanadaWide Standard level.
Modelling of the approved scenarioshows that although PM2.5 levels arerising, all communities in the regionwould experience concentrations below the Canada Wide Standard.222
The planned scenario models predictfurther increases in PM2.5. This means that seven communities will be subjected to levels higher than theAlberta Particulate Matter and OzoneManagement Framework Level of 20 ug/m3 – the level that requiresAlberta Environment to implement amanagement plan to prevent furtherdegradation of air quality. 223,224
Emissions of VOCs are also on the rise because of both emissions fromburning fossil fuels (e.g., natural gas,diesel, coke) and the growing numberof tailings ponds. (VOCs are a largecategory of pollutants that share onecharacteristic – they evaporate orvolatilize into the air.) In 2002, Alberta was among the top four states and provinces in North Americafor emissions of VOC emissions.225
Currently operating and approved oilsands developments account for morethan 500 tonnes per day of VOCemissions.226 Once planned oil sandsdevelopment is considered, this total ispredicted to grow to more than 750tonnes per day.227
4.4.4 Acid RainWhen acid rain or particles fall onto the land, they are measured as thepotential acid input (PAI). Expressed in kiloequivalents per hectare per year(keq/ha/yr) 228 PAI is used to evaluatethe environmental impacts of acidifyingemissions (N0x and S02). Scientists canestimate how much acid the land canwithstand before the chemistry of itssoil begins to change, resulting inchanges to the types of plants and treesthat make up the ecosystem. Land withsensitive soils can absorb less acid thanland with non-sensitive soils. Thisamount of acid is referred to as theecosystem’s critical load.229
Critical loads have been determined for Alberta soils ranging from sensitive,to moderately sensitive, to notsensitive. If one were to assume thatthe entire area affected by emissionsfrom oil sands operations has non-sensitive soil, a very conservativeassumption, an area equivalent toalmost 500 square kilometres is at risk from the acidifying emissions of oil sands projects that are alreadyoperating or have been approved tooperate (Figure 30). This area willalmost double to 1000 squarekilometres in the planned scenario. 230
Water bodies are also at risk ofacidification in the Athabasca region. A 2004 study predicted that theacidifying emissions from planned oilsands development would result in theacidification of 25 lakes in the region.231
This study only analyzed the sensitivityof 6% of the lakes in the region so thistally may be underestimated.
BENZENEBenzene, one of theVOCs emitted by oilsands operations, hasbeen the target of asuccessful nation-widereduction campaign that started in 1995 inresponse to concernsabout the level of humanexposure. Actualreleases of benzene and concentrations of benzene in the airhave been reducedsignificantly, and thenational reduction efforthas now entered asecond phase.232
Meanwhile, benzenelevels in the air in Fort McMurray andsurrounding communitiesare rising in conjunctionwith rising VOCemissions in the oil sands.233
The massive tailingsponds account for thehigh VOC emissions inthe region. For exampleImperial Oil estimatesthat its tailings pond willaccount for about three-quarters of its total dailyrelease of 74.01 tonnesof VOCs.234
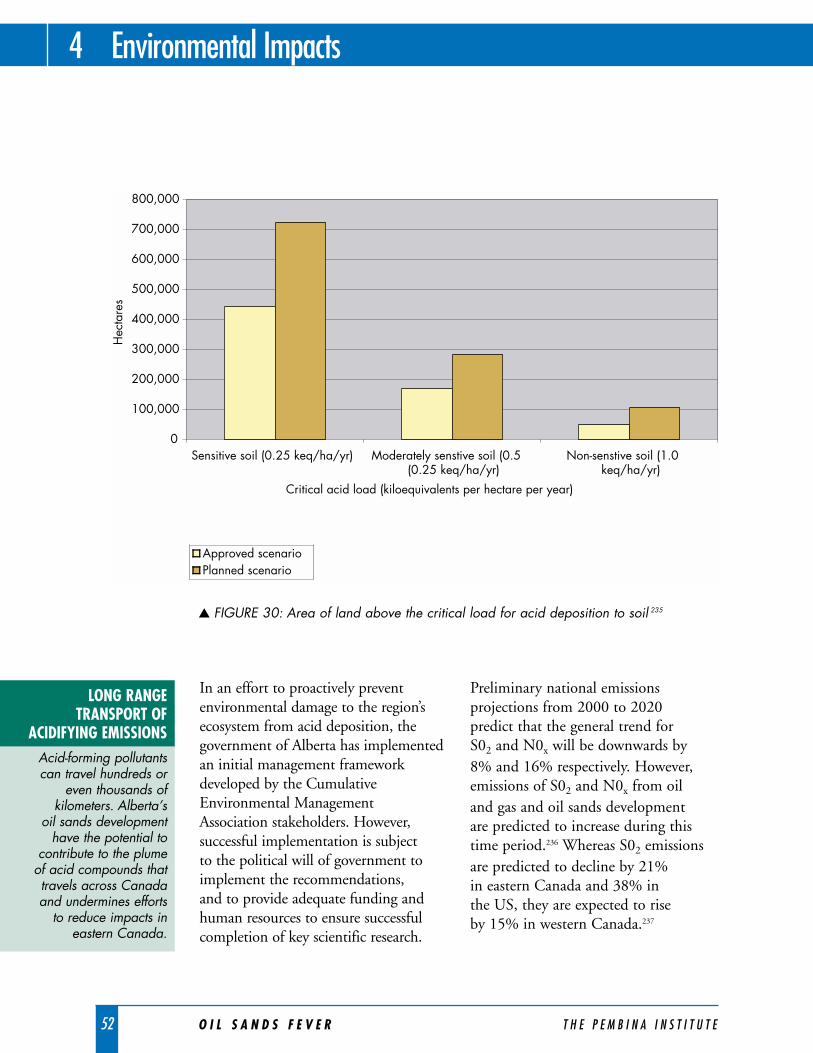
52 O I L S A N D S F E V E R T H E P E M B I N A I N S T I T U T E
In an effort to proactively preventenvironmental damage to the region’secosystem from acid deposition, thegovernment of Alberta has implementedan initial management frameworkdeveloped by the CumulativeEnvironmental ManagementAssociation stakeholders. However,successful implementation is subject to the political will of government toimplement the recommendations, and to provide adequate funding andhuman resources to ensure successfulcompletion of key scientific research.
Preliminary national emissionsprojections from 2000 to 2020 predict that the general trend for S02 and N0x will be downwards by 8% and 16% respectively. However,emissions of S02 and N0x from oil and gas and oil sands development are predicted to increase during thistime period.236 Whereas S02 emissionsare predicted to decline by 21% in eastern Canada and 38% in the US, they are expected to rise by 15% in western Canada.237
4 Environmental Impacts
0
100,000
200,000
300,000
400,000
500,000
600,000
700,000
800,000
Sensitive soil (0.25 keq/ha/yr) Moderately senstive soil (0.5(0.25 keq/ha/yr)
Non-senstive soil (1.0 keq/ha/yr)
Critical acid load (kiloequivalents per hectare per year)
Approved scenarioPlanned scenario
Hec
tare
s
▲ FIGURE 30: Area of land above the critical load for acid deposition to soil 235
LONG RANGETRANSPORT OF
ACIDIFYING EMISSIONS Acid-forming pollutantscan travel hundreds or
even thousands ofkilometers. Alberta’s
oil sands developmenthave the potential to
contribute to the plumeof acid compounds thattravels across Canadaand undermines efforts
to reduce impacts ineastern Canada.
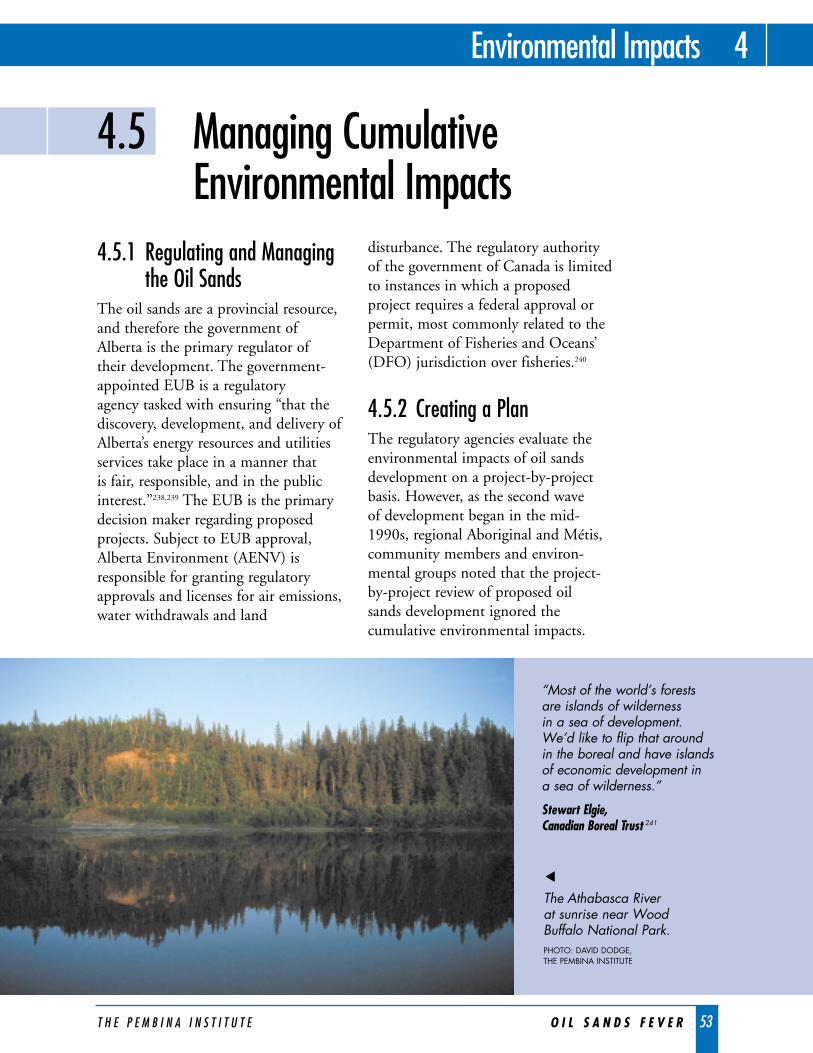
T H E P E M B I N A I N S T I T U T E O I L S A N D S F E V E R 53
Environmental Impacts 4
4.5.1 Regulating and Managing the Oil Sands
The oil sands are a provincial resource,and therefore the government ofAlberta is the primary regulator of their development. The government-appointed EUB is a regulatory agency tasked with ensuring “that thediscovery, development, and delivery ofAlberta’s energy resources and utilitiesservices take place in a manner that is fair, responsible, and in the publicinterest.”238,239 The EUB is the primarydecision maker regarding proposedprojects. Subject to EUB approval,Alberta Environment (AENV) isresponsible for granting regulatoryapprovals and licenses for air emissions,water withdrawals and land
disturbance. The regulatory authorityof the government of Canada is limitedto instances in which a proposedproject requires a federal approval orpermit, most commonly related to theDepartment of Fisheries and Oceans’(DFO) jurisdiction over fisheries.240
4.5.2 Creating a PlanThe regulatory agencies evaluate theenvironmental impacts of oil sandsdevelopment on a project-by-projectbasis. However, as the second wave of development began in the mid-1990s, regional Aboriginal and Métis,community members and environ-mental groups noted that the project-by-project review of proposed oil sands development ignored thecumulative environmental impacts.
4.5 Managing Cumulative Environmental Impacts
“Most of the world’s forestsare islands of wilderness in a sea of development.We’d like to flip that aroundin the boreal and have islandsof economic development in a sea of wilderness.”
Stewart Elgie, Canadian Boreal Trust 241
The Athabasca River at sunrise near WoodBuffalo National Park.PHOTO: DAVID DODGE, THE PEMBINA INSTITUTE
▲
54 O I L S A N D S F E V E R T H E P E M B I N A I N S T I T U T E
Rather than altering its regulatoryapproach, in 1999 the government ofAlberta crafted a Regional SustainableDevelopment Strategy (RSDS) for the Athabasca Oil Sands in recognitionof “The unprecedented pace ofdevelopment in the Athabasca OilSands Area” and the resultant“increased potential for effects onenvironmental quality, species diversityand abundance, and human health.”242
The purpose of the RSDS was todevelop a framework that would,among other things: “Create anenhanced management framework thatwill adapt to the changing needs of thearea, which will guide government’senvironmental and resource managers”and “Develop a strong foundation ofenvironmental information and scienceto assist in making decisions onsustainable resource and environmentalmanagement in the region.”243
4.5.3 Implementing the PlanIn 2000, the CumulativeEnvironmental ManagementAssociation (CEMA)244 was establishedto work with the Government ofAlberta to implement the RSDS bycollecting scientific information andmaking recommendations for how best to manage the cumulativeenvironmental impacts of industrialdevelopment in the region.245 In thehopes of replicating Alberta’s Clean Air Strategic Alliance (CASA)246 successin developing provincial air qualitymanagement systems for otherindustrial activities, CEMA wasestablished as a consensus-based,multistakeholder group comprised ofrepresentatives from the oil industry,
the governments of Alberta andCanada, Aboriginal and Métis groups,and environmental non-governmentalorganizations.247 The 72 environmentalissues identified in the RSDS wereprioritized, and it was anticipated thatthe highest priority issues (Category A)would be addressed within two years.
4.5.4 Slipping TimelinesIn 2001, the government of Albertareleased a progress report on the RSDS,in which it noted that, contrary to theRSDS plan that had stated thatmanagement objectives for category Athemes would be completed in twoyears, no management objectives hadbeen completed. This lack of progresswas linked to “the complexity of the environmental issues and theconsultative, interactive nature of thepartnership process, and the workgroup’s demand for a thoroughapproach make the strategy’s originaltargets unrealistic.”248 Further, thereport noted: “The effort required bythe working groups is very intensiveand necessitates individuals to committheir time over and above their regularwork activities.... This is compoundedby the increasing pace of developmentand large number of projects in the oilsands area that are often drawing onthe same consultants.”249
While all stakeholders have placedsignificant emphasis on the success ofCEMA, it has been far less effectivethan originally envisioned. Between2000 and the end of 2004, CEMA’sworking groups produced 52 reportsand four recommendations to thegovernment of Alberta, including one
4 Environmental Impacts
T H E P E M B I N A I N S T I T U T E O I L S A N D S F E V E R 55
Environmental Impacts 4
regional environmental managementframework.250 As demonstrated in Table 7, the timelines for CEMAdelivering management plans have beenconsistently delayed and may not becomplete before many more approvalsare granted for oil sands development.Given the importance and scope of conducting research to defineenvironmental thresholds and developregional environmental managementsystems, undertaking this work in parallel to ongoing oil sandsdevelopment is a challenge. The steadystream of applications for proposed oil sands projects submitted forregulatory and stakeholder reviewimposes a significant workload on
the government and Aboriginal and ENGO members of CEMA,competing for their time and resources.
Regulatory decision makers such as theEUB have acknowledged that CEMAhas not been keeping pace with the rateof oil sands development in the region.While the EUB has made recom-mendations to various provincial andfederal government agencies regardingtheir role in ensuring that CEMA iseffective and the RSDS is implemented,these agencies have done little inresponse. As a result, an ongoing lack of human resources and limitedgovernment leadership has hamperedCEMA’s ability to achieve its objectives.
“The [Energy and Utilities Board]Board notes that OSEC [the OilSands Environmental Coalition] hasrequested that the Board conduct apublic inquiry into the ecologicalcarrying capacity of the region. In this case, the Board believes thatas long as the various initiatives aremaking adequate progress such aninquiry is unnecessary. However, it is clearly possible for a number ofreasons that the proposed consensusbased processes may not be able tomove forward as quickly as needed.Accordingly, the Board has decidedto reserve its decision on OSEC’srequest for a Section 22 proceeding,and may reconsider this request atsome time in the future.” 251
Alberta Energy and Utilities Board, MuskegRiver Mine Decision Report, 1999
■
“In a series of decision in this area,the Board has placed significantreliance on the success of the CEMA
process to verify that both existingand future oil sands developmentsremain in the public interest. The Board believes that CEMA’swork is important and that the resultswill assist the Board in meeting itsregulatory mandate to ensure thatenergy developments are carried outin an orderly and efficient mannerthat protects the public interest. The Board understands that CEMAis dealing with complex and difficultissues within a multistakeholderforum. Nonetheless, it is concernedwith delays in the issuance ofrecommendations.” 252
Alberta Energy and Utilities Board, TrueNorth Fort Hills Mine Decision Report, 2002
■
“The [Joint Federal-ProvincialReview] Panel has concerns thatCEMA’s effectiveness may also be influenced by the volume andcomplexity of its work, multiplepriorities of stakeholders, and
funding mechanisms that may notkeep pace with CEMA’s increasedworkload from oil sands expansions,new oil sands mining and in situprojects, and other contributors ofregional cumulative effects” 253
Alberta Energy and Utilities Board, CNRLHorizon Mine Decision Report, 2004
■
“The [Joint Federal-ProvincialReview] Panel understands that there is good support in general for CEMA but widespread concernabout delays in delivery ofenvironmental managementobjectives and plans &The Panel has serious concerns about delays in the issuance of recommendationsand the ability of CEMA to meet the proposed timelines.” 254
Alberta Energy and Utilities Board, Shell Jackpine Mine – Phase 1 DecisionReport, 2004
LOTS OF TALK, LITTLE ACTION
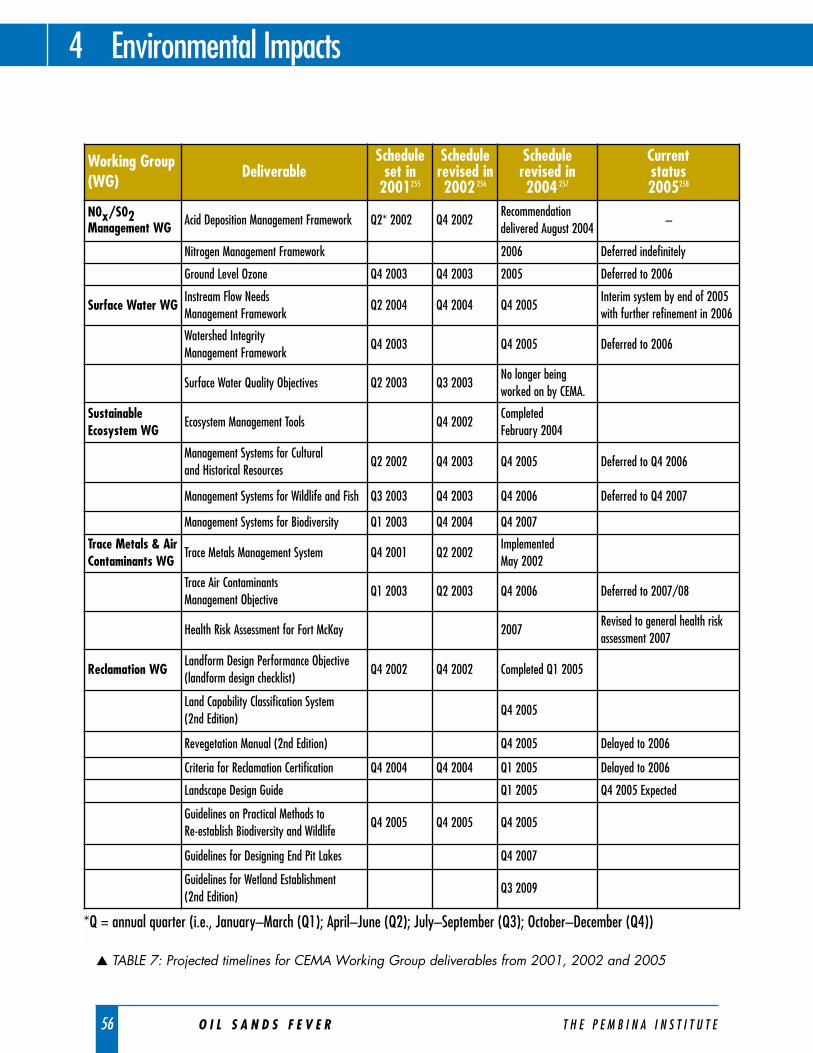
56 O I L S A N D S F E V E R T H E P E M B I N A I N S T I T U T E
4 Environmental Impacts
Working Group(WG)
DeliverableSchedule
set in2001255
Schedulerevised in2002 256
Schedulerevised in2004 257
Current status 2005258
N0x/S02Management WG Acid Deposition Management Framework Q2* 2002 Q4 2002
Recommendationdelivered August 2004
–
Nitrogen Management Framework 2006 Deferred indefinitely
Ground Level Ozone Q4 2003 Q4 2003 2005 Deferred to 2006
Surface Water WGInstream Flow Needs Management Framework
Q2 2004 Q4 2004 Q4 2005Interim system by end of 2005with further refinement in 2006
Watershed Integrity Management Framework
Q4 2003 Q4 2005 Deferred to 2006
Surface Water Quality Objectives Q2 2003 Q3 2003No longer beingworked on by CEMA.
SustainableEcosystem WG
Ecosystem Management Tools Q4 2002Completed February 2004
Management Systems for Cultural and Historical Resources
Q2 2002 Q4 2003 Q4 2005 Deferred to Q4 2006
Management Systems for Wildlife and Fish Q3 2003 Q4 2003 Q4 2006 Deferred to Q4 2007
Management Systems for Biodiversity Q1 2003 Q4 2004 Q4 2007
Trace Metals & AirContaminants WG
Trace Metals Management System Q4 2001 Q2 2002Implemented May 2002
Trace Air Contaminants Management Objective
Q1 2003 Q2 2003 Q4 2006 Deferred to 2007/08
Health Risk Assessment for Fort McKay 2007Revised to general health riskassessment 2007
Reclamation WGLandform Design Performance Objective(landform design checklist)
Q4 2002 Q4 2002 Completed Q1 2005
Land Capability Classification System (2nd Edition)
Q4 2005
Revegetation Manual (2nd Edition) Q4 2005 Delayed to 2006
Criteria for Reclamation Certification Q4 2004 Q4 2004 Q1 2005 Delayed to 2006
Landscape Design Guide Q1 2005 Q4 2005 Expected
Guidelines on Practical Methods to Re-establish Biodiversity and Wildlife
Q4 2005 Q4 2005 Q4 2005
Guidelines for Designing End Pit Lakes Q4 2007
Guidelines for Wetland Establishment (2nd Edition)
Q3 2009
▲ TABLE 7: Projected timelines for CEMA Working Group deliverables from 2001, 2002 and 2005
*Q = annual quarter (i.e., January–March (Q1); April–June (Q2); July–September (Q3); October–December (Q4))
T H E P E M B I N A I N S T I T U T E O I L S A N D S F E V E R 57
Environmental Impacts 4
In the rush to develop the oil sands,efforts to proactively manage thecumulative environmental impacts have proven inadequate. Neither thegovernment nor industry has placedenough priority on identifying theability of the regional environment to withstand impacts and developingplans to manage oil sands developmentwithin these constraints. As a result,numerous proposed oil sands projectsunder regulatory review will beconsidered without the extent ofscientific information and cumulativeimpact management systemsrecommended by the government’sown Regional SustainableDevelopment Strategy (RSDS).
While the members of CEMA remainsupportive of their role in advancingand developing regional environmentalmanagement systems, we believe anumber of changes are required toenable the organization’s success.
In addition, development should occur in a precautionary manner that continuously seeks to minimizeenvironmental impacts. This continuousimprovement can be driven by theestablishment of clear environmentalperformance targets to encourage the oil sands industry to dedicate itsconsiderable capacity for technologicalinnovation towards achieving areduction in environmental impacts.
4.6 Protecting the Environment
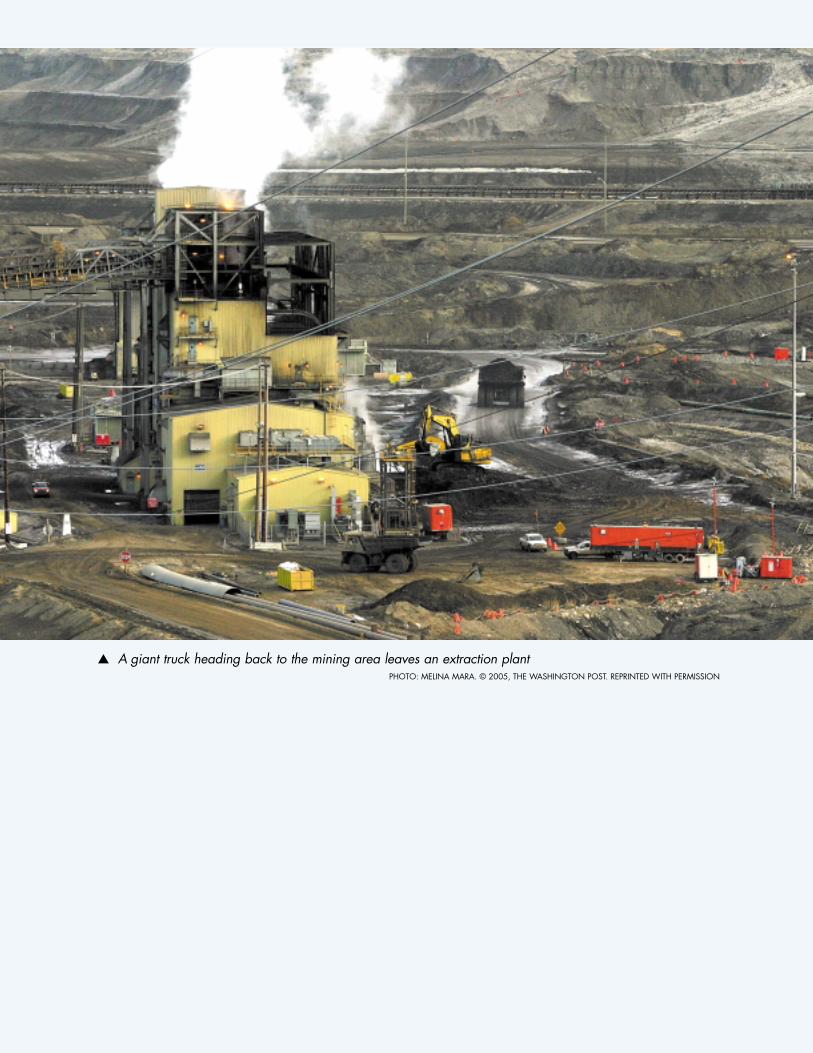
▲ A giant truck heading back to the mining area leaves an extraction plantPHOTO: MELINA MARA. © 2005, THE WASHINGTON POST. REPRINTED WITH PERMISSION
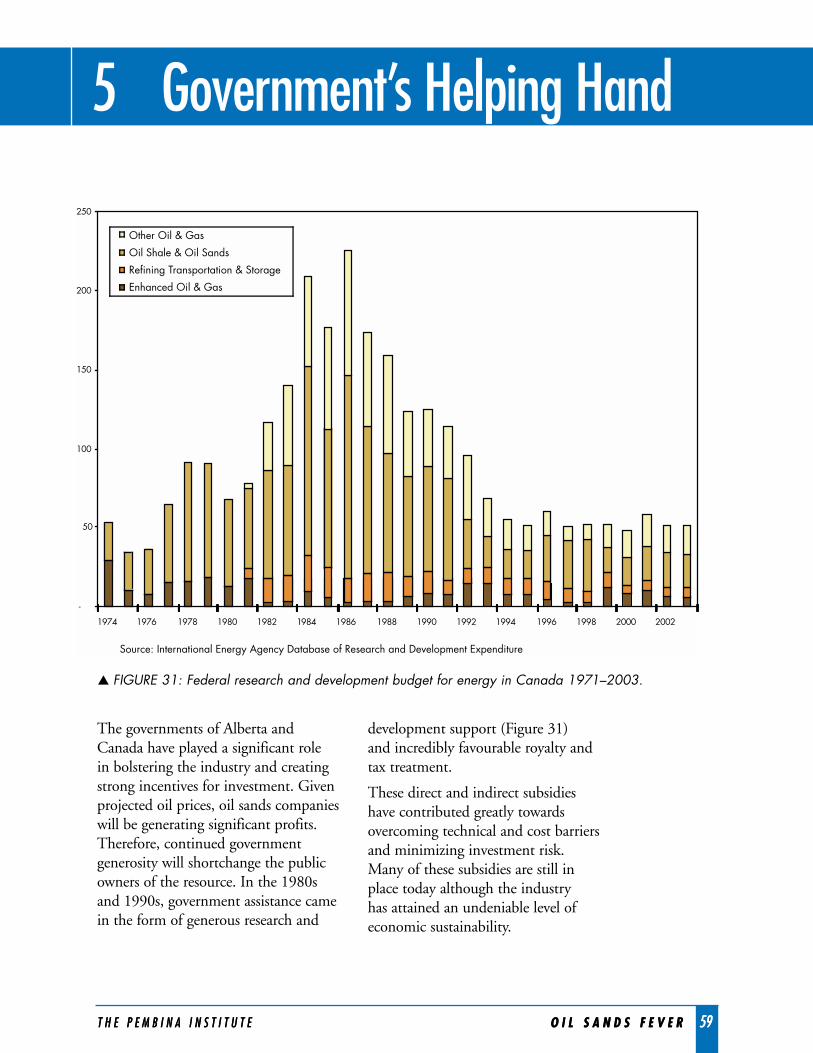
5 Government’s Helping Hand
T H E P E M B I N A I N S T I T U T E O I L S A N D S F E V E R 59
The governments of Alberta andCanada have played a significant role in bolstering the industry and creatingstrong incentives for investment. Givenprojected oil prices, oil sands companieswill be generating significant profits.Therefore, continued governmentgenerosity will shortchange the publicowners of the resource. In the 1980sand 1990s, government assistance camein the form of generous research and
development support (Figure 31) and incredibly favourable royalty andtax treatment.
These direct and indirect subsidies have contributed greatly towardsovercoming technical and cost barriersand minimizing investment risk. Many of these subsidies are still in place today although the industry has attained an undeniable level ofeconomic sustainability.
T H E P E M B I N A I N S T I T U T E O I L S A N D S F E V E R 59
-
50
100
150
200
250
1974 1976 1978 1980 1982 1984 1986 1988 1990 1992 1994 1996 1998 2000 2002
Other Oil & Gas
Oil Shale & Oil Sands
Refining Transportation & Storage
Enhanced Oil & Gas
Source: International Energy Agency Database of Research and Development Expenditure
▲ FIGURE 31: Federal research and development budget for energy in Canada 1971–2003.
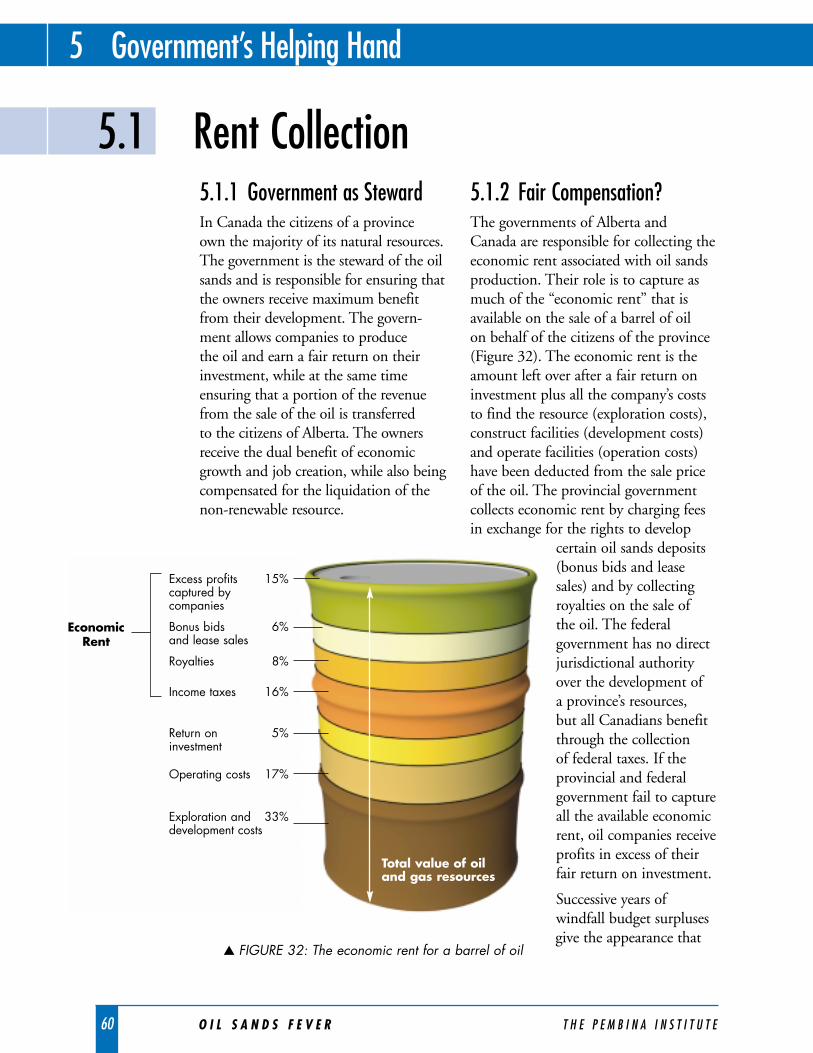
60 O I L S A N D S F E V E R T H E P E M B I N A I N S T I T U T E
5.1 Rent Collection5.1.1 Government as StewardIn Canada the citizens of a province own the majority of its natural resources.The government is the steward of the oilsands and is responsible for ensuring thatthe owners receive maximum benefitfrom their development. The govern-ment allows companies to produce the oil and earn a fair return on theirinvestment, while at the same timeensuring that a portion of the revenuefrom the sale of the oil is transferred to the citizens of Alberta. The ownersreceive the dual benefit of economicgrowth and job creation, while also beingcompensated for the liquidation of thenon-renewable resource.
5.1.2 Fair Compensation?The governments of Alberta andCanada are responsible for collecting theeconomic rent associated with oil sandsproduction. Their role is to capture asmuch of the “economic rent” that isavailable on the sale of a barrel of oil on behalf of the citizens of the province(Figure 32). The economic rent is theamount left over after a fair return oninvestment plus all the company’s coststo find the resource (exploration costs),construct facilities (development costs)and operate facilities (operation costs)have been deducted from the sale priceof the oil. The provincial governmentcollects economic rent by charging feesin exchange for the rights to develop
certain oil sands deposits(bonus bids and leasesales) and by collectingroyalties on the sale of the oil. The federalgovernment has no directjurisdictional authorityover the development of a province’s resources, but all Canadians benefitthrough the collection of federal taxes. If theprovincial and federalgovernment fail to captureall the available economicrent, oil companies receiveprofits in excess of theirfair return on investment.
Successive years ofwindfall budget surplusesgive the appearance that
5 Government’s Helping Hand
▲ FIGURE 32: The economic rent for a barrel of oil
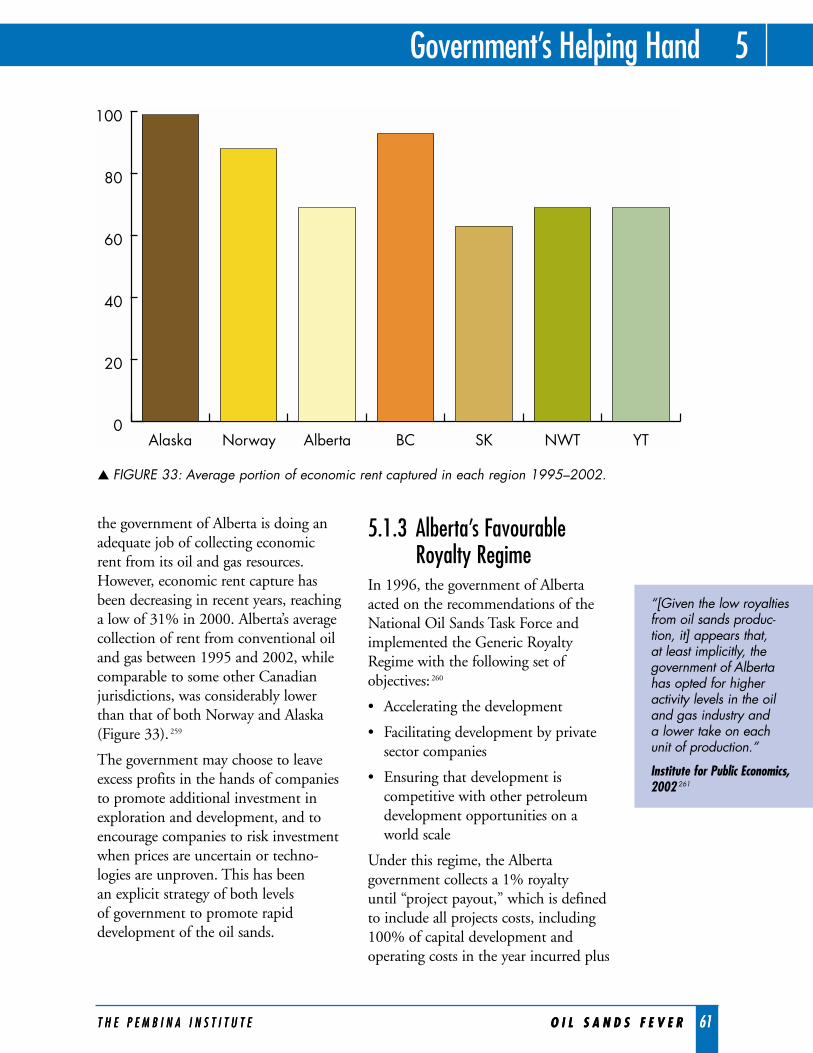
T H E P E M B I N A I N S T I T U T E O I L S A N D S F E V E R 61
Government’s Helping Hand 5
the government of Alberta is doing anadequate job of collecting economic rent from its oil and gas resources.However, economic rent capture hasbeen decreasing in recent years, reachinga low of 31% in 2000. Alberta’s averagecollection of rent from conventional oiland gas between 1995 and 2002, whilecomparable to some other Canadianjurisdictions, was considerably lowerthan that of both Norway and Alaska(Figure 33). 259
The government may choose to leaveexcess profits in the hands of companiesto promote additional investment inexploration and development, and toencourage companies to risk investmentwhen prices are uncertain or techno-logies are unproven. This has been an explicit strategy of both levels of government to promote rapiddevelopment of the oil sands.
5.1.3 Alberta’s Favourable Royalty Regime
In 1996, the government of Albertaacted on the recommendations of theNational Oil Sands Task Force andimplemented the Generic RoyaltyRegime with the following set ofobjectives: 260
• Accelerating the development
• Facilitating development by privatesector companies
• Ensuring that development iscompetitive with other petroleumdevelopment opportunities on aworld scale
Under this regime, the Albertagovernment collects a 1% royalty until “project payout,” which is definedto include all projects costs, including100% of capital development andoperating costs in the year incurred plus
T H E P E M B I N A I N S T I T U T E O I L S A N D S F E V E R 61
“[Given the low royaltiesfrom oil sands produc-tion, it] appears that, at least implicitly, thegovernment of Albertahas opted for higheractivity levels in the oiland gas industry and a lower take on eachunit of production.”
Institute for Public Economics,2002 261
0
20
40
60
80
100
YTNWTSKBCAlbertaNorwayAlaska
▲ FIGURE 33: Average portion of economic rent captured in each region 1995–2002.
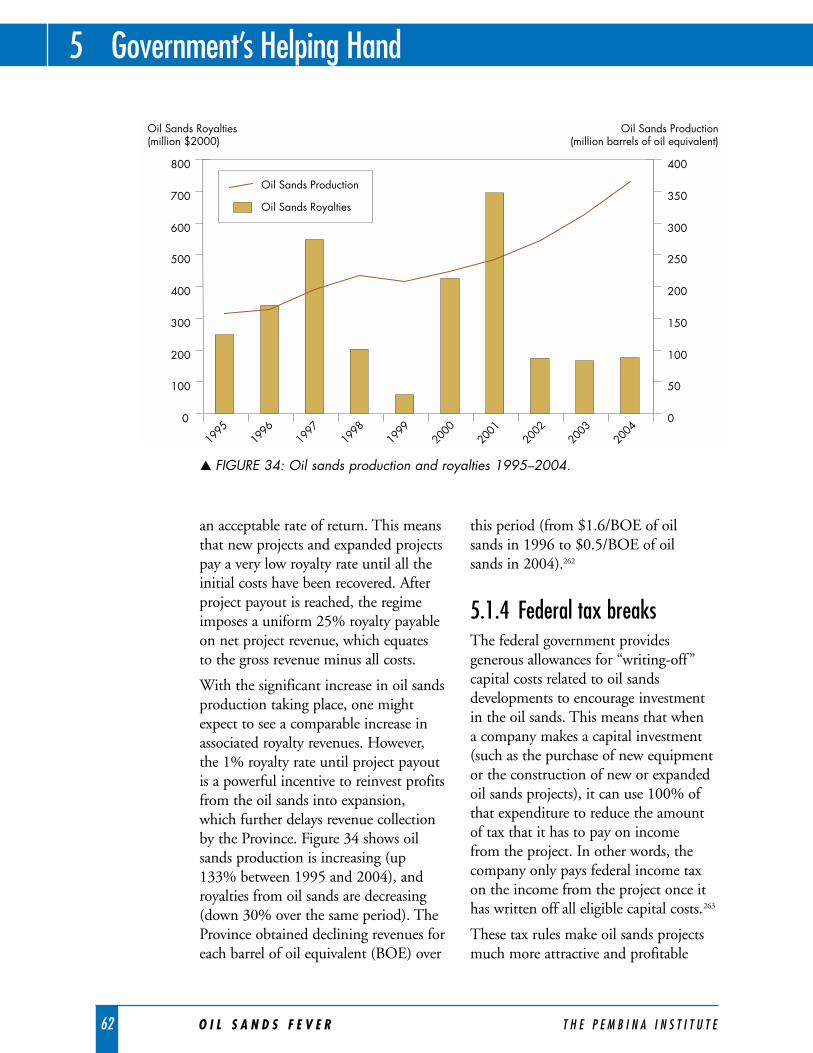
62 O I L S A N D S F E V E R T H E P E M B I N A I N S T I T U T E
an acceptable rate of return. This meansthat new projects and expanded projectspay a very low royalty rate until all theinitial costs have been recovered. Afterproject payout is reached, the regimeimposes a uniform 25% royalty payableon net project revenue, which equates to the gross revenue minus all costs.
With the significant increase in oil sandsproduction taking place, one mightexpect to see a comparable increase inassociated royalty revenues. However,the 1% royalty rate until project payoutis a powerful incentive to reinvest profitsfrom the oil sands into expansion,which further delays revenue collectionby the Province. Figure 34 shows oilsands production is increasing (up133% between 1995 and 2004), androyalties from oil sands are decreasing(down 30% over the same period). TheProvince obtained declining revenues foreach barrel of oil equivalent (BOE) over
this period (from $1.6/BOE of oil sands in 1996 to $0.5/BOE of oil sands in 2004).262
5.1.4 Federal tax breaksThe federal government providesgenerous allowances for “writing-off”capital costs related to oil sandsdevelopments to encourage investmentin the oil sands. This means that when a company makes a capital investment(such as the purchase of new equipmentor the construction of new or expandedoil sands projects), it can use 100% ofthat expenditure to reduce the amountof tax that it has to pay on income from the project. In other words, thecompany only pays federal income taxon the income from the project once ithas written off all eligible capital costs.263
These tax rules make oil sands projectsmuch more attractive and profitable
5 Government’s Helping Hand
0
100
200
300
400
500
600
700
800
0
50
100
150
200
250
300
350
400
1995
1996
1997
1998
1999
2000
2001
2002
2003
2004
Oil Sands Royalties (million $2000)
Oil Sands Production
Oil Sands Royalties
Oil Sands Production(million barrels of oil equivalent)
▲ FIGURE 34: Oil sands production and royalties 1995–2004.
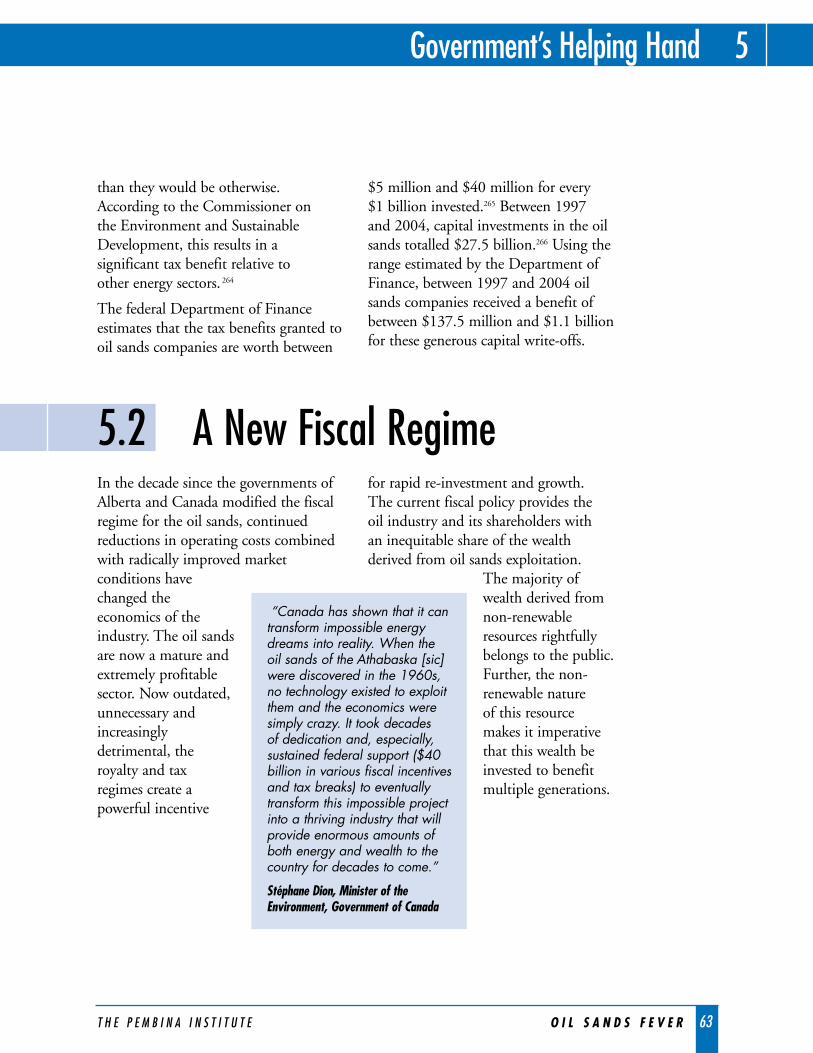
T H E P E M B I N A I N S T I T U T E O I L S A N D S F E V E R 63
Government’s Helping Hand 5
than they would be otherwise.According to the Commissioner on the Environment and SustainableDevelopment, this results in asignificant tax benefit relative to other energy sectors. 264
The federal Department of Financeestimates that the tax benefits granted tooil sands companies are worth between
$5 million and $40 million for every $1 billion invested.265 Between 1997 and 2004, capital investments in the oilsands totalled $27.5 billion.266 Using therange estimated by the Department ofFinance, between 1997 and 2004 oilsands companies received a benefit ofbetween $137.5 million and $1.1 billionfor these generous capital write-offs.
5.2 A New Fiscal RegimeIn the decade since the governments ofAlberta and Canada modified the fiscalregime for the oil sands, continuedreductions in operating costs combinedwith radically improved marketconditions havechanged theeconomics of theindustry. The oil sandsare now a mature andextremely profitablesector. Now outdated,unnecessary andincreasinglydetrimental, theroyalty and taxregimes create apowerful incentive
for rapid re-investment and growth. The current fiscal policy provides the oil industry and its shareholders with an inequitable share of the wealthderived from oil sands exploitation.
The majority ofwealth derived fromnon-renewableresources rightfullybelongs to the public.Further, the non-renewable nature of this resourcemakes it imperativethat this wealth beinvested to benefitmultiple generations.
“Canada has shown that it cantransform impossible energydreams into reality. When the oil sands of the Athabaska [sic]were discovered in the 1960s,no technology existed to exploitthem and the economics weresimply crazy. It took decades of dedication and, especially,sustained federal support ($40billion in various fiscal incentivesand tax breaks) to eventuallytransform this impossible projectinto a thriving industry that willprovide enormous amounts ofboth energy and wealth to thecountry for decades to come.”
Stéphane Dion, Minister of theEnvironment, Government of Canada
▲ From the air, the giant trucks look like little ants in the large mines. You can see the mine layeringin this photo. The bottom of the mine is as deep below the surface of the former boreal forest asthe length of a football field. PHOTO: CHRIS EVANS, THE PEMBINA INSTITUTE
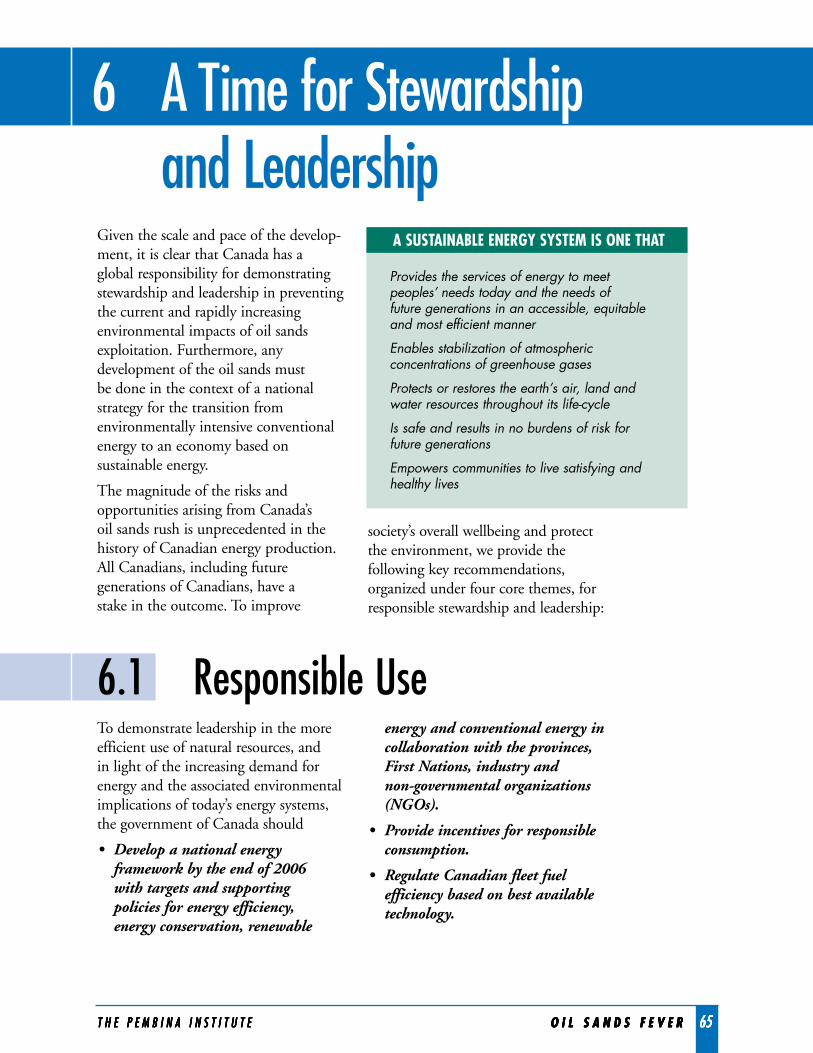
6 A Time for Stewardshipand Leadership
6.1 Responsible UseTo demonstrate leadership in the moreefficient use of natural resources, and in light of the increasing demand forenergy and the associated environmentalimplications of today’s energy systems,the government of Canada should
• Develop a national energyframework by the end of 2006 with targets and supporting policies for energy efficiency, energy conservation, renewable
energy and conventional energy incollaboration with the provinces,First Nations, industry and non-governmental organizations(NGOs).
• Provide incentives for responsibleconsumption.
• Regulate Canadian fleet fuelefficiency based on best availabletechnology.
T H E P E M B I N A I N S T I T U T E O I L S A N D S F E V E R 65T H E P E M B I N A I N S T I T U T E O I L S A N D S F E V E R 65T H E P E M B I N A I N S T I T U T E O I L S A N D S F E V E R 65
Given the scale and pace of the develop-ment, it is clear that Canada has a global responsibility for demonstratingstewardship and leadership in preventingthe current and rapidly increasingenvironmental impacts of oil sandsexploitation. Furthermore, anydevelopment of the oil sands must be done in the context of a nationalstrategy for the transition fromenvironmentally intensive conventionalenergy to an economy based onsustainable energy.
The magnitude of the risks andopportunities arising from Canada’s oil sands rush is unprecedented in thehistory of Canadian energy production.All Canadians, including futuregenerations of Canadians, have a stake in the outcome. To improve
society’s overall wellbeing and protectthe environment, we provide thefollowing key recommendations,organized under four core themes, forresponsible stewardship and leadership:
T H E P E M B I N A I N S T I T U T E O I L S A N D S F E V E R 65
A SUSTAINABLE ENERGY SYSTEM IS ONE THAT
Provides the services of energy to meet peoples’ needs today and the needs of future generations in an accessible, equitableand most efficient manner
Enables stabilization of atmosphericconcentrations of greenhouse gases
Protects or restores the earth’s air, land andwater resources throughout its life-cycle
Is safe and results in no burdens of risk for future generations
Empowers communities to live satisfying andhealthy lives
66 O I L S A N D S F E V E R T H E P E M B I N A I N S T I T U T E
6.2 Protecting the Climate
6 A Time for Stewardship and Leadership
6.3 Protecting the Regional EnvironmentOver the next two years, regulatoryagencies will be asked to reviewproposed oil sands projects that willpush production to approximately 3.8million barrels per day, more than triplethe current production. Over the nextseveral years, regulatory agencies may befaced with proposals to further increaseproduction to five million barrels perday or more. These public-interestdecisions must be made in an informed and precautionary manner to ensure that cumulative environmentalimpacts are proactively managed. We recommend that
The government of Alberta
• Establish a conservation offsetwithin the oil sands region byprotecting an area of intact borealforest of high conservation valuethat is representative of the region.
• Establish interim environmentallimits that protect human healthand the environmental integrity of the region before approvingadditional oil sands development.
• Establish clear reclamationexpectations that ensure the long-term ecological sustainability of theregion before approving additionaloil sands development.
The governments of Alberta and Canada
• Create the conditions for CEMA tosuccessfully refine environmentallimits and develop regionalenvironmental management systems to guide decisions aboutfuture oil sands development. This will require the development of specific memoranda of
To ensure that the oil sands industrydoes its fair share in meeting Canada’sGHG reduction obligations enshrinedwithin the Kyoto Protocol, werecommend that the government of Canada
• Define Best Available TechnologyEconomically Achievable (BATEA)-based targets for the oil sandsindustry at a level that ensures newand expanded projects make ameaningful contribution towardsmeeting Canada’s emission-reductions obligations.
• Invest in research and provideincentives to promote thecommercialization of more efficient transportation-basedtechnologies and the development of low-impact alternative fuels.
Looking beyond 2012, we recommendthat the governments of Canada andAlberta
• Require all existing and new oil sandsoperations to be carbon-neutral (net zero GHG emissions) by 2020through a combination of actualreductions and emission offsets.
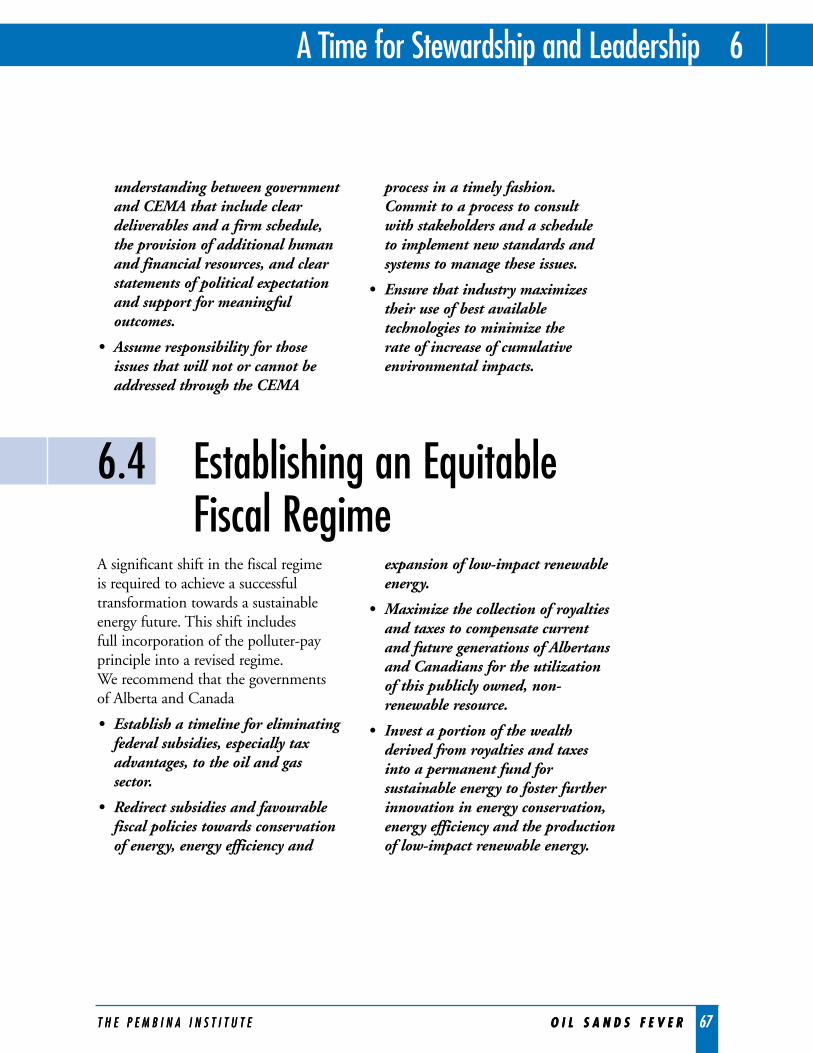
6.4 Establishing an Equitable Fiscal Regime
T H E P E M B I N A I N S T I T U T E O I L S A N D S F E V E R 67
A Time for Stewardship and Leadership 6
T H E P E M B I N A I N S T I T U T E O I L S A N D S F E V E R 67
understanding between governmentand CEMA that include cleardeliverables and a firm schedule,the provision of additional humanand financial resources, and clearstatements of political expectationand support for meaningfuloutcomes.
• Assume responsibility for thoseissues that will not or cannot beaddressed through the CEMA
process in a timely fashion. Commit to a process to consult with stakeholders and a schedule to implement new standards andsystems to manage these issues.
• Ensure that industry maximizestheir use of best availabletechnologies to minimize the rate of increase of cumulativeenvironmental impacts.
A significant shift in the fiscal regime is required to achieve a successfultransformation towards a sustainableenergy future. This shift includes full incorporation of the polluter-payprinciple into a revised regime. We recommend that the governments of Alberta and Canada
• Establish a timeline for eliminatingfederal subsidies, especially taxadvantages, to the oil and gassector.
• Redirect subsidies and favourablefiscal policies towards conservationof energy, energy efficiency and
expansion of low-impact renewableenergy.
• Maximize the collection of royaltiesand taxes to compensate currentand future generations of Albertansand Canadians for the utilizationof this publicly owned, non-renewable resource.
• Invest a portion of the wealthderived from royalties and taxesinto a permanent fund forsustainable energy to foster furtherinnovation in energy conservation,energy efficiency and the productionof low-impact renewable energy.
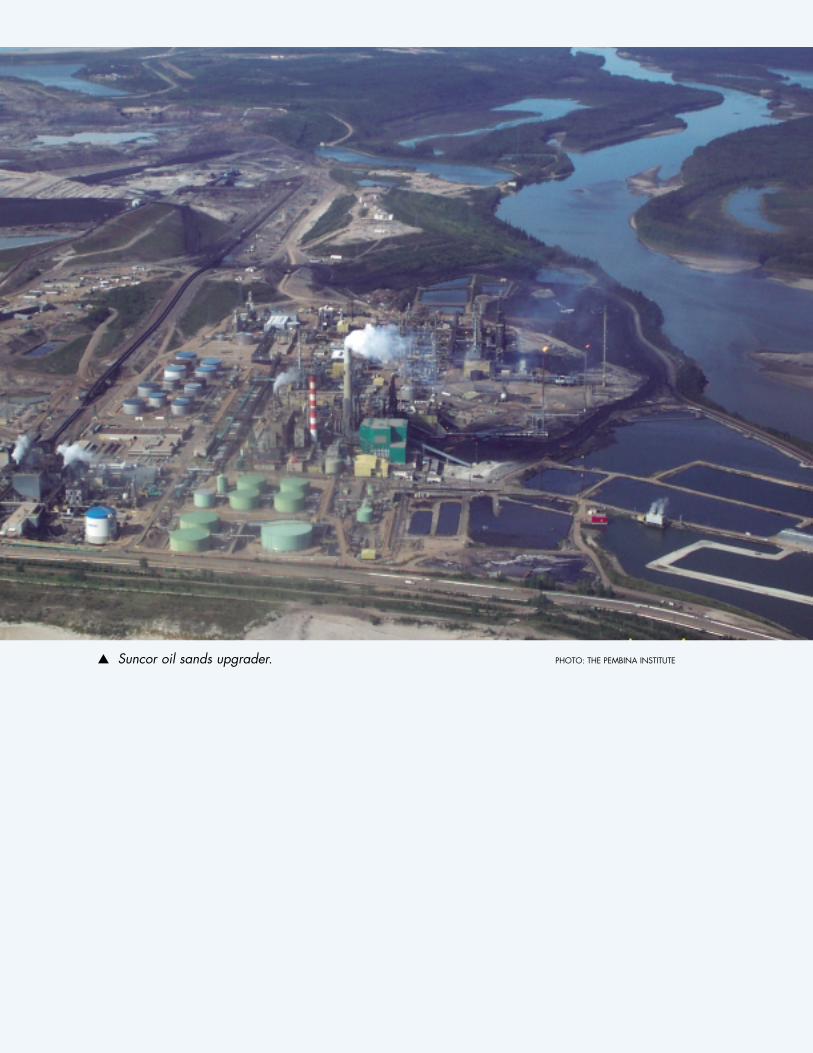
▲ Suncor oil sands upgrader. PHOTO: THE PEMBINA INSTITUTE
Endnotes1 - 30
1 Data was taken from Table 2.3 and converted from hectaresto square kilometres. Source: Alberta Energy and UtilitiesBoard, Alberta’s Reserves 2004 and Supply/DemandOutlook/Overview (2005), Statistical Series (ST) 2005-98, pp. 2-7.
2 The province of Alberta is 661,190 km2 (260,000 mi2) in area.
3 Population data source:http://www.woodbuffalo.net/population.htm.
4 Alberta Energy and Utilities Board, Alberta’s Reserves 2004and Supply/Demand Outlook/Overview (2005), StatisticalSeries (ST) 2005-98,p. 2.
5 The EUB defines established reserves as “Those reservesrecoverable under current technology and present andanticipated economic conditions specifically proved by drilling, testing, or production, plus the portion ofcontiguous recoverable reserves that are interpreted to exist from geological, geophysical, or similar informationwith reasonable certainty.”
6 Kevin Hall, “U.S. energy future rests with development ofCanadian oil sands,” October 6, 2005. Knight RidderNewspapers.
7 Data was taken from Table 2.3 and converted from cubicmeters to barrels using a conversion factor of 6.2929barrels/cubic metre. Alberta Energy and Utilities Board.Alberta’s Reserves 2004 and Supply/Demand Outlook/Overview(2005), Statistical Series (ST) 2005-98, p. 2-7.
8 Doug Barnett, An Early History of the Athabasca Oil Sands,http://www.usask.ca/education/ideas/tplan/sslp/yukon/bitumont.htm.
9 National Energy Board, Canada’s Oil Sands – Outlook to2015 (2000), p. 15.
10 Nickle’s Energy, Information, Technology. Syncrude and Alta.Gov’t reach agreement on tar sands development – still hinges onfederal gov’t export tax. September 19, 1973,http://www.nickles.com/history/article.asp?article=history%5Chistory_0935.html.
11 http://www.centreforenergy.com/generator2.asp?xml=/silos/ong/oilsands/oilsandsHistoryXML.asp&template=1,1,1.
12 http://www.centreforenergy.com/generator2.asp?xml=/silos/ong/oilsands/oilsandsHistoryXML.asp&template=1,1,1.
13 National Oil Sands Task Force, The Oil Sands: A New EnergyVision for Canada (1995), p. 33.
14 National Oil Sands Task Force, The Oil Sands: A New EnergyVision for Canada (1995), p. 5.
15 National Oil Sands Task Force, The Oil Sands: A New EnergyVision for Canada (1995), pp. 4, 6, 36 and 12 respectively.
16 Between 1995 and 2004, Alberta’s crude bitumen productionincreased from 482,000 barrels per day to 1.1 million barrelsper day. Data was converted from cubic metres to barrelsusing a factor of 6.2929 barrels/ cubic metre. Source of 1995data: Alberta Energy and Utilities Board. (2004), ST98-2004 – Graphs and Data – Section 2 Crude Bitumen.http://www.eub.gov.ab.ca/bbs/products/STs/st98-2004-data-2-bitumen.ppt. Source of 2004 data: Alberta Energy andUtilities Board, Alberta’s Reserves 2004 and Supply/DemandOutlook/Overview (2005), Statistical Series (ST) 2005-98,p.2.
17 In the summer of 2005, Total initiated a friendly takeover ofDeer Creek Energy Limited, a small Canadian oil companyfocused on oil sands development. As of September 2005,Total had acquired 78% of the issued and outstanding shares of DCEL, with the intent of acquiring the remainder.Source: http://www.total.com/en/press/press_releases/pr_2005/050913_total_acquires_78_deer_creek_7917.htm.
18 Chinese investments in the oil sands include ChinaPetroleum & Chemical Corp.’s (Sinopec) purchase of a 40% stake in Synenco Energy’s Northern Lights project,CNOOC’s purchase of one-sixth of MEG Energy, andPetroChina International Company Ltd.’s commitment tohalf of the capacity of Enbridge’s proposed Gateway pipelineto the Pacific coast.
19 See, for example, Tamsin Carlisle, “A Black-Gold Rush in Alberta,” Wall Street Journal, September 15, 2005,http://online.wsj.com/public/article/0,,SB112674051132041159-MVjoYsv_EzzxfBJ5r5QF2Qj3W54_20050921,00.html?mod=mktw.
20 Canadian Energy Research Institute (CERI), Oil SandsSupply Outlook, Potential Supply and Costs of Crude Bitumenand Synthetic Crude Oil in Canada 2003-2017 (2004), StudyNo. 108. p. 1.
21 Premier Ralph Klein, “Western Canada’s role in building asecure, abundant and sustainable energy future for NorthAmerica,” (presentation by Premier Ralph Klein to theWestern Governors’ Association – North American EnergySummit. Albuquerque, New Mexico. April 15, 2004.)
22 Report of the U.S. National Energy Policy DevelopmentGroup, May 2001, http://www.dfait-maeci.gc.ca/can-am/washington/trade_and_investment/energy-en.asp.
23 Data source: Oil and Gas Journal, December 2004.
24 The four mining operations approved over this period were Albian Sands Muskeg River Mine, TrueNorth (nowUTS/PetroCanada) Fort Hills, CNRL Horizon Mine andShell Jackpine Mine – Phase 1. The seven in situ projectsapproved included Suncor Firebag, EnCana Christina Lake,PetroCanada Mackay River, OPTI/Nexen Long Lake,ConocoPhillips Canada Surmont, PetroCanada MeadowCreek and Devon Jackfish.
25 Alberta Chamber of Resources, Oil Sands TechnologyRoadmap – Unlocking the potential (2004), p. 7.
26 Canadian Association of Petroleum Producers, CanadianCrude Oil Production and Supply Forecast 2005-2015 (2005),p. 2.
27 Alberta Chamber of Resources, Oil Sands TechnologyRoadmap – Unlocking the potential (2004), p. 2.
28 "We project that oil sands production will make up half of all Canadian crude production sometime in late 2007, andreach 2 million barrels per day in 2013, double the 1 millionbarrels per day production reached in 2004, and reach 3million barrels per day in 2018. The oil sands reach our veryprovisional peak number of 11 million barrels per day in2047.” Source: Multicyclic Hubbert Curve Theory andCanada’s Future Oil Outlook: Could Oil Sands productionreach 11 million barrels per day? First Energy Capital Corp,July 7, 2005.
29 http://www.bloomberg.com/apps/news?pid=10000082&sid=aGEiywJ8Yr8s&refer=canada.
30 http://www.centreforenergy.com/generator2.asp?xml=/silos/ong/oilsands/oilsandsHistoryXML.asp&template=1,1,1.
T H E P E M B I N A I N S T I T U T E O I L S A N D S F E V E R 69
70 O I L S A N D S F E V E R T H E P E M B I N A I N S T I T U T E
31 - 6631 Alberta Department of Energy,
http://www.energy.gov.ab.ca/com/Sands/Introduction/Oil_Sands.htm.
32 Alberta Department of Energy,http://www.energy.gov.ab.ca/com/Sands/Introduction/Oil_Sands.htm.
33 http://www.capp.ca/default.asp?TEMPORARY_TEMPLATE=29&V_DOC_ID=1135.
34 George W. Bush, President; President Fox of Mexico and Prime Minister Martin of Canada. Remarks at Bill Daniels Activity Center, Baylor University Waco, TX.March 23, 2005,http://www.state.gov/p/wha/rls/rm/2005/q1/43847.htm.
35 Data source: Alberta Energy and Utilities Board (2005),Alberta’s Reserves 2004 and Supply/Demand Outlook/Overview.Statistical Series (ST) 2005-98,http://www.eub.gov.ab.ca/bbs/products/sts/st98-2005-data.ppt.
36 Alberta Energy and Utilities Board,Alberta’s Reserves 2004 and Supply/Demand Outlook/Overview (2005), StatisticalSeries (ST) 2005-98.http://www.eub.gov.ab.ca/bbs/products/sts/st98-2005-data.ppt.
37 Alberta Energy and Utilities Board Alberta’s Reserves 2004 andSupply/Demand Outlook/Overview (2005), Statistical Series(ST) 2005-98, pp.2–23.
38 National Energy Board, Canada’s Oil Sands – Opportunitiesand Challenges to 2015 (2004), p.32.
39 For examples, see Matthew Simmons, “Peak Oil: The Reality Of Depletion,” presented at the OffshoreTechnology Conference in Houston, Texas on May 3, 2004,http://www.simmonsco-intl.com/files/OTC-World%20Energy%20Supplies.pdf and J. Mawdsley, J. Mikhareva, and J. Tennison,, The Oil Sands of Canada –The World Wakes Up: First to Peak Oil, Second to Canada’s Oil Sands (Raymond James Equity Research, 2005)http://www.raymondjames.com.
40 Ian Mackinnon, “Commodity Strategists: Oil May Average$93 in 2007,” Bloomberg, September 9, 2005.
41 Roma Luciw, “Oil to fall to $45: TD” September 22, Globe and Mail, September 22, 2005. Update edition.
42 Foster Natural Gas Report, Outlook for oil sands production in Canada factors in significant demand for natural gas. March11, 2004. Citing a study released March 3, 2004 by theCanadian Energy Research Institute entitled Oil Sands SupplyOutlook: Potential Supply and Costs of Crude Bitumen andSynthetic Crude Oil in Canada, 2003-2017.
43 Source of data for 1990-2004 from British Petroleum,Statistical Review of World Energy 2005. p. 14. Source of data for 2005: Bloomberg Market Data, October 21, 2005,http://www.bloomberg.com/markets/commodities/energyprices.html. Source of data for 2006-2007: Ian Mackinnon,“Commodity Strategists: Oil May Average $93 in 2007,”Bloomberg, September 9, 2005.
44 From a barrel of oil, 40% (by volume) is refined to gasolinefor use in automobiles, 25% is refined to diesel fuel, 7% tojet fuel, (total of 72% to transportation fuels), 8% is refinedto light fuel oil for heating, 7% to heavy fuel oil for powergeneration, 8% to “other” e.g., petrochemicals and 5% of thecrude oil (or the equivalent amount of energy from naturalgas) is consumed in the refining process. Centre for Energy,Our Petroleum Challenge – 7th Edition (2004), p. 16.
45 Projected oil demand in 2015 is estimated to be more than24 million barrels per day. Steve Maich, “Alberta is about toget wildly rich and powerful,” Macleans, June 13, 2005.
46 Alberta Chamber of Resources, Oil Sands TechnologyRoadmap – Unlocking the potential (2004), p.7.
47 The International Energy Agency has estimated global oildemand to be 121 million barrels per day in 2030. Source:Birol, Faith. International Energy Agency, The Outlook to2030 (2004), p.38, http://www.world-petroleum.org/first/first2004/Birol.pdf.
48 Richard Heavenrich , Light-Duty Automotive Technology and Fuel Economy Trends: 1975 Through 2005 (U.S. Environmental Protection Agency, 2005),http://www.epa.gov/otaq/fetrends.htm.
49 Average specific consumption of vehicles in the EuropeanUnion in 2003: ODYSSEE Energy Efficiency Indicators in Europe. http://www.odyssee-indicators.org/.
50 Kevin G.Hall, “U.S. energy future rests with development of Canadian oil sands.” October 6, 2005. Knight RidderNewspapers.
51 Canadian Press, “ Clinton issues Alberta a global warmingwarning,” October 19, 2005.
52 National Oil Sands Task Force, The Oil Sands: A New EnergyVision for Canada (1995), p. 12.
53 Vincent DiNorcia, “Editors Notes,” The Corporate EthicsMonitor. Volume 17, Issue 4, July–August 2005.
54 David Kilgour, “Rise of an energy colossus,” National Post,June 15, 2005.
55 Alberta Energy, What is oil sands? (2004),http://www.energy.gov.ab.ca/100.asp.
56 Alberta Energy and Utilities Board. 2005. Alberta’s Reserves2004 and Supply/Demand Outlook/Overview (2005),Statistical Series (ST) 2005-98, p.2-1.
57 Alberta Energy Research Institute. Canadian oil sands:development and future outlook. p. 1,http://www.aeri.ab.ca/sec/new_res/docs/oil_sands_dev_outlook_Isaacs_050214.pdf.
58 Data was taken from Table 2.3 and converted from hectares to square kilometres. Alberta Energy and UtilitiesBoard,Alberta’s Reserves 2004 and Supply/DemandOutlook/Overview (2005), Statistical Series (ST) 2005-98, pp. 2–7.
59 Alberta Energy, Facts on Oil Sands (2004),http://www.energy.gov.ab.ca/docs/oilsands/pdfs/FactSheet_OilSands.pdf.
60 http://www.cnrl.com/imageviewer.php?pic=/client/body/22/54/sco_process_zoom.gif&alt=.
61 http://www.syncrude.com/who_we_are/01_04_1.html.
62 Alberta Energy, Facts on Oil Sands (2004),http://www.energy.gov.ab.ca/docs/oilsands/pdfs/FactSheet_OilSands.pdf.
63 Brendan I. Koerner, “The Trillion-Barrel Tar Pit – Who needs “oil independence” – our friendly neighbour tothe north is sitting on a black gold mine!” Wired Magazine,http://www.wired.com/wired/archive/12.07/oil_pr.html.
64 http://rocktoroad.com/oilsands.html.
65 L. Flint, Bitumen Recovery: A review of long term research and development opportunities, p. 10,http://www.ptac.org/links/dl/osdfnlreport.pdfand L. Sawatsky, Golder Associates, Improved Stewardship of Water Resources that are Entrusted to Oil Sands Mine(presentation to “Water and Land Issues for the Oil and Gas Industry” March 22, 2004).
66 Alberta Chamber of Resources, Oil Sands TechnologyRoadmap – Unlocking the potential (2004), p .14.
Endnotes
T H E P E M B I N A I N S T I T U T E O I L S A N D S F E V E R 71
Endnotes
67 National Energy Board, Canada’s Oil Sands – Opportunities and Challenges to 2015 (2004), p.25.
68 Petro-Canada, Application for Approval of the Meadow CreekProject (2001), vol. 1, pp. 3–4.
69 Alberta Chamber of Resources, Oil Sands TechnologyRoadmap – Unlocking the potential (2004), p. 14.
70 Alberta Chamber of Resources, Oil Sands TechnologyRoadmap – Unlocking the potential (2004), p. 3.
71 A Chevy Avalanche’s fuel efficiency is 16 miles per gallon.Given that a barrel of oil can produce about 72 litres of gasoline, a barrel of oil produces enough gasoline to drive an Avalanche 490 kilometres. Sources:http://www.energy.gov.ab.ca/1960.asp andhttp://www.fueleconomy.gov/.
72 National Energy Board, Canada’s Oil Sands – Opportunities and Challenges to 2015. May 2004. p. 110.
73 National Energy Board, Canada’s Oil Sands – Opportunities and Challenges to 2015. May 2004. p. 86.
74 A typical Canadian home uses 72 GJ of energy each year for space heating (185 cubic feet of gas per day), on average.Source: Natural Resources Canada.http://oee.nrcan.gc.ca/corporate/statistics/neud/dpa/tablestrends2/res_ca_2_e_3.cfm?attr=0.
75 As much as 1.2 billion cubic feet per day of gas could beavailable to move through the Mackenzie Valley Pipeline.Source:http://www.mackenziegasproject.com/theProject/overview/index.html.
76 Two billion cubic feet of gas could heat 10.8 millionCanadian homes for a day. In 2001, Canada hadapproximately 11.5 million homes.
77 Alberta Chamber of Resources, Oil Sands TechnologyRoadmap: Unlocking the Potential. (2004), p. 14.
78 Eric Reguly, “Oil sands mother lode could doom gas reserves,”Globe and Mail, May 28, 2005.
79 2004 data from National Energy Board, Canada’s Oil Sands –Opportunities and Challenges to 2015 (2004), p. 86.Production forecasts for 2012 and 2030, breakdown ofproduction (SCO from in situ vs. surface mines and non-upgraded bitumen) and natural gas factors (for mining toSCO, in situ to SCO and in situ to crude bitumen) all from Alberta Chamber of Resources, Oil Sands TechnologyRoadmap: Unlocking the Potential (2004).
80 http://www.innovationalberta.com/article.php?articleid=92.
81 R.B. Dunbar, and T.W. Sloan, Canadian Energy ResearchInstitute (2003), Does nuclear have a role in the development ofCanada’s oil sands? Paper 2003-096.
82 Dave Ebner and Simon Tuck, “Oil sands players eye nuclearoption,” Globe and Mail, September 23, 2005.
83 Canadian Press, “ Klein says nuclear energy not a goodoption,” October 18, 2005.
84 National Energy Board, Canada’s Oil Sands – Opportunities and Challenges to 2015 (2004), p. 86.
85 National Energy Board, Canada’s Oil Sands – Opportunities and Challenges to 2015 (2004), p. 110.
86 Alberta Chamber of Resources, Oil Sands TechnologyRoadmap: Unlocking the Potential (2004), p. 57.
87 National Energy Board, Canada’s Oil Sands – Opportunities and Challenges to 2015 (2004), p. 90.
88 National Energy Board, Canada’s Oil Sands – Opportunities and Challenges to 2015 (2004), p. 32.
89 National Energy Board, Canada’s Oil Sands – Opportunities and Challenges to 2015 (2004), p. 50.
90 Alberta Chamber of Resources, Oil Sands TechnologyRoadmap – Unlocking the potential (2004), p.13.
91 For more information on the proposed Gateway Pipeline, see http://www.enbridge.com/gateway/.
92 J. Mawdsley and J. Mikhareva, and J. Tennison, The Oil Sands of Canada - The World Wakes Up: First to PeakOil, Second to Canada's Oil Sands (Raymond James EquityResearch, 2005), http://www.raymondjames.com.
93 For a complete discussion on this topic, see a forthcomingreport examining the need for long-term deep reductions in GHG emissions, to be published by the David SuzukiFoundation and the Pembina Institute, November 2005.
94 Government of Canada, Climate Change Plan for Canada(2002), p. 29.
95 National Climate Change Process Analysis and ModellingGroup, Canada’s Emission Outlook – An Update (1999), pp. 45-46.
96 Information provided to Robert Collier, San FranciscoChronicle, by Environment Canada, May 5, 2005, and then provided to author.
97 For the natural gas and residue scenarios, two emissionintensity improvements were used. The upper limit of eachgraph uses an improvement of 1% and the lower limit uses a2.3% improvement. A 1% emission intensity improvementreflects the “autonomous energy efficiency index”. The AEEIis a value energy modelers use to represent the natural, non-price induced change in energy efficiency over time. AEEItypically ranges from 0.5% to 1%.
The 2.3% emission intensity improvement is what AlbertaEnvironment’s Climate Change Plan is targeting. By 2020,Alberta will cut emissions in the province relative to GDP by 50% below 1990 levels. A 50% improvement over 30years is equal to a 2.3% annual improvement, assuming thatcontribution of oil sands to Alberta’s GDP remains at thesame level. Expansion in the oil sands is expected to increaseand so will its contribution to the GDP.
As an interesting note, in the last decade the oil sands havemade a 26% reduction in emissions, which is equal to a 3%annual reduction. While this amount may not be sustainableover the long term it is not unreasonable to expect that a2.3% improvement is possible especially when efficiency isdriven by higher energy costs.
Utilization of residue for hydrogen and as an energy source is expected to come on-line in 2012. This date was chosensince this is when Suncor expects it might use a gasifier withPhase Two of its Voyageur project.
Sources: IPCC Third Assessment Report, Climate Change 2001, Mitigation Report, Section 3.5.5.6,http://www.grida.no/climate/ipcc_tar/wg3/index.htm;Alberta Environment, Albertans and Climate Change – Taking Action (October 2002); Climate Change Plan forCanada (November 2002) p. 29; Suncor Energy, VoyageurProject EIA (2005), volume 1A, pp. 1–2.
98 Natural Resources Canada, Canada’s Emissions Outlook – an “Events-Based” Update for 2010 (1998), p. 1,http://www.nrcan.gc.ca/es/ceo/CEO-2010.PDF.
99 Natural Resources Canada, Canada’s Emissions Outlook – an “Events-Based” Update for 2010 (1998), p. 11,http://www.nrcan.gc.ca/es/ceo/CEO-2010.PDF.
100 National Climate Change Process Analysis and ModellingGroup, Canada’s Emissions Outlook – an Update (1999), p. 42.
67 - 100
72 O I L S A N D S F E V E R T H E P E M B I N A I N S T I T U T E
101 - 138101 Analysis and Modelling Group, The Magnitude of the
Challenge: Revising the Gap (powerpoint presentation to Joint Ministers Meeting, February, 2002).
102 Government of Canada, Moving Forward on Climate Change– A Plan for Honouring our Kyoto Commitment (2005), p. 12,http://www.climatechange.gc.ca/kyoto_commitments.
103 See, for example, P. Calamai, “An elusive pollution target,”Toronto Star, February 12, 2005.
104 World Resouces Institute, Climate Analysis Indicators Tool(CAIT) Version 2.0 (2005), http://cait.wri.org/cait.php. Here the industrialized world is taken to comprise themember countries of the Organization for Economic Co-operation and Development (OECD).
105 http://www.eia.doe.gov/emeu/cabs/canenv.html.
106 http://www.iea.org/Textbase/press/pressdetail.asp?PRESS_REL_ID=140.
107 Average intensity for conventional oil derived frominformation provided in Canadian Association of PetroleumProducers, A National Inventory of Greenhouse Gas (GHG),Criteria Air Contaminant (CAC) and Hydrogen Sulphide(H2S) Emissions by the Upstream Oil and Gas Industry (2004).Table 2. GHG Emissions For Year 2000 From Subject Oiland Gas Activity by Province/Territory, Pg. 19, Volume 1.Average intensity for oil sands SCO was calculated as theaverage of operating surface mining operation intensities(Suncor, Syncrude, Shell – 2004 data from respectiveSustainability Reports) and the “SAGD to SCO” emission factor provided by Len Flint, Lenef Consulting(personal communication).
108 David Ljunggren, “Nothing must harm oil sands plans –Canada minister” Reuters, November 29, 2002,http://www.planetark.com/avantgo/dailynewsstory.cfm?newsid=18831.
109 Charles Caccia, “Taxation and Other Policies to ReduceGreenhouse Gas Emissions and Enhance Competitiveness.”(2002), Environmental Policy and Law, Volume 32,Numbers 3-4, pp. 178–181.
110 J.Mawdsley and J. Mikhareva and J.Tennison, The Oil Sandsof Canada - The World Wakes Up: First to Peak Oil, Second toCanada's Oil Sands (Raymond James Equity Research, 2005),p. 53, http://www.raymondjames.com.
111 http://www.shell.ca/code/values/climate/climate_asop.html.
112 http://www.weforum.org/site/knowledgenavigator.nsf/Content/_S1531?open.
113 The Royal Society, Joint science academies’ statement: Global response to climate change (2005),http://www.royalsoc.ac.uk/document.asp?id=3222.
114 Production of 3.7 million barrels per day was calculatedusing existing, approved and planned oil sands developmentfigures. Shell Canada Ltd. 2005. Application for the MuskegRiver Mine Expansion. Appendix 2-6.
115 Clifford Krauss, “In Canada’s Wilderness, Measuring theCost of Oil Profits,” New York Times, October 9, 2005.
116 The Regional Municipality of Wood Buffalo, Regional Profile:the Regional Municipality of Wood Buffalo (2003).
117 The Athabasca Tribal Council represents the region’s fiveFirst Nations groups who have lived in the area for centuries.For more information on First Nations within RMWB visitwww.atc97.org.
118 Alberta Chamber of Resources, Oil sands TechnologyRoadmap: Unlocking the Potential. Final Report (2004), Figure 3.3, p. 21.
119 http://www.pnr-rpn.ec.gc.ca/nature/whp/ramsar/df02s06.en.html.
120 http://www.pnr-rpn.ec.gc.ca/nature/whp/ramsar/df02s06.en.html.
121 Of the 388 million cubic metres of water licensed forwithdrawal from the Athabasca River, only 38 million cubicmetres (10%) is licensed for return to the Athabasca River.
122 John Hollenhorst, “Environmental Impact a Consideration in Oil Sands Business,” Online edition. KSL News, August 9, 2005.
123 Len Flint, Bitumen Recovery: A review of long term research and development opportunities (2005), p. 42,http://www.ptac.org/links/dl/osdfnlreport.pdf.
124 B. Peachey, Strategic Needs for Energy Relate Water UseTechnologies. Water and the EnergyINet (2005), p. 34,http://www.aeri.ab.ca/sec/new_res/docs/EnergyINet_and_Water_Feb2005.pdf.
125 National Energy Board, Canada’s Oil Sands – Outlook to 2015 (200), p. 68
126 Len Flint, Bitumen Recovery: A review of long term research and development opportunities (2005), p. 10,http://www.ptac.org/links/dl/osdfnlreport.pdf.
127 Bruce Peachey (New Paradigm Engineering Ltd.), in discussion with the author, September 13, 2005.
128 Alberta Chamber of Resources, Oil Sands TechnologyRoadmap – Unlocking the potential (2004), p.3.
129 Adrienne Price and Carl A. Mendoza, How big is your man-made aquifer? Groundwater flow and salt transport insand tailings storage facility, Fort McMurray, Alberta. (2004),Paper No.194-6. Geological Society of America Abstractswith Programs, Vol. 36, No. 5, p. 451.
130 The largest tailings pond at Syncrude Canada Ltd. is theMildred Lake Settling Basin, which has a water surface of 13 square kilometres and contains over 400 _ 106 cubicmetres of fine tailings. Source: P.M. Fedorak, D.L. Coy, M.J. Salloum and M.J. Dudas., “Methanogenic potential of tailings samples from oil sands extraction plants,”Canadian Journal of Microbiology (2002), Volume 48, pp. 21–33, http://cjm.nrc.ca.
131 An Olympic-sized swimming pool holds 2,500 m3 of water.
132 Suncor Energy, 2005 Report on Sustainability (2005), p.67.
133 Conrad Environmental Aquatics Technical Advisory Group(CEATAG), Naphthenic Acids Background InformationDiscussion Report (1998), Alberta Department of Energy:Edmonton, AB, Canada.
134 M.D.MacKinnon and H.Boerger, Description of twotreatment methods for detoxifying oil sands tailings pond water.Water Poll. Res. J. Can. 1986, 21, pp. 496–512.
135 V.V.Rogers, M. Wickstrom. K. Liber and M.D.MacKinnon,“Acute and subchronic mammalian toxicity of naphthenicacids from oil sands tailings,” Toxicol. Sci. 2002, 66, pp. 347-355.
136 P.M.Fedorak, D.L. Coy, M.J. Salloum and M.J. Dudas,2002. “Methanogenic potential of tailings samples from oilsands extraction plants.,” Canadian Journal of Microbiology,(2002), volume 48, pp.21-33, http://cjm.nrc.ca.
137 National Energy Board, Canada’s Oil Sands: Opportunitiesand Challenges to 2015 (2004), p. 68.
138 Bruce Peachey, “Strategic Needs for Energy Relate Water Use Technologies,” Water and the EnergyINet, (2005), p35;http://www.aeri.ab.ca/sec/new_res/docs/EnergyINet_and_Water_Feb2005.pdf.
Endnotes
T H E P E M B I N A I N S T I T U T E O I L S A N D S F E V E R 73
Endnotes
139 For example, see p. 65 of Alberta Energy and Utilities Board,Canadian Natural Resources Ltd. Application for an OilSands Mine, Bitumen Extraction Plant, and BitumenUpgrading Plant in the Fort McMurray Area, (2004), Joint Panel Report. EUB Decision 2004-005.
140 Alberta’s Surface Water Quality Guidelines have beendeveloped for the protection of aquatic life, agriculture,recreation and aesthetics,http://www3.gov.ab.ca/env/protenf/publications/surfwtrqual-nov99.pdf.
141 John V.Headley and Dena W. McMartin, “ A review of the occurrence and fate of naphthenic acids in aquaticenvironments,” Part A – Toxic/Hazardous Substances andEnvironmental Engineering (2004), Vol.A 39, No.8, pp.1989-2010.
142 National Energy Board, Canada’s Oil Sands: Opportunitiesand Challenges to 2015, An Energy Market Assessment (2004),p. 68.
143 Exploration Rio Alto Ltd. (now CNRL), Kirby ProjectApplication for Approval to Alberta Energy and UtilitiesBoard and Alberta Environment (2002), Vol.2, p. C2-16.
144 CNRL has estimated that for its Horizon surface mine, its aquifer depressurization will have a potential drawdownzone of 98 square kilometres (9,820 ha) in size. Source:Canadian Natural Resources Ltd., Horizon Oil Sands Project. Application for Approval (2002), Volume 6, Section 4,pp. 4-37.
145 EnCana’s figure for Foster Creek is based on the anticipatedaverage for 2005–2025, assuming 15,900 m3/day of bitumenproduction or more.
146 Florence Hum, Peter Tsang, Harding Thomas and KantzasA..Apostolos, Review of Produced Water Recycle and BeneficialReuse (2005), Institute for Sustainable Energy, Environmentand Economy, University of Calgary, p. 29.
147 Government of Alberta, Water for Life: Alberta’s Strategy forSustainability (2003), http://www.waterforlife.gov.ab.ca/.
148 Source of data is Golder Associates Ltd, A compilation ofinformation and data on water supply and demand in the lowerAthabasca River Reach (2005), Prepared for the CEMASurface Water Working Group. Table 13.
149 For example, in 2003 the City of Calgary’s population was 922,315 and its municipal water requirement was approximately 174 million cubic metres per year. Water use data: Sustainable Calgary, 2004 State of Our City Report (2005), p.48.http://www.sustainablecalgary.ca/sooc/sooc2004.pdfPopulation data:http://content.calgary.ca/CCA/City+Hall/Business+Units/Community+Strategies/Social+Data/Research+Services/Population+Size.htm.
150 Golder Associates Ltd., A compilation of information and data on water supply and demand in the lower Athabasca River Reach (2005), Prepared for the CEMA Surface Water Working Group.
151 Source of data: Alberta Environment, personalcommunication with M. Griffiths of the Pembina Institute.
152 Environment Canada, Western Boreal Conservation Initiative– Strategic Plan (2004), p.1.
153 Cited in Environment Canada, Western Boreal ConservationInitiative – Strategic Plan. p. 4.
154 Natural Resources Canada, The State of Canada’s Forests2004-2005 (2005), p. 44
155 Global Forest Watch Canada, Boreal Canada: State of theEcosystem, State of Industry, Emerging Issues and Projections –Report to the National Round Table on Environment and theEconomy (2004), p. 4.
156 Global Forest Watch Canada, Boreal Canada: State of theEcosystem, State of Industry, Emerging Issues and Projections –Report to the National Round Table on Environment and theEconomy (2004), p.5
157 Environment Canada, Western Boreal Conservation Initiative– Backgrounder (2004), p. 2.
158 Cumulative Environmental Management Association, Review and assessment of environmental effects information forwildlife and fish indicators in the RSDS study area within theAthabasca oil sands region (2003), p. 39.
159 Environment Canada, Western Boreal Conservation Initiative– Backgrounder (2004), p. 2.
160 National Energy Board, Canada’s oil sands: A supply andmarket outlook to 2015 (2000), p. 83.
161 Wilcox and Murphy in Boyce 1992. Cited in CumulativeEnvironmental Management Association (2003), Review andassessment of environmental effects information for wildlife andfish indicators in the RSDS study area within the Athabasca oilsands region, p. 48.
162 Alberta Environment, Conservation and ReclamationInformation Letter – C&R/IL/00-2 -Guideline for wetlandre-establishment on reclaimed oil sands leases (2000),http://www3.gov.ab.ca/env/protenf/landrec/documents/2000-2.pdf.
163 Daniel Farr, Steve Kennett, Monique M. Ross, Brad Stelfox,and Marian Weber, Al-Pac Case Study Report – Part 1.Management Objectives, Prepared for the NationalRoundtable on the Environment and the Economy. July 2004. p. 4.
164 Preston McEachern and Theo Charette, Lakes in Alberta’sBoreal Forest. Lakeline, Winter 2003/04.
165 Global Forest Watch Canada, Boreal Canada: State of the Ecosystem, State of Industry, Emerging Issues andProjections – Report to the National Round Table onEnvironment and the Economy (2004), p. 12.
166 Alberta Center for Boreal Studies, The Oil and Gas Industryin Alberta: Practices, Regulations and Environmental Impacts(November 2001), p. 13.
167 Cumulative Environmental Management Association, Review and Assessment of Environmental Effects Information for Wildlife and Fish Indicators in the Regional SustainableDevelopment Strategy (RSDS) Study Area within the Athabasca Oil Sands Region (AOSR) (March 2003), p. 42.
168 Suncor Energy, 2005 Report on Sustainability (2005), p. 67.
169 Syncrude Canada Ltd., 2004 Sustainability Report (2005), p. 60.
170 http://www3.gov.ab.ca/env/protenf/landrec/definitions.html.
171 Alberta Energy and Utilities Board, Conservation andReclamation Information Letter – Guidelines for Reclamation to Forest Vegetation in the Athabasca Oil Sands Region (January 1999).
172 National Energy Board, Canada’s Oil Sands: Opportunitiesand Challenges to 2015. (2004), p. 71.
173 Alberta Environment, Regulatory Perspective – Oil SandsReclamation. Presented at CONRAD/OSERN Symposium2003, May 12 and 13, 2003, in Edmonton, Alberta.
139 - 173
74 O I L S A N D S F E V E R T H E P E M B I N A I N S T I T U T E
174 - 207174 John V. Headley and Dena W. McMartin, “A review
of the occurrence and fate of naphthenic acids in aquaticenvironment,”. Part A – Toxic/Hazardous Substances and Environmental Engineering (2004), Vol.A39, No.8, pp. 1989–2010.
175 Syncrude’s Aurora (North and South) mines, Albian Sands’Muskeg River mine and Shell’s Jackpine Mine-Phase 1 arealready approved and/or operating in the Muskeg Riverwatershed. Imperial’s Kearl Mine, Albian’s Muskeg RiverMine expansion, and Husky’s Sunrise SAGD project are all currently under regulatory review.
176 Alberta Energy and Utilities Board, Shell Canada LimitedApplications for a tar sands Mine, Bitumen Extraction Plant,Co-generation Plant, and Water Pipeline in the Fort McMurrayArea (2004), Joint Panel Report. EUB Decision 2004-009,p. 68.
177 Canadian Natural Resources Ltd.., Supplemental Responses.(2004), Part 2, 21.5 (ii), p. 100.
178 Alberta Pacific Forestry Ltd., Draft Al-Pac FMA Area ForestManagement Plan (2005), p. 157.
179 Cumulative Environmental Management Association, Review and Assessment of Environmental Effects Information for Wildlife and Fish Indicators in the Regional SustainableDevelopment Strategy (RSDS) Study Area within the AthabascaOil Sands Region (AOSR). March 2003. p. 42.
180 Ibid.
181 Daniel Farr, Steve Kennett, Monique M. Ross, Brad Stelfoxand Marian Weber, Al-Pac Case Study Report – Part 1.Management Objectives. Prepared for the NationalRoundtable on the Environment and the Economy. July 2004. p. 5.
182 Daniel Farr, Steve Kennett, Monique M. Ross, Brad Stelfoxand Marian Weber, Al-Pac Case Study Report – Part 1.Management Objectives. Prepared for the NationalRoundtable on the Environment and the Economy. July 2004. p. 5.
183 Daniel Farr, Steve Kennett, Monique M. Ross, Brad Stelfoxand Marian Weber, Al-Pac Case Study Report – Part 1.Management Objectives. Prepared for the NationalRoundtable on the Environment and the Economy. July 2004. p. 5.
184 http://www.energy.gov.ab.ca/108.asp.
185 http://www.energy.gov.ab.ca/108.asp.
186 Transcripts from CNRL Horizon Joint Panel Review, p. 1299. Lines 10-15.
187 http://www.albertawilderness.ca/Issues/ML/threats.htm.
188 Alberta Environment, Regulatory Perspective – Oil SandsReclamation. Presented at CONRAD/OSERN Symposium2003, May 12 &13 2003, in Edmonton, Alberta.
189 Alberta Environment. 2005. State of the Environment (2005),http://www3.gov.ab.ca/env/soe/land_indicators/41_oilsands_reclamation.html
190 Albian Sands Energy Inc., Muskeg River Mine ExpansionProject, Appendix 2-6.
191 Sources of data: Alberta Environment State of theEnvironment 2004,http://www3.gov.ab.ca/env/soe/land_indicators/41_oilsands_reclamation.html and Shell Canada Ltd. Application for the Muskeg River Mine Expansion (2005), Appendix 2-6.
192 http://www.pollutionwatch.org/pressroom/factSheetData/PollutionWatch%20Alberta%20Overview%202003%20-%20FINAL.pdf .
193 Environment Canada (2005),http://www.ec.gc.ca/pdb/ape/cape_home_e.cfm.
194 Commission for Environmental Cooperation, Taking Stock: 2002 North American Pollutant Releases and Transfers(May 2005), Overview, Page xxxiv.
195 http://www.acidrain.org/pages/acidEutrophications/sub3_1.asp.
196 http://www.ec.gc.ca/acidrain/acidair.html.
197 Commission for Environmental Cooperation, Taking Stock: 2002 North American Pollutant Releases and Transfers(May 2005), Overview, Page xxxvii.
198 http://www.ec.gc.ca/acidrain/acidair.html.
199 Canadian Council of Ministers of the Environment,“Canada-Wide Standard for Benzene Phase 1” (2000).
200 Environment Canada, Canadian Acid Deposition ScienceAssessment: Summary of Key Results (2004), pp. 10–11.
201 http://www.acidrain.org/pages/acidEutrophications/sub3_2.asp.
202 http://www.acidrain.org/pages/acidEutrophications/sub3_1.asp.
203 http://www.acidrain.org/pages/acidEutrophications/sub3_1.asp.
204 Polycyclic aromatic hydrocarbons (PAHs) are a group of more than 100 different chemicals formed during theincomplete burning of coal, oil and gas. PAHs enter the air mostly as releases from volcanoes, forest fires, burningcoal and automobile exhaust. The majority of PAH andmetal emissions in the oil sands region can be attributed to combustion of diesel fuels from the mining fleets.
205 Information taken from the Horizon Oilsands Project,Application for Approval. Emissions intensity includeemissions from mining operations and upgrading of bitumen product as well as on-site electricity production.The emissions intensity is based on each barrel of bitumenproduction. Information taken from “A National Inventoryof Greenhouse Gas (GHG), Criteria Air Contaminant(CAC) and Hydrogen Sulphide (H2S) Emissions by theUpstream Oil and Gas Industry,” Volume 1 and Volume 2.Specific segments of the industry excluded from theinventory are petroleum refining, heavy oil upgrading,oilsands mining, extraction and upgrading, and natural gas distribution. As well, emissions from electricity are not included.
206 Emissions from SAGD operations have a lower emissionintensity than oil sands mining, but this intensity is stillsubstantially higher than that of conventional oil.
207 Information taken from the Horizon Oilsands Project,Application for Approval. Emissions intensity includeemissions from mining operations and upgrading of bitumen product as well as on-site electricity production.The emissions intensity is based on each barrel of bitumenproduction. Information taken from “A National Inventoryof Greenhouse Gas (GHG), Criteria Air Contaminant(CAC) and Hydrogen Sulphide (H2S) Emissions by theUpstream Oil and Gas Industry,”, Volume 1 and Volume 2.Specific segments of the industry excluded from theinventory are petroleum refining, heavy oil upgrading,oilsands mining, extraction and upgrading, and natural gas distribution. As well, emissions from electricity are not included.
Endnotes
T H E P E M B I N A I N S T I T U T E O I L S A N D S F E V E R 75
Endnotes
208 Pollution Watch, Ranking facilities by air releases of CAC –Alberta (2005),http://www.pollutionwatch.org/rank.do?change=&healthEffect=all&year=2003&provincesByList=RETR_TOTAL_COMBINED&facilitiesByList=RELE_AIR_CAC&provincesListFac=AB&facilitiesByButton=Rank&companiesByList=RETR_TOTAL_COMBINED.
209 Pollution Watch, Ranking facilities by air releases of CAC –Canada (2005),http://www.pollutionwatch.org/rank.do?change=&healthEffect=all&year=2003&provincesByList=RETR_TOTAL_COMBINED&facilitiesByList=RELE_AIR_CAC&provincesListFac=all&facilitiesByButton=Rank&companiesByList=RETR_TOTAL_COMBINED.
210 Albian Sands Energy Inc., Muskeg River Mine ExpansionProject, Appendix 2-6, Developments in the Oil Sands Region,April 2005.
211 Figures for existing scenario for SO2 and NOx – Source:Predicted Ambient Concentrations and Deposition ofPriority Substances Released to the Air in the Oil SandsRegion – Final Report, RWDI West Inc. Submitted toCumulative Environmental Management Association Trace Metal and Air Contaminant Working Group,December 2003. Table 2.3, page 14.
212 Existing scenario totals for PM2.5 and VOC are comprised of approved emissions for Syncrude Mildred Lake, AuroraNorth, Suncor Base Plant, Steepbank, Millenium, Upgraderand South Tailings, PetroCanada MacKay River and ImperialCold Lake.
213 Alberta’s Ambient Air Quality Guideline (AAQG) fornitrogen oxides (N0x) is based on the prevention of humanhealth effects. The guideline for sulphur dioxide (S02) isbased on the prevention of effects to vegetation.
214 Canadian Council of Ministers of Environment, CanadaWide Standards for Particulate Matter and Ozone (2000), p. 4.
215 Albian Sands Energy Inc., Muskeg River Mine ExpansionProject, Air Quality and Noise Assessment, April 2005, Table 3, p 4.
216 Imperial Oil Resources Ventures Limited, Volume 1, Kearl Oil Sands Project – Mine Development (July 2005),pp. 5-64.
217 Imperial Oil Resources Ventures Limited, Volume 2, Kearl Oil Sands Project – Mine Development, Appendix 2B(July 2005), pp. 68–70.
218 Albian Sands Energy Inc., Muskeg River Mine ExpansionProject, Air Quality and Noise Assessment, April 2005, Table 5, p. 11.
219 Albian Sands Energy Inc,. Muskeg River Mine ExpansionProject, Air Quality and Noise Assessment, April 2005, Table 4, p. 6.
220 World Health Organization Regional Office for Europe Copenhagen, Air Quality Guidelines for Europe(Second Edition, 2000), p. 192.
221 The Particulate Matter and Ozone Management Frameworkwas recommended to government by the stakeholders of theClean Air Strategic Alliance in 2003.
222 Albian Sands Energy Inc., Muskeg River Mine ExpansionProject, Air Quality and Noise Assessment, April 2005, Table 17, p. 37.
223 Albian Sands Energy Inc., Muskeg River Mine ExpansionProject, Air Quality Planned Development Case AmbientPredictions, April 2005, Table 16, p. 36.
224 Clean Air Strategic Alliance, Particulate Matter and OzoneManagement Framework (2003), pp. 31–34.
225 Commission for Environmental Cooperation, Taking Stock: 2002 North American Pollutant Releases and Transfers,(May 2005), p. 53.
226 Albian Sands Energy Inc., Muskeg River Mine ExpansionProject, Air Quality and Noise Assessment, April 2005, Table 3, p. 4.
227 Albian Sands Energy Inc., Muskeg River Mine ExpansionProject, Air Quality Planned Development Case AmbientPredictions, April 2005, p. 28.
228 An expression of the potential to cause acidification in termsof equivalency to hydrogen ions deposited over a hectare ofland per year.
229 Environment Canada,http://www.ec.gc.ca/acidrain/acidforest.html.
230 Albian Sands Energy Inc., Muskeg River Mine ExpansionProject, Environmental Impact Assessment Appendices for the Muskeg River Mine Expansion, Appendix 2-9, Air andNoise Modelling Methods (April 2005), Tables 27 and 28, p. 107 and 108.
231 N0x/S02 Management Working Group, 2004, N0x and S0xSensitivity Mapping.
232 Canadian Council of Ministers of Environment, Canada-Wide Standard for Benzene Phase 2 (2001), pp. 2-3.
233 Albian Sands Energy Inc., Muskeg River Mine ExpansionProject, Air Quality Planned Development Case AmbientPredictions, April 2005, Table 13, p. 28.
234 Imperial Oil Resources Ventures Limited, Volume 5, Kearl Oil Sands Project – Mine Development RegulatoryApplication , (Volume 5, Appendix 2B (July 2005), p. 2B-70.
235 Albian Sands Energy Inc. Muskeg River Mine ExpansionProject, Environmental Impact Assessment Appendices for the Muskeg River Mine Expansion, Appendix 2-9, Air andNoise Modelling Methods, April 2005, Tables 27 and 28, p. 107 and 108.
236 Marc Deslauriers, Pollution Data Branch – Environment Canada, “Emission Inventories andProjections” (presentation at the SMOG Science Workshop, March 8 and 9, 2005 in Toronto).
237 Environment Canada, 2004 Canadian Acid DepositionScience Assessment: Summary of Key Results.
238 http://www.eub.gov.ab.ca/BBS/eubinfo/default.htm.
239 In Alberta, the environmental assessment (EA) process isencompassed within the Environmental Protection andEnhancement Act (EPEA), more specifically within theEnvironmental Assessment (Mandatory and ExemptedActivities) Regulation (AR111/93) and the EnvironmentalAssessment Regulation (AR 112/93). Schedule 1 of AR111/93 lists oil sands mines and commercial oil sandsupgrading or processing plants as activities that require amandatory environmental impact assessment (EIA). TheEnvironmental Assessment Process is outlined in Part 2 ofthe EPEA, which describes the purpose of the process andthe steps to prepare and submit an EIA. Section 49 of EPEAlists the required contents of an EIA report, which includes adescription of monitoring plans for predicted environmentalimpacts and proposed mitigation measures.
Similar to EPEA, the Canadian Environmental AssessmentAct (CEAA) includes Comprehensive Study Regulations that identify projects and classes of projects that require acomprehensive study. Included in the comprehensive studylist are oil sands processing facilities and mines.
208 - 239
76 O I L S A N D S F E V E R T H E P E M B I N A I N S T I T U T E
240 - 266240 Most commonly, federal involvement is triggered by an oil
sands proponent’s requirement of a permit under Section35(2) of the Fisheries Act for the alteration, disruption, or destruction of fish habitat. Prior to DFO issuing anauthorization, an environmental assessment of the projectunder the Canadian Environmental Assessment Act (CEAA)is required.
241 Fen Montaigne “The Great Northern Forest: Boreal,”National Geographic (2002), vol.201, issue 6, pp. 42-66.
242 Alberta Environment, Regional Sustainable DevelopmentStrategy for the Athabasca Oil Sands Area (1999), p. 1-2. For more information on the RSDS seehttp://www3.gov.ab.ca/env/regions/neb/rsds/.
243 Alberta Environment, Regional Sustainable DevelopmentStrategy for the Athabasca Oil Sands Area (1999), p.1.
244 For more information on the Cumulative EnvironmentalManagement Association (CEMA) seehttp://www.cemaonline.ca/.
245 http://www3.gov.ab.ca/env/irm/irm_actions.html.
246 The Clean Air Strategic Alliance (CASA) was established in March 1994 as a new way to manage air quality issues in Alberta. CASA is a non-profit association composed of diverse stakeholders from three sectors – government,industry, and non-government organizations such as health and environmental groups. Stakeholders arecommitted to developing and applying a comprehensive air quality management system for all Albertans. For more information see: http://www.casahome.org/.
247 As of January 2005, CEMA’s membership consisted of 15 government representatiaves, 21 industry representatives,14 Aboriginal and Métis represetatives, and 6 ENGOsrepresentatives.
248 Alberta Environment & Sustainable Resource Development,Regional Sustainable Development Strategy for the AthabascaOil Sands Area – Progress Report (July 2001), p. 12.
249 Alberta Environment & Sustainable Resource Development,Regional Sustainable Development Strategy for the AthabascaOil Sands Area – Progress Report (July 2001) p.12.
250 CEMA Contract Summary. April 30, 2005.
251 EUB Decision Report 99-2, p. 39.
252 EUB Decision Report 2002-089, p. 55.
253 EUB Decision 2004-005, p. 76.
254 EUB Decision 2004-009, p. 77.
255 Cumulative Environmental Management Association, Annual Report 2000 and 2001. Cumulative EnvironmentalManagement Association – Wood Buffalo Region.
256 Cumulative Environmental Management Association 2002.CEMA Schedule Compared to Oil Sand Development Profiles.
257 Cumulative Environmental Management Association.2004.CEMA Five Year Strategic Plan – Summary of WorkingGroup Activities.
258 Cumulative Environmental Management AssociationGeneral Meeting October 4&5, 2005. Taken from scheduleupdates provided by the working groups.
259 Amy Taylor et al, When the Government is the Landlord(Pembina Institute, 2004), http://www.pembina.org/publications_display.asp?category=11.
260 Richard Masson and Bryan Remillard., Alberta’s New OilSands Royalty System (1996) Alberta Department of Energy.
261 A. Plourde and Bradford Reid, “Natural Resource Revenuesand the Alberta Budget” in Wilson, L. S., ed. Alberta’sVolatile Government Revenues. Edmonton, Alberta: Institute for Public Economics (2002).
262 All statistics from Alberta Energy and the CanadianAssociation of Petroleum Producers.
263 Appendix A-Government Support for Energy Investments.
264 Commissioner of the Environment and SustainableDevelopment, Report of the Commissioner of the Environmentand Sustainable Development (2000).
265 Ken Ketchum, Robert Lavigne and Reg Plummer, Oil Sands Tax Expenditure (Department of Finance: 2001).
266 Source: http://www.capp.ca/raw.asp?x=1&dt=NTV&e=PDF&dn=34093.
Endnotes
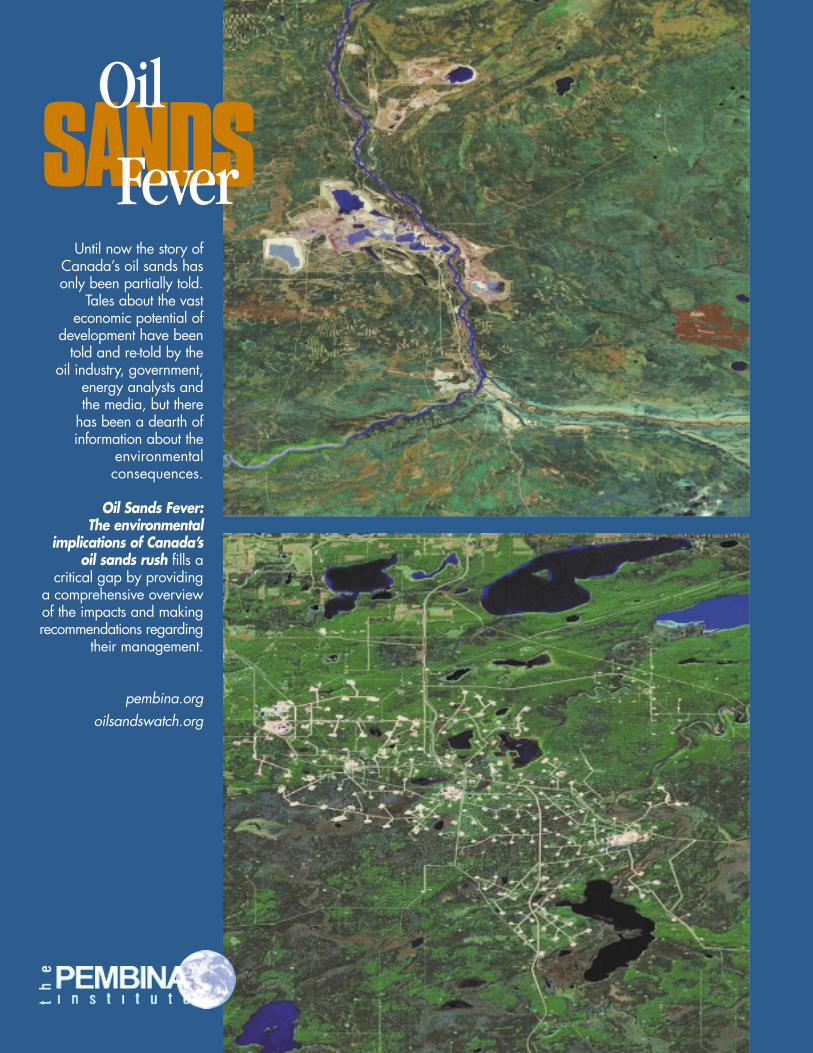
SANDSFeverOil
Until now the story ofCanada’s oil sands hasonly been partially told.
Tales about the vasteconomic potential of
development have beentold and re-told by the
oil industry, government,energy analysts and the media, but there
has been a dearth ofinformation about the
environmental consequences.
Oil Sands Fever: The environmental
implications of Canada’soil sands rush fills a
critical gap by providing a comprehensive overviewof the impacts and makingrecommendations regarding
their management.
pembina.orgoilsandswatch.org