Embed Size (px)
Citation preview

1st
Sem
este
r
2019/2020
Philadelphia University Faculty of Engineering
Civil Engineering Department
SANITARY LABORATORY MANUAL
Prepared by Reviewed by
Eng.Isra’a Alsmadi Lab Instructor
Dr. Mohammad Younes Assistant Professor

Prepared by: Eng. Isra’a I. Al-Smadi
SYLLABUS
(Sanitary Laboratory)
Course number and name 0670444: Sanitary Laboratory
Credits and contact hours 1 Credit Hour
Instructor’s : Instructor: Eng.Isra’a Alsmadi
Text book, title, author, and year
“Sanitary Laboratory Manual”, (Prepared Eng.Isra’a Alsmadi/ Civil Engineering
Department/Philadelphia University),(2019)
Specific course information
Brief description of the content of the course (catalog description)
Determination of pH ,Preparation of Primary& Secondary Standards ,Acid –
Base Titration ,Determination of Acidity of Water, Determination of Alkalinity
of Water, Determination of Hardness Water, Determination Of Turbidity,
Determination Of Conductivity ,JAR Testing of Coagulation-Flocculation
Process, Determination of Solid and Determination of Dissolved Oxygen
Prerequisites
Prerequisite: Sanitary Engineering (0670443)
Course objectives:
The students will be able to understand and follow procedures, through lab manual.
The students will be able to work in teams, as experiments are conducted in
groups.
The students will be able to prepare a technical report, as the findings of
experiments have to be reported in well-structured format.
The students will be able to critically evaluate their results, by comparing them
with related published information.
The students will be able to understand how results of a practical are influenced by
the status of the apparatus.

Prepared by: Eng. Isra’a I. Al-Smadi
Course outcomes:
Students who successfully complete this course will have demonstrated ability to:
Identify, Solutions it is types, and the characteristics of each type.
Understand basic units of measurement, convert units, and appreciate their
magnitudes.
Measure some of the important characteristics of water quality such as pH,
alkalinity, acidity …etc.
Use word and excel software in writing reports.
Compare the results of analytical models introduced in the lab to the standards of
drinking water.
List of experiment:
1) Determination of pH
2) Preparation of Primary& Secondary Standards
3) Acid – Base Titration
4) Determination of Acidity of Water
5) Determination of Alkalinity of Water
6) Determination of Hardness Water
7) Determination of Turbidity
8) Determination of Conductivity
9) JAR Testing of Coagulation-Flocculation Process
10) Determination of Solid
11) Determination of Dissolved Oxygen
Evaluation
60 % Lab work [quizzes and lab reports]
40 % final Exam
Attendance and Course Policies
Absence: - two absences are allowed with accepted excuse and the experiments must be
recovered. Any exceeding for the permitted absences will be restricted from taking the
final exam
Reports: no late submission will be accepted. Missing reports will result in a zero grade.
Cheating is not tolerated. A student guilty of cheating will receive a zero grade. Cheating is
any form of copying of another student’s work, or allowing the copying of your own work.
The late on the lab time: - the student is allowed to enter the lab after 10 minutes from
the starting the lab only.
Discipline: any student make any disturbance in the lab will be dismissed immediately
Dismissing: no student is allowed to dismiss from the lab until the lab is finished for any
excuse.
Quizzes: - it is about the previous experiment and it is given at the end of each lab after
finishing the experiment
All cellular phones must be turned off before lab begins.

Prepared by: Eng. Isra’a I. Al-Smadi
List of Experiments
1) Determination of pH
2) Preparation of Primary& Secondary Standards
3) Acid – Base Titration
4) Determination of Acidity of Water
5) Determination of Alkalinity of Water
6) Determination of Hardness Water
7) Determination of Turbidity
8) Determination of Conductivity
9) JAR Testing of Coagulation-Flocculation Process
10) Determination of Solid
11) Determination of Dissolved Oxygen

Prepared by: Eng. Isra’a I. Al-Smadi
HOW TO WRITE A LAB REPORT?
LAB REPORT ESSENTIALS
1. Title Page
It would be a single page that states:
a. The title of the experiment.
b. Your name and the names of any lab partners.
c. Your instructor's name.
d. The date the lab was performed or the date the report was submitted.
2. Title
The title says what experiment you did.
3. Introduction / Purpose
Usually, the Introduction is one paragraph that explains the objectives or purpose of the
lab. Sometimes an introduction may contain background information, briefly summarize
how the experiment was performed, state the findings of the experiment, and list the
conclusions of the investigation. Even if you don't write a whole introduction, you need
to state the purpose of the experiment, or why you did it. This would be where you state
your hypothesis.
4. Materials
List everything needed to complete your experiment.
5. Methods or procedure
Describe the steps you completed during your investigation. This is your procedure. Be
sufficiently detailed that anyone could read this section and duplicate your experiment. Write it
as if you were giving direction for someone else to do the lab. It may be helpful to provide a
Figure to diagram your experimental setup.
6. Data and Results
Numerical data obtained from your procedure usually is presented as a table. Data encompasses
what you recorded when you conducted the experiment. It's just the facts, not any interpretation
of what they mean.
Prepared by: Eng. Isra’a I. Al-Smadi
7. Discussion or Analysis
The Analysis section contains any calculations you made based on those numbers. This is where
you interpret the data and determine whether or not a hypothesis was accepted. This is also
where you would discuss any mistakes you might have made while conducting the investigation.
You may wish to describe ways the study might have been improved.
8. Conclusions
Most of the time the conclusion is a single paragraph that sums up what happened in the
experiment, whether your hypothesis was accepted or rejected, and what this means.
9. Figures & Graphs
Graphs and figures must both be labeled with a descriptive title. Label the axes on a graph,
being sure to include units of measurement.
10. References
If your research was based on someone else's work or if you cite facts that require
documentation, then you should list these references.
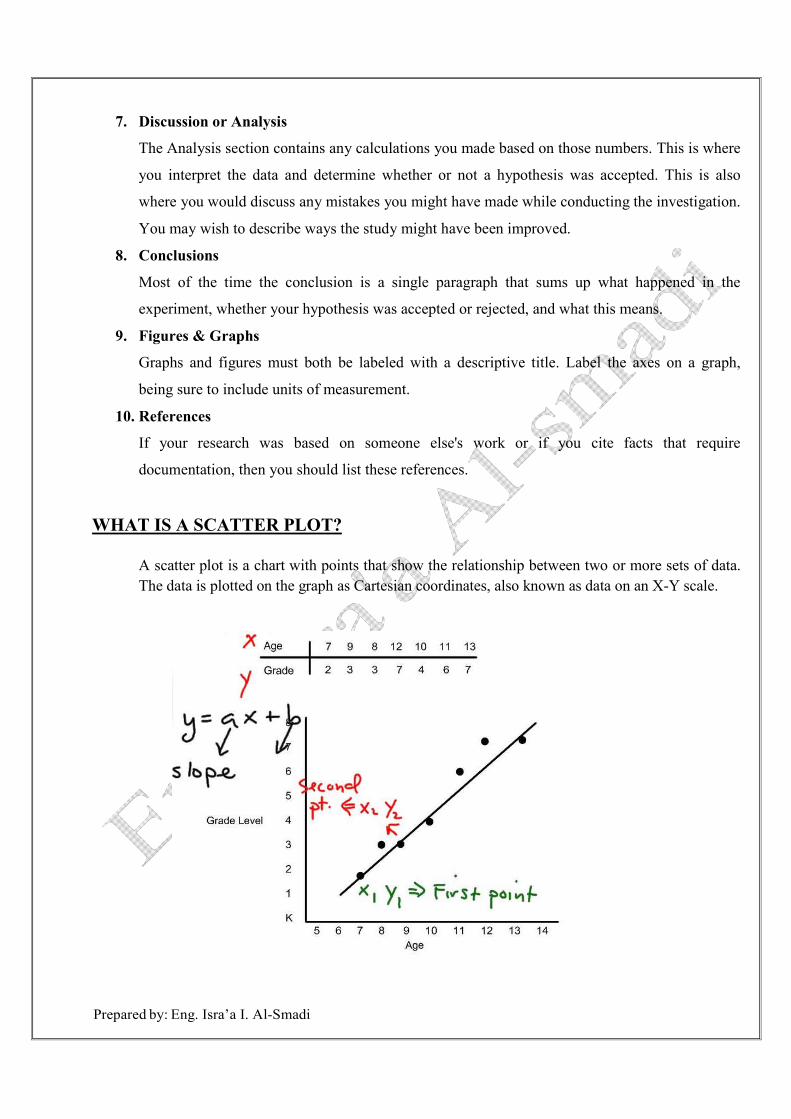
WHAT IS A SCATTER PLOT?
A scatter plot is a chart with points that show the relationship between two or more sets of data.
The data is plotted on the graph as Cartesian coordinates, also known as data on an X-Y scale.

Prepared by: Eng. Isra’a I. Al-Smadi
Laboratory Safety Requirements
صحیةاللعامة في مختبر السلامة اءات ارجا
:اتلمختبرامشرفي ولطلبة التالیة من قبل العامة السلامة دئ التقید بمباایجب
.لملابسوالیدین والسلامة للجسم العمل لتأمبن اء ارواب اتدرلطلبة باام الزورة اضر )1(
.لمختبراخل دالنقالة اتف الھوام استخدایمنع )2(
سمير عمل لمختبر لمن لیس لھاخل داجد التوایمنع )3(
ايلمختبر للعمل في ازیة ھجان ضمات وضیارلادوات والاوالمختبر اعلى نظافة ظ لحفاایجب )4(
.قتو
.هلانتبام اعد عن ناتجةادث یة حوع المختبر منعا لوقواخل دالركض اح او المزایمنع )5(
.ضلمراو التعب العمل في حالة ایمنع )6(
.لعملاي في حالة ة وھلاجھزایمنع تنظیف )7(
.لعملت الاواة وطلاجھزت واضیارلاالمحافظة على نظافة ایجب )8(
.ةلاجھزالك لتامین سلامة رب وذلتجاا من ءلانتھاابعد ة لاجھزء افااطلتاكد من ا )9(
:ما یلية عاالمختبر مرس امھندف او لمشرا علىو
.لمختبردرة اقبل مغاالاحھزة لكھربائي عن ر التیاالتاكد من فصل ا )1(
.درةلمغااقبل ء لماء والكھرباء افااطلتاكد من ا )2(
.مسبقاة لاجھزالتاكد من صلاحیة واا اؤھجري المنورب التجاة والمسبق للاجھزالتحضیر ایجب )3(
.لمختبرالي في ولاف اللاسعاوق یجب توفر صند )4(
للمختبر لرئیسيا بلباا من قریب نمكا في ضعھاوو لمختبرا في مناسبة حریق فایةط توفر یجب )5( .زلغات انااسطووالطاقة ارة والحردر اا عن مصادھبعاوا .لیھال الوصوالتسھیل

Prepared by: Eng. Isra’a I. Al-Smadi
Page | 8
Experiment 1
DETERMINATION OF pH
OBJECTIVES:
To measure the pH for different samples.
APPARATUS:
pH meter Standard flasks
Wash Bottle Magnetic Stirrer
Tissue Paper Funnel
REAGENTS:
Buffers Solutions of pH 4.01, 7.0 and 9.2
Potassium Chloride
Distilled Water
THEORY:
The term pH refers to the measure of hydrogen ion concentration in a solution and
defined as “the negative log of H+ ions concentration in water and wastewater”. The
values of pH 0 to a little less than 7 are termed as acidic and the values of pH a little
above 7 to 14 are termed as basic. When the concentration of H+ and OH– ions are
equal then it is termed as neutral pH.
The pH electrode used in the pH measurement is a combined glass electrode. It
consists of sensing half cell and reference half cell, together form an electrode system.
The sensing half cell is a thin pH sensitive semi permeable membrane, separating two
solutions, viz., the outer solution, the sample to be analyzed and the internal solution
enclosed inside the glass membrane and has a known pH value. An electrical potential
is developed inside and another electrical potential is developed outside, the difference
in the potential is measured and is given as the pH of the sample.

Prepared by: Eng. Isra’a I. Al-Smadi
Page | 9
Drinking water with a pH between 6.5 and 8.5 is generally considered satisfactory.
Acidic waters tend to be corrosive to plumbing and faucets, particularly if the pH is
below 6. Alkaline waters are less corrosive. Waters with a pH above 8.5 may tend to
have a bitter taste.
PROCEDURE:
CALIBRATING THE INSTRUMENT
Using the buffer solutions calibrate the instrument.
Step 1
In a 100 mL beaker take pH 9.2 buffer solution and place it in a magnetic stirrer,
and stir well.
Now place the electrode in the beaker containing the stirred buffer and check for
the reading in the pH meter.
If the instrument is not showing pH value of 9.2, using the calibration knob adjust
the reading to 9.2.
Take the electrode from the buffer, wash it with distilled water and then wipe
gently with soft tissue.
Step 2
In a 100 mL beaker take pH 7.0 buffer solution and place it in a magnetic stirrer,
and stir well.
Now place the electrode in the beaker containing the stirred buffer and check for
the reading in the pH meter.
If the instrument is not showing pH value of 7.0, using the calibration knob adjust
the reading to 7.0.
Take the electrode from the buffer, wash it with distilled water and then wipe
gently with soft tissue.
Step 3
In a 100 mL beaker take pH 4.0 buffer solution and place it in a magnetic stirrer,
and stir well.
Now place the electrode in the beaker containing the stirred buffer and check for
the reading in the pH meter.
If the instrument is not showing pH value of 4.0, using the calibration knob adjust
the reading to 4.0.

Prepared by: Eng. Isra’a I. Al-Smadi
Page | 10
Take the electrode from the buffer, wash it with distilled water and then wipe
gently with soft tissue.
Now the instrument is calibrated.
TESTING OF SAMPLE
In a clean dry 100 mL beaker take the water sample and place it in a magnetic
stirrer and stir well.
Now place the electrode in the beaker containing the water sample and check for
the reading in the pH meter. Wait until you get a stable reading. Repeat this step
for different water samples and record each sample pH value.
Take the electrode from the water sample, wash it with distilled water and then
wipe gently with soft tissue.
TABLE OF OBSERVATIONS AND CALCULATIONS:
measure the value of pH of the given water sample, by using the pH meter at
different temperatures ,then fill the readings obtained into the following table :
Sample No
Temperature of Sample (ºC)
pH
1.
2.
3.
4.
5.

Prepared by: Eng. Isra’a I. Al-Smadi
Page | 11
CONCLUSION AND RECOMMENDATIONS:
What are alternative methods for determining the pH of aqueous samples?
What are typical pH values of drinking water in Jordan? How do your data
compare with these values?
Discuss the relationship between (a) pH and hydrogen ion concentration (b) pH
and hydroxide ion concentration?
What are the potential health and environmental effects if any of extreme pH
values? (for humans)
Classify these samples for acidic ,basic or neutral
Arrange them according the pH values.

Prepared by: Eng. Isra’a I. Al-Smadi
Page | 12
Experiment 2
PREPARATION OF PRIMARY& SECONDARY STANDARDS
OBJECTIVES:
Define standard, explain its uses, classify standard with proper example and explain
various properties of standards
Prepare a primary and secondary solution.
Exchange between concentration expressions.
APPARATUS:
Burette 25 ml Beaker 500 ml
pH meter Magnetic stirrer
Volumetric flask 100 ml Erlenmeyer flask 250 ml
Analytical balance
REAGENTS:
Sodium carbonate Na2CO3 Standard buffers
Sulfuric acid solution H2SO4 Methyl orange indicator
THEORY:
Standards are materials containing a precisely known concentration of a substance for
use in quantitative analysis.
Standards can be divided into two types:
Primary standard
Secondary standard
The Primary standard is a reagent that is extremely pure, stable, has no waters of
hydration, and has a high molecular weight .

Prepared by: Eng. Isra’a I. Al-Smadi
Page | 13
Some primary standards for titration of acids:
sodium carbonate: Na2CO3, mol wt. = 105.99 g/mol
Tris-(hydroxymethyl) aminomethane (TRIS or THAM): (CH2OH)3CNH2, mol wt.
= 121.14 g/mol
Some primary standards for titration of bases:
potassium hydrogen phthalate (KHP): KHC8H4O4, mol wt. = 204.23 g/mol
potassium hydrogen iodate: KH(IO3)2, mol wt. = 389.92 g/mol
Some primary standards for redox titrations:
potassium dichromate: K2Cr2O7, mol wt. = 294.19 g/mol
The Secondary Standards is a standard that is prepared in the laboratory for a specific
analysis. It is usually standardized against a primary standard.
Normality is a measure of concentration equal to the gram equivalent weight per liter of
solution. Gram equivalent weight is the measure of the reactive capacity of a molecule.
Molarity concentration unit, defined to be the number of moles of solute divided by the
number of liters of solution.
Molality of a solution is defined as the amount of substance (in mol) of solute, divided
by the mass (in kg) of the solvent .
How to prepare .02N Na2CO3?
By using the following equation:
N = weight /(equivalent weight ∗ volume)
1. We need to know the weight that makes 0.02N. From the above equation :
Weight = N ∗ equivalent weight ∗ volume
2. The equivalent weight is unknown!!! So ,
equivalent weight = molecular weight /charge
Where:
The molecular weight is known = 106 gram/mol (23*2+3*16+12)
The charge = 2, by the following relationship:
Na2CO3 2Na + + CO3-2. (The charge = 2).
Prepared by: Eng. Isra’a I. Al-Smadi
Page | 14
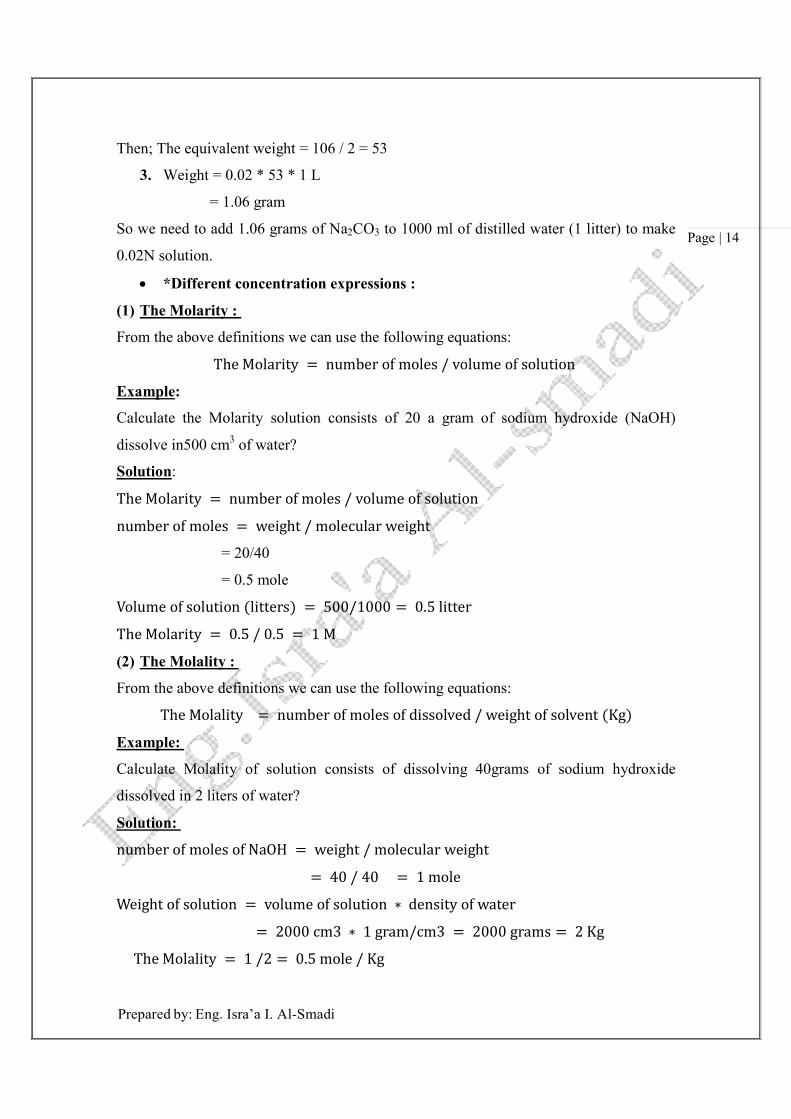
Then; The equivalent weight = 106 / 2 = 53
3. Weight = 0.02 * 53 * 1 L
= 1.06 gram
So we need to add 1.06 grams of Na2CO3 to 1000 ml of distilled water (1 litter) to make
0.02N solution.
*Different concentration expressions :
(1) The Molarity :
From the above definitions we can use the following equations:
The Molarity = number of moles / volume of solution
Example:
Calculate the Molarity solution consists of 20 a gram of sodium hydroxide (NaOH)
dissolve in500 cm3 of water?
Solution:
The Molarity = number of moles / volume of solution
number of moles = weight / molecular weight
= 20/40
= 0.5 mole
Volume of solution (litters) = 500/1000 = 0.5 litter
The Molarity = 0.5 / 0.5 = 1 M
(2) The Molality :
From the above definitions we can use the following equations:
The Molality = number of moles of dissolved / weight of solvent (Kg)
Example:
Calculate Molality of solution consists of dissolving 40grams of sodium hydroxide
dissolved in 2 liters of water?
Solution:
number of moles of NaOH = weight / molecular weight
= 40 / 40 = 1 mole
Weight of solution = volume of solution ∗ density of water
= 2000 cm3 ∗ 1 gram/cm3 = 2000 grams = 2 Kg
The Molality = 1 /2 = 0.5 mole / Kg

Prepared by: Eng. Isra’a I. Al-Smadi
Page | 15
PROCEDURE:
1) Prepare standard Na2CO3 with 0.02N (by adding 10.6 grams of Na2CO3 to 1000
ml of distilled water).
2) Dissolve concentrated sulfuric acid H2SO4 with unknown volume to make 1000
ml solution.
3) Use the burette and fill it to the mark with the acid solution.
4) Put Na2CO3 with volume of 50 ml in Erlenmeyer flask, then add 5 drops of
Methyl Orange Indicator and place the flask on the Magnetic Stirrer.
5) While stirring, add acid slowly until the orange color disappear and pink appear.
6) Record the volume of the used H2SO4.
7) Record PH of the solution after titration (~=4.3).
8) Repeat the titration more times by follow the pervious steps, and measure the
H2SO4 volume used by change Na2CO3 volume.
TABLE OF OBSERVATIONS AND CALCULATIONS:
We want to calculate the normality of H2SO4 by using the following equation:
N1V1 = N2V2
Where,
N1 = normality of acid solution (unknown)
V1 = the volume of acid solution used.
N2 = normality of base solution.
V2 = the volume of base solution used.
Then fill the following data table:
N1 V1 V2 N2 #
1
2
3
4
5

Prepared by: Eng. Isra’a I. Al-Smadi
Page | 16
CONCLUSION AND RECOMMENDATIONS:
Compare between the primary and the secondary standards
What is an indicator? Which indicator is used in the titration? Can the titration be
performed by using some other indicator?
Explain the term ‘end point’?
What do you mean by 1.0 M solution?
Prepared by: Eng. Isra’a I. Al-Smadi
Page | 17
Experiment 3
ACID –BASE TITRATION CURVE & ACID –BASE INDICATORS
OBJECTIVES:
Learn about the interaction between acids and bases.
Finding the equivalent point of acid and base reaction
APPARATUS:
pH meter Beakers different sizes
Magnetic stirrer Graduated cylinder
Burettes Erlenmeyer flask 250 ml
REAGENTS:
Na2CO3 Phenolphthalein indicator solution
H2SO4 Methyl orange indicator solution
THEORY:
Acids are a solution have a pH below 7.0, a sour taste, releases hydroxyl ions in water,
and turn litmus paper red.
Acids are divided into two main classes
Strong acids: are very corrosive and cause severe skin burns, examples are
hydrochloric acid, nitric acid, and sulfuric acid
Also called mineral or inorganic acids.
Weak acids are mildly corrosive and normally do not affect skin, examples are
acetic acid (vinegar), citric acid (citrus fruit juice acid), and tartaric acid (used
in making mayonnaise). Also called natural or organic acids.
Bases are solutions with a pH greater than 7, Bases tend to taste bitter and feel slippery.
At home, we use bases as cleaning agents and as antacid medications. Common examples
of bases found at home include soaps, lye (found in oven cleaners, for example), milk of
magnesia, and Tums. Each has a pH value greater than 7, has the potential for accepting
free hydrogen, and can neutralize acids.

Prepared by: Eng. Isra’a I. Al-Smadi
Page | 18
When a strong acid and a strong base solution are mixed, a neutralization reaction
occurs, and the products do not have characteristics of either acids or bases. Instead, a
neutral salt and water are formed. Look at the reaction below:
HCl (aq) + NaOH (aq) H2O (l) + NaCl (aq)
The anion from the acid (Cl–) reacts with the cation from the base (Na+) to give a salt,
and a salt is defined as any compound formed whose anion came from an acid and whose
cation came from a base.
When a strong acid and a weak base are mixed, the resulting salt will be acidic.
When a strong base and a weak acid are mixed, the resulting salt will be basic
ex: K2CO3 (basic salt) is formed when the base, potassium hydroxide (which is
strong), reacts with the acid, H2CO3 (which is weak).
Acid–Base titration is the determination of the concentration of an acid or base by
exactly neutralizing the acid or base with an acid or base of known concentration. This
allows for quantitative analysis of the concentration of an unknown acid or base solution.
It makes use of the neutralization reaction that occurs between acids and bases.
Titration involves the slow addition of one solution where the concentration is known to
a known volume of another solution where the concentration is unknown until the
reaction reaches a desired level. For acid/base titrations, a color change from a pH
indicator is reached or a direct reading using a pH meter. This information can be used to
calculate the concentration of the unknown solution.
If the pH of an acid solution is plotted against the amount of base added during a titration,
the shape of the graph is called a titration curve. All acid titration curves follow the
same basic shapes.
At the beginning, the solution has a low pH and climbs as the strong base is added. As the
solution nears the point where all of the H+ is neutralized, the pH rises sharply and then
levels out again as the solution becomes more basic as more OH- ions are added.

Prepared by: Eng. Isra’a I. Al-Smadi
Page | 19
The first curve shows a strong acid being titrated by a strong base. There is the initial
slow rise in pH until the reaction nears the point where just enough bases are added to
neutralize all the initial acid. This point is called the equivalence point. For a strong
acid/base reaction, this occurs at pH = 7. As the solution passes the equivalence point, the
pH slows its increase where the solution approaches the pH of the titration solute.
Figure 1: Acid base titration curves

Prepared by: Eng. Isra’a I. Al-Smadi
Page | 20
PROCEDURE:
1. Prepare acid solution (H2SO4 0.05 N). 2. Prepare base solution (Na2CO3 0.02 N). 3. Put Na2CO3 with volume of 50 ml in Erlenmeyer flask, and then add Phenolphthalein
indicator to have a pink color. 4. Then measure the pH value before titration starting. (Needed titration solution
volume. =0). 5. then start titrate by putting the acid in the burette .the base color will change from the
pink to the colorless 6. Here, you will measure the pH value, which should be around 8.3, and measure the
needed titration solution volume. (equivalent point 1 ) 7. Next, Add the Methyl orange indicator, which give the yellow color to the solution. 8. Then start titrate by add the H2SO4 from the burette .the solution color will change
from the yellow to the red. 9. Now, you will measure the pH value, which should be around 4.5, and measure the
needed titration solution volume. (equivalent point 1 ) Note: we prepare the Phenolphthalein indicator solution by weighting 1 gram Phenolphthalein indicator and dissolve it in 100 ml alcohol (ethanol C2H2OH).

Prepared by: Eng. Isra’a I. Al-Smadi
Page | 21
TABLE OF OBSERVATIONS AND CALCULATIONS:
Show me how can you prepare the acid and base solution needed?
From the experiment results, complete the following data table:
pH
Titration volume
solution(ml)
#
0 1
5 2
10 3
15 4
20 5
25 6
30 7
35 8
40 9
45 10
50 11
GRAPHICAL RELATIONSHIP:
(1) Draw the titration curve by using the data in the table above.
(2) Specify the two equivalent points from the table : (where the color changed )
(3) From the curve determine the type of the acid and the base which you used.
Equivalent points 1: …………… titration volume 1: ………….
Equivalent points 2: …………….titration volume 2: ………….
Prepared by: Eng. Isra’a I. Al-Smadi
Page | 22
CONCLUSION AND RECOMMENDATIONS:
After that, Compare between your experimentally point titration volume and pH
with the actual ones, where:
Equivalent points 1(actual) at pH = 8.3
Equivalent points 2(actual) at pH = 4.5
And calculate the errors %.
What is the difference between an end point and an equivalence point?

Prepared by: Eng. Isra’a I. Al-Smadi
Page | 23
Experiment 4
DETERMINATION OF ACIDITY OF WATER
OBJECTIVES:
To determine the acidity of given water sample
APPARATUS:
Pipette Beakers different sizes
Magnetic stirrer Graduated cylinder
Burettes Erlenmeyer flask 500 ml
REAGENTS:
NaOH Phenolphthalein indicator solution
Distilled water Methyl orange indicator solution
THEORY:
Acidity is a measure of the capacity of water to neutralize bases.
Acidity is the sum of all titrable acid present in the water sample. Strong mineral acids,
weak acids such as carbonic acid, acetic acid present in the water sample contributes to
acidity of the water. Usually dissolved carbon dioxide (CO2) is the major acidic
component present in the unpolluted surface waters.
The volume of standard alkali required to titrate a specific volume of the sample to pH
8.3 is called phenolphthalein acidity (Total Acidity).
The volume of standard alkali required to titrate a specific volume of the water sample
(wastewater and highly polluted water) to pH 3.7 is called methyl orange acidity
(Mineral Acidity).To determine the acidity( as CaCO3 equivalent mg/l) for given water
sample , we will use the following equation :
������� ������� = ������� �� ���� ∗ � ���� ∗ �� ∗ ����
������ ������
����� ������� = ������� �� ���� ∗ � ���� ∗ �� ∗ ����
������ ������
Where: N is the Normality of NaOH.
Prepared by: Eng. Isra’a I. Al-Smadi
Page | 24
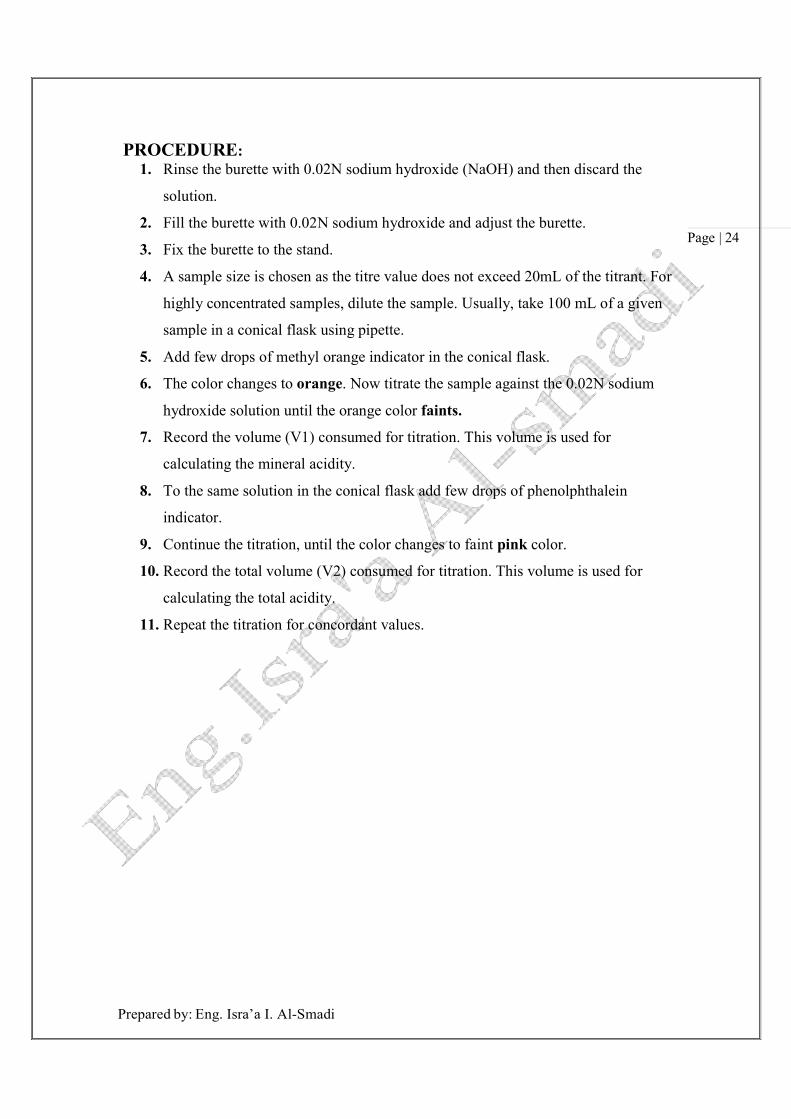
PROCEDURE: 1. Rinse the burette with 0.02N sodium hydroxide (NaOH) and then discard the
solution.
2. Fill the burette with 0.02N sodium hydroxide and adjust the burette.
3. Fix the burette to the stand.
4. A sample size is chosen as the titre value does not exceed 20mL of the titrant. For
highly concentrated samples, dilute the sample. Usually, take 100 mL of a given
sample in a conical flask using pipette.
5. Add few drops of methyl orange indicator in the conical flask.
6. The color changes to orange. Now titrate the sample against the 0.02N sodium
hydroxide solution until the orange color faints.
7. Record the volume (V1) consumed for titration. This volume is used for
calculating the mineral acidity.
8. To the same solution in the conical flask add few drops of phenolphthalein
indicator.
9. Continue the titration, until the color changes to faint pink color.
10. Record the total volume (V2) consumed for titration. This volume is used for
calculating the total acidity.
11. Repeat the titration for concordant values.
Prepared by: Eng. Isra’a I. Al-Smadi
Page | 25
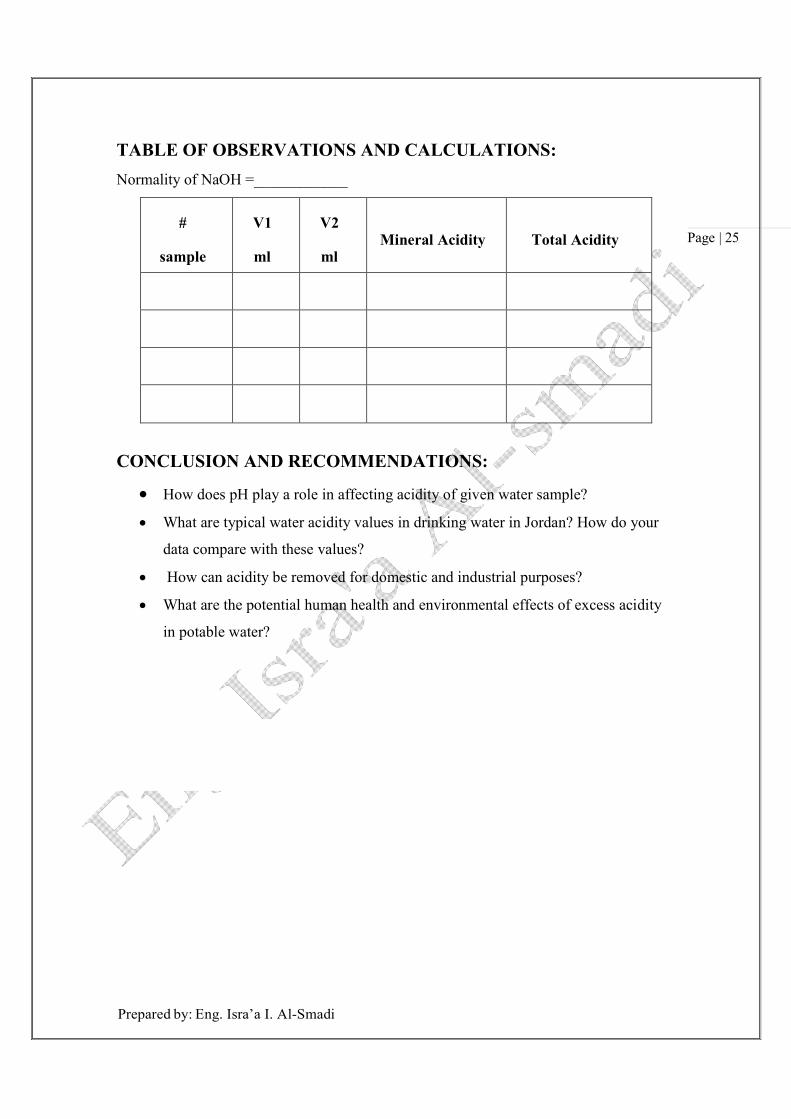
TABLE OF OBSERVATIONS AND CALCULATIONS:
Normality of NaOH =____________
#
sample
V1
ml
V2
ml Mineral Acidity Total Acidity
CONCLUSION AND RECOMMENDATIONS:
How does pH play a role in affecting acidity of given water sample?
What are typical water acidity values in drinking water in Jordan? How do your
data compare with these values?
How can acidity be removed for domestic and industrial purposes?
What are the potential human health and environmental effects of excess acidity
in potable water?

Prepared by: Eng. Isra’a I. Al-Smadi
Page | 26
Experiment 5
DETERMINATION OF ALKALINITY OF WATER
OBJECTIVES:
To determine the alkalinity of given water sample
APPARATUS:
Pipette Beakers different sizes
Magnetic stirrer Graduated cylinder
Burettes Erlenmeyer flask 500 ml
REAGENTS:
H2SO4 Phenolphthalein indicator solution
Distilled water Methyl orange indicator solution
THEORY:
Alkalinity of water is a measurement of its capacity to neutralize the acid .Alkalinity is
important for fish and aquatic life because it protects or buffers against rapid pH changes.
Higher alkalinity levels in surface waters will buffer acid rain and other acid wastes and
prevent pH changes that are harmful to aquatic life. But Large amount of alkalinity
imparts bitter taste in water.
The alkalinity of water can be determined by titrating the water sample with Sulphuric
acid of known values of pH, volume and concentrations. Based on stoichiometry of the
reaction and number of moles of Sulphuric acid needed to reach the end point, the
concentration of alkalinity in water is calculatedusing the following formula as CaCO3
equivalent mg/l
���������� = ������� �� H2SO� ∗ � H2SO� ∗ �� ∗ ����
������ ������
Where: N is the Normality ofH�SO4.

Prepared by: Eng. Isra’a I. Al-Smadi
Page | 27
3
3
PROCEDURE: 1. Rinse the burette with 0.02N Sulphuric acid H2SO4 and discard the solution.
2. Fill the burette with 0.02N sulphuric acid and adjust it to zero.
3. Fix the burette in the stand.
4. Using a measuring cylinder exactly measure 100 mL of sample and pour it into a
250 mL of conical flask.
5. Add few drops of phenolphthalein indicator to the contents of conical flask. The
color of the solution will turn to pink. This color change is due to alkalinity of
hydroxyl ions in the water sample.
6. Titrate it against 0.02N sulphuric acid till the pink color disappears. This
indicates that all the hydroxyl ions are removed from the water sample. Record
the titter value (V1).This value is used in calculating the phenolphthalein
alkalinity.
7. To the same solution in the conical flask add few drops of methyl orange
indicator. The color of the solution turns to orange.
8. Continue the titration from the point where stopped for the phenolphthalein
alkalinity. Titrate till the solution becomes pink. The entire volume (V2) of
sulphuric acid is noted down and it is accountable in calculating the total
alkalinity.
9. The value of titration is 8.3mL.
10. Repeat the titration for concordant values.

Prepared by: Eng. Isra’a I. Al-Smadi
Page | 28
TABLE OF OBSERVATIONS AND CALCULATIONS:
Normality of H2SO4 =____________
#
sample
V1
H2SO4
V2
H2SO4
Phenolphthalein
Alkalinity Total alkalinity
CONCLUSION AND RECOMMENDATIONS:
Which is the major form of alkalinity? How is it formed?
What are typical phenolphthalein and total alkalinity values for rivers, streams
and drinking water in Jordan or the world? How do your data compare with
these values?
Why does the pH change on aerating the water?
Why do we should use CO2 free distilled water for analysis?
Are there other methods that can determine the alkalinity in water samples?

Prepared by: Eng. Isra’a I. Al-Smadi
Page | 29
Experiment 6
DETERMINATION OF TOTAL HARDNESS
OBJECTIVES:
To determine the hardness of given sample of water.
APPARATUS:
Pipette Beakers different sizes
Magnetic stirrer Graduated cylinder
Burettes Erlenmeyer flask 500 ml
REAGENTS:
Buffer solutions Standard EDTA solution
Distilled water EBT (Erichrome Black T )
THEORY:
Hardness is the ability of water to neutralize soap and it is a natural characteristic of
water so as hardness increases, more soap is needed to achieve the same level of cleaning
due to the interactions of the hardness ions with the soap.
Chemically, hardness is often defined as the capacity of cations in water (Ca+2, Mg+2,
Sr+2, Mn+2 and Fe+2) to replace the Sodium (Na) or Potassium (K) ions in soap and form
insoluble products.
Classification of hardness:
There are three methods to classify the hardness:
1. According to the removing method:
Temporary hardness : can be removed simply by boiling the water
Permanent hardness: cannot be removed by boiling but can often be
removed by chemical treatment
Total hardness equals the sum Temporary hardness and Permanent hardness.
2. According to the cause(cations):
Calcium hardness (Ca+2)

Prepared by: Eng. Isra’a I. Al-Smadi
Page | 30
Magnesium hardness(Mg+2)
Total hardness equals the sum Calcium hardness and Magnesium
hardness
3. According to the type of anions:
Carbonate hardness: Carbonate hardness is usually due to the presence of
bicarbonate [Ca (HCO3)2 and Mg (HCO3)2] and carbonate (CaCO3 and
MgCO3) salts.
Noncarbonate hardness: Noncarbonate hardness is contributed by salts such
as calcium chloride (CaCl2), magnesium sulfate (MgSO4), and magnesium
chloride (MgCl2).
Total hardness equals the sum of carbonate and noncarbonate
hardness.
Hardness is usually reported as equivalents of mg/L calcium carbonate (CaCO3) and is
generally classified as soft, moderately hard, hard, and very hard. The classification
scheme used by the U.S. Environmental Protection Agency (EPA) is shown in Table 1.
Table (1): Water hardness classifications (reported as CaCO3 equivalents) by the
U.S. EPA (EPA 1986).
Classification CaCO3 equivalent (mg/L)
Soft <75
Moderately hard 75–150
Hard 150–300
Very hard >300
The measurement of water hardness is important in water quality monitoring and is
usually performed by means of an Ethylenediaminetetraacetic acid (EDTA) complexation
titration. By convention, the total hardness of water is quoted in terms of the parts per
million of calcium carbonate, ignoring the contribution of magnesium salts. In this
method a sample of tap water will be analyzed.

Prepared by: Eng. Isra’a I. Al-Smadi
Page | 31
Calcium and magnesium ions form 1:1 complexes with EDTA according to the
equations:
The indicators used are Erichrome Black T which changes from red to blue in the
presence of excess EDTA.
And hydroxynaphthol blue which changes from
The separate calcium and magnesium concentrations can then be found by a separate
titration at higher pH. By adding NaOH, the magnesium precipitate as Mg (OH) 2 and the
calcium can be determined separately. Simple subtraction from the total concentration of
magnesium + calcium, the magnesium concentration can also be found.
Generally hardness is calculated using the following equation:
Total Hardness (as CaCO� equivalent mg/l) = V���� ∗ N ∗ 50.000
V������
Where,
V EDTA: volume of EDTA needed to titration.
N: EDTA normality = 0.02 N
50: equivalent weight of CaCO3.
1000 = (Convert the volume from ml to litter)
V sample: the volume of the measured sample.

Prepared by: Eng. Isra’a I. Al-Smadi
Page | 32
PROCEDURE:
The total hardness in Tap water :
1) Fill 100 ml of tap water.
2) To rise the PH reading (9.5 – 10 ) , we need to put amount of ammonia
3) Add EBT indicator which will give you pink (wine red).
4) Add EDTA titrant until the color changes to blue & record volume of EDTA that
use.
Calcium hardness in Tap water :
1) Fill 100 ml tap water.
2) To rise PH reading ( 12 – 13 ) ,use amount of NaOH with [ 1 N ] buffer
3) Add murxide indicator which will give you pink color.
4) Add EDTA titrant until the color changes to purple & record volume of EDTA
that use.
TABLE OF OBSERVATIONS AND CALCULATIONS:
Hardness type Total hardness EDTA volume
ml Sample
volume ml Sample
20 1
50 2
100 3
150 4

Prepared by: Eng. Isra’a I. Al-Smadi
Page | 33
CONCLUSION AND RECOMMENDATIONS:
What is degree of hardness? How will you classify water in terms of degree of
hardness?
What are typical water hardness values in rivers, streams, lakes and drinking
water in Jordan/World?
Explain the significance of determination of hardness of water in environmental
engineering.
How can you remove permanent hardness from water?
What are the principal cations causing hardness in water and the major anions
associated with them?
Define softening. Why it is necessary? What are the advantages of soft water?

Prepared by: Eng. Isra’a I. Al-Smadi
Page | 34
Experiment 7
DETERMINATION OF TURBIDITY
OBJECTIVES:
To determine the turbidity of the given water sample
APPARATUS:
Turbidity meter Tissue Papers
Sample cell Thermometer
REAGENTS:
Distilled water
Different water sample
THEORY:
Turbidity is the term referring to the cloudiness of a solution and it is a qualitative
characteristic which is imparted by solid particles obstructing the transmittance of light
through a water sample. Turbidity often indicates the presence of dispersed and
suspended solids like clay, organic matter, silt, algae and other microorganisms.
Turbidity has some environmental impacts such as:
The colloidal material which exerts turbidity provides adsorption sites for
chemicals and for biological organism that may not be harmful.
They may be harmful or cause undesirable tastes and odors.
Disinfection of turbid water is difficult because of the adsorptive characteristics of
some colloids and because the solids may partially shield organisms from
disinfectant.
In natural water bodies, turbidity may impart a brown or other color to water and
may interfere with light penetration and photosynthetic reaction in streams and
lakes.
Turbidity increases the load on slow sand filters.

Prepared by: Eng. Isra’a I. Al-Smadi
Page | 35
Turbidity measurements are used to determine the effectiveness of treatment produced
with different chemicals and the dosages needed. Turbidity measurements help to gauge
the amount of chemicals needed from day-to-day operation of water treatment works.
Turbidity is based on the comparison of the intensity of light scattered by the sample
under defined conditions with the intensity of the light scattered by a standard reference
suspension under the same conditions. The turbidity of the sample is thus measured from
the amount of light scattered by the sample taking a reference with standard turbidity
suspension. The higher the intensity of scattered light the higher is the turbidity.
Formazin polymer is used as the primary standard reference suspension.
PROCEDURE:
1) To the sample cells, add turbidity free distilled water up to the horizontal mark,
wipe gently with soft tissue.
2) Place it in the turbidity meter such that the vertical mark in the sample cell should
coincide with the mark in the turbidity meter and cover the sample cell.
3) Now using the set zero knob, adjust the reading to zero.
4) To the sample cells, add sample water up to the horizontal mark, wipe gently with
soft tissue and place it in the turbidity meter such that the vertical mark in the
sample cell should coincide with the mark in the turbidity meter and cover the
sample cell.
5) Check for the reading in the turbidity meter. Wait until you get a stable reading.

Prepared by: Eng. Isra’a I. Al-Smadi
Page | 36
TABLE OF OBSERVATIONS AND CALCULATIONS:
Concentration-Turbidity relationship:
Temperature-Turbidity relationship:
GRAPHICAL RELATIONSHIP:
Draw a curve show the relationship between the concentration and the turbidity.
Draw a curve show the relationship between the temperature and the turbidity.
((The concentration is constant for all samples))
Sample # Concentration mg/l
Turbidity FNU
1
2
3
4
5
Sample # Temperature oC Turbidity FNU
1
2
3
4
5

Prepared by: Eng. Isra’a I. Al-Smadi
Page | 37
CONCLUSION AND RECOMMENDATIONS:
What are the alternative methods for determining the turbidity of aqueous
samples? How do they compare to this method?
Discuss the significance of determination of turbidity in sanitary engineering.
What are typical turbidity and TSS values of water in Jordan? How do your
data compare with these values? (Drinking, surface and ground water)
Discuss the nature of materials causing turbidity in:
River water during flash flood
Polluted river water
Domestic wastewater
What is the standard unit of turbidity?
What are NTU and FNU?
Comment on the relations between turbidity and temperature and concentration.
And why?

Prepared by: Eng. Isra’a I. Al-Smadi
Page | 38
Experiment 8
DETERMINATION OF CONDUCTIVITY
OBJECTIVES:
Measurer the electrical conductivity of water using conductivity meter and find the
relation between EC and TDS.
APPARATUS: Conductivity meter beakers
graduated cylinder Thermometer
REAGENTS:
Distilled water
Sodium chloride (NaCl)
THEORY:
Conductivity is an expression the ability of water to conduct electric current. This ability
affected by many conditions such as temperature, Concentrations of ions in the solution
and charge of dissolved solids.
Since the electrical conductivity of the water depends on the water temperature: the
higher the temperature, the higher the electrical conductivity would be. The electrical
conductivity of water increases by 2-3% for an increase of 1 degree Celsius of water
temperature. Many EC meters nowadays automatically standardize the readings to 25oC.
The commonly used units for measuring electrical conductivity of water are:
μS/cm (micro Siemens/cm) or dS/m (deci Siemens/m); Where: 1000 μS/cm = 1
dS/m
The electrical conductivity of water provides an estimate of the total amount of solids
dissolved in water TDS, Since the electrical conductivity is a measure to the capacity of
water to conduct electrical current, it is directly related to the concentration of salts
dissolved in water, and therefore to the Total Dissolved Solids (TDS). Salts dissolve into
positively charged ions and negatively charged ions, which conduct electricity.
Prepared by: Eng. Isra’a I. Al-Smadi
Page | 39
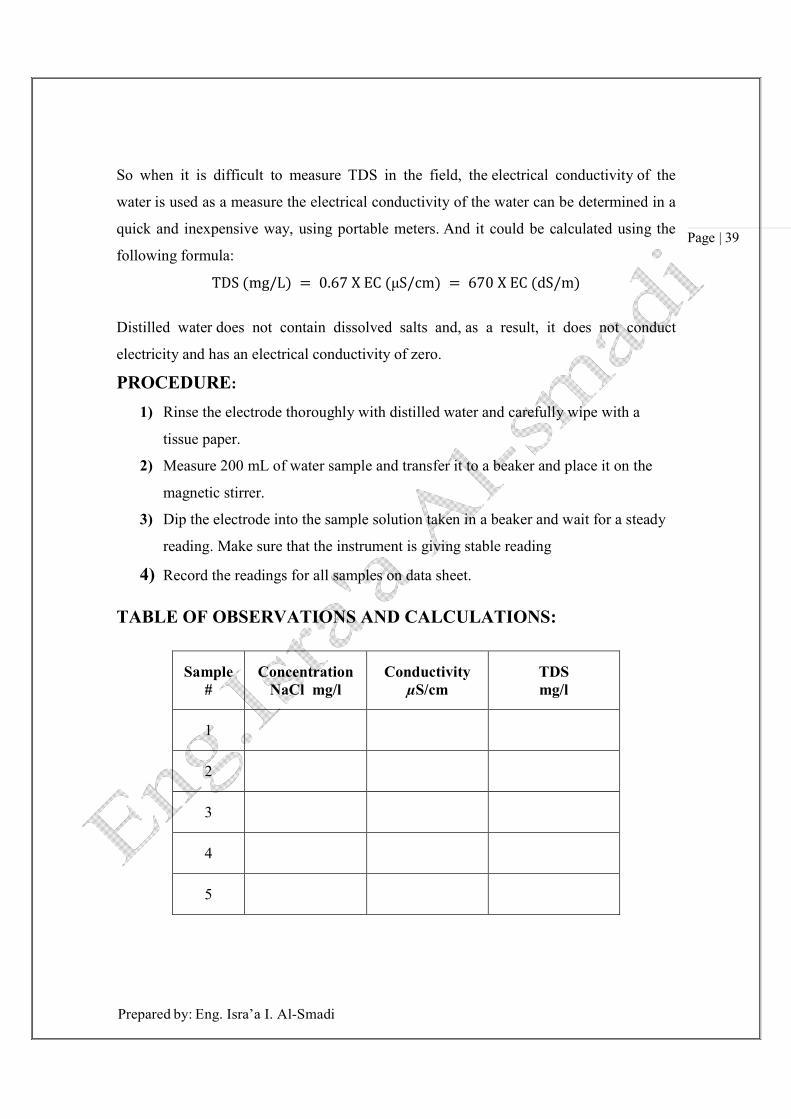
So when it is difficult to measure TDS in the field, the electrical conductivity of the
water is used as a measure the electrical conductivity of the water can be determined in a
quick and inexpensive way, using portable meters. And it could be calculated using the
following formula:
TDS (mg/L) = 0.67 X EC (μS/cm) = 670 X EC (dS/m)
Distilled water does not contain dissolved salts and, as a result, it does not conduct
electricity and has an electrical conductivity of zero.
PROCEDURE:
1) Rinse the electrode thoroughly with distilled water and carefully wipe with a
tissue paper.
2) Measure 200 mL of water sample and transfer it to a beaker and place it on the
magnetic stirrer.
3) Dip the electrode into the sample solution taken in a beaker and wait for a steady
reading. Make sure that the instrument is giving stable reading
4) Record the readings for all samples on data sheet.
TABLE OF OBSERVATIONS AND CALCULATIONS:
Sample #
Concentration NaCl mg/l
Conductivity µS/cm
TDS mg/l
1
2
3
4
5

Prepared by: Eng. Isra’a I. Al-Smadi
Page | 40
GRAPHICAL RELATIONSHIP:
Draw the concentration Vs conductivity.
Calculate the slope, which must be between ( 0.55– 0.9 )
CONCLUSION AND RECOMMENDATIONS:
What are the potential sources of error in this analytical determination? How
could they be overcome?
What are alternative methods for determining the TDS of aqueous samples?
What are typical conductivity and TDS values of drinking water in Jordan? How
do your data compare with these values?
What are the main sources of TDS in water and wastewater?
What are the potential health and environmental effects if any of extreme TDS
values?
What is the common conductivity reading for deionized, distilled, drinking and
waste water?

Prepared by: Eng. Isra’a I. Al-Smadi
Page | 41
Experiment 9
JAR TEST FOR OPTIMUM COAGULANT DOSE
(Coagulation-Flocculation)
OBJECTIVES:
To determine the optimum dosage of given coagulant
APPARATUS: Jar test apparatus Glass beakers
Pipette Thermometer
Turbidity meter Stopwatch
REAGENTS:
Distilled water Aluminum Sulphate (alum)
THEORY:
Coagulation/flocculation is the process of binding small particles in the water together
into larger, heavier clumps which settle out relatively quickly. The larger particles are
known as floc. Properly formed floc will settle out of water quickly in the sedimentation
basin, removing the majority of the water's turbidity. In colloid chemistry, flocculation
refers to the process by which fine particulates are caused to clump together into a floc.
The floc may then: float to the top of the liquid (creaming), settle to the bottom of the
liquid (sedimentation), or be readily filtered from the liquid.
Coagulants are used in water treatment plants
to remove natural suspended and colloidal matter,
to remove material which do not settle in plain sedimentation, and
To assist in filtration.
Alum [Al2 (SO4)3. 18H2O] is the most widely used coagulant. When alum solution is
added to water, the molecules dissociate to yield SO2–4 and Al+3 .The positive species
combine with negatively charged colloidal to neutralize part of the charge on the
colloidal particle. Thus, agglomeration takes place. Coagulation is a quite complex
phenomenon and the coagulant should be distributed uniformly throughout the solution.
A flash mix accomplishes this.

Prepared by: Eng. Isra’a I. Al-Smadi
Page | 42
Jar test is simple device used to determine this optimum coagulant dose required. The jar
test, device consists of a number of stirrers (4 to 6) provided with paddles. The paddles
can be rotated with varying speed with the help of a motor and regulator. Samples will be
taken in jars or beakers and varying dose of coagulant will be added simultaneously to all
the jars. The paddles will be rotated at 100 rpm for 1 minute and at 40 rpm for 20 to 30
minutes, corresponding to the flash mixing and slow mixing in the flocculator of the
treatment plant. After 30 minutes settling, supernatant will be taken carefully from all the
jars to measure turbidity. The dose, which gives the least turbidity, is taken as the
optimum coagulant dose.
PROCEDURE:
1) Prepare 4 of water sample.
2) Record the initial temperature pH , and turbidity
3) Add alum dosage respectively, ex (1, 2, 3 and4 ml).
4) Start the stirrer for rapid mixing for 1 minute @ 100 rpm.
5) Then slow mixing for 20 minutes @20-40 rpm.
6) After settling for 30 minutes take a sample from the center of each beaker and
measure the turbidity.
7) Measure the pH, temperature and note the difference.
8) Compare the turbidity of each beaker after the coagulation and flocculation
process.
9) Determine the turbidity reduction for each dosage.
Prepared by: Eng. Isra’a I. Al-Smadi
Page | 43
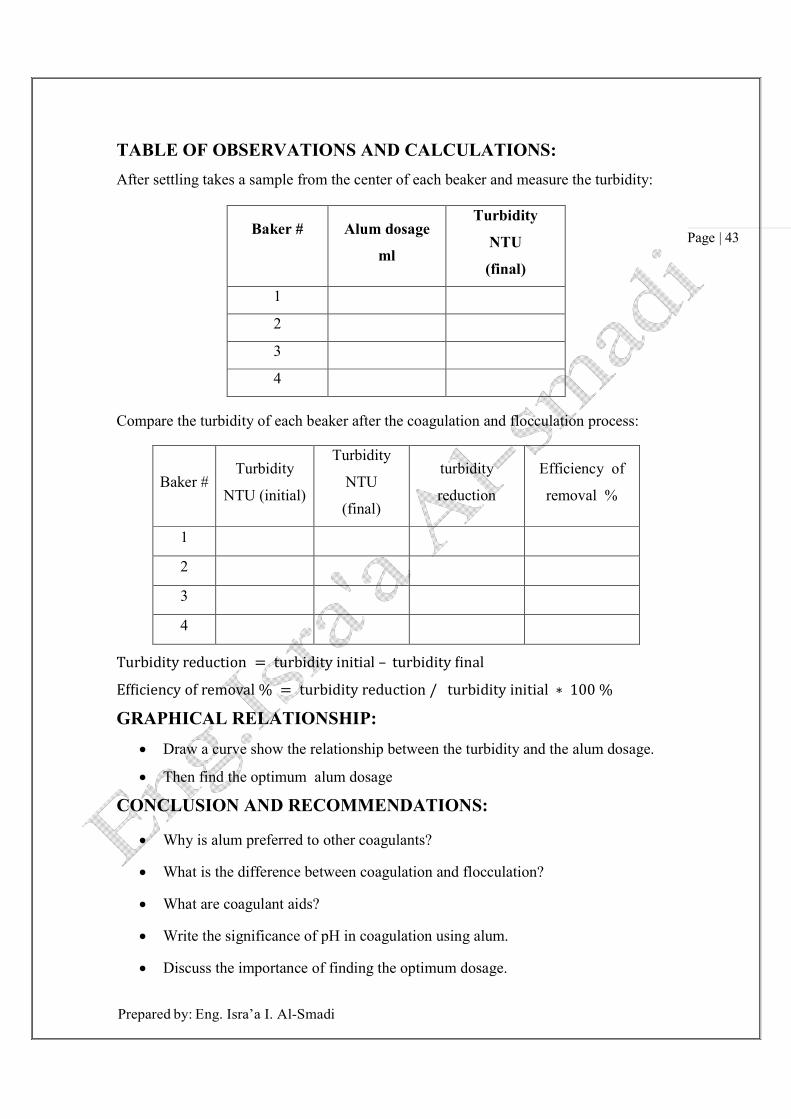
TABLE OF OBSERVATIONS AND CALCULATIONS:
After settling takes a sample from the center of each beaker and measure the turbidity:
Compare the turbidity of each beaker after the coagulation and flocculation process:
Turbidity reduction = turbidity initial – turbidity �inal
Ef�iciency of removal % = turbidity reduction / turbidity initial ∗ 100 %
GRAPHICAL RELATIONSHIP:
Draw a curve show the relationship between the turbidity and the alum dosage.
Then find the optimum alum dosage
CONCLUSION AND RECOMMENDATIONS:
Why is alum preferred to other coagulants?
What is the difference between coagulation and flocculation?
What are coagulant aids?
Write the significance of pH in coagulation using alum.
Discuss the importance of finding the optimum dosage.
Baker #
Alum dosage
ml
Turbidity
NTU
(final)
1
2
3
4
Baker # Turbidity
NTU (initial)
Turbidity
NTU
(final)
turbidity
reduction
Efficiency of
removal %
1
2
3
4

Prepared by: Eng. Isra’a I. Al-Smadi
Page | 44
Experiment 10
DETERMINATION OF SOLIDS
OBJECTIVES:
The aim of the experiments is to determine the following types of solids in the given
sample(s):
Total solids
Total (inorganic) fixed solids
Total volatile (organic) solids
Total dissolved solids
Dissolved fixed (inorganic) solids
Dissolved volatile (organic) solids
Total suspended solids
Suspended fixed (inorganic) solids
Suspended volatile (organic) solids
Settleable solids
APPARATUS:
REAGENTS:
Water samples
Porcelain evaporating dishes of
150–200 mL capacity
Filter paper (preferably of glass
fiber)
Drying oven Electric muffle furnace
Analytical balance Imhoff cone

Prepared by: Eng. Isra’a I. Al-Smadi
Page | 45
THEORY:
Total solid is the term applied to the material left in the vessel after evaporation of a sample of
water/waste water and its subsequent drying in an oven at a definite temperature. Total solids
include “total suspended solids” the portion of total solids retained by a filter and “total
dissolved solids” the portion that passes through the filter. Fixed solids are the residue remaining
after ignition for 1 hour at 550°C. The solid portion that is volatilized during ignition is called
volatile solids. It will be mostly organic matter.
Water that is low in organic matter and total mineral content and are intended for
human consumption may be examined under 103–105°C or 179–181°C. But water
containing considerable organic matter or those with pH over 9.0 should be dried at
179–181°C. In any case, the report should indicate the drying temperature.
The sample is filtered and the filtrate evaporate in a weighed dish on a steam bath, the
residue left after evaporation is dried to constant weight in an oven at either 103–105°C
or 179–181°C. The increase in weight over that of the empty dish represents total
dissolved solids and includes all materials, liquid or solid, in solution or otherwise,
which passes through the filter and not volatilized during the drying process.
The difference between the total solids and the total dissolved solids will give the total
suspended solids. The dishes with the residue retained after completion of the tests for
total solids and total dissolved solids are subjected to heat for 1 hour in a muffle furnace
held at 550°C. The increase in weight over that of the ignited empty vessel represents
fixed solids in each instance.
The difference between the total dissolved/total suspended solids and the corresponding
fixed solids will give volatile solids in each instance. All the quantities should be
expressed in mg/L. Settleable matter in surface and saline waters as well as domestic
and industrial wastes may be determined and reported on a volume basis as milliliter per
litter.

Prepared by: Eng. Isra’a I. Al-Smadi
Page | 46
PROCEDURE:
Total solids
1) Ignite the clean evaporating dishes in the muffle furnace for 30 minutes at 550°C and cool in a desiccator.
2) Note down the empty weight of the dish (W1).
3) Pour a measured portion (50 to 100 mL) of the well-mixed sample into the dish and evaporate the contents by placing the dish on a steam bath.
4) Transfer the dish to an oven maintained at either 103–105°C or 179–181°C and dry it for 1 hour.
5) Allow the dish to cool briefly in air before placing it, while still warm in a desiccator to complete cooling in a dry atmosphere.
6) Weigh the dish as soon as it has completely cooled (W2).
7) Weight of residue = (W2 – W1) mg. W2
and W1 should be
expressed in mg. Total fixed solids
1) Keep the same dish used for determining total residue in a muffle furnace for 1 hour at 550°C.
2) Allow the dish to partially cool in air until most of the heat has dissipated, then transfer to a desiccator for final cooling in a dry atmosphere.
3) Weigh the dish as soon as it has cooled (W3).
4) Weight of total fixed residue = (W3 – W1) mg.
W3 and W1 should be
expressed in mg
Total dissolved solids
1) Filter a measured portion of the mixed sample (50 or 100 mL) through a filter paper and collect the filtrate in a previously prepared and weighed evaporating dish.
2) Repeat the steps 3 to 6 outlined in total solids procedure.
3) Weight of dissolved solids = (W5 – W4) mg. W4 = Weight
of empty evaporating dish in mg. W5 = Weight of empty evaporating dish in mg + Residue left after evaporating the
filtrate in mg.

Prepared by: Eng. Isra’a I. Al-Smadi
Page | 47
Total suspended solids = Total solids – Total dissolved solids.
Total volatile solids = Total solids – Total fixed solids.
Fixed dissolved solids
1) Keep the same evaporating dish used in determining total dissolved solids in a muffle furnace for 1 hour at 550°C.
2) Repeat the steps 2 and 3 outlined in total fixed solids procedure.
3) Weight of fixed dissolved solids = (W6 – W4) mg. W6 = Weight of empty evaporating dish + Fixed solids left after ignition at 550°C.
Volatile dissolved solids = Total dissolved solids – Fixed dissolved solids.
Fixed suspended solids = Total fixed solids – Fixed dissolved solids.
Volatile suspended solids = Total volatile solids – Volatile dissolved solids.
Settleable solids by volume
1) Fill an Imhoff cone to the litter mark with a thoroughly mixed sample.
2) Settle for 45 minutes.
3) Gently stir the sides of the cone with a rod or by spinning.
4) Settle 15 minutes longer.
5) Record the volume of settleable matter in the cone as mL/L.

Prepared by: Eng. Isra’a I. Al-Smadi
Page | 48
TABLE OF OBSERVATIONS AND CALCULATIONS:
Item Sample
I
Sample
II
Sample
III
Volume of sample taken
Wt. of empty evaporating dish = W1 mg (For
total dissolved solids)
Wt. of dish + total solids = W2 mg
Total solids = (W2 – W1) mg
Wt. of dish + fixed solids = W3 in mg
Fixed solids in mg = (W3 – W1)
Wt. of empty evaporating dish = W4 mg (For
total dissolved solids)
Wt. of dish + total dissolved solids = W5 mg
Total dissolved solids = (W5 – W4) mg
Wt. of dish + fixed dissolved solids = W6 mg
Fixed dissolved solids = (W6 – W4) mg
Total solids in mg/L
Total fixed solids in mg/L
Total dissolved solids in mg/L
Total suspended solids in mg/L
Total volatile solids in mg/L
Fixed dissolved solids in mg/L
Volatile dissolved solids in mg/L
Fixed suspended solids in mg/L
Volatile suspended solids in mg/L
Settleable solids in mg/L

Prepared by: Eng. Isra’a I. Al-Smadi
Page | 49
MATHEMATICAL RELATIONSHIP:
mg/L total solids = mg total solids × 1000
ml of sample
mg/L total �ixed solids = mg total �ixed solids × 1000
ml of sample
mg/L total dissolved solid = mg of total dissolved solids × 1000
ml of sample
mg/L total suspended solids = mg/L of total solids – mg/L of total dissolved solids
mg/L total volatile solids = mg/L of total solids – mg/L of total �ixed solids
mg/L �ixed dissolved solids = mg �ixed dissolved solids × 1000
ml of sample
mg/L volatile dissolved solids
= mg/L total dissolved solids – mg/L of �ixed dissolved solids
mg/L �ixed suspended solids
= mg/L total �ixed solids – mg/L �ixed dissolved solids
mg/L volatile suspended solids
= mg/L total volatile solids – mg/L volatile dissolved solids
CONCLUSION AND RECOMMENDATIONS:
What is the application of determination of settleable solids?
Explain the significance of determination of total solids in sanitary engineering.
How will the volatile solids affect the strength of sewage? Why?
Why do you determine the fixed solids by igniting at 550°C? How will the result
be affected, if it has magnesium carbonate content?
What significant information is furnished by the determination of volatile solids?
What is sludge volume index?

Prepared by: Eng. Isra’a I. Al-Smadi
Page | 50
Experiment 11
DETERMINATION OF DISSOLVED OXYGEN
OBJECTIVES:
Determine the quantity of dissolved oxygen present in the given sample(s) by using modified
Winkler’s (Azide modification) method.
APPARATUS:
300 mL capacity bottle with stopper
Burette
Pipettes, etc
REAGENTS:
Manganous sulphate solution
(MnSO4.4H2O)
Conc. sulphuric acid (36 N)
Alkali-iodide Azide reagent Starch indicator
Standard sodium thiosulphate solution (0.025N)
Standard potassium dichromate solution (0.025N)
THEORY:
Dissolved Oxygen (D.O.) levels in natural and wastewaters are dependent on the
physical, chemical and biochemical activities prevailing in the water body. The
analysis of D.O. is a key test in water pollution control activities and waste treatment
process control.
Improved by various techniques and equipment and aided by instrumentation, the
Winkler (or iodometric) test remains the most precise and reliable titrimetric
procedure for D.O. analysis. The test is based on the addition of divalent manganese
solution, followed by strong alkali to the water sample in a glass-stoppered bottle.
D.O. present in the sample rapidly oxidizes in equivalent amount of the dispersed
divalent manganous hydroxide precipitate to hydroxides of higher valency states. In
the presence of iodide ions and upon acidification, the oxidized manganese reverts to
the divalent state, with the liberation of iodine equivalent to the original D.O. content
in the sample. The iodine is then titrated with a standard solution of thio-sulphate.

Prepared by: Eng. Isra’a I. Al-Smadi
Page | 51
PROCEDURE:
1) Add 2 mL of manganous sulphate solution and 2 mL of alkali-iodide Azide reagent to the
300 mL sample taken in the bottle, well below the surface of the liquid.
(The pipette should be dipped inside the sample while adding the above two reagents.)
2) Stopper with care to exclude air bubbles and mix by inverting the bottle at least 15 times.
3) When the precipitate settles, leaving a clear supernatant above the manganese hydroxide floc, shake again.
4) After 2 minutes of settling, carefully remove the stopper, immediately add 3 mL
concentrated sulphuric acid by allowing the acid to run down the neck of the bottle.
5) Restopper and mix by gentle inversion until dissolution is complete.
6) Measure out 203 mL of the solution from the bottle to an Erlenmeyer flask. As 2 mL each
of manganese sulphate and Azide reagent have been added.
7) Titrate with 0.025 N sodium thiosulphate solutions to a pale straw color.
8) Add 1–2 mL starch solution and continue the titration to the first disappearance of
the blue color and note down the volume of sodium thiosulphate solution added (V),
which gives directly the D.O. in mg/L
TABLE OF OBSERVATIONS AND CALCULATIONS:
After the yellow, blue, colorless color appears in Sequential way, record the needed volume of the sodium thiosulphate solution.
�� ( ��/� ) = �(������ ������������ ) ∗ � (������ ������������ ) ∗ ����
� (������ )
By using the previously relationship, fill the following table:
Sample #
Temperature ºC
V sample ml
V (sodium thiosulphate)
ml
N (sodium thiosulphate)
DO mg/l
1
2
3

Prepared by: Eng. Isra’a I. Al-Smadi
Page | 52
CONCLUSION AND RECOMMENDATIONS:
What are alternative methods for determining the DO of aqueous samples? How do they compare to this method?
What are typical DO values of water in Jordan? How do your data compare with these values?
What are the main sources of DO in water and wastewater?
Discuss the environmental significance of dissolved oxygen.
Most of the critical conditions related to dissolve oxygen deficiency occur during summer months. Why?
The turbulence of water should be encouraged. Why?