Embed Size (px)
Citation preview

<ITY\11'~ SAN JOSE (";\111Ti\l Or \ II (('ON \ Al l f \.
T&E Committee: 11/2/2015 Item: (d) 3
Attachment B
SANITARY SEWER SYSTEM ANNUAL REPORT FY 2014-2015
Sanitary Sewer Pipe Installation
November 2015

City of San Jose Sanitary Sewer System Report
Fiscal Year 20 14-2015
CONTENTS
I History and Background Infmmation 2
II Program Funding
A. Adopted FY 2014-15 CIP Budget Revenue 4 B. Adopted FY 2014-15 CIP Budget Expenditures ........................................................................ ... ... ... .. .... ... ....... .. ... .... ......... . 4 C. Adopted FY 2014-15 O&M Budget Expenditures ................... ... ..... .... ..... ... ........ .. ....... ... ..... .. .. .... ... ............................ ... .. .. ..... . 5
III Program Activities
A. Neighborhood Sewer Rehabilitation .............................. .. .................................................................................. . 5 B. Pump Stations 6 C. Interceptor and Capital llnproven1ents .... .. ... .... ........ .... .... .. ... ... .. ... .... .. .. ..... ... .. ... .. .. ........................... .. ... .. ............ . 9 D. Condition Assessn1ent. ........................................................................... ........ ... ..... .. ..... .. ............ .. .. . . 11 E. Master Planning 12
IV Operations and Maintenance 16
V Conclusion 18

Sauitary Sewer System Annual Report - FY 2014-15 2

I. HISTORY AND BACKGROUND INFORMATION
The City provides sanitary sewer service for the residents and businesses of San Jose and smTounding areas. The City owns and operates the sewer collection system consisting of approximately 2,250 miles of pipes (which vary in size from 6 inches to 90 inches in diameter), including 10 miles of force mains, 16 pump stations and 45,000 manholes. There are over 202,000 lateral connections to the system. The collected wastewater is conveyed to the San Jose /Santa Clara Regional Wastewater Facility (RWF) by major interceptor pipelines located in the northem pa1i of San Jose. This system conveys an average flow of 76 millions of gallons on a daily basis. The City's sanitary sewer collection system benefits from the generally uniform topography of the Santa Clara Valley which allows the majority ofthe wastewater flows to be conveyed to the RWF using gravity sewer lines with minimal use of lift or pump stations.
The sewer system dates back to the late 1800's which consisted of a main outfall sewer constructed of brick. This system conveyed combined sanitary and stonn flows directly into the San Francisco Bay. In the 1950's this combined system was separated, and sanitary flows were directed through the wastewater treatment facility ( cunently known as the Regional Wastewater Facility, or RWF) prior discharging into the bay. Approximately 85 percent ofthe system, which was constructed between 1950 and 1980 are local collector pipes that are 10 inches or less in diameter.
In general, the sanitary sewer system is overseen and managed by the following departments:
• The Depatiment of Public Works designs and builds sanitary sewer infrastructure funded tlu·ough the City's Capital Improvement Program. Public Works also reviews and inspects sanitary sewer improvements constructed by private developers and otl1er public agencies. The Sanitat·y Capital and Master Planning Sections are pati of the Transpmiation & Hydraulics Services Division in Public Works. The primary goal of these sections is to plan, design and construct improvements to sanitary sewer system, in atl effort to provide safe and reliable sewer service to the cunent and future residents/ businesses of San Jose and contributing agencies.
• Day-to-day operations and maintenance of the system are perfmmed by tl1e Department ofTranspmtation's Infrastructure Maintenance Division.
• The Environmental Services Department manages the wastewater from the collection system to suitable treatment and discharge into the San Francisco Bay and for beneficial reuse to protect the environment and public health.
Sanitary Sewer System Annual Report- FY 2014-15 3

Legend San itary Sewer Mains
12" and smaller
- 14" and larger
= Freeway
====> Expressway
lc:J Service Area
CITY OF SAN JOSE EXISTING SAN ITARY SEWER SYSTEM
Figure 1 -City of San Jose Sanitary Sewer System
Sanitary Sewer System Annual Report - FY 2014- 15 4
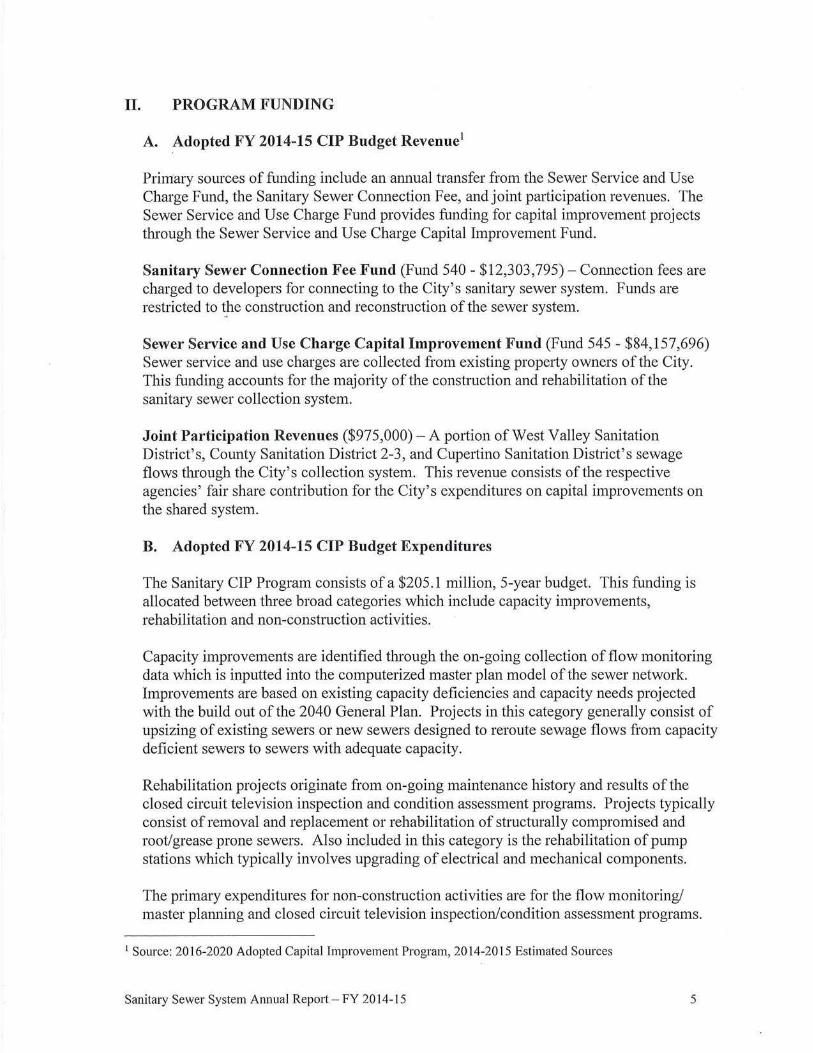
II. PROGRAM FUNDING
A. Adopted FY 2014-15 CIP Budget Revenue1
Primary sources of funding include an annual transfer from the Sewer Service and Use Charge Fund, the Sanitary Sewer C01mection Fee, and joint participation revenues. The Sewer Service and Use Charge Fund provides funding for capital improvement projects through the Sewer Service and Use Charge Capital Improvement Fund.
Sanitary Sewer Connection Fee Fund (Fund 540- $12,303,795) - Connection fees are charged to developers for c01mecting to the City's sanitary sewer system. Funds are resh·icted to ~he construction and reconstruction of the sewer system.
Sewer Service and Use Charge Capital Improvement Fund (Fund 545- $84,157,696) Sewer service and use charges are collected from existing property owners of the City. This funding accounts for the majority of the construction and rehabilitation of the sanitary sewer collection system.
Joint Participation Revenues ($975,000)- A portion of West Valley Sanitation District's, County Sanitation District 2-3, and Cupertino Sanitation Dish·ict's sewage flows tlu·ough the City's collection system. This revenue consists of the respective agencies' fair share conh·ibution for the City's expenditures on capital improvements on the shared system.
B. Adopted FY 2014-15 CIP Budget Expenditures
The Sanitary CIP Program consists of a $205.1 million, 5-year budget. This funding is allocated between three broad categories which include capacity improvements, rehabilitation and non-construction activities.
Capacity improvements are identified through the on-going collection of flow monitoring data which is inputted into the computerized master plan model of the sewer network. Improvements are based on existing capacity deficiencies and capacity needs projected with the build out of the 2040 General Plan. Projects in tllis category generally consist of upsizing of existing sewers or new sewers designed to reroute sewage flows from capacity deficient sewers to sewers with adequate capacity.
Rehabilitation projects originate from on-going maintenance history and results of the closed circuit television inspection and condition assessment programs. Projects typically consist of removal and replacement or rehabilitation of structurally compromised and root/grease prone sewers. Also included in this category is the rehabilitation of pump stations which typically involves upgrading of electrical and mechanical components.
The primary expenditures for non-construction activities are for the flow monitoring/ master planning and closed circuit television inspection/condition assessment programs.
1 Source: 20 16-2020 Adopted Capital Improvement Program, 20 14-20 15 Estimated Sources
Sanitary Sewer System Annual Report - FY 2014-15 5
Each of these programs is essential to the planning and prioritization of capital improvements within the sanitary sewer system.
C. Adopted FY 2014-15 Operations and Maintenance Budget Expenditures
The rumual ongoing operating and maintenance budget is approximately $16.2 million, which provides funding for administration, engineering, and maintenance.
III. PROGRAM ACTIVITY
A. Neighborhood Sewer Rehabilitation
Approximately 1,900 miles or 85% ofthe City's sanitary sewer system are considered neighborhood sewers. The average age of the neighborhood sewer system is approximately 45 years. These sewers generally consist of smaller diameter (6 to 12 inches) pipes constructed three to six feet deep of vitrified clay or cast iron. These characteristics result in a variety of operational and maintenance issues including root intrusion, grease accumulation, conosion (of the cast iron sewers), structmal damage due to the depth of cover and the anay of other utilities common at similru· depths as the sewers. For these reasons, the vast majority of sanitary sewer overflows (SSOs) occur in these types of sewers.
During FY 2014-15, twenty-seven separate contracts were either awarded and/or completed to address issues in neighborhood sewers. The total value of these contracts was $24.2 million. In order to address these issues in a timely and cost effective manner, a variety of types of construction contracts and methods were implemented. Traditional remove and replace contracts were utilized for cast iron sewer replacements and for system replacements which required changes in horizontal or vettical alignment. Changes in aligmnent are typically necessary to improve flow ru1d prevent grease accumulation. Rehabilitation contracts, which consist of insettion of a liner into the existing sewer, or pulling in a new polyethylene pipe while breaking the old pipes were utilized to repair sewers with mild to moderate damage and prevent root intmsion. Point repair contracts, which consist of multiple locations under a single contract, were utilized to repair sewers which had severe localized damage.
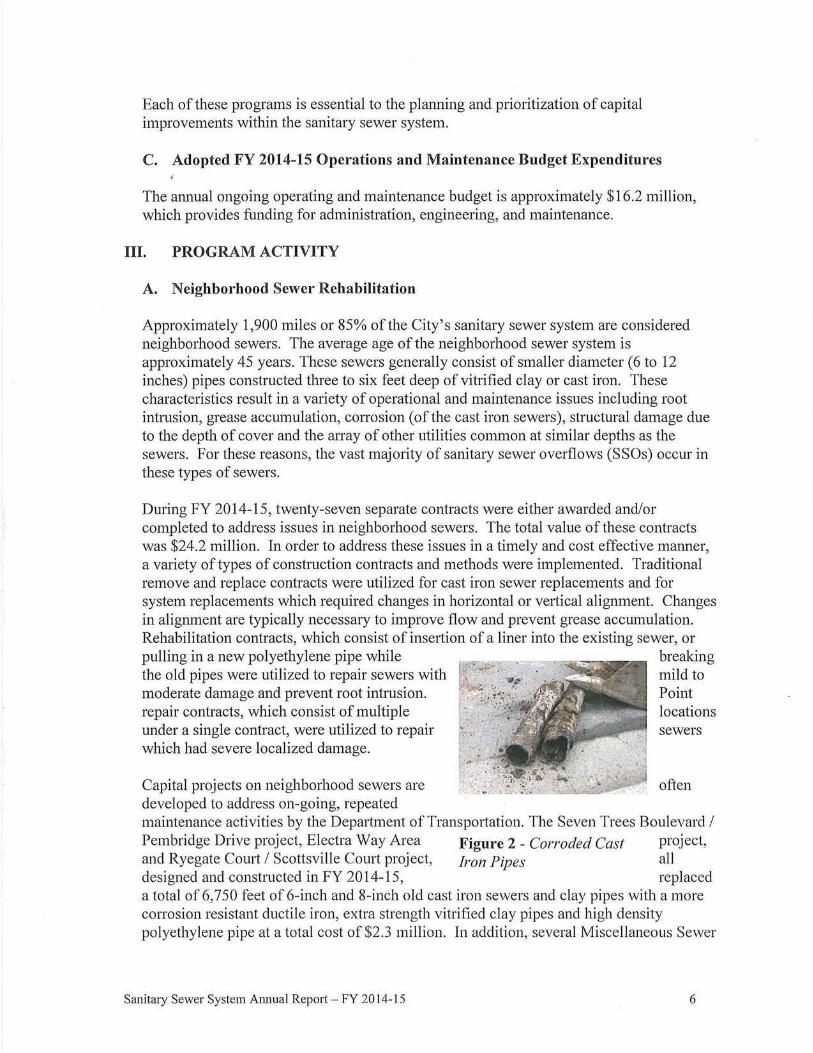
Capital projects on neighborhood sewers are developed to address on-going, repeated maintenance activities by the Department of Transportation. The Seven Trees Boulevard I Pembridge Drive project, Electra Way Area Figure 2- Corroded Cast project, and Ryegate Court I Scottsville Court project, Iron Pipes all designed and constructed in FY 2014-15, replaced a total of 6,750 feet of 6-inch and 8-inch old cast iron sewers and clay pipes with a more conosion resistant ductile iron, extra strength vitrified clay pipes and high density polyethylene pipe at a total cost of$2.3 million. In addition, several Miscellaneous Sewer
Sanitary Sewer System Annual Report - FY 20 14-15 6

Repairs projects and a General On-Cal l Engineering Contract were issued to address structural defects found in the system at various locations tluoughout the City in an effort to assist the Department of Transportation (DOT) to reduce SSOs. A few other projects including the Pine Ave, Mackey Ave, and Story Road Easement projects were designed and constructed to eliminate issues related to slow flow or relocate the sewers from an easement to the main street for accessibility.
Prior to these projects, the sewer systems in these areas required cleaning by DOT on a weekly to monthly basis due to heavy grease accumulation. Each cleaning effort consisted of an average of four hours with a two person crew with a combination vactorlflushing truck. Upon completion of the capital project, maintenance activities have been reduced significantly to one light cleaning effort in a year.
Figure 3 - Neighborhood Sanita!y Sewer Improvement Project
The combined effort of capital improvements and the Department of Transportation's cleaning and maintenance program has resulted in a continued reduction in the number of SSOs year-over-year, from 101 in FY 2013-14 to 96 in FY 2014-15.
~l . l'i'fln'l~:.t.~o,; t.) """"~llfiirmb
Jul Aug Sept Oct Nov Dec Jan Feb Mar Apr May Jun Total
FY 17 6 12 10 25 17 15 19 19 22 20 10 192 11/12 FY
12 12 14 8 22 12 19 14 18 10 8 6 155 12/13
Sanitary Sewer System Annual Report- FY 2014-15 7

FY 7 6 7 9 9 13 7 7 9 10 9 8 101
13/14 FY
8 4 4 9 11 15 18 8 7 4 6 2 96 14/15 FY
7 4 4 1 15/16
Table 1 - Sanitmy Sewer Overflow Data
B. Pump Stations
The average age ofthe City's 16 sanitary sewer pump stations is approximately 26 years. These facilities are listed in Table 2. The standard design-life of the mechanical and electrical components of a pump stations are 10 to 25 years. Due to the wide range of pumping capacity for each station, the total cost to rehabilitate and/or replace these pump stations can range between $2 million-$10 million each.
In FY 2014-15, approximately $3.5 million was allocated to rehabilitate and upgrade various pump stations. The structw·al rehabilitation of the pump station would prolong the life and improve the reliability of the system; similarly, the upgrades of the electrical, mechanical and data communication components will allow staff to monitor these pumps remotely and also reduce the maintenance effort required to keep these pump stations operating correctly.
Sanitary Pump Stations and Other Facilities (Alphabetical Order)
Name Year Built Year Rehabilitated/Status
Pump Stations 1. Basking Ridge 2006 Pumps replaced by DOT in 201 1 2. Commw1ication Hill 2007
3. Gateway 1988 Init ial assessment in progress; possible abandonment/rehabilitation
4. Junction 1979
5. Lamplighter 1984 Force main condition assessment completed in 2008
6. Margaret 1952 7. Montague 1976 Design for replacement in progress 8. Nordale 1960 Design for replacement in progress 9. Nmtech 1983 Condition assessment in progress
10. Padres 20 12 New pump station constructed i11 August 2012
11. Riddle Park 1982 12. San Felipe 1989 Design for abandonment in progress
13. Spreckles 1975 Recently completed rehabilitation in 2014
Sanitary Sewer System Annual Rep01t - FY 20 I 4- I 5 8

14. Tea Garden 1986 Rehabilitated in 1997 15. Happy Hollow Zoo 1967 Pump replaced in 2009 16. Willow 2003 Design for replacement in progress
I Other Facilities (Odor Control Stations) 17. Canoas Ferrous
1962 Rehabilitated in 2009 Chloride Injection
18. Canoas Soil Bed Filter 1994 19. Zanker Soil Bed Filter 1995 Condition assessed in 2008
Table 2 - Sanitary Pump Stations
Spreckles Pump Station - Tllis project was awarded in May 2013 and completed in August 2014. This project upgraded the electrical and mechanical components of the existing pump station and installed a new secondary force main from the pump station to its discharge point on the northeast side of the RWF. This project was developed in response to frequent maintenance needs at tills facility. Since the conversion of the Spreckles site from a wastewater treatment facility to a sanitary sewer pump station in the 1970's, no major upgrades or renovations have been performed. The improvements will reduce the on-going maintenance costs associated with tllis facility and provide reliable and continuous sewer service to the area.
Cunently staff is working on the design of a second phase to extend the force mains to the Emergency Basin Overflow Structure located in the RWF.
Sanitary Sewer System Armual Rep01t - FY 2014-15 9

Figure 4- Spreckles Force Ma;n and Pump StaNon
Montague Sanitary Pump Station- This station is located at the southeast corner of the intersection of Montague Expressway and North First Sh·eet. Built in 1978, the pump station has been offline since the mid-1980s as the pumping capacity ofthis station has been accommodated by the Lamplighter pump station to the north. The upgrade of Montague Sanitary Pump Station is necessary to accommodate anticipated future development in the area. Staff completed the design and is waiting for Real Estate to complete the negotiation with the adjacent property to obtain a larger easement for the new pump station. The project is currently scheduled for award in 2016.
Willow Pump Station - This pump station was constructed in 2003 to temporarily replace a damaged creek-crossing siphon lmtil a new siphon was built. Staff later determined that upgrading the existing pump station would be a better alternative compared to constructing a new siphon due to constructability and the stringent permitting process. Recently, the U.S. Corporation of Army in coordination with the Santa Clara Valley Water Dish·ict infonned the City that they have a plan to widen the creek, thus staff had put this project on hold waiting for the completion of the design by the Corporation of Almy.
San Felipe Pump Station - This pump station was consh·ucted in 1999 to serve the residents in the Scenic Meadow Lane neighborhood in Evergreen Valley area. A new gravity sewer system, built by private developers in 2003 to serve other subdivisions in the area, allows the City to reroute the flow to the new system and eliminate the pump station. The project is cunently under constmction and will be completed in late 2015.
C. Interceptor and Capacity Improvements
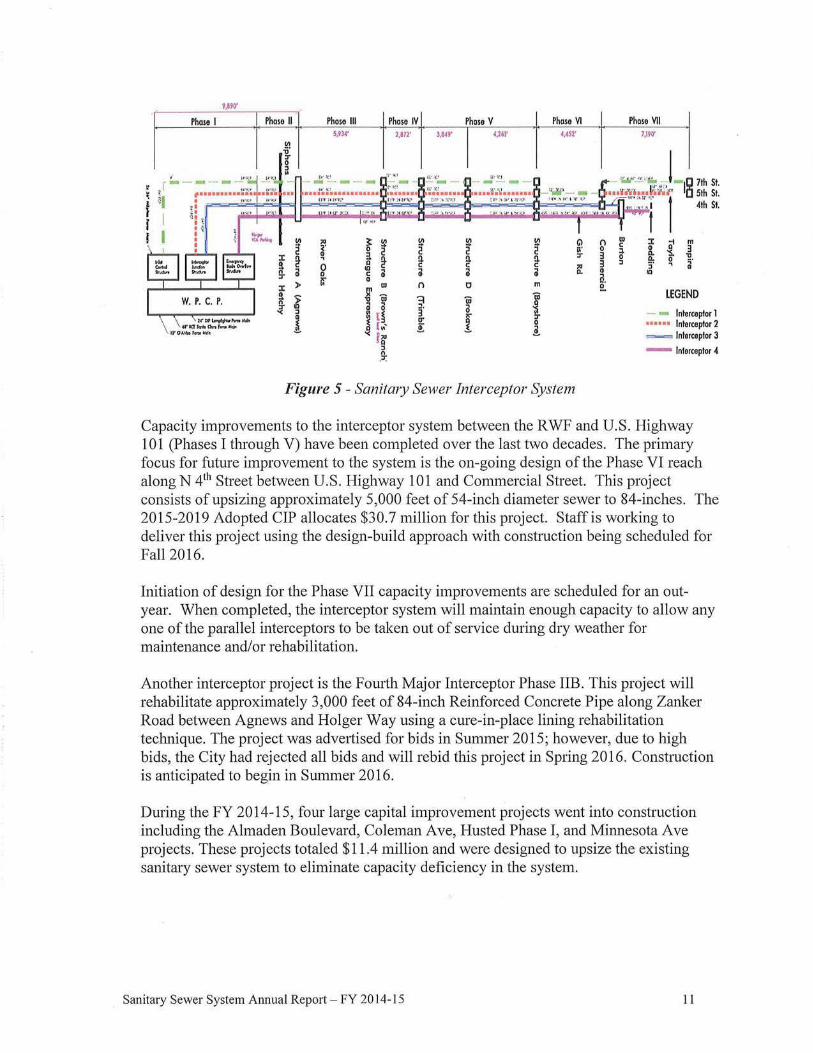
The interceptor system between the R WF and approximately Empire Street in the Japantown area consists of four parallel large diameter (60 to 90-inch) sewers. The locations of various reaches of the system are designated by Phases I through VII, with Phase I located fmthest to the north entering the RWF and Phase VII located near the Empire Street accepting flows from major trunk sewers. This system conveys approximately 80% of the total wastewater flows to the RWF. A schematic diagram of the interceptor system is shown in Figure 5 below.
Sanitary Sewer System Annual Report - FY 20 14-15 10
t.tiO'
Ph()SO I Phaso II Phase Ill Phose W Phase V Phase VI 5,f~· l ,ln' 3Mf' 4)'1' vsr
"' ;;· :r 0 ~
"' ,. ~ "' !a i "' Cl 2 ~· 0 2 2 2 ~· :t ~
, a ~ ~ !1. ~
:r !1 0 " c
~ n Cl "' 0 0 i 0 0 c :r If 0
:t )> w ~ () 0 m
!1 5 '=I 'iii j n ., 0>
~ "' J t~ ~. a 'S ~ 3
l ,.. :r IT 1 0 [,.- .!: 1 ig
n .:;:
Figure 5 - Sanitmy Sewer Interceptor System
() 0 3 3 0 a. a.
Phase VII 7,110'
LEGEND
- - ln~rceplor 1 ... . . . lnlurcepfor 2 =--= lnlurceptor 3
- lntorcoplor 4
Capacity improvements to the interceptor system between the RWF and U.S. Highway 101 (Phases I through V) have been completed over the last two decades. The primary focus for future improvement to the system is the on-going design of the Phase VI reach along N 4111 Street between U.S. Highway 101 and Commercial Street. This project consists ofupsizing approxin1ately 5,000 feet of 54-inch diameter sewer to 84-inches. The 2015-2019 Adopted CIP allocates $30.7 million for this project. Staff is working to deliver this project using the design-build approach with construction being scheduled for Fall2016.
Initiation of design for the Phase VII capacity improvements are scheduled for an outyear. When completed, the interceptor system will maintain enough capacity to allow any one of the parallel interceptors to be taken out of service during dry weather for maintenance and/or rehabilitation.
Another interceptor project is the Fowih Major Interceptor Phase liB. This project will rehabilitate approximately 3,000 feet of 84-inch Reinforced Concrete Pipe along Zanker Road between Agnews and Holger Way using acme-in-place lining rehabilitation technique. The project was advetiised for bids in Summer 2015; however, due to high bids, the City had rejected all bids and will rebid this project in Spring 2016. Construction is anticipated to begin in Sutmner 2016.
During the FY 2014-15, four large capital improvement projects went into consh·uction including the Almaden Boulevard, Coleman Ave, Husted Phase I, and Minnesota Ave projects. These projects totaled $11.4 million and were designed to upsize the existing sanitary sewer system to eliminate capacity deficiency in the system.
Sanitary Sewer System Annual Rep01t - FY 2014- 15 11

D. Condition Assessment
The Sanitary Sewer Condition Assessment (SSCA) Pilot Program was initiated in 2010. The original pilot project utilized closed circuit television (CCTV) to video and collect data'on a 46 mile representative sample of the City's 2,250 mile sanitary sewer system.
In 2013, the City procured a sanitary sewer asset management software program to develop risk assessments based on an anay of the sewer's physical prope1iies and consequence of failure. Since early 2014, City staff utilized the software, along with available CCTV data, to analyze collected data and determine the risk level of the City's sanitary sewer system. Based on the risk levels, staff has developed a priority list of the sanitary sewer basin areas to be assessed in future years.
Two contracts to video inspect high priority basin areas were awarded in FY 2014-15. In addition to the video inspection, these contracts included special provisions that allow contractors to repair any pipelines that are fow1d to be severely defective and in need of immediate attention. Because of the condition of the pipes in these higher risk basin areas and the increase in cleaning and inspection cost, only 116 miles of pipelines were video inspected. Beginning FY 2015-16, additional budget will be allocated to support the Condition Assessment program in order to increase the video inspection footage and to meet the target of assessing the entire City's sanitary sewer system by 2021.
0 2010 Pilot 46 1 2011-2012 261 2 2012-2013 152 3 2013-2014 108 4 2014-2015 116
Total 683 (30%)
Table 3 - CCTV Inspection
Data collected through CCTV contracts are used in developing the City's Sanitary CIP p1:ogram to proactively repair or rehabilitate these pipelines before they fail. A decision tree model bas been created to determine the most appropriate repair or rehabilitation techniques for each pipeline. The model will be used to forecast and determined the total cost to repair and rehabilitate the City's sanitary sewer system. As larger data sets are gathered tlu·ough each year's CCTV contracts, more analysis can be performed to better adjust the decision tree model.
Sanitary Sewer System Annua l Report- FY 2014-15 12

• E. Master Planning
1. Capacity Management
Citywide Trunk System Master Plan (Capacity Assessment):
Sanitary sewer collection systems are designed to convey anticipated peak flows, based on current and predicted/planned future demands under both dry weather and design st01m (or wet weather event) conditions. The State Water Resources Control Board requires sewer agencies to prepare System Evaluation and Capacity Assurance Plans to evaluate the capacity of key system components and hydraulic deficiencies and to develop capacity enhancement measures.
The citywide Sanitary Sewer Master Plan was completed in April2013. A trunk system model included pipes of 1 0-inch and larger in diameter, and incorporated Census 2000 population, non-residential water use, latest development and General Plan 2040 land uses, and flow information. The Master Plan identified the capacity deficiencies of the system, and recommended a sewer capacity improvement program to address these deficiencies for both existing and future land use conditions.
The Master Plan model initially identified roughly 334,000 feet of the pipes with capacity deficiencies (i.e. flowing nearly full pipe or higher in dry weather conditions, or flowing slightly above full pipe or higher in wet weather conditions). Each deficient system was evaluated with alternatives to find efficient and cost-effective relief measures instead of straight upsizing or building parallel pipes. These measures may include dive1ting excess flow to a near-by system with available capacity and/or addressing multiple deficiencies in one smaller project.
As a result, the City only required approximately 200,000 feet of relief sewers for the capacity improvement program in 93 projects with total estimated cost at $175 million. Compared to upsizing the 334,000 feet of deficient pipeline initially identified by the model, total cost of the capacity improvement program could be reduced by an estimated $110 million.
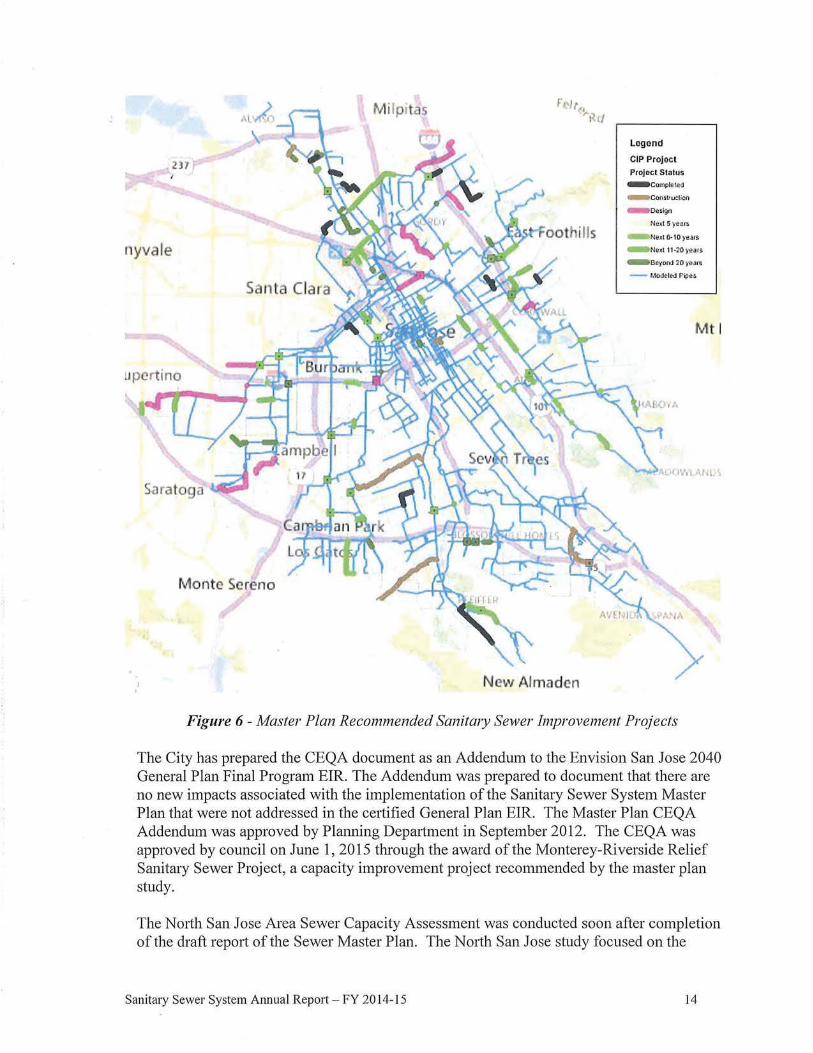
The capacity projects are scheduled in a 20-year plan according to the degree of deficiencies as predicted by the hydraulic model at existing, near-term and long-term (GP 2040) future land use scenarios. Each predicted project would be first cottfi1med with additional flow monitoring before being programmed into the 5-year CIP. The color-coded map below (Figure 5) provides the project timeline in the 20-year plan along with completed projects and projects in design and construction phases.
Sanitary Sewer System Annual Rep01t- FY 2014-15 13
Milprtas
2.) 7
Monte Sereno
New Almaden
Legend
CIP Prejocl Pro]e<:l Status -Completed
- COf'Utueli<ln
- O<?•i90
NeJ1.16- 10yean
Ne..t lf·20year•
- Beyot>J 20 yesf!
- Modeled Pip-e!.
Mtl
Figure 6- Master Plan Recommended Sanitmy Sewer Improvement Projects
The City has prepared the CEQA document as an Addendwn to the Envision San Jose 2040 General Plan Final Program EIR. The Addendum was prepared to document that there are no new impacts associated with the implementation of the Sanitary Sewer System Master Plan that were not addressed in the certified General Plan EIR The Master Plan CEQA Addendum was approved by Planning Depat1ment in September 2012. The CEQA was approved by council on June 1, 2015 through the award ofthe Monterey-Riverside Relief Sanitary Sewer Project, a capacity improvement project recommended by the master plan study.
The North San Jose Area Sewer Capacity Assessment was conducted soon after completion of the draft report of the Sewer Master Plat1. The North San Jose study focused on the
Sanitary Sewel' System Annual Report - FY 2014-15 14
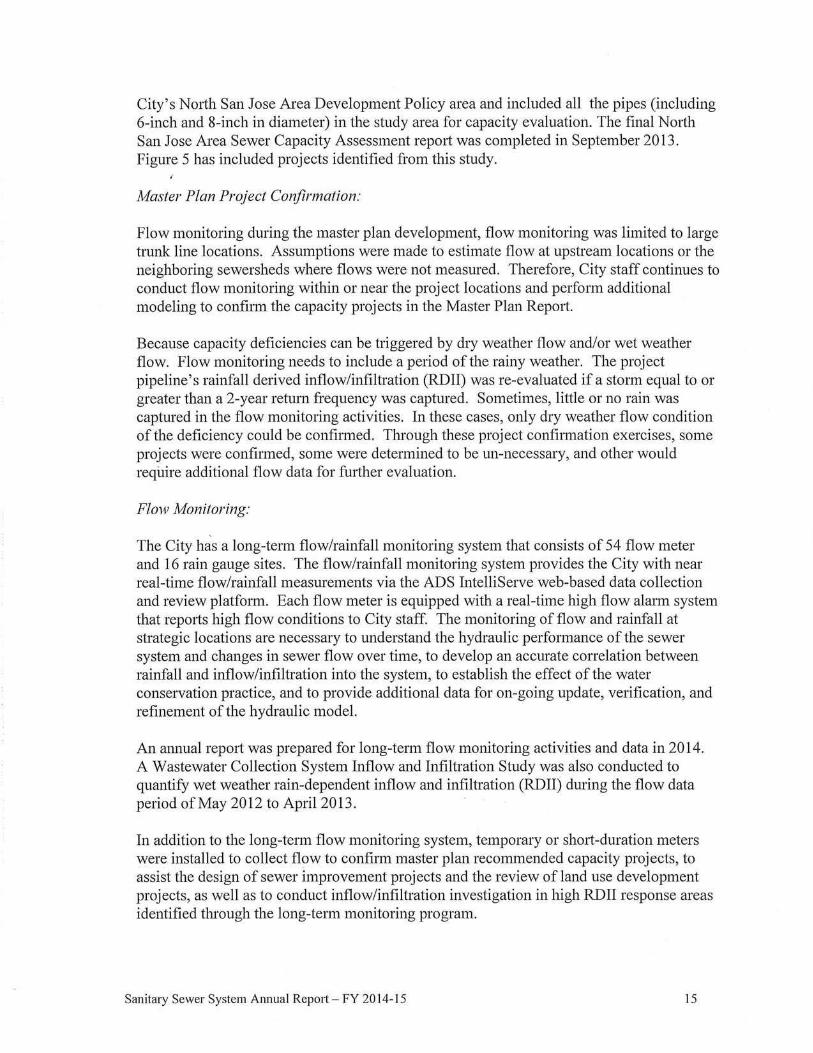
City's North San Jose Area Development Policy area and included all the pipes (including 6-inch and 8-incl1 in diameter) in the study area for capacity evaluation. The final North San Jose Area Sewer Capacity Assessment rep01t was completed in September 2013. Figure 5 has included projects identified from this study.
Master Plan Project Confirmation:
Flow monitoring during the master plan development, flow monitoring was limited to large trunk line locations. Assumptions were made to estimate flow at upstream locations or the neighboring sewersheds where flows were not measw·ed. Therefore, City staff continues to conduct flow monitoring within or near the project locations and perform additional modeling to confirm the capacity projects in the Master Plan Report.
Because capacity deficiencies can be triggered by dry weather flow and/or wet weather flow. Flow monitoring needs to include a period of the rainy weather. The project pipeline's rainfall derived inflow/infiltration (RDII) was re-evaluated if a storm equal to or greater than a 2-year return frequency was captured. Sometimes, little or no rain was captured in the flow monitoring activities. In these cases, only dry weather flow condition of the deficiency could be confirmed. Through these project confim1ation exercises, some projects were confirmed, some were determined to be un-necessary, and other would require additional flow data for fmther evaluation.
Flow Monitoring:
The City has a long-tem1 flow/rainfall monitoring system that consists of 54 flow meter and 16 rain gauge sites. The flow/rainfall monitoring system provides the City with near real-time flow/rainfall measmements via the ADS IntelliServe web-based data collection and review platform. Each flow meter is equipped with a real-time high flow ala1m system that reports high flow conditions to City staff. The monitoring of flow and rainfall at strategic locations are necessary to understand the hydraulic performance of the sewer system and changes in sewer flow over time, to develop an accmate correlation between rainfall and inflow/infiltration into the system, to establish the effect of the water conservation practice, and to provide additional data for on-going update, verification, and refinement of the hydraulic model.
An annual report was prepared for long-te1m flow monitoring activities and data in 2014. A Wastewater Collection System Inflow and Infiltration Study was also conducted to quantify wet weather rain-dependent inflow and infiltration (RDII) during the flow data period of May 2012 to April 2013.
In addition to the long-term flow monitoring system, temporary or sh01t-duration meters were installed to collect flow to confi1m master plan recommended capacity projects, to assist the design of sewer improvement projects and the review of land use development projects, as well as to conduct inflow/infiltration investigation in high RDII response areas identified through the long-term monitoring program.
Sanitary Sewer System Annual Report- FY 20 J 4-15 15

Model Expansion:
City staff continues to expand the trunk system model to include smaller diameter (6" and 8") pipes in General Plan 2040 growth areas. The process includes adding smaller pipes and manholes, subdividing drainage areas, incorporating additional local system flow data, and performing modeling analysis. The ultimate goal is to develop a model that includes all pipes of the system for evaluation to ensure adequate capacity exists to support economic development and to prevent SSOs. City staff has added approximately 70% of the small pipes into the citywide trunk system model. After the pipeline system network is developed, the next step will be to refine sewersbed boundaries and to develop loading for the network. The model will then need to be re-calibrated using the latest long-tenn and temporary data. The all-pipe model is estimated to complete by the end of 20 17 ..
2. Support for Economic Development
City staff from DPW, DOT and ESD have been working very closely with outside agencies such as VT A, and developers to resolve sewer capacity deficiencies for economic development tlu-ough the on-going sewer master planning study. City staff provided review and assistance to resolve sewer capacity issues for many land use development projects with examples noted below.
Development projects may be located upstream of a sewer with existing capacity deficiencies that may not be progranuned in the cmTent 5-year CIP. The Ohlone Mixed Use development project is located upstream of the deficient existing sewer system on Sunol Street. A capacity improvement project (Lincoln Avenue & Savaker Avenue Sanitary Sewer Improvements, JLS-11) was identified to address the deficiencies in this system. City staff has completed the design for the sewer project. However, there is a possibility to postpone this project due to a resurfacing of Lincoln Street in summer 2016.
A development project may cause or increase the capacity deficiency of an existing sewer system. In such case, City staff will perform modeling analysis and evaluate the degree of deficiencies, and detennine the urgency of an improvement project. Some of these sewer improvements may be constructed by the developments which could receive credits and prutial cost reimbursement towards the improvements.
During FY 2014-2015, the City's capacity analysis dete1mined that the following development projects would cause deficiencies or connect to an already deficient sewer downstream:
• Coleman Highline Phase I- The development's proposed connection would cause long stretch of sewer along airport to be deficient. City staff suggested an alternative connection to the 21-in line along Newhall.
• Santana West- The development's proposed connection would cause deficiencies in approximately 3,600 feet of the 6- and 8-inch sewer system downstream on Olin Ave., Maplewood Ave., and Steven Creek Blvd. City staff suggested a more cost-
Sanitary Sewer System Annual Report - FY 2014-15 16

effective solution with cmmection to the 15" along Winchester Blvd. for the 971 residential and 170,820 SF co1m11ercial developments.
• Boston Properties (on N. First and Zanker)- caused greater deficiency on a First ,Street sewer, but it was determined that the deficiency would not require an urgent need for improvement.
• Skyport Plaza - development's proposed lateral connection to Technology Dr. contributes to the deficient 8-inch pipe in wet weather design flow. An upsized pipe would be required to provide the needed capacity for the development. Staff recommended an alternative that cmmects to Sonora Ave. where capacity is available.
• Flea Market - would trigger an increased capacity need for the project (BKW -7). Develop prepared the design plan of a new 21" sewer that would provide the needed capacity for the Phases II and III of the Flea Market Development Project.
The cost share infonnation based on the average dry weather flow ratios would be provided to the Development Services staff for the development's contribution toward these sewer improvement projects. All sewer improvement projects are required to be designed to convey flows generated by General Plan 2040 land use scenarios and to meet the City' s sewer design standards.
IV. OPERATIONS AND MAINTENANCE
Funded directly from the Sewer Service and Use Charge Fund, the day-to-day maintenance and operations of the sanitary sewer collection system is primarily the responsibility of the Deprutment of Transportation (DOT). Functions performed by DOT generally include the following:
• Cleaning and removing grease, roots and other debris from the City's sewer lines.
• Repairing localized failures and deficiencies in the City's sewer mains and City maintained lower lateral pipes.
• Inspecting, maintaining and repairing pumps and other pump station facilities.
• Responding to ru1d resolving rep01ted sewer problems.
The primary goal of DOT's maintenru1ce functions is to reduce or eliminate occurrences of Sanitary Sewer Overflows (SSOs) in which untreated sewage escapes the sewer system due to a sewer line blockage or other system malfunction. DOT has invested in and implemented a multi-year plan to greatly reduce the number and severity of SSO's that occur in the City each year. Specific elements of this plan include the following:
• Increasing the amount of sewer line cleaning performed each year by expanding the miles of sewer lines cleaned on frequent cycles (e.g. weekly, monthly, mmually, bi-
Sanitary Sewer System Almual Report - FY 2014-15 17

annually).
• Implementing a chemical tree root control program for selected sewer lines.
• ·Performing additional sewer line inspections to identify needed cleaning, root control, and repairs.
• Implementing a First Responder Program to ensure timely response to reported sewer problems in order to prevent and reduce the impact of SSO's.
• Developing a new Computerized Maintenance Management System and adding technical and analytical staff to analyze the performance ofthe sewer system, identify and plan effective maintenance strategies, and evaluate and manage the maintenance operations.
• Replacing obsolete and unreliable equipment and purchasing additional equipment to maximize the efficiency of the maintenance operations.
• Providing advanced training for the sewer line cleaning crews.
Performance data and inf01mation from the last two fiscal years indicate that DOT's SSO reduction plan has been successful in reducing SSO's and improving maintenance operations. Table 4 below highlights some of the results achieved by DOT over the past tlu·ee years.
Number ofSSO's 20 16 15
SSO's per 100 miles of pipe per 3.5 2.8 2.6
year Gallons of sewage spilled to surface
1,010 6,214 60,968 water Percent of reported sewer problems
75.0% 79.3% 73.7% responded to within 30 minutes
Miles of sewer lines cleaned 261 223 284
Note: Prior to FY 2012-13, DOT's timeliness standard for responding to reported sewer problems was 4 hours.
Table 4- Pe1jormance Improvement Result
While the results compare and contrast only a single quarter from the last three fiscal years, they are consistent with the trends that are being experienced over the last 12 months and staff believes that they are a confirmation that the recent investments and improvements made by DOT are paying off.
Sau itary Sewer System Annual Report- FY 2014-15 18

Cunently, DOT receives approximately $16.6 million in on-going funding each year to maintain and operate the sanitary sewer collection system. Approximately $2.4M of additional one-time funding was received in FY 2014-15 for teclmology improvements, lateral repair grants and a rebudget for delayed vehicle procurements. Going forward, DOT believes that the performance of the sanitary sewer system and the productivity of maintenance staff will continue to improve with continued investments in equipment and persoru1el. Most notably, DOT will be implementing a new computerized maintenance management system and technology improvements and/or staffmg alignments may be needed to optimize field productivity, data collection and overall sewer system management.
V. CONCLUSION
• The Sanitary Sewer Capital Improvement program continues to uti lize strategic plaru1ing tools such as the Sanitary Master Plan and Condition Assessment program, in addition to input from our Operations and Maintenance partners in the Department of Transportation, to prioritize and implement improvements to the sanitary sewer system. Construction of these improvements will ensure safe and reliable sewer service to the current and future residents/businesses of San Jose and contributing agencies. Increasing regulatory oversight, reducing SSOs, and supporting economic development all require continued investment in active management, maintenance and improvement of the City's 2,250 miles of sanitary sewer system. Increased capital funding for the sanitary capital program has increased our ability to maintain and enhance the system. The $25 million ammal transfer was fow1d to be insufficient to meet our targeted revenue of$37 million per year and as a result, begim1ing FY 2015-16, the total ammal transfer for the sanitary capital program has been increased to $32 million annually. With the anticipation of awarding the Phase VI interceptor project of over $30 million in this year, the accumulated ending fund balance will be reduced significantly. The combined effort between operations, maintenance and capital improvements have resulted in a reduction of blockages and SSOs.
• Sixteen capital projects were completed to restore the integrity and conveyance of the system, reducing maintenance costs and the probability of SSOs and/or blockages.
• The Master Plan program has helped reduce the cost of development by providing efficiency in sewer capacity review process and finding cost-effective measures to improve sewer capacity needed for land use development.
• 35,700 feet of structurally deficient sewer removed and replaced.
• 17,600 feet of moderately deteriorated sewers were rehabilitated.
• 544,863 feet of sewers were inspected by closed circuit television inspection.
• Four of the most deteriorated sanitary pump stations are in design or construction.
Sanjtary Sewer System Annual Report- FY 2014- 15 19
• The Sanitary Sewer Master Plan was continually updated and calibrated to develop and prioritize sanitary sewer capacity projects.
• The Condition Assessment program was initiated to assist with development of a 'prioritized and proactive rehabilitation program.
• Implementation of the First Responder program has reduced overall SSO response times to less than 30 minutes, which helped to decrease the amount of spilled sewage entering surface waters significantly.
• Over 1,035 miles of sewer lines were cleaned and 12.4 miles of sewers were chemically treated.
• Implementation and development of new Computerized Maintenance Management System and technology enhancements have contributed to plamling effective maintenance strategies in order to maximize efficiency.
Sanitary Sewer System Annual Report- FY 20 14-15 20