Embed Size (px)
Citation preview

04.26.2017
SANTANDER CONSUMER USA HOLDINGS INC.First Quarter 2017

2IMPORTANT INFORMATIONForward-Looking StatementsThis presentation contains forward-looking statements within the meaning of the Private Securities Litigation Reform Act of 1995. Any statements about ourexpectations, beliefs, plans, predictions, forecasts, objectives, assumptions, or future events or performance are not historical facts and may be forward-looking.These statements are often, but not always, made through the use of words or phrases such as anticipates, believes, can, could, may, predicts, potential, should,will, estimates, plans, projects, continuing, ongoing, expects, intends, and similar words or phrases. Although we believe that the expectations reflected in theseforward-looking statements are reasonable, these statements are not guarantees of future performance and involve risks and uncertainties that are subject tochange based on various important factors, some of which are beyond our control. For additional discussion of these risks, refer to the section entitled Risk Factorsand elsewhere in our Annual Report on Form 10-K and our Quarterly Reports on Form 10-Q filed by us with the U.S. Securities and Exchange Commission (SEC).Among the factors that could cause the forward-looking statements in this presentation and/or our financial performance to differ materially from that suggestedby the forward-looking statements are (a) the inherent limitations in internal controls over financial reporting; (b) our ability to remediate any material weaknessesin internal controls over financial reporting completely and in a timely manner; (c) continually changing federal, state, and local laws and regulations couldmaterially adversely affect our business; (d) adverse economic conditions in the United States and worldwide may negatively impact our results; (e) our businesscould suffer if our access to funding is reduced; (f) significant risks we face implementing our growth strategy, some of which are outside our control; (g)unexpected costs and delays in connection with exiting our personal lending business; (h) our agreement with Fiat Chrysler Automobiles US LLC may not result incurrently anticipated levels of growth and is subject to certain performance conditions that could result in termination of the agreement; (i) our business couldsuffer if we are unsuccessful in developing and maintaining relationships with automobile dealerships; (j) our financial condition, liquidity, and results of operationsdepend on the credit performance of our loans; (k) loss of our key management or other personnel, or an inability to attract such management and personnel; (l)certain regulations, including but not limited to oversight by the Office of the Comptroller of the Currency, the Consumer Financial Protection Bureau, theEuropean Central Bank, and the Federal Reserve, whose oversight and regulation may limit certain of our activities, including the timing and amount of dividendsand other limitations on our business; and (m) future changes in our relationship with Banco Santander that could adversely affect our operations. If one or moreof the factors affecting our forward-looking information and statements proves incorrect, our actual results, performance or achievements could differ materiallyfrom those expressed in, or implied by, forward-looking information and statements. Therefore, we caution the reader not to place undue reliance on any forward-looking information or statements. The effect of these factors is difficult to predict. Factors other than these also could adversely affect our results, and the readershould not consider these factors to be a complete set of all potential risks or uncertainties. Any forward-looking statements only speak as of the date of thisdocument, and we undertake no obligation to update any forward-looking information or statements, whether written or oral, to reflect any change, except asrequired by law. All forward-looking statements attributable to us are expressly qualified by these cautionary statements.

3
» Net income of $143 million, or $0.40 per diluted common share
» Total auto originations of $5.4 billion
» Net finance and other interest income of $1.1 billion, down 8% year-over-year
» Net leased vehicle income of $128 million, up 18% year-over-year
» Return on average assets of 1.5%
» Average managed assets of $51.2 billion, down 3% year-over-year
» CET1 ratio of 13.8%, up 170 bps year-over-year demonstrating strong capital generation
» Executed Banco Santander flow agreement - $700 million inaugural transaction
» Issued $3.1 billion in securitizations
» Continued strength in ABS platforms evidenced by the upgrade of 49 ABS tranches by Moody’s across multiple platforms during the quarter, positively impacting more than $4.2 billion in securities
Q1 2017 HIGHLIGHTS Setting SC up for long-term success by delivering value to shareholders while focusing on disciplined
underwriting, compliance and being simple, personal and fair

4ECONOMIC INDICATORSU.S. Auto Sales1
Units in Millions
1 St. Louis Fed Research2 University of Michigan3 Bloomberg4 Bureau of Labor Statistics
Consumer Confidence2
Index Q1 1966=100
U.S. GDP3
YOY%U.S. Unemployment Rate4
%
ORI
GIN
ATIO
NS
CRED
IT
4.5%
Max 10.0%
Min 4.4%
Mar-07 Mar-08 Mar-09 Mar-10 Mar-11 Mar-12 Mar-13 Mar-14 Mar-15 Mar-16 Mar-17
98.2
Max 98.5
Min 55.3
Mar-07 Mar-08 Mar-09 Mar-10 Mar-11 Mar-12 Mar-13 Mar-14 Mar-15 Mar-16 Mar-17
16.5
Max 18.8
Min 9.0
Mar-07 Mar-08 Mar-09 Mar-10 Mar-11 Mar-12 Mar-13 Mar-14 Mar-15 Mar-16 Mar-17
1.9%
Max 3.2%
Min -4.1%
Dec-07 Dec-08 Dec-09 Dec-10 Dec-11 Dec-12 Dec-13 Dec-14 Dec-15 Dec-16

5
44.9%
53.4%51.1%
35%
40%
45%
50%
55%
60%
65%
70%
Mar-13 Mar-14 Mar-15 Mar-16 Mar-17SC Auction Only Recovery Rate SC Auction Plus Recovery Rate (Quarterly)
7.5%
Max 13.3%
Min 2.8%
0.0
2.0
4.0
6.0
8.0
10.0
12.0
14.0
Feb-07 Feb-09 Feb-11 Feb-13 Feb-15 Feb-17
Subprime
4.3%
Max 5.4%
Min 1.6%
Feb-07 Feb-09 Feb-11 Feb-13 Feb-15 Feb-17
Subprime
85
90
95
100
105
110
115
120
125
110
115
120
125
130
Mar-12 Mar-13 Mar-14 Mar-15 Mar-16 Mar-17
Manheim (Left Axis) NADA (Right Axis)
AUTO INDUSTRY ANALYSISUsed Vehicle Indices1
Manheim: Seasonally Adjusted NADA: Not Seasonally Adjusted
1 Manheim, Inc.; Indexed to a basis of 100 at 1995 levels; National Automotive Dealers Association (NADA)2 Auction Only - includes all auto-related recoveries including inorganic/purchased receivables from auction lanes only2 Auction Plus – Per the financial statements includes insurance proceeds, bankruptcy/deficiency sales, and timing impacts 3 Standard & Poor’s Rating Services (ABS Auto Trust Data – two-month lag on data, as of February 28, 2017)
SC Recovery Rates2
Industry Net Loss Rates3
Nonprime
SEVE
RITY
CRED
IT
Industry 60+ Day Delinquency Rates3
Nonprime

6
VEHICLE FINANCE
LEVERAGING TECHNOLOGY IS INTEGRAL TO THE FOUR PILLARS OF OUR FOCUSED BUSINESS MODEL
FOCUSED BUSINESS MODEL
DISCIPLINED APPROACH TO MARKETSIMPLE, PERSONAL, FAIR APPROACH WITH
CUSTOMERS, EMPLOYEES AND ALL CONSTITUENCIES
SERVICED FOR OTHERS
FUNDING AND LIQUIDITY CULTURE OF COMPLIANCE

7
Benefits
Overview
Strategy to support the Chrysler relationship and improve prime originations
Prime loan sale through securitization structure
BSSA provides SC with a $750M warehouse facility to fund originations between asset sales
Established during April 2017
Two-year agreement between SC and BSSA
Provides a stable framework for prime originations
Expected to be beneficial to Fiat Chrysler Automobiles (FCA) relationship by improving Chrysler Capital penetration
Supports the serviced for others strategy
Provides access to attractive ROA assets for Banco Santander
During Q1 2017 SC and Banco Santander (BSSA) executed an inaugural transaction for approximately $700 million prime retail loans
EXECUTED BANCO SANTANDER FLOW AGREEMENT

8DISCIPLINED LOAN UNDERWRITING CONTINUED IN 1Q17
1 Approximate FICOs2 Includes some capital lease originations
Auto origination decreases (YoY) driven by disciplined underwriting in a competitive market
($ in Millions) Q1 2017 Q4 2016 Q1 2016 QoQ YoYTotal Core Retail Auto 2,198$ 2,010$ 2,614$ 9% (16%)
Chrysler Capital Loans (<640)1 833 768 1,242 8% (33%)Chrysler Capital Loans (≥640)1 755 775 1,307 (3%) (42%)
Total Chrysler Capital Retail 1,588$ 1,543$ 2,549$ 3% (38%)Total Leases2 1,602 973 1,619 65% (1%)Total Auto Originations 5,388$ 4,526$ 6,782$ 19% (21%)
Total Personal Lending - 190 - N/A N/ATotal Originations 5,388$ 4,717$ 6,782$ 14% (21%)
Asset Sales 931$ 1,381$ 1,729$ (33%) (46%)Serviced for Others Portfolio 11,015$ 11,945$ 14,235$ (8%) (23%)Average Managed Assets 51,230$ 52,039$ 52,962$ (2%) (3%)
Three Months Ended Originations % Variance

9
4% 3% 2% 2% 2%
14% 13% 12% 11% 12%
15%12% 13% 15% 18%
22%20% 23% 24%
25%
13%13%
14% 15% 13%
32%40% 35% 32% 30%
1Q16 2Q16 3Q16 4Q16 1Q17
Originations by Credit (RIC only)($ in millions)
>640
600-640
540-599
<540
No FICO
Commercial
51% 57% 56% 53% 47%
49% 43% 44% 47% 53%
1Q16 2Q16 3Q16 4Q16 1Q17
New/Used Originations($ in millions)
Used
New
ORIGINATIONS EXHIBIT DISCIPLINED UNDERWRITING
1 Loans to commercial borrowers; no FICO score obtained
Originations <640 decreased approximately $840 million YoY
Mix relatively constant on a percentage basis
Higher proportion of used vehicles originated in 2017, up 4% YoY
Average loan balances on originations down YoY, reflecting larger percentage of used vehicles and lower loan-to-values
Average loan balancein dollars $21,745 $21,929 $21,482 $21,488 $20,193
$3,723 $3,861 $3,553$5,162 $3,787
$3,723 $3,861 $3,553$5,162 $3,787
1
$2,657$3,499

10
Significant opportunity in prime originations
Executed Banco Santander flow agreement
FCA has sold more than 2 million units annually since 2014
March 2017 penetration rate of 19% vs. 17% as of
December 2016
Accomplishments and Improvements
SC remained the largest provider for FCA
FCA and SC’s relationship provides a unique offering for nonprime consumers in comparison to other original equipment manufacturers (“OEMs”)
Continued to refine dealer VIP program; approximately 2,000 dealerships participating
On track for a national rollout in 2017
The VIP program is leading to an increase in applications and funding without impacting underwriting standards
Through Santander Bank N.A. (“SBNA”), SC has increased dealer receivable originations (“floorplan”) more than 44% compared to 2016 YTD
CHRYSLER CAPITAL
1 FCA filings; sales as reported on 04/03/2017
SC continues to work strategically and collaboratively with FCA to continue to strengthen the relationship and create value within the Chrysler Capital program
0.4 0.4 0.5 0.5 0.6 0.5
1.71.8
2.12.3 2.2
2012 2013 2014 2015 2016 2017 YTD
FCA Sales1
(units in millions)
YTD Full Year

11
Flow Programs 1,729 659 794 477 931
CCART 904
Recent decrease in total balance related to lower prime originations and lower asset sales
Growth in SFO remains dependent upon Chrysler Capital penetration
SERVICED FOR OTHERS (SFO) PLATFORM
Composition at 3/31/2017
RIC 81%
Leases 12%
RV/Marine 7%
Total 100%
Serviced for Others Balances
Flow programs continue to drive asset sales
Inaugural BSSA flow sale of $700 million *Sales with retained servicing during period
$14,235 $13,034
$12,157 $11,945 11,015
1Q16 2Q16 3Q16 4Q16 1Q17
$ in Millions
$

12Q1 2017 FINANCIAL RESULTS
March 31, 2017 December 31, 2016 March 31, 2016 QoQ YoY Interest on finance receivables and loans 1,209,186$ 1,222,468$ 1,286,195$ (1%) (6%)Net leased vehicle income 128,062 122,791 108,432 4% 18%Other finance and interest income 3,825 3,695 3,912 4% (2%)Interest expense 227,089 216,980 184,735 5% 23%Net finance and other interest income 1,113,984$ 1,131,974$ 1,213,804$ (2%) (8%)Provision for credit losses 635,013 685,711 660,170 (7%) (4%)Profit sharing 7,945 12,176 11,394 (35%) (30%)Total other income 55,480 (47,996) 77,558 NA (28%)Total operating expenses 305,078 295,905 290,856 3% 5%Income before tax 221,428$ 90,186$ 328,942$ 146% (33%)Income tax expense 78,001 28,911 120,643 170% (35%)Net income 143,427$ 61,275$ 208,299$ 134% (31%)Diluted EPS ($) 0.40$ 0.17$ 0.58$ 135% (31%)
Average total assets 38,901,686$ 38,513,454$ 37,112,650$ 1% 5%Average managed assets 51,229,729$ 52,038,692$ 52,961,885$ (2%) (3%)
Three Months Ended(Unaudited, Dollars in Thousands, except per share) % Variance

13
March 31, 2017
December 31, 2016
March 31, 2016
QoQ YoY
Interest on finance receivables and loans 1,116,737$ 1,142,176$ 1,188,527$ (2%) (6%)Net leased vehicle income 128,062 122,791 108,432 4% 18%Other finance and interest income 3,825 3,696 3,912 3% (2%)Interest expense 215,076 206,259 172,252 4% 25%Net finance and other interest income 1,033,548$ 1,062,404$ 1,103,653$ (3%) (6%)Provision for credit losses 635,013 685,710 660,170 (7%) (4%)Profit sharing 8,187 9,218 9,685 (11%) (15%)
Investment gains (losses), net (11,760) (22,614) 2,039 (48%) NAServicing fee income 31,684 32,205 44,494 (2%) (29%)Fees, commissions and other 49,455 39,617 48,167 25% 3%
Total other income 69,379$ 49,207$ 94,700$ 41% (27%)
Average gross individually acquired retail installment contracts 28,200,907$ 28,604,117$ 28,319,861$ (1%) 0%Average gross operating leases 9,849,077$ 9,586,090$ 7,770,959$ 3% 27%
Three Months Ended(Unaudited, Dollars in Thousands) % Variance
Q1 2017 EXCLUDING PERSONAL LENDING
*Additional details can be found in Appendix

14
31-Mar-16 30-Jun-16 30-Sep-16 31-Dec-16 31-Mar-17
Reported Total Other Income (Loss) 77,558$ 37,302$ 26,682$ (47,996)$ 55,480$
Reported Investment Gains (Losses), Net (69,056)$ (101,309)$ (106,050)$ (168,344)$ (76,399)$
Add back:
Personal Lending LOCM Adjustments 64,213 94,767 95,646 145,730 64,639
Other 6,451 7,330 6,639 - -
Normalized Investment Gains (Losses), Net 1,608$ 788$ (3,765)$ (22,614)$ (11,760)$
Servicing Fee Income 44,494 42,988 36,447 32,205 31,684
Fees, Commissions, and Other1 102,120 95,623 96,285 88,143 100,195
Normalized Total Other Income 148,222$ 139,399$ 128,967$ 97,734$ 120,119$
Customer Default Activity 101,347 97,169 114,477 116,097 111,198
Fair Value Discount (37,134) (2,402) (18,831) 29,633 (46,559)
Denotes quarters with CCART sales
Three Months Ended
(Unaudited, Dollars in Thousands)
TOTAL OTHER INCOME SC’s strategy is to price loans sold under flow agreements close to par, with minimal investment gains (losses), to generate further growth
in the serviced for others platform and drive increased fee income
Beginning in Q4 2015, net investment gains (losses) include the impact of personal lending assets
Customer defaults, as part of LOCM adjustments on the personal lending portfolio designated as held for sale, are recognized through net investment gains (losses)
Seasonal balances will impact magnitude of LOCM adjustments; this quarter included lower LOCM adjustments driven by seasonal decreases in the personal lending portfolio
1 Fees, commissions and other includes fee income from the personal lending and auto portfolios

15
$660
$512
$610$686
$635
12.0%
12.6%
12.4%
12.6%
12.7%
11.6%
11.8%
12.0%
12.2%
12.4%
12.6%
12.8%
$0$100$200$300$400$500$600$700$800
Q1 2016 Q2 2016 Q3 2016 Q4 2016 Q1 2017
Provis ion Expense and Allowance Ratio($ in mi llions)
Provision for credit losses Allowance Ratio
$3,422
$171
$128 $10 ($278)
$3,453
$3,000
$3,100
$3,200
$3,300
$3,400
$3,500
$3,600
$3,700
$3,800
Q4 2016 NewVolume
TDRMigration
PerformanceAdjustment
Liquidations& Other
Q1 2017
Q4 2016 to Q1 2017 ALLL Reserve Walk2
($ in mi llions)
PROVISION AND RESERVES
Allowance to loans ratio increased to 12.7% QoQ, primarily driven by the increased balance of loans classified as TDRs and the denominator effect of slower portfolio growth
Provision for credit losses decreased YoY primarily driven by lower allowance for credit loss offset by higher net credit loss
QoQ allowance increased $31 million
New volume and TDR migration1 were offset by liquidations and other
1 TDR migration – the allowance for assets classified as TDRs or “troubled debt restructuring” takes into consideration expected lifetime losses, typically requiring additional coverage2 Explanation of quarter over quarter variance are estimates

16
6.9%
9.0% 9.2%10.0%
7.3%
3.1%4.2% 4.6%
5.1%
3.9%
0.0%
2.0%
4.0%
6.0%
8.0%
10.0%
12.0%
Q1 2016 Q2 2016 Q3 2016 Q4 2016 Q1 2017
Delinquency: Individually Acquired Retail Installment Contracts, Held for Investment
31-60
61+
16.3%
14.2%
17.2%18.1% 18.1%
7.6%5.7%
8.7% 9.4% 8.8%
53% 60%
49% 48% 51%
0%
10%
20%
30%
40%
50%
60%
70%
0.0%
2.0%
4.0%
6.0%
8.0%
10.0%
12.0%
14.0%
16.0%
18.0%
20.0%
Q1 2016 Q2 2016 Q3 2016 Q4 2016 Q1 2017
Credit: Individually Acquired Retail Installment Contracts,Held for Investment
Gross Charge-off Ratio
Net Charge-offRatio
Recovery Rate(as % ofrecordedinvestment)
LOSS AND DELINQUENCY
YoY delinquency increased for each delinquency bucket
Primary drivers:
2015 originations more nonprime in nature
Slower portfolio growth
YoY gross loss increased 180 basis points
Primary drivers:
2015 originations more nonprime in nature
Slower portfolio growth
Acceleration of bankruptcy related charge-offs
Recovery rates and net losses in Q2 2016 benefited by proceeds from bankruptcy and deficiency sales1
1 Excluding bankruptcy sales, recovery rates would have been 59%

17
$540
$599
$19
$19
$36 $15
Q1 2016 Portfolio Growth,Aging and Mix Shift
Recoveries Other Bankruptcy Sales Q1 2017
Q1 2016 to Q1 2017 Net Charge-Off Walk($ in millions)
CREDIT QUALITY: LOSS DETAIL
2015 vintage still represents largest portion of losses
“Other” includes $24 million of write-downs on loans in bankruptcy which were accelerated into Q1 2017
* Individually acquired retail installment contracts

18EXPENSE MANAGEMENT
Operating expenses totaled $305 million, an increase of 5% versus the same quarter last year, driven by continued investments in compliance and control functions and severance expense related to efficiency efforts
$52,962 $53,237 $52,675 $52,039 $51,230
$291$272 $284 $296 $305
2.2% 2.0% 2.2% 2.3% 2.4%
0.0%
2.0%
4.0%
6.0%
8.0%
10.0%
$2
$10,002
$20,002
$30,002
$40,002
$50,002
$60,002
Q1 2016 Q2 2016 Q3 2016 Q4 2016 Q1 2017
Average ManagedAssets($ millions)
Total Expenses($ millions)
Expense Ratio

19
6.94.2
3.85.7
Q4 2016 Q1 2017Unused Used
8.08.9
Q4 2016 Q1 2017
1.4
0.9
Q4 2016 Q1 2017
3.04.1
3.32.9
Q4 2016 Q1 2017
Unused
Used
13.5 14.8
Q4 2016 Q1 2017
$18.7 billion in commitments from 14 lenders 57% unused capacity on revolving lines at Q1 2017
FUNDING AND LIQUIDITYTotal committed liquidity of $41.4 billion at end of Q1 2017, up 5% from $38.5 billion at the end of Q4 2016.
Asset-Backed Securities($ Billions)
Private Financings($ Billions)
Banco Santander & Subsidiaries($ Billions)
Asset Sales($ Billions)
Executed 2 DRIVE and 1 SDART securitization in Q1 2017 = $3.1 BN
$7.0 billion in total commitments 41% unused capacity at Q1 2017
Q4 2016 sales were elevated vs. Q1 2017 due to Q4 CCART securitization
Amortizing Revolving
10.79.9
6.37.0
20
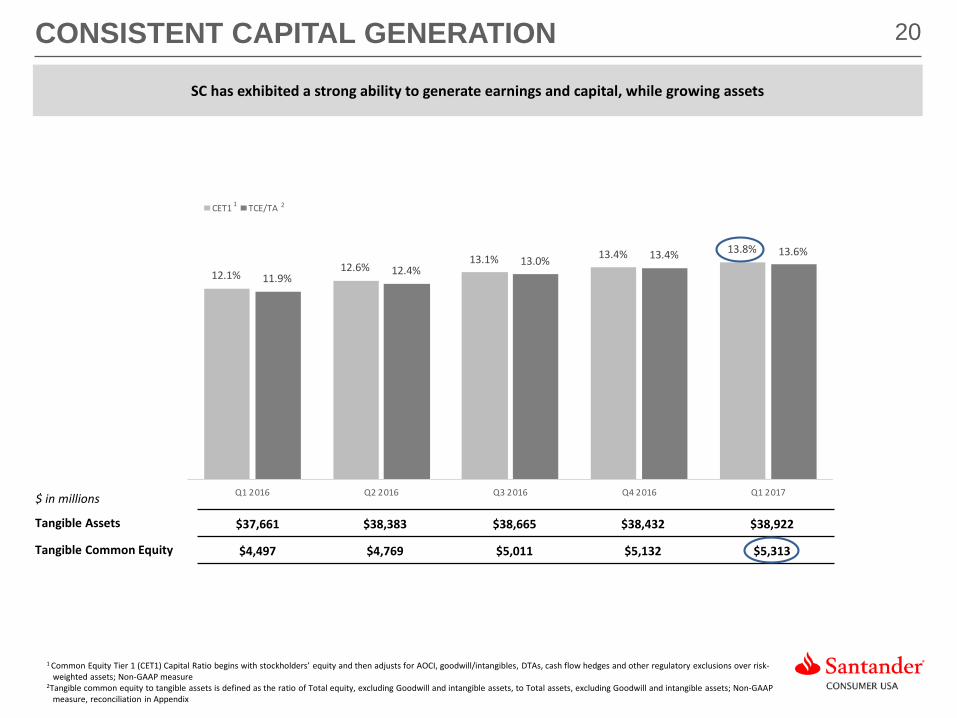
12.1%12.6%
13.1% 13.4% 13.8%
11.9%12.4%
13.0% 13.4% 13.6%
Q1 2016 Q2 2016 Q3 2016 Q4 2016 Q1 2017
CET1 TCE/TA
CONSISTENT CAPITAL GENERATION
1 Common Equity Tier 1 (CET1) Capital Ratio begins with stockholders’ equity and then adjusts for AOCI, goodwill/intangibles, DTAs, cash flow hedges and other regulatory exclusions over risk-weighted assets; Non-GAAP measure
2Tangible common equity to tangible assets is defined as the ratio of Total equity, excluding Goodwill and intangible assets, to Total assets, excluding Goodwill and intangible assets; Non-GAAP measure, reconciliation in Appendix
1 2
SC has exhibited a strong ability to generate earnings and capital, while growing assets
Tangible Assets $37,661 $38,383 $38,665 $38,432 $38,922
Tangible Common Equity $4,497 $4,769 $5,011 $5,132 $5,313
$ in millions

APPENDIX

22
Dealer performance was monitored by Risk Management quarterly SC focused on quantitative metrics including loss performance versus expectations
DEALER PERFORMANCE MANAGEMENT TIMELINE
2013
SC further enhanced dealer oversight to include qualitative metrics such as negative media, false documents and consumer complaints
If dealers breach any of the qualitative or quantitative metrics and performance does not improve, SC may terminate the dealership. Since 2015, over 800 dealerships have been terminated for performance-related issues
2016
Dealer Services department formed, which today has approximately 90 employees responsible for dealer oversight and management2015
Monthly Dealer Performance Management (DPM) process was created SC enhanced dealer oversight to include other quantitative metrics such as
delinquency and early payment default trends2014

23DEALER SERVICES DEPARTMENT ORG STRUCTURE
Dealer Maintenance: onboards new dealers and maintains dealer records
Dealer Performance Management (DPM): dealer performance is monitored and underperforming dealers are either trained or required to provide additional verifications. The DPM team recommends dealers for termination if necessary
Dealer Quality: conducts targeted reviews based on triggers such as consumer complaints, income outliers, negative media coverage and other risk events
Fraud Investigations: dealer management leverages SC’s Enterprise Fraud program to investigate identity theft, fraud claims, dealer fraud and customer application fraud
Dealer Recoveries: collects funds owed to SC from dealers, and reviews early payment defaults which may require proof of down payment
Fraud Investigations: dealer operations leverages SC’s Enterprise Fraud program to discuss suspicious activity with dealers and pursue enforcement when required
Dealer Advocacy: supports dealers by resolving complaints and obtaining feedback and suggestions
Conducts root cause analysis to determine training, system issues and develops remediation plans
Reports daily / monthly to executive team
Utilizing traditional metrics including loss trends, early loan performance trends and delinquency trends along with other metrics such as consumer complaints and dealer media coverage allows SC to have an even higher
standard of dealer oversight
SC’s Dealer Services Department today has approximately 90 employees responsible for dealer oversight and management of more than 15,000 dealer relationships
Dealer Management
Dealer Experience
Dealer Operations

24SANTANDER CONSUMER USA HOLDINGS INC.
1 As of March 31, 20172 DDFS LLC is an entity owned by former Chairman and Chief Executive Officer, Tom Dundon. This purchase would result in SHUSA owning approximately 68.3% of SC.3 Chrysler Capital is a dba of Santander Consumer USA
• Santander Consumer USA Holdings Inc. (NYSE:SC) (“SC”) is approximately 58.7%1 owned by Santander Holdings USA, Inc.(“SHUSA”), a wholly-owned subsidiary of Banco Santander, S.A. (NYSE:SAN)
• On July 3, 2015, SHUSA elected to exercise its right to purchase all of the shares of SC common stock owned by DDFS LLC, subject to regulatory approval and applicable law2
▪ SC is a full-service, technology-driven consumer finance company focused on vehicle finance, third-party servicing and providing superior customer service
• Historically focused on nonprime markets; established presence in prime and lease
▪ Approximately 5,000 full-time, 70 part-time and 1,400 vendor-based employees across multiple locations in the U.S. and the Caribbean
▪ Our strategy is to leverage our efficient, scalable technology and risk infrastructure and data to underwrite, originate and service profitable assets while treating employees, customers and all stakeholders in a simple, personal and fair manner
▪ Unparalleled compliance and responsible practices focus
▪ Continuously optimizing the mix of assets retained vs. assets sold and serviced for others
▪ Presence in prime markets through Chrysler Capital3
▪ Efficient funding through key third-party relationships, secondary markets and Santander
▪ Solid capital base
Overview
Strategy

25COMPANY ORGANIZATION
Other Subsidiaries
100% Ownership
Santander Holdings USA, Inc.(“SHUSA’)
~58.7% Ownership
Santander Consumer USA Holdings Inc.(“SC”)
Santander Bank, N.A.Other Subsidiaries
~9.6% Ownership
DDFS LLC1
and Tom Dundon
~31.7% Ownership
Other Management
Public Shareholders
Banco Santander, S.A. Spain
*Ownership percentages are approximates as of March 31, 20171 On July 3, 2015, SHUSA elected to exercise the right to purchase shares of SC common stock owned by DDFS LLC, an entity owned by former Chairman and Chief Executive Officer, Thomas Dundon, subject to regulatory approval and applicable law. This purchase would result in SHUSA owning approximately 68.3% of SC.

26Q1 2017 EXCLUDING PERSONAL LENDING DETAIL
TotalPersonal Lending
Excluding Personal Lending
TotalPersonal Lending
Excluding Personal Lending
TotalPersonal Lending
Excluding Personal Lending
Interest on finance receivables and loans $ 1,209,186 $ 92,449 $ 1,116,737 $ 1,222,468 $ 80,292 $ 1,142,176 $ 1,286,195 $ 97,668 $ 1,188,527
Net leased vehicle income 128,062 - 128,062 122,791 - 122,791 108,432 - 108,432
Other finance and interest income 3,825 - 3,825 3,696 - 3,696 3,912 - 3,912
Interest expense 227,089 12,013 215,076 216,980 10,721 206,259 184,735 12,483 172,252
Net finance and other interest income $ 1,113,984 $ 80,436 $ 1,033,548 $ 1,131,975 $ 69,571 $ 1,062,404 $ 1,213,804 $ 110,151 $ 1,103,653
Provision for credit losses 635,013 - 635,013 685710 - 685,710 660,170 - 660,170
Profit sharing 7,945 (242) 8,187 12,175 2,957 9,218 11,394 1,709 9,685
Investment gains (losses), net (76,399) (64,639) (11,760) (168,344) (145,730) (22,614) (69,055) (71,094) 2,039
Servicing fee income 31,684 - 31,684 32,205 - 32,205 44,494 - 44,494
Fees, commissions and other 100,195 50,740 49,455 88,144 48,527 39,617 102,120 53,953 48,167
Total other income $ 55,480 $ (13,899) $ 69,379 $ (47,996) $ (97,203) $ 49,207 $ 77,559 $ (17,141) $ 94,700
Average gross individually acquired retail installment contracts $ 28,200,907 - $ 28,604,117 - $ 28,319,861 -
Average gross personal loans - $ 1,488,665 - $ 1,405,187 - $ 1,727,635
Average gross operating leases $ 9,849,077 - $ 9,586,090 - $ 7,770,959 -
As of and for the Three Months Ended
(Unaudited, Dollars in Thousands)March 31, 2017 December 31, 2016 March 31, 2016

27HELD FOR INVESTMENT CREDIT TRENDS
Retail Installment Contracts1
1Held for investment; excludes assets held for sale
4.2%
12.6
%
23.2
%
31.0
%
17.1
%
11.9
%
2.6%
12.6
%
22.9
%
31.2
%
17.4
%
13.3
%
3.3%
12.4
%
22.2
%
31.1
%
17.2
%
13.8
%
3.1%
12.2
%
22.1
%
31.4
%
17.4
%
13.8
%
2.8%
12.0
%
22.3
%
31.7
%
17.4
%
13.8
%
Commercial Unknown <540 540-599 600-639 >=640
Q1 2016 Q2 2016 Q3 2016 Q4 2016 Q1 2017

28CONDENSED CONSOLIDATED BALANCE SHEETS(Unaudited, dollars in thousands) March 31, 2017 December 31, 2016
Assets
Cash and cash equivalents $ 420,826 $ 160,180
Finance receivables held for sale, net 1,856,019 2,123,415
Finance receivables held for investment, net 23,444,625 23,481,001
Restricted cash 2,912,710 2,757,299
Accrued interest receivable 306,742 373,274
Leased vehicles, net 8,927,536 8,564,628
Furniture and equipment, net 67,921 67,509
Federal, state and other income taxes receivable 93,386 87,352
Related party taxes receivable 467 1,087
Goodwill 74,056 74,056
Intangible assets, net 32,275 32,623
Due from affi l iates 29,480 31,270
Other assets 861,871 785,410
Total assets $ 39,027,914 $ 38,539,104
Liabilities and Equity
Liabil ities:
Notes payable — credit facil ities $ 4,958,638 $ 6,739,817
Notes payable — secured structured financings 23,666,666 21,608,889
Notes payable — related party 2,850,000 2,975,000
Accrued interest payable 37,759 33,346
Accounts payable and accrued expenses 414,851 379,021
Deferred tax l iabil ities, net 1,342,055 1,278,064
Due to affi l iates 56,315 50,620
Other l iabil ities 282,633 235,728
Total l iabil ities $ 33,608,917 $ 33,300,485
Equity:
Common stock, $0.01 par value 3,594 3,589
Additional paid-in capital 1,662,200 1,657,611
Accumulated other comprehensive income (loss), net 35,504 28,259
Retained earnings 3,717,700 3,549,160
Total stockholders’ equity $ 5,418,998 $ 5,238,619
Total l iabil ities and equity $ 39,027,915 $ 38,539,104

29CONDENSED CONSOLIDATED INCOME STATEMENTS March 31, March 31,
2017 2016
Interest on finance receivables and loans $ 1,209,186 $ 1,286,195 Leased vehicle income 418,233 329,792Other finance and interest income 3,825 3,912Total finance and other interest income $ 1,631,244 $ 1,619,899 Interest expense 227,089 184,735Leased vehicle expense 290,171 221,360Net finance and other interest income $ 1,113,984 $ 1,213,804 Provision for credit losses 635,013 660,170Net finance and other interest income after provision for credit losses $ 478,971 $ 553,634 Profit sharing 7,945 11,394Net finance and other interest income after provision for credit losses and profit sharing $ 471,026 $ 542,240
Investment gains (losses), net (76,399) (69,056)Servicing fee income 31,684 44,494Fees, commissions, and other 100,195 102,120Total other income $ 55,480 $ 77,558
Compensation expense 136,262 119,842Repossession expense 71,299 73,545Other operating costs 97,517 97,469Total operating expenses $ 305,078 $ 290,856 Income before income taxes 221,428 328,942Income tax expense 78,001 120,643Net income $ 143,427 $ 208,299
Net income per common share (basic) $ 0.40 $ 0.58 Net income per common share (diluted) $ 0.40 $ 0.58 Weighted average common shares (basic) 359,105,050 357,974,890 Weighted average common shares (diluted) 360,616,032 358,840,322
For the Three Months Ended
(Unaudited, dollars in thousands, except per share amounts)

30RECONCILIATION OF NON-GAAP MEASURES
March 31, December 31, September 30, June 30, March 31,
2017 2016 2016 2016 2016
Total equity $ 5,418,998 $ 5,238,619 $ 5,117,657 $ 4,876,712 $ 4,604,739
Deduct: Goodwill and intangibles 106,331 106,679 107,084 107,737 107,971Tangible common equity $ 5,312,667 $ 5,131,940 $ 5,010,573 $ 4,768,975 $ 4,496,768
Total assets $ 39,027,915 $ 38,539,104 $ 38,771,636 $ 38,490,611 $ 37,768,959
Deduct: Goodwill and intangibles 106,331 106,679 107,084 107,737 107,971Tangible assets $ 38,921,584 $ 38,432,425 $ 38,664,552 $ 38,382,874 $ 37,660,988
Equity to assets ratio 13.9% 13.6% 13.2% 12.7% 12.2%
Tangible common equity to tangible assets 13.6% 13.4% 13.0% 12.4% 11.9%
Total equity 5,418,998$ 5,238,619$ 5,117,657$ 4,876,712$ 4,604,739$ Deduct: Goodwill and other intangible assets, net of deferred tax liabilities 182,156 186,930 191,848 196,962 201,684 Deduct: Accumulated other comprehensive income, net 35,504 28,259 (26,598) (50,766) (36,065)Tier 1 common capital 5,201,338$ 5,023,430$ 4,952,407$ 4,730,516$ 4,439,120$ Risk weighted assets (a) 37,799,513$ 37,432,700$ 37,828,982$ 37,460,349$ 36,691,264$ Common Equity Tier 1 capital ratio (b) 13.8% 13.4% 13.1% 12.6% 12.1%
(Unaudited, dollars in thousands)
(a) Under the banking agencies' risk-based capital guidelines, assets and credit equivalent amounts of derivatives and off-balance sheet exposures are assigned to broad risk categories. The aggregate dollar amount in each risk
category is multiplied by the associated risk weight of the category. The resulting weighted values are added together with the measure for market risk, resulting in the Company's and the Bank's total Risk weighted assets (b) CET1 is calculated under Basel III regulations required as of January 1, 2015.