Embed Size (px)
Citation preview

Santander UK plc2014 Half Yearly Financial Report

Strategic report update
2014 Half year results highlights
Net interest income
£1,673mUp 20% on the first half of 2013, largely due to lower cost of retail liabilities and increased lending in Commercial Banking.
Adjusted cost-to-income ratio
52%(1)
Costs remained tightly controlled, absorbing on-going investment, with 10% positive jaws between income and expenses growth rates excluding significant items.
Gross mortgage lending
£12.8bnAn increase of £4.9bn compared with the first half of 2013, with a resumption of positive net lending in the first half of 2014.
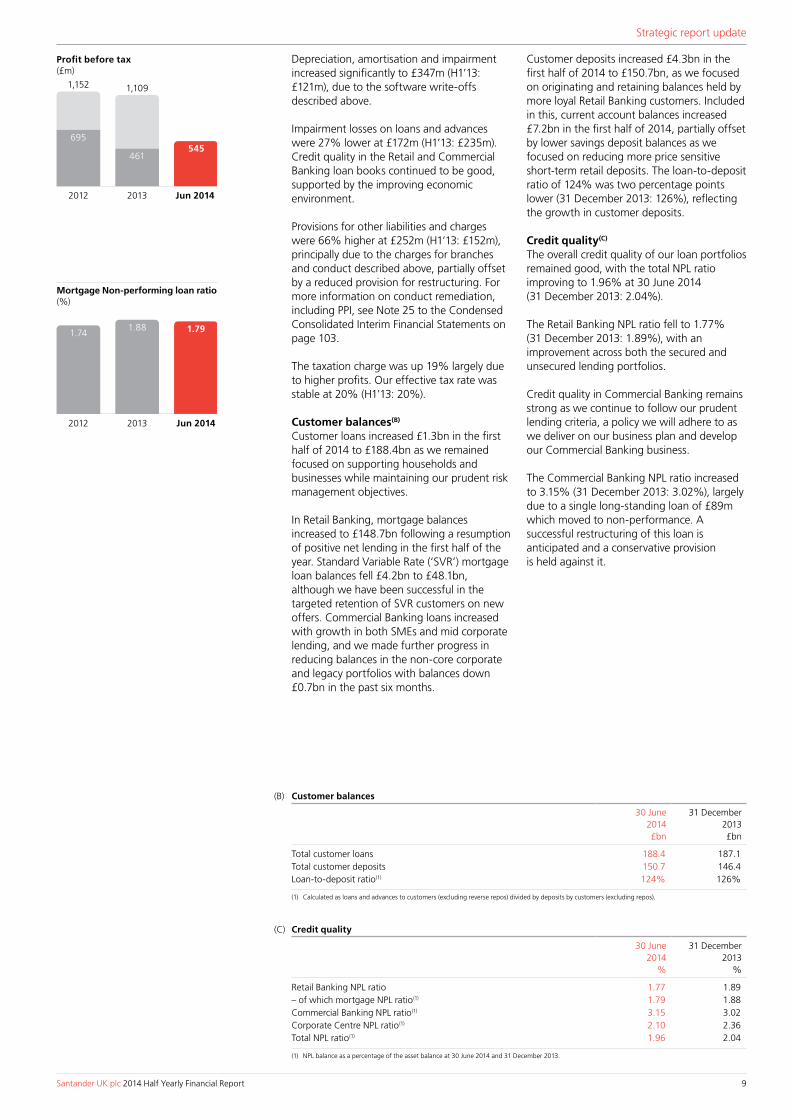
Profit before tax
£545mUp 18% on the first half of 2013, with continued growth in net interest income, strong cost discipline and good credit quality.
CET 1 Capital ratio
11.8%Common Equity Tier 1 (‘CET 1’) capital ratio strengthened from 11.6% at 31 December 2013, and after a £237m interim dividend approved in June 2014.
1I2I3 World customers
3 millionUp 25% in the first half of 2014, with almost one-in-four current account switchers joining Santander UK since the introduction of guaranteed current account switching in September 2013(2).
Banking net interest margin
1.80%Up 34 basis points from 1.46% in the first half of 2013, driven by lower customer deposit and wholesale funding costs.
Loan-to-deposit ratio
124%Improved two percentage points from 126% at 31 December 2013 reflecting strong growth in customer deposits, particularly current account balances.
Commercial lending
10% growthGrowth of 10% over the past 12 months to £23.1bn, and continues to be subject to prudent risk management criteria.
(1) A number of significant items impacted the financial results for the first half of 2014; their aggregate impact was £(206)m pre-tax and £(162)m post-tax. See page 8. Adjusted cost-to-income ratio of 52% for the first half of 2014 excludes significant items. The cost-to-income ratio for the first half of 2014 including significant items was 56%.
(2) Payments Council, Bacs for the industry and internal Management Information as reported to Bacs. Full switchers under the guarantee scheme from 24 September 2013 to 30 June 2014.

Santander UK plc 2014 Half Yearly Financial Report 1
Strategic report update
Strategic report update2 Our heritage
3 Santander UK today
4 Our strategy and business model
5 Key performance indicators
6 Chief Executive Officer’s review Ana Botín reports on progress against our strategic priorities and the overall business performance in the first half of 2014 as we work to build a simple, personal and fair bank for all our stakeholders.
8 Chief Financial Officer’s review Stephen Jones reports on our financial progress, profitability and the further strengthening of our balance sheet in the first half of 2014.
11 Summary risk report
Detailed business review
15 Group and divisional results
24 Balance sheet review
36 Risk management report
83 Governance
83 Directors
83 Directors’ Responsibility Statement
Financial Statements
85 Independent Review report
86 Primary Financial statements
90 Notes to the financial statements
Shareholder Information
119 Risk Factors
119 Contact information
119 Glossary of financial services industry terms
120 Forward-looking statements
This Half Yearly Financial Report contains forward-looking statements that involve inherent risks and uncertainties. Actual results may differ materially from those contained in such forward-looking statements. See ‘Forward-looking statements’ on page 120.
2014 Half Yearly Financial Report

Strategic report update
2 Santander UK plc 2014 Half Yearly Financial Report
Our relationship with the Banco Santander groupThe Banco Santander group operates a subsidiary model. This model involves autonomous units, such as Santander UK, operating in core markets, with each unit being responsible for its own liquidity, funding and capital management on an ongoing basis. The model is designed to minimise the risk to individual Banco Santander group units from problems arising elsewhere in the Banco Santander group.
The subsidiary model also gives Santander UK considerable financial flexibility, yet enables it to continue to take advantage of the significant synergies that come from being part of a global group: in brand, products, systems, platforms, development and management capability. In the model, the Banco Santander group facilitates the sharing of best practice and provides common technology, operations and support services
to all of its subsidiaries via independent operating entities, themselves established by the Banco Santander group so as to be able to continue operating as viable standalone businesses.
On 10 January 2014, Santander UK Group Holdings Limited became the holding company of Santander UK plc following its acquisition of Santander UK plc from Banco Santander S.A.. The acquisition was satisfied by the issue of shares in Santander UK Group Holdings Limited. The new holding company was put in place in light of UK regulatory developments relating to Banking Reform and Resolution and Recovery planning under which having a holding company above the operating banking companies is considered preferable.
For more information see the Directors’ Report on page 188 of the 2013 Annual Report.
Our heritage
Strong foundations
(1) On 10 January 2014.
NO GUARANTEE 100% owned
Banco Santander, S.A.
NO GUARANTEE 100% owned
Santander UK Group Holdings Limited (1)
CROSS GUARANTEE 100% owned
Santander UK plc
All Santander UK senior debt, covered bond and Euro Commercial Paper
Abbey National Treasury Services plc
1944The Abbey National Building Society formed with the merger of two long-standing building societies
2008Bradford & Bingley savings business and branches acquired by Santander UK
2010Abbey, Alliance & Leicester and Bradford & Bingley rebranded as Santander
Abbey National plc incorporated and listed on the London Stock Exchange
Banco Santander, S.A. acquisition of Abbey National plc approved by the courts
Alliance & Leicester plc transferred to Santander UK
1I2I3 World Current Account launched
1989 2004 2009 2012
JanuarySantander UK Group Holdings Limited became the holding company of Santander UK plc
2014
MarchLaunch of the 1I2I3 Mini Current Account for children and the Select debit card
AprilImplementation of the Mortgage Market Review
JuneLaunch of the new public website, new trade portal, Santander Passport and £500m AT1 Issuance by Santander UK plc
JulyLaunch of the 1I2I3 Student Current Account and announcement of a US$100m Fintech fund

Strategic report update
Santander UK plc 2014 Half Yearly Financial Report 3
Santander UK plc (the ‘Company’) and its subsidiaries collectively (‘Santander UK’ or the ‘Santander UK group’) operate primarily in the UK, are regulated by the UK Prudential Regulation Authority (‘PRA’) and the Financial Conduct Authority (‘FCA’) and are part of the Banco Santander, S.A. group (the ‘Banco Santander group’). Santander UK is a major financial services provider in the UK, offering a wide range of personal financial products and services, and is a growing participant in the corporate and commercial banking market. Santander UK is well positioned to continue to grow, with a distribution capability across our extensive branch and regional Corporate Business Centre (‘CBC’) network, and through our intermediary, telephony and digital channels.
Santander UK today(1)
Established UK market player
Active customers Branches Corporate Business Centres Employees
14m 987 52 20,345
Our businesses
Retail BankingOffers a wide range of products and financial services to individuals and small businesses (with a turnover of less than £250,000 per annum) through a network of branches and ATMs, as well as through telephony, e-commerce and intermediary channels.
Commercial BankingProvides a wide range of products and financial services to customers through a network of regional Corporate Business Centres (‘CBCs’) and through telephony and e-commerce channels across small and medium enterprise (‘SME’), mid-cap and large-cap corporates.
MarketsDelivers risk management and other services to financial institutions, as well as to other Santander UK divisions. Its main product areas are fixed income and foreign exchange, equities, capital markets and institutional sales.
Corporate CentrePrincipally comprises Financial Management & Investor Relations (‘FMIR’), responsible for managing capital and funding, balance sheet composition and structure, and strategic liquidity risk for the Santander UK group. Also includes the non-core corporate and legacy portfolios.
Income
£1,991mIncome
£395mIncome
£58mShort-term funding
£25.3bn Profit before tax
£1,053mProfit before tax
£145mProfit before tax
£1mTotal wholesale funding
£67.4bnResidential mortgages
£148.7bnCustomer loans
£23.1bnTotal assets
£17.3bnTotal liquid assets
£72.2bnLoyal customers
3mCustomers
71,650
5
83
12
Customer loan balances(%)
Commercial Banking
Retail Banking
Corporate Centre
(1) Data at 30 June 2014 and for the six months ended 30 June 2014.

Strategic report update
4 Santander UK plc 2014 Half Yearly Financial Report
Our strategy and business model
Our purpose is to help people and businesses prosper throughout the United Kingdom.
Our aim is to be the best bank for our people, our customers, our shareholders and our communities...
Simple, Personal and Fair: the Santander Way
We want everything we do to be simple, personal and fair. This embodies what our stakeholders want from their bank and
define how we work together and how we treat our customers, our shareholders and our communities.
By making everything we do simple, personal and fair, we will achieve our aim to become the best bank in the UK.
Our three strategic priorities are driving our transformation into a customer-focused, diversified retail and commercial bank...
Loyal and satisfied retail customers
To deepen our customers’ loyalty by satisfying their changing needs
‘Bank of Choice’ for UK companies
To grow our Commercial Banking business and expand the range of products and
services we offer to our corporate customers by understanding their needs
Consistent profitability and a strong balance sheet
To provide our shareholders with a reliable return on their investment
1 2 3
People
Shareholders
CustomersCommunities
Best bank for our customers
We build long-lasting relationships with our retail customers by offering clear products with ongoing value.
We build long-term partnerships with our corporate customers by understanding their needs, with better products and
tailored services
Best bank for our people
We recruit, retain and reward the most talented and committed people
so we can provide the best service to our customers
Best bank for our communities
We support communities around the UK in order to fulfil our responsibilities to society
and deepen our links with those whom we serve
Best bank for our shareholders
We maintain a conservative capital, funding and liquidity profile,
underpinned by a prudent approach to risk, in order to generate
consistent returns for our shareholders through
the economic cycle

Strategic report update
Santander UK plc 2014 Half Yearly Financial Report 5
Performance indicator Actual performance Target for 2015
2012 201330 June
2014
Loyal customersOur loyal customer base is growing, supported by the continued success of the 1I2I3 Current Account.
2.2million
2.7 million
3.0 million
4 million
1I2I3 World customers1I2I3 World has 3.0 million current account and credit card customers, more than 1 million higher than a year ago, and with a growing transactional primary customer base.
1.3 million
2.4 million
3.0 million
4 million
Customer satisfaction (Financial Research Survey (‘FRS’))(1)
FRS reported that customer satisfaction continued to improve in the last year, with the gap between Santander UK and the average of our top three peers reducing to 2 percentage points.
55% 57.3% 58.4% Top 3(Average of top 3 peers)(60%) (61.1%) (60.4%)
Commercial Banking percentage of customer loansCommercial Banking customer loans increased by £1.0bn in the first half of 2014 (and by £2.1bn over the last year) to £23.1bn, with growth in lending to large corporates and SMEs. We will not, however, compromise on our prudent risk management and returns objectives to achieve our 2015 mix aspiration for the Commercial Banking business. Our 20% target will not be achieved by the end of 2015, but remains a medium-term objective.
10% 12% 12% 20%
Return on tangible equity (‘RoTE’) Adjusted RoTE(3) improved to 11.7% in the first half of 2014. RoTE improved to 10.0% in the same period.
9.1%(2) 8.6%(2) 11.7%(3) 13%-15%
Cost-to-income ratioAdjusted cost-to-income ratio for the first half of 2014 was 52%(4). Costs remained tightly controlled, absorbing ongoing investment, with 10% positive jaws between income and expense growth rates excluding significant items. Cost-to-income ratio for the first half of 2014 was 56%, and for the first half of 2013 was 57%.
53% 54% 52%(4) <50%
Common Equity Tier 1 (‘CET 1’) capital ratio Capital was strengthened further, after declaring an interim dividend of £237m in the first half of 2014.
11.1% 11.6% 11.8% >10.5%
Loan-to-deposit ratioThe loan-to-deposit ratio improved 2 percentage points to 124%, reflecting growth in customer deposits, particularly current account balances, and we expect the ratio to reduce further over time. Consequently, we revised our 2015 target to <125% from <130%.
129% 126% 124% <125%
Non-performing loan (‘NPL’) ratioThe NPL ratio of 1.96% continued to improve, with retail and corporate loans performing in line with expectations.
2.16% 2.04% 1.96% ratio maintained
Dividend payout ratioIn the first half of 2014, we approved an interim dividend of £237m. All dividends are paid subject to the approval of the regulator.
50% 50% 50%(5) 50%
Key performance indicators (‘KPIs’) help measure our progress against our strategic priorities and represent the set of measures that management reviews and tracks on a regular basis. In the first half of 2014, business performance improved further and we remain focused on delivering almost all of our key commitments for the end of 2015.
Key performance indicators
(1) The FRS is a monthly personal finance survey of around 5,000 consumers prepared by the independent market research agency, GfK NOP. The ‘Overall Satisfaction’ score refers to the proportion of extremely and very satisfied customers across mortgages, savings, main current accounts, home insurance, UPLs and credit cards, based on a weighting of those products calculated to reflect the average product distribution across Santander UK and competitor brands. Data shown is for the 12 months ended 30 June 2014, 12 months ended 31 December 2013 and 12 months ended 30 June 2013. The competitor set in this analysis is Barclays, Halifax, HSBC, Lloyds Bank (including Lloyds TSB) and NatWest. Previously this data was reported on a rolling three-month basis.
(2) Adjusted to reflect the retrospective adoption of IFRIC 21. (2011: 9.5%). See Note 1 to the Condensed Consolidated Interim Financial Statements.(3) Adjusted RoTE for the first half of 2014 is annualised and adjusted for the effect of the UK Bank Levy and to exclude significant items (see page 8).(4) Adjusted cost-to-income ratio for the first half of 2014 of 52% excludes significant items (see page 8).(5) Dividend payout ratio is calculated as dividend paid and approved as a percentage of earnings attributable to ordinary shareholders (profit after tax less payment of dividend on preference shares and adjusted for the prior year restatement
relating to FSCS).
Definitions of the KPIs and explanations of why the chosen indicators are important to management are set out on page 6 of the 2013 Annual Report. The financial results for the first half of 2014 included a number of pre-tax significant items in Corporate Centre, as outlined in the Chief Financial Officer’s Review. In the table below, RoTE and the cost-to-income ratio have been adjusted to exclude the impact of these items.

Strategic report update
6 Santander UK plc 2014 Half Yearly Financial Report
Our aim is to become the best bank in the UK, for our people, our customers, our shareholders and the communities in which we operate, ensuring that everything we do is Simple, Personal and Fair. Our performance, with results once again ahead of our plans, reflects the strategic transformation we initiated in 2011.
In the first half of 2014, we continued to support our customers against the backdrop of a UK economy that is showing an increasing positive momentum across all regions, while we continue to make steady progress:
Our strategic priorities
1. Loyal and satisfied retail customers 1I2I3 World, which offers value and rewards customers’ loyalty, has continued to drive the success of our retail banking proposition. The number of 1I2I3 World customers increased by 600,000 in the first half of 2014 to 3.0 million. Since the introduction of guaranteed current account switching in September 2013, almost one-in-four of the customers who have moved banks have joined Santander UK(1).
Current account balances have grown by around £1bn per month on average since 2012. Our share of related savings balances has also grown, with total deposits held by our primary banking customers up 19% to £62.4bn in the first half of 2014, and now accounting for 49% of total retail liabilities.
During the first half of 2014, we helped 19,300 first-time buyers (£2.6bn gross lending) and 3,100 Help to Buy customers (£450m) purchase a home. Our total gross mortgage lending was £12.8bn, with a resumption of positive net lending. Our average loan-to-value on new mortgages was 65% with an average loan to income multiple of 3.1. We also offer our 1I2I3 current account customers exclusive mortgage rates and, as a result, since the beginning of the year more than 22% of mortgages sold in our branches have been to 1I2I3 customers.
Our performance reflects improvements we have made to the customer experience. In July 2014, the FRS reported that the gap between our satisfaction score and that of our top 3 peers had narrowed to two percentage points from a gap of nine points at the end 2011. The experience of 1|2|3 World customers is now consistently among the highest in the industry.
We are building on our successful approach by developing more targeted products and services for our key customer segments, including our new segment for more affluent customers, Select, to which we have now introduced 540,000 customers. In the first half of 2014, we have also launched a 1I2I3 Mini, a new current account for children, and a 1I2I3 Student account.
By the end of 2014, our programme of refurbishment will have covered 40% of our branches since it began, and we will have invested further to provide better products and improve customer service, with a strong emphasis on technology and digital capability. Our digital service is well advanced with about 25% of our sales now coming from digital channels, and we have already made a number of improvements, including a new public website unveiled in June and improvements to our secure site.
Lastly, in order to support our focus on digital innovation, we have announced a new US$100m Santander Fintech Fund, based in London, to invest in financial technology start-ups in the UK and elsewhere.
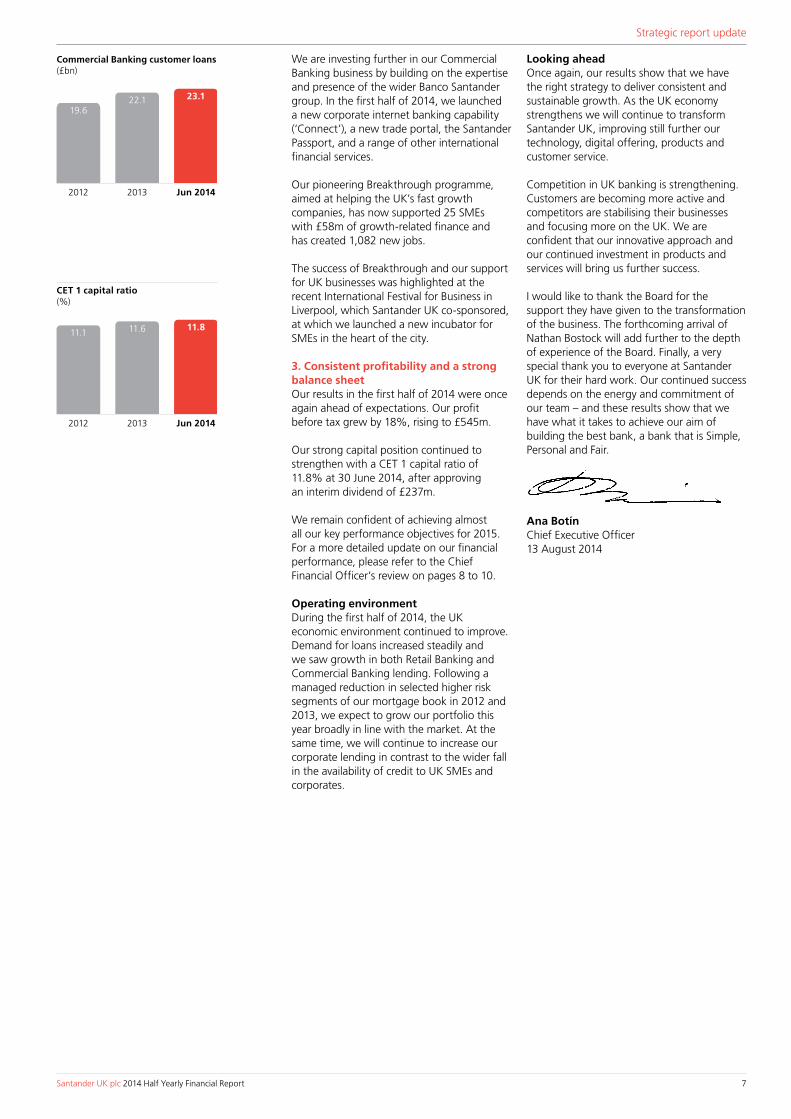
2. ‘Bank of Choice’ for UK companies Our Commercial Banking proposition is built on four pillars: a business model, based on ‘proximity’; an IT platform, offering new products and services; a segmented risk approach; and our Breakthrough programme, to provide funding for fast growth SMEs.
Commercial Banking lending has grown by 10% over the past year. During the first half of 2014, we extended £3.9bn of new facilities to UK corporates and SMEs, with loan balances increasing to £23.1bn.
We continued to invest in our local presence and now have 52 Corporate Business Centres and 677 relationship managers.
Customer satisfaction with our SME banking continues to improve and now matches that of our top 3 competitors(2).
Chief Executive Officer’s review
Ana Botín Chief Executive Officer
(1) Payments Council, Bacs for the industry and internal Management Information as reported to Bacs. Full switchers under the guarantee scheme from 24 September 2013 to 30 June 2014.
(2) The Charterhouse UK Business Banking Survey, published May 2014.
Loyal customers(million)
2012 2013 Jun 2014
2.2
2.73.0
Strategic report update
Santander UK plc 2014 Half Yearly Financial Report 7
We are investing further in our Commercial Banking business by building on the expertise and presence of the wider Banco Santander group. In the first half of 2014, we launched a new corporate internet banking capability (‘Connect’), a new trade portal, the Santander Passport, and a range of other international financial services.
Our pioneering Breakthrough programme, aimed at helping the UK’s fast growth companies, has now supported 25 SMEs with £58m of growth-related finance and has created 1,082 new jobs.
The success of Breakthrough and our support for UK businesses was highlighted at the recent International Festival for Business in Liverpool, which Santander UK co-sponsored, at which we launched a new incubator for SMEs in the heart of the city.
3. Consistent profitability and a strong balance sheet Our results in the first half of 2014 were once again ahead of expectations. Our profit before tax grew by 18%, rising to £545m.
Our strong capital position continued to strengthen with a CET 1 capital ratio of 11.8% at 30 June 2014, after approving an interim dividend of £237m.
We remain confident of achieving almost all our key performance objectives for 2015. For a more detailed update on our financial performance, please refer to the Chief Financial Officer’s review on pages 8 to 10.
Operating environment During the first half of 2014, the UK economic environment continued to improve. Demand for loans increased steadily and we saw growth in both Retail Banking and Commercial Banking lending. Following a managed reduction in selected higher risk segments of our mortgage book in 2012 and 2013, we expect to grow our portfolio this year broadly in line with the market. At the same time, we will continue to increase our corporate lending in contrast to the wider fall in the availability of credit to UK SMEs and corporates.
Looking ahead Once again, our results show that we have the right strategy to deliver consistent and sustainable growth. As the UK economy strengthens we will continue to transform Santander UK, improving still further our technology, digital offering, products and customer service.
Competition in UK banking is strengthening. Customers are becoming more active and competitors are stabilising their businesses and focusing more on the UK. We are confident that our innovative approach and our continued investment in products and services will bring us further success.
I would like to thank the Board for the support they have given to the transformation of the business. The forthcoming arrival of Nathan Bostock will add further to the depth of experience of the Board. Finally, a very special thank you to everyone at Santander UK for their hard work. Our continued success depends on the energy and commitment of our team – and these results show that we have what it takes to achieve our aim of building the best bank, a bank that is Simple, Personal and Fair.
Ana BotínChief Executive Officer13 August 2014
CET 1 capital ratio(%)
2013 Jun 2014
11.811.6
2012
11.1
Commercial Banking customer loans(£bn)
2013 Jun 2014
23.122.1
2012
19.6

Strategic report update
8 Santander UK plc 2014 Half Yearly Financial Report
Overview In the first half of 2014, we maintained our track record of consistent profitability and a strong balance sheet.
RoTE improved to 10.0%, supported by increased net interest income, and banking NIM rose strongly to 1.80% (H1’13: 1.46%), a consequence of lower deposit and wholesale funding costs. Costs remained tightly controlled and absorbing investment spend, with an adjusted cost-to-income ratio of 52% (2013: 54%) and a 10 percentage point positive jaws between income and expenses growth rates excluding significant items.
Credit quality remains good across all portfolios and in the mortgage book in particular where NPLs fell to 1.79%.
The CET 1 capital ratio continued to strengthen to 11.8% at 30 June 2014 (31 December 2013: 11.6%) after approving a £237m interim dividend. The dividend was in line with our policy to pay 50% of attributable earnings and was approved by the UK regulator.
Income statement highlights(A)
Profit before tax from continuing operations increased by 18% to £545m in the first half of 2014, with continued growth in net interest income, strong cost discipline and good credit quality. A number of significant items impacted the financial results for the period; their aggregate impact was £(206)m pre-tax and £(162)m post-tax, as follows:
Significant items – A net gain of £218m arose in administrative expenses as a result of defined benefit pension scheme changes that limit future entitlements and provide for the longer-term sustainability of our staff pension arrangements.
– Software write-offs of £206m were charged in depreciation, amortisation and impairment, and investment costs of £98m were charged in administrative expenses. Following implementation of our new digital platform and completion of our product simplification programme, we made write-offs for decommissioning redundant systems, and charged investment costs for technology and digital capability build out.
– Provisions for other liabilities and charges were impacted by £120m. These comprised a £50m provision for the costs of our ongoing branch de-duplication programme. There was also £70m, including related costs, as provisions for conduct remediation. Of this, £65m related to payment protection insurance (‘PPI’), following a review of recent claims activity which indicates that claims are now expected to continue for longer than originally anticipated. There was a net £5m charge related to other retail products.
Net interest income for the six months ended 30 June 2014 was 20% higher at £1,673m (H1’13: £1,391m). This was largely due to the lower cost of retail liabilities following the maturity of several tranches of higher cost eSaver products in 2013, and the reduced cost of new ISA deposits originated in the first half of 2014, as well as increased lending in Commercial Banking. Reduced mortgage stock margins partly offset these effects.
Non-interest income was 9% lower at £519m (H1’13: £570m), reflecting a significantly reduced credit arising from the debit valuation adjustments on derivatives written by Santander UK, and lower banking fees in Retail Banking.
Costs remained tightly controlled to accommodate continued investment in the transformation of the business. Administrative costs were 12% lower at £876m (H1’13: £992m), mainly due to the pensions gain described above.
In the first six months of 2014 we delivered profit before tax from continuing operations of £545m, an increase of 18% and profit after tax of £438m.
We continue to deliver improved returns, strong capital and leverage with a better quality, lower cost funding mix, which will provide a solid backdrop for our future growth.
Chief Financial Officer’s review
Stephen Jones Chief Financial Officer
Income statement highlights
Six months ended 30 June 30 June 2014£m
30 June 2013(1) £m
Profit before tax from continuing operations(3) 545 461Profit after tax from continuing operations(3) 438 371Banking net interest margin (‘NIM’)(2) 1.80% 1.46%
(1) Adjusted to reflect the adoption of IFRIC 21. See Note 1 to the Condensed Consolidated Interim Financial Statements. (2) Banking NIM is calculated as annualised net interest income divided by average customer assets.(3) In accordance with IFRS, regulatory costs relating to the FSCS of £100m were recognised in the first half of 2014 (restated first half of 2013: £88m).
Costs relating to the UK Bank Levy are recognised in the second half of the year (second half of 2013: £59m).
(A)
Return on tangible equity (’RoTE’)(%)
2012 2013 Jun 2014
9.1 8.610.0
Strategic report update
Santander UK plc 2014 Half Yearly Financial Report 9
Depreciation, amortisation and impairment increased significantly to £347m (H1’13: £121m), due to the software write-offs described above.
Impairment losses on loans and advances were 27% lower at £172m (H1’13: £235m). Credit quality in the Retail and Commercial Banking loan books continued to be good, supported by the improving economic environment.
Provisions for other liabilities and charges were 66% higher at £252m (H1’13: £152m), principally due to the charges for branches and conduct described above, partially offset by a reduced provision for restructuring. For more information on conduct remediation, including PPI, see Note 25 to the Condensed Consolidated Interim Financial Statements on page 103.
The taxation charge was up 19% largely due to higher profits. Our effective tax rate was stable at 20% (H1’13: 20%).
Customer balances(B)
Customer loans increased £1.3bn in the first half of 2014 to £188.4bn as we remained focused on supporting households and businesses while maintaining our prudent risk management objectives.
In Retail Banking, mortgage balances increased to £148.7bn following a resumption of positive net lending in the first half of the year. Standard Variable Rate (‘SVR’) mortgage loan balances fell £4.2bn to £48.1bn, although we have been successful in the targeted retention of SVR customers on new offers. Commercial Banking loans increased with growth in both SMEs and mid corporate lending, and we made further progress in reducing balances in the non-core corporate and legacy portfolios with balances down £0.7bn in the past six months.
Customer deposits increased £4.3bn in the first half of 2014 to £150.7bn, as we focused on originating and retaining balances held by more loyal Retail Banking customers. Included in this, current account balances increased £7.2bn in the first half of 2014, partially offset by lower savings deposit balances as we focused on reducing more price sensitive short-term retail deposits. The loan-to-deposit ratio of 124% was two percentage points lower (31 December 2013: 126%), reflecting the growth in customer deposits.
Credit quality(C)
The overall credit quality of our loan portfolios remained good, with the total NPL ratio improving to 1.96% at 30 June 2014 (31 December 2013: 2.04%).
The Retail Banking NPL ratio fell to 1.77% (31 December 2013: 1.89%), with an improvement across both the secured and unsecured lending portfolios.
Credit quality in Commercial Banking remains strong as we continue to follow our prudent lending criteria, a policy we will adhere to as we deliver on our business plan and develop our Commercial Banking business.
The Commercial Banking NPL ratio increased to 3.15% (31 December 2013: 3.02%), largely due to a single long-standing loan of £89m which moved to non-performance. A successful restructuring of this loan is anticipated and a conservative provision is held against it.
Credit quality
30 June 2014
%
31 December 2013
%
Retail Banking NPL ratio 1.77 1.89– of which mortgage NPL ratio(1) 1.79 1.88Commercial Banking NPL ratio(1) 3.15 3.02Corporate Centre NPL ratio(1) 2.10 2.36Total NPL ratio(1) 1.96 2.04
(1) NPL balance as a percentage of the asset balance at 30 June 2014 and 31 December 2013.
(C)
Customer balances
30 June 2014£bn
31 December 2013£bn
Total customer loans 188.4 187.1Total customer deposits 150.7 146.4Loan-to-deposit ratio(1) 124% 126%
(1) Calculated as loans and advances to customers (excluding reverse repos) divided by deposits by customers (excluding repos).
(B)
Mortgage Non-performing loan ratio(%)
2013 Jun 2014
1.791.88
2012
1.74
Profit before tax(£m)
2012 2013
545
1,152
695
1,109
461
Jun 2014

Strategic report update
10 Santander UK plc 2014 Half Yearly Financial Report
Liquidity and fundingOur funding strategy is to develop and maintain a diversified funding base, which allows us access to a variety of funding sources. In the first half of 2014, we raised medium-term funding of £6.7bn (sterling equivalent), largely through unsecured issuances. In the second quarter of 2014, we also drew down a further £500m of Treasury Bills under the Bank of England and HM Treasury ‘Funding for Lending’ scheme.
Total liquid assets fell slightly in the period to £72.2bn (31 December 2013: £73.0bn) and PRA-eligible liquid assets increased by £2.7bn to £32.2bn (31 December 2013: £29.5bn). Both total and PRA-eligible liquid assets significantly exceeded short-term wholesale funding requirements. At 30 June 2014, PRA-eligible liquid assets amounted to 127% (31 December 2013: 139%) of wholesale funding with a residual maturity of less than one year. The Liquidity Coverage Ratio (‘LCR’) was 107% (31 December 2013: 103%).
Our level of encumbrance decreased in the first half of 2014 as planned, reflecting both the overall reduction in wholesale funding and the desire to better balance new wholesale funding issuance between secured and unsecured markets where possible.
Capital and leverage(D)
Our CET 1 capital ratio increased to 11.8% at 30 June 2014 (31 December 2013: 11.6%). On 24 June 2014, Santander UK plc issued a £500m Additional Tier 1 (‘AT1’) security to its immediate parent Santander UK Group Holdings Ltd which, in turn, issued a similar security to Banco Santander, S.A.
We expect that the strength of our CET 1 capital ratio, our ability to generate capital organically and the rebalancing of our business mix will enable us to meet our targeted capital ratios even once the capital requirements of CRD IV and the PRA are phased in.
Our end-point Tier 1 leverage ratio as defined by the PRA was 3.6%. Retained profits, and further AT1 issuance if required, are expected to result in a continued improvement in our leverage ratio.
Risk weighted assets (‘RWAs’) increased to £79.9bn (31 December 2013: £77.7bn), reflecting the growth of customer lending.
OutlookWe expect the developments in the business and investment made to date to help maintain a strong business performance. A further reduction in the overall cost of deposits is expected to compensate for any further asset margin declines. Our tight control of costs will continue, while we invest further in the transformation of our business.
Over the coming months, we anticipate greater clarity in respect of capital levels, leverage and the detailed rules necessary to meet the requirements of the Financial Services (Banking Reform) Act 2013 that will enable us to better plan the required structure of the business. However, considerable uncertainty will still remain and we cannot therefore be certain of the impact on our business model that the banking reform agenda will require.
The increased positive momentum of the UK economy should also support our business in 2014 and we believe that our performance over time should continue to demonstrate the consistency and strength of Santander UK.
Stephen JonesChief Financial Officer13 August 2014
Chief Financial Officer’s review continued
Capital and leverage– CRD IV
30 June 2014£bn
31 December 2013£bn
CET 1 capital 9.4 9.0CET 1 capital ratio 11.8% 11.6%Risk Weighted Assets (‘RWAs’) 79.9 77.7(1)
End-point Tier 1 PRA leverage ratio(2) 3.6% 3.3%
(1) Adjusted for consistency to reflect the CRD IV rules as if they had applied on 31 December 2013 as described in ‘Risk-weighted assets’ in the Balance Sheet Review on page 32.
(2) The leverage ratio defined by the PRA uses an exposure measure consistent with the Basel Committee’s January 2014 Leverage Ratio Framework.
(D)

Strategic report update
Santander UK plc 2014 Half Yearly Financial Report 11
As a significant financial services provider, managing risk is at the core of Santander UK’s day-to-day activities. The understanding and control of risk is critical for the effective management of the business.
This Summary Risk Report describes our approach to risk management and how we manage and control risk through our Risk Framework, which supports the implementation of Santander UK’s strategic business objectives and business plan via the risk culture statement and our overriding principles. It also highlights our top and emerging risks.
Risk managementIn managing risk, Santander UK aims to: – Maintain a predictable medium-low risk profile in our business;
– Employ effective and advanced risk management techniques; and
– Deliver robust financial performance, and ultimately build sustainable value for all our stakeholders.
Risk frameworkSantander UK manages and controls risk through its Risk Framework, which: – Defines risk, enterprise-wide risk and key risk types;
– Sets out the required risk culture, the overriding principles and minimum standards;
– Summarises key roles and responsibilities and how Santander UK is organised for risk;
– Defines the terms of reference for risk committees and how and where decisions are made, reviewed and challenged; and
– Lists and explains the key internal risk regulation documents.
The Risk Framework supports the implementation of Santander UK’s strategic business objectives and business plan via the risk culture statement, guiding overriding principles and minimum standards to manage and control risks, and thus reduces the uncertainty around Santander UK meeting its objectives.
Separate risk frameworks are in place for each key risk type and core risk activities such as those relating to risk appetite, stress testing and policy. These specific risk frameworks establish the principles, standards, rules and governance requirements for the management and control of each risk type. In support of these frameworks, each specific risk type has its own suite of policies and limits. These set out the rules and risk limits for the management of risk at a more granular level.
Allocation of riskAs Santander UK’s business is focused on retail and commercial lending, its largest source of risk is credit risk. This is illustrated in the chart opposite, which sets out the allocation of risk across Santander UK based on the economic capital requirement at 30 June 2014 and 31 December 2013 by key risk type. This allocation is limited to risks for which capital is considered a mitigant, and does not make allowance for the effects of diversification across risks or assets.
During the first half of 2014, the allocation of risk remained broadly stable, with only minor movements evident in line with the evolution of our balance sheet.
Summary risk report
Allocation of risk(%)
2012 2013 Jun 2014
16111
72
15
151
69
15
151
69
Operational riskand others
Traded market risk
Credit risk
Balance sheet management risk

Strategic report update
12 Santander UK plc 2014 Half Yearly Financial Report
All of our activities involve, to varying degrees, identification, assessment, management and reporting of risk or combinations of risks. During the first half of 2014, senior management focused on certain top and emerging risks and their causes. These are described in the following section, including how they link to our strategic business priorities which are described in more detail on page 4, as well as the change in importance for each of them in the first half of 2014.
Summary risk report continued
Top risks
Risk description Strategic priorities Risk features and impact Developments in the first half of 2014 2014 changes
CapitalCapital risk is the risk that Santander UK does not have an adequate amount, or quality, of capital to meet its internal business objectives, market expectations and regulatory requirements. 3
Capital risk has the potential to disrupt our business model and stop the normal functions of Santander UK. It could also cause Santander UK to fail to meet the capital requirements of regulators, who would then have powers to constrain disbursements, such as the payment of dividends, or to resolve Santander UK. Capital risk in Santander UK is driven primarily by credit risk and the effects of regulatory change as well as management’s ability to raise capital to meet demand over the economic cycle.
See ‘Capital risk’ on page 76. Management’s approach to capital risk is described in more detail on page 144 of the 2013 Annual Report.
During the first half of 2014, regulatory developments continued to have the potential to impact Santander UK’s capital plans materially and were mitigated through close monitoring, scenario analysis and capital issuance. During the second quarter of 2014, Santander UK participated in the Bank of England’s concurrent stress testing exercise, the results of which were presented to the PRA. Our CET 1 capital ratio increased to 11.8% at 30 June 2014 (2013: 11.6%). On 24 June 2014, Santander UK plc issued a £500m Additional Tier 1 (‘AT1’) security to its immediate parent Santander UK Group Holdings Ltd who, in turn, issued a similar security to Banco Santander, S.A.. We expect that the strength of our CET 1 capital ratio, our ability to generate capital organically and the rebalancing of our business mix will enable us to meet our targeted capital ratios even once the capital requirements of CRD IV and the PRA are phased in.
Our end-point Tier 1 leverage ratio as defined by the PRA was 3.6%. Retained profits, and further AT1 issuance if required, are expected to result in a continued improvement in our leverage ratio. RWAs increased to £79.9bn (2013: £77.7bn), reflecting the growth of higher risk-weighted corporate lending.
ConductConduct risk is the risk that the business and operational decisions we take and the behaviours displayed lead to poor outcomes for our customers.
1
2
3
Conduct risk is a key risk to Santander UK in view of the evolving regulatory environment and to enable us to meet our aim to be the best bank for our customers. Specific conduct risks to which we are exposed include: products and services not meeting customer needs; failing to deal with complaints effectively; and the risk that customers are sold unsuitable products or not provided adequate information to make informed decisions.
See ‘Conduct risk’ on page 77. Management’s approach to conduct risk is described in more detail on page 146 of the 2013 Annual Report.
Building on the enhanced Conduct Risk Framework developed in 2013, a programme of work is planned to continue throughout 2014 to further embed effective management of conduct risk throughout the business, including a comprehensive cultural change project.
In the second quarter of 2014, a £70m provision for conduct remediation, including related costs, was made. This included £65m relating to PPI and a net £5m for claims in respect of other retail products. During the first half of 2014, the volume of PPI complaints decreased at a slower rate than in previous periods. A review of recent claims activity indicated that claims are now expected to continue for longer than originally anticipated. As a result, the provision was increased. During the first half of 2014, the high proportion of invalid complaints continued. Monthly redress costs, including related costs, decreased to an average of £10m per month in the first half of 2014, compared with a monthly average of £18m per month in 2013 and £25m per month in 2012.
CreditCredit risk is the risk of financial loss arising from the default or credit quality deterioration of a customer or counterparty to which we have directly provided credit, or for which we have assumed a financial obligation.
1
2
3
Deterioration in the credit quality of our customers and counterparties could reduce the value of our assets, and increase our write-downs and allowances for impairment losses. A deterioration in credit risk can be caused by a range of macroeconomic environment and other factors, including increased unemployment, falling house prices, increased corporate insolvency levels, reduced corporate profits, increased personal insolvency levels, increased interest rates and/or higher tenant defaults.
See ‘Credit risk – Retail Banking’, ‘Credit risk – Commercial Banking’, ‘Credit risk – Corporate Centre’ and ‘Credit risk – Markets’ on pages 43, 54, 62 and 61. Management’s approach to credit risk is described in more detail on page 73 of the 2013 Annual Report.
During the first half of 2014, the overall Santander UK NPL ratio improved to 1.96% (2013: 2.04%), with the performance across the business units as follows:
The Retail Banking NPL ratio decreased to 1.77% at 30 June 2014 (2013: 1.89%), with an improvement across both the secured and unsecured lending portfolios. There was a particular improvement in unsecured personal lending and 1I2I3 Credit Cards which benefited from the better risk profile of 1I2I3 World customers.
The Commercial Banking NPL ratio increased to 3.15% at 30 June 2014 (2013: 3.02%) largely due to a single long-standing loan of £89m which moved to non-performance. A successful restructure of this loan is still anticipated and a conservative provision is held against it.
The Corporate Centre NPL ratio decreased to 2.10% at 30 June 2014 (2013: 2.36%), reflecting the on-going sale and run-off of the non-core corporate and legacy assets which continue with no significant impact on the income statement. Social Housing comprised 80% of customer loans in Corporate Centre at 30 June 2014, and this portfolio is fully performing.
LiquidityLiquidity risk is the risk that Santander UK, although solvent, either does not have sufficient financial resources available to meet its obligations as they fall due, or can secure them only at excessive cost.
3
All major banks, including Santander UK, can be impacted by changes in confidence in the banking sector, the wholesale funding markets or the banking institution. Should Santander UK be unable to continue to source sustainable funding due to exceptional circumstances, our ability to fund our financial obligations could be adversely affected, potentially disrupting the day-to-day operations, business model or leading to the insolvency of Santander UK plc.
See ‘Liquidity risk’ on page 70. Management’s approach to Liquidity risk is described in more detail on page 133 of the 2013 Annual Report.
Eligible liquid assets increased £2.7bn to £32.2bn at 30 June 2014 (2013: £29.5bn). Throughout the first half of 2014, Santander UK continued to maintain a strong liquidity position and a conservative balance sheet structure (i.e. maintaining high levels of high quality liquid assets) as well as robust risk management controls to monitor and manage the levels of the liquid asset portfolio and encumbrance. Eligible liquid assets continued to significantly exceed wholesale funding of less than one year, with a coverage ratio of 127% at 30 June 2014 (2013: 139%).
At 30 June 2014, the Basel Liquidity Coverage Ratio (‘LCR’) was 107% (2013: 103%). Further clarity on the implementation of the LCR and Net Stable Funding Ratio (‘NSFR’) has continued to help to reduce the degree of uncertainty in this area.
PensionPension risk is the risk to Santander UK caused by its contractual or other liabilities to or with respect to its defined benefit pension schemes. 3
Pension schemes can be impacted by the uncertainty of future investment returns and the projected cost of liabilities. The key risk factors include long-term interest rates, inflation expectations, accounting discount rates, salary growth, life expectancy of the scheme members, investment performance as well as changes in the regulatory environment. Individually, or in combination, these factors may cause additional contributions to be required, or can directly impact the capital position of Santander UK.
See ‘Pension risk’ on page 76. Management’s approach to pension risk is described in more detail on page 132 of the 2013 Annual Report.
During the first half of 2014, the latest triennial Trustee pension scheme funding valuation at 31 March 2013 was agreed. Following this, an updated schedule of deficit funding contributions was agreed with the Scheme Trustee. During the first half of 2014, the risk profile of the Santander UK group’s defined benefit pension scheme remained stable with the focus on positive performance of the assets relative to liabilities, whilst managing volatility through hedging a proportion of the liabilities with bond assets and derivatives.
The accounting deficit of the Scheme improved by £381m, partially driven by positive asset returns as well as a net gain of £218m that arose from scheme changes that limit future defined benefit pension entitlements and provide for the longer-term sustainability of our staff pension arrangements.
OperationalOperational risk is the direct, or indirect, risk of loss to Santander UK resulting from inadequate or failed internal processes, people and systems, or from external events.
1
2
3
Operational risk is inherent within all the processes Santander UK operates and occurs where unexpected or unplanned events associated with people, processes, systems or external events may prevent us from achieving any of our planned or desired business outcomes.
See ‘Operational risk’ on page 76. Management’s approach to operational risk is described in more detail on page 148 of the 2013 Annual Report.
During the first half of 2014, Santander UK continued to develop and embed its operational risk management framework in line with regulatory expectations. During the first six months of 2014, the majority of Santander UK’s £83m (year ended 31 December 2013: £221m) of Operational Risk losses arose within the clients, products and business practices category. These principally represented redress payouts (excluding related costs) on the sales of PPI products, largely provided for in previous years.
Industry-wide concerns about external cyber crime remain high. On-going monitoring and oversight continued to be strengthened.

Strategic report update
Santander UK plc 2014 Half Yearly Financial Report 13
Top risksA top risk is defined as being a current risk within our business that could potentially have a material impact on our financial results, reputation and the sustainability of our business model.
Strategic priority key:
1 Loyal and satisfied retail customers
2 ‘Bank of Choice’ for UK companies
3 Consistent profitability and a strong balance sheet
Risk description Strategic priorities Risk features and impact Developments in the first half of 2014 2014 changes
CapitalCapital risk is the risk that Santander UK does not have an adequate amount, or quality, of capital to meet its internal business objectives, market expectations and regulatory requirements. 3
Capital risk has the potential to disrupt our business model and stop the normal functions of Santander UK. It could also cause Santander UK to fail to meet the capital requirements of regulators, who would then have powers to constrain disbursements, such as the payment of dividends, or to resolve Santander UK. Capital risk in Santander UK is driven primarily by credit risk and the effects of regulatory change as well as management’s ability to raise capital to meet demand over the economic cycle.
See ‘Capital risk’ on page 76. Management’s approach to capital risk is described in more detail on page 144 of the 2013 Annual Report.
During the first half of 2014, regulatory developments continued to have the potential to impact Santander UK’s capital plans materially and were mitigated through close monitoring, scenario analysis and capital issuance. During the second quarter of 2014, Santander UK participated in the Bank of England’s concurrent stress testing exercise, the results of which were presented to the PRA. Our CET 1 capital ratio increased to 11.8% at 30 June 2014 (2013: 11.6%). On 24 June 2014, Santander UK plc issued a £500m Additional Tier 1 (‘AT1’) security to its immediate parent Santander UK Group Holdings Ltd who, in turn, issued a similar security to Banco Santander, S.A.. We expect that the strength of our CET 1 capital ratio, our ability to generate capital organically and the rebalancing of our business mix will enable us to meet our targeted capital ratios even once the capital requirements of CRD IV and the PRA are phased in.
Our end-point Tier 1 leverage ratio as defined by the PRA was 3.6%. Retained profits, and further AT1 issuance if required, are expected to result in a continued improvement in our leverage ratio. RWAs increased to £79.9bn (2013: £77.7bn), reflecting the growth of higher risk-weighted corporate lending.
ConductConduct risk is the risk that the business and operational decisions we take and the behaviours displayed lead to poor outcomes for our customers.
1
2
3
Conduct risk is a key risk to Santander UK in view of the evolving regulatory environment and to enable us to meet our aim to be the best bank for our customers. Specific conduct risks to which we are exposed include: products and services not meeting customer needs; failing to deal with complaints effectively; and the risk that customers are sold unsuitable products or not provided adequate information to make informed decisions.
See ‘Conduct risk’ on page 77. Management’s approach to conduct risk is described in more detail on page 146 of the 2013 Annual Report.
Building on the enhanced Conduct Risk Framework developed in 2013, a programme of work is planned to continue throughout 2014 to further embed effective management of conduct risk throughout the business, including a comprehensive cultural change project.
In the second quarter of 2014, a £70m provision for conduct remediation, including related costs, was made. This included £65m relating to PPI and a net £5m for claims in respect of other retail products. During the first half of 2014, the volume of PPI complaints decreased at a slower rate than in previous periods. A review of recent claims activity indicated that claims are now expected to continue for longer than originally anticipated. As a result, the provision was increased. During the first half of 2014, the high proportion of invalid complaints continued. Monthly redress costs, including related costs, decreased to an average of £10m per month in the first half of 2014, compared with a monthly average of £18m per month in 2013 and £25m per month in 2012.
CreditCredit risk is the risk of financial loss arising from the default or credit quality deterioration of a customer or counterparty to which we have directly provided credit, or for which we have assumed a financial obligation.
1
2
3
Deterioration in the credit quality of our customers and counterparties could reduce the value of our assets, and increase our write-downs and allowances for impairment losses. A deterioration in credit risk can be caused by a range of macroeconomic environment and other factors, including increased unemployment, falling house prices, increased corporate insolvency levels, reduced corporate profits, increased personal insolvency levels, increased interest rates and/or higher tenant defaults.
See ‘Credit risk – Retail Banking’, ‘Credit risk – Commercial Banking’, ‘Credit risk – Corporate Centre’ and ‘Credit risk – Markets’ on pages 43, 54, 62 and 61. Management’s approach to credit risk is described in more detail on page 73 of the 2013 Annual Report.
During the first half of 2014, the overall Santander UK NPL ratio improved to 1.96% (2013: 2.04%), with the performance across the business units as follows:
The Retail Banking NPL ratio decreased to 1.77% at 30 June 2014 (2013: 1.89%), with an improvement across both the secured and unsecured lending portfolios. There was a particular improvement in unsecured personal lending and 1I2I3 Credit Cards which benefited from the better risk profile of 1I2I3 World customers.
The Commercial Banking NPL ratio increased to 3.15% at 30 June 2014 (2013: 3.02%) largely due to a single long-standing loan of £89m which moved to non-performance. A successful restructure of this loan is still anticipated and a conservative provision is held against it.
The Corporate Centre NPL ratio decreased to 2.10% at 30 June 2014 (2013: 2.36%), reflecting the on-going sale and run-off of the non-core corporate and legacy assets which continue with no significant impact on the income statement. Social Housing comprised 80% of customer loans in Corporate Centre at 30 June 2014, and this portfolio is fully performing.
LiquidityLiquidity risk is the risk that Santander UK, although solvent, either does not have sufficient financial resources available to meet its obligations as they fall due, or can secure them only at excessive cost.
3
All major banks, including Santander UK, can be impacted by changes in confidence in the banking sector, the wholesale funding markets or the banking institution. Should Santander UK be unable to continue to source sustainable funding due to exceptional circumstances, our ability to fund our financial obligations could be adversely affected, potentially disrupting the day-to-day operations, business model or leading to the insolvency of Santander UK plc.
See ‘Liquidity risk’ on page 70. Management’s approach to Liquidity risk is described in more detail on page 133 of the 2013 Annual Report.
Eligible liquid assets increased £2.7bn to £32.2bn at 30 June 2014 (2013: £29.5bn). Throughout the first half of 2014, Santander UK continued to maintain a strong liquidity position and a conservative balance sheet structure (i.e. maintaining high levels of high quality liquid assets) as well as robust risk management controls to monitor and manage the levels of the liquid asset portfolio and encumbrance. Eligible liquid assets continued to significantly exceed wholesale funding of less than one year, with a coverage ratio of 127% at 30 June 2014 (2013: 139%).
At 30 June 2014, the Basel Liquidity Coverage Ratio (‘LCR’) was 107% (2013: 103%). Further clarity on the implementation of the LCR and Net Stable Funding Ratio (‘NSFR’) has continued to help to reduce the degree of uncertainty in this area.
PensionPension risk is the risk to Santander UK caused by its contractual or other liabilities to or with respect to its defined benefit pension schemes. 3
Pension schemes can be impacted by the uncertainty of future investment returns and the projected cost of liabilities. The key risk factors include long-term interest rates, inflation expectations, accounting discount rates, salary growth, life expectancy of the scheme members, investment performance as well as changes in the regulatory environment. Individually, or in combination, these factors may cause additional contributions to be required, or can directly impact the capital position of Santander UK.
See ‘Pension risk’ on page 76. Management’s approach to pension risk is described in more detail on page 132 of the 2013 Annual Report.
During the first half of 2014, the latest triennial Trustee pension scheme funding valuation at 31 March 2013 was agreed. Following this, an updated schedule of deficit funding contributions was agreed with the Scheme Trustee. During the first half of 2014, the risk profile of the Santander UK group’s defined benefit pension scheme remained stable with the focus on positive performance of the assets relative to liabilities, whilst managing volatility through hedging a proportion of the liabilities with bond assets and derivatives.
The accounting deficit of the Scheme improved by £381m, partially driven by positive asset returns as well as a net gain of £218m that arose from scheme changes that limit future defined benefit pension entitlements and provide for the longer-term sustainability of our staff pension arrangements.
OperationalOperational risk is the direct, or indirect, risk of loss to Santander UK resulting from inadequate or failed internal processes, people and systems, or from external events.
1
2
3
Operational risk is inherent within all the processes Santander UK operates and occurs where unexpected or unplanned events associated with people, processes, systems or external events may prevent us from achieving any of our planned or desired business outcomes.
See ‘Operational risk’ on page 76. Management’s approach to operational risk is described in more detail on page 148 of the 2013 Annual Report.
During the first half of 2014, Santander UK continued to develop and embed its operational risk management framework in line with regulatory expectations. During the first six months of 2014, the majority of Santander UK’s £83m (year ended 31 December 2013: £221m) of Operational Risk losses arose within the clients, products and business practices category. These principally represented redress payouts (excluding related costs) on the sales of PPI products, largely provided for in previous years.
Industry-wide concerns about external cyber crime remain high. On-going monitoring and oversight continued to be strengthened.

Strategic report update
14 Santander UK plc 2014 Half Yearly Financial Report
Emerging and future risksAn emerging and future risk is defined as being a risk with largely uncertain outcomes which may develop or crystallise in the future. Crystallisation of an emerging risk could have a material effect on long-term strategy.
Summary risk report continued
Emerging and future risks
TimeframeStrategic priorities Risk description and mitigation
Less than 1 year
1
2
3
UK economic and political environmentThe financial performance of Santander UK is intrinsically linked to the UK economy. Whilst evidence of recovery is becoming increasingly apparent, the possibility of economic downturn, along with its concomitant impact on profitability, remains a risk. In the event that the UK economy continues to improve, there is an increasing likelihood of a higher interest rate environment. In such a scenario, the reaction of our customers and other market participants might result in different patterns of behaviour. These could include increased customer attrition and more competitive product pricing.
In addition, any significant changes in UK Government policies or political structure could have an impact on our business. In particular, the first half of 2014 saw continued debate on Scotland’s constitutional future in the run up to the referendum in September. We continue to monitor the potential consequences such changes may have with action to be taken as appropriate. The impacts of this risk may also be seen over more than a one-year period.
1-3 years
3
Emerging regulationThe aftermath of the financial crisis has seen the emergence of a significant volume of additional regulation. In some cases, the impacts this regulation has on Santander UK have become clearer and more precisely quantified. On the other hand, there remains a significant body of new regulation where the impact and timing remain uncertain. Over the coming months, we also anticipate greater clarity in respect of capital levels, leverage and the detailed rules necessary to meet the requirements of the Financial Services (Banking Reform) Act 2013. However, considerable uncertainty will still remain and we cannot therefore be certain of the impact on our business model that the banking reform agenda will have.
1
2
3
IT and business changeSantander UK continues to invest in the roll-out of new IT platforms and systems to support its strategic growth plans. As with any significant programme of this nature, there is a need to ensure that the risks associated with the pace of change are properly monitored and controlled.
More than 3 years
1
2
3
New competitors and technologyInnovations in technology applied to the delivery of financial services continued to develop at a rapid pace. We have also seen the advent of new financial services providers. These factors bring with them the potential for increased levels of competition in the medium term.
Credit risk highlights
The Santander UK group’s main credit portfolios are its UK residential mortgage portfolio and its Corporate Banking portfolio, as follows:
Mortgage non-performing loans
2012 2013
2,657
1.791.74
2,719
1.88
2,788
Jun 2014
Non-performing loan ratio (%)
Non-performing loans (£m)
Mortgage NPLsDuring the first half of 2014, the mortgage asset NPL stock decreased to £2,657m (2013: £2,788m). This reduction resulted largely from improvements in the economic environment and prolonged low interest rates, coupled with improved collections efficiencies introduced both in 2013 and the first half of 2014. The NPL ratio decreased to 1.79% (2013: 1.88%) due to a reduction in NPL stock and a more stable mortgage asset stock.
The improving economy also helped to contribute to a reduction in the level of early arrears (31-90 days), as well as in the proportion of impaired loans. However, the economic recovery remains at an early stage, and a conservative stance was therefore maintained in the provisioning policy. This included allowances made for losses which could stem from factors including regional variation in the risk profile, changes to regulation and contractual maturity defaults.
Commercial Banking non-performing loans
2012 2013
728
3.154.26
835
3.02
666
Jun 2014
Non-performing loan ratio (%)
Non-performing loans (£m)
Commercial Banking NPLsDuring the first half of 2014, the Commercial Banking NPL ratio increased to 3.15% (2013: 3.02%), largely due to a single long-standing loan of £89m which moved to non-performance. A successful restructuring of this loan is anticipated and a conservative provision is held against it. The underlying NPL ratio excluding this case reduced to 2.76%.
Credit quality remains strong as we continued to adhere to our prudent lending criteria and as we further deliver on our business plan to grow Commercial Banking lending.

Detailed Business Review
Group and Divisional Results
Santander UK plc 2014 Half Yearly Financial Report 15
GROUP SUMMARY SUMMARISED CONSOLIDATED INCOME STATEMENT
Six months ended 30 June 2014
£m
Six months ended 30 June 2013(1)
£m
Net interest income 1,673 1,391 Non-interest income 519 570 Total operating income 2,192 1,961 Administrative expenses (876) (992) Depreciation, amortisation and impairment (347) (121) Total operating expenses excluding impairment losses, provisions and charges (1,223) (1,113) Impairment losses on loans and advances (172) (235) Provisions for other liabilities and charges (252) (152) Total operating impairment losses, provisions and charges (424) (387) Profit on continuing operations before tax 545 461 Tax on profit on continuing operations (107) (90)Profit on continuing operations after tax 438 371Loss from discontinued operations after tax - (12)Profit after tax for the period 438 359
(1) Adjusted to reflect the adoption of IFRIC 21, as described in Note 1 to the Condensed Consolidated Interim Financial Statements.
Six months ended 30 June 2014 compared to six months ended 30 June 2013 Profit on continuing operations before tax increased by £84m to £545m in the first half of 2014 (2013: £461m). By income statement line, the movements were:
> Net interest income increased by £282m to £1,673m in the first half of 2014 (2013: £1,391m). This was largely due to the lower cost
of retail liabilities following the maturity of several tranches of higher cost eSaver products in the second half of 2013, the reduced cost of new ISA liabilities originated in the first half of 2014, as well as increased lending in Commercial Banking.
These increases were partly offset by reduced mortgage stock margins reflecting the lower customer rates available on incentive products as the current environment for mortgage lending led to increased activity. This activity, combined with UK Government schemes (such as Help to Buy), led to an increase in customers moving from SVR mortgages. We have been successful in the targeted retention of customers into new Santander UK mortgages.
In addition, the returns on our structural hedge strategy were lower than in the first half of 2013 following the maturity of historic contracts that benefited from higher returns.
> Non-interest income decreased by £51m to £519m in the first half of 2014 (2013: £570m), largely reflecting a significantly reduced
credit arising from the debit valuation adjustments on derivatives written by Santander UK. The decrease was also driven by lower banking fees, including higher cashback on 1|2|3 World products and lower overdraft fees, partially offset by an increase in credit cards business and new product promotions, and continued growth in 1|2|3 World product balances.
These decreases were partially offset by a recovery of non-interest income to more normalised levels in our Equity Derivatives and Securities Financing businesses.
> Administrative expenses decreased by £116m to £876m in the first half of 2014 (2013: £992m) principally due to a net gain of £218m
which arose as a result of scheme changes that limit future defined benefit pension entitlements and provide for the longer term sustainability of our staff pension arrangements. Costs remained tightly controlled, and the decrease was also driven by on-going efficiencies including the consolidation of multi-branch locations.
These decreases were partially offset by major investment programmes, including a continued investment in the growth of the businesses serving SME and corporate customers, as well as branch network and digital systems. These support the business transformation and will continue to improve the customer experience across all our distribution channels.
> Depreciation, amortisation and impairment costs increased by £226m to £347m in the first half of 2014 (2013: £121m). This was
principally due to software write-offs of £206m for the decommissioning of redundant systems following the implementation of our new digital platform and the completion of our product simplification programme. The write-offs will reduce our future depreciation charge. The increase also reflected continued investment in business growth, including branch network systems and digital channels as well as the commencement of depreciation on a new data centre.
> Impairment losses on loans and advances decreased by £63m to £172m in the first half of 2014 (2013: £235m). This was largely due to the reduction in impairment losses on mortgages as a result of improving economic conditions, rising house prices, prolonged low interest rates and collections efficiencies introduced both in 2013 and the first half of 2014.
> Provisions for other liabilities and charges increased by £100m to £252m in the first half of 2014 (2013: £152m), principally due to a charge of £50m relating to the costs for our on-going branch de-duplication programme. There was also an additional provision of £70m, including related costs, for conduct remediation, of which £65m related to PPI, following a review of recent claims activity which indicates that claims are now expected to continue for longer than originally anticipated; the remaining net £5m charge was for other retail products. In addition, the first half of 2014 benefitted from a reduced provision for restructuring, while 2013 benefitted from a reassessment of the provision for non-PPI retail customer remediation payments.
Provision for other liabilities and charges included regulatory costs relating to the FSCS of £100m (2013: £88m).
> The taxation charge was higher by 19% largely due to higher profits. The effective tax rate for 2014, based on profit on continuing operations before tax was 19.6% (2013: 19.5%).
Loss from discontinued operations after tax of £nil in the first half of 2014 (2013: £12m) reflected the sale of the co-brand credit cards business in 2013.

Detailed Business Review
Group and Divisional Results continued
16 Santander UK plc 2014 Half Yearly Financial Report
Critical factors affecting results The preparation of our Condensed Consolidated Interim Financial Statements requires management to make estimates and judgements that affect the reported amount of assets and liabilities at the balance sheet date and the reported amount of income and expenses during the reporting period. Management evaluates its estimates and judgements on an ongoing basis and bases its estimates and judgements on historical experience and other factors believed to be reasonable under the circumstances. Actual results may differ from these estimates under different assumptions or conditions. Estimates and judgements that are considered important to the portrayal of our financial condition including, where applicable, quantification of the effects of reasonably possible ranges of such estimates are set out in ‘Critical Accounting Policies and Areas of Significant Management Judgement’ in Note 1 on page 229 of the 2013 Annual Report The rest of this section contains a summary of the results, and commentary thereon, by income statement line item for each segment. Basis of results presentation The segmental information in this Half Yearly Financial Report reflects the reporting structure in place at the reporting date in accordance with which the segmental information in Note 2 to the Condensed Consolidated Interim Financial Statements has been presented. The Company’s board of directors (the ‘Board’) is the chief operating decision maker for Santander UK. The segmental information below is presented on the basis used by the Board to evaluate performance and allocate resources. The Board reviews discrete financial information for each segment of the business which follows Santander UK’s normal accounting policies and principles, including measures of operating results, assets and liabilities.
PROFIT BEFORE TAX BY SEGMENT 30 June 2014 Retail
Banking £m
Commercial Banking
£m Markets
£m
Corporate Centre
£m Total
£m Net interest income/(expense) 1,685 264 1 (277) 1,673Non-interest income 306 131 57 25 519Total operating income 1,991 395 58 (252) 2,192Administration expenses (719) (181) (56) 80 (876)Depreciation, amortisation and impairment (112) (13) (1) (221) (347)Total operating expenses excluding impairment losses,
provisions and charges (831) (194) (57) (141) (1,223)
Impairment losses on loans and advances (107) (56) - (9) (172)Provisions for other liabilities and charges - - - (252) (252)Total operating impairment losses, provisions and charges (107) (56) - (261) (424)Profit/(loss) on continuing operations before tax 1,053 145 1 (654) 545 Loss from discontinued operations after tax - - - - -
30 June 2013 Retail
Banking £m
Commercial Banking
£m Markets
£m
Corporate Centre(1)
£m Total(1)
£m Net interest income/(expense) 1,382 199 (1) (189) 1,391Non-interest income 328 137 40 65 570Total operating income 1,710 336 39 (124) 1,961Administration expenses (772) (147) (48) (25) (992)Depreciation, amortisation and impairment (95) (9) (1) (16) (121)Total operating expenses excluding impairment losses,
provisions and charges (867) (156) (49) (41) (1,113)
Impairment losses on loans and advances (184) (51) - - (235)Provisions for other liabilities and charges - - - (152) (152)Total operating impairment losses, provisions and charges (184) (51) - (152) (387)Profit/(loss) on continuing operations before tax 659 129 (10) (317) 461 Loss from discontinued operations after tax - - - (12) (12) (1) Adjusted to reflect the adoption of IFRIC 21, as described in Note 1 to the Condensed Consolidated Interim Financial Statements.

Detailed Business Review
Group and Divisional Results continued
Santander UK plc 2014 Half Yearly Financial Report 17
RETAIL BANKING Retail Banking offers a wide range of products and financial services to customers through a network of branches and ATMs, as well as through telephony, e-commerce and intermediary channels. It principally serves personal banking customers, but also services small businesses with a turnover of less than £250,000 per annum. Retail Banking products include residential mortgage loans, savings and current accounts, credit cards and personal loans as well as a range of insurance policies. Summarised income statement
Six months ended 30 June 2014
£m
Six months ended 30 June 2013
£m Net interest income 1,685 1,382Non-interest income 306 328Total operating income 1,991 1,710Administration expenses (719) (772)Depreciation, amortisation and impairment (112) (95)Total operating expenses excluding impairment losses, provisions and charges (831) (867)Impairment losses on loans and advances (107) (184)Total operating impairment losses, provisions and charges (107) (184)Profit on continuing operations before tax 1,053 659
Six months ended 30 June 2014 compared to six months ended 30 June 2013 Profit on continuing operations before tax increased by £394m to £1,053m in the first half of 2014 (2013: £659m). By income statement line, the movements were:
> Net interest income increased by £303m to £1,685m in the first half of 2014 (2013: £1,382m). This was largely due to the lower cost of retail liabilities following the maturity of several tranches of higher cost eSaver savings products in the second half of 2013 and the reduced cost of new ISA liabilities originated in the first half of 2014.
These increases were partly offset by reduced mortgage stock margins reflecting the lower customer rates available on incentive products as the current environment for mortgage lending led to increased activity. This activity, combined with UK Government schemes (such as Help to Buy), led to an increase in customers moving from SVR mortgages. We have been successful in the targeted retention of customers into new Santander UK mortgages.
> Non-interest income decreased by £22m to £306m in the first half of 2014 (2013: £328m). The decrease was driven by lower banking fees, including higher cashback on 1|2|3 World products and lower overdraft fees, partially offset by an increase in credit cards business and new product promotions, and continued growth in 1|2|3 World product balances.
> Administration expenses decreased by £53m to £719m in the first half of 2014 (2013: £772m). The decrease was driven by on-going efficiencies including the consolidation of multi-branch locations.
> Depreciation, amortisation and impairment expenses increased by £17m to £112m in the first half of 2014 (2013: £95m). The increase reflected continued investment in business growth, including branch network systems and digital channels as well as the commencement of depreciation on a new data centre.
> Impairment losses on loans and advances decreased by £77m to £107m in the first half of 2014 (2013: £184m). This was largely due to the reduction in impairment losses on mortgages as a result of improving economic conditions, rising house prices, prolonged low interest rates and collections efficiencies introduced both in 2013 and the first half of 2014.

Detailed Business Review
Group and Divisional Results continued
18 Santander UK plc 2014 Half Yearly Financial Report
Balances and ratios
30 June 2014
£bn 31 December 2013
£bn Total assets 161.9 160.5Customer loans 156.6 155.6- of which mortgages 148.7 148.1- of which unsecured consumer and vehicle finance 7.9 7.5 Risk-weighted assets 37.3 36.3(1)
Customer deposits 126.9 123.2- of which current accounts 35.1 27.9 NPL ratio(2) (3) 1.77% 1.89% Coverage ratio (4) 32% 31% Mortgage NPL ratio(2)(5) 1.79% 1.88%Mortgage coverage ratio(2)(6) 22% 21%
(1) Adjusted for consistency to reflect the CRD IV rules as if they had applied on 31 December 2013 as described in ‘Risk-weighted assets’ in the Balance Sheet Review on page 32. (2) The balances include interest charged to the customer’s account, but exclude interest accrued but not yet charged to the account. (3) NPLs as a percentage of customer loans. (4) Impairment loss allowance as a percentage of NPLs. (5) Mortgage NPLs as a percentage of mortgage assets. (6) Mortgage impairment loss allowance as a percentage of mortgage NPLs.
30 June 2014 compared to 31 December 2013
> Total assets increased to £161.9bn at 30 June 2014 (2013: £160.5bn), mainly due to the rise in customer loans described below.
> Customer loans increased to £156.6bn at 30 June 2014 (2013: £155.6bn). Mortgage customer loans increased by £0.6bn as a result of higher new business lending. Increased gross mortgage lending is resulting in modest growth of the mortgage book, and growth is expected to be in line with our internal estimate for the market outlook for 2014 of approximately 1%.
SVR mortgage loan balances decreased by £4.2bn in the first half of 2014 to £48.1bn. We have been successful in the targeted retention of customers into new Santander UK mortgages.
Unsecured consumer and vehicle finance balances, which include bank overdrafts, unsecured personal loans, credit cards and consumer finance, increased £0.4bn largely in line with our 1|2|3 World loyalty strategy.
> Risk-weighted assets increased by 3% to £37.3bn at 30 June 2014 (2013: £36.3bn), reflecting increased mortgage loan approvals and the unsecured personal lending balances growth described above.
> Customer deposits increased 3% to £126.9bn at 30 June 2014 (2013: £123.2bn) as current account balances continued to grow. The 1|2|3 Current Account remains central to our retail customer relationship model and was the main driver of a 26% increase in current account balances during the period, partially offset by a managed reduction in other deposit balances without a broader customer relationship, as we continued to focus on retaining and originating accounts held by more loyal customers.
> The NPL ratio decreased to 1.77% at 30 June 2014 (2013: 1.89%), with an improvement across both the secured and unsecured
lending portfolios. There was a particular improvement in unsecured personal lending and 1|2|3 Credit Cards which benefitted from the better risk profile of 1|2|3 World customers.
> The mortgage NPL ratio decreased to 1.79% at 30 June 2014 (2013: 1.88%) as a result of a decrease in mortgage NPLs, which reflected the good credit quality of the portfolio, supported by the improving economic environment for UK households, with low interest rates, rising house prices and falling unemployment. We remain aware that these trends may not continue and we take account of this in setting our provisions.
Business volumes
Six months ended 30 June 2014
£bn
Six months ended 30 June 2013
£bn Mortgage gross lending 12.8 7.9 Mortgage net lending 0.6 (4.3) Retail deposit flows 3.7 (0.5) 30 June 2014 31 December 2013 Number of 1I2I3 World customers 3.0 million 2.4 million Number of loyal customers 3.0 million 2.7 million
Six months ended 30 June 2014
> Mortgage gross lending increased to £12.8bn in the first half of 2014, due to improved markets, including gross lending driven by the UK Government-backed Help to Buy scheme. We maintained our prudent lending criteria with an average LTV of 65% (2013: 62%) on new lending in the first half of 2014, including the effect of higher LTV Help to Buy business.
> The number of 1|2|3 World customers increased 25% to 3.0 million in the first half of 2014 (2013: 2.4 million), with a continued growing transactional primary customer base. In the first half of 2014, we further expanded the 1|2|3 World by launching the 1|2|3 Mini, a simple current account for children and a 1|2|3 Student account. This makes 1|2|3 World accessible to the whole family and is helping us to deepen customer relationships.
Our 1|2|3 World products are competitively priced, and are attracting new customers through our advertising campaigns, positive media feedback, and benefits from other 1|2|3 World products. 1|2|3 World customers tend to have higher balances, more products with us, transact more frequently and with a higher average credit card spend than other customers.

Detailed Business Review
Group and Divisional Results continued
Santander UK plc 2014 Half Yearly Financial Report 19
COMMERCIAL BANKING Commercial Banking offers a wide range of products and financial services to customers through a network of regional CBCs and through telephony and e-commerce channels. Commercial Banking products and services include loans, bank accounts, deposits, treasury services, invoice discounting, cash transmission and asset finance. The management of our customers is organised according to the annual turnover of their business, enabling us to offer a differentiated service to small and medium enterprises (‘SMEs’), mid and large corporate customers.
The SME and mid corporate business principally serves SMEs with an annual turnover of more than £250,000 up to £50m, and other corporate customers with an annual turnover of up to £500m. This also includes real estate lending.
The Large Corporates business offers specialist treasury services in fixed income and foreign exchange, lending, transactional banking services, capital markets and money markets to large multinational corporate customers with an annual turnover of more than £500m. Lending includes syndicated loans and structured finance. Transactional banking includes trade finance and cash management. Money market activities include securities lending/borrowing and repos. Summarised income statement
Six months ended 30 June 2014
£m
Six months ended 30 June 2013
£m Net interest income 264 199Non-interest income 131 137Total operating income 395 336Administration expenses (181) (147)Depreciation, amortisation and impairment (13) (9)Total operating expenses excluding impairment losses, provisions and charges (194) (156) Impairment losses on loans and advances (56) (51)Total operating impairment losses, provisions and charges (56) (51)Profit on continuing operations before tax 145 129
Six months ended 30 June 2014 compared to six months ended 30 June 2013 Profit on continuing operations before tax increased by £16m to £145m in the first half of 2014 (2013: £129m). By income statement line, the movements were:
> Net interest income increased by £65m to £264m in the first half of 2014 (2013: £199m), principally as a result of continued growth in customer loans and improved new business margins in the core SME segments, with margins on deposits also improving. Much of this growth was generated through the network of regional CBCs.
> Non-interest income decreased by £6m to £131m in the first half of 2014 (2013: £137m) reflecting lower income from Large Corporates, primarily as a result of lower demand for interest rate risk management products in a relatively stable, low interest rate environment, partially offset by increased client short-term market activity.
> Administration expenses increased by £34m to £181m in the first half of 2014 (2013: £147m). The increase reflected the continued investment in the growth of the businesses serving SME and corporate customers through the increasing number of relationship managers in our growing network of CBCs as we open new financial centres across the UK.
We are investing further in our Commercial Banking business by building on the expertise and presence of the wider Banco Santander group. In the first half of 2014, we launched a new corporate internet banking capability (‘Connect’), a new trade portal, the Santander Passport and a range of other international financial services.
> Depreciation, amortisation and impairment increased by £4m to £13m in the first half of 2014 (2013: £9m) due to the continued investment in systems to improve and support new transactional capabilities for our customers and the increase in our growing network of CBCs.
> Impairment losses on loans and advances increased by £5m to £56m in the first half of 2014 (2013: £51m). Credit quality in the loan books continued to be good, supported by the improving economic environment.

Detailed Business Review
Group and Divisional Results continued
20 Santander UK plc 2014 Half Yearly Financial Report
Balances and ratios
30 June 2014
£bn 31 December 2013
£bn Total assets 28.6 32.7Total customer loans 23.1 22.1- of which corporate SMEs 11.9 11.7Risk-weighted assets 28.4 26.8(1) Customer deposits 14.6 12.6 NPL ratio(2) (3) 3.15% 3.02%Coverage ratio(2) (4) 49% 53%
(1) Adjusted for consistency to reflect the CRD IV rules as if they had applied on 31 December 2013 as described in ‘Risk-weighted assets’ in the Balance Sheet Review on page 32. (2) The balances include interest charged to the customer’s account, but exclude interest accrued but not yet charged to the account. (3) NPLs as a percentage of customer loans. (4) Impairment loss allowance as a percentage of NPLs.
30 June 2014 compared to 31 December 2013
> Total assets comprise customer loans and assets relating to short-term markets activities including repos and derivatives. Total assets decreased by 13% to £28.6bn at 30 June 2014 (2013: £32.7bn) driven by the net of an increase in customer loans (described below), and a decrease in repo and securities financing activities in short-term markets.
> Customer loans increased by 5% to £23.1bn at 30 June 2014 (2013: £22.1bn) maintaining growth momentum. Corporate lending growth continues to be subject to prudent risk management criteria. This growth was predominantly driven by our network of CBCs as we continue to invest in growing our SME market share.
Following a periodic review in the first quarter of 2014, the management of a number of customers was transferred from the SME portfolio to the large corporate portfolio as the annual turnover of their businesses had increased; prior periods have not been restated. The balance associated with these loans was £327m. Excluding this transfer, SME lending growth amounted to 6% in the first half of the year.
> Risk-weighted assets increased by 6% to £28.4bn at 30 June 2014 (2013: £26.8bn) due to higher lending to customers, described above.
> Customer deposits increased by 16% to £14.6bn at 30 June 2014 (2013: £12.6bn) principally reflecting strong inflows during the period as we continued to develop deeper relationships with our clients, and build on our new enhanced corporate cash management and liability capabilities.
> The NPL ratio increased to 3.15% at 30 June 2014 (2013: 3.02%), largely due to a single long-standing loan of £89m which moved to non-performance. A successful restructure of this loan is still anticipated and a conservative provision is held against it. Credit quality remains strong as we continue to adhere to our prudent lending criteria and as we further deliver on our business plan to expand Commercial Banking lending.

Detailed Business Review
Group and Divisional Results continued
Santander UK plc 2014 Half Yearly Financial Report 21
MARKETS Markets offers risk management and other services to financial institutions, as well as to other Santander UK divisions. Its main product areas are fixed income and foreign exchange, equity, capital markets and institutional sales. Summarised income statement
Six months ended 30 June 2014
£m
Six months ended 30 June 2013
£m
Net interest income/(expense) 1 (1)Non-interest income 57 40Total operating income 58 39Administration expenses (56) (48)Depreciation, amortisation and impairment (1) (1)Total operating expenses excluding impairment losses, provisions and charges (57) (49)Provisions for other liabilities and charges - -Total operating impairment losses, provisions and charges - -Profit on continuing operations before tax 1 (10)
Six months ended 30 June 2014 compared to six months ended 30 June 2013 Profit on continuing operations before tax increased by £11m to £1m in the first half of 2014 (2013: loss of £10m). By income statement line, the movements were: > Net interest income/(expense) increased by £2m to £1m in the first half of 2014 (2013: expense of £1m), primarily due to a
decrease in funding costs.
> Non-interest income increased by £17m to £57m in the first half of 2014 (2013: £40m). Following a refocusing of the Equity Derivatives and Securities Financing businesses in 2013, non-interest income recovered to more normalised levels.
> Administration expenses increased by £8m to £56m in the first half of 2014 (2013: £48m), reflecting investment in developing interest rate and fixed income product capabilities offset by tight cost control.
> Depreciation, amortisation and impairment remained unchanged at £1m in the first half of 2014 (2013: £1m).
Balances
30 June 2014
£bn 31 December 2013
£bn Total assets (1) 17.3 19.3Risk-weighted assets 6.7 6.7(2)
(1) Primarily comprises derivative assets (2) Adjusted for consistency to reflect the CRD IV rules as if they had applied on 31 December 2013 as described in ‘Risk-weighted assets’ in the Balance Sheet Review on page 32.
30 June 2014 compared to 31 December 2013
> Total assets comprise derivatives for fixed income and equity products. Total assets decreased by 10% to £17.3bn at 30 June 2014 (2013: £19.3bn). The decrease was mainly driven by the maturity of trades which were economically hedging a portfolio which also matured in the period. This was partially offset by movements in yield curves.
> Risk-weighted assets were broadly flat at £6.7bn at 30 June 2014 (2013: £6.7bn) as the reduction in derivatives, which are subject to netting and collateral, did not impact risk-weighted assets.

Detailed Business Review
Group and Divisional Results continued
22 Santander UK plc 2014 Half Yearly Financial Report
CORPORATE CENTRE Corporate Centre includes Financial Management & Investor Relations (‘FMIR’) and the non-core corporate and legacy portfolios, as well as the co-brand credit cards business sold in 2013 which has been presented as discontinued operations. FMIR is responsible for managing capital and funding, balance sheet composition and structure, and strategic liquidity risk for the Santander UK group. The non-core corporate and legacy portfolios include aviation, shipping, infrastructure, commercial mortgages, Social Housing loans and structured credit assets, all of which are being run-down and/or managed for value. Summarised income statement
Six months ended 30 June 2014
£m
Six months ended 30 June 2013(1)
£m
Net interest expense (277) (189)Non-interest income 25 65Total operating expense (252) (124)Administration expenses 80 (25)Depreciation, amortisation and impairment (221) (16)Total operating expenses excluding impairment losses, provisions and charges (141) (41)Impairment losses on loans and advances (9) -Provisions for other liabilities and charges (252) (152)Total operating impairment losses, provisions and charges (261) (152)Loss on continuing operations before tax (654) (317) Loss on discontinued operations after tax - (12)
(1) Adjusted to reflect the adoption of IFRIC 21, as described in Note 1 to the Condensed Consolidated Interim Financial Statements.
Six months ended 30 June 2014 compared to six months ended 30 June 2013 Loss on continuing operations before tax increased by £337m to £654m in the first half of 2014 (2013: £317m). By income statement line, the movements were: > Net interest expense increased by £88m to £277m in the first half of 2014 (2013: £189m) as the returns on our structural hedge
strategy were lower than in the first half of 2013 following the maturity of historic contracts that benefited from higher returns.
> Non-interest income decreased by £40m to £25m in the first half of 2014 (2013: £65m) largely reflecting a significantly reduced credit arising from the debit valuation adjustments on derivatives written by Santander UK.
> Administration expenses decreased by £105m to a benefit of £80m in the first half of 2014 (2013: expense of £25m). This was largely due to a net gain of £218m which arose as a result of scheme changes that limit future defined benefit pension entitlements and provide for the longer term sustainability of our staff pension arrangement. This was partially offset by additional project costs, including those relating to our investment programme, which were borne centrally.
> Depreciation, amortisation and impairment increased by £205m to £221m in the first half of 2014 (2013: £16m). This was principally due to software write-offs of £206m for the decommissioning of redundant systems following the implementation of our new digital platform and the completion of our product simplification programme. The write-offs will reduce our future depreciation charge.
> Impairment losses on loans and advances increased by £9m to £9m in the first half of 2014 (2013: £nil) due to modest provisions raised in relation to the non-core corporate and legacy portfolios in run-off.
> Provision for other liabilities and charges increased by £100m to £252m in the first half of 2014 (2013: £152m), principally due to a charge of £50m relating to the costs for our on-going branch de-duplication programme. There was also an additional provision of £70m, including related costs, for conduct remediation, of which £65m related to PPI, following a review of recent claims activity which indicates that claims are now expected to continue for longer than originally anticipated; the remaining net £5m charge related to other retail products. In addition, the first half of 2014 benefitted from a reduced provision for restructuring, while 2013 benefitted from a reassessment of the provision for non-PPI retail customer remediation payments.
Provision for other liabilities and charges included regulatory costs relating to the FSCS of £100m (2013: £88m). Following the adoption of IFRIC 21 on 1 January 2014, the charge for the FSCS is now recognised in the first half of the year as set out in Note 1 to the Condensed Consolidated Interim Financial Statements. IFRIC 21 has been applied retrospectively and prior periods have been adjusted.
Loss from discontinued operations after tax of £nil in the first half of 2014 (2013: £12m) reflected the sale of the co-brand credit cards business in 2013.

Detailed Business Review
Group and Divisional Results continued
Santander UK plc 2014 Half Yearly Financial Report 23
Balances and ratios
30 June 2014
£bn 31 December 2013
£bn Total assets 62.4 57.8Eligible liquid assets(1) 32.2 29.5Total customer loans (non-core) 8.7 9.4Risk-weighted assets 7.5 7.9(2)
Customer deposits 9.2 10.6 NPL ratio(3) (4) 2.10% 2.36%Coverage ratio(3) (5) 132% 125%
(1) Includes off balance sheet items per liquid assets table on page 70. (2) Adjusted for consistency to reflect the CRD IV rules as if they had applied on 31 December 2013 as described in ‘Risk-weighted assets’ in the Balance Sheet Review on page 32. (3) The balances include interest charged to the customer’s account, but exclude interest accrued but not yet charged to the account. (4) NPLs as a percentage of customer loans. (5) Impairment loan loss allowance as a percentage of non-performing loans. The impairment loan loss allowance includes provisions against both non-performing loans and other loans where a
provision is required. As a result the ratio can exceed 100%
Non-core assets
30 June 2014
£bn 31 December 2013
£bn Social housing 7.0 7.1Commercial mortgages 1.0 1.2Shipping 0.3 0.4Aviation 0.2 0.4Other 0.2 0.3Non-core customer loans 8.7 9.4Legacy Treasury asset portfolio 1.3 2.0Total non-core assets 10.0 11.4
30 June 2014 compared to 31 December 2013
> Total assets increased by 8% to £62.4bn at 30 June 2014 (2013: £57.8bn) driven by the increase in eligible liquid assets, partially offset by the reduction in non-core customer loans described below. Eligible liquid asset balances continued to be managed against liquidity requirements with a focus on efficiency, given stability in capital markets and as a consequence of historic actions taken to strengthen the balance sheet. As in 2013, surplus liquidity was also utilised to fund maturing medium term funding and to invest in the ALCO portfolio.
> Customer loans decreased by 7% to £8.7bn at 30 June 2014 (2013: £9.4bn) due to the rundown of the non-core corporate and legacy portfolios as we continued to successfully implement our on-going exit strategy from individual loans and leases. Disposals of assets continued across the portfolios with no significant impact on the income statement. The Social Housing loan portfolio remained relatively stable, reflecting its long-term, low risk nature.
> Risk-weighted assets decreased by 5% to £7.5bn at 30 June 2014 (2013: £7.9bn) principally due to the reduction in customer loans due to the continued run-down of the non-core corporate and legacy portfolios.
> Customer deposits decreased by 13% to £9.2bn at 30 June 2014 (2013: £10.6bn), as part of a plan for the management of our less relationship driven deposit base.
> The NPL ratio decreased to 2.10% at 30 June 2014 (2013: 2.36%), reflecting the on-going sale and run-off of the non-core corporate and legacy assets which continue with no significant impact on the income statement. Social Housing comprised 80% of customer loans in Corporate Centre at 30 June 2014, and this portfolio is fully performing.

Detailed Business Review
Balance Sheet Review
24 Santander UK plc 2014 Half Yearly Financial Report
This Balance Sheet Review describes Santander UK’s significant assets and liabilities and its strategy and reasons for entering into such transactions. Throughout this section, references to UK and non-UK, in the geographic analysis, refer to the location of the office where the transaction is recorded.
This Balance Sheet Review focuses on those areas that have changed significantly during the first half of 2014, and represents an update to the Balance Sheet Review in the 2013 Annual Report, with which it should be read in conjunction. The Balance Sheet Review in the 2013 Annual Report contains additional disclosures which have not changed significantly during the first half of 2014.
Index 25 Summarised condensed consolidated balance sheet 27 Short-term borrowings 28 Capital management and resources 34 Liquidity and funding 35 Average balance sheet

Detailed Business Review
Balance Sheet Review continued
Santander UK plc 2014 Half Yearly Financial Report 25
SUMMARISED CONDENSED CONSOLIDATED BALANCE SHEET 30 June 2014
£m 31 December 2013(1)
£m Assets Cash and balances at central banks 26,568 26,374 Trading assets 18,701 22,294Derivative financial instruments 19,159 20,049Financial assets designated at fair value 2,754 2,747Loans and advances to banks 2,325 2,347Loans and advances to customers 186,094 184,587Loans and receivables securities 869 1,101Available for sale securities 7,755 5,005Macro hedge of interest rate risk 727 769Interest in other entities 36 27 Property, plant and equipment 1,530 1,521Retirement benefit assets 235 118Tax, intangibles and other assets 3,467 3,347Total assets 270,220 270,286Liabilities Deposits by banks 8,234 8,696Deposits by customers 150,734 147,167Trading liabilities 17,848 21,278Derivative financial instruments 19,030 18,863Financial liabilities designated at fair value 3,252 3,407Debt securities in issue 50,258 50,870Subordinated liabilities 4,272 4,306Retirement benefit obligations 408 672Tax, other liabilities and provisions 2,586 2,437Total liabilities 256,622 257,696Equity Total shareholders’ equity 13,598 12,590Total equity 13,598 12,590Total liabilities and equity 270,220 270,286(1) Adjusted to reflect the adoption of IFRIC 21, as described in Note 1 to the Condensed Consolidated Interim Financial Statements. A more detailed consolidated balance sheet is contained in the Condensed Consolidated Interim Financial Statements. 30 June 2014 compared to 31 December 2013 Assets Trading assets Trading assets decreased by 16% to £18,701m at 30 June 2014 (2013: £22,294m), reflecting lower levels of activity relating to securities purchased under resale agreements to both banks and customers partially offset by increased holdings of £2,507m of equity instruments as part of short-term markets trading activity. Derivative financial instruments - assets Derivative assets decreased by 4% to £19,159m at 30 June 2014 (2013: £20,049m). The decrease was mainly driven by the maturity of trades which were economically hedging a portfolio which also matured in the period. This was partially offset by movements in yield curves. Loans and advances to customers Loans and advances to customers increased by 1% to £186,094m at 30 June 2014 (2013: £184,587m) principally due to increased mortgage lending and Commercial Banking loans. We remain focused on increasing new mortgage lending in line with the market. Available for sale securities Available for sale securities increased by 55% to £7,755m at 30 June 2014 (2013: £5,005m) largely due to the purchase of Government bonds as part of normal liquid asset portfolio management activity. Retirement benefit assets Retirement benefit assets increased by 99% to £235m at 30 June 2014 (2013: £118m). For those sections of the Santander UK Group Pension Scheme which had surpluses, the key drivers of the increase were scheme changes that limit future defined benefit pension entitlements and provide for the longer term sustainability of our staff pension arrangements. In remeasurement of the defined benefit pension schemes during the period, the return on plan assets (excluding net interest income) exceeded the actuarial losses arising from changes in financial assumptions. Tax, intangibles and other assets Tax, intangibles and other assets increased by 3% to £3,467m at 30 June 2014 (2013: £3,347m). The increase primarily reflected an increase in prepayments, partially offset by a reduction in intangible software assets as a result of write-offs for the decommissioning of redundant systems following the implementation of our new digital platform and the completion of our product simplification programme.
Detailed Business Review
Balance Sheet Review continued
26 Santander UK plc 2014 Half Yearly Financial Report
Liabilities Deposits by customers Deposits by customers increased by 2% to £150,734m at 30 June 2014 (2013: £147,167m) as we focused on retaining and originating accounts held by more loyal Retail Banking customers. Current account balances increased, partially offset by lower savings deposit balances as we focused on reducing short-term retail deposits without a broader customer relationship. Trading liabilities Trading liabilities decreased by 16% to £17,848m at 30 June 2014 (2013: £21,278m). A decrease in securities sold under repurchase activities and the cash collateral received as part of normal trading activity were offset by an increase in short-term deposits and short positions in securities. Derivative financial instruments - liabilities Derivative liabilities were broadly unchanged at £19,030m at 30 June 2014 (2013: £18,863m). Debt securities in issue Debt securities in issue decreased by 1% to £50,258m at 30 June 2014 (2013: £50,870m) as new issuances during the period were broadly offset by maturities and changes in foreign exchange rates. Subordinated liabilities Subordinated liabilities decreased by 1% to £4,272m at 30 June 2014 (2013: £4,306m) due to changes in foreign exchange rates. Retirement benefit obligations Retirement benefit obligations decreased by 39% to £408m at 30 June 2014 (2013: £672m). The explanation for the movement is the same as that given for retirement benefit assets above. Tax, other liabilities and provisions Tax, other liabilities and provisions increased by 6% to £2,586m at 30 June 2014 (2013: £2,437m). The increase principally reflected provisions for vacant property and conduct remediation, partially offset by utilisation during the period. Equity Total shareholders’ equity increased by 9% to £13,598m at 30 June 2014 (2013: £12,590m). The increase was principally attributable to the issuance of £500m Perpetual Capital Securities to our immediate parent company, actuarial gains and the retained profit for the period.

Detailed Business Review
Balance Sheet Review continued
Santander UK plc 2014 Half Yearly Financial Report 27
SHORT-TERM BORROWINGS Santander UK includes short-term borrowings within deposits by banks, trading liabilities, financial liabilities designated at fair value and debt securities in issue and does not show short-term borrowings separately on the balance sheet. Short-term borrowings are defined by the US Securities and Exchange Commission (the ‘SEC’) as amounts payable for short-term obligations that are US Federal funds purchased and securities sold under repurchase agreements, commercial paper, borrowings from banks, borrowings from factors or other financial institutions and any other short-term borrowings reflected on Santander UK’s balance sheet. Santander UK’s only significant short-term borrowings are securities sold under repurchase agreements, commercial paper, borrowings from banks, negotiable certificates of deposit, and certain other debt securities in issue. Additional information on short-term borrowings is provided in the table below for the six months ended 30 June 2014 and 2013. Six months ended
30 June 2014 £m
Six months ended 30 June 2013
£m
Securities sold under repurchase agreements - Period-end balance 14,673 23,664 - Period-end interest rate 0.65% 0.35% - Average balance(1) 24,479 19,740 - Average interest rate(1) 0.47% 0.39% - Maximum balance(1) 27,396 23,664 Commercial paper - Period-end balance 3,862 4,687 - Period-end interest rate 0.61% 0.47% - Average balance(1) 4,043 4,223 - Average interest rate(1) 0.39% 0.53% - Maximum balance(1) 4,610 4,687 Borrowings from banks (Deposits by banks)(2) - Period-end balance 3,213 2,374 - Period-end interest rate 0.08% 0.00% - Average balance(1) 1,485 2,592 - Average interest rate(1) 0.03% 0.03% - Maximum balance(1) 3,213 3,401 Negotiable certificates of deposit - Period-end balance 4,119 2,336 - Period-end interest rate 2.00% 1.96% - Average balance(1) 3,588 2,299 - Average interest rate(1) 2.51% 1.77% - Maximum balance(1) 4,119 2,724 Other debt securities in issue - Period-end balance 4,864 4,661 - Period-end interest rate 2.86% 2.92% - Average balance(1) 4,967 6,578 - Average interest rate(1) 3.09% 2.90% - Maximum balance(1) 5,975 8,308 (1) Calculated using monthly data. (2) The period-end deposits by banks balance includes non-interest bearing items in the course of transmission of £315m (30 June 2013: £586m).
Santander UK issues commercial paper generally in denominations of not less than US$50,000, with maturities of up to 365 days. Commercial paper is issued by Abbey National Treasury Services plc and Abbey National North America LLC.

Detailed Business Review
Balance Sheet Review continued
28 Santander UK plc 2014 Half Yearly Financial Report
CAPITAL MANAGEMENT AND RESOURCES
Capital management and capital allocation Santander UK adopts a centralised capital management approach, based on an assessment of both regulatory requirements and the economic capital impacts of our businesses. Details of Santander UK’s objectives, policies and processes for managing capital can be found in Note 47 in the 2013 Annual Report. Details of Santander UK’s capital at 30 June 2014 can be found in Note 33 to the Condensed Consolidated Interim Financial Statements. Capital and risk management disclosures required by Pillar 3 Banco Santander, S.A. is supervised by the Banco de España (the Bank of Spain) on a consolidated basis. The European Central Bank (‘ECB’) will commence supervision of the Banco Santander group from late 2014 as part of the Single Supervisory Mechanism (‘SSM’). Santander UK has applied Banco Santander, S.A.’s approach to capital measurement and risk management in its implementation of Basel II. As a result, Santander UK has been classified as a significant subsidiary of Banco Santander, S.A. at 30 June 2014. Further information on the Basel II risk measurement of Santander UK’s exposures is included in Banco Santander, S.A.’s Pillar 3 report. Additional capital disclosures In addition, in previous periods further disclosures on capital could be found in Santander UK’s “Additional Capital and Risk Management Disclosures” on www.santander.co.uk. This information principally consisted of transitional disclosures about CRD IV. Following the adoption of CRD IV with effect from 1 January 2014, such transitional disclosures are no longer required, and the remaining disclosures have been incorporated into the following sections. Consequently, a separate “Additional Capital and Risk Management Disclosures” document has not been published at this half year. Scope of Santander UK’s capital adequacy Santander UK is a UK banking group effectively subject to two tiers of supervision. Santander UK is subject to prudential supervision by both the PRA (as a UK authorised bank) and the Banco de España (as a member of the Banco Santander group). The ECB will commence supervision of the Banco Santander group from late 2014 as part of the SSM. As a PRA regulated entity, Santander UK is expected to satisfy the PRA capital requirements on a standalone basis. Similarly, Santander UK must demonstrate to the PRA that it can withstand capital stress tests without parental support. Reinforcing the corporate governance framework adopted by Santander UK, the PRA exercises oversight through its rules and regulations on the Santander UK plc Board and senior management appointments.
Santander UK Group Holdings Limited became the holding company of Santander UK plc with effect from 10 January 2014. From this date, Santander UK Group Holdings Limited became the head of the Santander UK group for regulatory capital and leverage purposes. The basis of consolidation used for capital-related disclosures in this document reflects the Santander UK group, which corresponds to the basis of consolidation of the financial statements. At 30 June 2014, the capital and leverage ratios of the Santander UK Group Holdings Limited consolidated group were substantially the same as those of the Santander UK group.
Capital transferability between Santander UK’s subsidiaries is managed in accordance with Santander UK’s corporate purpose and strategy, its risk and capital management policies and with regard to UK legal and regulatory requirements. There are no other current or foreseen material practical or legal impediments to the prompt transfer of capital resources or repayment of liabilities when due between the Company and its subsidiaries. Key capital ratios The calculations of capital are prepared on a basis consistent with Santander UK’s regulatory filings at 30 June 2014, following the adoption of CRD IV with effect from 1 January 2014. The amounts presented for 31 December 2013 have been prepared on a consistent basis, to aid comparability, as described above. Ratios are calculated by taking the relevant capital resources as a percentage of risk-weighted assets.
The table below summarises Santander UK’s capital ratios under CRD IV: 30 June 2014
% 31 December 2013
% CET 1 capital ratio 11.8 11.6 Total capital ratio 17.8 17.1

Detailed Business Review
Balance Sheet Review continued
Santander UK plc 2014 Half Yearly Financial Report 29
Regulatory capital resources The table below analyses the composition of Santander UK’s regulatory capital resources. The calculations reflect the amounts prepared on a basis consistent with Santander UK’s regulatory filings at 30 June 2014, following the adoption of CRD IV with effect from 1 January 2014. The amounts presented for 31 December 2013 have been prepared on a consistent basis, to aid comparability. The amounts presented for 2013 have not been adjusted to reflect the adoption of IFRIC 21, as set out in Note 1 to the Condensed Consolidated Interim Financial Statements. The adjustment would not have had a material effect on Santander UK’s regulatory position. 30 June 2014
£m 31 December 2013
£m
Common Equity Tier 1 (‘CET 1’) capital instruments and reserves: - Capital instruments and related share premium accounts 8,725 8,725 - Retained earnings 3,640 3,307 - Accumulated other comprehensive income and other reserves 129 (116) CET 1 capital before regulatory adjustments 12,494 11,916 CET 1 regulatory adjustments: - Additional value adjustments (85) (75) - Intangible assets (net of tax) (2,085) (2,319) - Fair value reserves related to gains or losses on cash flow hedges (104) 110 - Negative amounts resulting from the calculation of regulatory expected loss amounts (545) (544) - Gains or losses on liabilities valued at fair value resulting from changes in own credit standing (25) (25) - Defined benefit pension fund assets (185) (94) Total regulatory adjustments to CET 1 (3,029) (2,947) CET 1 capital 9,465 8,969 Additional Tier 1 (‘AT1’) capital instruments: - Capital instruments and the related share premium accounts 500 - - Amounts of qualifying items and related share premium accounts subject to phase out from AT1 1,297 1,298 AT1 capital before regulatory adjustments 1,797 1,298 Total regulatory adjustments to AT1 - - AT1 capital 1,797 1,298 Tier 1 capital 11,262 10,267 Tier 2 capital instruments: - Capital instruments and related share premium accounts 1,737 1,767 - Amounts of qualifying items and related share premium accounts subject to phase out from Tier 2 1,253 1,253 Tier 2 capital before regulatory adjustments 2,990 3,020 Total regulatory adjustments to Tier 2 - - Tier 2 capital 2,990 3,020 Total capital 14,252 13,287
Total regulatory capital consists of: CET 1 capital instruments and reserves Capital instruments and related share premium accounts comprise ordinary share capital of £3,105m (2013: £3,105m) and share premium of £5,620m (2013: £5,620m). Also included within CET 1 capital before regulatory adjustments are retained earnings of £3,640m (2013: £3,307m) and other reserves of £129m (2013: deduction of £116m), as per the Condensed Consolidated Balance Sheet. CET 1 regulatory adjustments CET1 regulatory adjustments represent adjustments to capital and reserves attributable to ordinary shareholders required under CRD IV. The adjustments applicable to Santander UK are as follows:
> Additional value adjustments: Prudent valuation adjustments of £85m (2013: £75m) assessed using a PRA-defined approach. > Intangible assets: Goodwill and intangible assets of £2,085m (2013: £2,319m) net of deferred tax of £20m (2013: £16m) represent
goodwill arising on the acquisition of businesses and certain capitalised computer software costs. > Fair value reserves relating to gains or losses on cash flow hedges: Gains/(losses) on cash flow hedges of £104m (2013: £110m
loss) which have been recognised in reserves. > Negative amounts resulting from the calculation of regulatory expected loss amounts: Excess expected losses deduction of
£545m (2013: £544m) representing the difference between expected loss calculated in accordance with Santander UK’s Internal Rating-Based (‘IRB’) and Advanced Internal Rating-Based (‘AIRB’) models, and impairment loss allowances calculated in accordance with IFRS. Santander UK’s accounting policy for impairment loss allowances is set out in Note 1 to the Consolidated Financial Statements in the 2013 Annual Report. Regulatory expected losses are calculated using risk parameters based on either through-the-cycle or economic downturn estimates, and are subject to conservatism due to the imposition of regulatory floors. They are therefore currently higher than the impairment loss allowances under IFRS which only reflect losses incurred at the balance sheet date.
> Gains or losses on liabilities valued at fair value resulting from changes in own credit standing: This consists of a debit valuation adjustment of £29m (2013: £29m) relating to changes in OTC derivatives and changes in liabilities designated at fair value through profit and loss of £4m (2013: £4m) relating to resulting from changes in Santander UK’s own credit risk.
> Defined benefit pension fund assets: Removal or the defined benefit pension scheme assets of £185m (2013: £94m) net of deferred tax of £50m (2013: £22m).

Detailed Business Review
Balance Sheet Review continued
30 Santander UK plc 2014 Half Yearly Financial Report
AT1 capital instruments AT1 capital consists of preference shares and innovative/hybrid Tier 1 securities. All such instruments issued by the Santander UK group prior to 1 January 2014 do not fully meet the CRD IV requirements for AT1 capital which became effective on that date. These instruments are subject to transitional phase out provisions under CRD IV which restrict their recognition as capital. The £500m Perpetual Capital Securities issued in June 2014 meet the CRD IV AT1 rules and are fully recognised as AT1 capital. Tier 2 capital Tier 2 capital consists of fully CRD IV eligible Tier 2 instruments and grandfathered Tier 2 instruments whose capital recognition is subject to CRD IV transitional phase out provisions. A reconciliation of Core Tier 1 capital at 31 December 2013, calculated in accordance with PRA rules in force at that date, and CET 1 capital calculated in accordance with CRD IV rules which came into force on 1 January 2014 is set out below: 31 December 2013
£m Core Tier 1 capital - PRA rules 9,680 CRD IV adjustments to Core Tier 1: - Excess of regulatory expected losses over impairment losses (335) - Defined benefit pension adjustment (310) - Other(1) (66) CET 1 capital - CRD IV rules 8,969
(1) Other adjustments to Core Tier 1 capital include the effect of additional valuation adjustments, deferred tax, securitisation and unrealised losses on available-for-sale securities.
Movements in regulatory capital Movements in regulatory capital during the six months ended 30 June 2014 and the year ended 31 December 2013 are set out below. The calculations are prepared on a basis consistent with Santander UK’s regulatory filings at 30 June 2014, following the adoption of CRD IV with effect from 1 January 2014. The amounts presented for 2013 have been prepared on a consistent basis, to aid comparability, as described above. 30 June 2014
£m 31 December 2013
£m
CET 1 capital Opening amount 8,969 9,302 Contribution to CET 1 capital from profit for the period/year: - Increase in retained earnings 333 (5) - Increase/(decrease) in comprehensive income 245 (134) - Decrease in additional value adjustments (10) - - (Increase)/decrease in intangible assets (net of tax) 234 (10) - (Increase)/decrease in fair value reserves related to gains and losses on cash flow hedges (214) 110 - Decrease in negative amounts resulting from the calculation of regulatory expected loss amounts (1) 15 - Gain on liabilities valued at fair value resulting from changes in own credit standing - (19) - (Increase)/decrease in defined benefit pension fund assets (91) 382 Additional filters and deductions required pre-CRR - 39 Basel II to CRD IV impact - (711) Closing amount 9,465 8,969 AT1 capital Opening amount 1,298 1,901 - Increase/(decrease) in capital instruments and related share premium accounts 499 (512) - Decrease in amount of qualifying items and related share premium amounts subject to phase out from AT1 - (10) Basel II to CRD IV impact - (81) Closing amount 1,797 1,298 Tier 2 capital Opening amount 3,020 2,756 - Decrease/(increase) in capital instruments (30) 735 - Increase in qualifying items subject to phase out from Tier 2 - 22 Basel II to CRD IV impact - (493) Closing amount 2,990 3,020 Total regulatory capital 14,252 13,287 The changes in Santander UK’s CET 1 capital reflect movements in ordinary share capital, share premium and profits for the six months ended 30 June 2014 and the year ended 31 December 2013 after adjustment to comply with the PRA’s rules. Santander UK complied with the PRA’s capital adequacy requirements during the first half of 2014 and the year ended 31 December 2013.
During the six months ended 30 June 2014, CET 1 capital increased by £496m to £9,465m. This was largely due to profits for the period of £438m, less an interim ordinary dividend approved of £237m and a decrease in intangible assets due to the write-off of software of £206m. During the first half of 2014, the increase in AT1 capital was due to the issuance of £500m Perpetual Capital Securities to Santander UK plc’s immediate parent company as set out in Note 31 to the Condensed Consolidated Interim Financial Statements. During the year ended 31 December 2013: CET 1 capital decreased by £333m to £8,969m comprising an increase in Core Tier 1 capital of £378m combined with a decrease of £711m from the impact of moving from Basel II Core Tier 1 to CRD IV CET1.

Detailed Business Review
Balance Sheet Review continued
Santander UK plc 2014 Half Yearly Financial Report 31
Regulatory Leverage – using PRA definition The Basel III and CRD IV rules include proposals for the use of a leverage ratio as a backstop measure to risk-based capital ratios. The methodology for calculation of the leverage ratio has continued to evolve, with the Basel Committee in January 2014 producing a revised definition of the exposure measure in the ‘Basel III leverage ratio framework and disclosure requirements’ document.
The PRA has requested that UK banking groups disclose leverage ratios using a methodology based on the January 2014 Basel Committee framework for exposure measurement, and an end-point definition of Tier 1 capital at 30 June 2014.
The table below presents the Santander UK group leverage ratio calculated using the approach requested by the PRA. This is the same as the leverage ratio for the Santander UK Group Holdings Limited prudential consolidation group. The position at 31 December 2013 below has been restated to reflect the same basis as that used for the presentation of the position at 30 June 2014. Santander UK exceeded the proposed minimum 3% leverage ratio at both 30 June 2014 and 31 December 2013.
30 June 2014
£m 31 December 2013
£m Regulatory exposure 273,157 272,084 End-point Tier 1 capital 9,965 9,037 PRA end-point Tier 1 leverage ratio 3.6% 3.3% The Basel leverage ratio framework requires certain adjustments to be made to total assets per the consolidated balance sheet to arrive at regulatory exposure for leverage purposes. A reconciliation of total assets per the consolidated balance sheet to the regulatory exposure for leverage purposes at 30 June 2014 and 31 December 2013 is as follows: 30 June 2014
£m 31 December 2013
£m
Total assets per consolidated balance sheet 270,220 270,286 Derivatives netting adjustment and potential future exposure (10,516) (11,367) Securities financing current exposure add-on 1,825 1,963 Removal of IFRS netting 2,006 2,085 Commitments calculated in accordance with Basel Committee Leverage Framework 12,507 12,114 CET 1 regulatory adjustments (2,885) (2,997) 273,157 272,084 The adjustments are as follows: > Derivatives netting and potential future exposure: Where derivative netting is allowed in the calculation of regulatory risk weights
for derivatives, this is also allowed for the purposes of the leverage ratio. This is partially offset by the inclusion of the potential future exposure as used in the calculation of regulatory risk-weighted assets for derivatives.
> Securities financing current exposure add-on: An add-on for securities financing transactions to reflect current exposure is included for the purposes of the leverage ratio.
> Removal of IFRS netting: Where netting of assets and liabilities is permitted under IFRS, this is removed for the purposes of the leverage ratio.
> Commitments calculated in accordance with Basel Committee Leverage Framework: The gross value of undrawn commitments is added to total assets for leverage purposes after applying regulatory credit conversion factors.
> CET 1 regulatory adjustments: Where assets are deducted from CET 1, they can be deducted from total assets for the purposes of the leverage ratio.

Detailed Business Review
Balance Sheet Review continued
32 Santander UK plc 2014 Half Yearly Financial Report
Risk-weighted assets (‘RWAs’) The tables below analyse the composition of Santander UK’s RWAs. The calculations reflect the amounts prepared on a basis consistent with Santander UK’s regulatory filings at 30 June 2014, following the adoption of CRD IV with effect from 1 January 2014. The amounts presented for 2013 have been prepared on a consistent basis, to aid comparability. The amounts presented for 31 December 2013 have not been adjusted to reflect the adoption of IFRIC 21, as set out in Note 1 to the Condensed Consolidated Interim Financial Statements. The adjustment would not have had a material effect on Santander UK’s regulatory position.
RWAs by risk 30 June 2014
£bn 31 December 2013
£bn Credit risk 63.0 61.1 Counterparty risk 4.7 4.8 Market risk 5.1 4.8 Operational risk 7.1 7.0 Total 79.9 77.7
RWAs by division 30 June 2014
£bn 31 December 2013
£bn Retail Banking 37.3 36.3 Commercial Banking 28.4 26.8 Markets 6.7 6.7 Corporate Centre 7.5 7.9 Total 79.9 77.7 A reconciliation of RWAs at 31 December 2013, calculated in accordance with PRA rules in force at that date, and calculated in accordance with CRD IV rules which came into force on 1 January 2014 is set out below: 31 December 2013
£bn Pillar 1 RWAs - PRA rules 75.2 CRD IV adjustments to RWAs: - Securitisation 1.1 - Counterparty Risk and Other(1) 1.4 RWAs - CRD IV rules 77.7
(1) The counterparty risk adjustments to RWAs include credit valuation adjustment, central counterparty clearing, asset value correlation, operational risk and changes to credit risk from provision treatment and SME risk weight reduction.
RWAs by division may be further analysed into the balance sheet amount, the equivalent regulatory exposure measured under the standardised and IRB approaches, the risk-weighting applied to those regulatory exposures, and the resulting risk-weighted assets calculated, as follows:
30 June 2014 Regulatory exposure Risk-weighting applied RWAs
Balance sheet
amount £bn
Standardised
approach £bn
IRB
approach £bn
Total £bn
Standardised
approach %
IRB
approach %
Total %
Standardised
approach £bn
IRB
approach £bn
Total £bn
Retail Banking - Secured lending 148.7 - 158.8 158.8 - 14.8 14.8 - 23.5 23.5 - Unsecured lending 7.9 5.3 6.8 12.1 79.2 63.2 70.2 4.2 4.3 8.5 - Operational risk - - - - - - - 5.3 - 5.3 Commercial Banking - Customer assets 23.1 16.2 14.4 30.6 80.9 75.7 78.4 13.1 10.9 24.0 - Non-customer assets(1) 7.5 1.6 1.0 2.6 46.4 34.9 41.9 0.7 0.4 1.1 - Market risk(2) - - - - - - - 1.8 - 1.8 - Operational risk - - - - - - - 1.5 - 1.5 Markets - Credit risk 0.1 0.1 - 0.1 - - - - - - - Counterparty risk 17.2 1.1 4.0 5.1 63.6 60.0 60.8 0.7 2.4 3.1 - Market risk(2) - - - - - - - 3.3 - 3.3 - Operational risk - - - - - - - 0.3 - 0.3 Corporate Centre - Customer assets(3) 8.7 1.8 7.9 9.7 55.6 12.7 20.6 1.0 1.0 2.0 - Eligible liquid assets (4) 33.5 30.6 - 30.6 - - - - - - - Counterparty Risk - - - - - - - - 0.4 0.4 Intangible assets & securitisation deductions
2.1 - - - - - - - - -
Other assets(5) 21.4 8.4 3.3 11.7 39.3 54.5 43.6 3.3 1.8 5.1 270.2 65.1 196.2 261.3 35.2 44.7 79.9 (1) Non-customer assets principally consist of the securities lending/borrowing and repo businesses of the Short Term Markets business. (2) Market Risk RWAs are determined using both internal model-based and standardised approaches. See the Market Risk section. (3) Customer assets in Corporate Centre largely comprise social housing. (4) Eligible liquid assets include reverse repurchase agreements collateralised by eligible sovereign securities. (5) The balance sheet amounts of other assets have not been allocated segmentally, although the RWAs have been allocated to Corporate Centre. The RWAs cover Credit Risk, Market Risk and
Operational Risk.

Detailed Business Review
Balance Sheet Review continued
Santander UK plc 2014 Half Yearly Financial Report 33
31 December 2013 Regulatory exposure Risk-weighting applied RWAs Balance
sheet amount
£bn
Standardised
approach £bn
IRB
approach £bn
Total £bn
Standardised
approach %
IRB
approach %
Total %
Standardised
approach £bn
IRB
approach £bn
Total £bn
Retail Banking - Secured lending 148.1 0.2 157.3 157.5 77.1 14.5 14.5 0.1 22.8 22.9 - Unsecured lending 7.5 4.8 6.5 11.3 78.2 65.1 70.7 3.8 4.2 8.0 - Operational risk - - - - - - - 5.4 - 5.4 Commercial Banking - Customer assets 22.1 13.5 14.6 28.1 90.4 72.6 81.1 12.2 10.6 22.8 - Non-customer assets(1) 13.4 0.8 1.5 2.3 100.0 26.7 52.2 0.8 0.4 1.2 - Market risk(2) - - - - - - - 1.4 - 1.4 - Operational risk - - - - - - - 1.4 - 1.4 Markets - Credit risk 0.1 - 0.1 0.1 - - - - - - - Counterparty risk 19.2 2.0 3.8 5.8 100.0 31.6 55.2 2.0 1.2 3.2 - Market risk(2) - - - - - - - 3.3 - 3.3 - Operational risk - - - - - - - 0.2 - 0.2 Corporate Centre - Customer assets(3) 9.4 2.0 9.1 11.1 77.2 21.5 31.5 1.5 2.0 3.5 - Eligible liquid assets (4) 31.5 28.1 - 28.1 - - - - - - - Operational risk - - - - - - - - - - Counterparty risk - - - - - - - 0.5 - 0.5 Intangible assets & securitisation deductions
2.3 - - - - - - - - -
Other assets(5) 16.7 7.0 3.6 10.6 42.2 26.4 36.8 3.0 0.9 3.9 270.3 58.4 196.5 254.9 35.6 42.1 77.7 (1) Non-customer assets principally consist of the securities lending/borrowing and repo businesses of the Short Term Markets business. (2) Market Risk RWAs are determined using both internal model-based and standardised approaches. See the Market Risk section. (3) Customer assets in Corporate Centre largely comprise social housing. (4) Eligible liquid assets include reverse repurchase agreements collateralised by eligible sovereign securities. (5) The balance sheet amounts of other assets have not been allocated segmentally, although the RWAs have been allocated to Corporate Centre. The RWAs cover Credit Risk, Market Risk and
Operational Risk. Regulatory exposure represents the Exposure at Default (‘EAD’) calculated in accordance with CRR and related PRA supervisory statements. EAD for customer loans includes unutilised credit facilities and is adjusted for a credit conversion factor. EAD for repurchase, reverse repurchase, securities financing and derivative transactions are calculated net of any associated collateral and are adjusted for regulatory changes and potential future exposure adjustments (‘PFE’) where applicable.
Santander UK applies Basel III to the calculation of its capital requirement. In addition, Santander UK applies the Retail IRB and AIRB approaches to its credit portfolios. Residential lending capital resources requirements include securitised residential mortgages. During the six months ended 30 June 2014, RWAs increased in line with the growth in Retail Banking mortgage lending and Commercial Banking lending.

Detailed Business Review
Balance Sheet Review continued
34 Santander UK plc 2014 Half Yearly Financial Report
LIQUIDITY AND FUNDING The Board’s risk objective is to be a risk resilient institution at all times, and to be perceived as such by stakeholders, preserving the short and long-term viability of Santander UK. While recognising that a bank engaging in maturity transformation cannot hold sufficient liquidity to cover all possible stress scenarios, the Board requires Santander UK to hold sufficient liquidity to cover extreme situations. The requirements arising from the PRA’s regulatory liquidity regime are reflected in the Board’s Liquidity Risk Appetite. Liquidity risk is the risk that Santander UK, although solvent, either does not have available sufficient financial resources to enable it to meet its obligations as they fall due, or can secure them only at excessive cost. In Santander UK’s opinion, working capital is sufficient for its present requirements.
Santander UK primarily generates funding and liquidity through UK retail and corporate deposits, as well as in the financial markets through its own debt programmes and facilities to support its business activities and liquidity requirements. It does this with reliance on the strength of its balance sheet and profitability and its own network of investors. It does not rely on a guarantee from Banco Santander, S.A. or any other member of the Banco Santander group to generate this funding or liquidity. Santander UK does not raise funds to finance other members of the Banco Santander group or guarantee the debts of other members of the Banco Santander group (other than certain of Santander UK plc’s own subsidiaries). As a PRA regulated group, Santander UK is expected to satisfy the PRA liquidity and capital requirements on a standalone basis. Similarly, Santander UK must demonstrate to the PRA that it can withstand liquidity and capital stress tests without parental support.
See the “Liquidity and Funding Risk” section of the Risk Management Report for more information. Sources of liquidity and funding Santander UK is primarily funded by retail deposits. This, together with corporate deposits, forms its commercial bank franchise, which attracts deposits through a variety of entities. More than three quarters of Santander UK’s customer lending is financed by customer deposits. The retail sources primarily originate from the Retail Banking savings business. Although largely callable, these funds provide a stable and predictable core of funding due to the nature of the retail accounts and the breadth of personal customer relationships. Additionally, Santander UK has a strong wholesale funding base, which is diversified across product types and geography.
Through the wholesale markets, Santander UK has active relationships with many counterparties across a range of sectors, including banks, other financial institutions, corporates and investment funds. Other sources of funding include collateralised borrowings, mortgage securitisations and long-term debt issuance. Short-term funding is accessed through money market instruments, including time deposits, certificates of deposit and commercial paper. Medium to long-term funding is accessed primarily through asset securitisation and covered bond arrangements and Santander UK’s euro medium-term note programmes. The major debt issuance programmes are managed by, and in the name of, Abbey National Treasury Services plc on its own behalf (except for the US commercial paper programme, which is managed by, and in the name of, Abbey National North America LLC, a guaranteed subsidiary of Santander UK plc) and are set out in Note 33 to the Consolidated Financial Statements in the 2013 Annual Report.
The ability to sell assets quickly is also an important source of liquidity for Santander UK. Santander UK holds marketable investment securities, such as central bank-eligible debt securities, which could be disposed of either by entering into sale and repurchase agreements or by being sold to provide additional funding should the need arise.
Within the framework of prudent funding and liquidity management, Santander UK manages its commercial banking activities to minimise liquidity risk. Encumbrance - securitisation of assets and covered bonds Santander UK has provided prime retail mortgage-backed products to a diverse investor base through its mortgage-backed funding programmes, as described in Note 15 to the Condensed Consolidated Interim Financial Statements. Funding has historically been raised via mortgage-backed notes, both issued directly to third parties and retained for repo with third parties (the latter being eligible collateral for liquidity purposes under certain central bank facilities). Santander UK, via its subsidiary Abbey National Treasury Services plc, has an established covered bond programme, whereby securities are issued to investors and are guaranteed by a pool of ring-fenced residential mortgages.
Santander UK’s level of encumbrance arising from external issuance of mortgage-backed funding decreased in the first half of 2014 as planned, reflecting both the overall reduction in wholesale funding and the desire to better balance new wholesale funding issuance between secured and unsecured markets where possible. At 30 June 2014, total notes issued externally from secured programmes (securitisations and covered bonds) decreased to £34,585m (2013: £36,307m), reflecting gross issuance of £2.6bn in the first half of 2014 (2013: £3.1bn) and maturities/redemptions of £4.3bn. At 30 June 2014, a total of £14,440m (2013: £14,599m) of notes issued under securitisation and covered bond programmes had also been retained internally, a proportion of which had been used as collateral for raising funds via third party bilateral secured funding transactions, which totalled £7.2bn at 30 June 2014 (2013: £7.6bn). Cash flows Six months ended
30 June 2014 £m
Six months ended 30 June 2013
£m
Net cash (outflow)/inflow from operating activities (252) 10,275 Net cash (outflow)/inflow from investing activities (2,905) 282 Net cash outflow from financing activities (813) (6,824) (Decrease)/increase in cash and cash equivalents (3,970) 3,733
The major activities and transactions that affected Santander UK’s cash flows during the first six months of 2014 were as follows:
The net cash outflow from operating activities of £252m resulted from the reduction in trading balances offset by increased customer savings and deposits from other banks.
The net cash outflow from investing activities of £2,905m principally reflected the purchase and sale of available-for-sale securities. The net cash outflow from financing activities of £813m reflected the repayment of debt securities maturing in the period of
£12,046m offset by new issues of debt securities of £10,983m and the issuance of £500m capital securities. Further outflows of cash occurred in the payment of interim dividends of £210m on ordinary shares and £40m of dividends on other equity instruments.
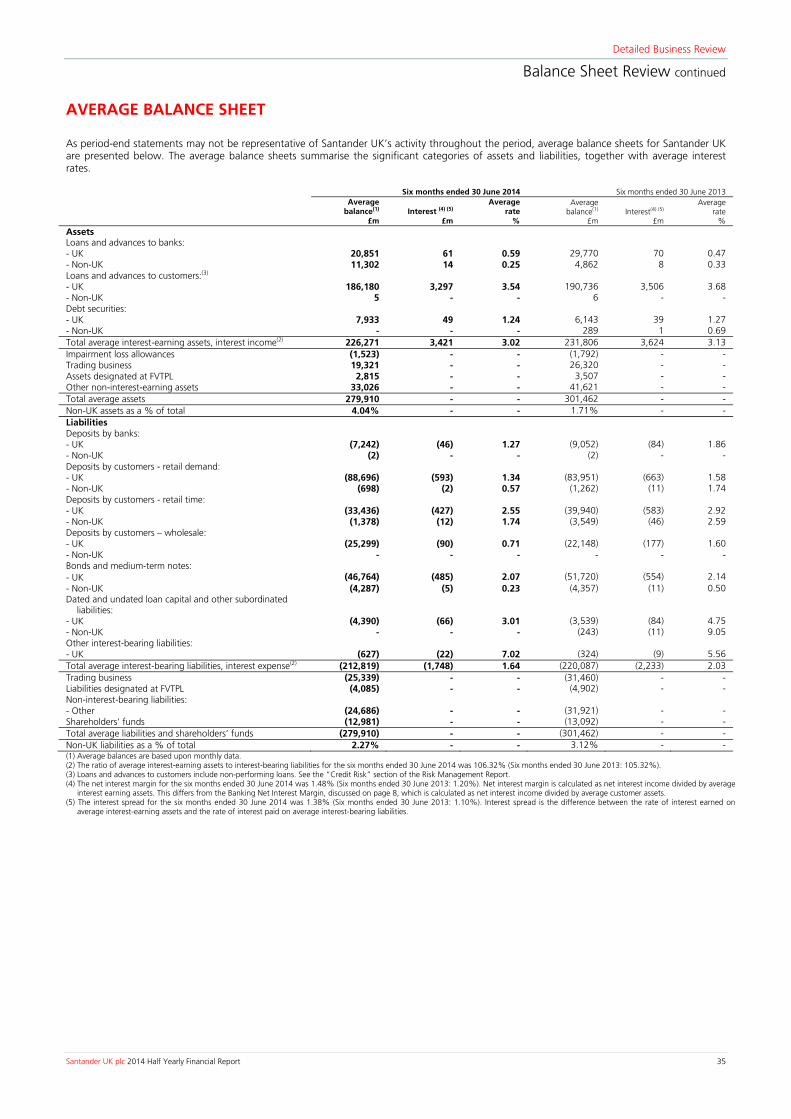
Detailed Business Review
Balance Sheet Review continued
Santander UK plc 2014 Half Yearly Financial Report 35
AVERAGE BALANCE SHEET
As period-end statements may not be representative of Santander UK’s activity throughout the period, average balance sheets for Santander UK are presented below. The average balance sheets summarise the significant categories of assets and liabilities, together with average interest rates.
Six months ended 30 June 2014 Six months ended 30 June 2013
Average balance(1)
£m
Interest (4) (5)
£m
Average rate
%
Average balance(1)
£m
Interest(4) (5)
£m
Average rate
% Assets Loans and advances to banks: - UK 20,851 61 0.59 29,770 70 0.47 - Non-UK 11,302 14 0.25 4,862 8 0.33 Loans and advances to customers:(3) - UK 186,180 3,297 3.54 190,736 3,506 3.68 - Non-UK 5 - - 6 - - Debt securities: - UK 7,933 49 1.24 6,143 39 1.27 - Non-UK - - - 289 1 0.69 Total average interest-earning assets, interest income(2) 226,271 3,421 3.02 231,806 3,624 3.13 Impairment loss allowances (1,523) - - (1,792) - - Trading business 19,321 - - 26,320 - - Assets designated at FVTPL 2,815 - - 3,507 - - Other non-interest-earning assets 33,026 - - 41,621 - - Total average assets 279,910 - - 301,462 - - Non-UK assets as a % of total 4.04% - - 1.71% - - Liabilities Deposits by banks: - UK (7,242) (46) 1.27 (9,052) (84) 1.86 - Non-UK (2) - - (2) - - Deposits by customers - retail demand: - UK (88,696) (593) 1.34 (83,951) (663) 1.58 - Non-UK (698) (2) 0.57 (1,262) (11) 1.74 Deposits by customers - retail time: - UK (33,436) (427) 2.55 (39,940) (583) 2.92 - Non-UK (1,378) (12) 1.74 (3,549) (46) 2.59 Deposits by customers – wholesale: - UK (25,299) (90) 0.71 (22,148) (177) 1.60 - Non-UK - - - - - - Bonds and medium-term notes: - UK (46,764) (485) 2.07 (51,720) (554) 2.14 - Non-UK (4,287) (5) 0.23 (4,357) (11) 0.50 Dated and undated loan capital and other subordinated
liabilities:
- UK (4,390) (66) 3.01 (3,539) (84) 4.75 - Non-UK - - - (243) (11) 9.05 Other interest-bearing liabilities: - UK (627) (22) 7.02 (324) (9) 5.56 Total average interest-bearing liabilities, interest expense(2) (212,819) (1,748) 1.64 (220,087) (2,233) 2.03 Trading business (25,339) - - (31,460) - - Liabilities designated at FVTPL (4,085) - - (4,902) - - Non-interest-bearing liabilities: - Other (24,686) - - (31,921) - - Shareholders’ funds (12,981) - - (13,092) - - Total average liabilities and shareholders’ funds (279,910) - - (301,462) - - Non-UK liabilities as a % of total 2.27% - - 3.12% - - (1) Average balances are based upon monthly data. (2) The ratio of average interest-earning assets to interest-bearing liabilities for the six months ended 30 June 2014 was 106.32% (Six months ended 30 June 2013: 105.32%). (3) Loans and advances to customers include non-performing loans. See the “Credit Risk” section of the Risk Management Report. (4) The net interest margin for the six months ended 30 June 2014 was 1.48% (Six months ended 30 June 2013: 1.20%). Net interest margin is calculated as net interest income divided by average
interest earning assets. This differs from the Banking Net Interest Margin, discussed on page 8, which is calculated as net interest income divided by average customer assets. (5) The interest spread for the six months ended 30 June 2014 was 1.38% (Six months ended 30 June 2013: 1.10%). Interest spread is the difference between the rate of interest earned on
average interest-earning assets and the rate of interest paid on average interest-bearing liabilities.

Detailed Business Review
Risk Management Report
36 Santander UK plc 2014 Half Yearly Financial Report
This Risk Management Report contains information that forms an integral part of the Condensed Consolidated Interim Financial Statements, except as otherwise marked as unreviewed. This Risk Management Report focuses on those areas that have changed significantly during the first half of 2014, and represents an update to the Risk Management Report in the 2013 Annual Report, with which it should be read in conjunction. The Risk Management Report in the 2013 Annual Report contains additional disclosures which have not changed significantly during the first half of 2014.
Index 37 Risk Management 37 Introduction (unreviewed) 37 Risk Framework 38 Credit Risk 38 - Credit Risk Review 38 - Santander UK group exposure 43 - Retail Banking 54 - Commercial Banking 61 - Markets 62 - Corporate Centre 66 Market Risk 67 - Traded Market risk 69 Balance Sheet Management Risk 69 - Banking Market risk 70 - Liquidity and Funding risk 76 - Capital risk (unreviewed) 76 - Pension risk (unreviewed) 76 Operational Risk (unreviewed) 77 Conduct Risk (unreviewed) 77 Regulatory Risk (unreviewed) 77 Legal Risk (unreviewed) 78 Areas of focus and other items 78 - Country Risk exposure

San
ThinfMaRe
R IN As forfaccus
ach
R Th
>>>>
In sim
>
>>
>
Ri
ntander UK plc 2014 H
is Risk Managemformation on paanagement Repoport.
ISK MAN
NTRODUC
a significant finr the effective mcilitate the delivstomers, shareho
Santandhievement of ou
ISK FRAM
e Risk Framewor
> Risk def> Risk Cu> Governa> System
December 2013mplified and the
> With re(previouand Leg
> The add> With re
Executiv> A Risk C
isk definit
Half Yearly Financial R
ment Report conages 36 to 82 isort should be re
NAGEME
CTION (un
ancial services pmanagement of tvery of robust folders and the c
der UK aims to mur strategic objec
MEWORK
rk in place at 30
finition and struclture, overridingance, roles and r of internal contr
3, the Board app lines of defence
spect to risk defusly known as Stgal, as set out diaditional classificaespect to governve Risk CommittCulture statemen
tion and st
Report
ntains informatio within the scopad in conjunctio
NT
nreviewed)
provider, risk is athe business. Safinancial performcommunities in wmaintain a predicctives set out in
K
0 June 2014 was
cture; principles and mresponsibilities; arol for risk.
proved an updae model streamli
finition and structructural) includagrammatically b
ation of financialnance, roles antee; and nt was included.
tructure
on that forms anpe of the reviewon with the Sum
t the core of Sanantander UK aimmance, and ultiwhich we operatctable medium-l“Our Strategy an
based upon the
minimum standaand
ted Risk Framewned. There was
cture, the key rising Banking Mabelow; and / non-financial d responsibilitie
n integral part ow report of Delo
mmary Risk Repo
ntander UK’s dams to employ a p
mately build sute. low risk profile, nd Business Mod
e following key c
ards;
work which openo change to th
sk types were rerket (previously
risks was removes, a Conduct &
R
of the Condenseoitte LLP except rt on pages 11 t
y-to-day activitieprudent approacustainable value
consistent with del” on page 4,
components:
rated throughouhe overriding prin
eorganised as: C known as Non-
ed; & Regulatory Ris
Risk Manag
d Consolidated for those items to 14, which for
es. The understach and advanced for all our sta
its business mod and pages 4 and
ut the first half nciples. The main
redit, Traded Matraded Market),
sk Committee w
Detaile
gement Rep
Interim Financia marked as unrerms part of this
anding and contrd risk managem
akeholders, inclu
del, which is keyd 5 of the 2013
of 2014. The kn changes were
arket, Balance S Operational, Co
was created wh
ed Business Revie
port continue
37
al Statements. Teviewed. This RiRisk Manageme
rol of risk is criticment techniques uding our peop
y to the successf Annual Report.
ey risk types we:
Sheet Managemeonduct, Regulat
hich reports to t
ew
ed
7
he isk
ent
cal to le,
ful
ere
ent ory
the

Detailed Business Review
Risk Management Report continued
38 Santander UK plc 2014 Half Yearly Financial Report
CREDIT RISK REVIEW SANTANDER UK GROUP EXPOSURE Maximum exposure and net exposure to credit risk The tables below set out the main differences between the Santander UK group’s maximum exposure and net exposure to credit risk. They show the effects of collateral, netting, and risk transfer to mitigate the Santander UK group’s exposure.
For balance sheet assets, the maximum exposure to credit risk represents the carrying value, including accrued interest, after allowance for impairment losses. Off-balance sheet exposures comprise guarantees, formal standby facilities, credit lines and other commitments. For off-balance sheet guarantees, the maximum exposure is the maximum amount that Santander UK would have to pay if the guarantees were to be called upon. For formal standby facilities, credit lines and other commitments that are irrevocable over the life of the respective facilities, the maximum exposure is the full amount of the committed facilities.
The tables presented below include only those financial assets subject to credit risk, and therefore exclude equity securities. Subsequent analyses of credit risk in this section cover loans and advances to customers and banks, at carrying value.
30 June 2014 Maximum exposure Balance
sheet asset £bn
Off-balance sheet
£bn Collateral(1)
£bn Netting(2)
£bn
Risk Transfer(3)
£bn
Net Exposure
£bn Cash and balances at central banks 26.6 - - - - 26.6Trading assets: - Loans and advances to banks 6.2 - (2.3) (1.1) - 2.8 - Loans and advances to customers 1.8 - (1.2) - - 0.6 - Debt securities 7.5 - - - - 7.5 Total trading assets 15.5 - (3.5) (1.1) - 10.9 Financial assets designated at fair value: - Loans and advances to customers 2.2 0.2 (2.2) - - 0.2 - Debt securities 0.5 - - - - 0.5 Financial assets designated at fair value 2.7 0.2 (2.2) - - 0.7 Available-for-sale debt securities 7.7 - - - - 7.7 Derivative financial instruments 19.2 - (1.1) (15.3) - 2.8 Loans and advances to banks 2.3 1.5 - - (0.1) 3.7 Loans and advances to customers: - Advances secured on residential property 148.4 6.7 (155.0) - - 0.1 - Corporate loans 26.3 13.7 (19.3) - - 20.7 - Finance leases 3.2 - (2.3) - - 0.9 - Other secured advances 2.2 0.2 (2.2) - - 0.2 - Other unsecured advances 5.2 10.5 - - - 15.7 - Amounts due from fellow subsidiaries, associates and joint ventures 0.8 - - - - 0.8 Total loans and advances to customers 186.1 31.1 (178.8) - - 38.4 Loans and receivables securities 0.9 - - - (0.1) 0.8 Total 261.0 32.8 (185.6) (16.4) (0.2) 91.6
31 December 2013 Maximum exposure
Balance sheet asset
£bn
Off-balance sheet
£bn Collateral(1)
£bn Netting(2)
£bn
Risk Transfer(3)
£bn
Net Exposure
£bn Cash and balances at central banks 26.4 - - - - 26.4 Trading assets: - Loans and advances to banks 9.3 - (0.8) (3.4) - 5.1 - Loans and advances to customers 4.4 - (4.2) - - 0.2 - Debt securities 7.9 - - - - 7.9 Total trading assets 21.6 - (5.0) (3.4) - 13.2 Financial assets designated at fair value: - Loans and advances to customers 2.2 0.2 (2.3) - - 0.1 - Debt securities 0.5 - - - - 0.5 Financial assets designated at fair value 2.7 0.2 (2.3) - - 0.6 Available-for-sale debt securities 5.0 - - - - 5.0 Derivative financial instruments 20.0 - (1.7) (15.4) - 2.9 Loans and advances to banks 2.3 - (0.3) - (0.1) 1.9 Loans and advances to customers: - Advances secured on residential property 147.8 6.8 (154.3) - - 0.3 - Corporate loans 24.9 13.2 (18.6) - - 19.5 - Finance leases 3.1 - (2.2) - - 0.9 - Other secured advances 2.7 0.2 (2.4) - - 0.5 - Other unsecured advances 5.3 9.6 - - - 14.9 - Amounts due from fellow subsidiaries, associates and joint ventures 0.8 - - - - 0.8 Total loans and advances to customers 184.6 29.8 (177.5) - - 36.9 Loans and receivables securities 1.1 - - - - 1.1 Total 263.7 30.0 (186.8) (18.8) (0.1) 88.0
(1) The forms of collateral which Santander UK takes to mitigate credit risk include: residential and commercial property; other physical assets, including motor vehicles; liquid securities, including those transferred under reverse repurchase agreements; cash, including that which is used to collateralise derivative transactions and receivables. In terms of exposure, charges on residential property represent the majority of collateral taken.
(2) Credit risk exposures can be reduced by applying netting and set-off. Santander UK uses this approach mainly for derivative and repurchase transactions with financial institutions. For derivatives transactions, Santander UK uses standard master netting agreements (e.g. ISDA). These agreements allow for netting of credit risk exposure to a counterparty resulting from a derivative transaction against Santander UK’s obligations to the counterparty in the event of default, to produce a lower net credit exposure. They may also reduce settlement exposure.
(3) Certain financial instruments can be used to transfer credit risk from one counterparty to another. The main form of risk transfer employed by Santander UK is through the use of credit default swaps.
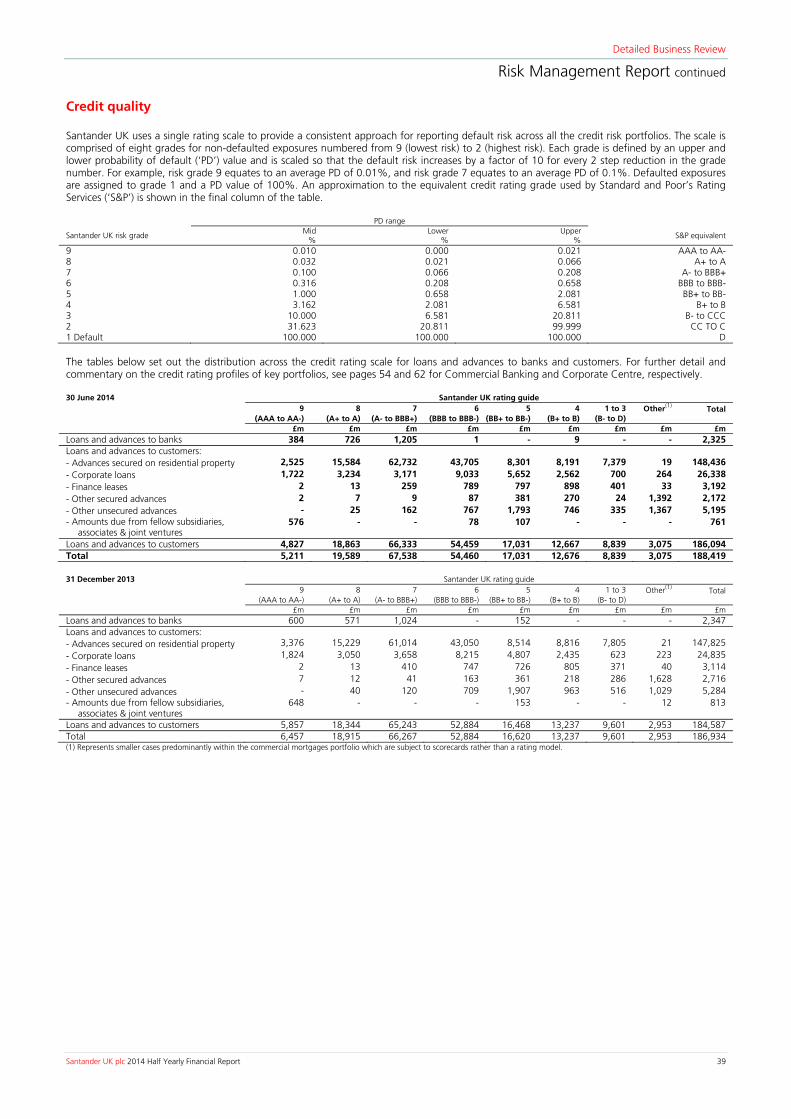
Detailed Business Review
Risk Management Report continued
Santander UK plc 2014 Half Yearly Financial Report 39
Credit quality Santander UK uses a single rating scale to provide a consistent approach for reporting default risk across all the credit risk portfolios. The scale is comprised of eight grades for non-defaulted exposures numbered from 9 (lowest risk) to 2 (highest risk). Each grade is defined by an upper and lower probability of default (‘PD’) value and is scaled so that the default risk increases by a factor of 10 for every 2 step reduction in the grade number. For example, risk grade 9 equates to an average PD of 0.01%, and risk grade 7 equates to an average PD of 0.1%. Defaulted exposures are assigned to grade 1 and a PD value of 100%. An approximation to the equivalent credit rating grade used by Standard and Poor’s Rating Services (‘S&P’) is shown in the final column of the table.
PD range
Santander UK risk grade Mid %
Lower %
Upper %
S&P equivalent
9 0.010 0.000 0.021 AAA to AA- 8 0.032 0.021 0.066 A+ to A 7 0.100 0.066 0.208 A- to BBB+ 6 0.316 0.208 0.658 BBB to BBB- 5 1.000 0.658 2.081 BB+ to BB- 4 3.162 2.081 6.581 B+ to B 3 10.000 6.581 20.811 B- to CCC 2 31.623 20.811 99.999 CC TO C 1 Default 100.000 100.000 100.000 D The tables below set out the distribution across the credit rating scale for loans and advances to banks and customers. For further detail and commentary on the credit rating profiles of key portfolios, see pages 54 and 62 for Commercial Banking and Corporate Centre, respectively. 30 June 2014 Santander UK rating guide 9 8 7 6 5 4 1 to 3 Other(1) Total (AAA to AA-) (A+ to A) (A- to BBB+) (BBB to BBB-) (BB+ to BB-) (B+ to B) (B- to D) £m £m £m £m £m £m £m £m £m Loans and advances to banks 384 726 1,205 1 - 9 - - 2,325Loans and advances to customers: - Advances secured on residential property 2,525 15,584 62,732 43,705 8,301 8,191 7,379 19 148,436- Corporate loans 1,722 3,234 3,171 9,033 5,652 2,562 700 264 26,338- Finance leases 2 13 259 789 797 898 401 33 3,192- Other secured advances 2 7 9 87 381 270 24 1,392 2,172- Other unsecured advances - 25 162 767 1,793 746 335 1,367 5,195- Amounts due from fellow subsidiaries,
associates & joint ventures 576 - - 78 107 - - - 761
Loans and advances to customers 4,827 18,863 66,333 54,459 17,031 12,667 8,839 3,075 186,094Total 5,211 19,589 67,538 54,460 17,031 12,676 8,839 3,075 188,419 31 December 2013 Santander UK rating guide 9 8 7 6 5 4 1 to 3 Other(1) Total (AAA to AA-) (A+ to A) (A- to BBB+) (BBB to BBB-) (BB+ to BB-) (B+ to B) (B- to D) £m £m £m £m £m £m £m £m £m Loans and advances to banks 600 571 1,024 - 152 - - - 2,347 Loans and advances to customers: - Advances secured on residential property 3,376 15,229 61,014 43,050 8,514 8,816 7,805 21 147,825 - Corporate loans 1,824 3,050 3,658 8,215 4,807 2,435 623 223 24,835 - Finance leases 2 13 410 747 726 805 371 40 3,114 - Other secured advances 7 12 41 163 361 218 286 1,628 2,716 - Other unsecured advances - 40 120 709 1,907 963 516 1,029 5,284 - Amounts due from fellow subsidiaries,
associates & joint ventures 648 - - - 153 - - 12 813
Loans and advances to customers 5,857 18,344 65,243 52,884 16,468 13,237 9,601 2,953 184,587 Total 6,457 18,915 66,267 52,884 16,620 13,237 9,601 2,953 186,934 (1) Represents smaller cases predominantly within the commercial mortgages portfolio which are subject to scorecards rather than a rating model.

Detailed Business Review
Risk Management Report continued
40 Santander UK plc 2014 Half Yearly Financial Report
Non-performing loans and advances (1)(2) An analysis of Santander UK’s NPLs is presented below.
30 June 2014
£m 31 December 2013
£m
Loans and advances to customers of which:(2) 188,470 187,048 Customers in Arrears(3) 3,172 3,431 NPLs - impaired(3)(4) 1,643 1,467 NPLs - not impaired(3) 2,048 2,356 Total NPLs 3,691 3,823 Total impairment loss allowances 1,499 1,555 % % Arrears ratio(5) 1.68 1.83 NPL ratio(6) 1.96 2.04 Coverage ratio(7) 41 41 (1) Loans and advances are classified as non-performing as described in the footnotes to the tables on pages 47, 56 and 64 for Mortgage loans, Commercial Banking loans and Corporate Centre
loans, respectively. (2) Loans and advances to customers include social housing loans and finance leases, and exclude trading assets. (3) All balances are UK and continue accruing interest. For the data presented, the balances include interest charged to the customer’s account, but exclude interest accrued but not yet charged
to the account. (4) NPLs against which an impairment loss allowance has been established. (5) Loans and advances to customers in arrears as a percentage of loans and advances to customers. (6) NPLs as a percentage of loans and advances to customers. (7) Impairment loss allowances as a percentage of NPLs.
30 June 2014 compared to 31 December 2013 (unreviewed) During the first half of 2014, the NPL ratio of 1.96% (2013: 2.04%), continued to improve, with retail and corporate loans performing in line with our expectations. The reduction in the NPL ratio resulted largely from improvements in the economic environment and prolonged low interest rates. In Retail Banking, this was coupled with improved collections efficiencies introduced both in 2013 and the first half of 2014, a decrease in mortgage NPLs and increase in mortgage asset, higher credit quality in the newer 1|2|3 Current Account customers and unsecured personal loans. These decreases were partially offset by the increase in NPL stock in Commercial Banking largely due to a single long-standing loan of £89m which moved to non-performance. A successful restructure of this loan is still anticipated and a conservative provision is held against it.
Loans and advances to customers in arrears and the arrears ratio decreased to £3,172m (2013: £3,431m) and 1.68% (2013: 1.83%), respectively, as a result of the improving economy and as Santander UK continued to execute the strategy of exiting problem exposures through sale of the debt or through the realisation of the collateral. This decrease was partially offset by the increase in customers in arrears in Commercial Banking due to the same single long-standing loan noted above. The coverage ratio remained unchanged at 41% (2013: 41%). Ratio of write-offs to average loans (annualised) 30 June 2014
% 31 December 2013
%
Ratio of write-offs to average loans during the period/year 0.29 0.43

Detailed Business Review
Risk Management Report continued
Santander UK plc 2014 Half Yearly Financial Report 41
Concentrations of credit risk exposures The management of risk concentration is a key part of risk management. Santander UK tracks the degree of concentration of its credit risk portfolios using various criteria, including geographic areas and countries, economic sectors, products and groups of customers. Although Santander UK’s operations are based mainly in the UK, it has built up exposures to various entities around the world and is therefore exposed to concentrations of risk related to geographic area. These are further analysed below: Geographic concentrations As part of its approach to credit risk management and risk appetite, Santander UK sets exposure limits to countries and certain geographic areas. These limits are set by Santander UK with reference to the country limits set by Banco Santander, S.A. These are determined according to the classification of the country (whether it is a developed OECD country or not), the rating of the country, its gross domestic product and the type of business activities and products the Banco Santander group wishes to engage in within that country.
The tables below set out the distribution, by geographic area, of loans and advances to banks and customers. 30 June 2014
UK Peripheral
eurozone(1) Rest of
eurozone Rest of Europe US
Rest of world Total
£m £m £m £m £m £m £m Loans and advances to banks 1,882 16 8 12 359 48 2,325 Loans and advances to customers: - Advances secured on residential property 148,436 - - - - - 148,436- Corporate loans 24,236 400 345 635 134 588 26,338- Finance leases 3,189 - - 3 - - 3,192- Other secured advances 2,172 - - - - - 2,172- Other unsecured advances 5,195 - - - - - 5,195- Amounts due from fellow subsidiaries, associates and joint ventures 761 - - - - - 761Loans and advances to customers 183,989 400 345 638 134 588 186,094Total 185,871 416 353 650 493 636 188,419
31 December 2013
UK Peripheral
eurozone(1) Rest of
eurozone Rest of Europe US
Rest of world Total
£m £m £m £m £m £m £m Loans and advances to banks 1,528 68 62 222 415 52 2,347 Loans and advances to customers: - Advances secured on residential property 147,825 - - - - - 147,825 - Corporate loans 22,705 263 157 734 159 817 24,835 - Finance leases 3,106 4 - 4 - - 3,114 - Other secured advances 2,716 - - - - - 2,716 - Other unsecured advances 5,284 - - - - - 5,284 - Amounts due from fellow subsidiaries, associates and joint ventures 813 - - - - - 813 Loans and advances to customers 182,449 267 157 738 159 817 184,587 Total 183,977 335 219 960 574 869 186,934 (1) Peripheral eurozone comprises Cyprus, Greece, Ireland, Italy, Portugal and Spain. For additional geographic information and commentary, see “Country Risk Exposures” on pages 78 to 82.

Detailed Business Review
Risk Management Report continued
42 Santander UK plc 2014 Half Yearly Financial Report
Credit risk exposures by industry As part of its approach to credit risk management and risk appetite, Santander UK sets exposure limits to certain key industry sectors. The tables below set out the distribution, by industry sector, of loans and advances to banks and customers. The data is presented gross of impairment loss allowances, with the total impairment loss allowance shown separately.
(1) Real estate SMEs are included in the ‘Real estate’ column.
For additional industry information, see “Country Risk Exposures” on pages 78 to 82. Forbearance summary The following tables provide a summary of the population of loans and advances to customers which have been subject to forbearance programmes and are included in the previous tables. Discussion and analysis of forbearance activities for mortgages in Retail Banking are set out on page 49. Discussion and analysis of forbearance activities in Commercial Banking and Corporate Centre are set out on pages 57 and 65 respectively. 30 June 2014 Forbearance of NPL Forbearance of non-NPL Total £m £m £m Retail Banking:
- Mortgages 710 3,287 3,997- Unsecured loans 2 4 6- Credit cards 34 - 34- Bank accounts 1 13 14
Commercial Banking 161 666 827Corporate Centre 51 312 363Total 959 4,282 5,241 31 December 2013 Forbearance of NPL Forbearance of non-NPL Total £m £m £m Retail Banking:
- Mortgages 691 3,396 4,087 - Unsecured loans 2 7 9 - Credit cards 33 - 33 - Bank accounts 2 15 17
Commercial Banking 196 728 924 Corporate Centre 58 322 380 Total 982 4,468 5,450
30 June 2014
Social Housing Banks SME(1) Real estate(1) Transport Residential
Cards and unsecured
personal lending Other Total
£m £m £m £m £m £m £m £m £m Loans and advances to banks - 2,325 - - - - - - 2,325Loans and advances to customers: - Advances secured on residential property - - - - - 149,022 - - 149,022 - Corporate loans 5,523 - 10,237 3,369 519 - - 7,098 26,746 - Finance leases - - - - 1,076 - - 2,164 3,240 - Other secured advances - - 881 - - - - 1,480 2,361 - Other unsecured advances - - - - - - 5,463 - 5,463 - Amounts due from fellow subsidiaries,
associates & joint ventures - - - - - - - 761 761
Loans and advances to customers (gross) 5,523 - 11,118 3,369 1,595 149,022 5,463 11,503 187,593 Less: impairment loss allowance (1,499) Loans and advances to customers (net) 186,094 Total 188,419
31 December 2013
Social Housing Banks SME(1) Real estate(1) Transport Residential
Cards and unsecured
personal lending Other Total
£m £m £m £m £m £m £m £m £m Loans and advances to banks - 2,347 - - - - - - 2,347 Loans and advances to customers: - Advances secured on residential property - - - - - 148,418 - - 148,418 - Corporate loans 5,763 - 10,372 3,602 746 - - 4,756 25,239 - Finance leases - - - - 1,110 - - 2,048 3,158 - Other secured advances - - 1,001 - - - - 1,944 2,945 - Other unsecured advances - - - - - - 5,569 - 5,569 - Amounts due from fellow subsidiaries,
associates & joint ventures - - - - - - - 813 813
Loans and advances to customers (gross) 5,763 - 11,373 3,602 1,856 148,418 5,569 9,561 186,142 Less: impairment loss allowance (1,555) Loans and advances to customers (net) 184,587 Total 186,934

Detailed Business Review
Risk Management Report continued
Santander UK plc 2014 Half Yearly Financial Report 43
CREDIT RISK – RETAIL BANKING RESIDENTIAL MORTGAGES In the following chart, gross lending includes both new business and, shown separately, further advances and any flexible mortgage drawdown against available limits. The redemptions and paydowns refer to customer payments, over-payments, clearing mortgage balances or re-financing away from Santander UK. The data excludes accrued interest and is presented gross of impairment loss allowances.
The following is a pictorial representation of the data in the table below.
An analysis of mortgage asset movements during the first half of 2014 is presented below: £m At 1 January 2014 148,079 New business 12,246 Further advances/flexi drawdowns 601 Redemptions/paydowns (12,246) At 30 June 2014 148,680 In addition, during the first half of 2014 there were internal transfers of £8.0bn (six months ended 31 December 2013: £10.1bn; six months ended 30 June 2013: £8.3bn) where we were successful in the targeted retention of customers on new Santander UK mortgages.
148,680
(12,246)12,246
601
148,079
020,00040,00060,00080,000
100,000120,000140,000160,000180,000200,000
At 1 January New Business Further Advances/ Flexi Drawdowns
Redemptions /Paydowns
At 30 June
£m
Mortgage asset movements in the first half of 2014 (unreviewed)

D
R
44
B Incmb
3DBgwcoinstdw P
TeTeStBFlBOT(1(2
3Dpw2
Detailed Business
Risk Manag
4
BORROWE
n the following customers who
mortgaging to Sausiness figures b
0 June 2014 coDuring the first h
uy scheme, unduaranteeing a p
without increasinorresponding dencentive producttrategy to expanuring the first h
which was also in
Product and
erm Product – Fixeerm Product – Tractandard Variable Rase Rate Linked exi(2) uy-to-let
Other otal ) Excludes Buy-to-let
2) In addition, there wSantander UK flexi l
0 June 2014 coDuring the first h
otential borrowewas also reflected
014 (2013: 35%
s Review
gement Rep
ER AND PR
chart, the categomove their morantander UK onbelow.
ompared to 31 half of 2014, theder which Santaproportion of theng the credit riskecrease in the pts ahead of antind this line of bhalf of 2014 at 3nfluenced by red
interest rat
ed Rate cker Rate (‘SVR’) (1)
on SVR of £807m (20were £6,804m (2013:loan product.
ompared to 31 half of 2014, thers’ concerns ovd in the proporti
%).
port continue
RODUCT PR
ory ‘home movertgage to us atly. Internal re-m
December 2013e proportion of nder UK lent £4eir loan, enablingk profile of the leproportion of hicipated increase
business in a con3.07 (2013: 3.04demptions and re
te profile
013: £841m) included £7,469m) of legacy
December 2013he migration awver future interesion of existing c
ed
ROFILE
ers’ includes botht the point they
mortgages, furthe
3 (unreviewed) new business a450m in the perg lenders takingending. In additiome movers. Tes in market intntrolled manner4). There were sepayments. Ove
d in the Buy-to-let line Alliance & Leicester f
3 (unreviewed) way from trackerst rate movemenustomers paying
h existing customy move home. er advances and
arising from firstriod. The Help tog part to offer hoion, the proport
The remortgage erest rates. Buyr. The average esmaller movemerall, the mix was
634
4715152
148e. flexible loan products
r mortgages to nts, and the incrg the standard va
mers moving hoThe category ‘r
d any flexible mo
t-time buyers inco Buy scheme some buyers mortion of remortga trend seen in 2-to-let new bus
earnings multiplents in the mix os relatively stable
30£m
3,232 4,357 7,320 5,319 5,706 2,511
235 8,680
s included in other ca
fixed rate produreased availabilitariable rate decr
Santande
use and taking ore-mortgagers’ cortgages drawdo
creased from 20upports borrowre higher LTV moagers increased f2013 continuediness increased fe of new busine
of buyer type in e, with only a slig
June 2014 % 42 3
32 10 11 2 -
100
tegories as the produ
ucts witnessed ity of competitiveeasing by 3 perc
er UK plc 2014 Half Y
out a new mortcomprises exterowns are not inc
0% to 22% drivwers who have s
ortgages (from 8from 28% to 29d, as borrowers from 3% to 4%ess (at inceptionthe mortgage aght decrease in
£m 56,672 5,956
51,490 15,260 16,245 2,201
255 148,079
uct flexibility is more
in 2013 continuely priced fixed rcentage points t
Yearly Financial Report
gage with us, annal customers rcluded in the ne
ven by the Help maller deposits 80% to 95% LT9%, balanced by seek to move
%, in line with tn) remained stabasset stock figurethe remortgage
31 December 20
1
limited than the curr
ued. This reflectrate products. Thto 32% at 30 Ju
t
nd re-ew
to by
TV) y a to he ble es, rs.
013 % 39 4
35 10 11 1 -
00
ent
ed his ne

Detailed Business Review
Risk Management Report continued
Santander UK plc 2014 Half Yearly Financial Report 45
GEOGRAPHIC DISTRIBUTION The new business data in the following tables corresponds to new business originated during each of the reported periods. For the first half of 2014, the Council of Mortgage Lenders (‘CML’) new business data in the table below covers the three months ended 31 March 2014, due to timing of data availability. For 2013, the CML new business data covers the twelve months ended 31 December 2013. The percentage shown is on a value weighted basis.
30 June 2014 Stock New business
(unreviewed) CML new business
UK Region % % % North East 3 3 3 North West 8 7 7 Yorkshire and the Humber 5 5 6 East Midlands 4 4 6 West Midlands 6 5 6 East of England 4 4 3 Greater London 27 31 23 South East excluding Greater London 24 25 28 South West 8 9 8 Wales 3 2 3 Scotland 5 4 6 Northern Ireland 3 1 1 100 100 100
31 December 2013
Stock New business (unreviewed)
CML new business UK Region % % % North East 3 2 3 North West 8 7 7 Yorkshire and the Humber 5 5 6 East Midlands 4 4 6 West Midlands 6 5 6 East of England 4 4 3 Greater London 27 32 23 South East excluding Greater London 24 25 27 South West 8 9 8 Wales 3 2 3 Scotland 5 4 7 Northern Ireland 3 1 1 100 100 100
30 June 2014 compared to 31 December 2013 (unreviewed) Geographically, whilst Santander UK has a diverse footprint across the UK, our mortgage exposure continues to reflect a concentration around the South East including Greater London, representing approximately half the value of the total portfolio. The concentration is a result of both the natural effect of a greater housing density and higher than average house prices in this area, coupled with a new business market share around 10% higher than the industry average as a whole.
During the first half of 2014, the mortgage asset stock distribution by region was broadly unchanged, whilst for new business there was a marginal decrease in the proportion of lending in Greater London. Exposures to larger loans Exposures to larger loans across the UK remain at a low level with the total mortgage asset stock of larger mortgage loans at 30 June 2014 and 31 December 2013, as follows:
Stock South East including Greater London UK 30 June 2014 31 December 2013 30 June 2014 31 December 2013 Individual mortgage loan size £m £m £m £m £0.5m - £1m 4,530 3,809 5,449 4,683 £1m - £2m 627 461 685 510 > £2m 86 59 93 66
Average loan size for new business The average loan size for new business during the six months ended 30 June 2014 and the year ended 31 December 2013 was as follows:
New business Six months ended
30 June 2014 Year ended
31 December 2013 UK Region £’000 £’000 South East including Greater London 226 205 Rest of the UK 123 118 UK as a whole 166 155

Detailed Business Review
Risk Management Report continued
46 Santander UK plc 2014 Half Yearly Financial Report
LOAN-TO-VALUE ANALYSIS
The following table sets out the Loan-to-Value distribution for mortgage asset stock, non-performing stock and new business. The LTV calculation includes fees added to the loan, and, where the product is on flexible terms, only includes the drawn loan amount, not undrawn limits. The valuation is based on the results of an automated valuation modelling or HPI indexed values, as appropriate. This re-valuation of the book is undertaken on a quarterly basis.
Of the loans in negative equity, the total which is effectively uncollateralised, before taking account of any loan loss allowances, was £640m at 30 June 2014 (2013: £838m). The collateral value shown excludes the impact of over-collateralisation i.e. where the collateral held is of a higher value than the loan balance outstanding.
30 June 2014 Stock of which:
% NPL Stock
% New Business
% <=50% 32 21 17 >50 - 55% 7 5 5 >55 - 60% 8 6 6 >60 - 65% 9 7 7 >65 - 70% 10 7 11 >70 - 75% 9 8 13 >75 - 80% 7 8 16 >80 - 85% 6 8 10 >85 - 90% 4 6 11 >90 - 95% 3 6 4 >95 - 100% 2 4 - > 100% i.e. negative equity 3 14 - 100 100 100 Collateral value of residential properties(1) £148,040m £2,572m £12,246m % % % Simple average(2) loan-to-value (indexed) 49 57 65 Value weighted average(3) loan-to-value (indexed) 45 52 60 31 December 2013 Stock of which:
% NPL Stock
% New Business
% <=50% 29 18 19 >50 - 55% 7 4 6 >55 - 60% 7 5 6 >60 - 65% 9 6 8 >65 - 70% 10 6 12 >70 - 75% 9 8 14 >75 - 80% 8 8 13 >80 - 85% 7 8 10 >85 - 90% 5 8 12 >90 - 95% 3 6 - >95 - 100% 2 6 - > 100% i.e. negative equity 4 17 - 100 100 100 Collateral value of residential properties(1) £147,241m £2,678m £17,234m % % % Simple average(2) loan-to-value (indexed) 51 61 62 Value weighted average(3) loan-to-value (indexed) 47 57 58 (1) Includes collateral against loans in negative equity of £4,190m at 30 June 2014 (2013: £5,394m). (2) Unweighted average of loan-to-value of all accounts. (3) Sum of all loan values divided by sum of all valuations. 30 June 2014 compared to 31 December 2013 (unreviewed) During the first half of 2014, the LTV profile of new business marginally shifted towards higher LTVs primarily as a consequence of the positive market conditions and propositions such as the UK Government’s Help to Buy scheme. The Help to Buy scheme was a significant factor in the increase of 90% to 95% LTV new business from 0% to 4% in the period, in line with our plans.
During the first half of 2014, the LTV profile of mortgage asset stock improved primarily as a result of house price increases, although there were regional variations, as well as the effect of regular capital repayments. House price increases positively impacted LTV by more than 1% in the Midlands, East and South East of England, Northern Ireland and Greater London.
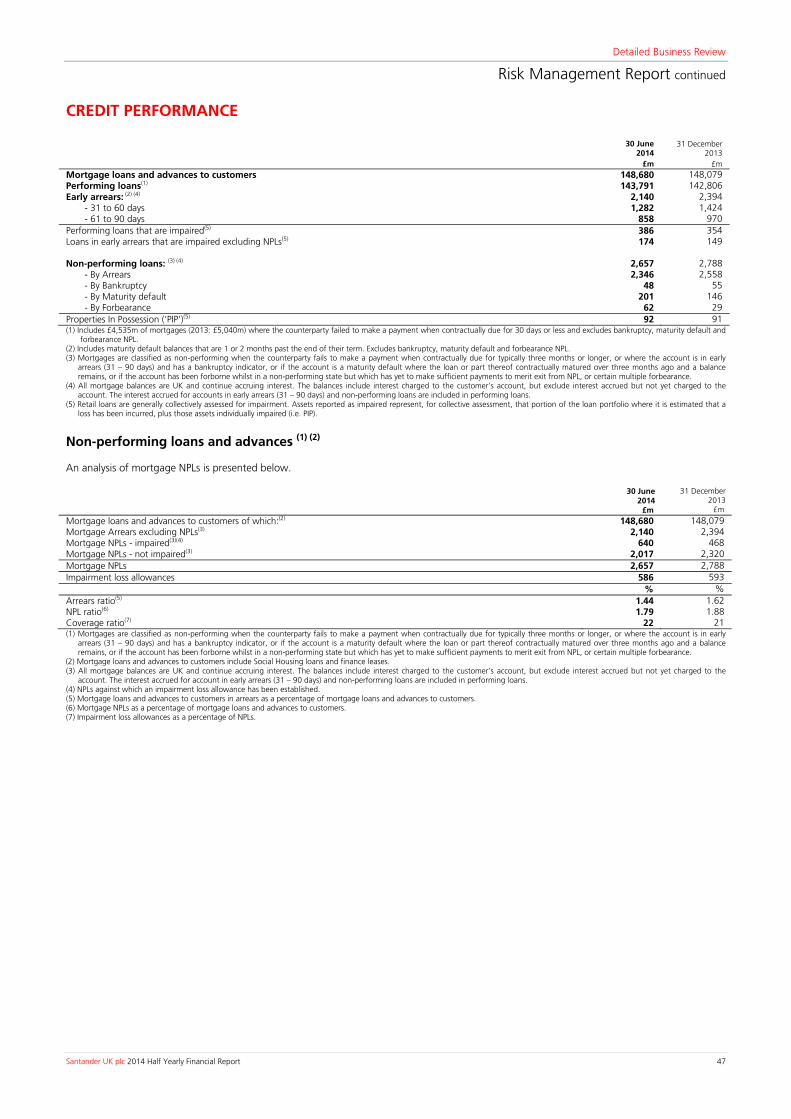
Detailed Business Review
Risk Management Report continued
Santander UK plc 2014 Half Yearly Financial Report 47
CREDIT PERFORMANCE
30 June 2014
31 December 2013
£m £m Mortgage loans and advances to customers 148,680 148,079 Performing loans(1) 143,791 142,806 Early arrears: (2) (4) 2,140 2,394
- 31 to 60 days 1,282 1,424 - 61 to 90 days 858 970
Performing loans that are impaired(5) 386 354 Loans in early arrears that are impaired excluding NPLs(5) 174 149 Non-performing loans: (3) (4) 2,657 2,788
- By Arrears 2,346 2,558 - By Bankruptcy 48 55 - By Maturity default 201 146 - By Forbearance 62 29
Properties In Possession (‘PIP’)(5) 92 91 (1) Includes £4,535m of mortgages (2013: £5,040m) where the counterparty failed to make a payment when contractually due for 30 days or less and excludes bankruptcy, maturity default and
forbearance NPL. (2) Includes maturity default balances that are 1 or 2 months past the end of their term. Excludes bankruptcy, maturity default and forbearance NPL. (3) Mortgages are classified as non-performing when the counterparty fails to make a payment when contractually due for typically three months or longer, or where the account is in early
arrears (31 – 90 days) and has a bankruptcy indicator, or if the account is a maturity default where the loan or part thereof contractually matured over three months ago and a balance remains, or if the account has been forborne whilst in a non-performing state but which has yet to make sufficient payments to merit exit from NPL, or certain multiple forbearance.
(4) All mortgage balances are UK and continue accruing interest. The balances include interest charged to the customer’s account, but exclude interest accrued but not yet charged to the account. The interest accrued for accounts in early arrears (31 – 90 days) and non-performing loans are included in performing loans.
(5) Retail loans are generally collectively assessed for impairment. Assets reported as impaired represent, for collective assessment, that portion of the loan portfolio where it is estimated that a loss has been incurred, plus those assets individually impaired (i.e. PIP).
Non-performing loans and advances (1) (2) An analysis of mortgage NPLs is presented below.
30 June 2014
£m
31 December 2013
£m Mortgage loans and advances to customers of which:(2) 148,680 148,079 Mortgage Arrears excluding NPLs(3) 2,140 2,394 Mortgage NPLs - impaired(3)(4) 640 468 Mortgage NPLs - not impaired(3) 2,017 2,320 Mortgage NPLs 2,657 2,788 Impairment loss allowances 586 593 % % Arrears ratio(5) 1.44 1.62 NPL ratio(6) 1.79 1.88 Coverage ratio(7) 22 21 (1) Mortgages are classified as non-performing when the counterparty fails to make a payment when contractually due for typically three months or longer, or where the account is in early
arrears (31 – 90 days) and has a bankruptcy indicator, or if the account is a maturity default where the loan or part thereof contractually matured over three months ago and a balance remains, or if the account has been forborne whilst in a non-performing state but which has yet to make sufficient payments to merit exit from NPL, or certain multiple forbearance.
(2) Mortgage loans and advances to customers include Social Housing loans and finance leases. (3) All mortgage balances are UK and continue accruing interest. The balances include interest charged to the customer’s account, but exclude interest accrued but not yet charged to the
account. The interest accrued for account in early arrears (31 – 90 days) and non-performing loans are included in performing loans. (4) NPLs against which an impairment loss allowance has been established. (5) Mortgage loans and advances to customers in arrears as a percentage of mortgage loans and advances to customers. (6) Mortgage NPLs as a percentage of mortgage loans and advances to customers. (7) Impairment loss allowances as a percentage of NPLs.

Detailed Business Review
Risk Management Report continued
48 Santander UK plc 2014 Half Yearly Financial Report
Movements in NPLs during the period are set out in the graph below. > ‘Transfers in’ represent loans which have become classified as NPLs during the year, comprising: > Entries: cases where the arrears increased to 91 days or more past due, specific types of maturity default, bankruptcy or
forbearance; and > Policy entries: cases that entered the NPL classification due to a change in policy in the year.
> ‘Transfers out’ represent loans which have left the NPL classification during the year, comprising: > Exits: cases where the arrears reduced to less than 91 days past due, as well as loan repayments/redemptions; and > PIP exits: cases that moved from non-performing and into possession, including any written-off portion. Write-offs represent the
unrecovered element of a loan where recovery options, including realisation of any collateral, have been exhausted.
Forbearance activity does not result in a change in the NPL status. The following is a pictorial representation of the data in the table below.
An analysis of the NPL movements during the first half of 2014 is presented below: £m At 1 January 2014 2,788 Transfers in to NPL: - Entries 772 - Policy entries 24 Transfers out of NPL: - PIP exits (100) - Exits (827) At 30 June 2014 2,657 30 June 2014 compared to 31 December 2013 (unreviewed) During the first half of 2014, the mortgage asset NPL stock decreased to £2,657m (2013: £2,788m). This reduction resulted largely from improvements in the economic environment and prolonged low interest rates, coupled with improved collections efficiencies introduced both in 2013 and the first half of 2014. The mortgage NPL ratio decreased to 1.79% at 30 June 2014 (2013: 1.88%) reflecting a decrease in mortgage NPLs and increase in mortgage asset. The decrease in mortgage NPLs reflected the good credit quality of the portfolio, supported by the improving economic environment for UK households, with low interest rates, rising house prices and falling unemployment. We remain aware that these trends may not continue and we take account of this in setting our provisions. There was a small increase in mortgage NPLs on maturity defaults (i.e. interest-only mortgages that remain outstanding more than 90 days after contractual maturity), in line with our expectations.
The improving economy also helped to contribute to a reduction in the level of early arrears (31-90 days), as well as in the proportion of impaired loans. However, the economic recovery remains at an early stage, and a conservative stance was therefore maintained in the provisioning policy. This included allowances made for losses which could stem from factors including regional variation in the risk profile, changes to regulation and contractual maturity defaults. In the first half of 2014, interest income recognised on impaired loans amounted to £42m (six months ended 30 June 2013: £43m).
2,657
24
(827)
2,788
0
1,000
2,000
3,000
4,000
5,000
At 1 January Entries Policy entries PIP exits Exits At 30 June
£m
NPL movements in the first half of 2014 (unreviewed)
Transfer outTransfer in
(100)772

Detailed Business Review
Risk Management Report continued
Santander UK plc 2014 Half Yearly Financial Report 49
FORBEARANCE Forbearance commenced during the period/year (1) (2) The balances that entered forbearance during the period ended 30 June 2014 and year ended 31 December 2013 analysed by type of forbearance applied, were: 30 June 2014 30 June 2014 31 December 2013 31 December 2013 £m % £m % Capitalisation 141 41 130 31 Term extensions 137 40 168 39 Interest-only 63 19 128 30 341 100 426 100 (1) Mortgages are included within the period/year that they were forborne. (2) The figures by period/year reflect the amount of forbearance activity undertaken during the period/year irrespective of whether any forbearance activity has previously been undertaken on the
forborne accounts.
Forbearance cumulative position a) Performance status when entering forbearance The forborne balances at 30 June 2014 and 31 December 2013 when they originally entered forbearance, analysed by type of forbearance applied, were: 30 June 2014(1) Capitalisation Term extension Interest-only Total
£m £m £m £m Forbearance of NPL 311 85 314 710 Forbearance of Non-NPL 1,387 858 1,042 3,287 Total 1,698 943 1,356 3,997
31 December 2013(1) Capitalisation Term extension Interest-only Total
£m £m £m £m Forbearance of NPL 290 77 324 691 Forbearance of Non-NPL 1,426 892 1,078 3,396 Total 1,716 969 1,402 4,087 (1) Forbearance type categorisation is based on the first forbearance activity undertaken on the accounts. Tables contain only open accounts at the end of the period/year.
b) Performance status at the period/year-end The forborne balances analysed by type of forbearance applied at 30 June 2014 and 31 December 2013 were: 30 June 2014(1)
Capitalisation Term extension Interest-only Total Impairment
allowance £m £m £m £m £m
In arrears (including NPLs) 453 162 445 1,060 71Performing (2) 1,245 781 911 2,937 42Total 1,698 943 1,356 3,997 113Proportion of portfolio 1.1% 0.6% 0.9% 2.7% -
31 December 2013(1)
Capitalisation Term extension Interest-only Total Impairment
allowance £m £m £m £m £m
In arrears (including NPLs) 499 181 495 1,175 68Performing (2) 1,217 788 907 2,912 62Total 1,716 969 1,402 4,087 130Proportion of portfolio 1.2% 0.7% 0.9% 2.8% -
(1) Forbearance type categorisation is based on the first forbearance activity undertaken on the accounts. Tables contain only open accounts at the end of the period/year. (2) Where a loan has been classed as performing it will be continue to be classed as forborne for the duration of the life of the account.

Detailed Business Review
Risk Management Report continued
50 Santander UK plc 2014 Half Yearly Financial Report
30 June 2014 compared to 31 December 2013 (unreviewed) The average monthly level of forbearance commenced in the first half of 2014 increased due to a higher level of capitalisations. The level of capitalisations increased due to improvements in the efficiency of the capitalisation process, enabling decisions on capitalisation to be made more rapidly, but the levels of inflows were still significantly below that observed prior to 2013.
At 30 June 2014, the stock of mortgage accounts that had their term extended or converted to interest-only was relatively stable, amounting to 1.5% of all mortgage accounts by value (2013: 1.6%).
Levels of adherence to revised payment terms agreed under Santander UK’s forbearance arrangements improved during the first half of 2014 to approximately 78% by value (2013: 75%) and 79% by volume (2013: 77%) of the accounts in forbearance. The high percentage of these accounts performing supports Santander UK’s view that its forbearance arrangements provide an important tool to improve the prospects of recovery of amounts owed. In addition, it is likely that some of the accounts which were in early arrears at the time of the initial forbearance would have otherwise deteriorated into a non-performing state.
At 30 June 2014, the proportion of accounts that had been in forbearance for more than six months that had made their last six months’ contractual payments increased slightly to 83% (2013: 82%). Furthermore, the accounts in forbearance classified as performing remained stable at just over £2.9bn or 73.5% by value (2013: £2.9bn or 71% by value). The weighted average LTV of all accounts in forbearance was 39.8% (2013: 42.0%) compared to the weighted average portfolio LTV of 43.6% (2013: 46.7%). Those accounts that reach the end of the concessionary forbearance period continue to show a good propensity to return to full repayments in accordance with the original contractual terms after the period of financial difficulty has passed.
At 30 June 2014, impairment loss allowances as a percentage of the balance of accounts for the overall mortgage portfolio was 0.39% (2013: 0.40%). The equivalent ratio for accounts in forbearance which were performing was 1.42% (2013: 2.13%), and for accounts in forbearance which were in arrears was 6.68% (2013: 5.79%). The higher ratios for accounts in forbearance reflected the higher levels of impairment loss allowances held, as a result of the higher risk characteristics inherent in such accounts.
Multiple forbearance is intended to recognise when an agreed plan to mitigate the customer’s financial difficulty has failed and an alternative plan is required. Customers that have more than one forbearance event in a given year or more than three events in any rolling five year period are classified as multiple forbearance. At 30 June 2014, the carrying value of mortgage loans classified as multiple forbearance increased to £78m (2013: £67m) mainly due to increased capitalisation activities and on-going activities on interest-only accounts that have reached maturity with a balance still remaining. Other changes in contractual terms In addition, £6.8bn (2013: £7.3bn) of loans have been modified since January 2008. On these accounts, the modifications are not considered to have been forbearance as the borrowers were not exhibiting signs of being in financial difficulty. These modifications were entered into in order to retain the customer relationship. The performance and profile of the additional modifications is kept under review. At 30 June 2014: > The average LTV was 46% (2013: 49%) and 96% (2013: 93%) of accounts had paid their contractual monthly payment during the
previous six months.
> The proportion of accounts three or more monthly payments in arrears was 1.65% (2013: 1.68%), which continued to be consistent with the rest of the portfolio.
Financial assets that would otherwise be past due or impaired At 30 June 2014, the carrying amount of financial assets that would otherwise be past due or impaired whose terms have been forborne was £2,952m (2013: £2,930m).

Detailed Business Review
Risk Management Report continued
Santander UK plc 2014 Half Yearly Financial Report 51
HIGHER RISK LOANS AND OTHER SEGMENTS OF PARTICULAR INTEREST
There are some mortgage types of particular interest or which present higher risks than others. These mortgages consist of: > Interest-only loans; > Flexible loans; > Loans with loan-to-value >100%; and > Buy-to-let loans. The arrears performance of these mortgages has continued to be relatively stable during the first half of 2014 with arrears and loss rates remaining low. Borrower profile (1) 30 June 2014 Stock New Business
£m £m Full interest-only loans 47,446 1,459 Part interest-only, part repayment loans(2) 15,442 1,370 Flexi loans 15,706 416 Other flexible loans(3) 6,804 - Loans with current LTV > 100% 4,830 - Buy-to-let 2,511 445 Interest-only and >100% current LTV 3,457 - 31 December 2013 Stock New Business
£m £m Full interest-only loans 49,318 2,151 Part interest-only, part repayment loans(2) 15,534 1,693 Flexi loans 16,245 1,172Other flexible loans(3) 7,469 - Loans with current LTV > 100% 6,202 1 Buy-to-let 2,201 432 Interest-only and >100% current LTV 4,336 - (1) Where a loan exhibits more than one of the criteria, it is included in all the applicable categories. (2) Mortgage balance includes both the interest-only element of £10,686m (2013: £9,564m) and the non-interest only element of the loan. (3) Legacy Alliance & Leicester flexible loan products with more limited flexibility than the current Santander UK flexi loan product. 30 June 2014 compared to 31 December 2013 (unreviewed) The proportion of new business in the first half of 2014 that was pure interest-only remained stable at 12% (2013: 12%). Lending with a mixture of interest-only and capital and interest repayment increased from 10% to 11%, continuing the trend from 2013 as the maximum allowable LTV for this type of lending was increased to 75% towards the end of 2012 whilst maintaining the maximum allowable LTV for the interest-only element of the mortgage at 50%.
The proportion of flexible loans new business decreased to 3% (2013: 7%), whilst Buy-to-let lending in the first half of 2014 increased slightly to 3.6% (2013: 2.5%) in line with the strategy to expand this line of business in a controlled manner.
From a mortgage asset stock perspective, loans with a current LTV greater than 100% decreased to 3% (2013: 4%) driven by improving house prices.

Detailed Business Review
Risk Management Report continued
52 Santander UK plc 2014 Half Yearly Financial Report
Credit performance 30 June 2014 Segment of particular interest (1)
Total Interest -only (2)
Flexible Loans (3)
Loan to Value > 100% Buy-to-let
Other Portfolio (4)
£m £m £m £m £m £m Mortgage portfolio 148,680 62,888 22,510 4,830 2,511 75,093Performing 143,791 59,922 22,070 4,234 2,474 73,521Early arrears:
- 31 to 60 days 1,282 761 90 105 10 491- 61 to 90 days 858 516 65 82 6 321
Non-performing loans 2,657 1,629 280 367 20 742NPL ratio 1.79% 2.59% 1.24% 7.60% 0.80% 0.99%Properties in possession 92 60 5 42 1 18 31 December 2013 Segment of particular interest (1)
Total Interest -only (2)
Flexible Loans (3)
Loan to Value > 100% Buy-to-let
Other Portfolio (4)
£m £m £m £m £m £m Mortgage portfolio 148,079 64,852 23,714 6,202 2,201 71,554 Performing 142,806 61,644 23,260 5,442 2,161 69,872 Early arrears:
- 31 to 60 days 1,424 837 111 140 11 538 - 61 to 90 days 970 585 69 107 7 355
Non-performing loans 2,788 1,723 269 471 21 773 NPL ratio 1.88% 2.66% 1.13% 7.59% 0.95% 1.08% Properties in possession 91 63 5 42 1 16 (1) Where a loan exhibits more than one segment of particular interest, it is included in all applicable categories. As a result, the sum of the mortgage arrears in the segments of particular
interest will not agree to the total mortgage arrears. (2) Interest-only loan segment contains both full interest-only and part-interest-only loans. (3) Includes legacy Alliance & Leicester flexible loan products with more limited flexibility than the current Santander UK flexi loan product. (4) Includes other loans that are not in any segment of particular interest.
30 June 2014 compared to 31 December 2013 (unreviewed) At 30 June 2014, the NPL ratio decreased from 1.88% to 1.79% due to a reduction in NPL stock. Interest-only and loans with a current LTV over 100% have a higher than average NPL ratio. The decrease in the NPL ratio for interest-only loans in the first half of 2014 was in line with the overall reduction in NPL stock. The NPL ratio for loans with an LTV > 100% increased slightly in the first half of 2014 due to a reduction in stock in this segment driven by the house prices increases. The buy-to-let portfolio remained better than average quality, as did the flexible loans portfolio.
A flexible mortgage loan permits customers to “drawdown” additional funds at any time up to a predefined credit limit. By utilising the drawdown on their available funds customers are able to vary their monthly payments, or take payment holidays. A customer’s ability to drawdown is subject to certain predetermined conditions, as described on page 80 of the 2013 Annual Report. Customer limits are actively managed where information collected suggests the predefined limit requires adjustment.
During the first half of 2014, the stock of properties in possession increased slightly, although the underlying trend of possession stock is improving due to favourable market conditions. Forbearance (1) (2) (3) (4)
The incidence of the main types of higher risk loans forbearance arrangements which commenced during the six months ended 30 June 2014 and year ended 31 December 2013 was: 30 June 2014 Interest-only(4) Flexible loans Loan to Value >100% Buy-to-let Total value £206m £36m - £2m Proportion of portfolio(5) 60% 10% - 1% 31 December 2013 Interest-only(4) Flexible loans Loan to Value >100% Buy-to-let Total value £242m £61m - £3m Proportion of portfolio(5) 57% 14% - 1% (1) Mortgages are included within the period/year that they were forborne. (2) The figures by year period/reflect the amount of forbearance activity undertaken during the period/year irrespective of whether any forbearance activity has previously been undertaken on
the forborne accounts. (3) Where a loan exhibits more than one of the higher risk criteria, it is included in all the applicable categories. (4) Loans which are either full interest only or partial interest only are included. (5) Portfolio of total forbearance arrangements which commenced during the period/year.
30 June 2014 compared to 31 December 2013 (unreviewed) The values of higher risk loan entering forbearance arrangements in the first half of 2014 compared to 2013 decreased in line with overall reductions seen in flows into forbearance during the period.
During the first half of 2014, the proportion of loans entering forbearance arrangements defined as higher risk from interest-only loans increased, and from flexible loans decreased. The mix of forbearance arrangements shifted slightly due to factors such as the increased level of capitalisations described on page 50. This led to a slightly higher proportion of forbearance arrangements being granted to interest-only loans in the first half of 2014 compared to 2013.

Detailed Business Review
Risk Management Report continued
Santander UK plc 2014 Half Yearly Financial Report 53
BANKING AND CONSUMER CREDIT Santander UK may also provide borrowing facilities by way of overdraft as part of bank accounts, together with unsecured personal loans, credit cards, consumer finance, including finance leases and other forms of consumer finance, and business banking lending. LENDING An analysis of movements in banking and consumer credit loans and advances is presented below.
30 June 2014 Bank Accounts
£m
Unsecured Personal Loans
£m
Credit Cards
£m
Consumer Finance
£m
Business Banking
£m Total
£m At 1 January 543 2,016 1,679 3,145 151 7,534 Net lending in the period/year (39) 163 226 70 5 425 At 30 June 504 2,179 1,905 3,215 156 7,959
31 December 2013 Bank
Accounts £m
Unsecured Personal Loans
£m
Credit Cards
£m
Consumer Finance
£m
Business Banking
£m Total
£m At 1 January 536 2,344. 1,420 3,109 133 7,542. Net lending in the year 7 (328) 259 36 18 (8) At 31 December 543 2,016. 1,679 3,145 151 7,534.
30 June 2014 compared to 31 December 2013 (unreviewed) Total net lending increased by £425m (5.6%) in the first half of 2014, largely in line with our loyalty strategy, due to increases in unsecured personal loans and credit cards, driven by competitively priced products in unsecured personal loans and strong balance transfer and purchase promotion products in credit cards. CREDIT PERFORMANCE 30 June 2014 Bank
Accounts Unsecured
Personal Loans Credit Cards
Consumer Finance
Business Banking Total
£m £m £m £m £m £m Loans and Advances 504 2,179 1,905 3,215 156 7,959 Performing 448 2,113 1,838 3,193 143 7,735 In arrears 24 40 27 6 4 101 Non-performing loans: (1) (2) 32 26 40 16 9 123 - NPLs that are impaired 17 23 35 12 5 92 - NPLs that are not impaired 15 3 5 4 4 31 Impairment loss allowance 47 84 79 87 18 315 NPL ratio (2) 1.55%Coverage ratio (3) 256%
31 December 2013 Bank
Accounts Unsecured
Personal Loans Credit Cards
Consumer Finance
Business Banking Total
£m £m £m £m £m £m Loans and Advances 543 2,016 1,679 3,145 151 7,534 Performing 471 1,936 1,609 3,121 131 7,268 In arrears 28 47 29 9 5 118 Non-performing loans: (1) (2) 44 33 41 15 15 148 - NPLs that are impaired 26 29 38 11 8 112 - NPLs that are not impaired 18 4 3 4 7 36 Impairment loss allowance 51 90 86 85 16 328 NPL ratio (2) 1.96% Coverage ratio (3) 222% (1) Banking and consumer credit lending is classified as non-performing when the customer fails to make a payment when contractually due for three months or longer, or where it is deemed
probable that this will occur in the near future or for accounts where fees and interest have been suspended. (2) NPL ratio is the NPL stock as a % of total loans and advances. (3) The coverage ratio is the total impairment loss allowances, as a % of NPL stock. Total loan loss allowances relate to early arrears and performing assets as well as accounts classified as NPL
and hence the ratio exceeds 100%.
30 June 2014 compared to 31 December 2013 (unreviewed) During the first half of 2014, the value of NPLs decreased by 17% to £123m (2013: £148m) and the NPL ratio decreased by 41 basis points to 1.55% (2013: 1.96%). The main drivers of these improvements were bank accounts, reflecting the higher credit quality of 1|2|3 Current Account customers and unsecured personal loans that continued to benefit from the sustained improvement in the credit quality of new business. This was driven by the competitive pricing in unsecured personal loans and strong balance transfer and purchase promotion products in credit cards being attractive to customers of high credit worthiness.

Detailed Business Review
Risk Management Report continued
54 Santander UK plc 2014 Half Yearly Financial Report
CREDIT RISK – COMMERCIAL BANKING In Commercial Banking, credit risk arises on asset balances and on committed off-balance sheet transactions such as credit facilities or guarantees. Consequently, committed exposures are typically higher than asset balances. However, in the following committed exposures tables, Sovereigns are presented net of short positions and include Sovereign exposures established for liquidity management purposes managed by Short Term Markets on behalf of Corporate Centre. Large Corporate reverse repos are presented net of repo liabilities and include OTC derivatives. As a result, the committed exposures are smaller than the asset balances recognised on the balance sheet.
COMMERCIAL BANKING - COMMITTED EXPOSURES Rating distribution The rating distribution tables show the credit risk exposure by Santander UK’s internal rating scale (see ‘Credit Quality’ on page 39) for each portfolio within Commercial Banking. Within this scale, the higher the rating, the better the quality of the counterparty. 30 June 2014
Sovereign and Supranational(2)
£m
Large Corporate
£m
Structured Finance
£m
Mid Corporate and SME
£m
Commercial Real Estate
£m Social Housing
£m Total
£m 9 1,483 3 - 95 1 339 1,921 8 3,723 2,009 - 642 299 385 7,058 7 680 4,108 29 2,356 793 219 8,185 6 - 5,297 5 5,736 5,045 90 16,173 5 - 1,657 15 3,620 3,199 - 8,491 4 - 117 78 2,470 696 - 3,361 1 to 3 - 98 109 430 275 - 912 Other (1) - - - 422 116 - 538 Total 5,886 13,289 236 15,771 10,424 1,033 46,639 31 December 2013
Sovereign and Supranational(2)
£m
Large Corporate
£m
Structured Finance
£m
Mid Corporate and SME
£m
Commercial Real Estate
£m Social Housing
£m Total
£m 9 1,296 24 - 200 127 263 1,910 8 3,893 1,450 - 531 320 359 6,553 7 860 4,083 30 2,248 1,447 231 8,899 6 - 4,382 6 5,292 4,263 115 14,058 5 - 1,722 40 2,633 2,737 - 7,132 4 - 22 72 2,410 683 - 3,187 1 to 3 - 1 136 247 324 - 708 Other (1) - - 24 518 144 - 686 Total 6,049 11,684 308 14,079 10,045 968 43,133 (1) Represents smaller exposures predominantly within the commercial mortgages portfolio which are subject to scorecards rather than a rating model. (2) An international organisation, whereby member states transcend national boundaries or interests to share in the decision-making and vote on issues pertaining to the geographical focus of the
organisation.
Geographical distribution The geographic location is classified by country of risk, being the country where each counterparty’s main business activity or assets are located. For clients whose operations are more geographically dispersed, the country of incorporation is applied. 30 June 2014 Sovereign and
Supranational(1) £m
Large Corporate
£m
Structured Finance
£m
Mid Corporate and SME
£m
Commercial Real Estate
£m Social Housing
£m Total
£m UK - 9,435 84 15,488 10,424 1,033 36,464 Peripheral eurozone 680 693 19 8 - - 1,400 Rest of Europe 1,191 2,238 71 237 - - 3,737 US - 364 62 4 - - 430 Rest of world 4,015 559 - 34 - - 4,608 Total 5,886 13,289 236 15,771 10,424 1,033 46,639 31 December 2013 Sovereign and
Supranational(1) £m
Large Corporate
£m
Structured Finance
£m
Mid Corporate and SME
£m
Commercial Real Estate
£m Social Housing
£m Total
£m UK - 8,685 108 13,836 10,045 968 33,642 Peripheral eurozone 860 411 20 18 - - 1,309 Rest of Europe 1,029 1,736 75 87 - - 2,927 US - 320 105 - - - 425 Rest of world 4,160 532 - 138 - - 4,830 Total 6,049 11,684 308 14,079 10,045 968 43,133 (1) An international organisation, whereby member states transcend national boundaries or interests to share in the decision-making and vote on issues pertaining to the geographical focus of the
organisation. 30 June 2014 compared to 31 December 2013 (unreviewed) During the first half of 2014, total committed exposures increased by £3.5bn or 8% to £46.6bn principally within the Large Corporate, and Mid Corporate and SME portfolios.
Large Corporate exposures increased by 14% as a result of the development of the franchise focused in high-rated multinational companies. Growth was focused on the UK and other European countries with counterparties with good credit quality and primarily reflects the provision of financial products to support the working capital and liquidity needs of our clients.
The Mid Corporate and SME portfolio grew by 12%, reflecting the continued development of the franchise especially in the SME segment. This was reflected in the rise in the mid-range rating bands as this is where counterparties in this segment typically rate.

Detailed Business Review
Risk Management Report continued
Santander UK plc 2014 Half Yearly Financial Report 55
COMMERCIAL BANKING - CREDIT RISK MITIGATION At 30 June 2014, collateral held against impaired loans amounted to 39% (2013: 47%) of the carrying amount of impaired loan balances.
COMMERCIAL BANKING – CREDIT PERFORMANCE Exposures exhibiting potentially higher risk characteristics are subject to risk monitoring under the Watchlist process (described in “The Credit Cycle” section under “Risk monitoring” on page 76 of the 2013 Annual Report). The table below sets out the portfolio showing exposures subject to risk monitoring under the Watchlist process and those classified as non-performing by portfolio at 30 June 2014 and 31 December 2013: 30 June 2014 Sovereign and
Supranational(7) £m
Large Corporate
£m
Structured Finance
£m
Mid Corporate and SME
£m
Commercial Real Estate
£m
Social Housing
£m Total
£m Total Committed Exposure of which:(1) 5,886 13,289 236 15,771 10,424 1,033 46,639
-Watchlist: Enhanced Monitoring - 448 77 854 381 30 1,790 -Watchlist: Proactive Management - - 70 486 193 - 749 -Remaining Performing Exposure 5,886 12,841 73 14,033 9,510 1,003 43,346
Subtotal Performing Exposure 5,886 13,289 220 15,373 10,084 1,033 45,885 Non-Performing Exposure(2) - - 16 398 340 - 754 Total Impaired Exposure of which: (3) - - 140 1,738 914 30 2,822
-Performing – Watchlist - - 124 1,340 574 30 2,068 -Non-Performing Exposure(2) - - 16 398 340 - 754
Total Observed impairment loss allowances of which:(4)
- - 52 161 120 - 333
-Performing – Watchlist - - 45 21 20 - 86-Non-Performing Exposure(2) - - 7 140 100 - 247
IBNO(5)(6) 24 Total Impairment loss allowance 357 31 December 2013 Sovereign and
Supranational(7) £m
Large Corporate
£m
Structured Finance
£m
Mid Corporate and SME
£m
Commercial Real Estate
£m
Social Housing
£m Total
£m Total Committed Exposure of which:(1) 6,049 11,684 308 14,079 10,045 968 43,133
-Watchlist: Enhanced Monitoring - 231 52 629 295 35 1,242 -Watchlist: Proactive Management - - 132 288 357 - 777 -Remaining Performing Exposure 6,049 11,453 105 12,821 9,074 933 40,435
Subtotal Performing Exposure 6,049 11,684 289 13,738 9,726 968 42,454 Non-Performing Exposure(2) - - 19 341 319 - 679 Total Impaired Exposure of which: (3) - - 203 1,259 970 35 2,467
-Performing – Watchlist - - 184 918 651 35 1,788 -Non-Performing Exposure(2) - - 19 341 319 - 679
Total Observed impairment loss allowances of which:(4)
- - 72 136 131 - 339
-Performing – Watchlist - - 64 12 24 - 100 -Non-Performing Exposure(2) - - 8 124 107 - 239
IBNO(5)(6) 17 Total Impairment loss allowance 356 (1) Includes committed facilities and derivatives. The terms ‘Enhanced Monitoring’ and ‘Proactive Management’ are defined on page 76 of the 2013 Annual Report. (2) Non-Performing Exposure in the table above include committed facilities and derivative exposures and therefore are larger than the NPLs in the table below which only include drawn balances.
All the Non-Performing Exposures are impaired for purposes of provisioning. (3) Corporate loans are assessed individually or collectively assessed for impairment. Assets reported as impaired represent, for collective assessment, that portion of the loan portfolio where it is
estimated that a loss has been incurred, plus those assets individually impaired. (4) Excludes IBNO provision. (5) Allowance for incurred inherent losses (i.e. incurred but not observed (‘IBNO’)) as described in Note 1 to the Consolidated Financial Statements in the 2013 Annual Report. (6) There is no impairment allowance attributable to Sovereign and Supranational, and to Large Corporate. (7) An international organisation, whereby member states transcend national boundaries or interests to share in the decision-making and vote on issues pertaining to the geographical focus of the
organisation.

Detailed Business Review
Risk Management Report continued
56 Santander UK plc 2014 Half Yearly Financial Report
Non-performing loans and advances (1) (2) An analysis of Commercial Banking NPLs is presented below.
30 June 2014
£m 31 December 2013
£m Loans and advances to customers of which:(2) 23,128 22,075 Commercial Banking Arrears including NPLs(3) 733 680 Commercial Banking NPLs - impaired(3)(4)(5) 728 666Commercial Banking NPLs - not impaired(3)(4) - -Commercial Banking NPLs 728 666 Impairment loss allowances 357 356 % % Arrears ratio(6) 3.17 3.08 NPL ratio(7) 3.15 3.02Coverage ratio(8) 49 53(1) Loans and advances are classified as non-performing typically when the counterparty fails to make payments when contractually due for three months or where it is deemed probable that this
will occur in the near future. (2) Commercial Banking loans and advances to customers include finance leases. (3) All Commercial Banking balances are UK and continue accruing interest. For the data presented, the balances include interest charged to the customer’s account, but exclude interest accrued
but not yet charged to the account. (4) All the Non-Performing Loans are impaired for purposes of provisioning. (5) NPLs against which an impairment loss allowance has been established. (6) Commercial Banking loans and advances to customers in arrears as a percentage of Commercial Banking loans and advances to customers. (7) Commercial Banking NPLs as a percentage of Commercial Banking loans and advances to customers. (8) Impairment loss allowances as a percentage of NPLs. Movements in NPLs during the first six months are set out in the graph below. ‘Entries’ represent loans which have become classified as NPLs during the period. ‘Exits (including repayments)’ represent that element of loans to customers that have been repaid (in full or in part) plus those returned to performing status. ‘Write-offs’ represent the unrecovered element of a loan where recovery options, including realisation of any collateral, have been exhausted. Forbearance activity does not result in a change in the NPL status.
The following is a pictorial representation of the reviewed data in the table below.
An analysis of the NPL movements during the first half of 2014 is presented below.
£m At 1 January 2014 666 Transfers in to NPL: - Entries 296 Transfers out of NPL: - Exits (181) - Write Offs (53) At 30 June 2014 728
30 June 2014 compared to 31 December 2013 (unreviewed) During the first six months of 2014, Watchlist exposures subject to proactive management reduced overall to £749m (2013: £777m), largely driven by a reduction in Commercial Real Estate which more than compensated for the increase in the Mid Corporate and SME portfolio. Watchlist exposures subject to enhanced monitoring increased in almost all portfolios, predominantly due to a tightening of policy whereby any customer with a Care Quality Commission flag is automatically added to the Watchlist; and due to the prudent policy requirement to add Commercial Real Estate transactions that have six months to maturity and no definitive exit or refinance plan in place, irrespective of their loan-to-value ratio. In the Sovereign and Supranational, Large Corporate and Social Housing portfolios, there were no exposures subject to proactive management with only 2.4% (2013: 1.4%) of these portfolio exposures subject to enhanced monitoring.
Loans and advances to customers in arrears increased to £733m (2013: £680m) largely due to a single long-standing loan of £89m which moved to non-performance. A successful restructure of this loan is still anticipated and a conservative provision is held against it. Consequently, loans and advances to customers in arrears as a percentage of loans and advances to customers increased to 3.17% (2013: 3.08%).
During the first six months of 2014, the NPL ratio also increased slightly to 3.15% (2013: 3.02%) due to the same single long-standing loan noted above. The underlying NPL ratio excluding this case reduced to 2.76%.
In the first half of 2014, interest income recognised on impaired loans amounted to £9m (six months ended 30 June 2013: £7m).
728
(181)
(53)
296
666
0
200
400
600
800
1,000
At 1 January Entries Exits (includingrepayments)
Write Offs At 30 June
£m
NPL movements in the first half of 2014 (unreviewed)
Transfers in Transfers out

Detailed Business Review
Risk Management Report continued
Santander UK plc 2014 Half Yearly Financial Report 57
COMMERCIAL BANKING LOANS - FORBEARANCE Forbearance commenced during the period/year (1) No arrangements have been entered into with respect to Sovereign and Supranational, Large Corporate, Structured Finance or Social Housing counterparties. The exposures that entered forbearance during the six months period ended 30 June 2014 and the year ended 31 December 2013 were:
30 June 2014 Mid Corporate and SME Commercial Real Estate Total £m £m £m Forbearance of NPL 27 1 28Forbearance of Non-NPL 18 67 85 45 68 113
31 December 2013 Mid Corporate and SME Commercial Real Estate Total £m £m £m Forbearance of NPL 30 33 63 Forbearance of Non-NPL 60 105 165 90 138 228
(1) The figures by period/year reflect the amount of forbearance activity undertaken during the period/year irrespective of whether any forbearance activity has previously been undertaken on the forborne accounts.
Forbearance cumulative position a) Performance status when entering forbearance The status of forborne exposures at 30 June 2014 and 31 December 2013 when they originally entered forbearance, analysed by their payment status, was: 30 June 2014 Forbearance of NPL Forbearance of Non-NPL Total Impairment allowance £m £m £m £m Performing - 666 666 91In arrears (inc. NPLs) 161 - 161 41Total 161 666 827 132 31 December 2013 Forbearance of NPL Forbearance of Non-NPL Total Impairment allowance £m £m £m £m Performing - 728 728 84 In arrears (inc. NPLs) 196 - 196 50 Total 196 728 924 134
b) Performance status at the period/year-end The current status of forborne exposures analysed by their payment status at 30 June 2014 and 31 December 2013 was: 30 June 2014 Forbearance of NPL Forbearance of Non-NPL Total Impairment allowance £m £m £m £m Performing 55 390 445 11In arrears (inc. NPLs) 106 276 382 121Total 161 666 827 132 31 December 2013 Forbearance of NPL Forbearance of Non-NPL Total Impairment allowance £m £m £m £m Performing 70 516 586 21 In arrears (inc. NPLs) 126 212 338 113 Total 196 728 924 134

Detailed Business Review
Risk Management Report continued
58 Santander UK plc 2014 Half Yearly Financial Report
This data may be further analysed by portfolio, as follows: Mid Corporate and SMEs 30 June 2014 Forbearance of NPL Forbearance of Non-NPL Total Impairment allowance £m £m £m £m Performing 31 127 158 3In arrears (inc. NPLs) 70 75 145 60Total 101 202 303 63
31 December 2013 Forbearance of NPL Forbearance of Non-NPL Total Impairment allowance £m £m £m £m Performing 45 150 195 6 In arrears (inc. NPLs) 61 82 143 55 Total 106 232 338 61
Commercial Real Estate 30 June 2014 Forbearance of NPL Forbearance of Non-NPL Total Impairment allowance £m £m £m £m Performing 24 263 287 8In arrears (inc. NPLs) 36 201 237 61Total 60 464 524 69
31 December 2013 Forbearance of NPL Forbearance of Non-NPL Total Impairment allowance £m £m £m £m Performing 25 366 391 15 In arrears (inc. NPLs) 65 130 195 58 Total 90 496 586 73
30 June 2014 compared to 31 December 2013 (unreviewed) The incidence of forbearance that commenced in the period remained stable compared to 2013. Existing cases continue to work their way through the process. Overall, the cumulative forbearance position decreased both in the Commercial Real Estate and Mid Corporate and SME portfolios.
Accounts that are in forbearance continue to be closely monitored, to ensure that the forbearance arrangements are sustainable. Not all forbearance will prove effective, and in certain circumstances, market conditions may lead either to a case remaining in NPL even post-forbearance or to the need for a second forbearance action. At 30 June 2014, 34% (2013: 36%) of forborne exposures that were in NPL at the time of forbearance were performing in accordance with the revised terms agreed under the forbearance arrangements. At 30 June 2014, 54% (2013: 63%) of total forborne exposure was performing in accordance with the revised terms agreed under the forbearance arrangements. This decrease is largely due to the aforementioned single long-standing loan which moved to non-performance. A successful restructure of this loan is still anticipated.
The level of compliance with revised terms agreed under forbearance arrangements is influenced by market conditions and, as a consequence of the economic conditions, it is taking longer for cases to return to performing status after forbearance. Those cases where forbearance occurs prior to default, which at 30 June 2014 represented 81% (2013: 79%) of exposure, are generally more effective as highlighted in the tables above. Forborne exposures are assessed for observed impairment loss allowances. The greater probability of a loss when compared to the performing book is reflected in the calculation of impairment loss allowances. A customer’s ability to adhere to any revised terms agreed is an indicator of the sustainability of Santander UK’s forbearance arrangements, although the forbearance is unlikely to be successful in all cases. Debt-for-equity swaps (unreviewed) Debt-for-equity swaps amounted to £28m at 30 June 2014 (2013: £46m) and in view of their small size are not included in these analyses. Financial assets that would otherwise be past due or impaired At 30 June 2014, the carrying amount of financial assets that would otherwise be past due or impaired whose terms have been forborne was £55m (2013: £70m).

Detailed Business Review
Risk Management Report continued
Santander UK plc 2014 Half Yearly Financial Report 59
HIGHER RISK LOANS AND OTHER SEGMENTS OF PARTICULAR INTEREST The Commercial Real Estate market has experienced a particularly challenging environment over recent years following the financial crisis. Within this sector, Commercial Real Estate loans originated prior to 2009 represent a segment of relatively higher risk. Credit performance Commercial Real Estate non-performing exposures and weighted average LTVs at 30 June 2014 and 31 December 2013 may be further analysed between loans originated pre-2009 and thereafter as follows: 30 June 2014 Original vintage Pre-2009 2009 onwards Total Total committed exposure £1,328m £9,096m £10,424m Non-performing exposure ratio 22.6% 0.4% 3.3% Weighted average LTV 73% 54% 56% 31 December 2013 Original vintage Pre-2009 2009 onwards Total Total committed exposure £1,569m £8,476m £10,045m Non-performing exposure ratio 18.8% 0.3% 3.2% Weighted average LTV 74% 53% 56%
30 June 2014 compared to 31 December 2013 (unreviewed) At 30 June 2014, 88% (2013: 92%) of the non-performing exposures related to deals originated pre-2009. The pre-2009 vintage loans were written on terms prevailing in the market at that time which, compared to more recent times, included higher original LTVs, lower interest coverage and exposure to development or letting risk. Following the significant downturn in the commercial real estate market in 2008 and 2009, some of these customers suffered financial stresses resulting in their inability to meet the contractual payment terms, comply with covenants, or achieve refinancing/repayment at maturity. As a result, the pre-2009 sub-portfolio has experienced higher NPL rates in recent years. At 30 June 2014, the NPL ratio of the pre-2009 sub-portfolio was 22.6% which increased from 31 December 2013 due to the reduction in the size of the portfolio.
In light of the market deterioration, Santander UK’s lending criteria were significantly tightened from 2009 onwards, with lower LTVs and the avoidance of transactions with material letting or development risks (at 30 June 2014, this element of the portfolio represented only 2% (2013: 4%) of the total Commercial Real Estate portfolio). As a result, the sub-portfolio representing loans originating from 2009 onwards continues to perform significantly better than the pre-2009 sub-portfolio which continues to decline both in absolute terms and as a proportion of the total Commercial Real Estate portfolio. At 30 June 2014, the pre-2009 sub-portfolio represented less than 13% (2013: 16%) of the total Commercial Real Estate portfolio. Further detail on the entire Commercial Real Estate portfolio is contained in the following section.

Detailed Business Review
Risk Management Report continued
60 Santander UK plc 2014 Half Yearly Financial Report
Commercial Real Estate loans The Commercial Real Estate portfolio remained well diversified by sector at 30 June 2014 and 31 December 2013, as set out below.
Sector 30 June 2014
% 31 December 2013
% Office 26 26 Retail 23 23 Industrial 15 13 Residential 11 10 Mixed Use 10 9 Student Accommodation 5 6 Hotels & Leisure 5 6 Other 5 7 100 100 Loan-to-value analysis In Commercial Real Estate lending, the main form of credit mitigation is collateral. The table below analyses the loan to value ratios of loans within the Commercial Real Estate portfolio at 30 June 2014 and 31 December 2013. The LTV distribution is presented for the Non-Standardised portfolio, which at £8.7bn (2013: £8.4bn) represented 84% (2013: 84%) of the total Commercial Real Estate portfolio at 30 June 2014. The residual element of the portfolio consists of smaller value transactions largely in the form of commercial mortgages for which valuations are only available at the point of origination. These loans have therefore been excluded from the analysis below. 30 June 2014 Stock
% New Business
% Up to 50% 33 26 50% to 60% 36 42 60% to 70% 21 32 70% to 80% 5 - 80% to 90% 1 - 90% to 100% 2 - > 100% i.e. negative equity 2 - Total 100 100 31 December 2013 Stock
% New Business
% Up to 50% 33 26 50% to 60% 36 47 60% to 70% 18 22 70% to 80% 6 5 80% to 90% 3 - 90% to 100% - - > 100% i.e. negative equity 4 - Total 100 100 30 June 2014 compared to 31 December 2013 (unreviewed) At 30 June 2014, the profile of the portfolio remained conservative in terms of LTV with 69% (2013: 69%) of the portfolio at or below 60% LTV. This reflected the more recent vintage of the portfolio with 87% (2013: 84%) originated in 2009 or subsequent years. The majority of higher LTV deals represent older deals which remain in the portfolio.
New business is rarely written above 65% LTV. During the first half of 2014, all new business was originated at 65% LTV or lower. The majority of the cases with negative equity form part of the forborne element of the portfolio and are managed by the Restructuring & Recoveries team.
At 30 June 2014 the average LTV, weighted by exposure, remained stable at 56% (2013: 56%). The weighted average LTV of new deals written in the first half of 2014 was 54% (2013: 54%).
Refinancing risk As part of the annual review process, for commercial real estate loans that are approaching maturity, consideration is given to the prospects of refinancing the loan at prevailing market terms and applicable credit policy. The review will consider this and other aspects (e.g. covenant compliance) which could result in the case being placed on the Watchlist. Additionally, where an acceptable refinancing proposal has not been received within six months prior to maturity, the case will be placed on the Watchlist.
At 30 June 2014, there was £1,535m (2013: £852m) of commercial real estate loans due to mature within 12 months. Of these, £257m i.e. 17% (2013: £320m i.e. 27%) have an LTV ratio above that which would be considered acceptable under current credit policy, of which £252m (2013: £313m) has been placed on the Watchlist or recorded as NPL and has an impairment loss allowance of £58m (2013: £62m) associated with it.

Detailed Business Review
Risk Management Report continued
Santander UK plc 2014 Half Yearly Financial Report 61
CREDIT RISK – MARKETS Derivative risk exposures in the tables below are lower than the balance sheet position because the overall risk exposure is monitored and therefore consideration is taken of margin posted, Credit Support Annexes within ISDA Master Agreements, and master netting agreements and other financial instruments which reduce the Santander UK group’s exposures. Derivative asset balances recognised on the balance sheet reflect only the more restrictive netting permitted by IAS 32.
MARKETS – COMMITTED EXPOSURES Rating and geographical distribution The tables below reflect the total credit risk exposures of Markets by internal rating scale (see ‘Credit Quality’ on page 39) and by geographical areas. The exposures include committed facilities as well as the uncommitted drawn facilities. The geographic location is defined as the counterparty’s country of domicile except where a full risk transfer guarantee is in place, in which case the country of domicile of the guarantor is used. 30 June 2014 UK
£m Peripheral eurozone
£m Rest of Europe
£m US £m
Rest of world £m
Total £m
9 295 - 19 128 9 451 8 2,109 28 678 530 105 3,450 7 597 650 103 640 - 1,990 6 97 1 1 4 - 103 5 1 4 11 - - 16 4 58 - - - - 58 1 to 3 - - - - - - Total 3,157 683 812 1,302 114 6,068 31 December 2013 UK
£m Peripheral eurozone
£m Rest of Europe
£m US £m
Rest of world £m
Total £m
9 - - 2 - 56 58 8 1,410 10 897 746 87 3,150 7 1,064 582 169 227 - 2,042 6 76 3 - 23 - 102 5 1 5 11 - 1 18 4 - - - - - - 1 to 3 28 - - - - 28 Total 2,579 600 1,079 996 144 5,398
30 June 2014 compared to 31 December 2013 (unreviewed) As a continued effort to mitigate counterparty credit risk in derivative transactions, Santander UK increased the use of Central Counterparties (‘CCPs’) during the first half of 2014. This was reflected by the increased exposure in rating categories 8 and 9 in the UK resulting in an overall improved credit rating profile.
MARKETS - CREDIT RISK MITIGATION Markets focuses on derivative products and mitigates its credit risk to counterparties through netting arrangements, collateralisation and the use of CCPs. For details of the approach to credit risk mitigation, see “Credit Risk Management – Markets” on page 85 of the 2013 Annual Report.
The top 20 clients with which Santander UK had the biggest derivative exposures were Banks and CCPs. These top 20 clients’ derivative exposure accounted for 78% of the total derivative exposure in Markets at 30 June 2014 (2013: 90%). Cash collateral related to the Top 20 at 30 June 2014 was £1.7bn (2013: £2.3bn) and the risk exposure weighted average credit rating was 7.4 (2013: 7.6).
The total notional amount of Santander UK’s OTC derivatives at 30 June 2014 was £934.2bn (2013: £909.4bn) and 46% (2013: 34%) was cleared through CCPs. By mark-to-market terms (i.e. the credit risk exposure including mark-to-market value plus a volatility add-on that reflects the future volatility of the derivatives), CCPs were used in connection with 26% (2013: 18%) of Santander UK’s OTC derivatives. CCP transaction values as a percentage of the total portfolio are higher in notional amount than in mark-to-market terms due to their higher collateralisation and lower volatility.
MARKETS - CREDIT PERFORMANCE At 30 June 2014, there were no impaired or non-performing loans or exposures (2013: none) and the assets in the Watchlist proactive management category amounted to only £69m (2013: £36m).
MARKETS - FORBEARANCE At 30 June 2014 and 31 December 2013, there was no forbearance activity in Markets.

Detailed Business Review
Risk Management Report continued
62 Santander UK plc 2014 Half Yearly Financial Report
CREDIT RISK - CORPORATE CENTRE Credit risk arises on assets in the balance sheet and in off-balance sheet transactions. Consequently, the committed exposure (which takes into account credit mitigation procedures) is shown in the tables below. It excludes Sovereign and Supranational exposures managed by Short Term Markets within Commercial Banking.
CORPORATE CENTRE – COMMITTED EXPOSURES Rating distribution The rating distribution tables below show the credit risk exposure by Santander UK’s internal rating scale (see ‘Credit Quality’ on page 39) for each portfolio. Within this scale the higher the rating the better the quality of the counterparty. 30 June 2014 Sovereign and
Supranational (2) £m
Structured Products
£m Derivatives
£m
Legacy Portfolios in run-off
£m
Social Housing
£m Total
£m 9 31,782 942 - - 2,622 35,346 8 - 1,172 436 2 4,354 5,964 7 - 1,361 382 603 1,753 4,099 6 - 2 - 328 223 553 5 - 4 - 140 - 144 4 - 14 - 225 - 239 1 to 3 - 152 - 121 - 273 Other(1) - - - 877 - 877 Total 31,782 3,647 818 2,296 8,952 47,495 31 December 2013 Sovereign and
Supranational (2) £m
Structured Products
£m Derivatives
£m
Legacy Portfolios in run-off
£m
Social Housing
£m Total
£m 9 29,688 694 - 2 2,654 33,038 8 - 707 1,061 2 4,382 6,152 7 - 1,091 453 790 1,713 4,047 6 - 54 - 464 238 756 5 - 90 - 170 - 260 4 - 72 - 291 - 363 1 to 3 - 131 - 137 - 268 Other(1) - 27 - 1,007 - 1,034 Total 29,688 2,866 1,514 2,863 8,987 45,918 (1) Represents smaller exposure predominantly within the commercial mortgages portfolio which are subject to scorecards rather than a rating model. (2) An international organisation whereby member states transcend national boundaries or interests to share in the decision-making and vote on issues pertaining to the geographical focus of the
organisation.
Geographical distribution The geographic location is classified by country of risk being the country where each counterparty’s main business activity or assets are located. For clients whose operations are more geographically dispersed the country of incorporation is applied. 30 June 2014 Sovereign and
Supranational(1) £m
Structured Products
£m Derivatives
£m
Legacy Portfolios in run-off
£m
Social Housing
£m Total
£m UK 22,973 1,069 92 1,894 8,952 34,980 Peripheral eurozone - 252 - 8 - 260 Rest of Europe 367 1,533 276 56 - 2,232US 7,498 305 450 73 - 8,326 Rest of world 944 488 - 265 - 1,697 Total 31,782 3,647 818 2,296 8,952 47,495 31 December 2013 Sovereign and
Supranational(1) £m
Structured Products
£m Derivatives
£m
Legacy Portfolios in run-off
£m
Social Housing
£m Total
£m UK 24,036 880 453 2,241 8,987 36,597 Peripheral eurozone - 329 - 59 - 388 Rest of Europe 53 1,207 600 63 - 1,923 US 5,230 422 461 80 - 6,193 Rest of world 369 28 - 420 - 817 Total 29,688 2,866 1,514 2,863 8,987 45,918 (1) An international organisation whereby member states transcend national boundaries or interests to share in the decision-making and vote on issues pertaining to the geographical focus of the
organisation. 30 June 2014 compared to 31 December 2013 (unreviewed) During the first half of 2014, total committed exposures increased by £1.6bn or 3% to £47.5bn principally within the Sovereign and Supranational, and Structured Products portfolios, partially offset by decreases in the Derivatives and Legacy Portfolios in run-off portfolios. Committed exposures to Sovereign and Supranationals principally reflect cash at central banks and holdings of highly rated liquid assets as part of normal liquid asset portfolio management, and remained concentrated in the UK and US. Exposures to Structured Products reflect holdings of highly rated covered bonds, floating rate notes and residential mortgage-backed securities as part of normal liquid asset portfolio management. The increased exposures reflect the purchase of covered bonds and floating rate notes to optimise the liquid asset portfolio composition. Derivative exposures decreased due to a managed reduction of the portfolio. Legacy Portfolios in run-off decreased as we continued to successfully implement our on-going exit strategy.

Detailed Business Review
Risk Management Report continued
Santander UK plc 2014 Half Yearly Financial Report 63
CORPORATE CENTRE - CREDIT RISK MITIGATION At 30 June 2014, collateral held against impaired loans amounted to 74% (2013: 65%) of the carrying amount of impaired loan balances. Structured Products are unsecured but benefit from senior positions in the creditor cascade. Credit risk in derivatives is mitigated by netting agreements, collateralisation and the use of CCPs. For details of the approach to credit risk mitigation, see “Credit Risk Management – Markets” on page 85 of the 2013 Annual Report.
CORPORATE CENTRE - CREDIT PERFORMANCE Exposures exhibiting potentially higher risk characteristics are subject to risk monitoring under the Watchlist process (described in “The Credit Cycle” section under “Risk monitoring” on page 76 of the 2013 Annual Report). The table below sets out the portfolio showing exposures subject to risk monitoring under the Watchlist process and those classified as non-performing by portfolio at 30 June 2014 and 31 December 2013: 30 June 2014 Sovereign and
Supranational(7) £m
Structured Products
£m Derivatives
£m
Legacy Portfolios in run-off
£m
Social Housing
£m Total
£m Total Committed Exposure of which:(1) 31,782 3,647 818 2,296 8,952 47,495
- Watchlist: Enhanced Monitoring - - - 51 35 86 - Watchlist: Proactive Management - - - 59 - 59 - Remaining Performing Exposure 31,782 3,647 818 1,991 8,917 47,155
Subtotal Performing Exposure 31,782 3,647 818 2,101 8,952 47,300 Non-Performing Exposure(2) - - - 195 - 195 Total Impaired Exposure of which:(3) - - - 450 35 485
- Performing – Watchlist - - - 255 35 290 - Non-Performing Exposure(2) - - - 195 - 195
Total Observed impairment loss allowances of which:(4) - - - 114 - 114- Performing – Watchlist - - - 35 - 35- Non-Performing Exposure(2) - - - 79 - 79
IBNO(5)(6) 127 Total Impairment loss allowance 241 31 December 2013 Sovereign and
Supranational(7) £m
Structured Products
£m Derivatives
£m
Legacy Portfolios in run-off
£m
Social Housing
£m Total
£m Total Committed Exposure of which:(1) 29,688 2,866 1,514 2,863 8,987 45,918
- Watchlist: Enhanced Monitoring - 37 - 173 118 328 - Watchlist: Proactive Management - - - 72 - 72 - Remaining Performing Exposure 29,688 2,829 1,514 2,389 8,869 45,289
Subtotal Performing Exposure 29,688 2,866 1,514 2,634 8,987 45,689 Non-Performing Exposure(2) - - - 229 - 229 Total Impaired Exposure of which:(3) - - - 485 118 603
- Performing – Watchlist - - - 256 118 374 - Non-Performing Exposure(2) - - - 229 - 229
Total Observed impairment loss allowances of which:(4) - - - 162 - 162 - Performing – Watchlist - - - 55 - 55 - Non-Performing Exposure(2) - - - 107 - 107
IBNO(5)(6) 114 Total Impairment loss allowance 277 (1) Includes committed facilities and derivatives. The terms ‘Enhanced Monitoring’ and ‘Proactive Management’ are defined on page 76 of the 2013 Annual Report. (2) Non-Performing Exposure in the table above include committed facilities and derivative exposures and therefore are larger than the NPLs in the tables on page 64 which only include drawn
balances. All the Non-Performing Exposures are impaired for purposes of provisioning. (3) Corporate loans are assessed individually or collectively assessed for impairment. Assets reported as impaired represent, for collective assessment, that portion of the loan portfolio where it is
estimated that a loss has been incurred, plus those assets individually impaired. (4) Excludes IBNO provision. (5) Allowance for incurred inherent losses (i.e. incurred but not observed (‘IBNO’)) as described in Note 1 to the Consolidated Financial Statements in the 2013 Annual Report. (6) There is no impairment allowance attributable to Sovereign and Supranational or Structured Products. (7) An international organisation, whereby member states transcend national boundaries or interests to share in the decision-making and vote on issues pertaining to the geographical focus of the
organisation.
Non-core customer assets at 30 June 2014 comprised Social Housing of £7.0bn (2013: £7.1bn), Commercial Mortgages of £1.0bn (2013: £1.2bn), Aviation of £0.2bn (2013: £0.4bn), Shipping of £0.3bn (2013: £0.4bn), and Others of £0.2bn (2013: £0.3bn).

Detailed Business Review
Risk Management Report continued
64 Santander UK plc 2014 Half Yearly Financial Report
Non-performing loans and advances (1) (2) An analysis of Corporate Centre NPLs is presented below.
30 June 2014
£m 31 December 2013
£m Loans and advances to customers of which:(2) 8,703 9,360 Corporate Centre Arrears including NPLs(3) 198 239 Corporate Centre NPLs - impaired(3)(4)(5) 183 221Corporate Centre NPLs - not impaired(3)(4) - -Corporate Centre NPLs 183 221 Impairment loss allowances 241 277 % % Arrears ratio(6) 2.27 2.55 NPL ratio(7) 2.10 2.36 Coverage ratio(8) 132 125(1) Loans and advances are classified as non-performing typically when the counterparty fails to make payments when contractually due for three months or where it is deemed probable that this
will occur in the near future. (2) Corporate Centre loans and advances to customers include Social Housing loans and finance leases. (3) All Corporate Centre balances are UK and continue accruing interest. For the data presented, the balances include interest charged to the customer’s account, but exclude interest accrued but
not yet charged to the account. (4) All the Non-Performing Loans are impaired for purposes of provisioning. (5) NPLs against which an impairment loss allowance has been established. (6) Corporate Centre loans and advances to customers in arrears as a percentage of Corporate Centre loans and advances to customers. (7) Corporate Centre NPLs as a percentage of Corporate Centre loans and advances to customers. (8) Impairment loss allowances as a percentage of NPLs. Movements in NPLs during the first six months are set out in the graph below. ‘Entries’ represent loans which have become classified as NPLs during the first six months. ‘Exits (including repayments)’ represent that element of loans that have been repaid (in full or in part) plus those returned to performing status. ‘Write-offs’ represent the unrecovered element of a loan where recovery options, including realisation of any collateral, have been exhausted. Forbearance activity does not result in a change in the NPL status. The following is a pictorial representation of the reviewed data in the table below.
An analysis of the NPL movements during the first half of 2014 is presented below. £m At 1 January 2014 221 Transfers in to NPL - Entries 72 Transfers out of NPL - Exits (64) - Write Offs (46) At 30 June 2014 183
30 June 2014 compared to 31 December 2013 (unreviewed) During the first half of 2014, the value of exposures in the Legacy Portfolios in run-off subject to Watchlist and NPLs decreased as a consequence of the strategy to exit these exposures. Similarly, the level of provision decreased during the period reflecting disposal of assets. Social Housing exposure subject to enhanced monitoring decreased as a result of a number of cases returning to performing status following resolution of governance issues as anticipated. There was no Watchlist exposure subject to enhanced monitoring in Sovereign and Supranational, Structured Products and Derivatives.
In the first six months of 2014, loans and advances to customers in arrears decreased to £198m (2013: £239m) as Santander UK continued to execute the strategy of exiting problem exposures through sale of the debt or through the realisation of the collateral. Loans and advances to customers in arrears as a percentage of loans and advances to customers decreased to 2.27% (2013: 2.55%) as a result of the decrease in arrears described above which was achieved at a slightly faster rate than the run-off of the loans and advances.
At 30 June 2014, the NPL ratio decreased slightly to 2.10% (2013: 2.36%). This decrease reflected the continuing strategy to exit exposures where possible for this portfolio. In the first half of 2014, coverage increased to 132% (2013: 125%) reflecting the successful disposal programme without incurring significant further losses. In the first six months of 2014, interest income recognised on impaired loans amounted to £4m (six months ended 30 June 2013: £7m).
183
(64)(46)
72
221
0
200
400
600
800
1,000
At 1 January Entries Exits (includingrepayments)
Write Offs At 30 June
£m
NPL movements in the first half of 2014 (unreviewed)

Detailed Business Review
Risk Management Report continued
Santander UK plc 2014 Half Yearly Financial Report 65
CORPORATE CENTRE - FORBEARANCE Forbearance arrangements have only been entered into with respect to the Legacy portfolios in run-off. No forbearance arrangements have been entered into with respect to Sovereign and Supranational, Structured Products, Derivatives or Social Housing counterparties.
Forbearance commenced during the period The forborne exposures that entered forbearance during the six months ended 30 June 2014 and the year ended 31 December 2013 were:
30 June 2014 31 December 2013 £m £m Forbearance of NPL 9 23 Forbearance of Non-NPL 6 26 15 49
Forbearance cumulative position a) Performance status when entering forbearance The status of the forborne exposures at 30 June 2014 and 31 December 2013 when they originally entered forbearance, analysed by their payment status, was:
30 June 2014 Forbearance of NPL Forbearance of Non-NPL Total Impairment allowance £m £m £m £m Performing - 312 312 31In arrears (inc. NPLs) 51 - 51 16Total 51 312 363 47
31 December 2013 Forbearance of NPL Forbearance of Non-NPL Total Impairment allowance £m £m £m £m Performing - 322 322 32 In arrears (inc. NPLs) 58 - 58 18 Total 58 322 380 50
b) Performance status at the period/year-end The current status of forborne exposures analysed by their payment status at 30 June 2014 and 31 December 2013 was: 30 June 2014 Forbearance of NPL Forbearance of Non-NPL Total Impairment allowance £m £m £m £m Performing 37 270 307 14In arrears (inc. NPLs) 14 42 56 33Total 51 312 363 47 31 December 2013 Forbearance of NPL Forbearance of Non-NPL Total Impairment allowance £m £m £m £m Performing 32 274 306 13 In arrears (inc. NPLs) 26 48 74 37 Total 58 322 380 50 30 June 2014 compared to 31 December 2013 (unreviewed) In the first six months of 2014, the level of new forbearance undertaken during the first half of the year reduced as actions taken to exit potential problem exposures continued to be successfully executed, consistent with the non-core nature of the Legacy Portfolios in run-off. The balance of forborne exposure also reduced during the period as the strategy to exit these exposures continued to be executed where the opportunity arose. An element of the residual forborne exposure is expected to take longer to exit given their profile and the more limited market appetite for the purchase or refinancing of certain assets.
Accounts that are in forbearance continue to be closely monitored, to ensure that the forbearance arrangements are sustainable. At 30 June 2014, 85% (2013: 80%) of forborne exposures were performing in accordance with the revised terms agreed under Santander UK’s forbearance arrangements. A customer’s ability to adhere to any revised terms agreed is an indicator of the sustainability of Santander UK’s forbearance arrangements.
Financial assets that would otherwise be past due or impaired At 30 June 2014, the carrying amount of financial assets that would otherwise be past due or impaired whose terms have been forborne was £37m (2013: £32m).
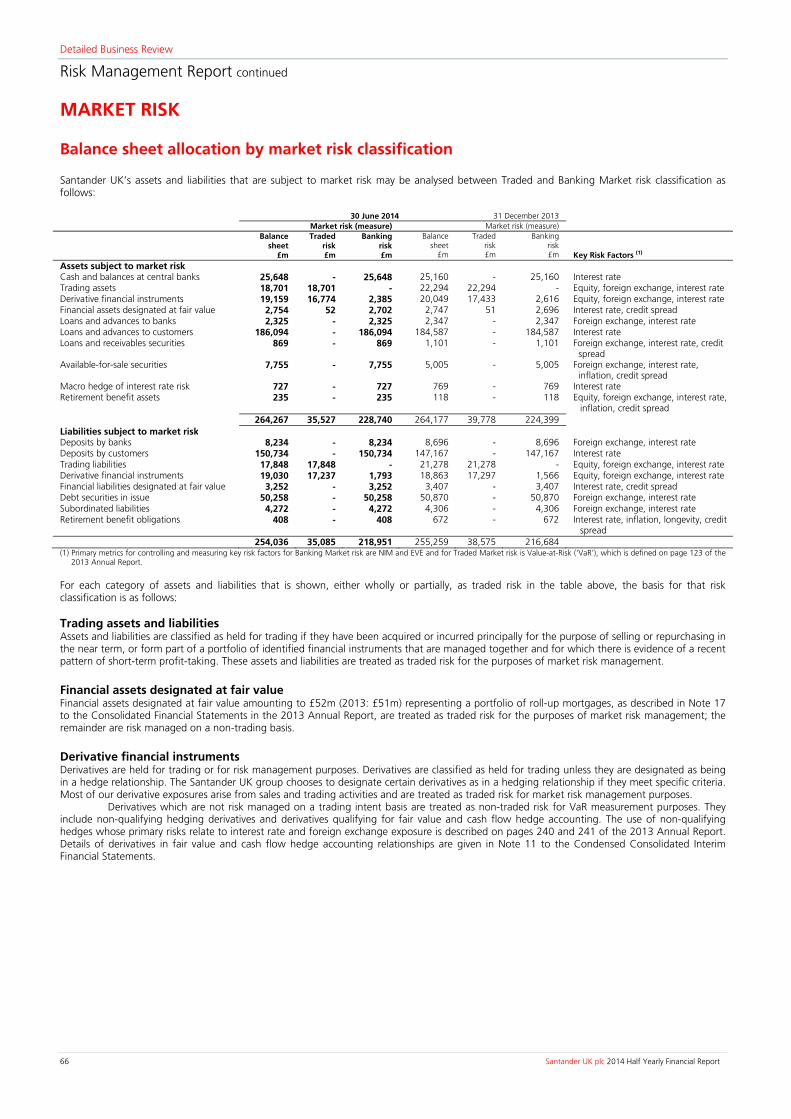
Detailed Business Review
Risk Management Report continued
66 Santander UK plc 2014 Half Yearly Financial Report
MARKET RISK Balance sheet allocation by market risk classification Santander UK’s assets and liabilities that are subject to market risk may be analysed between Traded and Banking Market risk classification as follows: 30 June 2014 31 December 2013 Market risk (measure) Market risk (measure) Balance
sheet £m
Traded risk £m
Banking risk £m
Balance sheet
£m
Traded risk £m
Banking risk £m Key Risk Factors (1)
Assets subject to market risk Cash and balances at central banks 25,648 - 25,648 25,160 - 25,160 Interest rate Trading assets 18,701 18,701 - 22,294 22,294 - Equity, foreign exchange, interest rate Derivative financial instruments 19,159 16,774 2,385 20,049 17,433 2,616 Equity, foreign exchange, interest rate Financial assets designated at fair value 2,754 52 2,702 2,747 51 2,696 Interest rate, credit spread Loans and advances to banks 2,325 - 2,325 2,347 - 2,347 Foreign exchange, interest rate Loans and advances to customers 186,094 - 186,094 184,587 - 184,587 Interest rate Loans and receivables securities 869 - 869 1,101 - 1,101 Foreign exchange, interest rate, credit
spread Available-for-sale securities 7,755 - 7,755 5,005 - 5,005 Foreign exchange, interest rate,
inflation, credit spread Macro hedge of interest rate risk 727 - 727 769 - 769 Interest rate Retirement benefit assets 235 - 235 118 - 118 Equity, foreign exchange, interest rate,
inflation, credit spread 264,267 35,527 228,740 264,177 39,778 224,399 Liabilities subject to market risk Deposits by banks 8,234 - 8,234 8,696 - 8,696 Foreign exchange, interest rate Deposits by customers 150,734 - 150,734 147,167 - 147,167 Interest rate Trading liabilities 17,848 17,848 - 21,278 21,278 - Equity, foreign exchange, interest rate Derivative financial instruments 19,030 17,237 1,793 18,863 17,297 1,566 Equity, foreign exchange, interest rate Financial liabilities designated at fair value 3,252 - 3,252 3,407 - 3,407 Interest rate, credit spread Debt securities in issue 50,258 - 50,258 50,870 - 50,870 Foreign exchange, interest rate Subordinated liabilities 4,272 - 4,272 4,306 - 4,306 Foreign exchange, interest rate Retirement benefit obligations 408 - 408 672 - 672 Interest rate, inflation, longevity, credit
spread 254,036 35,085 218,951 255,259 38,575 216,684 (1) Primary metrics for controlling and measuring key risk factors for Banking Market risk are NIM and EVE and for Traded Market risk is Value-at-Risk (‘VaR’), which is defined on page 123 of the
2013 Annual Report.
For each category of assets and liabilities that is shown, either wholly or partially, as traded risk in the table above, the basis for that risk classification is as follows: Trading assets and liabilities Assets and liabilities are classified as held for trading if they have been acquired or incurred principally for the purpose of selling or repurchasing in the near term, or form part of a portfolio of identified financial instruments that are managed together and for which there is evidence of a recent pattern of short-term profit-taking. These assets and liabilities are treated as traded risk for the purposes of market risk management. Financial assets designated at fair value Financial assets designated at fair value amounting to £52m (2013: £51m) representing a portfolio of roll-up mortgages, as described in Note 17 to the Consolidated Financial Statements in the 2013 Annual Report, are treated as traded risk for the purposes of market risk management; the remainder are risk managed on a non-trading basis. Derivative financial instruments Derivatives are held for trading or for risk management purposes. Derivatives are classified as held for trading unless they are designated as being in a hedge relationship. The Santander UK group chooses to designate certain derivatives as in a hedging relationship if they meet specific criteria. Most of our derivative exposures arise from sales and trading activities and are treated as traded risk for market risk management purposes.
Derivatives which are not risk managed on a trading intent basis are treated as non-traded risk for VaR measurement purposes. They include non-qualifying hedging derivatives and derivatives qualifying for fair value and cash flow hedge accounting. The use of non-qualifying hedges whose primary risks relate to interest rate and foreign exchange exposure is described on pages 240 and 241 of the 2013 Annual Report. Details of derivatives in fair value and cash flow hedge accounting relationships are given in Note 11 to the Condensed Consolidated Interim Financial Statements.

Detailed Business Review
Risk Management Report continued
Santander UK plc 2014 Half Yearly Financial Report 67
TRADED MARKET RISK
TRADED MARKET RISK – COMMERCIAL BANKING
The amounts below represent the potential change in market values of trading instruments. Since trading instruments are recorded at market value, these amounts also represent the potential effect on income. Actual exposure at
Trading instruments
30 June 2014
£m
31 December 2013 £m
Interest rate risks(1) 1.4 1.7 Equity risks(2) 0.5 0.5 Spread risks(3) - - Correlation offsets(4) (0.5) (0.5) Total correlated one-day VaR 1.4 1.7
Actual exposure for the period ended Average exposure Highest exposure Lowest exposure
Trading instruments
30 June 2014
£m
31 December 2013
£m
30 June 2014
£m
31 December 2013
£m
30 June 2014
£m
31 December 2013
£m Interest rate risks(1) 2.5 3.1 3.9 4.6 1.3 1.6 Equity risks(2) 0.5 0.8 0.6 1.2 0.4 0.5 Spread risks(3) - - - 1.1 - - Correlation offsets(4) (0.4) (0.8) - - - - Total correlated one-day VaR 2.6 3.1 3.9 5.0 1.4 1.7 (1) Interest rate risk measures the impact of interest rate and volatility changes on cash instruments, securities and derivatives. This includes swap spread risk (the difference between swap rates
and the government bond rates), basis risk (changes in interest rate floating benchmark levels) and inflation risk (changes in inflation rates). (2) Equity risk measures the impact on equity stocks and derivatives from changes in equity prices, volatilities and dividends. (3) Spread risk measures the impact of changes in the credit spread of corporate bonds or credit derivatives. (4) The highest and lowest exposure figures reported for each risk type did not necessarily occur on the same day as the highest and lowest total correlated one-day VaR. A corresponding
correlation offset effect cannot be calculated and is therefore omitted from the above table.
Commercial Banking daily total correlated one day VaR 2014 (short-term markets business) (unreviewed)
The principal component of VaR in Commercial Banking is interest rate risk. The increase in risk seen in the first quarter of 2014 was due to changes in interest rate positioning which also accounted for the decrease in the second quarter.
0.0
0.5
1.0
1.5
2.0
2.5
3.0
3.5
4.0
4.5
01 J
an
31 M
ar
30 J
un
£m
Total VaR Equity Risks Interest Rate Risks

Detailed Business Review
Risk Management Report continued
68 Santander UK plc 2014 Half Yearly Financial Report
TRADED MARKET RISK – MARKETS The amounts below represent the potential change in market values of trading instruments. Since trading instruments are recorded at market value, these amounts also represent the potential effect on income.
Actual exposure at
Trading instruments 30 June 2014
£m 31 December 2013
£m Interest rate risks(1) 2.0 2.3 Equity risks(2) 0.9 1.4 Property risks(3) 0.1 0.1 Spread risks(4) 0.3 0.3 Other risks(5) - - Correlation offsets (1.1) (1.6) Total correlated one-day VaR 2.2 2.5
Actual exposure for the period ended Average exposure Highest exposure Lowest exposure
Trading instruments
30 June 2014
£m
31 December 2013
£m
30 June 2014
£m
31 December 2013
£m
30 June 2014
£m
31 December 2013
£m Interest rate risks(1) 3.3 2.6 6.1 4.4 1.8 1.7 Equity risks(2) 1.2 1.9 1.9 4.6 0.7 0.7 Property risks(3) 0.1 0.1 0.1 0.2 0.1 - Spread risks(4) 0.4 0.4 0.6 1.0 0.2 0.2 Other risks(5) - 0.1 0.1 0.5 - - Correlation offsets(6) (1.6) (1.9) - - - - Total correlated one-day VaR 3.4 3.2 5.9 6.5 1.7 1.9
(1) Interest rate risk measures the impact of interest rate and volatility changes on cash instruments, securities and derivatives. This includes swap spread risk (the difference between swap rates and the government bond rates), basis risk (changes in interest rate floating benchmark levels) and inflation risk (changes in inflation rates).
(2) Equity risk measures the impact on equity stocks and derivatives from changes in equity prices, volatilities and dividends. (3) Property risk measures the impact of changes in the property indices. (4) Spread risk measures the impact of changes in the credit spread of corporate bonds or credit derivatives. (5) Other risks include foreign exchange risk. Foreign exchange risk measures the impact of changes in foreign exchange rates and volatilities. (6) The highest and lowest exposure figures reported for each risk type did not necessarily occur on the same day as the highest and lowest total correlated one-day VaR. A corresponding
correlation offset effect cannot be calculated and is therefore omitted from the above table. Markets daily total correlated one day VaR 2014 (unreviewed)
The principal component of VaR in Markets is interest rate risk. The VaR volatility in the first half of 2014 was predominately due to short-term changes in interest rate positioning during the period.
0.0
1.0
2.0
3.0
4.0
5.0
6.0
7.0
01 J
an
31 M
ar
30 J
un
£m
Total VaR Interest Rate Risks Equity Risks Spread Risks FX
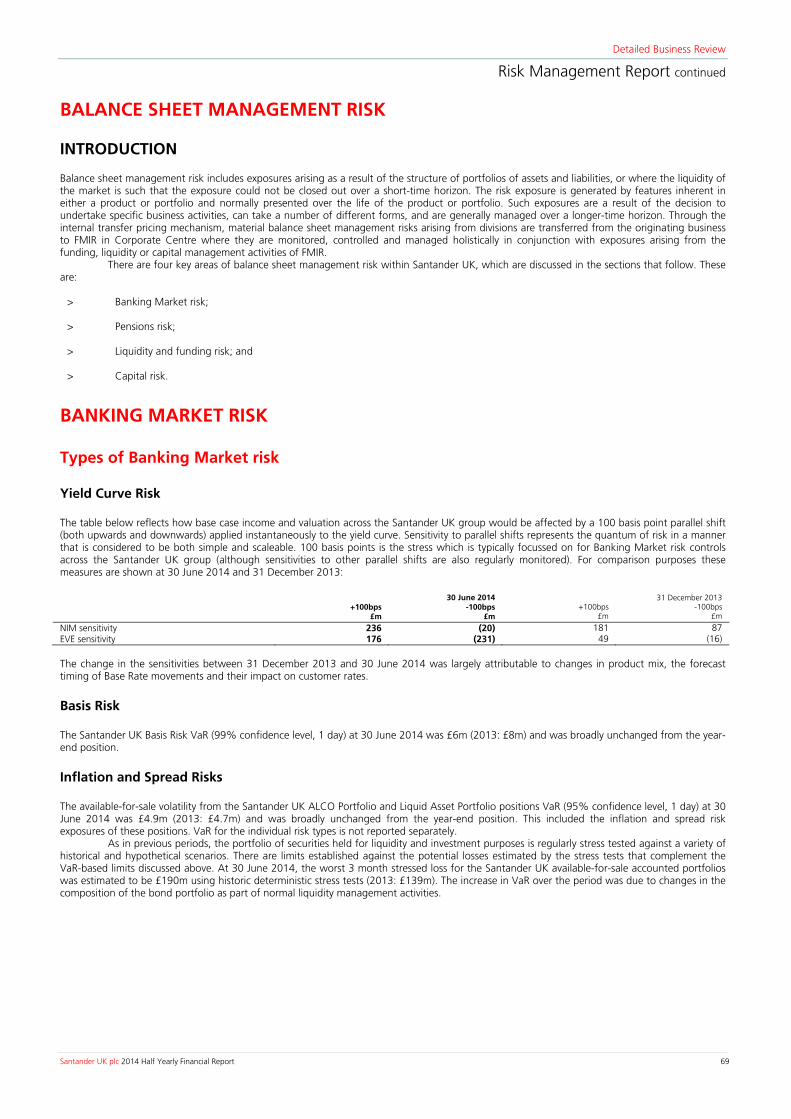
Detailed Business Review
Risk Management Report continued
Santander UK plc 2014 Half Yearly Financial Report 69
BALANCE SHEET MANAGEMENT RISK
INTRODUCTION
Balance sheet management risk includes exposures arising as a result of the structure of portfolios of assets and liabilities, or where the liquidity of the market is such that the exposure could not be closed out over a short-time horizon. The risk exposure is generated by features inherent in either a product or portfolio and normally presented over the life of the product or portfolio. Such exposures are a result of the decision to undertake specific business activities, can take a number of different forms, and are generally managed over a longer-time horizon. Through the internal transfer pricing mechanism, material balance sheet management risks arising from divisions are transferred from the originating business to FMIR in Corporate Centre where they are monitored, controlled and managed holistically in conjunction with exposures arising from the funding, liquidity or capital management activities of FMIR.
There are four key areas of balance sheet management risk within Santander UK, which are discussed in the sections that follow. These are:
> Banking Market risk;
> Pensions risk;
> Liquidity and funding risk; and
> Capital risk.
BANKING MARKET RISK Types of Banking Market risk Yield Curve Risk The table below reflects how base case income and valuation across the Santander UK group would be affected by a 100 basis point parallel shift (both upwards and downwards) applied instantaneously to the yield curve. Sensitivity to parallel shifts represents the quantum of risk in a manner that is considered to be both simple and scaleable. 100 basis points is the stress which is typically focussed on for Banking Market risk controls across the Santander UK group (although sensitivities to other parallel shifts are also regularly monitored). For comparison purposes these measures are shown at 30 June 2014 and 31 December 2013:
The change in the sensitivities between 31 December 2013 and 30 June 2014 was largely attributable to changes in product mix, the forecast timing of Base Rate movements and their impact on customer rates. Basis Risk The Santander UK Basis Risk VaR (99% confidence level, 1 day) at 30 June 2014 was £6m (2013: £8m) and was broadly unchanged from the year-end position. Inflation and Spread Risks The available-for-sale volatility from the Santander UK ALCO Portfolio and Liquid Asset Portfolio positions VaR (95% confidence level, 1 day) at 30 June 2014 was £4.9m (2013: £4.7m) and was broadly unchanged from the year-end position. This included the inflation and spread risk exposures of these positions. VaR for the individual risk types is not reported separately.
As in previous periods, the portfolio of securities held for liquidity and investment purposes is regularly stress tested against a variety of historical and hypothetical scenarios. There are limits established against the potential losses estimated by the stress tests that complement the VaR-based limits discussed above. At 30 June 2014, the worst 3 month stressed loss for the Santander UK available-for-sale accounted portfolios was estimated to be £190m using historic deterministic stress tests (2013: £139m). The increase in VaR over the period was due to changes in the composition of the bond portfolio as part of normal liquidity management activities.
30 June 2014 31 December 2013
+100bps
£m -100bps
£m +100bps
£m -100bps
£m
NIM sensitivity 236 (20) 181 87 EVE sensitivity 176 (231) 49 (16)

Detailed Business Review
Risk Management Report continued
70 Santander UK plc 2014 Half Yearly Financial Report
LIQUIDITY AND FUNDING RISK Liquidity and funding risk is managed on a Santander UK group basis. In addition, under the PRA’s regulatory liquidity regime, Santander UK and its subsidiaries Abbey National Treasury Services plc and Cater Allen Limited form the Santander UK Defined Liquidity Group (‘DLG’). Under these arrangements, each member of the DLG is liable to support each other in terms of transferring or receiving surplus liquidity in times of stress.
LIQUIDITY RISK Santander UK’s key ongoing liquidity risks, Liquidity Risk Appetite (‘LRA’) and approach to Liquidity risk management are described on pages 133 to 135 of the 2013 Annual Report. In addition to the Liquidity Risk Appetite, Santander UK also complies with regulatory requirements set by the PRA, other regulatory bodies and Banco Santander group standards. New requirements such as Liquidity Coverage Ratio (‘LCR’) and Net Stable Funding Ratio (‘NSFR’) which will be introduced under the Basel III regime are being actively monitored at a Santander UK group level. Reporting processes are being developed to ensure compliance with these ratios. At 30 June 2014, the LCR was in excess of 100%, and in excess of minimum regulatory requirements. The LCR is tracked at key governance committees including ALCO; the NSFR is still under development and is not disclosed at this time.
The table below shows the basis of liquidity ratios that are tracked and also the current level of LCR and LRA. Santander UK reviewed and revised its Liquidity Risk Appetite in 2013 and it was updated to represent the coverage of the current most plausible stress by qualifying liquid resources. Compliance with internal and regulatory stress tests
30 June 2014 30 June 2014 31 December 2013 31 December 2013
Santander UK LRA (two month
Santander UK specific requirement)
Estimated Basel III LCR
(revised text January 2013) (1)
Santander UK LRA (two month
Santander UK specific requirement)
Estimated Basel III LCR
(revised text January 2013)
£bn £bn £bn £bn Eligible liquidity pool 30.4 36.0 27.2 31.8 Asset inflows 0.6 1.0 0.6 0.9 Stress outflows: Retail and commercial deposit outflows (5.5) (6.7) (4.7) (6.2) Wholesale funding and derivatives (6.8) (19.2) (2.1) (13.8) Contractual credit rating downgrade exposure (5.6) (6.0) (6.6) (9.2) Drawdowns of loan commitments (2.6) (2.6) (2.2) (2.6) Other (1.6) - (1.6) - Total stress net cash outflows (21.5) (33.5) (16.6) (30.9) Surplus 8.9 2.5 10.6 0.9 Liquidity pool as a percentage of anticipated net cash flows 141% 107% 164% 103%
(1) Takes into account the ‘Instructions for Basel III monitoring’ and ‘Frequently asked questions on Basel III monitoring’ as revised by the Basel Committee in March and May 2014, respectively.
LIQUID ASSETS
Santander UK holds, at all times, a portfolio of unencumbered liquid assets to mitigate liquidity risk. The size and composition of this portfolio is determined by Santander UK’s Liquidity Risk Appetite and regulatory requirements.
The table below shows the carrying value and liquidity value of liquid assets held by Santander UK at 30 June 2014 and 31 December 2013 and the weighted average carrying value during the relevant period:
Carrying value Liquidity value Weighted average carrying value during the period/year
30 June 2014 31 December 2013 30 June 2014 31 December 2013 30 June 2014 31 December 2013 £bn £bn £bn £bn £bn £bn Cash at central banks(4) 25 25 25 25 28 29Government bonds 7 4 7 4 4 4Eligible liquid assets(1) 32 29 32 29 32 33High quality liquid assets 4 3 3 2 4 3Other liquid assets: - Whole loans and own debt securities(2)(3) 34 39 22 25 36 38- Other securities 2 2 1 1 2 2Total liquid assets(4) 72 73 58 57 74 76(1) Eligible liquid assets consist of those assets which meet the PRA requirements for a liquid asset portfolio. (2) Whole loans are loans acceptable on an unsecuritised basis to the Bank of England as collateral for its various funding arrangements. (3) Includes own debt securities (i.e. retained issuances) held by Santander UK of £1bn at 30 June 2014 (2013: £1bn). (4) Excludes cash in hand.

Detailed Business Review
Risk Management Report continued
Santander UK plc 2014 Half Yearly Financial Report 71
The classification of the assets in the liquid asset portfolio in the Consolidated Balance Sheet, or their treatment as off-balance sheet at 30 June 2014 and 31 December 2013 was as follows: 30 June 2014 On balance sheet Off balance sheet Total
liquid assets
Cash Financial assets designated at
fair value
Loans and advances to
customers
Trading Assets
Available- for-sale
securities
Loans and receivables
securities
Collateral received/ (pledged)
Retained issuances of own debt
securities £bn £bn £bn £bn £bn £bn £bn £bn £bn Cash at central banks(1) 25 25 - - - - - - -Government bonds 7 - - - 4 4 - (1) -Eligible liquid assets 32 25 - - 4 4 - (1) -High quality bonds 4 - - - 1 4 - (1) -Other liquid assets: - Whole loans and own debt securities 34 - 2 31 - - - - 1- Other securities 2 - - - 2 - 1 (1) -Total liquid assets(1) 72 25 2 31 7 8 1 (3) 1
31 December 2013 On balance sheet Off balance sheet Total
liquid assets
Cash Financial assets designated at
fair value
Loans and advances to
customers
Trading Assets
Available- for-sale
securities
Loans and receivables
securities
Collateral received/ (pledged)
Retained issuances of own debt
securities £bn £bn £bn £bn £bn £bn £bn £bn £bn Cash at central banks(1) 25 25 - - - - - - - Government bonds 4 - - - 3 3 - (2) - Eligible liquid assets 29 25 - - 3 3 - (2) - High quality bonds 3 - - - 1 2 - - - Other liquid assets: - Whole loans and own debt securities 39 - 1 37 - - - - 1 - Other securities 2 - - - 1 - 1 - - Total liquid assets(1) 73 25 1 37 5 5 1 (2) 1
(1) Excludes cash in hand.
The following tables set out liquid assets by the geographic location of the issuer or counterparty at 30 June 2014 and 31 December 2013: 30 June
2014 £bn
31 December 2013 £bn
Eligible liquid assets: Cash at central banks:
- UK 18 20- US 7 5 25 25Government bonds: - UK 3 2- US 3 2- Supranational 1 - 7 4Total eligible liquid assets 32 29High quality(1) corporate bonds and asset-backed securities: - UK 1 1- US - 1- Other countries, each less than £1bn(2) 3 1 4 3Other liquid assets: - UK – Whole loans and own debt securities 34 39- UK – Other debt securities, bonds, and equities included in major indices 1 1- Other countries, each less than £1bn(3) 1 1 36 41Total liquid assets 72 73
(1) A- rated or above. (2) Consists of Austria, Belgium, Canada, Switzerland, Germany, France, Norway, Sweden, Ireland, Luxembourg, Denmark and Netherlands. (3) Consists of Canada, Spain, Italy, France, Denmark, Portugal and Australia.

Detailed Business Review
Risk Management Report continued
72 Santander UK plc 2014 Half Yearly Financial Report
Composition of the liquidity pool The liquidity pool consists of total liquid assets and cash in hand. 30 June 2014 Liquidity pool of which Liquidity pool PRA eligible Basel III Liquidity Coverage Ratio-eligible Total Level 1 Level 2A Level 2B £bn £bn £bn £bn £bn Cash in hand and cash with central banks 26 25 26 - -Government bonds: AAA rated 7 7 7 - - Total Government bonds 7 7 7 - -Other: Covered bonds (rated AA- and above) 2 - - 2 - Equities 1 - - - 1 Other 37 - - - 1 Total Other 40 - - 2 2Total at 30 June 2014 73 32 33 2 2
31 December 2013 Liquidity pool of which Liquidity pool PRA eligible Basel III Liquidity Coverage Ratio-eligible Total Level 1 Level 2A Level 2B £bn £bn £bn £bn £bn Cash in hand and cash with central banks 26 25 26 - -Government bonds: AAA rated 2 2 2 - - AA+ to AA- rated 2 2 2 - - Total Government bonds 4 4 4 - -Other: Covered bonds (rated AA- and above) 1 - - 1 - Corporate bonds (rated A- and above) 1 - - - 1 Equities 1 - - - - Other 41 - - - - Total Other 44 - - 1 1Total at 31 December 2013 74 29 30 1 1
Liquidity pool by currency US Dollar
£bn Euro
£bn Sterling
£bn Other
£bn Total
£bn At 30 June 2014 13 2 58 - 73At 31 December 2013 8 2 63 1 74
Liquidity developments in the first half of 2014 (unreviewed) The first half of 2014 was characterised by steadily improving sentiment regarding the UK, US and, to a lesser extent, eurozone economies. In addition, overall investor sentiment continued to strengthen. A developing trend towards the search for enhanced yield and increased risk appetite was observed.
During the first half of 2014, Santander UK benefited from low wholesale, unsecured medium-term and secured medium-term funding rates and increased confidence both in the UK banking sector and wider economic environment. Throughout the first half of 2014, Santander UK continued to maintain a strong liquidity position and a conservative balance sheet structure (i.e. maintaining high levels of high quality liquid assets) as well as robust risk management controls to monitor and manage the levels of the liquid asset portfolio and encumbrance. Eligible liquid assets continued to significantly exceed wholesale funding of less than one year, with a coverage ratio of 127% at 30 June 2014 (2013: 139%). The change in the ratio, which is expected to be volatile due to the management of normal short term business commitments, was driven by an increase in eligible liquid assets by £2.7bn to £32.2bn at 30 June 2014 (2013: £29.5bn) offset by an increase in wholesale funding with a residual maturity of less than one year of £4.1bn to £25.3bn at 30 June 2014 (2013: £21.2bn), due to the phasing of secured funding maturities.
In addition, Santander UK’s LCR improved to 107% at 30 June 2014 (2013: 103%). The rules relating to the LCR, which is expected to be effective from the start of 2015, remain to be finalised. We continue to monitor the ratio based on our interpretation of the rules but it will be subject to revision as the regulatory process develops further. The ratio will also not necessarily be comparable with those of our peers.

Detailed Business Review
Risk Management Report continued
Santander UK plc 2014 Half Yearly Financial Report 73
FUNDING RISK Santander UK’s primary sources of funding, approach to funding risk management and funding strategy and structure are described on pages 139 to 141 of the 2013 Annual Report.
DEPOSIT FUNDING The table below shows customer loans, customer deposits and the loan-to-deposit ratio for the Retail Banking, Commercial Banking and Corporate Centre business divisions at 30 June 2014 and 31 December 2013. Retail Banking and Commercial Banking activities are largely funded by customer deposits with the remaining funded with long-term debt and equity (including funding secured against customer loans and advances). The Markets business division has no customer loans or customer deposits.
The data presented in the table below for the business divisions excludes accrued interest. The table also shows loans and advances to customers, customer deposits and the loan-to-deposit ratio for the Santander UK group at 30 June 2014 and 31 December 2013. The data presented for the Santander UK group includes accrued interest but excludes repurchase agreements and reverse repurchase agreements, as described in “Key Performance Indicators” on page 6 of the 2013 Annual Report.
30 June 2014 Customer loans Customer deposits Loan-to-Deposit ratio £bn £bn % Retail Banking 156.6 126.9 123 Commercial Banking 23.1 14.6 158 Corporate Centre 8.7 9.2 95 Total customer assets / deposits 188.4 150.7 Adjust for: Fair value loans, loan loss reserves, accrued interest and other (2.3) - Statutory customer loans and advances / deposits 186.1 150.7 Less: repurchase agreements and reverse repurchase agreements - (0.9) Total (1) 186.1 149.8 124
31 December 2013 Customer loans Customer deposits Loan-to-Deposit ratio £bn £bn % Retail Banking 155.6 123.2 126Commercial Banking 22.1 12.6 175Corporate Centre 9.4 10.6 89Total customer assets / deposits 187.1 146.4 Adjust for: Fair value loans, loan loss reserves, accrued interest and other (2.5) 0.8 Statutory customer loans and advances / deposits 184.6 147.2 Less: repurchase agreements and reverse repurchase agreements - (0.9) Total (1) 184.6 146.3 126
(1) Total Loan-to-Deposit ratio calculated as loans and advances to customers (excluding reverse repurchase agreements) divided by deposits by customers (excluding repurchase agreements).
WHOLESALE FUNDING Maturity profile of wholesale funding The tables below show Santander UK’s primary wholesale funding sources, excluding short-term repurchase agreements. The tables are prepared taking into account scheduled repayments, and do not reflect the final contractual maturity of the funding. 30 June 2014 Not
more than 1 month
Over 1 but not more
than 3 months
Over 3 but not more
than 6 months
Over 6 but not more
than 9 months
Over 9 but not more
than 12 months
Sub-total less
than 1 year
Over 1 but not more
than 2 years
Over 2 but not more
than 5 years Over 5
years Total £bn £bn £bn £bn £bn £bn £bn £bn £bn £bn Deposits by banks (non-customer deposits) 1.0 0.8 - 0.1 - 1.9 - - - 1.9CDs and Commercial Paper 2.4 2.6 1.4 1.3 0.3 8.0 0.2 - - 8.2Senior unsecured - public benchmark - - 0.9 - 0.2 1.1 1.5 3.6 1.2 7.4 - privately placed - - 0.3 0.1 0.2 0.6 1.0 1.0 0.8 3.4Covered bonds - 0.2 - 0.8 2.0 3.0 - 6.7 6.8 16.5Securitisation and Structured Issuance 2.9 0.8 1.4 2.5 3.0 10.6 5.4 8.2 0.9 25.1Subordinated liabilities - - - 0.1 - 0.1 - 1.1 3.7 4.9Total at 30 June 2014 6.3 4.4 4.0 4.9 5.7 25.3 8.1 20.6 13.4 67.4Of which: - secured 2.9 1.0 1.4 3.3 5.0 13.6 5.4 14.9 7.7 41.6- unsecured 3.4 3.4 2.6 1.6 0.7 11.7 2.7 5.7 5.7 25.8

Detailed Business Review
Risk Management Report continued
74 Santander UK plc 2014 Half Yearly Financial Report
31 December 2013 Not more
than 1 month
Over 1 but not more
than 3 months
Over 3 but not more
than 6 months
Over 6 but not more
than 9 months
Over 9 but not more
than 12 months
Sub-total less
than 1 year
Over 1 but not more
than 2 years
Over 2 but not more
than 5 years Over 5
years Total £bn £bn £bn £bn £bn £bn £bn £bn £bn £bn Deposits by bank (non-customer deposits) 0.1 1.2 - - - 1.3 - - - 1.3CDs and Commercial Paper 1.9 2.2 1.6 0.4 0.5 6.6 - - - 6.6Senior unsecured - public benchmark - 0.8 1.5 - 1.0 3.3 1.1 2.4 0.7 7.5 - privately placed 0.1 0.2 0.2 0.1 0.3 0.9 0.6 0.7 0.7 2.9Covered bonds - - 1.3 0.1 - 1.4 2.8 6.0 6.8 17.0Securitisation and Structured Issuance 1.2 0.3 1.7 3.2 1.3 7.7 7.1 9.7 1.4 25.9Subordinated liabilities - - - - - - - 0.1 4.4 4.5Total at 31 December 2013 3.3 4.7 6.3 3.8 3.1 21.2 11.6 18.9 14.0 65.7Of which: - secured 1.2 0.3 3.0 3.3 1.3 9.1 9.9 15.7 8.2 42.9- unsecured 2.1 4.4 3.3 0.5 1.8 12.1 1.7 3.2 5.8 22.8
Currency composition of wholesale funds At 30 June 2014 and 31 December 2013, the proportions of wholesale funding by major currencies were as follows: 30 June 2014 Sterling US Dollar Euro Other Currencies % % % % Deposits by banks (non-customer deposits) 13 84 3 -CDs and Commercial Paper 19 56 25 -Senior unsecured - public benchmark 5 49 43 3
- privately placed 31 17 46 6Covered bonds 34 - 65 1Securitisation and Structured Issuance 39 31 29 1Subordinated liabilities 66 24 7 3Total at 30 June 2014 33 28 37 2 31 December 2013 Sterling US Dollar Euro Other Currencies % % % % Deposits by banks (non-customer deposits) 9 90 1 -CDs and Commercial Paper 17 65 16 2Senior unsecured - public benchmark 13 41 43 3
- privately placed 40 16 34 10 Covered bonds 29 - 70 1Securitisation and Structured Issuance 35 33 31 1Subordinated liabilities 62 27 8 3Total at 31 December 2013 31 28 39 2
Reconciliation of wholesale funding to the balance sheet The tables below present a reconciliation of wholesale funding to the balance sheet at 30 June 2014 and 31 December 2013. 30 June 2014 Balance sheet line item
Funding analysis
Deposits by banks
Deposits by customers(2)
Debt securities in issue
Financial liabilities
at fair value Trading
liabilities Subordinated
liabilities
Share capital and other equity
instruments(4) £bn £bn £bn £bn £bn £bn £bn £bn Deposits by banks (non-customer deposits) 1.9 - - - - 1.9 - -CDs and Commercial Paper 8.2 - - 7.3 0.9 - - -Senior unsecured - public benchmark 7.4 - - 7.4 - - - - - privately placed 3.4 - - 1.0 2.4 - - -Covered bonds 16.5 - - 16.5 - - - -Securitisation and Structured Issuance 25.1 4.9 0.9 18.1 - 1.2 - -Subordinated liabilities 4.9 - - - - - 3.8 1.1Total wholesale funding 67.4 4.9 0.9 50.3 3.3 3.1 3.8 1.1Repos 7.7 - - - - 7.7 - -Foreign exchange and hedge accounting - - - - - - - -Other 10.9 3.3(1) - - - 7.1(3) 0.5 -Balance sheet total 86.0 8.2 0.9 50.3 3.3 17.9 4.3 1.1 31 December 2013 Balance sheet line item
Funding analysis
Deposits by banks
Deposits by customers(2)
Debt securities in issue
Financial liabilities
at fair value Trading
liabilities Subordinated
liabilities
Share capital and other equity
instruments(4) £bn £bn £bn £bn £bn £bn £bn £bn Deposits by banks (non-customer deposits) 1.3 - - - - 1.3 - -CDs and Commercial Paper 6.6 - - 5.8 0.8 - - -Senior unsecured - public benchmark 7.5 - - 7.5 - - - - - privately placed 2.9 - - 0.3 2.6 - - -Covered bonds 17.0 - - 17.0 - - - -Securitisation and Structured Issuance 25.9 5.5 0.9 19.5 - - - - Subordinated liabilities 4.5 - - - - - 3.9 0.6 Total wholesale funding 65.7 5.5 0.9 50.1 3.4 1.3 3.9 0.6Repos 12.8 - - - - 12.8 - -Foreign exchange and hedge accounting 0.9 - - 0.8 - - 0.1 - Other 10.7 3.2(1) - - - 7.2(3) 0.3 -Balance sheet total 90.1 8.7 0.9 50.9 3.4 21.3 4.3 0.6(1) Principally consists of items in the course of transmission and other deposits. See Note 21 to the Condensed Consolidated Interim Financial Statements. (2) Included in the balance sheet total of £150,734m (2013: £147,167m). (3) Consists of short positions in securities and unsettled trades, cash collateral and short-term deposits. See Note 22 to the Condensed Consolidated Interim Financial Statements. (4) Principally consists of £300m (2013: £300m) fixed/floating rate non-cumulative callable preference shares, £300m step-up callable perpetual reserve capital instruments and £500m perpetual
capital securities. See Note 31 to the Condensed Consolidated Interim Financial Statements.

Detailed Business Review
Risk Management Report continued
Santander UK plc 2014 Half Yearly Financial Report 75
Funding developments in the first half of 2014 (unreviewed) Our overall funding strategy remains to develop and maintain a diversified funding base, which allows us access to a variety of funding sources. As part of this strategy, Santander UK raises funding in a number of currencies, including US dollars and euro, and converts these back into sterling to fund its commercial assets which are largely sterling denominated.
In keeping with the pattern of new issuance in 2013, the focus of new issuance in the first half of 2014 was in the unsecured markets. In total, we issued three public US Dollar unsecured securities and one public Euro unsecured security. In addition to the unsecured issuance, we issued residential mortgage-backed securities and a benchmark Sterling covered bond, two forms of financing that permit us to benefit from our prime UK mortgage assets. The improvement in market sentiment over the medium term continued in the first half of 2014. The wholesale funding markets that we operate in continued to be stable, offering us economically viable sources of funding. This stable market backdrop allowed us to continue to have a more balanced mix of wholesale unsecured and secured new issuance than in recent years. Overall, the cost of wholesale funding continued to fall due to the replacement of expensive medium-term funding maturities with lower cost new issuance in the now more stable capital markets environment.
In the first half of 2014, our medium-term funding issuance was £6.7bn (2013: £6.6bn). This included £500m Perpetual Capital Securities issued to our immediate parent company in June 2014, which issued a similar security to Banco Santander, S.A.. During the first half of 2014, a further £500m of Treasury Bills were drawn under the Bank of England and HM Treasury Funding for Lending Scheme. Maturities in the first half of 2014 were approximately £7.6bn (2013: £16.3bn). At 30 June 2014, 62% (2013: 68%) of wholesale funding had a maturity of greater than one year, with an overall residual duration for wholesale funding of 1,046 days (2013: 1,090 days).
During the first half of 2014, our continuing strategy of building closer customer relationships through the 1|2|3 World retail offering created additional current account liabilities that further strengthened this stable funding source. At the same time, the level of less stable retail and corporate instant access accounts reduced as a constituent of the funding mix. Term issuance In the first half of 2014, the majority of term issuance was in unsecured format, consistent with the issuance strategy in 2013. During the period, term issuance (sterling equivalent) comprised:
Sterling US Dollar Euro
Total 30 June 2014
Total 31 December 2013
£bn £bn £bn £bn £bn Securitisations 0.8 1.0 - 1.8 1.7 Covered bonds - privately placed - - - - 0.5 - publicly placed 0.8 - - 0.8 0.8 Structured notes 0.1 0.1 - 0.2 0.4 Senior unsecured - privately placed - 0.1 1.0 1.1 0.2 - public benchmark - 1.5 0.8 2.3 2.1 Subordinated debt (including Perpetual Capital Securities) 0.5 - - 0.5 0.9 Total gross issuances 2.2 2.7 1.8 6.7 6.6

Detailed Business Review
Risk Management Report continued
76 Santander UK plc 2014 Half Yearly Financial Report
CAPITAL RISK (unreviewed)
Santander UK manages its capital based on an assessment of both regulatory requirements and the economic capital impacts of our businesses. The regulatory capital position at 30 June 2014 is based on the CRD IV rules, which implement Basel III in the EU and came into force on 1 January 2014. Regulatory capital demand is quantified for credit, traded market, banking market, operational, pension obligation and securitisation risk in accordance with PRA requirements. Santander UK produces and shares with the PRA its Internal Capital Adequacy Assessment Process document, which informs the supervisory review and evaluation process by the PRA which can result in additional capital requirements.
The Basel III and CRD IV rules include proposals for the use of a leverage ratio as a backstop measure to risk-based capital ratios. The methodology for calculation of the Leverage Ratio and the required minimum level for banks have not been finalised by the EU and are subject to further modification and calibration. A required minimum level significantly above the Basel III proposed level of 3% could require Santander UK to undertake leverage ratio-enhancing actions. Santander UK and other major UK banks and building societies are currently subjected to a PRA-specified leverage ratio minimum level of 3%; however the FPC are consulting upon measures that could increase this minimum level significantly. During 2014, the Bank of England is conducting concurrent stress tests on major UK banks and building societies, in which Santander UK is participating. The results of this exercise could have a material impact upon minimum capital levels and are expected to be announced towards the end of 2014.
A comparison of the Santander UK Consolidated Balance Sheet to the equivalent regulatory exposure is set out in the ‘Capital Management and Resources’ section in the Balance Sheet Review.
PENSION RISK (unreviewed)
During the first half of 2014, the risk profile of the Santander (UK) Group Pension Scheme, remained stable with the focus on positive performance of the assets relative to liabilities, whilst managing volatility through hedging a proportion of the liabilities with bond assets and derivatives. Santander UK seeks to manage the impact of the pension risk arising from market movements. Consistent with previous periods, the Scheme was managed within the risk triggers and limits.
During the first half of 2014, the accounting deficit of the Scheme improved by £381m, partially driven by positive asset returns as well as a net gain of £218m that arose from scheme changes that limit future defined benefit pension entitlements and provide for the longer term sustainability of our staff pension arrangements.
In addition, the latest triennial Trustee funding valuation at 31 March 2013 was agreed. Following this, an updated schedule of deficit funding contributions was agreed with the Scheme Trustee. The new funding valuation and contribution schedule did not have a significant impact on VaR and stress loss metrics.
Further information on Santander UK’s pension obligations, including the current asset allocation and sensitivity to key risk factors can be found in Note 26 to the Condensed Consolidated Interim Financial Statements.
OPERATIONAL RISK (unreviewed)
A revised Operational Risk Framework was approved at the start of 2014. A comprehensive supporting programme has been developed to ensure that Santander UK manages its operational risk in line with best practice. This programme has enhanced the key toolset elements of Risk Control Self Assessments, Scenario Analysis and Incident & Loss Management. The programme is being rolled out and will also ensure all the associated initiatives are embedded to a Basel II Advanced Measurement Approach equivalent standard by the end of 2016. Operational Risk loss profile The following table sets out Santander UK’s operational risk loss profile for the first six months of 2014. The operational loss categories in the chart replicate the Basel II loss event type classification, although within the Santander UK Risk Framework the responsibility for management of some of these risks may fall within other risk types (for example, Conduct, Regulatory and Legal Risk). The figures and volumes quoted reflect the loss data collection and categorisation policies in place within Santander UK at 30 June 2014. These policies are being updated with the aim of enhancing the degree of comparability with the range of different categorisations employed across the financial services industry.
During the first six months of 2014, the majority of Santander UK’s £83m (year ended 31 December 2013: £221m) of Operational Risk losses arose within the clients, products and business practices category. These principally represented redress payouts (excluding related costs) on the sales of PPI products. See Note 25 to the Condensed Consolidated Interim Financial Statements for more information on PPI.
The key operational risks facing Santander UK include change management, supplier management, conduct, IT and cyber attacks. Industry-wide concerns about external cyber crime remain high. On-going monitoring and oversight continued to be strengthened.
Six months ended
30 June 2014 Year ended
31 December 2013 £m Volume £m Volume Internal Fraud - 234 3 1,318 External Fraud 10 68,198 24 163,272 Employment Practices and Workplace Safety - 71 1 183 Clients, Products, and Business Practices 63 46,084 170 121,363 Damage to Physical Assets - 5 1 66 Business Disruption and Systems Failures - 133 - 1,892 Execution, Delivery, and Process Management 10 274,823 22 614,610 Total 83 389,548 221 902,704

Detailed Business Review
Risk Management Report continued
Santander UK plc 2014 Half Yearly Financial Report 77
CONDUCT RISK (unreviewed)
Conduct risk is the risk that Santander UK’s decisions and behaviours lead to a detriment or poor outcome for our customers. Santander UK considers conduct risk to be a primary risk type and takes a forward-looking approach to managing the risk in alignment with the Conduct Risk Framework. This framework has been developed through Santander UK’s overall Risk Framework and Operational Risk Framework, which include the core principles of risk management and control activities.
The Conduct Risk Framework defines the overriding principles and responsibilities for the identification, management, reporting and oversight of conduct risk. It is the operation of, and outputs from, these risk management activities that enables Santander UK to manage conduct risk exposures. All business units are required to manage their activities in accordance with the principles and guidelines set out in the Conduct Risk Framework, together with those detailed in the Santander UK Risk and Operational Risk Frameworks.
Key business decisions, including product approval, business strategy developments and conduct related remediation programmes are monitored and reported through formal governance committees. A programme of work is planned to continue throughout 2014 to further embed the effective management of conduct risk throughout the business, including a comprehensive cultural change project.
Details of Santander UK’s provision for conduct remediation are set out in Note 25 to the Condensed Consolidated Interim Financial Statements. Further information on conduct remediation provision sensitivities is set out in “Critical accounting policies and Areas of Significant Management Judgement” on page 229 of the 2013 Annual Report.
REGULATORY RISK (unreviewed)
Regulatory risk is the risk of reductions in earnings and/or value, through financial or reputational loss, from failing to comply with applicable codes and regulatory rules. The risk was broadly unchanged from the year-end position; however there have been a number of regulatory developments during the first half of 2014. This includes the implementation of the Mortgage Market Review, which came into force on 26 April 2014. In addition, the first half of 2014 saw the transfer of consumer credit regulation from the OFT to the FCA, which was effective on 1 April 2014. Santander UK has managed these changes across the business and has in a place a robust approach to identifying, assessing, managing and reporting any additional risks emerging from the new requirements. Following FCA thematic reviews in 2012, Santander UK was fined £12m by the FCA in March 2014 in relation to historic investment advice failings. The fine was covered by an existing provision. Whilst no material levels of mis-selling were identified, Santander UK has agreed to undertake a customer contact exercise to relevant customers.
LEGAL RISK (unreviewed)
Santander UK considers legal risk to be a key risk type and manages it in full alignment with the Legal Risk Framework. This Framework has been developed under the Santander UK Risk Framework and explains how Santander UK manages and controls legal risk.
Effective management of legal risk continued and was expanded throughout the first half of 2014. There was a reduction from 2013 in the level of legal risk, expressed through the key risk indicator of aggregated value at risk of all “managed legal claims”.
.

Detailed Business Review
Risk Management Report continued
78 Santander UK plc 2014 Half Yearly Financial Report
AREAS OF FOCUS AND OTHER ITEMS 1. COUNTRY RISK EXPOSURE Santander UK manages its country risk exposure under its global limits framework. Within this framework, Santander UK sets its individual risk appetite for each country, taking into account any factors that may influence the risk profile of each country, including political events, the macro-economic situation and the nature of the risk incurred. Exposures are actively managed if it is considered appropriate. Accordingly, and over recent years, Santander UK has intensified its monitoring of exposures to sovereigns and counterparties in eurozone countries, and has proceeded to selectively divest assets directly or indirectly affected by events in those countries. Banco Santander group-related risk is considered separately.
The country risk tables below show Santander UK’s exposures to central and local governments, government guaranteed counterparties, banks, other financial institutions, retail customers and corporate customers at 30 June 2014 and 31 December 2013. Total exposures consist of the total of balance sheet values and off-balance sheet values. Balance sheet values are calculated in accordance with IFRS (i.e. after the effect of netting agreements recognised in accordance with the requirements of IFRS) except for credit provisions which have been added back. Off balance sheet values consist of undrawn facilities and letters of credit.
The country of exposure has been assigned based on the counterparty’s country of incorporation except where Santander UK is aware that a guarantee is in place, in which case the country of incorporation of the guarantor has been used. The exposures are presented by type of counterparty other than where the specific exposures have been guaranteed by a sovereign counterparty in which case they are presented within the ‘Government guaranteed’ category.
Given the ongoing interest in eurozone economies, disclosures relating to those economies are presented first and highlighted separately.
The tables exclude credit risk exposures to other Banco Santander group companies, which are presented separately on pages 81 to 82.
30 June 2014 Central and local governments
£bn
Government guaranteed
£bn Banks (2)
£bn
Other financial institutions
£bn
Retail
£bn
Corporate
£bn
Total(1)
£bn Eurozone: Peripheral eurozone countries: Ireland - - - 0.1 - 0.4 0.5Spain (excluding Banco Santander) - - 0.2 - - 0.2 0.4Italy 0.7 - 0.1 0.1 - 0.1 1.0Portugal - - - - - - -Other eurozone countries: Germany - - 1.7 - - 0.4 2.1France - 0.5 1.6 0.1 - 0.1 2.3All other eurozone(3) - 0.3 0.7 - 0.1 2.0 3.1 0.7 0.8 4.3 0.3 0.1 3.2 9.4All other countries: UK 21.8 0.4 11.9 3.8 173.6 45.8 257.3US 7.6 - 7.9 0.3 - 0.4 16.2Switzerland 0.7 - 0.4 0.1 - 0.4 1.6Denmark - - 0.1 - - 0.2 0.3Japan 3.5 - 0.1 0.1 - - 3.7Russia - - - - - 0.2 0.2All others(4) - - 2.0 0.5 - 3.2 5.7 33.6 0.4 22.4 4.8 173.6 50.2 285.0Total 34.3 1.2 26.7 5.1 173.7 53.4 294.4(1) Credit exposures exclude cash at hand, the macro hedge of interest rate risk, intangible assets, property, plant and equipment, current and deferred tax assets, retirement benefit assets and
other assets. Loans and advances to customers are included gross of loan loss allowances. (2) Excludes balances with central banks. (3) Includes Luxembourg, Netherlands, Belgium and Finland, as well as Greece of £6m and Cyprus of £28m. (4) Includes Ukraine of £nil.

Detailed Business Review
Risk Management Report continued
Santander UK plc 2014 Half Yearly Financial Report 79
31 December 2013 Central and local governments
£bn
Government guaranteed
£bn Banks (2)
£bn
Other financial institutions
£bn
Retail
£bn
Corporate
£bn
Total(1)
£bn Eurozone: Peripheral eurozone countries: Ireland - - - - - 0.1 0.1 Spain (excluding Banco Santander) - - 0.2 - - 0.1 0.3 Italy 0.8 - 0.1 - - 0.1 1.0 Portugal - - - - - 0.1 0.1 Other eurozone countries: Germany - - 1.6 - - 0.2 1.8 France - 0.4 1.9 - - 0.1 2.4 All other eurozone(3) - 0.2 1.4 - - 1.3 2.9 0.8 0.6 5.2 - - 2.0 8.6 All other countries: UK 24.2 0.4 12.4 5.1 172.7 41.6 256.4 US 5.3 - 8.2 0.1 0.1 0.5 14.2 Switzerland 0.5 - 1.3 - - 0.5 2.3 Denmark - - 1.4 - - 0.1 1.5 Japan 3.8 - 0.1 - - 0.1 4.0 Russia - - - - - 0.2 0.2All others(4) - - 0.8 0.1 0.5 2.8 4.2 33.8 0.4 24.2 5.3 173.3 45.8 282.8 Total 34.6 1.0 29.4 5.3 173.3 47.8 291.4 (1) Credit exposures exclude cash at hand, the macro hedge of interest rate risk, intangible assets, property, plant and equipment, current and deferred tax assets, retirement benefit assets and
other assets. Loans and advances to customers are included gross of loan loss allowances.
(2) Excludes balances with central banks. (3) Includes Luxembourg, The Netherlands, Belgium and Finland, as well as Greece of £3m and Cyprus of £nil. (4) Includes Ukraine of £nil. 30 June 2014 compared to 31 December 2013 (unreviewed) Key changes in sovereign and other country risk exposures during the six months ended 30 June 2014 were as follows: > An increase of £0.9bn in exposure to the UK to £257.3bn (2013: £256.4bn). This was primarily due to increased commitments and
undrawn facilities in UK Corporate and Other Financial Institutions and retail mortgage lending, partially offset by a decrease in cash held with the Bank of England as part of normal liquid asset portfolio management activity.
> An increase of £2.0bn in exposure to the US to £16.2bn (2013: £14.2bn). This was primarily due to additional securities purchased under resale activity and an increase in deposits at the US Federal Reserve as part of normal liquid asset portfolio management activity.
> A decrease of £0.7bn in exposure to Switzerland to £1.6bn (2013: £2.3bn). This was due to reduced securities purchased under resale activity and lower gross derivative exposures.
> An increase of £0.3bn in exposures to Germany to £2.1bn (2013: £1.8bn). This was primarily due to increased securities purchased under resale activity, partially offset by lower gross derivative exposures.
> A decrease of £0.3bn in exposures to Japan to £3.7bn (2013: £4.0bn). This was primarily due to disposals of government securities as part of normal liquid asset portfolio management activity.
> An increase of £0.4bn in exposures to Ireland to £0.5bn (2013: £0.1bn). This was due to increased corporate lending, additional securities purchased under resale activity and new corporate facilities provided.
> An increase of £0.1bn in exposures to Spain to £0.4bn (2013: £0.3bn). This was due to new corporate facilities provided.
> A decrease of £1.2bn in exposures to Denmark to £0.3bn (2013: £1.5bn). This was principally due to the disposal of securities purchased under resale activity.
> Movements in the remaining country risk exposures were minimal and exposures to these countries remained at low levels.

Detailed Business Review
Risk Management Report continued
80 Santander UK plc 2014 Half Yearly Financial Report
Peripheral eurozone countries This section discusses Santander UK's direct exposure to peripheral eurozone countries at 30 June 2014 and 31 December 2013 by type of financial instrument. It excludes balances with other Banco Santander group companies which are presented separately on pages 81 to 82. This section also discusses our indirect exposures to peripheral eurozone countries
Direct and indirect risk exposures to peripheral eurozone countries arise primarily in the large corporate element of the portfolio via large multinational companies and financial institutions, which are monitored on a regular basis by the Wholesale Credit Risk Department as part of the overall risk management process. The corporate portfolio is mainly comprised of multinational UK companies which are considered to be geographically well diversified in terms of their assets, operations and profits. The remainder of the Commercial Banking portfolio is predominately UK based with no material peripheral eurozone exposure. In addition, the risk is further mitigated by the fact that credit agreements are underpinned by both financial and non-financial covenants.
The risk arising from indirect exposures from our transactions with financial institutions is mitigated by the short-term tenor of the transactions, and by the fact that many such transactions contain margin calls and/or collateral requirements, and are subject to standard ISDA Master Agreements permitting offsetting.
The risk arising from indirect exposures from our transactions with other corporates is mitigated by standard financial and non-financial guarantees and the fact that the companies are geographically well diversified in terms of their assets, operations and profits. Direct exposures to peripheral eurozone countries Balances with respect to Italy at 30 June 2014 comprised trading assets issued by central and local governments of £0.7bn (2013: £0.8bn), loans and receivables securities issued by banks of £nil (2013: £0.1bn), commitments and undrawn facilities with corporate customers and other financial institutions of £0.2bn (2013: £0.1bn) and derivative assets issued by banks of £0.1bn (2013: £0.1bn) net of derivative liabilities held by banks of £nil (2013: £0.1bn).
Balances with respect to Spain at 30 June 2014 comprised loans and receivables securities issued by banks of £0.1bn (2013: £0.1bn), derivative assets issued by banks of £0.1bn (2013: £0.1bn), and commitments and undrawn facilities with corporate customers of £0.2bn (2013: £0.1bn).
Balances with respect to Ireland at 30 June 2014 comprised trading assets with corporate customers of £0.2bn (2013: £nil), loans and advances to corporate customers of £nil (2013: £0.1bn), loans and receivables securities issued by other financial institutions of £0.1bn (2013: £nil) and commitments and undrawn facilities with corporate customers of £0.2bn (2013: £nil).
Balances with respect to Portugal at 30 June 2014 were £nil (2013: £0.1bn). Indirect exposures to peripheral eurozone countries Indirect exposures to peripheral eurozone countries are considered to exist where our direct counterparties outside the peripheral eurozone countries themselves have a direct exposure to one or more peripheral eurozone countries. Indirect exposures are identified as part of our ongoing credit analysis and monitoring of our counterparty base by the review of available financial information to determine the countries where the material parts of a counterparty’s assets, operations or profits arise.
Our indirect exposures to peripheral eurozone countries consist of a small number of corporate loans to large multinational companies based in the UK that derive a proportion of their profits from one or more peripheral eurozone countries; trading transactions and hedging transactions with financial institutions based in the UK and Europe that derive a proportion of their profits from or have a proportion of their assets in one or more peripheral eurozone countries; and a small number of loans to other corporate entities which have either a proportion of their operations within, or profits from, one or more peripheral eurozone countries. We have no significant indirect exposure to peripheral eurozone countries in our retail business.

Detailed Business Review
Risk Management Report continued
Santander UK plc 2014 Half Yearly Financial Report 81
Balances with other Banco Santander group companies Santander UK enters into transactions with other Banco Santander group companies in the ordinary course of business. Such transactions are undertaken in areas of business where Santander UK has a particular advantage or expertise and where other Banco Santander group companies can offer commercial opportunities, substantially on the same terms as for comparable transactions with third party counterparties. These transactions also arise in support of the activities of, or with, larger multinational corporate clients and financial institutions which may have relationships with a number of entities in the Banco Santander group.
At 30 June 2014 and 31 December 2013, Santander UK had gross balances with other Banco Santander group companies as follows:
30 June 2014 Banks £bn
Other financial institutions £bn
Corporate £bn
Total £bn
Assets: - Spain 2.2 - - 2.2- UK - 0.6 0.2 0.8- Chile 0.2 - - 0.2 2.4 0.6 0.2 3.2Liabilities: - Spain (3.5) (0.6) - (4.1)- UK - (1.8) (0.1) (1.9)- Italy - (0.2) - (0.2)- Chile (0.1) - - (0.1)- Germany - (0.1) - (0.1)- Other < £100m (0.1) (0.5) - (0.6) (3.7) (3.2) (0.1) (7.0) 31 December 2013 Banks
£bn Other financial institutions
£bn Corporate
£bn Total £bn
Assets: - Spain 2.2 0.1 - 2.3 - UK - 0.7 0.2 0.9 - Chile 0.1 - - 0.1 - Other < £100m 0.1 - - 0.1 2.4 0.8 0.2 3.4 Liabilities: - Spain (3.7) (0.8) - (4.5) - UK - (1.8) (0.1) (1.9) - Italy - (0.2) - (0.2) - Chile (0.1) - - (0.1) - Germany - (0.1) - (0.1) - Other < £100m (0.1) (0.5) (0.1) (0.7) (3.9) (3.4) (0.2) (7.5) The above activities are conducted in a manner that appropriately manages the credit risk arising against such other Banco Santander group companies within limits acceptable to the PRA. 30 June 2014 compared to 31 December 2013 (unreviewed) The above balances with other Banco Santander group companies at 30 June 2014 principally consisted of: > Reverse repos of £nil (2013: £50m), in the prior period all of which were collateralised by OECD Government (but not peripheral
eurozone) securities. The reverse repos were classified as “Loans and Advances to banks” in the balance sheet and were offset by repo liabilities of £nil (2013: £50m), classified as “Deposits by banks”. See Notes 13 and 21 to the Condensed Consolidated Interim Financial Statements.
> Derivative assets of £2,243m (2013: £2,224m) subject to International Swaps and Derivatives Association (‘ISDA’) Master Agreements including the Credit Support Annex. These balances were offset by derivative liabilities of £2,240m (2013: £2,141m) and cash collateral received, as described below, and are included in Note 11 to the Condensed Consolidated Interim Financial Statements.
> Cash collateral of £103m (2013: £112m) given in relation to derivatives futures contracts. The cash collateral was classified as “Trading assets” in the balance sheet. This was more than offset by cash collateral received in relation to other derivatives of £723m (2013: £829m), classified as “Trading liabilities” and “Deposits by banks”. See Notes 10, 21 and 22 to the Condensed Consolidated Interim Financial Statements.
> Asset-backed securities of £21m (2013: £23m), which were classified as “Loans and receivables securities” in the balance sheet.
> Asset-backed securities of £57m (2013: £56m), which were classified as “Financial assets designated at fair value” in the balance sheet. See Note 12 to the Condensed Consolidated Interim Financial Statements.
> Deposits by customers of £1,130m (2013: £1,014m).
> Debt securities in issue of £489m (2013: £654m). These balances represent holdings of debt securities by the wider Banco Santander group as a result of market purchases and for liability management purposes. The decrease in the period reflected contractual maturities. See Note 24 to the Condensed Consolidated Interim Financial Statements.
> Other liabilities of £36m (2013: £247m).
> Subordinated liabilities of £2,307m (2013: £2,229m) reflecting holdings of debt securities by the wider Banco Santander group as a result of market purchases and for liability management purposes.
> Financial Liabilities designed at fair value of £271m (2013: £189m). See Note 23 to the Condensed Consolidated Interim Financial Statements.

Detailed Business Review
Risk Management Report continued
82 Santander UK plc 2014 Half Yearly Financial Report
The next section further analyses the balances with other Banco Santander group companies at 30 June 2014 and 31 December 2013 by type of financial instrument and country of the counterparty. Spain 30 June 2014 Banks
£bn Other financial institutions
£bn Corporate
£bn Total
£bn Derivatives:
- Derivative assets 2.0 - - 2.0- Derivative liabilities (2.0) - - (2.0)
Cash collateral in relation to derivatives: - placed 0.1 - - 0.1 - held (0.7) - - (0.7)
Net derivatives position (0.6) - - (0.6)Other assets 0.1 - - 0.1 Total assets, after the impact of collateral (0.5) - - (0.5)Deposits by customers - (0.6) - (0.6)Debt securities in issue - (0.1) - (0.1)Subordinated liabilities (0.7) - - (0.7)Total liabilities (0.7) (0.7) - (1.4)Net balance (1.2) (0.7) - (1.9) 31 December 2013 Banks
£bn Other financial institutions
£bn Corporate
£bn Total £bn
Repurchase agreements - Asset balance - reverse repo 0.1 - - 0.1
Net repurchase agreement position 0.1 - - 0.1 Derivatives:
- Derivative assets 2.0 - - 2.0 - Derivative liabilities (1.9) - - (1.9)
Cash collateral in relation to derivatives: - placed 0.1 - - 0.1 - held (0.8) - - (0.8)
Net derivatives position (0.6) - - (0.6) Asset-backed securities - 0.1 - 0.1 Total assets, after the impact of collateral (0.5) 0.1 - (0.4) Deposits by customers - (0.6) - (0.6) Debt securities in issue (0.1) (0.1) - (0.2) Other liabilities (0.2) (0.1) - (0.3) Subordinated liabilities (0.7) - - (0.7) Total liabilities (1.0) (0.8) - (1.8) Net balance (1.5) (0.7) - (2.2) Other countries Balances with respect to Belgium at 30 June 2014 comprised debt securities in issue of £0.4bn (2013: £0.5bn). Balances with respect to the UK at 30 June 2014 comprised other assets of £0.8bn (2013: £0.9bn), deposits by customers of £0.2bn (2013: £0.3bn) and subordinated liabilities of £1.6bn (2013: £1.6bn). Balances with respect to Italy at 30 June 2014 comprised debt securities in issue (purchased in the secondary market) of £0.2bn (2013: £0.2bn). Balances with respect to Germany at 30 June 2014 comprised deposits by customers of £0.1bn (2013: £0.1bn). Balances with respect to Chile at 30 June 2014 comprised derivative assets of £0.1bn (2013: £0.1bn) and derivative liabilities of £0.1bn (2013: £0.1bn).

Sa
TEb E NENH2NhHb
D T (a
(b
(c
A
AC1
antander UK plc 2014
he Directors of xecutive Officer elow. José María
EXECUTIVE
Nathan BostocExecutive DireNathan Bostock (He was previousl
014). He joinedNational plc (now
is time with AbbHuman Resource
efore that with
Directors’ R
he Half Yearly Fi
a) the condadopted b
b) the interithe first s
c) the interiand chan
Approved by the
Ana Botín Chief Executive3 August 2014
4 Half Yearly Financial
Santander UK p and Executive Da Nus resigned a
E DIRECTO
ck ector and Dep(age 53) will joiny an Executive D RBS in 2009 as
w Santander UK bey National plc
es. Nathan was aChase Manhatta
Responsibilit
inancial Report i
ensed consolidaby the European
m managementsix months and d
m managementges therein).
Board of Santan
e Officer 4
l Report
plc are listed in Director of Santaas an Executive D
ORS
puty Chief Exn as Deputy ChieDirector and thes Head of Restru plc) from 2001 c, he held varioualso previously aan Bank in a var
ty Stateme
s the responsibi
ated interim finan Union;
t report includesdescription of pr
t report includes
nder UK plc and
the 2013 Annuander UK plc witDirector of the C
xecutive Officef Executive Office Group Financeucturing and Ris and served on tus senior positionat RBS again beiety of areas and
ent
lity of the Direct
ancial statement
s a fair review oincipal risks and
a fair review of
signed on its be
ual Report. In adth effect from 1
Company with ef
cer cer and Executiv
e Director at Thesk and Group Cthe Board as an ns including Chi
efore that (1991d functions. He i
tors who confirm
ts has been prep
f the informatio uncertainties fo
f the information
ehalf by:
ddition to those 9 August 2014.ffect from 1 Apr
ve Director of Sae Royal Bank of hief Risk Officer Executive Directief Financial Off – 2001) in a ns a chartered ac
m to the best of t
pared in accorda
on required by Dor the remaining
n required by DT
listed, Nathan Nathan Bostock
ril 2014.
ntander UK plc wScotland Group. Previous to thator from 2005 uicer and Executivumber of seniorcountant and ho
their knowledge
ance with IAS 3
DTR 4.2.7R (indic six months of th
TR 4.2.8R (disclo
Bostock will joink’s biographical
with effect fromp plc (‘RBS’) (Octat, he spent eig
until his departurve Director, Finar positions and olds a BSc (Hons
e:
34 ‘Interim Finan
cation of importhe year); and
osure of related
Governan
Directo
n as Deputy Ch details are show
m 19 August 201tober 2013 – Mht years at Abbre in 2009. Durinance, Markets anspent seven yea
s) in Mathematic
ncial Reporting’
tant events durin
party transactio
ce
rs
83
ief wn
4. ay
bey ng nd ars cs.
as
ng
ons

Financial Statements
84 Santander UK plc 2014 Half Yearly Financial Report
Index 85 Independent Review Report to Santander UK plc 86 Condensed Consolidated Income Statement for the six months ended 30 June 2014 and 2013 86 Condensed Consolidated Statement of Comprehensive Income for the six months ended 30 June 2014 and 2013 87 Condensed Consolidated Balance Sheet at 30 June 2014 and 31 December 2013 88 Condensed Consolidated Statement of Changes in Equity for the six months ended 30 June 2014 and 2013 89 Condensed Consolidated Cash Flow Statement for the six months ended 30 June 2014 and 2013 90 Notes to the Financial Statements

Review Report
Santander UK plc 2014 Half Yearly Financial Report 85
Independent Review Report to Santander UK plc We have been engaged by Santander UK plc (the ‘Company’) to review the condensed set of financial statements in the half-yearly financial report for the six months ended 30 June 2014 comprising the Condensed Consolidated Income Statement, the Condensed Consolidated Statement of Comprehensive Income, the Condensed Consolidated Balance Sheet, the Condensed Consolidated Statement of Changes in Equity, the Condensed Consolidated Cash Flow Statement, the related Notes 1 to 34, the information on pages 36 to 82 of the Risk Management Report in the Detailed Business Review except for those items marked as unreviewed, together the Condensed Consolidated Interim Financial Statements. We have read the other information contained in the half-yearly financial report and considered whether it contains any apparent misstatements or material inconsistencies with the information in the condensed set of financial statements.
This report is made solely to the Company in accordance with International Standard on Review Engagements (UK and Ireland) 2410 "Review of Interim Financial Information Performed by the Independent Auditor of the Entity" issued by the Auditing Practices Board. Our work has been undertaken so that we might state to the Company those matters we are required to state to it in an independent review report and for no other purpose. To the fullest extent permitted by law, we do not accept or assume responsibility to anyone other than the Company, for our review work, for this report, or for the conclusions we have formed. Directors' responsibilities The half-yearly financial report is the responsibility of, and has been approved by, the directors. The directors are responsible for preparing the half-yearly financial report in accordance with the Disclosure and Transparency Rules of the United Kingdom’s Financial Conduct Authority.
As disclosed in Note 1, the annual financial statements of the Company are prepared in accordance with IFRSs as adopted by the European Union. The condensed set of financial statements included in this half-yearly financial report has been prepared in accordance with International Accounting Standard 34, "Interim Financial Reporting," as adopted by the European Union. Our responsibility Our responsibility is to express to the Company a conclusion on the condensed set of financial statements in the half-yearly financial report based on our review. Scope of Review We conducted our review in accordance with International Standard on Review Engagements (UK and Ireland) 2410 "Review of Interim Financial Information Performed by the Independent Auditor of the Entity" issued by the Auditing Practices Board for use in the United Kingdom. A review of interim financial information consists of making inquiries, primarily of persons responsible for financial and accounting matters, and applying analytical and other review procedures. A review is substantially less in scope than an audit conducted in accordance with International Standards on Auditing (UK and Ireland) and consequently does not enable us to obtain assurance that we would become aware of all significant matters that might be identified in an audit. Accordingly, we do not express an audit opinion. Conclusion Based on our review, nothing has come to our attention that causes us to believe that the condensed set of financial statements in the half-yearly financial report for the six months ended 30 June 2014 is not prepared, in all material respects, in accordance with International Accounting Standard 34 as adopted by the European Union and the Disclosure and Transparency Rules of the United Kingdom’s Financial Conduct Authority.
Deloitte LLP Chartered Accountants and Statutory Auditor London, United Kingdom 13 August 2014

Financial Statements
Primary Financial Statements
86 Santander UK plc 2014 Half Yearly Financial Report
Condensed Consolidated Income Statement (unaudited) For the six months ended 30 June 2014 and 2013
Notes
Six months ended 30 June 2014
£m
Six months ended 30 June 2013(1)
£m Interest and similar income 3,421 3,624Interest expense and similar charges (1,748) (2,233)Net interest income 1,673 1,391Fee and commission income 534 532Fee and commission expense (169) (143)Net fee and commission income 365 389Net trading and other income 3 154 181Total operating income 2,192 1,961Administration expenses 4 (876) (992)Depreciation, amortisation and impairment 5 (347) (121)Total operating expenses excluding impairment losses, provisions and charges (1,223) (1,113)Impairment losses on loans and advances 6 (172) (235)Provisions for other liabilities and charges 6 (252) (152)Total operating impairment losses, provisions and charges (424) (387)Profit on continuing operations before tax 545 461Tax on profit on continuing operations 7 (107) (90)Profit on continuing operations after tax 438 371Loss from discontinued operations after tax 8 - (12)Profit after tax for the period 438 359 Attributable to: Equity holders of the parent 438 359 (1) Adjusted to reflect the adoption of IFRIC 21, as described in Note 1.
Condensed Consolidated Statement of Comprehensive Income (unaudited) For the six months ended 30 June 2014 and 2013
Note
Six months ended 30 June 2014
£m
Six months ended 30 June 2013(1)
£m Profit for the period 438 359 Other comprehensive income/(expense): Other comprehensive income that may be reclassified to profit or loss subsequently: Available-for-sale securities
- Gains on available-for-sale securities 38 28 - Gains on available-for-sale securities transferred to profit or loss - (53) - Tax on above items (8) 6 30 (19)
Cash flow hedges: - Losses on cash flow hedges (329) (429) - Losses on cash flow hedges transferred to profit or loss 601 370
- Tax on above items (58) 14 214 (45)
Exchange differences on translation of foreign operations 1 (2) Net other comprehensive income/(expense) that may be reclassified to profit or loss
subsequently 245 (66)
Other comprehensive income that will not be reclassified to profit or loss subsequently: Remeasurement of defined benefit pension obligations 26 128 (233) Tax on above item (26) 54Net other comprehensive expense that will not be reclassified to profit or loss subsequently 102 (179)Total other comprehensive expense for the period net of tax 347 (245)Total comprehensive income for the period 785 114Attributable to: Equity holders of the parent 785 114 (1) Adjusted to reflect the adoption of IFRIC 21, as described in Note 1.
The accompanying Notes on pages 90 to 118 and the reviewed sections of the Risk Management Report on pages 36 to 82 form an integral part of these Condensed Consolidated Interim Financial Statements.

Financial Statements
Primary Financial Statements continued
Santander UK plc 2014 Half Yearly Financial Report 87
Condensed Consolidated Balance Sheet (unaudited) At 30 June 2014 and 31 December 2013
Notes
30 June 2014 £m
31 December 2013(1) £m
Assets Cash and balances at central banks 26,568 26,374Trading assets 10 18,701 22,294Derivative financial instruments 11 19,159 20,049Financial assets designated at fair value 12 2,754 2,747Loans and advances to banks 13 2,325 2,347Loans and advances to customers 14 186,094 184,587Loans and receivables securities 869 1,101Available-for-sale securities 16 7,755 5,005Macro hedge of interest rate risk 727 769Interests in other entities 17 36 27 Intangible assets 18 2,105 2,335Property, plant and equipment 19 1,530 1,521Current tax assets 50 114Deferred tax assets 20 - 16Retirement benefit assets 26 235 118Other assets 1,312 882Total assets 270,220 270,286Liabilities Deposits by banks 21 8,234 8,696Deposits by customers 150,734 147,167Trading liabilities 22 17,848 21,278Derivative financial instruments 11 19,030 18,863Financial liabilities designated at fair value 23 3,252 3,407Debt securities in issue 24 50,258 50,870Subordinated liabilities 4,272 4,306Other liabilities 1,887 1,883Provisions 25 610 550Current tax liabilities 2 4Deferred tax liabilities 20 87 - Retirement benefit obligations 26 408 672Total liabilities 256,622 257,696Equity Share capital and other equity instruments 31 4,209 3,709Share premium 5,620 5,620Retained earnings 3,640 3,377Other reserves 129 (116)Total shareholders’ equity 13,598 12,590Total liabilities and equity 270,220 270,286(1) Adjusted to reflect the adoption of IFRIC 21, as described in Note 1. The accompanying Notes on pages 90 to 118 and the reviewed sections of the Risk Management Report on pages 36 to 82 form an integral part of these Condensed Consolidated Interim Financial Statements.

Financial Statements
Primary Financial Statements continued
88 Santander UK plc 2014 Half Yearly Financial Report
Condensed Consolidated Statement of Changes in Equity (unaudited) For the six months ended 30 June 2014 and 2013
Other reserves
Share capital and other
equity instruments
£m
Share premium
£m
Available for sale reserve
£m
Cash flow hedging reserve
£m
Foreign currency
translation reserve
£m
Retained earnings(1)
£m Total
£m 1 January 2014 3,709 5,620 (23) (110) 17 3,377 12,590Total comprehensive income/(expense): - Profit for the period - - - - - 438 438- Other comprehensive income/(expense): - Gains on available-for-sale securities - - 38 - - - 38 - Losses on cash flow hedges - - - (329) - - (329) - Losses on cash flow hedges transferred to profit or loss - - - 601 - - 601 - Remeasurement of defined benefit pension obligations - - - - - 128 128 - Exchange differences on translation of foreign operations - - - - 1 - 1 - Tax on other comprehensive income/(expense) - - (8) (58) - (26) (92)Other comprehensive income/(expense) net of tax - - 30 214 1 102 347Issue of Perpetual Capital Securities 500 - - - - - 500Dividends and other distributions - - - - - (277) (277)30 June 2014 4,209 5,620 7 104 18 3,640 13,598 1 January 2013 3,999 5,620 1 - 17 3,406 13,043 Total comprehensive income/(expense): - Profit for the period - - - - - 359 359 Other comprehensive income/(expense):
- Gains on available-for-sale securities - - 28 - - - 28 - Gains on available-for-sale securities transferred to profit or
loss - - (53) - - - (53)
- Losses on cash flow hedges - - - (429) - - (429) - Losses on cash flow hedges transferred to profit or loss - - - 370 - - 370 - Remeasurement of defined benefit pension obligations - - - - - (233) (233) - Exchange differences on translation of foreign operations - - - - (2) - (2) - Tax on other comprehensive income/(expense) - - 6 14 - 54 74
Other comprehensive income/(expense) net of tax - - (19) (45) (2) (179) (245) Dividends and other distributions - - - - - (272) (272) 30 June 2013 3,999 5,620 (18) (45) 15 3,314 12,885 (1) Adjusted to reflect the adoption of IFRIC 21, as described in Note 1.
The accompanying Notes on pages 90 to 118 and the reviewed sections of the Risk Management Report on pages 36 to 82 form an integral part of these Condensed Consolidated Interim Financial Statements.

Financial Statements
Primary Financial Statements continued
Santander UK plc 2014 Half Yearly Financial Report 89
Condensed Consolidated Cash Flow Statement (unaudited) For the six months ended 30 June 2014 and 2013
Notes
Six months ended 30 June 2014
£m
Six months ended 30 June 2013(1)
£m
Cash flows (used in)/from operating activities Profit for the period 438 371 Adjustments for: Non cash items included in profit (5) 767 Change in operating assets (1,824) (1,696) Change in operating liabilities 2,262 8,843 Corporation taxes (paid)/received (25) (31) Effects of exchange rate differences (1,098) 2,021 Net cash flow (used in)/from operating activities 28 (252) 10,275 Cash flows (used in)/from investing activities Interests in other entities - (3) Purchase of property, plant and equipment and intangible assets 18,19 (147) (145) Proceeds from sale of property, plant and equipment and intangible assets 17 80 Purchase of available-for-sale securities (3,193) (2,415) Proceeds from sale and redemption of available-for-sale securities 418 2,765 Net cash flow (used in)/from investing activities (2,905) 282 Cash flows from/(used in) financing activities Issue of debt securities 10,983 13,997 Issue of Perpetual Capital Securities 31 500 - Repayment of debt securities (12,046) (20,314) Dividends paid on ordinary shares 9 (210) (450) Dividends paid on preference shares classified in equity 9 (19) (19) Dividends paid on Reserve Capital Instruments 9 (21) (21) Dividends paid on Perpetual Preferred Securities 9 - (17) Net cash flow used in financing activities (813) (6,824) Net (decrease)/increase in cash and cash equivalents (3,970) 3,733 Cash and cash equivalents at beginning of the period 37,179 41,305 Effects of exchange rate changes on cash and cash equivalents (579) 516 Cash and cash equivalents at the end of the period 28 32,630 45,554 (1) Adjusted to reflect the adoption of IFRIC 21, as described in Note 1. The accompanying Notes on pages 90 to 118 and the reviewed sections of the Risk Management Report on pages 36 to 82 form an integral part of these Condensed Consolidated Interim Financial Statements.

Financial Statements
Notes to the Financial Statements
90 Santander UK plc 2014 Half Yearly Financial Report
1. ACCOUNTING POLICIES These Condensed Consolidated Interim Financial Statements are prepared for Santander UK plc (the ‘Company’) and the Santander UK plc group (the ‘Santander UK group’) under the Companies Act 2006. The principal activity of the Santander UK group is the provision of an extensive range of personal financial services, and a wide range of banking and financial services to business and public sector customers.
Santander UK plc is a public limited company, incorporated in England and Wales having a registered office in England. It is an operating company undertaking banking and financial services transactions.
BASIS OF PREPARATION The financial information in these Condensed Consolidated Interim Financial Statements does not constitute statutory accounts as defined in section 434 of the Companies Act 2006. Statutory accounts for the year ended 31 December 2013 have been delivered to the Registrar of Companies. The auditor’s report on those accounts was unqualified, did not draw attention to any matters by way of emphasis and did not contain a statement under section 498(2) or (3) of the Companies Act 2006.
Compliance with International Financial Reporting Standards The Condensed Consolidated Interim Financial Statements have been prepared in accordance with International Accounting Standard (‘IAS’) 34 ‘Interim Financial Reporting’, as adopted by the European Union and the Disclosure Rules and Transparency Rules of the Financial Conduct Authority (‘FCA’). They do not include all the information and disclosures normally required for full annual financial statements and should be read in conjunction with the Consolidated Financial Statements of the Santander UK plc group for the year ended 31 December 2013 which were prepared in accordance with International Financial Reporting Standards (‘IFRS’) as adopted by the European Union. Those Consolidated Financial Statements were also prepared in accordance with IFRS as issued by the International Accounting Standards Board (‘IASB’). There were no applicable differences between the two frameworks for the periods presented.
The same accounting policies, presentation and methods of computation are followed in these Condensed Consolidated Interim Financial Statements as were applied in the presentation of the Santander UK group’s 2013 Annual Report, except as otherwise described below. Copies of the Santander UK group’s 2013 Annual Report are available on the Santander UK group’s website or upon request from Investor Relations, Santander UK plc, 2 Triton Square, Regent’s Place, London NW1 3AN. The British Bankers’ Association Code for Financial Reporting Disclosure The British Bankers’ Association Code for Financial Reporting Disclosure (the ‘Disclosure Code’) sets out disclosure principles together with supporting guidance in respect of the financial statements of UK banks. The Santander UK group has adopted the Disclosure Code and these Condensed Consolidated Interim Financial Statements have been prepared in compliance with the Disclosure Code’s principles. Recent accounting developments In 2014, the Santander UK group adopted the following new accounting pronouncements and amendments to standards which became effective for financial years beginning on 1 January 2014. a) IAS 32 ‘Financial Instruments: Presentation’ - In December 2011, the IASB issued amendments to IAS 32 entitled ‘Offsetting Financial
Assets and Financial Liabilities’ which clarified the requirements for offsetting financial instruments and addressed inconsistencies in current practice when applying the offsetting criteria in IAS 32 ‘Financial Instruments: Presentation’. The amendments are effective for annual periods beginning on or after 1 January 2014 with early adoption permitted and are required to be applied retrospectively. The amendments did not have a material effect on the Condensed Consolidated Interim Financial Statements.
b) IFRIC Interpretation 21 ‘Levies’ - In May 2013, IFRIC issued IFRIC 21 which provides guidance on accounting for the liability to pay a government imposed levy. IFRIC 21 is effective for annual periods beginning on or after 1 January 2014. This interpretation clarifies that the obligating event that gives rise to a liability to pay a government levy is the activity that triggers the payment of the levy as set out in the relevant legislation. An entity does not have a constructive obligation to pay a levy that will be triggered by operating in a future period. The adoption of IFRIC 21 changed the accounting for the Financial Services Compensation Scheme (‘FSCS’) but did not affect the accounting for any other government imposed levy paid by the Santander UK group. In accordance with IFRIC 21, which has been applied retrospectively, FSCS levies are not recognised earlier than the levy year commencing 1 April to which the levies relate.
The impact of applying IFRIC 21 at 1 January 2014 was to increase retained earnings by £70m, increase deferred tax liabilities by £19m, and to reduce provisions by £89m. The impact of IFRIC 21 on the results for the six months ended 30 June 2013 was to increase provisions for other liabilities and charges by £88m and reduce profit on continuing items before tax by the same amount and increase tax on profit on continuing items by £19m. The impact of applying IFRIC 21 at 1 January 2013 was to increase retained earnings by £94m, increase deferred tax liabilities by £25m, and to reduce provisions by £119m. In accordance with IFRIC 21, FSCS levies of £100m have been recognised in provisions for other liabilities and charges for the six months ended 30 June 2014 (see Note 25).
c) There are a number of other changes to IFRS that were effective from 1 January 2014. Those changes did not have a significant impact on the Santander UK group’s Condensed Consolidated Interim Financial Statements.

Financial Statements
Notes to the Financial Statements continued
Santander UK plc 2014 Half Yearly Financial Report 91
Future accounting developments
The Santander UK group has not yet adopted the following significant new or revised standards and interpretations, and amendments thereto, which have been issued but which are not yet effective for the Santander UK group: a) IFRS 9 ‘Financial Instruments’ (‘IFRS 9’) – In July 2014, the IASB issued the final version of IFRS 9 which includes the completion of all
phases of the project to replace IAS 39 ‘Financial Instruments: Recognition and Measurement’ as discussed below. Phase 1: Classification and measurement of financial assets and financial liabilities. Financial assets are classified on the basis of
the business model within which they are held and their contractual cash flow characteristics. The standard also introduces a ‘fair value through other comprehensive income’ measurement category for particular simple debt instruments. The requirements for the classification and measurement of financial liabilities were carried forward unchanged from IAS 39, however, the requirements relating to the fair value option for financial liabilities were changed to address own credit risk and, in particular, the presentation of gains and losses within other comprehensive income.
Phase 2: Impairment methodology. IFRS 9 fundamentally changes the impairment requirements relating to the accounting for an entity’s expected credit losses on its financial assets and commitments to extend credit. It is no longer necessary for a credit event to have occurred before credit losses are recognised. Instead, an entity always accounts for expected credit losses, and changes in those expected credit losses. The amount of expected credit losses is updated at each reporting date to reflect changes in credit risk since initial recognition.
Phase 3: Hedge accounting. These requirements align hedge accounting more closely with risk management and establish a more principle-based approach to hedge accounting. Dynamic hedging of open portfolios is being dealt with as a separate project and until such time as that project is complete, entities can choose between applying the hedge accounting requirements of IFRS 9 or to continue to apply the existing hedge accounting requirements in IAS 39. The revised hedge accounting requirements in IFRS 9 are applied prospectively.
The effective date of IFRS 9 is 1 January 2018. For annual periods beginning before 1 January 2018, an entity may elect to early apply only the requirements for the presentation of gains and losses on financial liabilities designated at fair value through profit or loss. At the date of publication of these Condensed Consolidated Interim Financial Statements the standard is awaiting EU endorsement and the impact of the standard is currently being assessed. It is not yet practicable to quantify the effect of IFRS 9 on these Condensed Consolidated Interim Financial Statements.
b) IFRS 15 ‘Revenue from Contracts with Customers’ (‘IFRS 15’) – In May 2014, the IASB issued IFRS 15. The effective date of IFRS 15 is 1
January 2017. The standard establishes the principles that shall be applied in connection with revenue from contracts with customers including the core principle that the recognition of revenue must depict the transfer of promised goods or services to customers in an amount that reflects the entitlement to consideration in exchange for those good and services. IFRS 15 applies to all contracts with customers but does not apply to lease contracts, insurance contracts, financial instruments and certain non-monetary exchanges. At the date of publication of these Condensed Consolidated Interim Financial Statements the standard is awaiting EU endorsement. Whilst it is expected that a significant proportion of the Santander UK group’s revenue will be outside the scope of IFRS 15, the impact of the standard is currently being assessed. It is not yet practicable to quantify the effect the effect of IFRS 15 on these Condensed Consolidated Interim Financial Statements.
c) There are a number of other standards which have been issued or amended that are expected to be effective in future periods. However, it is not practicable to provide a reasonable estimate of their effects on the Santander UK group’s Condensed Consolidated Interim Financial Statements until a detailed review has been completed.
The Condensed Consolidated Interim Financial Statements reflect all adjustments that, in the opinion of management of the Santander UK group, are necessary for a fair presentation of the results of operations for the interim period. All such adjustments to the financial information are of a normal, recurring nature. Because the results from common banking activities are so closely related and responsive to changes in market conditions, the results for any interim period are not necessarily indicative of the results that can be expected for the year.
GOING CONCERN The Directors have assessed the ability of the Santander UK group to continue as a going concern, in light of uncertain current and anticipated economic conditions, including analysing the financial resources available to it and stress testing performance forecasts through various scenarios. The Directors confirm they are satisfied that the Santander UK group has adequate resources to continue in business for the foreseeable future. For this reason, they continue to adopt the ‘going concern’ basis of accounting for preparing financial statements.
CRITICAL ACCOUNTING POLICIES AND AREAS OF SIGNIFICANT MANAGEMENT JUDGEMENT The preparation of the Santander UK group’s Condensed Consolidated Interim Financial Statements requires management to make estimates and judgements that affect the reported amount of assets and liabilities at the date of the Condensed Consolidated Interim Financial Statements and the reported amount of income and expenses during the reporting period. Management evaluates its estimates and judgements on an ongoing basis. Management bases its estimates and judgements on historical experience and on various other factors that are believed to be reasonable under the circumstances. Actual results may differ from these estimates under different assumptions or conditions.
There have been no significant changes in the basis upon which estimates have been determined, compared to that applied in the 2013 Annual Report.
Financial Statements
Notes to the Financial Statements continued
92 Santander UK plc 2014 Half Yearly Financial Report
2. SEGMENTS The principal activity of the Santander UK group is financial services. The Santander UK group’s business is managed and reported on the basis of the following segments: > Retail Banking; > Commercial Banking; > Markets; and > Corporate Centre. The Santander UK group’s segments are strategic business units that offer different products and services. They are managed separately because each business requires different technology and marketing strategies. The Santander UK group has four segments:
> Retail Banking offers a wide range of products and financial services to customers through a network of branches, agencies and
ATMs, as well as through telephony, e-commerce and intermediary channels. It principally serves personal banking customers, but also services small businesses with an annual turnover of up to £250,000. Retail Banking products include residential mortgage loans, savings and current accounts, credit cards (excluding the co-brand credit cards business) and personal loans as well as a range of insurance products.
> Commercial Banking offers a wide range of products and financial services to customers through a network of regional business centres and through telephony and e-commerce channels. Commercial Banking products and services include loans, bank accounts, deposits, treasury services, invoice discounting, cash transmission and asset finance. The management of our customers is organised according to the annual turnover of their business, enabling us to offer a differentiated service to small and medium enterprises (‘SMEs’), mid and large corporate customers.
The SME and mid corporate business principally serves small and medium enterprises with an annual turnover of more than £250,000 up to £50m, and other corporate customers with an annual turnover of up to £500m. This also includes real estate lending.
The Large Corporates business offers specialist treasury services in fixed income and foreign exchange, lending, transactional banking services, capital markets and money markets to large multinational corporate customers with an annual turnover of more than £500m. Lending includes syndicated loans and structured finance. Transactional banking includes trade finance and cash management. Money market activities include securities lending/borrowing and repos.
> Markets offers risk management and other services to financial institutions, as well as to other Santander UK divisions. Its main business areas are fixed income and foreign exchange, equity, capital markets and institutional sales.
> Corporate Centre includes Financial Management & Investor Relations (‘FMIR’) and the non-core corporate and legacy portfolios, as well as the co-brand credit cards business sold in 2013 which has been presented as discontinued operations. FMIR is responsible for managing capital and funding, balance sheet composition and structure, and strategic liquidity risk for the Santander UK group. The non-core corporate and legacy portfolios include aviation, shipping, infrastructure, commercial mortgages, Social Housing loans and structured credit assets, all of which are being run-down and/or managed for value.
The Company’s board of directors (the ‘Board’) is the chief operating decision maker for the Santander UK group. The segment information below is presented on the basis used by the Board to evaluate performance and allocate resources. The Board reviews discrete financial information for each segment of the business, including measures of operating results, assets and liabilities. The segment information reviewed by the Board is prepared on a statutory basis of accounting.
Transactions between the business segments are on normal commercial terms and conditions. The accounting policies of the segments are the same as those applied in the presentation of the Santander UK group’s 2013 Annual Report as described in Note 1. Internal charges and internal UK transfer pricing adjustments have been reflected in the performance of each segment. Revenue sharing agreements are used to allocate external customer revenues to a business segment on a reasonable basis. Funds are ordinarily reallocated between segments, resulting in funding cost transfers disclosed in operating income. Interest charged for these funds is based on the Santander UK group’s cost of wholesale funding.
Interest income and interest expense have not been reported separately. The majority of the revenues from the segments presented below are interest income in nature and the Board relies primarily on net interest income to both assess the performance of the segment and to make decisions regarding allocation of segmental resources.

Financial Statements
Notes to the Financial Statements continued
Santander UK plc 2014 Half Yearly Financial Report 93
30 June 2014
Retail Banking
£m
Commercial Banking
£m Markets
£m
Corporate Centre
£m Total
£m Net interest income/(expense) 1,685 264 1 (277) 1,673 Non-interest income 306 131 57 25 519 Total operating income 1,991 395 58 (252) 2,192 Administration expenses (719) (181) (56) 80 (876) Depreciation, amortisation and impairment (112) (13) (1) (221) (347) Total operating expenses excluding impairment losses, provisions and
charges (831) (194) (57) (141) (1,223)
Impairment losses on loans and advances (107) (56) - (9) (172) Provisions for other liabilities and charges - - - (252) (252) Total operating impairment losses, provisions and charges (107) (56) - (261) (424) Profit/(loss) from continuing operations before tax 1,053 145 1 (654) 545 Loss from discontinued operations after tax - - - - - Revenue from external customers 2,304 464 59 (635) 2,192 Inter-segment revenue (313) (69) (1) 383 - Total operating income 1,991 395 58 (252) 2,192 Customer assets 156,639 23,128 - 8,703 188,470 Total assets(1) 161,837 28,649 17,333 62,401 270,220 Customer deposits 126,862 14,575 - 9,259 150,696 Total liabilities 130,281 23,229 14,419 88,693 256,622 Average number of staff(2) 17,550 1,999 329 179 20,057 (1) Includes customer assets, net of impairment loss allowances. (2) Full-time equivalents. 30 June 2013
Retail Banking
£m
Commercial Banking
£m Markets
£m
Corporate Centre(3)
£m Total(3)
£m Net interest income/(expense) 1,382 199 (1) (189) 1,391 Non-interest income 328 137 40 65 570 Total operating income 1,710 336 39 (124) 1,961 Administration expenses (772) (147) (48) (25) (992) Depreciation, amortisation and impairment (95) (9) (1) (16) (121) Total operating expenses excluding impairment losses, provisions and
charges (867) (156) (49) (41) (1,113)
Impairment losses on loans and advances (184) (51) - - (235) Provisions for other liabilities and charges - - - (152) (152) Total operating impairment losses, provisions and charges (184) (51) - (152) (387) Profit/(loss) from continuing operations before tax 659 129 (10) (317) 461 Loss from discontinued operations after tax - - - (12) (12) Revenue from external customers 2,243 377 41 (700) 1,961 Inter-segment revenue (533) (41) (2) 576 - Total operating income 1,710 336 39 (124) 1,961 31 December 2013 Customer assets 155,613 22,075 - 9,360 187,048 Total assets(1) 160,512 32,700 19,329 57,745 270,286 Customer deposits 123,189 12,631 - 10,624 146,444 Total liabilities 128,106 24,549 18,536 86,505 257,696 Average number of staff(2) 17,764 1,781 359 160 20,064
(1) Includes customer assets, net of impairment loss allowances. (2) Full-time equivalents. (3) Adjusted to reflect the adoption of IFRIC 21, as described in Note 1.

Financial Statements
Notes to the Financial Statements continued
94 Santander UK plc 2014 Half Yearly Financial Report
3. NET TRADING AND OTHER INCOME
Six months ended 30 June 2014
£m
Six months ended 30 June 2013
£m
Net trading and funding of other items by the trading book 194 206 Income from operating lease assets 21 21 Gains/(losses) on assets designated at fair value through profit or loss 113 (181) Losses on liabilities designated at fair value through profit or loss (82) (12) (Losses)/gains on derivatives managed with assets/liabilities held at fair value through profit or loss (71) 179 Share of profit from associates and joint ventures 4 1 Profit on sale of available-for-sale assets - 53 Hedge ineffectiveness and other (25) (86) 154 181
Net trading and funding of other items by the trading book includes fair value gains/(losses) of £(15)m (six months ended 30 June 2013: £137m) on embedded derivatives bifurcated from certain equity index-linked deposits. The embedded derivatives are economically hedged internally with the equity derivatives trading desk. These internal transactions are managed as part of the overall positions of the equity derivatives trading desk, the results of which are also included in this line item, and amounted to £16m (six months ended 30 June 2013: £136m). As a result, the net fair value movements recognised on the equity index-linked deposits and the related economic hedges were £1m (six months ended 30 June 2013: £1m).
4. ADMINISTRATION EXPENSES Six months ended
30 June 2014 £m
Six months ended 30 June 2013
£m
Staff costs: Wages and salaries 338 313 Performance-related payments: 77 80 Social security costs 44 41 Pensions costs: - defined contribution plans 30 19
- defined benefit plans: - past service credit (230) - - other 14 15
Other share-based payments - - Other personnel costs 35 26 308 494 Property, plant and equipment expenses 97 92 Information technology expenses 243 199 Other administration expenses 228 207 876 992
During the six months ended 30 June 2014, a net gain of £218m arose as a result of scheme changes that limit future defined benefit pension entitlements and provide for the longer term sustainability of our staff pension arrangement, as set out in Note 26. The net gain comprised a past service credit of £230m, partially offset by a one-off contribution to the defined contribution scheme for affected members of £10m, both classified in pensions costs, and implementation costs of £2m classified in other administration expenses.
5. DEPRECIATION, AMORTISATION AND IMPAIRMENT Six months ended
30 June 2014 £m
Six months ended 30 June 2013
£m Depreciation of property, plant and equipment 110 99 Amortisation and impairment of intangible assets 237 22 347 121 Amortisation and impairment of intangible assets for the six months ended 30 June 2014 included £206m in respect of the impairment of software, as set out in Note 18. There was no impairment in the six months ended 30 June 2013.

Financial Statements
Notes to the Financial Statements continued
Santander UK plc 2014 Half Yearly Financial Report 95
6. IMPAIRMENT LOSSES AND PROVISIONS Six months ended
30 June 2014 £m
Six months ended 30 June 2013(1)
£m Impairment losses on loans and advances: - loans and advances to customers (Note 14) 220 295 - loans and advances to banks (Note 13) - - - loans and receivables securities - - Recoveries of loans and advances (Note 14) (48) (60) 172 235 Impairment losses on available-for-sale financial assets - - Provisions for other liabilities and charges: (Note 25) 252 152 Total impairment losses and provisions charged to the income statement 424 387 (1) Adjusted to reflect the adoption of IFRIC 21, as described in Note 1.
7. TAXATION CHARGE Six months ended
30 June 2014 £m
Six months ended 30 June 2013(1)
£m Current tax: UK corporation tax on profit of the period 40 45 Adjustments in respect of prior years (4) (13) Total current tax 36 32 Deferred tax: Origination and reversal of temporary differences 79 60 Change in rate of UK corporation tax (7) - Adjustments in respect of prior years (1) (2) Total deferred tax 71 58 Tax on profit on continuing operations for the period 107 90 (1) Adjusted to reflect the adoption of IFRIC 21, as described in Note 1. Interim period corporation tax is accrued based on the estimated average annual effective corporation tax rate for the year of 21.2% (2013: 23%). The standard rate of UK corporation tax was 21.5% (2013: 23.25%). The standard rate of UK corporation tax was reduced from 23% to 21% with effect from 1 April 2014. Taxation for other jurisdictions is calculated at the rates prevailing in the relevant jurisdictions.
The Finance Act 2013, which provides for a reduction in the main rate of UK corporation tax to 21% effective from 1 April 2014 and 20% effective from 1 April 2015, was enacted on 17 July 2013. As the changes in rates were substantively enacted prior to 30 June 2014, they have been reflected in the deferred tax balance at 30 June 2014.
The tax expense differs from the theoretical amount that would arise using the UK statutory rate of the Company as follows: Six months ended
30 June 2014 £m
Six months ended 30 June 2013(1)
£m Profit on continuing operations before tax 545 461 Tax calculated at a tax rate of 21.5% (six months ended 2013: 23.25%) 118 107 Non-deductible preference dividends paid 1 1 Non-deductible UK Bank Levy 7 8 Other non-equalised items (4) (8) Effect of non-UK profits and losses (1) (1) Utilisation of capital losses for which credit was not previously recognised (2) (2) Effect of change in tax rate on deferred tax provision (7) - Adjustment to prior year provisions (5) (15) Tax expense 107 90 (1) Adjusted to reflect the adoption of IFRIC 21, as described in Note 1. Further information about deferred tax is presented in Note 20.

Financial Statements
Notes to the Financial Statements continued
96 Santander UK plc 2014 Half Yearly Financial Report
8. DISCONTINUED OPERATIONS The Company sold its co-brand credit cards business in 2013. The results and loss on sale of the discontinued operations were as follows: Six months ended
30 June 2014 £m
Six months ended 30 June 2013
£m Total operating income - 63 Total operating expenses excluding impairment losses, provisions and charges - (30) Impairment losses on loans and advances - (12) Provisions for other liabilities and charges - (21) Profit of discontinued operations before tax - - Taxation charge on discontinued operations - - Loss on sale of discontinued operations - (16) Taxation credit on loss on sale on discontinued operations - 4 Loss from discontinued operations after tax - (12)
9. DIVIDENDS
Dividends of £210m (2013: £450m) were paid on Santander UK plc’s ordinary shares in issue during the period. An interim dividend of £237m was approved on 24 June 2014 on the Company’s ordinary shares in issue.
The annual dividend of £21m (2013: £21m) on the Step-Up Callable Perpetual Reserve Capital Instruments was paid on 14 February 2014; the annual dividend of £0.4m (2013: £17m) on the £300m Step-up Callable Perpetual Preferred Securities, was paid on 22 March 2014; and the annual dividend of £19m (2013: £19m) on the £300m fixed/floating rate non-cumulative callable preference shares was paid on 24 May 2014.
10. TRADING ASSETS
30 June 2014 £m
31 December 2013 £m
Loans and advances to banks - securities purchased under resale agreements 532 4,219 - other(1) 5,668 5,107 Loans and advances to customers - securities purchased under resale agreements 1,187 4,210
- other(1) 580 194 Debt securities 7,522 7,859 Equity securities 3,212 705 18,701 22,294 (1) Total “other” comprises short-term loans of £479m (2013: £195m) and cash collateral of £5,769m (2013: £5,106m).
Included in the above balances are amounts owed to the Santander UK group by Banco Santander, S.A. and other subsidiaries of Banco Santander, S.A. outside the Santander UK group of £86m (2013: £80m) and £17m (2013: £32m) respectively.

Financial Statements
Notes to the Financial Statements continued
Santander UK plc 2014 Half Yearly Financial Report 97
11. DERIVATIVE FINANCIAL INSTRUMENTS Derivatives are financial instruments whose value is derived from the price of one or more underlying items such as equities, equity indices, interest rates, foreign exchange rates, property indices, commodities and credit spreads. Derivatives enable users to manage exposure to credit or market risks. The Santander UK group sells derivatives to its customers and uses derivatives to manage its own exposure to credit and market risks. Details of the Santander UK group’s use of derivatives are set out in Note 16 of the 2013 Annual Report. 30 June 2014 Derivatives held for trading
Contract/notional amount £m
Fair value assets £m
Fair value liabilities £m
Exchange rate contracts: - Cross-currency swaps 101,018 1,365 2,234 - Foreign exchange swaps, options and forwards 40,176 538 261 141,194 1,903 2,495 Interest rate contracts: - Interest rate swaps 556,156 10,712 10,084 - Caps, floors and swaptions 54,037 1,502 1,498 - Futures (exchange traded) 96,307 6 23 - Forward rate agreements 29,945 3 3 736,445 12,223 11,608 Equity and credit contracts: - Equity index swaps and similar products 35,955 2,255 3,126 - Equity index options (exchange traded) 25,709 360 2 - Credit default swaps and similar products 138 29 2 61,802 2,644 3,130 Commodity contracts: - OTC swaps 37 4 4 37 4 4 Total derivative assets and liabilities held for trading 939,478 16,774 17,237
30 June 2014 Derivatives held for hedging
Contract/notional amount £m
Fair value assets £m
Fair value liabilities £m
Derivatives designated as fair value hedges: Exchange rate contracts: - Cross-currency swaps 1,602 40 65 Interest rate contracts: - Interest rate swaps 93,254 1,501 1,019 94,856 1,541 1,084 Derivatives designated as cash flow hedges: Exchange rate contracts: - Cross-currency swaps 16,478 774 668 Interest rate contracts: - Interest rate swaps 5,406 70 41 21,884 844 709 Total derivative assets and liabilities held for hedging 116,740 2,385 1,793 Total recognised derivative assets and liabilities 1,056,218 19,159 19,030 31 December 2013 Derivatives held for trading
Contract/notional amount
£m Fair value assets
£m Fair value liabilities
£m
Exchange rate contracts: - Cross-currency swaps 110,425 1,282 2,027 - Foreign exchange swaps, options and forwards 41,849 1,133 417 152,274 2,415 2,444 Interest rate contracts: - Interest rate swaps 512,101 10,739 9,972 - Caps, floors and swaptions 56,230 1,912 1,891 - Futures (exchange traded) 31,137 11 36 - Forward rate agreements 29,379 1 1 628,847 12,663 11,900 Equity and credit contracts: - Equity index swaps and similar products 32,196 2,009 2,947 - Equity index options (exchange traded) 13,115 312 1 - Credit default swaps and similar products 158 32 3 45,469 2,353 2,951 Commodity contracts: - OTC swaps 54 2 2 54 2 2 Total derivative assets and liabilities held for trading 826,644 17,433 17,297

Financial Statements
Notes to the Financial Statements continued
98 Santander UK plc 2014 Half Yearly Financial Report
31 December 2013 Derivatives held for hedging
Contract/notional amount
£m Fair value assets
£m Fair value liabilities
£m
Derivatives designated as fair value hedges: Exchange rate contracts: - Cross-currency swaps 2,524 46 47 Interest rate contracts: - Interest rate swaps 105,138 1,578 1,066 107,662 1,624 1,113 Derivatives designated as cash flow hedges: Exchange rate contracts: - Cross-currency swaps 15,507 990 445 Interest rate contracts: - Interest rate swaps 3,856 2 8 19,363 992 453 Total derivative assets and liabilities held for hedging 127,025 2,616 1,566 Total recognised derivative assets and liabilities 953,669 20,049 18,863 Included in the above balances are amounts owed to the Santander UK group by Banco Santander, S.A. and other subsidiaries of Banco Santander, S.A. outside the Santander UK group of £2,042m (2013: £2,058m) and £201m (2013: £166m) respectively and amounts owed by the Santander UK group to Banco Santander, S.A. and other subsidiaries of Banco Santander, S.A. outside the Santander UK group of £2,049m (2013: £1,950m) and £191m (2013: £191m). The net exposures after collateral to the ultimate parent undertaking and fellow subsidiaries at 30 June 2014 amounted to £nil (2013: £nil) and £nil (2013: £nil) respectively, with collateral held exceeding the net position. Net gains or losses arising from fair value and cash flow hedges included in net trading and other income Six months ended
30 June 2014 £m
Six months ended 30 June 2013
£m
Fair value hedging: - Gains/(losses) on hedging instruments 27 (199) - (Losses)/gains on hedged items attributable to hedged risks (7) 216 Fair value hedging ineffectiveness 20 17 Cash flow hedging ineffectiveness (44) (98) (24) (81) The Santander UK group hedges its exposures to various risks, including interest rate risk and foreign currency risk, in connection with certain mortgage assets, covered bond issuances, and subordinated and senior debt securities in issue. The gains or losses arising on these assets and liabilities are presented in the table above on a combined basis.
12. FINANCIAL ASSETS DESIGNATED AT FAIR VALUE 30 June 2014
£m 31 December 2013
£m
Loans and advances to customers 2,229 2,219 Debt securities 525 528 2,754 2,747 Included in the above balances are amounts owed to the Santander UK group by Banco Santander, S.A. and other subsidiaries of Banco Santander, S.A. outside the Santander UK group of £nil (2013: £nil) and £57m (2013: £56m) respectively.
The maximum exposure to credit risk on loans and advances designated as held at fair value through profit or loss at the balance sheet date was mitigated by the Santander UK group having a charge over the residential properties in respect of lending to housing associations. See ‘Maximum exposure and net exposure to credit risk’ in the ‘Credit Risk Review’ section of the Risk Management Report.
The net gain during the period attributable to changes in credit risk for loans and advances designated at fair value was £10m (six months ended 30 June 2013: net gain of £7m). The cumulative net loss attributable to changes in credit risk for loans and advances designated at fair value at 30 June 2014 was £248m (31 December 2013: cumulative net loss of £258m).
13. LOANS AND ADVANCES TO BANKS
30 June 2014
£m 31 December 2013
£m
Placements with other banks - securities purchased under resale agreements 273 273 - other 2,036 2,013
Amounts due from Banco Santander - securities purchased under resale agreements - 50 - other 16 11
2,325 2,347

Financial Statements
Notes to the Financial Statements continued
Santander UK plc 2014 Half Yearly Financial Report 99
14. LOANS AND ADVANCES TO CUSTOMERS 30 June 2014
£m 31 December 2013
£m Loans and advances to customers 186,832 185,329 Amounts due from fellow Banco Santander group subsidiaries and joint ventures 761 813 Loans and advances to customers 187,593 186,142 Less: impairment loss allowances (1,499) (1,555) Loans and advances to customers, net of impairment loss allowances 186,094 184,587
Movement in impairment loss allowances: 30 June 2014 Loans secured
on residential property
£m
Corporate
Loans £m
Finance
leases £m
Other secured
advances £m
Other unsecured advances
£m
Total £m
At 1 January 2014: - Observed: - Individual 39 334 - 54 - 427 - Collective 343 30 8 83 128 592- Incurred but not yet observed 211 40 36 92 157 536 593 404 44 229 285 1,555Charge/(release) to the income statement: - Observed: - Individual 1 16 - 1 - 18 - Collective (23) 24 4 8 119 132- Incurred but not yet observed 42 24 4 (4) 4 70 20 64 8 5 123 220Write offs and other items(1) (27) (60) (4) (45) (140) (276)At 30 June 2014: - Observed: - Individual 40 305 - 35 - 380 - Collective 293 39 8 66 107 513- Incurred but not yet observed 253 64 40 88 161 606 586 408 48 189 268 1,499 31 December 2013 Loans secured
on residential property
£m
Corporate
Loans £m
Finance
leases £m
Other secured
advances £m
Other unsecured advances
£m
Total £m
At 1 January 2013: - Observed: - Individual 58 544 - 80 11 693 - Collective 327 58 6 79 197 667 - Incurred but not yet observed 167 125 34 10 106 442 552 727 40 169 314 1,802 Charge/(release) to the income statement: - Observed: - Individual (19) 77 - 69 (11) 116 - Collective 105 (28) 12 4 313 406 - Incurred but not yet observed 44 (85) 2 82 11 54 130 (36) 14 155 313 576 Write offs and other items(1) (89) (287) (10) (95) (342) (823) At 31 December 2013: - Observed: - Individual 39 334 - 54 - 427 - Collective 343 30 8 83 128 592 - Incurred but not yet observed 211 40 36 92 157 536 593 404 44 229 285 1,555
(1) Mortgage write-offs exclude the effect of the unwind over time of the discounting in estimating losses, as described in the accounting policies on page 222 of the 2013 Annual Report. Mortgage write-offs including this effect were £33m (six months ended 30 June 2013: £50m).
Recoveries: Loans secured
on residential property
£m
Corporate
Loans £m
Finance
leases £m
Other secured
advances £m
Other unsecured advances
£m
Total £m
30 June 2014 2 2 1 2 41 48 30 June 2013 - 1 1 - 58 60

Financial Statements
Notes to the Financial Statements continued
100 Santander UK plc 2014 Half Yearly Financial Report
15. SECURITISATIONS AND COVERED BONDS a) Securitisations i) Master Trust Structures Holmes In the first half of 2014, there were no issuances from Holmes Master Issuer plc (2013: £1.1bn). Mortgage-backed notes totalling £1.8bn (2013: £1.7bn) equivalent were redeemed during the period. Fosse In the first half of 2014, there were issuances of £1.0bn from Fosse Master Issuer plc (2013: £nil). Mortgage-backed notes totalling £0.7bn (2013: £4.9bn) equivalent were redeemed during the period. ii) Other securitisation structures Motor In the first half of 2014, the Santander UK group issued £0.9bn notes (2013: £0.9bn) through pass-through stand-alone vehicles for the securitisation of receivables derived from credit agreements with retail customers for the purchases of financed vehicles. b) Covered Bonds At 30 June 2014, gross assets assigned amounted to £22,420m (2013: £21,215m) and notes in issue amounted to £17,318m (2013: £18,379m).
16. AVAILABLE-FOR-SALE SECURITIES
30 June 2014 £m
31 December 2013 £m
Debt securities 7,731 4,981Equity securities 24 24 7,755 5,005
17. INTERESTS IN OTHER ENTITIES Santander UK plc has interests in subsidiaries, associates, joint ventures and unconsolidated structured entities, as set out in Note 24 to the Consolidated Financial Statements in the 2013 Annual Report. The unconsolidated structured entities include Abbey National Capital Trust I and Abbey National Capital LP I, which are 100% owned finance subsidiaries (as defined in Regulation S-X under the US Securities Act 1933, as amended) of Santander UK plc. On 7 February 2000, Abbey National Capital Trust I issued US$1bn of 8.963% Non-cumulative Trust Preferred Securities, which have been registered under the US Securities Act of 1933, as amended. Abbey National Capital Trust I serves solely as a passive vehicle holding the partnership preferred securities issued by Abbey National Capital LP I and each has passed all the rights relating to such partnership preferred securities to the holders of trust preferred securities issued by Abbey National Capital Trust I. All of the trust preferred securities and the partnership preferred securities have been fully and unconditionally guaranteed on a subordinated basis by Santander UK plc. The terms of the securities do not include any significant restrictions on the ability of Santander UK plc to obtain funds, by dividend or loan, from any subsidiary.
18. INTANGIBLE ASSETS Other intangibles During the period, the Santander UK group spent £7m (six months ended 30 June 2013: £49m) on additions to its computer software. The Santander UK group disposed of £nil (six months ended 30 June 2013: £39m) of computer software and recognised an impairment charge of £206m (six months ended 30 June 2013: £nil) in respect of software write-offs. The write-offs were for the decommissioning of redundant systems following the implementation of our new digital platform and the completion of our product simplification programme.

Financial Statements
Notes to the Financial Statements continued
Santander UK plc 2014 Half Yearly Financial Report 101
19. PROPERTY, PLANT AND EQUIPMENT During the period, the Santander UK group spent £23m (six months ended 30 June 2013: £34m) on the refurbishment of its branches and office premises, £83m (six months ended 30 June 2013: £9m) on additions to its office fixtures and equipment, £4m (six months ended 30 June 2013: £nil) on computer software and £30m (six months ended 30 June 2013: £53m) on the acquisition of operating lease assets. The Santander UK group disposed of £nil (six months ended 30 June 2013: £30m) of property, £8m (six months ended 30 June 2013: £14m) of office fixtures and equipment and £38m (six months ended 30 June 2013: £56m) of operating lease assets during the period.
At 30 June 2014, capital expenditure contracted, but not provided for was £1m (31 December 2013: £14m) in respect of property, plant and equipment. Assets under construction with a total value of £129m (31 December 2013: £279m) are included in the total carrying value of property, plant and equipment at the balance sheet date.
20. DEFERRED TAX
Deferred taxes are calculated on temporary differences under the liability method using the tax rates expected to apply when the liability is settled or the asset is realised. The movement on the deferred tax account was as follows: 30 June 2014
£m 31 December 2013(1)
£m At 1 January 16 35 Income statement charge (71) (139) (Charged)/credited to other comprehensive income: - retirement benefit obligations (26) 113 - cash flow hedges (16) 7 (42) 120 Eliminated on disposal 10 - At 30 June/31 December (87) 16 (1) Adjusted to reflect the adoption of IFRIC 21, as described in Note 1.
Deferred tax balances are presented in the balance sheet after offsetting assets and liabilities where the Santander UK group and Company has the legal right to offset and intends to settle on a net basis. The deferred tax assets and liabilities are attributable to the following items: 30 June 2014
£m 31 December 2013(1)
£m
Deferred tax assets/(liabilities) Pensions and other post-retirement benefits 31 108 Accelerated tax depreciation (8) (20) IFRS transitional adjustments 27 33 Other temporary differences (137) (105) (87) 16 (1) Adjusted to reflect the adoption of IFRIC 21, as described in Note 1.
The deferred tax assets scheduled above have been recognised in the Santander UK group on the basis that sufficient future taxable profits are forecast within the foreseeable future, in excess of the profits arising from the reversal of existing taxable temporary differences, to allow for the utilisation of the assets as they reverse. Based on the conditions at the balance sheet date, management determined that a reasonably possible change in any of the key assumptions underlying the estimated future taxable profits in the Santander UK group’s five year plan would not cause a reduction in the deferred tax assets recognised.
At 30 June 2014, the Santander UK group had UK capital losses carried forward of £10m (2013: £17m). These losses are available for offset against future UK chargeable gains and under current UK tax legislation do not time expire. No deferred tax asset has been recognised in respect of these capital losses on the basis that future capital gains required to utilise the losses are not considered probable. The deferred tax charge in respect of continuing and discontinued operations in the income statement comprises the following temporary differences:
Six months ended 30 June 2014
£m
Six months ended 30 June 2013(1)
£m
Accelerated tax depreciation 2 (7) Pensions and other post-retirement benefits (51) 3 IFRS transition adjustments (6) (8) Tax losses carried forward - (33) Other temporary differences (16) (13) (71) (58) (1) Adjusted to reflect the adoption of IFRIC 21, as described in Note 1.

Financial Statements
Notes to the Financial Statements continued
102 Santander UK plc 2014 Half Yearly Financial Report
21. DEPOSITS BY BANKS 30 June 2014
£m 31 December 2013
£m Items in the course of transmission 308 614 Deposits by banks - securities sold under agreements to repurchase 4,888 5,465 Amounts due to Banco Santander
- securities sold under repurchase agreements - 50 - other 606 636
Amounts due to fellow Banco Santander subsidiaries - 1 Deposits held as collateral 696 1,047 Other deposits 1,736 883 8,234 8,696
22. TRADING LIABILITIES
30 June 2014 £m
31 December 2013 £m
Deposits by banks - securities sold under repurchase agreements 6,076 7,795- other(1) 2,447 3,496
Deposits by customers - securities sold under repurchase agreements 2,810 6,329- other(1)(2) 2,285 740
Short positions in securities and unsettled trades 4,230 2,918 17,848 21,278(1) Comprises cash collateral of £1,451m (2013: £1,841m) and short-term deposits of £3,281m (2013: £2,336m). (2) Comprises equity index-linked deposits of £nil (2013: £59m). The capital amount guaranteed/protected and the amount of return guaranteed in respect of the equity index-linked deposits
were £nil for both commitments (2013: £127m and £17m, respectively).
Included in the above balances are amounts owed by the Santander UK group to Banco Santander, S.A. of £76m (2013: £193m) and to fellow subsidiaries of Banco Santander, S.A. of £48m (2013: £13m).
23. FINANCIAL LIABILITIES DESIGNATED AT FAIR VALUE
30 June 2014 £m
31 December 2013 £m
Debt securities in issue - US$10bn Euro Commercial Paper Programme 940 865 - US$20bn Euro Medium Term Note Programme 633 591 - Euro 10bn Note Certificate and Warrant Programme 1,571 1,832
Warrants 108 119 3,252 3,407
Included in the above balances are amounts owed to Banco Santander, S.A. of £26m (2013: £17m) and to fellow subsidiaries of Banco Santander S.A. of £245m (2013: £172m).
Gains and losses arising from changes in the credit spread of liabilities issued by the Santander UK group reverse over the contractual life of the debt, provided that the debt is not repaid at a premium or a discount. The net loss during the period attributable to changes in the Santander UK group’s own credit risk on the above debt securities in issue was £8m (six months ended 30 June 2013: net gain of £18m). The cumulative net loss attributable to changes in the Santander UK group’s own credit risk on the above debt securities in issue at 30 June 2014 was £14m (31 December 2013: cumulative net loss of £6m).
The amount that would be required to be contractually paid at maturity of the deposits by banks, deposits by customers, and debt securities in issue above at 30 June 2014 is £197m (2013: £216m) higher than the carrying value.
24. DEBT SECURITIES IN ISSUE
30 June 2014 £m
31 December 2013 £m
Bonds and medium term notes: - Euro 35bn Global Covered Bond Programme 17,318 18,379 - US$20bn Euro Medium Term Note Programme (See Note 23) 8,111 7,690 - US$40bn Euro Medium Term Note Programme 155 156 - US$20bn Commercial Paper Programme 2,922 3,131 - Euro 5bn Guaranteed French Certificates of Deposit Programme 1,318 890 - Certificates of deposit in issue 2,988 1,756 32,812 32,002 Securitisation programmes (See Note 15): - Holmes 7,244 9,139 - Fosse 9,067 8,885 - Motor 1,135 844 50,258 50,870

Financial Statements
Notes to the Financial Statements continued
Santander UK plc 2014 Half Yearly Financial Report 103
Included in the above balances are amounts owed by the Santander UK group to Banco Santander, S.A. and other subsidiaries of Banco Santander, S.A. outside the Santander UK group of £48m (2013: £37m) and £441m (2013: £617m) respectively.
25. PROVISIONS Conduct remediation PPI
£m Other products
£m Other provisions(1)
£m Total
£m At 1 January 2014 165 222 163 550 Additional provisions 65 5 182 252Used during the period (61) (77) (54) (192)Provisions released and other - - - -At 30 June 2014 169 150 291 610 To be settled: Within 12 months 134 131 139 404In more than 12 months 35 19 152 206 169 150 291 610 Conduct remediation
PPI £m
Other products £m
Other provisions(1)(2) £m
Total £m
At 1 January 2013 382 276 137 795 Additional provisions - - 295 295 Used during the year (217) (9) (269) (495) Provisions released and other - (45) - (45) At 31 December 2013 165 222 163 550 To be settled: Within 12 months 153 222 76 451 In more than 12 months 12 - 87 99 165 222 163 550 (1) Includes regulatory-related provisions of £153m in respect of the FSCS and the UK Bank Levy at 30 June 2014 (2013: £80m). (2) Adjusted to reflect the adoption of IFRIC 21, as described in Note 1.
Conduct remediation The amounts in respect of conduct remediation comprise the estimated cost of making redress payments, including related costs, with respect to the past sales of products. In calculating the conduct remediation provision, management’s best estimate of the provision was calculated based on conclusions regarding the number of claims, of those, the number that will be upheld, and the estimated average settlement per case. Sensitivities relating to the provision for conduct remediation can be found in “Critical Accounting Policies and Areas of Significant Management Judgement” in Note 1 to the Consolidated Financial Statements in the 2013 Annual Report. (i) Payment Protection Insurance (‘PPI’) The provision for conduct remediation in respect of PPI represents management’s best estimate of the anticipated costs of related customer contact and/or redress, including related costs. The provision is calculated based on a number of key assumptions which involve significant management judgement. These are as follows:
> Claim volumes – the estimated number of customer complaints received; > Uphold rate – the estimated percentage of complaints that are, or will be, upheld in favour of the customer; and > Average cost of redress – the estimated payment to customers, including compensation for any direct loss plus interest.
The assumptions have been based on the following:
> Analysis completed of the causes of complaints, and uphold rates, and how these are likely to vary in the future; > Actual claims activity registered to date; > The level of redress paid to customers, together with a forecast of how this is likely to change over time; > The impact on complaints levels of proactive customer contact; and > The effect of media coverage on the issue.
The assumptions are kept under review, and regularly reassessed and validated against actual customer data, e.g. claims received; uphold rates, the impact of any changes in approach to uphold rates, and any re-evaluation of the estimated population. The most critical factor in determining the level of provision is the volume of claims. The uphold rate is a reasonably consistent function of the sales process and the average cost of redress can be predicted reasonably accurately given that management is dealing with a high volume and reasonably homogeneous population. In setting the provision, management estimated the total claims that were likely to be received. Previous experience has indicated that claims could be received over a number of years, and influenced by press coverage and the activities of claims management companies (‘CMCs’). The CMCs facilitate customer claims in return for a share of the redress payment and advertise heavily thereby resulting in an increase in the volume of claims experienced.

Financial Statements
Notes to the Financial Statements continued
104 Santander UK plc 2014 Half Yearly Financial Report
The table below sets out the key drivers of the provision balance and forecast assumptions used in the calculating provision.
Cumulative to
30 June 2014
Future Expected
(unreviewed) Inbound complaints(1) (‘000) 742 166 Outbound contact (‘000) 324 52 Outbound contact completion 86% 14% Response rate to outbound contact 31% 48% Average uphold rate per claim(2) 80% 64% Average redress per claim £1,868 £1,780
(1) Excludes invalid claims where the complainant has not held a PPI policy. (2) Claims include inbound and responses to outbound contact. Number of PPI claims outstanding Movements in the number of PPI claims outstanding in the six months ended 30 June 2014 and year ended 31 December 2013 were as follows: 30 June 2014
‘000 31 December 2013
‘000 Outstanding at 1 January 14 31 Complaints received(1) 130 363 Complaints rejected as invalid(2) (99) (298) Complaints closed - upheld (25) (82) Outstanding at 30 June/31 December 20 14
(1) Includes complaints that were deemed invalid, as there is no record of a relevant PPI policy being held by the customer. (2) The customer has the right to appeal to the FOS if their claim is rejected. FOS may uphold or reject the appeal and if upheld Santander UK is required to provide redress to the customer.
Claims upheld or rejected above reflect the results of any appeals.
30 June 2014 compared with 31 December 2013 During the six months ended 30 June 2014, the volume of PPI complaints decreased at a slower rate than in previous periods. The provision was reassessed in light of this. A review of recent claims activity indicated that claims are now expected to continue for longer than originally anticipated. As a result, the provision was increased by £65m. Monthly PPI redress costs, including related costs, decreased to an average of £10m per month in the six months ended 30 June 2014, compared to a monthly average of £18m in the year ended 31 December 2013. The high proportion of invalid complaints continued. (ii) Other products The provision for conduct remediation in respect of other products represents management’s best estimate of the anticipated costs of related customer contact and/or redress, including related costs. A number of uncertainties remain as to the eventual costs with respect to conduct remediation in respect of these products given the inherent difficulties in determining the number of customers involved and the amount of any redress to be provided to them. Interest rate hedging products In 2012, the FCA (formerly known as the FSA) identified material failings in the sale of interest rate derivatives to some small and medium sized businesses at the four largest UK banks. The FCA did not identify any mis-selling issues with Santander UK. However, in order to ensure that customers are treated consistently, the FCA requested seven other UK banks (including Santander UK) to undertake a review of the sales of interest rate hedging products to SMEs since 2001.
A provision was initially recognised based on the pilot exercise completed in the second half of 2012 and subsequently revised following the customer contact exercise that commenced in the second quarter of 2013 and ongoing updated guidelines from the FCA. The level of provision is based on full redress i.e. unwinding of the trade (reversal of mark-to-market values) and refund of net interest payments made by customers. Response rates are monitored on a regular basis, and the provision updated accordingly. Card Protection Plan In August 2013, the FCA announced that Card Protection Plan Limited (“CPP”) and 13 banks and credit card issuers, including the Santander UK group, had agreed to a compensation scheme in relation to the sale of card and/or identity protection insurance to certain retail customers. CPP wrote to affected policyholders to confirm the details of the proposed scheme, which was approved by a policyholder vote and by the High Court of England and Wales.
A provision was recognised based on the proposed compensation scheme for sales and renewals made from 2005 onwards and operational costs associated with the contact exercise that commenced in the first half of 2014 and customer complaint handling costs. The level of provision will be assessed as the main redress and review exercise progresses. Other retail products A provision has also been recognised in respect of other retail products, including related to the historic sale of certain investments products.

Financial Statements
Notes to the Financial Statements continued
Santander UK plc 2014 Half Yearly Financial Report 105
Other provisions Other provisions principally comprise amounts in respect of regulatory-related provisions (the FSCS and the UK Bank Levy), as well as litigation and related expenses, restructuring expenses and vacant property costs. (i) Financial Services Compensation Scheme (‘FSCS’) The FSCS is the UK's independent statutory compensation fund for customers of authorised financial services firms and pays compensation if a firm is unable to pay claims against it. The FSCS is funded by levies on the industry (and recoveries and borrowings where appropriate). The levies raised comprise both management expenses levies and, where necessary, compensation levies on authorised firms. The FSCS charge recognised in the six months ended 30 June 2014 was £100m (six months ended 30 June 2013: £88m).
During the six months ended 30 June 2014, Santander UK adopted IFRIC 21 which provides guidance on accounting for the liability to pay a government imposed levy, as described in Note 1. The adoption of IFRIC 21 changed the accounting for the FSCS. IFRIC 21 has been applied retrospectively. The impact of applying IFRIC 21 at 1 January 2014 was to increase retained earnings by £70m, increase deferred tax liabilities by £19m, and to reduce provisions by £89m.
(ii) UK Bank Levy The Finance Act 2011 introduced an annual bank levy in the UK. The UK Bank Levy is based on the total chargeable equity and liabilities as reported in the balance sheet at the end of a chargeable period. The current year impact of the UK bank levy has not been reflected in these results in accordance with IFRS. Under IFRS, these charges for the year may only be recognised on the last day of the year, not accrued over the period. The total cost of the UK Bank Levy to the Santander UK group for 2013 was £59m. The accounting for the UK Bank Levy was not affected by the adoption of IFRIC 21, described in Note 1.
26. RETIREMENT BENEFIT PLANS The amounts recognised in the balance sheet were as follows:
30 June 2014 £m
31 December 2013 £m
Assets/(liabilities) Funded defined benefit pension scheme 235 118 Funded defined benefit pension scheme (368) (632) Unfunded defined benefit pension scheme (40) (40) Total net liabilities (173) (554)
Remeasurement gains/(losses) recognised in other comprehensive income during the period were as follows:
Six months ended 30 June 2014
£m
Six months ended 30 June 2013
£m
Remeasurement of defined benefit schemes 128 (233)
a) Defined Contribution pension schemes An expense of £30m (six months ended 30 June 2013: £19m) was recognised for defined contribution plans in the period, and is included in staff costs classified within administration expenses in the Income Statement. None of this amount was recognised in respect of key management personnel for the six months ended 30 June 2014 and 30 June 2013. b) Defined Benefit pension schemes The total amount (credited)/charged to the income statement, including any amounts classified as redundancy costs and in discontinued operations was as follows:
Six months ended 30 June 2014
£m
Six months ended 30 June 2013
£m
Net interest expense 12 1 Current service cost 19 20 Past service credit (230) - Administration costs 3 3 (196) 24 During the six months ended 30 June 2014, following a review of the Santander UK Group Pension Scheme, pension arrangements for colleagues in that scheme were amended through the introduction of a cap on pensionable pay increases of 1% per annum from 1 March 2015. The impact of this change was a reduction in the defined benefit obligation of £230m, partially offset by a one-off contribution to the defined contribution scheme for affected members of £10m, and implementation costs of £2m. Consequently, a net gain of £218m was recognised in the income statement for the six months ended 30 June 2014 as set out in Note 4.

Financial Statements
Notes to the Financial Statements continued
106 Santander UK plc 2014 Half Yearly Financial Report
The amounts recognised in other comprehensive income for the period were as follows:
Six months ended 30 June 2014
£m
Six months ended 30 June 2013
£m Return on plan assets (excluding amounts included in net interest expense) 219 19 Actuarial gains/(losses) arising from experience adjustments 10 (2) Actuarial losses arising from changes in financial assumptions (101) (250) Remeasurement of defined benefit pension schemes 128 (233)
The net liability recognised in the balance sheet was determined as follows: 30 June 2014
£m 31 December 2013
£m Present value of defined benefit obligation (8,402) (8,432) Fair value of plan assets 8,229 7,878 Net defined benefit obligation (173) (554)
Movements in the present value of defined benefit obligations during the period were as follows:
30 June 2014 £m
31 December 2013 £m
Balance at 1 January (8,432) (7,554) Current service cost (13) (27) Current service cost paid by subsidiaries (1) (2) Current service cost paid by fellow Banco Santander group subsidiaries (5) (9) Interest cost (187) (336) Employer salary sacrifice contributions (5) (5) Past service credit/(cost) 230 (1) Remeasurement gains/(losses): - Actuarial losses arising from changes in demographic assumptions - (21) - Actuarial gains/(losses) arising from experience adjustments 10 (22) - Actuarial losses arising from changes in financial assumptions (101) (656) Actual benefit payments 102 201 Balance at 30 June/31 December (8,402) (8,432) Movements in the fair value of scheme assets during the period were as follows:
30 June 2014 £m
31 December 2013 £m
Balance at 1 January 7,878 7,503 Interest income 175 336 Remeasurement gains: - Return on plan assets (excluding amounts included in net interest expense) 219 136 Company contributions paid 57 102 Contributions paid by subsidiaries and fellow Banco Santander group subsidiaries 5 11 Administration costs (3) (9) Actual benefit payments (102) (201) Balance at 30 June/31 December 8,229 7,878 Actuarial assumption sensitivities For details of the principal assumptions used for the defined benefit schemes, see page 277 of the 2013 Annual Report. The sensitivity analyses below have been determined based on reasonably possible changes of the respective assumptions occurring at the end of the reporting period, while holding all other assumptions constant. Increase/(decrease)
30 June 2014 £m
31 December 2013 £m
Discount rate Change in pension obligation at period end from a 25 bps increase (422) (442) Change in pension cost for the period from a 25 bps increase - (1) General price inflation Change in pension obligation at period end from a 25 bps increase 254 290 Change in pension cost for the period from a 25 bps increase 14 14 General salary increase(1) Change in pension obligation at period end from a 25 bps increase - 33 Mortality Change in pension obligation at period end from each additional year of longevity assumed 215 176 (1) General salary increase assumption is 2.8% for 2015 and 1% per annum thereafter as a result of the amendment to pension arrangements described on the previous page.

Financial Statements
Notes to the Financial Statements continued
Santander UK plc 2014 Half Yearly Financial Report 107
27. CONTINGENT LIABILITIES AND COMMITMENTS
30 June 2014 £m
31 December 2013 £m
Guarantees given to third parties 1,705 1,355 Formal standby facilities, credit lines and other commitments with original term to maturity of: - One year or less 4,658 2,672 - More than one year 26,413 26,008 Other contingent liabilities - 8 32,776 30,043
There have been no significant changes to the contingent liabilities as set out in Note 38 in the 2013 Annual Report.
28. CASH FLOW STATEMENT a) Reconciliation of profit after tax to net cash inflow/(outflow) from operating activities
Six months ended 30 June 2014
£m
Six months ended 30 June 2013(1)
£m
Profit for the period 438 371 Non-cash items included in net profit: Depreciation, amortisation and impairment 347 121 Change in prepayments and accrued income (40) (191) Change in accruals and deferred income (883) 219 Amortisation of discounts on debt securities - (12) Provisions for liabilities and charges 252 43 Impairment losses 220 382 Corporation tax charge 107 90 Other non-cash items 208 81 Pension change for defined benefit pension schemes (216) 15 433 1,119 Changes in operating assets and liabilities: Net change in cash and balances held at central banks - (120) Net change in trading assets (1,202) (8,540) Net change in derivative assets 890 4,223 Net change in financial assets designated at fair value (33) 988 Net change in debt securities, treasury bills and other eligible bills - 12 Net change in loans and advances to banks & customers (1,084) 1,362 Net change in other assets (395) 379 Net change in deposits by banks and customers 4,294 1,229 Net change in derivative liabilities 167 (5,232) Net change in trading liabilities (3,434) 13,682 Net change in financial liabilities designated at fair value 307 (153) Net change in debt securities in issue 1,130 (338) Net change in other liabilities (202) (326) Effects of exchange rate differences (1,098) 2,021 Net cash flow (used in)/from operating activities before tax (227) 10,306 Corporation tax paid (25) (31) Net cash flow (used in)/from operating activities (252) 10,275 (1) Adjusted to reflect the adoption of IFRIC 21, as described in Note 1.
b) Analysis of the balances of cash and cash equivalents in the balance sheet 30 June 2014
£m 31 December 2013
£m Cash and balances at central banks 26,568 26,374 Less: regulatory minimum cash balances (315) (315) 26,253 26,059 Net trading other cash equivalents 5,005 9,853 Net non-trading other cash equivalents 1,372 1,267 Cash and cash equivalents 32,630 37,179
c) Discontinued operations The co-brand credit cards business which was sold for cash consideration of £660m in 2013 qualified as discontinued operations. The net assets disposed of consisted of loans to customers of £672m. The net cash flows attributable to the operating, investing and financing activities of discontinued operations in the first half of 2013 were £907m outflow, £nil, and £nil, respectively.

Financial Statements
Notes to the Financial Statements continued
108 Santander UK plc 2014 Half Yearly Financial Report
29. ASSETS CHARGED AS SECURITY FOR LIABILITIES AND COLLATERAL ACCEPTED AS SECURITY FOR ASSETS
The following transactions are conducted under terms that are usual and customary to collateralised transactions, including, where relevant, standard securities lending and repurchase agreements. a) Financial assets pledged to secure liabilities The financial assets below are analysed between those assets accounted for on balance sheet and off-balance sheet in accordance with IFRS. 30 June 2014
£m 31 December 2013
£m
On balance sheet: Treasury bills and other eligible securities 7,119 6,342 Cash 5,912 5,236 Loans and advances to customers - securitisations and covered bonds (See Note 15) 55,807 58,788 Loans and advances to customers 1,651 172 Debt securities 1,357 1,123 Equity securities 1,219 608 73,065 72,269 Off balance sheet: Treasury bills and other eligible securities 7,443 11,171 Debt securities 527 4,802 Equity securities 1,447 181 9,417 16,154
The Santander UK group provides assets as collateral in the following areas of the business. Sale and repurchase agreements Subsidiaries of the Company enter into sale and repurchase agreements and similar transactions of equity and debt securities, which are accounted for as secured borrowings. Upon entering into such transactions, the subsidiaries provide collateral equal to 100%-131% of the borrowed amount. The carrying amount of assets that were so provided at 30 June 2014 was £15,431m (2013: £18,843m), of which £5,804m (2013: £5,469m) were classified within “loans and advances to customers – securitisations and covered bonds” in the table above. Securitisations and covered bonds The Company and certain of its subsidiaries enter into securitisation transactions whereby portfolios of residential mortgage loans and other loans are purchased by or assigned to structured securitisation companies, and have been funded through the issue of mortgage-backed securities and other asset-backed securities. Holders of the securities are only entitled to obtain payments of principal and interest to the extent that the resources of the securitisation companies are sufficient to support such payments and the holders of the securities have agreed in writing not to seek recourse in any other form. At 30 June 2014, £33,387m (2013: £37,573m) of loans were so assigned by the Santander UK group.
A subsidiary of the Company also has an established covered bond programme, whereby securities are issued to investors and are guaranteed by a pool of ring-fenced residential mortgages. At 30 June 2014, the pool of ring-fenced residential mortgages for the covered bond programme was £22,420m (2013: £21,215m).
At 30 June 2014, total notes issued externally from secured programmes (securitisations and covered bonds) increased to £34,585m (2013: £36,307m), reflecting gross issuance of £2.6bn (2013: £3.1bn) in 2014. At 30 June 2014, a total of £14,440m (2013: £14,599m) of notes issued under securitisation and covered bond programmes had also been retained internally, a proportion of which had been used as collateral for raising funds via third party bilateral secured funding transactions, which totalled £7.2bn at 30 June 2014 (2013: £7.6bn), or for creating collateral which could in the future be used for liquidity purposes. Stock borrowing and lending agreements Asset balances under stock borrowing and lending agreements represent stock lent by the Santander UK group. These balances amounted to £11,136m at 30 June 2014 (2013: £11,025m) and are offset by contractual commitments to return stock borrowed or cash received. Derivatives business In addition to the arrangements described above, collateral is also provided in the normal course of derivative business to counterparties. At 30 June 2014, £5,912m (2013: £5,236m) of such collateral in the form of cash had been provided by the Santander UK group and is included in the table above. b) Collateral held as security for assets The collateral held as security for assets below are analysed between those liabilities accounted for on the balance sheet and off-balance sheet in accordance with IFRS. 30 June 2014
£m 31 December 2013
£m
On balance sheet: Trading liabilities Deposits by banks
1,451 1,296
1,841 1,671
2,747 3,512 Off balance sheet: Trading liabilities 17,887 19,907 Deposits by banks 80 49 17,967 19,956

Financial Statements
Notes to the Financial Statements continued
Santander UK plc 2014 Half Yearly Financial Report 109
Purchase and resale agreements Subsidiaries of the Company also enter into purchase and resale agreements and similar transactions of equity and debt securities, which are accounted for as collateralised loans. Upon entering into such transactions, the subsidiaries receive collateral equal to 100%-105% of the loan amount. The level of collateral held is monitored daily and if required, further calls are made to ensure the market values of collateral remains at least equal to the loan balance. The subsidiaries are permitted to sell or repledge the collateral held in the absence of default. At 30 June 2014, the fair value of such collateral received was £8,339m (2013: £10,080m). Of the collateral received, almost all was sold or repledged. The subsidiaries have an obligation to return collateral that they have sold or pledged. Stock borrowing and lending agreements Obligations under stock borrowing and lending agreements represent contractual commitments to return stock borrowed. These obligations totalled £9,628m at 30 June 2014 (2013: £9,876m) and are offset by a contractual right to receive stock lent by the Santander UK group. Derivatives business In addition to the arrangements described above, collateral is also received from counterparties in the normal course of derivative business. At 30 June 2014, £2,747m (2013: £3,512m) of such collateral in the form of cash had been received by the Santander UK group and is included in the table above. Lending activities In addition to the above collateral held as security for assets, the Santander UK group may obtain a charge over a customer’s property in connection with its lending activities. Details of these arrangements are set out in the ‘Credit Risk’ section of the Risk Management Report.
30. RELATED PARTY DISCLOSURES a) Parent undertaking and controlling party On 10 January 2014, the ordinary shares of Santander UK plc were transferred to a new holding company, Santander UK Group Holdings Limited which is therefore now the Company’s immediate parent. The Company’s ultimate parent and controlling party is Banco Santander, S.A., a company incorporated in Spain. The smallest and largest group into which the Santander UK group’s results are included is the group accounts of Banco Santander, S.A., copies of which may be obtained from Santander Shareholder Relations, 2 Triton Square, Regent’s Place, London NW1 3AN. b) Transactions with related parties The financial position and performance of the Santander UK group have not been materially affected in the first six months of the year by any related party transactions, or changes to related party transactions, except as disclosed in the other Notes to these Condensed Consolidated Interim Financial Statements or otherwise described below.
On 24 June 2014, the Company issued £500m Perpetual Capital Securities to its immediate parent company, Santander UK Group Holdings Limited. Details of these securities can be found in Note 31. In turn, Santander UK Group Holdings Limited issued a similar security. The issuance was 100% subscribed by Banco Santander, S.A..
Information on balances due from/(to) other Banco Santander group companies is set out in ‘Balances with other Banco Santander group companies’ in the ‘Country Risk Exposure’ section of the Risk Management Report. In addition, transactions with pension schemes operated by the Santander UK group are described in Note 26. These transactions were made in the ordinary course of business and substantially on the same terms as for comparable transactions with third party counterparties and within limits acceptable to the PRA. Such transactions do not involve more than the normal risk of collectability or present any unfavourable features.
31. SHARE CAPITAL AND OTHER EQUITY INSTRUMENTS
30 June 2014
£m 31 December 2013
£m Ordinary share capital 3,105 3,105 £300m fixed/floating rate non-cumulative callable preference shares 300 300 £300m Step-up Callable Perpetual Reserve Capital Instruments 297 297 £300m Step Up Callable Perpetual Preferred Securities 7 7 £500m Perpetual Capital Securities 500 -
4,209 3,709
£500m Perpetual Capital Securities On 24 June 2014, the Company issued £500m Perpetual Capital Securities to its immediate parent company, Santander UK Group Holdings Limited. The securities are perpetual and pay a coupon on 24 March, June, September and December, commencing from March 2015. At each payment date, the Company can decide whether to pay the coupon, which is non-cumulative, in whole or in part. The coupon is 6.625% per annum until 24 June 2019; thereafter, the coupon resets every five years to a rate 4.441% per annum above the then prevailing 5 year sterling mid swap rate. The Perpetual Capital Securities will be automatically written down and the investors will lose their entire investment in the securities should the Common Equity Tier 1 Capital Ratio of the Santander UK group fall below 7%. The Perpetual Capital Securities are redeemable at the option of the Company on 24 June 2019 or on each coupon payment date thereafter. No such redemption may be made without the consent of the PRA.
In turn, Santander UK Group Holdings Limited issued a similar security. The issuance was 100% subscribed by Banco Santander, S.A..

Financial Statements
Notes to the Financial Statements continued
110 Santander UK plc 2014 Half Yearly Financial Report
32. FINANCIAL INSTRUMENTS a) Fair values of financial instruments measured at fair value on a recurring basis The following tables summarise the fair values at 30 June 2014 and 31 December 2013 of the financial asset and liability classes accounted for at fair value, analysed by the valuation methodology used by the Santander UK group to determine their fair value. The tables also disclose the percentages that the recorded fair values of financial assets and liabilities represent of the total assets and liabilities, respectively, that are recorded at fair value in the balance sheet: 30 June 2014 Internal models based on
Balance sheet category
Quoted prices in active markets
(Level 1)
Market observable data
(Level 2)
Significant unobservable
data (Level 3)
Total
Valuation technique
£m % £m % £m % £m %
Assets Trading assets Loans and advances to banks - - 6,200 13 - - 6,200 13 A Loans and advances to customers - - 1,767 4 - - 1,767 4 A Debt securities 7,522 16 - - - - 7,522 16 - Equity securities 3,212 7 - - - - 3,212 7 - Derivative assets Exchange rate contracts - - 2,706 6 11 - 2,717 6 A Interest rate contracts 6 - 13,763 28 25 - 13,794 28 A & C Equity and credit contracts 360 1 2,158 4 126 - 2,644 5 B & D Commodity contracts - - 4 - - - 4 - A Financial assets at FVTPL Loans and advances to customers - - 2,177 5 52 - 2,229 5 A Debt securities - - 314 - 211 - 525 - A & B AFS financial assets Equity securities 24 - - - - - 24 - -
Debt securities 7,731 16 - - - - 7,731 16 - Total assets at fair value 18,855 40 29,089 60 425 - 48,369 100 Liabilities Trading liabilities Deposits by banks - - 8,523 21 - - 8,523 21 A Deposits by customers - - 5,095 13 - - 5,095 13 A Short positions 4,230 11 - - - - 4,230 11 - Derivative liabilities Exchange rate contracts - - 3,228 8 - - 3,228 8 A Interest rate contracts 23 - 12,637 31 8 - 12,668 31 A & C Equity and credit contracts 2 - 3,084 8 44 - 3,130 8 B & D Commodity contracts - - 4 - - - 4 - A Financial liabilities at FVTPL Debt securities in issue - - 3,228 8 24 - 3,252 8 A Total liabilities at fair value 4,255 11 35,799 89 76 - 40,130 100 31 December 2013 Internal models based on
Balance sheet category
Quoted prices in active markets (Level 1)
Market observable data
(Level 2)
Significant unobservable
data (Level 3)
Total
Valuation technique
£m % £m % £m % £m %
Assets Trading assets Loans and advances to banks - - 9,326 19 - - 9,326 19 A Loans and advances to customers - - 4,404 9 - - 4,404 9 A Debt securities 7,859 16 - - - - 7,859 16 - Equity securities 705 1 - - - - 705 1 - Derivative assets Exchange rate contracts - - 3,437 7 14 - 3,451 7 A Interest rate contracts 11 - 14,232 28 - - 14,243 28 A & C Equity and credit contracts 311 1 1,911 4 131 - 2,353 5 B & D Commodity contracts - - 2 - - - 2 - A Financial assets at FVTPL Loans and advances to customers - - 2,168 4 51 - 2,219 4 A Debt securities - - 258 - 270 1 528 1 A & B AFS financial assets Equity securities 24 - - - - - 24 - -
Debt securities 4,981 10 - - - - 4,981 10 - Total assets at fair value 13,891 28 35,738 71 466 1 50,095 100 Liabilities Trading liabilities Deposits by banks - - 11,291 26 - - 11,291 26 A Deposits by customers - - 7,069 16 - - 7,069 16 A Short positions 2,918 6 - - - - 2,918 6 - Derivative liabilities Exchange rate contracts - - 2,936 7 - - 2,936 7 A Interest rate contracts 36 - 12,938 30 - - 12,974 30 A & C Equity and credit contracts 771 2 2,132 5 48 - 2,951 7 B & D Commodity contracts - - 2 - - - 2 - A Financial liabilities at FVTPL Debt securities in issue - - 3,370 8 37 - 3,407 8 A Total liabilities at fair value 3,725 8 39,738 92 85 - 43,548 100

Financial Statements
Notes to the Financial Statements continued
Santander UK plc 2014 Half Yearly Financial Report 111
Transfers between levels of the fair value hierarchy Transfers between levels of the fair value hierarchy are reported at the beginning of the reporting period in which they occur. During the six months ended 30 June 2014, the following financial instruments were transferred between Level 2 and Level 3 in the fair value hierarchy: > Bermudan swaptions shown within derivative assets and derivative liabilities with fair values of £29m and £10m, respectively, were
transferred from Level 2 to Level 3 principally due to a lack of market transactions in these instruments. The valuation techniques applied to estimate the fair value of these financial instruments are described in section e below as ‘instruments 2 and 9’.
> Certain asset-backed securities issued by Banco Santander group entities, with a fair value of £58m designated as fair value through profit and loss, were transferred from Level 3 to Level 2 principally due to improved transparency of market prices as a result of market transactions in these instruments. The valuation technique applied to estimate the fair value of these financial instruments is described in section e below as ‘instrument 8’.
During the year ended 31 December 2013, there were no transfers of financial instruments between Levels 2 and 3.
During the six months ended 30 June 2014, there were no transfers of financial instruments between Levels 1 and 2 (year ended 31 December 2013: Nil). b) Fair values of financial instruments measured at amortised cost on a recurring basis The following tables analyse the fair value of financial instruments not measured at fair value in the balance sheet: 30 June 2014 Carrying value
£m Fair value
£m Surplus/(deficit)
£m Assets Loans and advances to banks 2,325 2,288 (37)Loans and advances to customers 186,094 187,006 912Loans and receivables securities 869 873 4Liabilities Deposits by banks 8,234 8,423 (189)Deposits by customers 150,734 151,501 (767)Debt securities in issue 50,258 52,158 (1,900)Subordinated liabilities 4,272 4,169 103
31 December 2013 Carrying value
£m Fair value
£m Surplus/(deficit)
£m Assets Loans and advances to banks 2,347 2,307 (40) Loans and advances to customers 184,587 186,075 1,488 Loans and receivables securities 1,101 1,032 (69) Liabilities Deposits by banks 8,696 8,891 (195) Deposits by customers 147,167 147,963 (796) Debt securities in issue 50,870 52,489 (1,619) Subordinated liabilities 4,306 4,435 (129) The surplus/(deficit) in the table above represents the surplus/(deficit) of fair value compared to the carrying amount of those financial instruments for which fair values have been estimated. The carrying value above of any financial assets and liabilities that are designated as hedged items in a portfolio (or macro) fair value hedge relationship excludes gains and losses attributable to the hedged risk, as this is presented as a single separate line item on the balance sheet.
The fair value exposures set out in the tables above are managed by using a combination of hedging derivatives and offsetting on balance sheet positions. The approach to specific categories of financial instruments is described on page 295 of the 2013 Annual Report.

Financial Statements
Notes to the Financial Statements continued
112 Santander UK plc 2014 Half Yearly Financial Report
c) Valuation techniques The main valuation techniques employed in the Santander UK group’s internal models to measure the fair value of the financial instruments disclosed above at 30 June 2014 and 31 December 2013 are set out below. In substantially all cases, the principal inputs into these models are derived from observable market data. The Santander UK group did not make any material changes to the valuation techniques and internal models it used during the six months ended 30 June 2014. A In the valuation of financial instruments requiring static hedging (for example interest rate, currency derivatives and commodity
swaps) and in the valuation of loans and advances and deposits, the ‘present value’ method is used. Expected future cash flows are discounted using the interest rate curves of the applicable currencies or forward commodity prices as appropriate. The interest rate curves are generally observable market data and reference yield curves derived from quoted interest rates in appropriate time bandings, which match the timings of the cash flows and maturities of the instruments. The forward commodity prices are generally observable market data.
B In the valuation of equity financial instruments requiring dynamic hedging (principally equity securities, options and other structured instruments), proprietary local volatility and stochastic volatility models are used. These types of models are widely accepted in the financial services industry. Observable market inputs used in these models include the bid-offer spread, foreign currency exchange rates, volatility and correlation between indices. In limited circumstances, other inputs may be used in these models that are based on data other than observable market data, such as the Halifax’s UK House Price Index (‘HPI’) volatility, HPI forward growth, HPI spot rate, mortality and mean reversion.
C In the valuation of financial instruments exposed to interest rate risk that require either static or dynamic hedging (such as interest rate futures, caps and floors, and options), the present value method (futures), Black-Scholes model (caps/floors) and the Hull/White and Markov functional models (Bermudan options) are used. These types of models are widely accepted in the financial services industry. The significant inputs used in these models are observable market data, including appropriate interest rate curves, volatilities, correlations and exchange rates. In limited circumstances, other inputs may be used in these models that are based on data other than observable market data, such as HPI volatility, HPI forward growth, HPI spot rate and mortality.
D In the valuation of linear instruments such as credit risk and fixed-income derivatives, credit risk is measured using dynamic models similar to those used in the measurement of interest rate risk. In the case of non-linear instruments, if the portfolio is exposed to credit risk such as credit derivatives, the probability of default is determined using the par spread level. The main inputs used to determine the underlying cost of credit of credit derivatives are quoted credit risk premiums and the correlation between the quoted credit derivatives of various issuers.
The fair values of the financial instruments arising from the Santander UK group’s internal models take into account, among other things, contract terms and observable market data, which include such factors as bid-offer spread, interest rates, credit risk, exchange rates, the quoted market price of raw materials and equity securities, volatility and prepayments. In all cases, when it is not possible to derive a valuation for a particular feature of an instrument, management uses judgement to determine the fair value of the particular feature. In exercising this judgement, a variety of tools are used including proxy observable data, historical data and extrapolation techniques. Extrapolation techniques take into account behavioural characteristics of equity markets that have been observed over time, and for which there is a strong case to support an expectation of a continuing trend in the future. Estimates are calibrated to observable market prices when they become available.
The estimates thus obtained could vary if other valuation methods or assumptions were used. The Santander UK group believes its valuation methods are appropriate and consistent with other market participants. Nevertheless, the use of different valuation methods or assumptions, including imprecision in estimating unobservable market inputs, to determine the fair value of certain financial instruments could result in different estimates of fair value at the reporting date and the amount of gain or loss recorded for a particular instrument. Most of the valuation models are not significantly subjective, because they can be tested and, if necessary, recalibrated by the internal calculation of and subsequent comparison to market prices of actively traded securities, where available.

Financial Statements
Notes to the Financial Statements continued
Santander UK plc 2014 Half Yearly Financial Report 113
d) Fair value adjustments The internal models incorporate assumptions that the Santander UK group believes would be made by a market participant to establish fair value. Fair value adjustments are adopted when the Santander UK group considers that there are additional factors that would be considered by a market participant in the determination of fair value of the instrument that are not incorporated in the valuation model. The magnitude of fair value adjustments depends upon many entity-specific factors, including modelling sophistication, the nature of products traded, and the size and type of risk exposures. For this reason, fair value adjustments may not be comparable across the banking industry.
The Santander UK group classifies fair value adjustments as either ‘risk-related’ or ‘model-related’. The fair value adjustments form part of the portfolio fair value and are included in the balance sheet values of the product types to which they have been applied. The majority of these adjustments relate to Markets. The magnitude and types of fair value adjustment adopted by Markets are listed in the following table: 30 June 2014
£m 31 December 2013
£m
Risk-related: - Bid-offer and trade specific adjustments 19 27 - Uncertainty 17 18 - Credit risk adjustment 41 45 77 90 Model-related: - Model limitation 11 12 Day One profits 1 - 89 102
Risk-related adjustments ‘Risk-related’ adjustments are driven, in part, by the magnitude of the Santander UK group’s market or credit risk exposure, and by external market factors, such as the size of market spreads. For further details, see the ‘Risk-related adjustments’ section on page 302 of the 2013 Annual Report. e) Internal models based on information other than market data (Level 3) The table below provides an analysis of financial instruments valued using internal models based on information other than market data together with the subsequent valuation technique used for each type of instrument. Each instrument is initially valued at transaction price: Balance sheet
value Amount recognised in income/(expense)
30 June 2014
31 December 2013
H1 2014
H1 2013
Balance sheet line item Category Financial instrument product type £m £m £m £m
1. Derivative assets Exchange rate contracts Cross-currency swaps 11 14 (1) (6) 2. Derivative assets Interest rate contracts Bermudan swaptions 25 - (4) - 3. Derivative assets Equity and credit contracts Reversionary property interests 75 71 6 (2) 4. Derivative assets Equity and credit contracts Credit default swaps 9 13 3 (1) 5. Derivative assets Equity contracts Options and forwards 42 47 (8) - 6. FVTPL Loans and advances to customers Roll-up mortgage portfolio 52 51 2 (3) 7. FVTPL Debt securities Reversionary property securities 211 212 14 (2) 8. FVTPL Debt securities Asset-backed securities - 58 - 9 9. Derivative liabilities Interest rate contracts Bermudan swaptions (8) - 2 - 10. Derivative liabilities Equity contracts Options and forwards (44) (48) (5) 3 11. FVTPL Debt securities in issue Non-vanilla debt securities (24) (37) 1 5 Total net assets 349 381 - - Total income - - 10 3
Valuation techniques 1. Derivative assets - Exchange rate contracts These cross currency swaps are used to hedge the foreign currency risks arising from the PRDC notes issued by the Santander UK group, as described in Instrument 11 below. These derivatives are valued using a standard valuation model valuing each leg of the swap, with expected future cash flows less notional amount exchanged at maturity date discounted using an appropriate floating rate. The floating rate is adjusted by the relevant cross currency basis spread. Interest rates, foreign exchange rates, cross currency basis spread and long-dated foreign exchange (‘FX’) volatility are used as inputs to determine fair value. Interest rates and foreign exchange rates are observable on the market.
Cross currency spreads may be market observable or unobservable depending on the liquidity of the cross currency pair. As the Japanese Yen-US dollar cross currency pair related to the PRDC notes is liquid, the cross currency spreads (including long-dated cross currency spread) for these swaps are market observable. The significant unobservable inputs for the valuation of these financial instruments are the long-dated FX volatility and the correlation between the underlying assets.
The correlation between the underlying assets is assumed to be zero, as there are no actively traded options from which correlations between the underlying assets could be implied. Furthermore, the zero correlation assumption implies that the sources of the long-dated FX volatility are independent.

Financial Statements
Notes to the Financial Statements continued
114 Santander UK plc 2014 Half Yearly Financial Report
Long-dated FX volatility Long-dated FX volatility is extrapolated from shorter-dated FX volatilities which are directly observable on the market. Short-dated FX volatility is observable from the trading of FX options. As there is no active market for FX options with maturities greater than five years (long-dated FX options), long-dated FX volatility is not market observable. Furthermore, as historical prices are not relevant in determining the cost of hedging long-dated FX risk, long-dated FX volatility cannot be inferred from historical volatility. The Santander UK group extrapolates the long-dated FX volatility from the shorter-dated FX volatilities using Black-Scholes model.
FX volatility is modelled as the composition of the domestic interest rate, foreign interest rates and FX spot volatilities using standard Hull-White formulae. The Hull-White approach is used for estimating the future distribution of domestic and foreign zero-coupon rates, constructed from the relevant yield curves. Using short-dated FX options, the FX spot volatility is calculated which is then extrapolated to derive the long-dated FX volatility. 2. Derivative assets - Interest rate contracts These derivatives assets are options giving the holder the right to enter into an interest rate swap on any one of a number of predetermined dates. These Bermudan swaptions are valued using a standard valuation model.
In determining the value of Bermudan swaptions, the main inputs used are market observable information in the vanilla swaption market and a mean reversion parameter. The significant unobservable input for the valuation of these financial instruments is mean reversion. Mean reversion The mean reversion input used in valuing Bermudan swaptions reflects the level of de-correlation in the swaption market. This parameter is not directly observable in the market but can be deduced from broker quotes or using expert judgement. An adjustment is made to reflect this uncertainty by stressing the parameter. 3. Derivative assets - Equity and credit contracts These reversionary property derivatives are valued using a probability weighted set of HPI forward prices, which are assumed to be a reasonable representation of the increase in value of the Santander UK group’s reversionary interest portfolio underlying the derivatives. The probability used reflects the likelihood of the home owner vacating the property and is calculated from mortality rates and acceleration rates which are a function of age and gender, obtained from the relevant mortality tables. Indexing is felt to be appropriate due to the size and geographical dispersion of the Santander UK group’s reversionary interest portfolio. These are determined using HPI Spot Rates adjusted to reflect estimated forward growth. Launched in 1984, the Halifax’s UK HPI is the UK's longest running monthly house price data series covering the whole country. The indices calculated are standardised and represent the price of a typically transacted house. Both national and regional HPI are published. The national HPI is published monthly. The regional HPI reflects the national HPI disaggregated into 12 UK regions and is published quarterly. Both indices are published on two bases, including and excluding seasonal adjustments in the housing market. The Santander UK group uses the non-seasonally adjusted (‘NSA’) national and regional HPI in its valuation model to avoid any subjective judgement in the adjustment process which is made by Halifax.
The inputs used to determine the value of the reversionary property derivatives are HPI spot, HPI forward growth and mortality rates. The principal pricing parameter is HPI forward growth. HPI Spot Rate The HPI spot rate used in the model is a weighted average of NSA regional HPI spot rates i.e. adjusted for difference in the actual regional composition of the property underlying the Santander UK group’s reversionary interest portfolio and the composition of the published regional indices. The regional HPI spot rate (which is observable market data) is only published on specific quarterly dates. In between these dates, its value is estimated by applying the growth rate over the relevant time period inferred from the national HPI spot rates (which are observable market data and published monthly) to the most recently calculated weighted average regional HPI spot rate based on published regional indices.
An adjustment is also made to reflect the specific property risk i.e. possible deviation between the actual growth in the house prices underlying the Santander UK group’s reversionary interest portfolio and their assumed index-linked growth, which is based on the regional HPI. This adjustment is based on the average historical deviation of price changes of the Santander UK group’s actual property portfolio from that of the published indices over the time period since the last valuation date. HPI Forward Growth Rate Long-dated HPI forward growth rate is not directly observable in the market but is estimated from traded forward contracts. A specific spread is applied to the long-dated forward growth rate to reflect the uncertainty surrounding long-dated data. This spread is calculated by analysing the historical volatility of the HPI, whilst incorporating mean reversion. An adjustment is made to reflect the specific property risk as for the HPI spot rate above. Mortality Rate Mortality rates are obtained from the PNMA00 and PNFA00 Continuous Mortality Investigation Tables published by the UK Institute and Faculty of Actuaries. These mortality rates are adjusted by acceleration rates to reflect the mortality profile of the holders of Santander UK group’s reversionary property products underlying the derivatives. Mortality rates do not have a significant effect on the value of the instruments. 4. Derivative assets - Credit contracts These derivative assets are credit default swaps held against certain bonds. The credit default swaps are valued using the credit spreads of the referenced bonds. These referenced bonds are valued with the assistance of valuations prepared by an independent, specialist valuation firm as a deep and liquid market does not exist.
In valuing the credit default swaps, the main inputs used to determine the underlying cost of credit are quoted risk premiums and the correlation between the quoted credit derivatives of various issuers. The assumptions relating to the correlation between the values of quoted and unquoted assets are based on historical correlations between the impact of adverse changes in market variables and the corresponding valuation of the associated unquoted assets. The measurement of the assets will vary depending on whether a more or less conservative scenario is selected. The other main input is the probability of default of the referenced bonds. The significant unobservable input for the valuation of these financial instruments is the probability of default.

Financial Statements
Notes to the Financial Statements continued
Santander UK plc 2014 Half Yearly Financial Report 115
Probability of default The probability of default is assessed by considering the credit quality of the underlying referenced bonds. However, as no deep and liquid market exists for these assets the assessment of the probability of default is not directly observable and instead an estimate is calculated using the Standard Gaussian Copula model. 5. Derivative assets - Equity contracts There are three types of derivatives within this category: European options – These derivatives are valued using a modified Black-Scholes model where the HPI is log-normally distributed with the forward rates determined from the HPI forward growth. Asian options – Asian (or average value) options are valued using a modified Black-Scholes model, with an amended strike price and volatility assumption to account for the average exercise period, through a closed form adjustment that reflects the strike price relative to the distribution of stock prices at each relevant date. This is also known as the Curran model. Forward contracts – Forward contracts are valued using a standard forward pricing model. The inputs used to determine the value of the above instruments are HPI spot rate, HPI forward growth rate and HPI volatility. The principal pricing parameter is HPI forward growth rate. HPI Spot Rate The HPI spot rate used is the NSA national HPI spot rate which is published monthly and directly observable in the market. This HPI rate used is different from the weighted average regional HPI spot rate used in the valuation of Instrument 3 above, as the underlying of these derivatives is the UK national HPI spot rate. HPI Forward Growth Rate The HPI forward growth rate used is unobservable and is the same as used in the valuation of Instrument 3 above. HPI Volatility Long-dated HPI volatility is not directly observable in the market but is estimated from the most recent traded values. An adjustment is applied to the long-dated HPI volatility rate to reflect the uncertainty surrounding long-dated data. This adjustment is based on the empirical standard deviation of historical volatility over a range of time horizons. HPI volatility rates do not have a significant effect on the value of the instruments. 6. FVTPL – Loans and advances to customers These loans and advances to customers represent roll-up mortgages (sometimes referred to as “lifetime” mortgages), which are an equity release scheme under which a property owner takes out a loan secured against their home. The owner does not make any interest payments during their lifetime and the fixed interest payments are rolled up into the mortgage. The loan or mortgage (capital and rolled-up interest) is repaid upon the owner’s vacation of the property and the value of the loan is only repaid from the value of the property. This is known as a ‘no negative pledge’. The Santander UK group suffers a loss if the sale proceeds from the property are insufficient to repay the loan, as it is unable to pursue the homeowner’s estate or beneficiaries for the shortfall.
The value of the mortgage ‘rolls up’ or accretes until the owner vacates the property. In order to value the roll-up mortgages, the Santander UK group uses a probability-weighted set of European option prices (puts) determined using the Black-Scholes model, in which the ‘no negative pledges’ are valued as short put options. The probability weighting applied is calculated from mortality rates and acceleration rates as a function of age and gender, taken from mortality tables.
The inputs used to determine the value of these instruments are HPI spot, HPI forward growth, HPI volatility, mortality rates and repayment rates. The principal pricing parameter is HPI forward growth. The HPI forward growth rate used is unobservable and is the same as used in the valuation of Instrument 3 above. The other parameters do not have a significant effect on the value of the instruments. 7. FVTPL – Debt securities These debt securities consisting of reversionary property securities are an equity release scheme, where the property owner receives an upfront lump sum in return for paying a fixed percentage of the sales proceeds of the property when the owner vacates the property. These reversionary property securities are valued using a probability-weighted set of HPI forward prices which are assumed to be a reasonable representation of the increase in value of the Santander UK group’s reversionary interest portfolio underlying the derivatives. The probability weighting used reflects the probability of the home owner vacating the property through death and is calculated from death rates and acceleration factors which are a function of age and gender, obtained from the relevant mortality table.
The inputs used to determine the value of these instruments are HPI spot, HPI forward growth and mortality rates. The principal pricing parameter is HPI forward growth. Discussion of the HPI spot rate, HPI forward growth rate and mortality rates for this financial instrument is the same as Instrument 4 above. An adjustment is also made to reflect the specific property risk. Discussion of the specific property risk adjustment is the same as Instrument 3 above.

Financial Statements
Notes to the Financial Statements continued
116 Santander UK plc 2014 Half Yearly Financial Report
8. FVTPL – Debt securities These securities consist of asset-backed securities issued by Banco Santander group entities. Each instrument is valued with reference to the price from a consensus pricing service. This is then corroborated against the price from another consensus pricing service due to the lack of depth in the number of available market quotes. An average price is used where there is a more than insignificant difference between the two sources. The significant unobservable input is the adjustment to the credit spread embedded in the pricing consensus quotes. 9. Derivative liabilities – Interest rate contracts These derivatives are the same as Instrument 2 with the exception that they have a negative fair value. 10. Derivative liabilities - Equity contracts These derivatives are the same as Instrument 5 with the exception that they have a negative fair value. 11. FVTPL - Debt securities in issue These debt securities in issue are PRDC notes. These notes are financial structured products where an investor is seeking a better return and a borrower/issuer a lower rate by taking advantage of the interest rate differential between two countries. The note pays a foreign interest rate in the investor's domestic currency. The power component of the name denotes higher initial coupons and the fact that coupons rise as the domestic/foreign exchange rate depreciates. The power feature comes with a higher risk for the investor. Cash flows may have a digital cap feature where the rate gets locked once it reaches a certain threshold. Other add-on features are barriers such as knockouts and cancellation provisions for the issuer.
These debt securities in issue are valued using a three-factor Gaussian Model. The three factors used in the valuation are domestic interest rates, foreign interest rates and foreign exchange rates. The correlations between the factors are assumed to be zero within the valuation.
The Hull-White approach is used for estimating the future distribution of domestic and foreign zero-coupon rates, constructed from the relevant yield curves. A Geometric Brownian Motion model is used for estimating the future distribution of spot foreign exchange rates. The foreign exchange and interest rate volatilities are the most crucial pricing parameters; the model calibrates to the relevant swaption volatility surface.
The significant unobservable inputs for the valuation of these financial instruments are the long dated FX volatility and the correlation between the underlying assets and are the same as Instrument 1. Reconciliation of fair value measurements in Level 3 of the fair value hierarchy The following table provides a reconciliation of the movement between opening and closing balances of Level 3 financial instruments, measured at fair value using a valuation technique with significant unobservable inputs:
Assets Liabilities Derivatives Fair value
through P&L Total Derivatives Fair value
through P&L Total
£m £m £m £m £m £m At 1 January 2014 145 321 466 (48) (37) (85) Total gains/(losses) recognised in profit/(loss): - Fair value movements (4) 16 12 (3) 1 (2)- Foreign exchange and other movements - (1) (1) - - -Transfers in 29 - 29 (10) - (10) Transfers out - (58) (58) - - - Settlements (8) (15) (23) 9 12 21At 30 June 2014 162 263 425 (52) (24) (76)
Gains/(losses) recognised in profit/(loss) relating to assets and liabilities held at the end of the period
(4) 15 11 (3) 1 (2)
Total gains or losses are included in ‘Net trading and other income’ (see Note 3).
Assets Liabilities Derivatives Fair value
through P&L Total Derivatives Fair value
through P&L Total
£m £m £m £m £m £m At 1 January 2013 215 345 560 (57) (86) (143) Total gains/(losses) recognised in profit/(loss): - Fair value movements (16) 10 (6) 8 7 15 - Foreign exchange and other movements (11) 7 (4) (11) 12 1 Sales - (27) (27) - - - Settlements (43) (14) (57) 12 30 42 At 31 December 2013 145 321 466 (48) (37) (85)
Gains/(losses) recognised in profit/(loss) relating to assets and liabilities held at the end of the year
(27) 17 (10) (3) 19 16

Financial Statements
Notes to the Financial Statements continued
Santander UK plc 2014 Half Yearly Financial Report 117
Effect of changes in significant unobservable assumptions to reasonably possible alternatives (Level 3) The fair value of financial instruments are, in certain circumstances, measured using valuation techniques that incorporate assumptions that are not evidenced by prices from observable current market transactions in the same instrument and are not based on observable market data and, as such require the application of a degree of judgement. Changing one or more of the inputs to the valuation models to reasonably possible alternative assumptions would change the fair values significantly. The following table shows the sensitivity of these fair values to reasonably possible alternative assumptions.
Favourable and unfavourable changes are determined on the basis of changes in the value of the instrument as a result of varying the levels of the unobservable input as described in the table below. The potential effects do not take into effect any hedged positions. 30 June 2014 Reflected in income statement
Balance sheet note line item and product Fair
value
Significant unobservable input Shift Favourable
changes Unfavourable
changes
£m
Assumption description
Assumption value
£m £m Range(1) Weighted
average 2. Derivative assets – Interest rate contracts:
- Bermudan swaptions 25 Mean reversion
4%
4%
1%
1
(1)
3. Derivative assets – Equity and credit contracts:
– Reversionary property derivatives
75 HPI Forward growth rate HPI Spot rate
0%-5% n/a
2.66% 578(2)
1% 10%
10 8
(10) (8)
4. Derivative assets – Credit contracts: – Credit default swaps
9 Probability of default 0%-4.9%
0.3%
20% 2 (2)
5. Derivative assets – Equity contracts: – Options and forwards
42 HPI Forward growth rate HPI Spot rate
0%-5% n/a
2% 565
1% 10%
3 2
(3) -
6. FVTPL – Loans and advances to customers: – Roll-up mortgage portfolio
52 HPI Forward growth rate 0%-5%
2.82%
1% 2 (2)
7. FVTPL – Debt securities: – Reversionary property securities
211 HPI Forward growth rate HPI Spot rate
0%-5% n/a
2.66% 578
1% 10%
15 20
(15) (20)
9. Derivative liabilities – Interest rate contracts:
- Bermudan swaptions
(8) Mean reversion
4%
4%
1%
1
(1)
10. Derivative liabilities - Equity contracts: – Options and forwards
(44) HPI Forward growth rate HPI Spot rate
0%-5% n/a
2% 565(2)
1% 10%
4 15
(4) (18)
(1) The range of actual assumption values used to calculate the weighted average disclosure. (2) Represents the HPI spot rate index level at 30 June 2014.
31 December 2013 Reflected in income statement
Balance sheet note line item and product Fair
value
Significant unobservable input Shift Favourable
changes Unfavourable
changes
£m
Assumption description
Assumption value
£m £m Range(1) Weighted
average 3. Derivative assets – Equity and credit
contracts: – Reversionary property derivatives
71 HPI Forward growth rate HPI Spot rate
0%-5% n/a
2.67% 578(2)
1% 10%
11 8
(11) (8)
4. Derivative assets – Credit contracts: – Credit default swaps
13 Probability of default 0.1%-1.2%
0.7% 20% 3 (3)
5. Derivative assets – Equity contracts: – Options and forwards
47 HPI Forward growth rate HPI Spot rate
0%-5% n/a
1.62% 565(2)
1% 10%
5 11
(5) (10)
6. FVTPL – Loans and advances to customers: – Roll-up mortgage portfolio
51 HPI Forward growth rate 0%-5% 2.85% 1% 1 (1)
7. FVTPL – Debt securities: – Reversionary property securities
212 HPI Forward growth rate HPI Spot rate
0%-5% n/a
2.67% 578(2)
1% 10%
15 20
(16) (20)
8. FVTPL – Debt securities: – Mortgage-backed securities
58 Credit spread 0%-15% 5% 10% 6 (6)
10. Derivative liabilities - Equity contracts: – Options and forwards
(48) HPI Forward growth rate HPI Spot rate
0%-5% n/a
1.62% 565(2)
1% 10%
2 7
(2) (10)
(1) The range of actual assumption values used to calculate the weighted average disclosure. (2) Represents the HPI spot rate index level at 31 December 2013. No sensitivities are presented for the FVTPL - debt securities in issue (instrument 11) and related exchange rate derivatives (instrument 1), as the terms of these instruments are fully matched. As a result, any changes in the valuation of the debt securities in issue would be exactly offset by an equal and opposite change in the valuation of the exchange rate derivatives.

Financial Statements
Notes to the Financial Statements continued
118 Santander UK plc 2014 Half Yearly Financial Report
33. CAPITAL MANAGEMENT AND RESOURCES This note reflects the transactions and amounts reported on a basis consistent with the Santander UK group’s regulatory filings at 30 June 2014, following the adoption of CRD IV with effect from 1 January 2014. The amounts presented for 2013 have been prepared on a consistent basis, to aid comparability. The amounts presented for 2013 have not been adjusted to reflect the adoption of IFRC 21, as set out in Note 1. The adjustment would not have had a material effect on Santander UK’s regulatory position. Capital adequacy The Santander UK group manages its capital on a Basel III basis. During the six months ended 30 June 2014 and the year ended 31 December 2013, the Santander UK group held capital over and above its regulatory requirements, and managed internal capital allocations and targets in accordance with its capital and risk management policies. Group capital
30 June 2014 £m
31 December 2013 £m
Core Equity Tier 1 (‘CET 1’) capital before regulatory adjustments 12,494 11,916 Regulatory adjustments to CET 1 capital (3,029) (2,947) CET 1 capital 9,465 8,969 Additional Tier 1 (‘AT1’) capital 1,797 1,298 Tier 1 capital 11,262 10,267 Tier 2 capital 2,990 3,020 Total capital 14,252 13,287
During the first half of 2014, CET 1 capital increased by £496m to £9,465m (2013: £8,969m). This increase was largely due to retained profits for the period. During the first half of 2014, the increase in AT1 capital was due to the issuance of £500m Perpetual Capital Securities to the Company’s immediate parent company as detailed in Note 31.
34. EVENTS AFTER THE BALANCE SHEET DATE None.

Shareholder Information
Santander UK plc 2014 Half Yearly Financial Report 119
Risk Factors An investment in Santander UK plc (the ‘Company’) and its subsidiaries (‘us’, ‘we’ or ‘Santander UK group’) involves a number of risks, the material ones of which are set out in the 2013 Annual Report on pages 317 to 334. The principal risks described in these risk factors, a summary of which can be found on page 120, remain unchanged.
Contact Information Santander UK plc principal executive office and registered office, principal office and investor relations department 2 Triton Square Regent’s Place London NW1 3AN
Phone number: 0870-607-6000
Designated agent The designated agent for service of process on Santander UK in the United States is Abbey National Treasury Services plc (Connecticut branch), 400 Atlantic Street, Stamford, CT 06901. Santander Shareholder Relations 2 Triton Square Regent’s Place London NW1 3AN
Phone numbers: 0871-384-2000 +44 (0) 121-415-7188 (outside the UK)
Email: [email protected]
Glossary A glossary of financial services industry terms is set out on pages 336 to 341 of the 2013 Annual Report. The following additional term arose in the first half of 2014: Term Definition Single Supervisory Mechanism (‘SSM’)
The SSM will create a new system of financial supervision in the EU comprising the European Central Bank (‘ECB’) and the national competent authorities of participating EU countries. Among these EU countries are those whose currency is the euro and those whose currency is not the euro but who have decided to enter into close cooperation with the Single Supervisory Mechanism. The ECB will become responsible for specific banking supervision tasks relating to the prudential supervision of credit institutions. The main aims of the SSM will be to ensure the safety and soundness of the European banking system and to increase financial integration and stability in Europe. The ECB will be responsible for the effective and consistent functioning of the SSM, cooperating with the national competent authorities of participating EU countries. The ECB will assume its new banking supervision responsibilities in November 2014.

Forward- looking Statements
120 Santander UK plc 2014 Half Yearly Financial Report
Santander UK plc (the ‘Company’) and its subsidiaries (together ‘Santander UK’ or the ‘Santander UK group’) may from time to time make written or oral forward-looking statements. The Company makes written forward-looking statements in this Half Yearly Financial Report and may also make forward-looking statements in its periodic reports to the SEC on Forms 20-F and 6-K, in its offering circulars and prospectuses, in press releases and other written materials and in oral statements made by its officers, directors or employees to third parties. Examples of such forward-looking statements include, but are not limited to: > projections or expectations of revenues, costs, profit (or loss), earnings (or loss) per share, dividends, capital structure or other financial items or ratios; > statements of plans, objectives or goals of Santander UK or its management, including those related to products or services; > statements of future economic performance; and > statements of assumptions underlying such statements. Words such as ‘believes’, ‘anticipates’, ‘expects’, ‘intends’, ‘aims’, ‘plans’, ‘targets’ and similar expressions are intended to identify forward-looking statements, but are not the exclusive means of identifying such statements.
By their very nature, forward-looking statements are not statements of historical or current facts; they cannot be objectively verified, are speculative and involve inherent risks and uncertainties, both general and specific, and risks exist that the predictions, forecasts, projections and other forward-looking statements will not be achieved. Santander UK cautions readers that a number of important factors could cause actual results to differ materially from the plans, objectives, expectations, estimates and intentions expressed in such forward-looking statements made by Santander UK or on Santander UK’s behalf. Some of these factors, which could affect the Santander UK group’s business, financial condition and/or results of operations, are considered in detail in the Risk Management Report on pages 36 to 82 of this report and the Risk Factors section on pages 317 to 334 of the 2013 Annual Report. They include:
> the disruptions and volatility in the global financial markets; > the effects of UK economic conditions; > Santander UK’s exposure to UK political developments; > the extent to which regulatory capital and leverage requirements and any changes to these requirements may limit Santander UK’s operations; > the extent to which liquidity requirements and any changes to these requirements may limit Santander UK’s operations; > Santander UK’s exposure to UK Government debt; > > >
the effects of the ongoing economic and sovereign debt tensions in the eurozone; Santander UK’s exposure to risks faced by other financial institutions; Santander UK’s ability to access liquidity and funding on acceptable financial terms;
> the effects of any movement in the external credit rating assigned to the Santander UK group, any Santander UK group member or any of their respective debt securities;
> the effects of fluctuations in interest rates, exchange rates, equity prices and other market risks; > the extent to which Santander UK may be required to record negative fair value adjustments for its financial assets due to changes in market conditions; > the risk of failing to successfully implement and continue to improve Santander UK’s credit risk management systems; > the risks associated with Santander UK’s derivative transactions; > the extent which Santander UK may be exposed to operational losses (e.g. failed internal or external processes, people and systems); > the risk of failing to effectively improve or upgrade Santander UK’s information technology infrastructure and management information systems in a
timely manner; > Santander UK’s exposure to unidentified or unanticipated risks despite its risk management policies, procedures and methods; > the effects of competition, or intensification of such competition, in the financial services markets in which Santander UK conducts business and the
impact of customer perception of Santander UK’s customer service levels on existing or potential business; > the various risks facing Santander UK as its expands its range of products and services (e.g. risk of new products and services not being responsive to
customer demands or successful, risk of changing customer needs); > Santander UK’s ability to assess the credit quality of borrowers and control the level of non-performing loans, loan prepayment and the enforceability of
collateral, including real-estate securing such loans; > the ability of Santander UK to manage any future development effectively (e.g. efficiently managing the operations and employees of expanding
businesses and maintaining or growing its existing customer base); > the ability of Santander UK to realise the anticipated benefits of its business combinations and the exposure, if any, of Santander UK to any unknown
liabilities or goodwill impairments relating to acquired businesses; > the effects of the financial services laws, regulations, governmental oversight, administrative actions and policies and any changes thereto in each location
or market in which Santander UK operates; > Santander UK’s exposure to any potential uncertainly and changes to the UK regulatory regime as a result of the reform and reorganisation of the UK
financial regulatory authorities and the UK regulatory framework; > the effects of any new reforms to the UK mortgage lending and the personal loans market; > Santander UK’s exposure to any risk of loss form legal and regulatory proceedings; > the power of the FCA, the PRA or an overseas regulator to potentially intervene in response to e.g. attempts by customers to seek redress from financial
service institutions, including Santander UK, in case of industry-wide issues; > the effects which the UK Banking Act 2009 (as amended), the UK Financial Services (Banking Reform) Act 2013 and similar European legislation may have
on Santander UK’s business; > the extent to which members of the Santander UK group may be responsible for contributing to compensation schemes in the UK in respect of banks
and other authorised financial services firms that are unable to meet their obligations to customers; > the risk of third parties using Santander UK as a conduit for illegal or improper activities without Santander UK’s knowledge; > the effects of taxation requirements and other assessments and any changes thereto in each location in which Santander UK operates; > the effects of any changes in the pension liabilities and obligations of Santander UK; > the ability of Santander UK to recruit, retain and develop appropriate senior management and skilled personnel; > the effects of any changes to the reputation of the Santander UK group, any Santander UK group member or any affiliate operating under the Santander
UK brands; > the effects of any changes to accounting and reporting standards applicable to preparation of the Company or the Santander UK group’s financial
statements; > the basis of the preparation of the Company’s and the Santander UK group’s financial statements and information available about the Santander UK
group, including the extent to which assumptions and estimates made during such preparation are accurate; > the extent to which disclosure controls and procedures over financial reporting may prevent errors or acts of fraud; > the extent to which Santander UK rely on third parties for important infrastructure support, products and services; > the possibility of risk arising in the future in relation to transactions between the Company and its parent, subsidiaries or affiliates; > Santander UK’s success at managing the risks to which it is exposed, including the items above. Undue reliance should not be placed on forward-looking statements when making decisions with respect to Santander UK and/or its securities. Investors and others should take into account the inherent risks and uncertainties of forward-looking statements and should carefully consider the foregoing non-exhaustive list of important factors. Forward-looking statements speak only as of the date on which they are made and are based on the knowledge, information available and views taken on the date on which they are made; such knowledge, information and views may change at any time. Santander UK does not undertake any obligation to update or revise any forward-looking statement, whether as a result of new information, future events or otherwise.